Rehabilitation Techniques for Stripped Asphalt …...Rehabilitation Techniques for Stripped Asphalt...
99
Rehabilitation Techniques for Stripped Asphalt Pavements Final Report By David R. Johnson, E.I. Research Associate Of the Western Transportation Institute Civil Engineering Department Montana State University - Bozeman And Reed B. Freeman, PhD. P.E. Pavement Engineer Clinton, Mississippi Prepared for the STATE OF MONTANA DEPARTMENT OF TRANSPORTATION RESEARCH AND DEVELOPMENT PROGRAM In cooperation with the U.S. DEPARTMENT OF TRANSPORTATION FEDERAL HIGHWAY ADMINISTRATION December 5, 2002
Transcript of Rehabilitation Techniques for Stripped Asphalt …...Rehabilitation Techniques for Stripped Asphalt...
Rehabilitation Techniques for Stripped Asphalt Pavements
Final Report
By
David R. Johnson, E.I.
Research Associate
Of the
Western Transportation Institute Civil Engineering Department
Montana State University - Bozeman
And
Reed B. Freeman, PhD. P.E. Pavement Engineer Clinton, Mississippi
Prepared for the
STATE OF MONTANA DEPARTMENT OF TRANSPORTATION
RESEARCH AND DEVELOPMENT PROGRAM
In cooperation with the
U.S. DEPARTMENT OF TRANSPORTATION FEDERAL HIGHWAY ADMINISTRATION
December 5, 2002

Stripped Asphalt Final Report
Technical Report Documentation Page 1. Report No.
FHWA/MT-002-003/8123 2. Government Accession No.
3. Recipient�s Catalog No.
5. Report Date
December 5, 2002 4. Title and Subtitle
Rehabilitation Techniques for Stripped Asphalt Pavements 6. Performing Organization Code
7. Author(s)
David R. Johnson and Reed B. Freeman 8. Performing Organization
Report No.
10. Work Unit No. (TRAIS)
9. Performing Organization Name and Address Western Transportation Institute 413 Cobleigh Hall Montana State University Bozeman, Montana 59717
11. Contract or Grant No. MSU G&C #290220 MDT Project #8123
13. Type of Report and Period Covered
Final Report (1997-2002)
12. Sponsoring Agency Name and Address Montana Department of Transportation 2701 Prospect Avenue Helena, Montana 59620-1001 14. Sponsoring Agency Code
5401 15. Supplementary Notes
Research performed in cooperation with the Montana Department of Transportation and the U.S. Department of Transportation, Federal Highway Administration.
16. Abstract
Asphalt stripping is a fairly common form of distress for pavements in Montana, particularly for pavements that were surfaced with an open-graded friction course. Currently, the technique for rehabilitating these pavements involves the costly removal of most or all of the stripped material, prior to the placement of an overlay. The goal of this research was to determine whether the stripped material can remain in-place, serving as a structural layer within the rehabilitated pavement. This study has involved the construction of five test sites, which were incorporated into larger overlay projects. At each of these sites, stripped material was removed from a control section and stripped material was left in-place for a test section, prior to the placement of the overlay.
Leaving stripped asphalt concrete surface material in-place during rehabilitation, to be overlayed with new asphalt concrete, did not tend to make the rehabilitated pavement more susceptible to either stripping damage or load-induced damage. Life-cycle cost analyses should consider rate of stripping deterioration (in./year) to new asphalt concrete to be the same, whether or not stripped material is removed prior to placing an overlay. Overlay thickness and mix design methods for resisting stripping are the important factors for extending the life of a rehabilitated stripped asphalt pavement.
17. Key Words stripping, raveling, milling, rehabilitation, Road Rater, falling-weight deflectometer, South Dakota Profilometer
18. Distribution Statement No restrictions. This document is available to the public through NTIS, Springfield, Virginia 22161.
19. Security Classif. (of this report) Unclassified
20. Security Classif. (of this page) Unclassified
21. No. of Pages
154
22. Price
Western Transportation Institute Page i

Stripped Asphalt Final Report Implementation Statement
Implementation Statement
This study is sponsored by the Montana Department of Transportation in cooperation with the U.S. Department of Transportation, Federal Highway Administration. The major objective of this study is to determine the most cost-effective method of rehabilitating stripped asphalt pavements in the state of Montana. Recommendations from this study will indicate whether or not stripped material should be removed from a pavement surface, prior to the placement of an overlay.
Western Transportation Institute Page ii

Stripped Asphalt Final Report Acknowledgements
Acknowledgements
The authors would like to extend their appreciation to the Montana Department of Transportation (MDT) for their sponsorship and participation in this project. The following groups within MDT provided essential technical assistance: the Research Bureau, the project technical panel, the Non-Destructive Testing Unit, the Pavement Management Unit, the Asphalt Testing Laboratory, and personnel from the Construction Bureau
Western Transportation Institute Page iii

Stripped Asphalt Final Report Disclaimer
Disclaimer
This document is disseminated under the sponsorship of the Montana Department of Transportation and the United States Department of Transportation in the interest of information exchange. The State of Montana and the United States Government assume no liability of its contents or use thereof.
The contents of this report reflect the views of the authors, who are responsible for the facts and accuracy of the data presented herein. The contents do not necessarily reflect the official policies of the Montana Department of Transportation or the U.S. Department of Transportation.
The State of Montana and the United States Government do not endorse products of manufacturers. Trademarks or manufacturers� names appear herein only because they are considered essential to the object of this document.
This report does not constitute a standard, specification, or regulation.
Western Transportation Institute Page iv

Stripped Asphalt Final Report Alternative Format Statement
Alternative Format Statement
The Montana Department of Transportation attempts to provide reasonable accommodations for any known disability that may interfere with a person participating in any service, program, or activity of the Department. Alternative accessible formats of this document will be provided upon request. For further information, call (406) 444-7693 or TTY (406) 444-7696.
Western Transportation Institute Page v
Stripped Asphalt Final Report Abstract
Abstract
Asphalt stripping is a fairly common form of distress for pavements in Montana,
particularly for pavements that were surfaced with an open-graded friction course. Currently,
the technique for rehabilitating these pavements involves the costly removal of most or all of
the stripped material, prior to the placement of an overlay. The goal of this research was to
determine whether the stripped material can remain in-place, serving as a structural layer
within the rehabilitated pavement. This study has involved the construction of five test sites,
which were incorporated into larger overlay projects. At each of these sites, stripped material
was removed from a control section and stripped material was left in-place for a test section,
prior to the placement of the overlay.
Leaving stripped asphalt concrete surface material in-place during rehabilitation, to
be overlayed with new asphalt concrete, did not tend to make the rehabilitated pavement
more susceptible to either stripping damage or load-induced damage. Life-cycle cost
analyses should consider rate of stripping deterioration (in./year) to new asphalt concrete to
be the same, whether or not stripped material is removed prior to placing an overlay.
Overlay thickness and mix design methods for resisting stripping are the important factors
for extending the life of a rehabilitated stripped asphalt pavement.
Western Transportation Institute Page vi
Stripped Asphalt Final Report Table of Contents
Table of Contents
1. Introduction..................................................................................................................................1
2. Scope of Work .............................................................................................................................2
3. Literature Review.........................................................................................................................4
3.1 Description.....................................................................................................................4
3.2 Molecular-Level Causes of Stripping ............................................................................4
3.3 Macro-Level Mechanisms of Stripping .........................................................................5
3.4 Engineering and Construction Considerations...............................................................7
3.5 Prediction and Identification..........................................................................................9
3.6 Prevention or Minimization .........................................................................................13
3.7 Rehabilitation...............................................................................................................13
4. State Survey ..............................................................................................................................15
5. Test Sites....................................................................................................................................17
5.1 Pre-Rehabilitation Evaluations ....................................................................................26
5.2 Rehabilitation Scenarios ..............................................................................................33
5.3 Pavement Performance Monitoring .............................................................................41
6. Pavement Performance ............................................................................................................50
6.1 Structural Condition.....................................................................................................50
6.2 Roughness and Rut Depth............................................................................................61
6.3 Visual Distress Survey.................................................................................................69
6.4 Cores ............................................................................................................................70
6.5 Precipitation .................................................................................................................74
6.6 Test Section Summaries...............................................................................................76
7. Summary ..................................................................................................................................81
8. Primary Conclusion .................................................................................................................83
Western Transportation Institute Page vii

Stripped Asphalt Final Report Table of Contents
9. Recommendations....................................................................................................................84
10. References................................................................................................................................85
Appendices
Appendix A: Montana Method MT-331, �Method of Sampling and Evaluating Stripping Pavements� ...................................................................................................................................88
Appendix B: Structural Condition Data........................................................................................91
Appendix C: Statistical Test Summaries ...................................................................................121
Appendix D: Roughness and Rut Depth Data ............................................................................134
Appendix E: Visual Distress Survey Data ...................................................................................141
Western Transportation Institute Page viii

Striped Asphalt Final Report List of Tables
List of Tables
Table 1. General Information for Test Sites .................................................................................18
Table 2. Pre-Rehabilitation Construction Information for Test Sites ...........................................26
Table 3. Pre-Construction Road Rater Evaluations ......................................................................27
Table 4. Distress Information for the Total Project Length .........................................................28
Table 5. Summarized Distress Information for Entire Projects and Test Sites ............................30
Table 6. MDT Rating Scheme for Stripping Damage in Cores....................................................31
Table 7. Evaluation of Cores Removed Prior to Rehabilitation ...................................................32
Table 8. Details of Rehabilitation Construction ...........................................................................34
Table 9. MDT Ranking of Pavement Roughness .........................................................................43
Table 10. Distress Types Included in the Visual Examinations ...................................................48
Table 11. Thickness Measurements from Cores...........................................................................71
Table 12. Stripping Measurements from Cores ............................................................................73
Table 13. Precipitation Data Prior To and During the Experiment ..............................................75
Western Transportation Institute Page ix

Striped Asphalt Final Report List of Figures
List of Figures
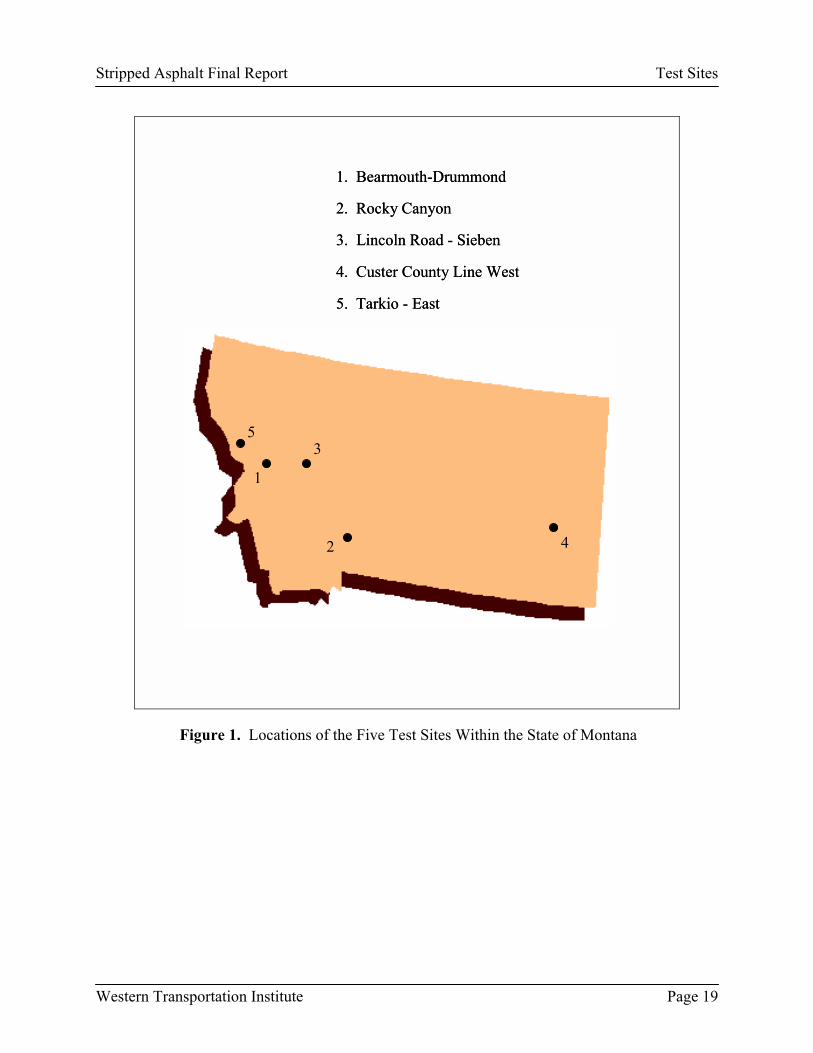
Figure 1. Locations of the Five Test Sites Within the State of Montana......................................19
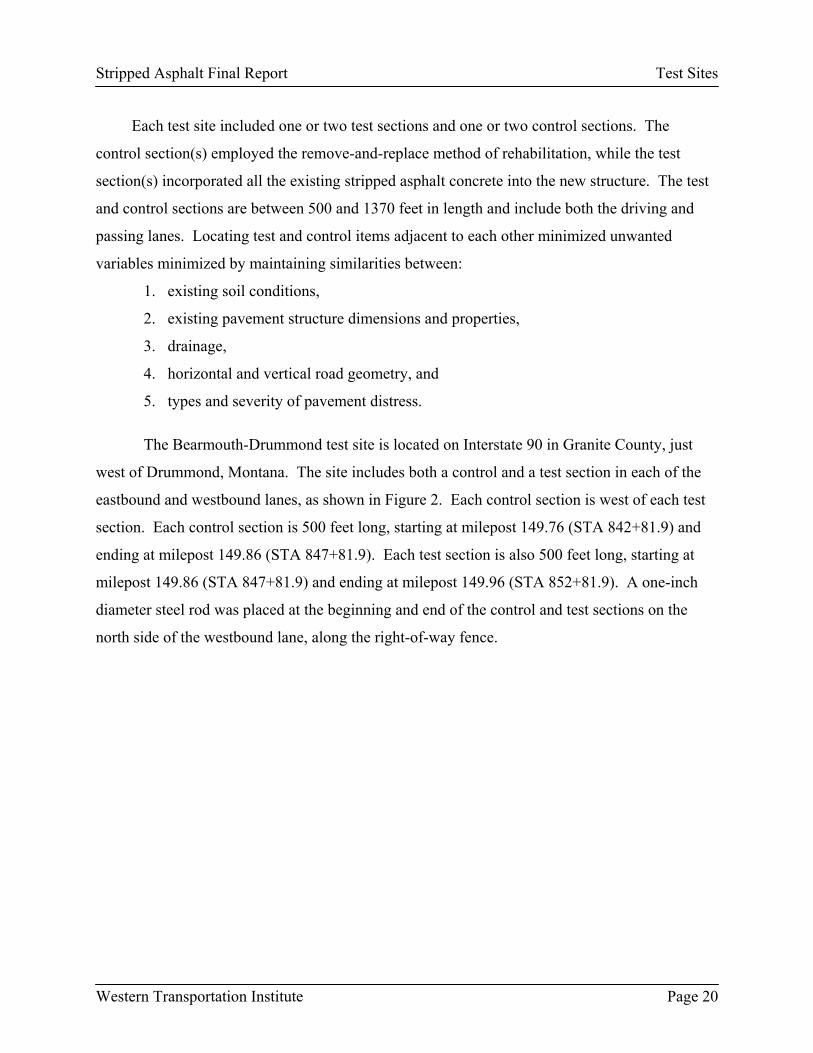
Figure 2: Layout of the Test Site at Bearmouth-Drummond........................................................21
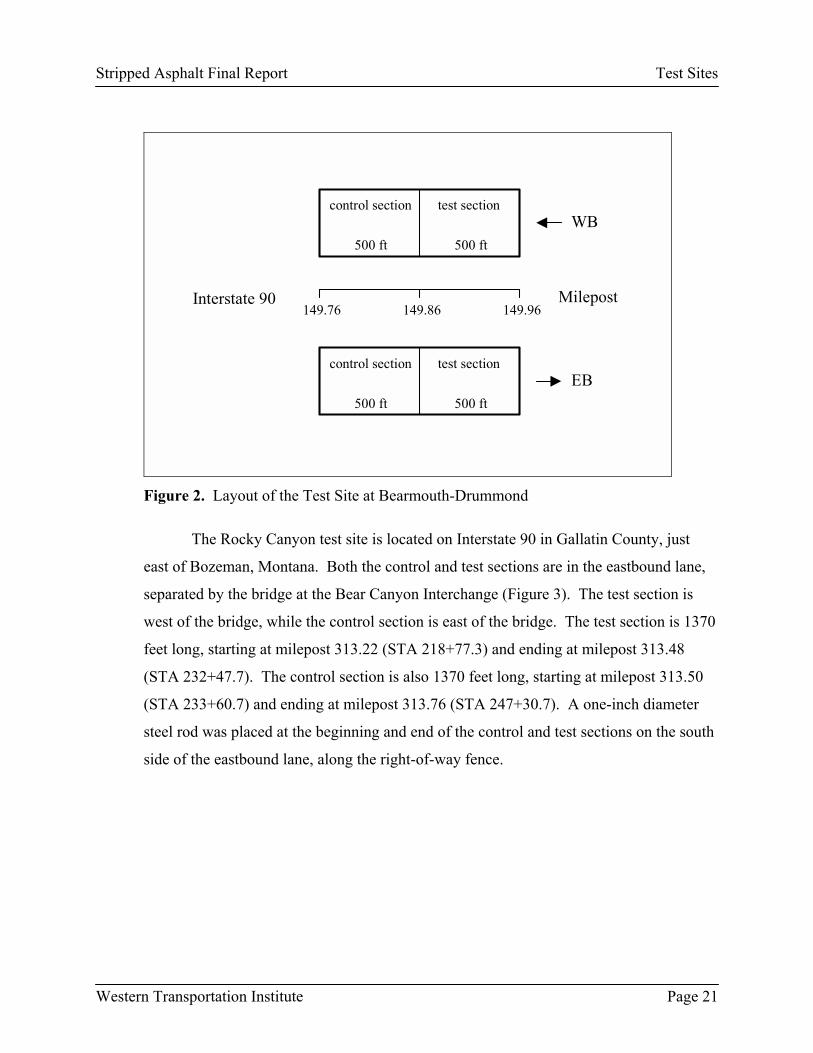
Figure 3: Layout of the Test Site at Rocky Canyon......................................................................22
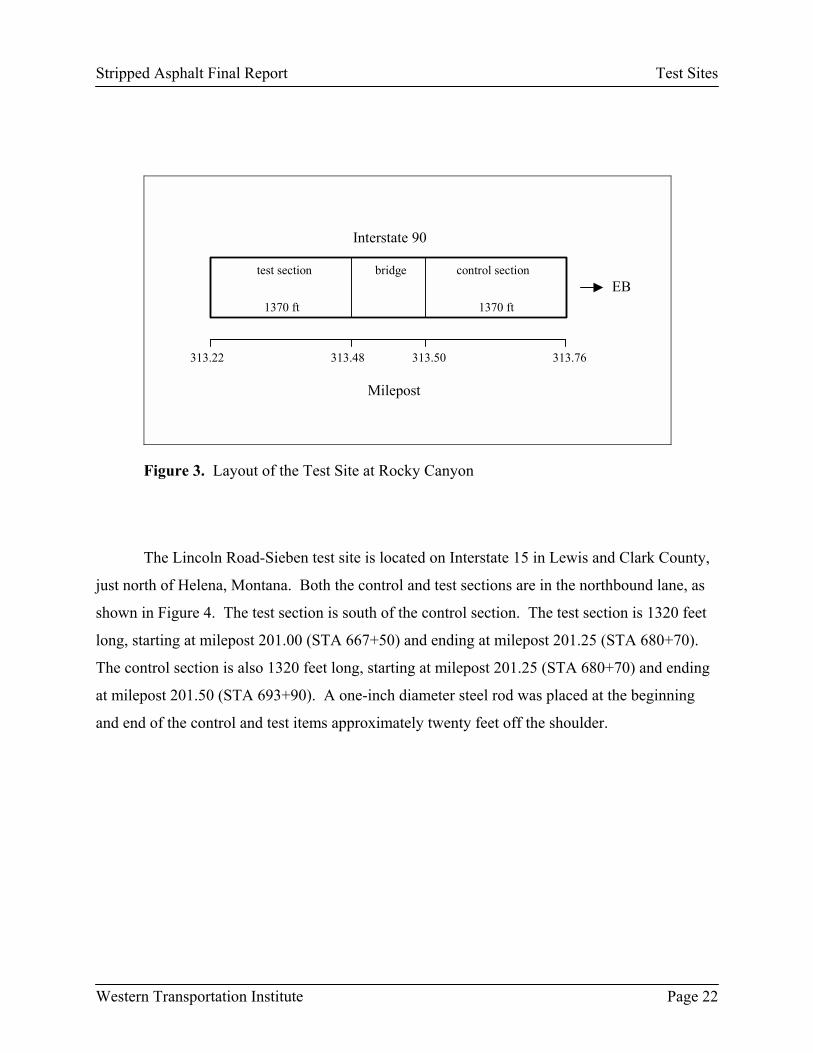
Figure 4. Layout of the Test Site at Lincoln Road-Sieben ..........................................................23
Figure 5. Layout of the Test Site at Custer County Line West.....................................................24
Figure 6. Layout of the Test Site at Tarkio-East...........................................................................25
Figure 7. Pavement Cross-Sections at Bearmouth-Drummond: a) original pavement, b) control section, and c) test section .................................................................................................36
Figure 8. Pavement Cross-Sections at Rocky Canyon: a) original pavement, b) control section, and c) test section .............................................................................................................37
Figure 9. Pavement Cross-Sections at Lincoln Road-Sieben: a) original pavement, b) control section, and c) test section .................................................................................................38
Figure 10. Pavement Cross-Sections at Custer County Line West: a) original pavement, b) control section, and c) test section .................................................................................................39
Figure 11. Pavement Cross-Sections at Tarkio-East: a) original pavement, b) control section, and c) test section .............................................................................................................40
Figure 12. Deflection Basin Obtained During Road Rater and FWD Testing .............................42
Figure 13. Rainhart Profilograph ..................................................................................................45
Figure 14. Moving the Rut-Transcribing Mechanism Across the Rainhart Profilograph ............46
Figure 15. Correlation of Basin Curvature Parameters for Lincoln Road-Sieben Site.................51
Figure 16. Impulse Stiffness Modulus at Bearmouth-Drummond, Westbound Lane ..................53
Figure 17. Impulse Stiffness Modulus at Bearmouth-Drummond, Eastbound Lane....................54
Figure 18. Impulse Stiffness Modulus at Rocky Canyon .............................................................54
Figure 19. Impulse Stiffness Modulus at Lincoln Road ...............................................................55
Figure 20. Impulse Stiffness Modulus at Custer County Line......................................................55
Figure 21. Impulse Stiffness Modulus at Tarkio East...................................................................56
Western Transportation Institute Page x

Striped Asphalt Final Report List of Figures
Figure 22. Basin Curvature at Bearmouth-Drummond, Westbound Lane ...................................57
Figure 23. Basin Curvature at Bearmouth-Drummond, Eastbound Lane.....................................58
Figure 24. Basin Curvature at Rocky Canyon ..............................................................................58
Figure 25. Basin Curvature at Lincoln Road ................................................................................59
Figure 26. Basin Curvature at Custer County Line.......................................................................59
Figure 27 Basin Curvature at Tarkio East.....................................................................................60
Figure 28. International Roughness Index at Bearmouth-Drummond, Westbound Lane ............61
Figure 29. International Roughness Index at Bearmouth-Drummond, Eastbound Lane..............62
Figure 30. International Roughness Index at Rocky Canyon .......................................................62
Figure 31. International Roughness Index at Lincoln Road .........................................................63
Figure 32. International Roughness Index at Custer County Line................................................63
Figure 33. International Roughness Index at Tarkio East.............................................................64
Figure 34. Rutting (Rainhart Profilograph) at Bearmouth-Drummond, Westbound Lane...........66
Figure 35. Rutting (Rainhart Profilograph) at Bearmouth-Drummond, Eastbound Lane ............67
Figure 36. Rutting (Rainhart Profilograph) at Rocky Canyon......................................................67
Figure 37. Rutting (Rainhart Profilograph) at Lincoln Road........................................................68
Figure 38. Rutting (Rainhart Profilograph) at Custer County Line ..............................................68
Figure 39. Rutting (Rainhart Profilograph) at Tarkio East ...........................................................69
Figure 40. Comparison Between Core Thicknesses and MDT Records ......................................71
Figure 41. Thicknesses of Non-Stripped Asphalt Concrete Near the Pavement Surface.............74
Figure 42. Average Annual Precipitation Near Test Sites During the Experiment ......................76
Western Transportation Institute Page xi
Stripped Asphalt Final Report Introduction
1. Introduction
The deterioration of asphalt concrete in the form of stripping is caused by the separation
of the asphalt binder from the aggregate. This loss of adhesion causes the asphalt concrete to
ravel under traffic loads. Stripping occurs in the presence of water, so it is often referred to as
moisture damage.
Currently, the most common method for rehabilitating a stripped pavement in Montana
involves the removal and replacement of most of the stripped material. This practice is
expensive because it requires milling and hauling operations in addition to normal paving
activities. The Montana Department of Transportation (MDT) initiated this project to investigate
the possibility of allowing all stripped material to remain in-place. The premise is that the
stripped asphalt could retain sufficient integrity to be used effectively within the rehabilitated
pavement structure. The original problem statement, submitted by Jim Weaver (former District
Engineer in Missoula, Montana), describes the question at-hand precisely:
�We presently spend millions of dollars to remove pavement that shows signs of stripping because of fear that it may act as �marbles� and destroy subsequent layers of pavement. We should make an attempt to determine if, in fact, the stripped asphalt is a detriment or if it may add value to the surfacing structure. Is the expenditure of millions of dollars to remove stripped asphalt cost effective?�
Western Transportation Institute Page 1

Stripped Asphalt Final Report Scope of Work
2. Scope of Work
This study compared two methods of rehabilitating stripped asphalt pavements by
comparing the performance of full-scale rehabilitated pavement structures. The first method of
rehabilitation involved the removal and replacement of most of the stripped asphalt concrete.
Under this approach, the stripped asphalt concrete layer is presumed to have little structural
value (i.e. less than the value of an equivalent thickness of standard base course material). The
second method of rehabilitation required minimal treatment of the in-place stripped asphalt
concrete layer. Only existing surface treatments and open-graded friction courses were removed
and then the stripped asphalt concrete layer was overlaid with a new surface course. This
approach presumed that the stripped asphalt concrete maintained a structural value at least as
high as a standard base course material.
This study began with a review of current practices concerning both the prevention of
stripping in asphalt concrete and the rehabilitation of pavements that have experienced stripping-
related damage. In addition to a literature search, a brief questionnaire was distributed to the
highway agencies in thirteen states from the northwest and north-central United States. The
survey solicited information regarding their experiences with the prevention and rehabilitation of
stripping damage. Findings from this initial phase are discussed in detail in Sections 3 and 4. As
a brief summary, however, most states have experienced stripping problems and most states have
handled the problem by removing the stripped material. Some of these states allow the removed
material to be recycled as a portion of new hot-mix and some states do not allow the reuse of
stripped asphalt concrete. Oregon was the only state to report the practice of placing an overlay
on top of stripped material.
The construction phase of this study began with the identification of five stripped
pavements among MDT interstate highway resurfacing projects. Plans for each site involved the
implementation of the two rehabilitation methods presented previously. Once sites were
identified, historical data were obtained for each site regarding soils information, original
structural design, and previous overlays. The condition of the pavements needing rehabilitation
was also quantified in general terms.
Western Transportation Institute Page 2
Stripped Asphalt Final Report Scope of Work
The five rehabilitated pavement test sections were monitored visually, structurally, and in
terms of roughness. Monitoring periods lasted for three to five years.
Western Transportation Institute Page 3
Stripped Asphalt Final Report Literature Review
3. Literature Review
This section gives an overview of the state-of-the-art in asphalt stripping science,
including causes, identification, and prevention.
3.1 Description
Asphalt stripping is a phenomenon in which the asphalt binder in an asphalt pavement
loses its ability to bond to the aggregate and the pavement material loses its structural integrity.
The result is a pavement that fails under ordinary traffic loads. These failures manifest
themselves in the form of alligator cracking, potholes and surface raveling, typically progressing
from the bottom of the pavement layers up to the top (Kandahl 1992).
3.2 Molecular-Level Causes of Stripping
Stripping of asphalt pavements occurs at the molecular level and is not entirely
understood in spite of extensive research. It is thought to be associated with either one or both of
two phenomena. First, water can interact with asphalt binder to cause a reduction in cohesion
with a subsequent reduction in stiffness and strength of the mix. Second, and more commonly
believed, water can get between the asphalt film and the aggregate, break the adhesive bond, and
strip the asphalt binder from the aggregate (Hicks 1991).
The nature of the adhesive bond between asphalt and aggregate is a subject of some
debate. Adhesion is defined as that physical property or molecular force by which one body
sticks to another of another nature (Hicks 1991). Several factors affect the adhesion of the
asphalt binder to the aggregate, including: interfacial tension between the asphalt binder and the
aggregate, chemical composition of the asphalt binder and aggregate, binder viscosity, surface
texture of the aggregate, aggregate porosity, aggregate cleanliness, and aggregate temperature
and moisture content at time of mixing (Hicks 1991).
Four general theories of adhesion exist to explain the adhesion of asphalt binder to
aggregates. These include the Mechanical Interlocking Theory, the Chemical Reaction Theory,
the Surface Energy Theory, and the Molecular Orientation Theory. The actual nature of
Western Transportation Institute Page 4
Stripped Asphalt Final Report Literature Review
adhesion is not fully explained by any one of these theories, but is partially explained in each
theory (Hicks 1991). A brief description of each theory follows.
Mechanical Interlocking Theory. Mechanical interlocking assumes the absence of
chemical interaction between binder and aggregate. The bond strength is assumed to be derived
from the cohesion in the binder and interlocking properties of the aggregate particles which
include individual crystal faces, aggregate porosity, absorption, surface coating, and angularity
(Kiggundu and Roberts 1988).
Chemical Reaction Theory. The chemical reaction theory arises from an observation
that stripping is more serious in acidic aggregate mixtures as compared to basic aggregate
mixtures. It is suggested that the chemical reaction between most asphalt binders and acidic
aggregates is not as strong as the reaction between most asphalt binders and basic aggregates
(Hicks 1991).
Surface Energy Theory. When asphalt spreads over and wets an aggregate surface, a
change in energy takes place. This change of energy, known as adhesion tension, is a surface
phenomenon that depends on the closeness of contact and mutual affinity of the asphalt binder
and aggregate (Hicks 1991). The adhesion tension for water to aggregate is higher than that for
asphalt binder to aggregate, and consequently water has a tendency to displace the asphalt binder
from the aggregate.
Molecular Orientation Theory. The molecular orientation theory states that when
asphalt binder comes into contact with an aggregate surface, the molecules in the binder orient
themselves so as to satisfy the energy demands of the aggregate. Water molecules are dipolar.
Asphalt molecules are generally nonpolar although they contain some polar components.
Consequently, water molecules, being more polar, may more readily satisfy the energy demands
of an aggregate surface (Hicks 1991)
3.3 Macro-Level Mechanisms of Stripping
Many macro-level mechanisms of stripping have been proposed, but the six most
commonly accepted mechanisms are detachment, displacement, spontaneous emulsification, film
Western Transportation Institute Page 5
Stripped Asphalt Final Report Literature Review
rupture, pore pressure, and hydraulic scouring. Much debate exists as to the relative contribution
of each macro-level mechanism to stripping in individual cases. For instance, it is probable that
the predominant stripping mechanisms in a hot-dry environment differ from the mechanisms in
hot-wet, cold-dry, and cold-wet environments (Kiggundu and Roberts 1988). Each mechanism
occurs as a result of one or more of the molecular-level causes described earlier. A brief
description of each mechanism follows.
Detachment. Detachment is the microscopic separation of a binder film from the
aggregate surface by a thin layer of water with no obvious break in the binder film. The binder
will then peel cleanly from the aggregate. The thin film of water probably results from either
aggregate that was not completely dried, interstitial pore water which vaporized and condensed
on the surface, or possibly water which permeated through the asphalt film to the interface
(Kiggundu and Roberts 1988).
Displacement. Displacement occurs when the binder is removed from the aggregate
surface by water. In this type of stripping, as compared to detachment, the free water gets to the
aggregate surface through a break in the binder coating. The break may be from incomplete
coating during mixing or from binder film rupture (Asphalt Institute 1981).
Spontaneous Emulsification. Spontaneous emulsification occurs when an inverted
emulsion (water droplets in binder rather than binder droplets in water as found in common
emulsified asphalt) is formed. In its emulsified state, the binder is less tenacious. This
mechanism seems to be enhanced under traffic on mixtures laden with free water (Kiggundu and
Roberts 1988).
Film Rupture. Film rupture, while not a stripping mechanism on its own, is believed to
initiate stripping. Film rupture is marked by fissures that occur under stresses of traffic at sharp
aggregate edges and corners where the binder film is the thinnest. Once a break in the film is
present, water is able to find its way to the interface and initiate stripping (Asphalt Institute
1981).
Western Transportation Institute Page 6
Stripped Asphalt Final Report Literature Review
Pore Pressure. A build-up of pore pressure is another possible stripping mechanism.
Stripping from pore pressure build-up begins when water is allowed to circulate freely through
the interconnected voids of a high void asphalt mixture. Traffic effects cause the void space to
be reduced and passages between voids to be closed thus trapping water. The continued action
of traffic can then cause pore pressures to build up to the point of stripping the binder from the
aggregate (Asphalt Institute 1981).
Hydraulic Scouring. Hydraulic scouring occurs more in surface courses than the lower
courses of an asphalt pavement. When the pavement is saturated, wheel action causes water to
be pressed into the pavement in front of the tires and to be sucked out behind the tires. This
water tends to strip the binder from the aggregate. This scouring action can be worsened by the
presence of abrasives, such as dust, on the surface of the roadway (Asphalt Institute 1981). This
form of stripping causes distress in the form of surface raveling.
3.4 Engineering and Construction Considerations
The initiation of one or more of the previously described stripping mechanisms is
attributable to engineering and/or construction problems. These problems include, but are not
necessarily limited to, inadequate pavement drainage, inadequate compaction, excessive dust
coating on the aggregate, inadequate drying of aggregates, weak and friable aggregates, and the
use of waterproofing membranes and seal coats (Kandahl 1992). Each factor will be briefly
described below, as will several other possible causes.
Inadequate Pavement Drainage. Inadequate surface drainage and/or subsurface
drainage allows the water that is necessary for stripping to occur to remain in the pavement
system. Water can enter the pavement layers in numerous ways. Surface water can percolate
down from the surface, usually through surface cracks. It can also seep in from the sides and
bottom from sources such as ditches or high groundwater. Water can also enter the bottom of the
pavement system by the upward forces of capillarity or as rising vapor condensation due to water
in the subgrade or subbase (Kandahl 1992).
Inadequate Compaction. A high number of air voids present in the asphalt layers
allows the movement of water through these pore spaces. Studies have shown that at less than
Western Transportation Institute Page 7
Stripped Asphalt Final Report Literature Review
4% to 5% air void content, the voids are generally not interconnected and therefore impervious
to water (Kandahl 1992). While most asphalt mixes are designed to have 3% to 5% air voids,
many agencies allow a maximum air void content of 8% at construction assuming that the
remaining compaction will occur under 2 to 3 years of traffic. However, partly due to poor
quality control at construction, the design air voids content is never reached. If the pavement
remains pervious for an extended period of time, stripping is likely to occur due to ingress of
water and hydraulic pore pressures induced by traffic (Kandahl 1992).
Excessive Dust Coating on Aggregate. The problem created by excessive dust coating
on the aggregate is two-fold. First, the presence of dust and clay coatings on the aggregate
inhibits intimate contact and complete wetting of the aggregate by the asphalt cement. Because
the asphalt is adhered to the dust coating and not the aggregate itself, the bitumen is easily
stripped from the aggregate. Second, the presence of dust particles enhances the action of
scouring under the effects of traffic (Kandahl 1992).
Inadequate Drying of Aggregate. Aggregate that absorbs or adsorbs water will strip
easily if not properly dried. This results from the asphalt being displaced from the aggregate by
the thin layer of water already present. A dry aggregate surface will have increased adhesion
with the asphalt cement compared to a moist or wet surface (Kandahl 1992).
Weak and Friable Aggregate. If weak and friable aggregate is used in an asphalt mix,
degradation is possible during rolling and subsequently under heavy traffic. Degradation or
delamination exposes uncoated aggregate surfaces which will readily absorb water and initiate
the stripping process (Kandahl 1992).
Waterproofing Membranes and Seal Coats. If moisture is present beneath the
pavement, then sealing the road surface can be detrimental in terms of stripping. A seal coat or
membrane, either on or within the pavement layers, acts as a vapor barrier trapping moisture in
the asphalt which facilitates stripping (Kandahl 1992).
Additional Factors. Several additional factors have been suggested to also contribute to
stripping, including the use of open-graded friction courses (Kandahl 1992), the use of excess
Western Transportation Institute Page 8

Stripped Asphalt Final Report Literature Review
anti-strip additives (Asphalt Institute 1981), the use of siliceous, or �water-loving,� aggregates
(Asphalt Institute 1981), and the use of aggregates that have relatively high surface potentials,
those that impart a high pH value to water in contact with their surfaces (Yoon and Tarrer 1988).
Weather conditions during construction have been related to stripping behavior (Hicks
1991). If the weather is cool and wet during construction, moisture damage is more likely to
occur. During a pavement�s life, environmental factors such as temperature fluctuations, freeze-
thaw cycles, and wet-dry cycles have been suggested to influence stripping (Hicks 1991).
The presence of microorganisms in the binder as well as in the surrounding soil may also
contribute to stripping (Ramamurti and Jayaprakash 1987, Ramamurti and Jayaprakash 1992,
Brown and Pabst 1988). These asphalt-loving bacteria feed on the asphaltic hydrocarbons, thus
creating microscopic tunnels through the binder, which allow water access to the
binder/aggregate interface. Water access, coupled with the pumping action of repeated wheel
loads, can initiate stripping failures.
All other factors being equal, it is suggested that increased repetitions of traffic loadings
accelerates stripping (Hicks 1991).
3.5 Prediction and Identification
The asphalt industry has developed two basic types of tests with regard to asphalt
stripping: predictive tests that identify stripping potential in asphalt mixes and raw materials, and
identification tests that identify whether stripping is in progress. This section will list the test
methods currently being practiced in the industry, as well as by MDT.
Prediction. Numerous laboratory tests exist that are designed to identify paving
mixtures that are susceptible to stripping. If a material is identified as being prone to stripping,
then the necessary actions can be taken to prevent stripping before it starts.
The most basic requirements of a stripping test are that it fail mixes that will strip in
service and pass mixes that will perform well in the field. Tests for stripping potential may be
divided into three types (Asphalt Institute 1981): 1) those that require visually estimated
stripping damage after prescribed conditioning, 2) those that measure the time-to-disruption of
Western Transportation Institute Page 9

Stripped Asphalt Final Report Literature Review
mix specimens stressed in some manner in the presence of water, and 3) those that measure the
change in mechanical properties of mix specimens exposed to water in some type of conditioning
scheme.
The first category includes boiling tests such as ASTM standard method D3625 (ASTM
2000) and static immersion tests such as AASHTO T182 (AASHTO 2000). These methods
require visual estimation of stripping after the prescribed conditioning. In ASTM D3625, loose
asphalt concrete is placed in boiling water for 10 minutes. After this conditioning, the mix is
inspected to determining whether the percentage of aggregate surface that retains its binder
coating is above or below 95 percent. AASHTO T182 is similar, but the loose mix is immersed
in distilled water at 77°F (25°C) for a period of 16 to 18 hours.
The second category is exemplified by the Texas Freeze-Thaw Pedestal Test (Kennedy,
Roberts, and Lee 1983). In this test a small asphalt-aggregate sample (1-5/8 in. diameter x ¾ in.
tall cylinder) is cured for 3 days and is then immersed in distilled water, subsequently frozen at
10°F for 15 hours, and then heated to 120°F for 9 hours. This cycle is repeated until visible
cracking develops. The mixture is judged to be susceptible to moisture damage if cracking
develops in less than 10 cycles (NCHRP 1991).
The third category includes the largest number of tests currently being practiced. In all of
these tests, compacted asphalt-aggregate specimens are exposed to prescribed conditioning
regimens. The ratio of the value of a specific mechanical property, such as compressive strength
or tensile strength, measured after conditioning and before conditioning provides the gauge for
stripping damage potential. The Immersion-Compression Test, ASTM D1075 (ASTM 2000),
involves conditioning by soaking in hot water (120°F or 140°F) and testing by unconfined
compressive strength. The Marshall-Immersion Test is similar, but the mechanical test is
achieved with the Marshall stabilometer.
Several tests have been used that involve indirect diametrical tension as the mechanical
test. The Lottman version (Lottman 1978, Lottman 1982) requires compaction of nine 4-inch-
diameter specimens to a void content similar to that expected in the field. The specimens are
divided into three groups of three. Group 1 specimens are subjected to no conditioning. Group 2
Western Transportation Institute Page 10
Stripped Asphalt Final Report Literature Review
specimens are vacuum saturated with water. Group 3 specimens are vacuum saturated similar to
Group 2 specimens and then they are subjected to one freeze-thaw cycle. While Group 2 reflects
field performance of up to four years, Group 3 reflects field performance up to twelve years. A
minimum tensile strength ratio (Group 2 / Group 1 or Group 3 / Group1) of 0.70 is recommended
to ensure adequate field performance (Lottman 1982).
Tunnicliff-Root version (Tunnicliff and Root 1984) of this test requires specimens to be
compacted to void contents of six to eight percent. The Group 2 specimens are vacuum saturated
to levels between fifty-five and eighty percent. They are then soaked for twenty-four hours in
140°F water. A minimum tensile strength ratio of 0.70 is recommended to ensure adequate field
performance. This method was standardized as ASTM D4867 (ASTM 2000), with Group 3 (the
freeze/thaw group) as an option.
The Modified Lottman Test, which was standardized as AASHTO T283 (AASHTO
2000), combines the two previous methods. Compaction and vacuum saturation are similar to
the Tunnicliff-Root version. Group 2 specimens are subjected to one freeze-thaw cycle, as
proposed by Lottman. All specimens are tested for indirect tensile strength. A minimum tensile
strength ratio of 0.70 is recommended to ensure adequate field performance.
A final test method for this category (involving changes in mechanical properties) was
developed during the Strategic Highway Research Program (SHRP) and was given the SHRP
test method designation M-006, " Determining Moisture Sensitivity Characteristics of
Compacted Bituminous Mixtures Subjected to Hot and Cold Climate Conditions" (SHRP 1994).
This test requires the use of the Environmental Conditioning System (ECS) that was also
developed during SHRP (Al-Swailmi and Terrel 1992). To represent field conditions, asphalt
concrete samples are exposed to both wetting and repeated axial loads. Both warm- and cold-
climate conditioning can be performed, depending on the geographic region of interest.
Specimens are monitored for changes in resilient modulus (axial), air permeability, and water
permeability. At the conclusion of the test, the specimens are tested for indirect tensile strength
and they are inspected visually for stripping (by estimating the percent of exposed aggregate
surface). As of the year 2002, this test had not been given an AASHTO or ASTM test method
designation.
Western Transportation Institute Page 11

Stripped Asphalt Final Report Literature Review
Numerous groups have studied the merits of the various test methods (Kandahl 1992,
Kiggundu and Roberts 1988, Parker 1987, Maupin 1989, Shatnawi, Nagarajaiah, and Harvey
1995, and Bruce 1990) have all evaluated the relative merits of some or all of the available test
methods. Kiggundu and Roberts (1988) go so far as to rank the methods tested in their study as
follows (in decreasing order of usefulness): 1) Lottman test, 2) Tunnicliff-Root test, 3) 10-
Minute Boil test, 4) Immersion-Compression test, and 5) Nevada Dynamic Strip test. Kandahl
(1992) states that "the Modified Lottman Test is the most appropriate test method available at the
present time to detect moisture damage [-potential] in HMA mixes." The Montana Department
of Transportation (MDT) primarily uses the Modified Lottman procedure for its own testing.
Identification. Testing of in-situ materials is not standardized throughout the industry
and tends to be very subjective. Effective and reliable identification is difficult because the types
of pavement distress caused by stripping, such as raveling or rutting, may be caused by other
non-hydraulic mechanisms. Also, field data on stripping tends to describe pavement distress in
subjective terms that are difficult to normalize between locations when gathered by different
individuals. Due to the subjectivity and widespread differences of the available practices, only
the MDT method will be described.
The MDT procedure for evaluating stripped asphalt involves visual inspection of asphalt
cores. This procedure calls for a core to be taken from the pavement section in question, split
diametrically, visually evaluated, and rated on a scale from zero to four. To ensure consistency,
the ratings are produced by comparing cored materials to photographs and written descriptions
that are associated with each of the five rating numbers. A rating of four indicates a core without
stripping damage. The split surface should be shiny and black, with all aggregate particles
coated by binder. A rating of zero indicates a core with severe stripping damage. Either binder
is absent from most aggregate surfaces or the asphalt material disintegrates during coring
operations. This rating procedure is part of Montana test method MT-331, �Method of Sampling
and Evaluating Stripping Pavements,� which is included as Appendix A in this report.
Western Transportation Institute Page 12

Stripped Asphalt Final Report Literature Review
3.6 Prevention or Minimization
Whether building a new pavement or overlaying or recycling an old one, measures should
be taken to prevent or minimize stripping when stripping occurrence is probable. Prevention or
minimization can be achieved by avoiding the causes discussed earlier. Published literature
generally categorize stripping precautions into (Asphalt Institute 1981): 1) material selection, 2)
construction practices, and 3) the use of anti-strip additives.
By choosing materials that are less prone to stripping, some stripping failures can be
averted. Certain types of aggregates are especially prone to stripping (Hicks 1991) and should be
avoided. Certain types and grades of asphalt binders as well as some asphalt-aggregate
combinations are likely to strip (Hicks 1991) and should also be avoided.
Good construction practices are essential to building pavements that will not strip.
Particularly important is the need to ensure thorough compaction of the asphalt mat to minimize
pore space and thus permeability (Hicks 1991, Asphalt Institute 1981).
While some agencies specify the use of anti-strip additives, either chemical or lime, in all
new asphalt mixes, it is probably only necessary to use additives in those mixes that contain
materials that are known to be prone to stripping (Kandahl 1992, Tunnicliff and Root 1984).
3.7 Rehabilitation
Rehabilitation of a stripped pavement currently includes several possible remedial
alternatives. The simplest of these is to overlay the stripped pavement as is with a new asphalt
mat. Variations of this simple overlay method involve the repair of deteriorated sections of the
old pavement, milling of the existing surface course, placement of a leveling course, or
placement of a paving fabric, all before an overlay is placed.
The most widely practiced method of rehabilitation involves the complete removal and
replacement of the stripped pavement. This is expensive and wasteful, particularly if the
material is not used in other paving projects that allow recycling. However, it is the only method
that ensures that all stripped and stripping-prone material is removed.
Western Transportation Institute Page 13
Stripped Asphalt Final Report Literature Review
The most important developments in the practice of pavement rehabilitation involve
recycling. Recycling is important because of the reduced environmental impacts associated with
reusing the failed material. Many methods of recycling are currently being practiced, including
various methods of cold and hot recycling. Cold recycling (Epps et al 1980, Canessa 1995,
Fanning and Day 1995) can include planing or milling of the existing pavement, followed by
reuse of the milled material, typically as a pavement base material.
Hot recycling includes the removal of the failed material, usually by milling. The milled
material is then either reused immediately, i.e. hot-in-place recycling (Button et al 1994, Button
et al 1995) or it is run back through a hot-mix plant at a future date (Wyoming SHD 1995). Hot
in-place recycling is a process that allows the failed pavement to be rehabilitated in-situ. In
some cases now, the process can be completed in a single pass. This is beneficial with respect to
minimizing disruption of traffic. Current limitations of hot in-place recycle techniques include
expensive equipment costs and limited depth of effective rehabilitation.
Some concerns have been raised as to whether the presence of stripped material in a
recycled asphalt mix will accelerate stripping in the new pavement. A study by Amirkhanian
and Burati (1992) at Clemson University shows that the use of recycled material in an asphalt
mix does not create increased risk of moisture damage in the recycled pavement. However,
rehabilitation should include determining the cause of stripping, as well as the proper preventive
measures for future stripping. Preventive measures will likely involve improving drainage
around the site of the stripping failure (Kandhal and Rickards 2001).
Western Transportation Institute Page 14

Stripped Asphalt Final Report State Survey
4. State Survey
In the early stages of this investigation, questionnaires were sent to state highway
agencies in the northwest and north-central United States. The questionnaires pertained to their
experiences with asphalt stripping. The purpose was to gain insight as to other state�s
impressions on the severity of stripping problems, as well as their methods of dealing with the
problem.
The sampling of the states was chosen to approximately reflect the type of climate found
in Montana, specifically the severe fluctuations between hot and cold. The results were not
intended to provide a scientific or statistically significant result, only to provide a brief
representation of techniques currently being applied in the area of asphalt stripping. Surveys
were sent to thirteen state agencies, of which three did not respond. Responses were received
from agencies in the following ten states: Colorado, Idaho, Minnesota, Nebraska, Nevada, North
Dakota, Oregon, Utah, Washington, and Wyoming.
This section will briefly summarize the results of the survey and highlight the most
interesting feedback.
Question Number 1. The first question inquired if the state had experienced stripping
related problems on its roadways and also asked for a brief explanation. North Dakota was the
only state that indicated they had experienced no stripping related problems and cited the use of
strip resistant aggregates as the reason. All other states indicated at least some degree of
experience with asphalt stripping; the reasons cited for the problem varied widely. Colorado and
Nebraska indicated that stripping problems were exasperated by moisture trapped beneath seal
coats. Other popular causes of stripping included: incompatibility between aggregates and
asphalt binder, coating of fine particles on aggregates prior to mixing, incomplete mixing of the
aggregate and asphalt binder, and poor compaction of the asphalt concrete mat.
Question Number 2. The second question inquired into a state�s current techniques for
rehabilitating a pavement that has experienced a stripping failure. The overwhelming response
was to remove the stripped asphalt and to replace it with new material using either some or all
Western Transportation Institute Page 15

Stripped Asphalt Final Report State Survey
virgin material. Wyoming and Idaho both hot-recycle stripped asphalt concrete, with Wyoming
indicating extensive use. Nebraska and Nevada do not recycle any stripped material. The
remaining respondents all indicated some stockpiling and reuse of stripped material, either at
some percentage in new asphalt concrete or as base material.
Lime was the most popular additive mentioned to minimize stripping problems in new
pavements. Idaho was the only state to indicate the use of a liquid chemical anti-strip additive.
Question Numbers 3 and 4. Questions 3 and 4 asked the states if their chosen method
of rehabilitation was effective and what changes they planned to make in the future.
Surprisingly, in spite of the on-going problem of stripping, most states expressed satisfaction
with their current method of rehabilitation, expected to see full design life from rehabilitated
pavements, and indicated no plans to alter their methods in the future.
Question Number 5. Lastly, questionnaire recipients were asked to list any methods for
rehabilitating a stripped pavement that they would like to try or like to see tested if the means
were available to them. Interestingly, only four agencies replied to this question. All four,
however, indicated that they wished to see more done with recycling, and two referred
specifically to hot in-place recycling.
Summary. The survey results confirm that stripping is a common form of deterioration
for asphalt concrete in the northwestern United States. The phenomenon of stripping is not
completely understood. No single rehabilitative method has universal application or acceptance.
Western Transportation Institute Page 16
Stripped Asphalt Final Report Test Sites
5. Test Sites
Five test sites were selected on interstate highways across the state of Montana. All the
test sites were constructed as part of larger pavement rehabilitation contracts. Test sites were
chosen based on the following criteria:
1. the sites had to be well-distributed across the state,
2. each pavement had to be determined as stripped according to MDT test procedures, and
3. the timing for rehabilitation construction had to be appropriate.
The test sites are listed in Table 1 and their locations are shown in Figure 1. The
rehabilitation projects were conducted between 1994 and 1997. The total lengths of the
rehabilitation projects ranged from five miles to seventeen miles. Among the chosen test sites,
the Rocky Canyon area experiences the most precipitation, while the Lincoln Road-Sieben area
experiences the least. The Custer County Line West area experiences the hottest summers. The
Tarkio-East area experiences relatively mild winters. The five sites rank in the following order,
in terms of both increasing average daily traffic (ADT) and increasing equivalent single-axle
loads (ESALS): Custer County Line West, Lincoln Road-Sieben, Tarkio-East, Bearmouth-
Drummond, and Rocky Canyon.
Western Transportation Institute Page 17

Stripped Asphalt Final Report Test Sites
Table 1. General Information for Test Sites
Characteristic Bearmouth-Drummond
Rocky Canyon
Lincoln Road-Sieben
Custer County Line West Tarkio-East
Project Number IM 90- 3(74) 135
IM 90- 6(70) 313
IM 15- 4(69) 200
IM 92- 4(49) 154
M 90-1(118) 64
County Granite Gallatin Lewis and Clark Custer Mineral
Interstate I-90 I-90 I-15 I-94 I-90
Length of Project (mi) 15.2 5.3 17.1 8.9 10.5
Date of Rehabilitation 1994-95 1995 1996 1996 1996-97
Climatic Data
Mean Precipitation (in.) 13.5 18.6 11.4 14.0 14.5
Mean Temperaturesa (ºF)
7-Day-Average Highb 91 (3.0) 88 (4.8) 88 (4.8) 97 (4.6) 93 (4.7)
Single-Day Lowb -27 (4.2) -24 (3.4) -26 (3.1) -29 (3.8) -15 (3.5)
Traffic Data
Average Daily Traffic, ADT (Year)
6800 (1991) 8100 (1991) 3700 (1993) 2800 (1991) 4500 (1991)
ADTc (Letting Year), Percent Trucks
7500 (1993), 20.2%
9200 (1996),20.3%
4000 (1996), 17.2%
3000 (1993), 20.7%
5000 (1993), 23.8%
ADT (2002), Percent Trucks
7360, 26.7%
14480, 14.9% 3600, 20.7% 2870, 32.2% 7150, 25.6%
Average Daily ESALs (2002) 1599 1634 677 748 1602
a From SHRP weather database (at least 20 years of data) b mean (standard deviation) c projected
Western Transportation Institute Page 18
Stripped Asphalt Final Report Test Sites
1. Bearmouth-Drummond
2. Rocky Canyon
3. Lincoln Road - Sieben
4. Custer County Line West
5. Tarkio - East
1
2
3
4
5
1. Bearmouth-Drummond
2. Rocky Canyon
3. Lincoln Road - Sieben
4. Custer County Line West
5. Tarkio - East
1
2
3
4
5
1. Bearmouth-Drummond
2. Rocky Canyon
3. Lincoln Road - Sieben
4. Custer County Line West
5. Tarkio - East
1
2
3
4
5
Figure 1. Locations of the Five Test Sites Within the State of Montana
Western Transportation Institute Page 19
Stripped Asphalt Final Report Test Sites
Each test site included one or two test sections and one or two control sections. The
control section(s) employed the remove-and-replace method of rehabilitation, while the test
section(s) incorporated all the existing stripped asphalt concrete into the new structure. The test
and control sections are between 500 and 1370 feet in length and include both the driving and
passing lanes. Locating test and control items adjacent to each other minimized unwanted
variables minimized by maintaining similarities between:
1. existing soil conditions,
2. existing pavement structure dimensions and properties,
3. drainage,
4. horizontal and vertical road geometry, and
5. types and severity of pavement distress.
The Bearmouth-Drummond test site is located on Interstate 90 in Granite County, just
west of Drummond, Montana. The site includes both a control and a test section in each of the
eastbound and westbound lanes, as shown in Figure 2. Each control section is west of each test
section. Each control section is 500 feet long, starting at milepost 149.76 (STA 842+81.9) and
ending at milepost 149.86 (STA 847+81.9). Each test section is also 500 feet long, starting at
milepost 149.86 (STA 847+81.9) and ending at milepost 149.96 (STA 852+81.9). A one-inch
diameter steel rod was placed at the beginning and end of the control and test sections on the
north side of the westbound lane, along the right-of-way fence.
Western Transportation Institute Page 20
Stripped Asphalt Final Report Test Sites
Milepost
500 ft500 ft
500 ft 500 ft
control section test section
149.76 149.86 149.96
WB
EB
Interstate 90
control section test section
Milepost
500 ft500 ft
500 ft 500 ft
control section test section
149.76 149.86 149.96
WB
EB
Interstate 90
control section test section
Figure 2. Layout of the Test Site at Bearmouth-Drummond
The Rocky Canyon test site is located on Interstate 90 in Gallatin County, just
east of Bozeman, Montana. Both the control and test sections are in the eastbound lane,
separated by the bridge at the Bear Canyon Interchange (Figure 3). The test section is
west of the bridge, while the control section is east of the bridge. The test section is 1370
feet long, starting at milepost 313.22 (STA 218+77.3) and ending at milepost 313.48
(STA 232+47.7). The control section is also 1370 feet long, starting at milepost 313.50
(STA 233+60.7) and ending at milepost 313.76 (STA 247+30.7). A one-inch diameter
steel rod was placed at the beginning and end of the control and test sections on the south
side of the eastbound lane, along the right-of-way fence.
Western Transportation Institute Page 21
Stripped Asphalt Final Report Test Sites
Milepost
1370 ft 1370 ft
control sectiontest section
313.22 313.48 313.76
EB
Interstate 90
313.50
bridge
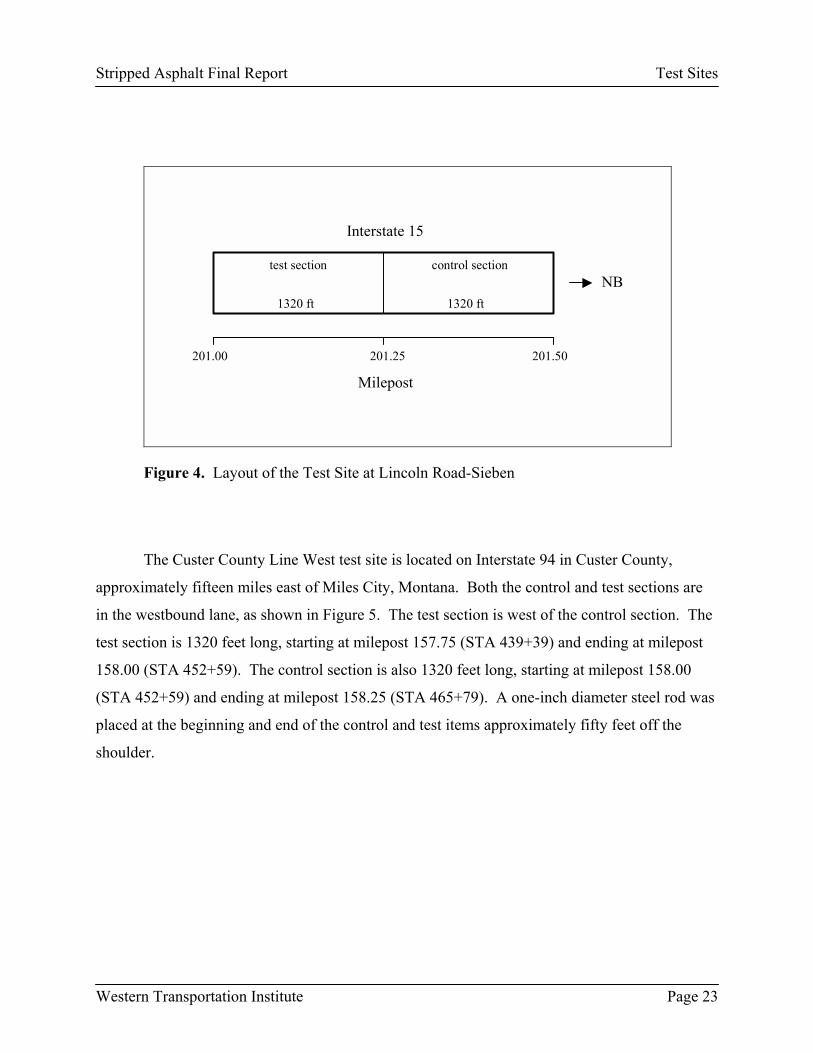
Milepost
1370 ft 1370 ft
control sectiontest section
313.22 313.48 313.76
EB
Interstate 90
313.50
bridge
Figure 3. Layout of the Test Site at Rocky Canyon
The Lincoln Road-Sieben test site is located on Interstate 15 in Lewis and Clark County,
just north of Helena, Montana. Both the control and test sections are in the northbound lane, as
shown in Figure 4. The test section is south of the control section. The test section is 1320 feet
long, starting at milepost 201.00 (STA 667+50) and ending at milepost 201.25 (STA 680+70).
The control section is also 1320 feet long, starting at milepost 201.25 (STA 680+70) and ending
at milepost 201.50 (STA 693+90). A one-inch diameter steel rod was placed at the beginning
and end of the control and test items approximately twenty feet off the shoulder.
Western Transportation Institute Page 22
Stripped Asphalt Final Report Test Sites
Milepost
1320 ft 1320 ft
control sectiontest section
201.00 201.50
NB
Interstate 15
201.25
Milepost
1320 ft 1320 ft
control sectiontest section
201.00 201.50
NB
Interstate 15
201.25
Figure 4. Layout of the Test Site at Lincoln Road-Sieben
The Custer County Line West test site is located on Interstate 94 in Custer County,
approximately fifteen miles east of Miles City, Montana. Both the control and test sections are
in the westbound lane, as shown in Figure 5. The test section is west of the control section. The
test section is 1320 feet long, starting at milepost 157.75 (STA 439+39) and ending at milepost
158.00 (STA 452+59). The control section is also 1320 feet long, starting at milepost 158.00
(STA 452+59) and ending at milepost 158.25 (STA 465+79). A one-inch diameter steel rod was
placed at the beginning and end of the control and test items approximately fifty feet off the
shoulder.
Western Transportation Institute Page 23

Stripped Asphalt Final Report Test Sites
Milepost
1320 ft 1320 ft
control sectiontest section
157.75 158.25
WB
Interstate 94
158.00
Milepost
1320 ft 1320 ft
control sectiontest section
157.75 158.25
WB
Interstate 94
158.00
Figure 5. Layout of the Test Site at Custer County Line West
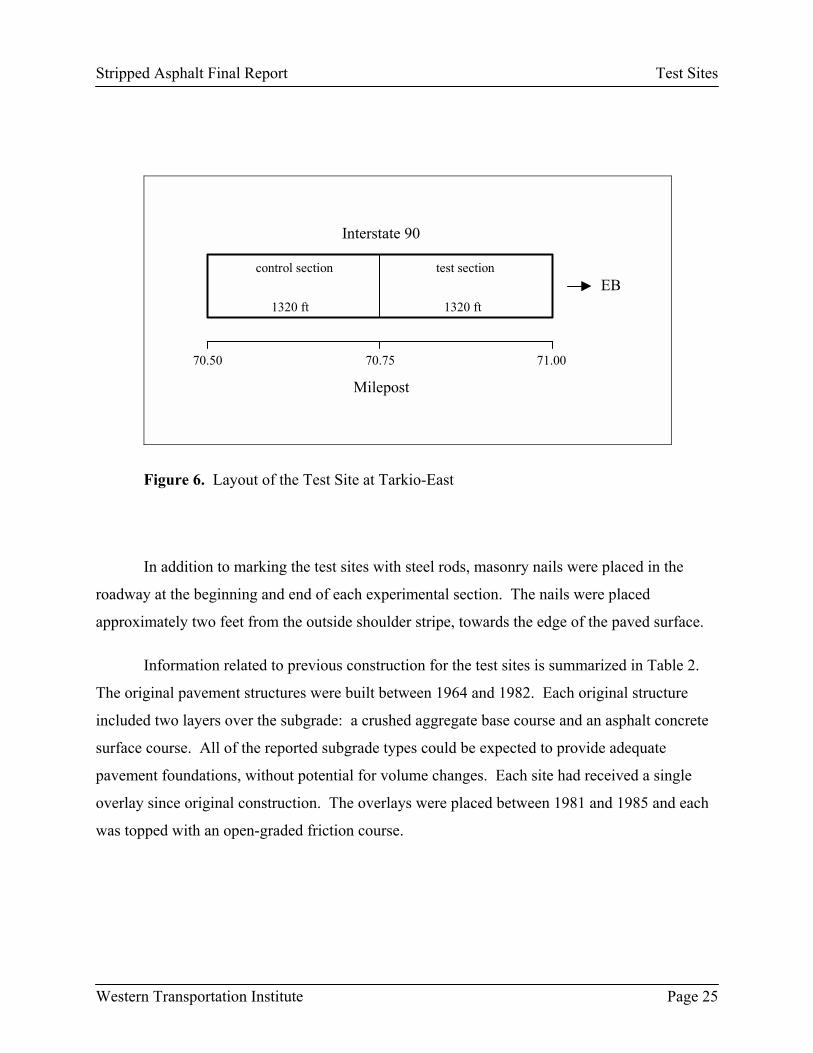
The Tarkio-East test site is located on Interstate 90 in Mineral County, just east of Tarkio,
Montana. Both the control and test sections are in the eastbound lane, as shown in Figure 6. The
control section is west of the test section. The control section is 1320 feet long, starting at
milepost 70.50 (STA 627+18.1) and ending at milepost 70.75 (STA 668+60). Test section is
also 1320 feet long, starting at milepost 70.75 (STA 668+60) and ending at milepost 71.00 (STA
681+80). A one-inch diameter steel rod was placed at the beginning and end of the control and
test items approximately ten feet off the shoulder.
Western Transportation Institute Page 24
Stripped Asphalt Final Report Test Sites
Milepost
1320 ft 1320 ft
test sectioncontrol section
70.50 71.00
EB
Interstate 90
70.75
Milepost
1320 ft 1320 ft
test sectioncontrol section
70.50 71.00
EB
Interstate 90
70.75
Figure 6. Layout of the Test Site at Tarkio-East
In addition to marking the test sites with steel rods, masonry nails were placed in the
roadway at the beginning and end of each experimental section. The nails were placed
approximately two feet from the outside shoulder stripe, towards the edge of the paved surface.
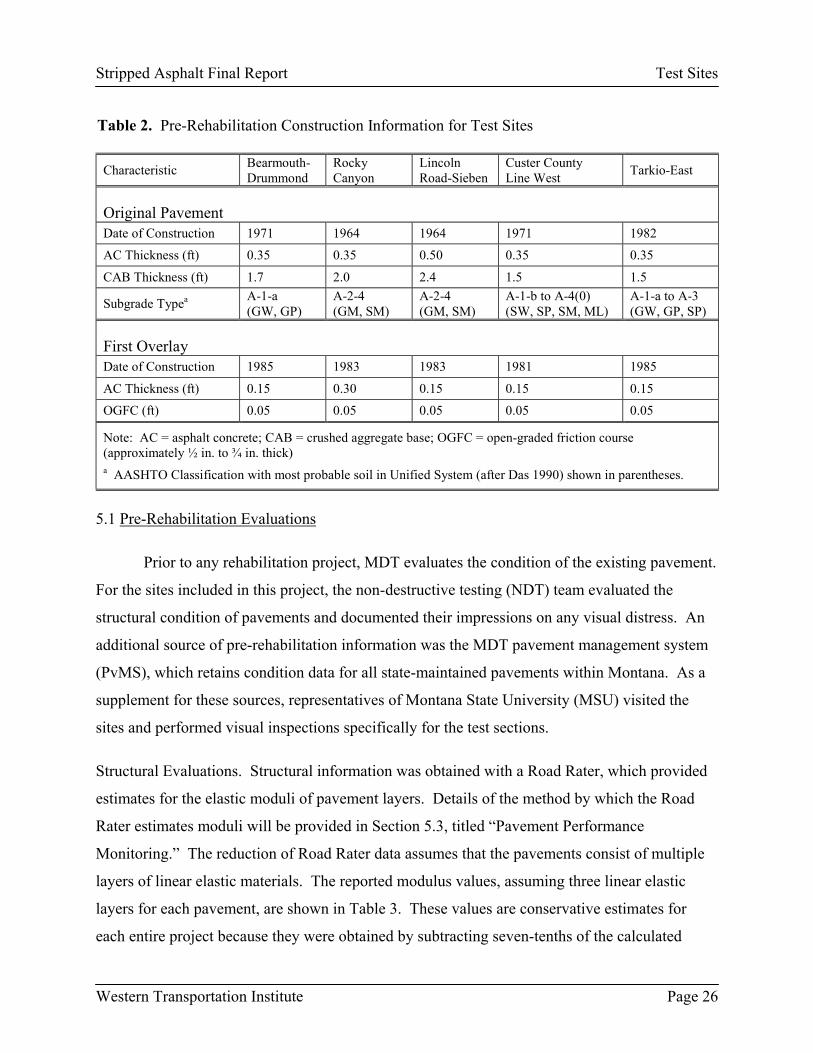
Information related to previous construction for the test sites is summarized in Table 2.
The original pavement structures were built between 1964 and 1982. Each original structure
included two layers over the subgrade: a crushed aggregate base course and an asphalt concrete
surface course. All of the reported subgrade types could be expected to provide adequate
pavement foundations, without potential for volume changes. Each site had received a single
overlay since original construction. The overlays were placed between 1981 and 1985 and each
was topped with an open-graded friction course.
Western Transportation Institute Page 25
Stripped Asphalt Final Report Test Sites
Table 2. Pre-Rehabilitation Construction Information for Test Sites Characteristic Bearmouth-
Drummond Rocky Canyon
Lincoln Road-Sieben
Custer County Line West Tarkio-East
Original Pavement Date of Construction 1971 1964 1964 1971 1982
AC Thickness (ft) 0.35 0.35 0.50 0.35 0.35
CAB Thickness (ft) 1.7 2.0 2.4 1.5 1.5
Subgrade Typea A-1-a (GW, GP)
A-2-4 (GM, SM)
A-2-4 (GM, SM)
A-1-b to A-4(0) (SW, SP, SM, ML)
A-1-a to A-3 (GW, GP, SP)
First Overlay Date of Construction 1985 1983 1983 1981 1985
AC Thickness (ft) 0.15 0.30 0.15 0.15 0.15
OGFC (ft) 0.05 0.05 0.05 0.05 0.05
Note: AC = asphalt concrete; CAB = crushed aggregate base; OGFC = open-graded friction course (approximately ½ in. to ¾ in. thick) a AASHTO Classification with most probable soil in Unified System (after Das 1990) shown in parentheses.
5.1 Pre-Rehabilitation Evaluations
Prior to any rehabilitation project, MDT evaluates the condition of the existing pavement.
For the sites included in this project, the non-destructive testing (NDT) team evaluated the
structural condition of pavements and documented their impressions on any visual distress. An
additional source of pre-rehabilitation information was the MDT pavement management system
(PvMS), which retains condition data for all state-maintained pavements within Montana. As a
supplement for these sources, representatives of Montana State University (MSU) visited the
sites and performed visual inspections specifically for the test sections.
Structural Evaluations. Structural information was obtained with a Road Rater, which provided
estimates for the elastic moduli of pavement layers. Details of the method by which the Road
Rater estimates moduli will be provided in Section 5.3, titled �Pavement Performance
Monitoring.� The reduction of Road Rater data assumes that the pavements consist of multiple
layers of linear elastic materials. The reported modulus values, assuming three linear elastic
layers for each pavement, are shown in Table 3. These values are conservative estimates for
each entire project because they were obtained by subtracting seven-tenths of the calculated
Western Transportation Institute Page 26
Stripped Asphalt Final Report Test Sites
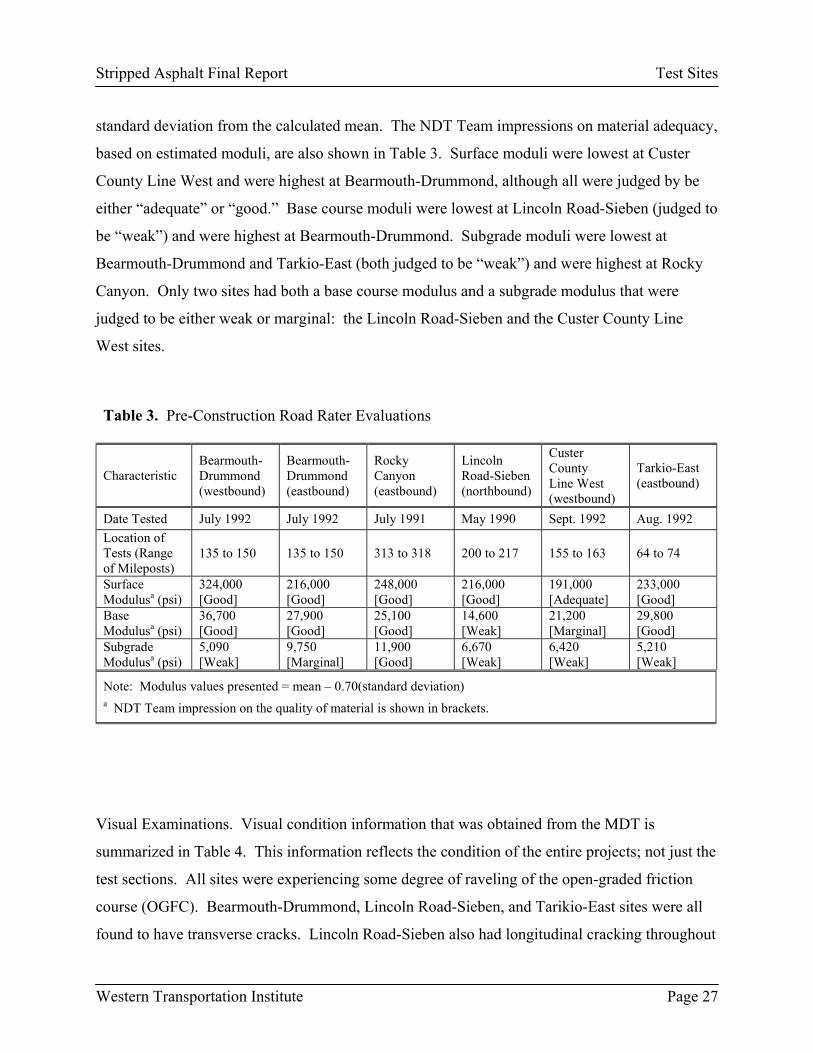
standard deviation from the calculated mean. The NDT Team impressions on material adequacy,
based on estimated moduli, are also shown in Table 3. Surface moduli were lowest at Custer
County Line West and were highest at Bearmouth-Drummond, although all were judged by be
either �adequate� or �good.� Base course moduli were lowest at Lincoln Road-Sieben (judged to
be �weak�) and were highest at Bearmouth-Drummond. Subgrade moduli were lowest at
Bearmouth-Drummond and Tarkio-East (both judged to be �weak�) and were highest at Rocky
Canyon. Only two sites had both a base course modulus and a subgrade modulus that were
judged to be either weak or marginal: the Lincoln Road-Sieben and the Custer County Line
West sites.
Table 3. Pre-Construction Road Rater Evaluations
Characteristic Bearmouth-Drummond (westbound)
Bearmouth-Drummond (eastbound)
Rocky Canyon (eastbound)
Lincoln Road-Sieben (northbound)
Custer County Line West (westbound)
Tarkio-East (eastbound)
Date Tested July 1992 July 1992 July 1991 May 1990 Sept. 1992 Aug. 1992 Location of Tests (Range of Mileposts)
135 to 150 135 to 150 313 to 318 200 to 217 155 to 163 64 to 74
Surface Modulusa (psi)
324,000 [Good]
216,000 [Good]
248,000 [Good]
216,000 [Good]
191,000 [Adequate]
233,000 [Good]
Base Modulusa (psi)
36,700 [Good]
27,900 [Good]
25,100 [Good]
14,600 [Weak]
21,200 [Marginal]
29,800 [Good]
Subgrade Modulusa (psi)
5,090 [Weak]
9,750 [Marginal]
11,900 [Good]
6,670 [Weak]
6,420 [Weak]
5,210 [Weak]
Note: Modulus values presented = mean � 0.70(standard deviation) a NDT Team impression on the quality of material is shown in brackets.
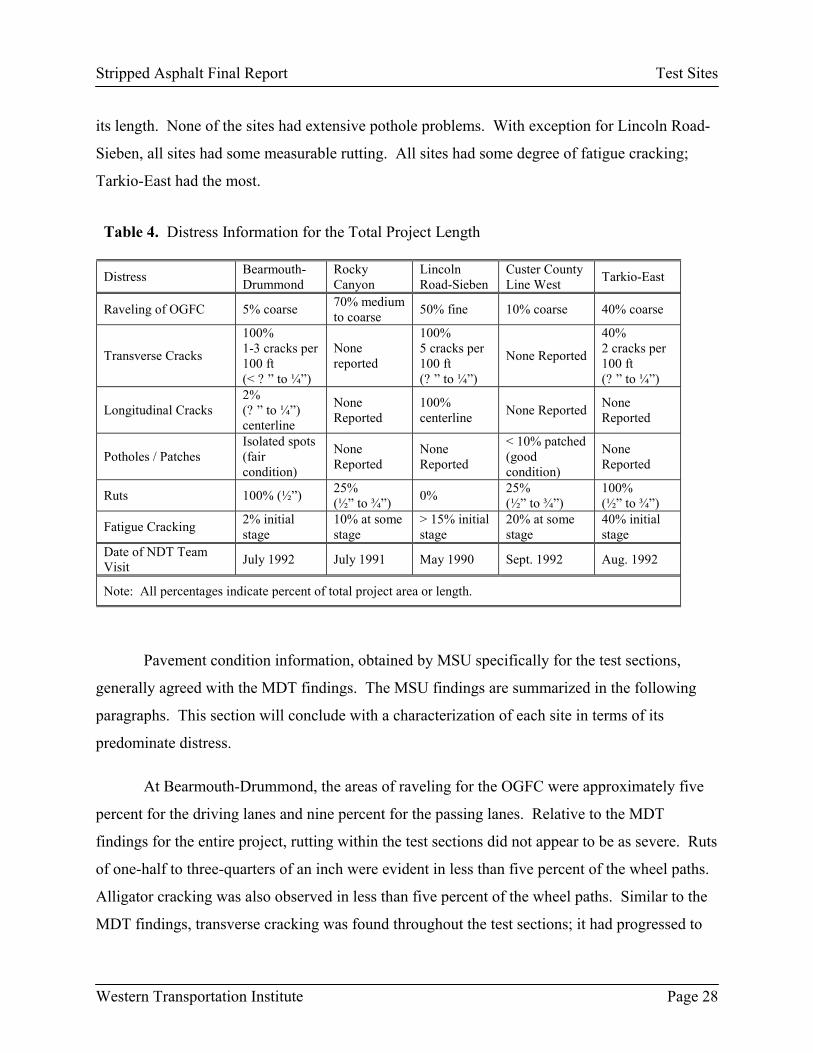
Visual Examinations. Visual condition information that was obtained from the MDT is
summarized in Table 4. This information reflects the condition of the entire projects; not just the
test sections. All sites were experiencing some degree of raveling of the open-graded friction
course (OGFC). Bearmouth-Drummond, Lincoln Road-Sieben, and Tarikio-East sites were all
found to have transverse cracks. Lincoln Road-Sieben also had longitudinal cracking throughout
Western Transportation Institute Page 27
Stripped Asphalt Final Report Test Sites
its length. None of the sites had extensive pothole problems. With exception for Lincoln Road-
Sieben, all sites had some measurable rutting. All sites had some degree of fatigue cracking;
Tarkio-East had the most.
Table 4. Distress Information for the Total Project Length Distress Bearmouth-
Drummond Rocky Canyon
Lincoln Road-Sieben
Custer County Line West Tarkio-East
Raveling of OGFC 5% coarse 70% medium to coarse 50% fine 10% coarse 40% coarse
Transverse Cracks
100% 1-3 cracks per 100 ft (< ? � to ¼�)
None reported
100% 5 cracks per 100 ft (? � to ¼�)
None Reported
40% 2 cracks per 100 ft (? � to ¼�)
Longitudinal Cracks 2% (? � to ¼�) centerline
None Reported
100% centerline None Reported None
Reported
Potholes / Patches Isolated spots (fair condition)
None Reported
None Reported
< 10% patched (good condition)
None Reported
Ruts 100% (½�) 25% (½� to ¾�) 0% 25%
(½� to ¾�) 100% (½� to ¾�)
Fatigue Cracking 2% initial stage
10% at some stage
> 15% initial stage
20% at some stage
40% initial stage
Date of NDT Team Visit July 1992 July 1991 May 1990 Sept. 1992 Aug. 1992
Note: All percentages indicate percent of total project area or length.
Pavement condition information, obtained by MSU specifically for the test sections,
generally agreed with the MDT findings. The MSU findings are summarized in the following
paragraphs. This section will conclude with a characterization of each site in terms of its
predominate distress.
At Bearmouth-Drummond, the areas of raveling for the OGFC were approximately five
percent for the driving lanes and nine percent for the passing lanes. Relative to the MDT
findings for the entire project, rutting within the test sections did not appear to be as severe. Ruts
of one-half to three-quarters of an inch were evident in less than five percent of the wheel paths.
Alligator cracking was also observed in less than five percent of the wheel paths. Similar to the
MDT findings, transverse cracking was found throughout the test sections; it had progressed to
Western Transportation Institute Page 28

Stripped Asphalt Final Report Test Sites
moderate severity in many cases. Longitudinal cracks were also found within the test sections,
generally of low severity.
By 1995 when MSU performed their visual condition survey, the alligator cracking at
Rocky Canyon had worsened from the time of the MDT inspection in 1991. Alligator cracking,
or at least longitudinal cracks in the wheelpaths were observed along most of the test site.
Transverse cracks and a longitudinal crack between paving lanes were observed, although they
were generally low-severity.
A description of the test site at Lincoln Road-Sieben would be similar to that provided by
MDT for the entire project. Some slight modifications follow. The longitudinal cracks at the
centerline were severe for approximately a third of the project length. Parallel cracks had formed
and raveling had become severe within one foot of the longitudinal crack. Low-severity rutting
was also noted to have occurred in the driving lane.
Although cracks were not mentioned at the time of the NDT Team visit to Custer County
Line West, many transverse cracks had formed within the test site by the year 1995. Moderate-
to high-severity cracks were observed on the order of three per 100 feet of pavement length.
Isolated potholes, both unimproved and patched, were found in the driving lane. The potholes
accounted for less than ten percent of the pavement area. Low-severity rutting was also noted to
have occurred in the driving lane.
The condition of the original pavement at the Tarkio East test site was generally poor.
Similar to the NDT Team report, raveling and alligator cracking were found to be extensive.
Ruts were also found in both the driving and passing lanes. Although MDT had found transverse
cracks along the project, they seemed to be nearly absent within the test sections. However, the
test site did have longitudinal cracking between paving lanes throughout its length. The
longitudinal cracks had promoted additional deterioration in the form of small parallel cracks and
intermittent potholes.
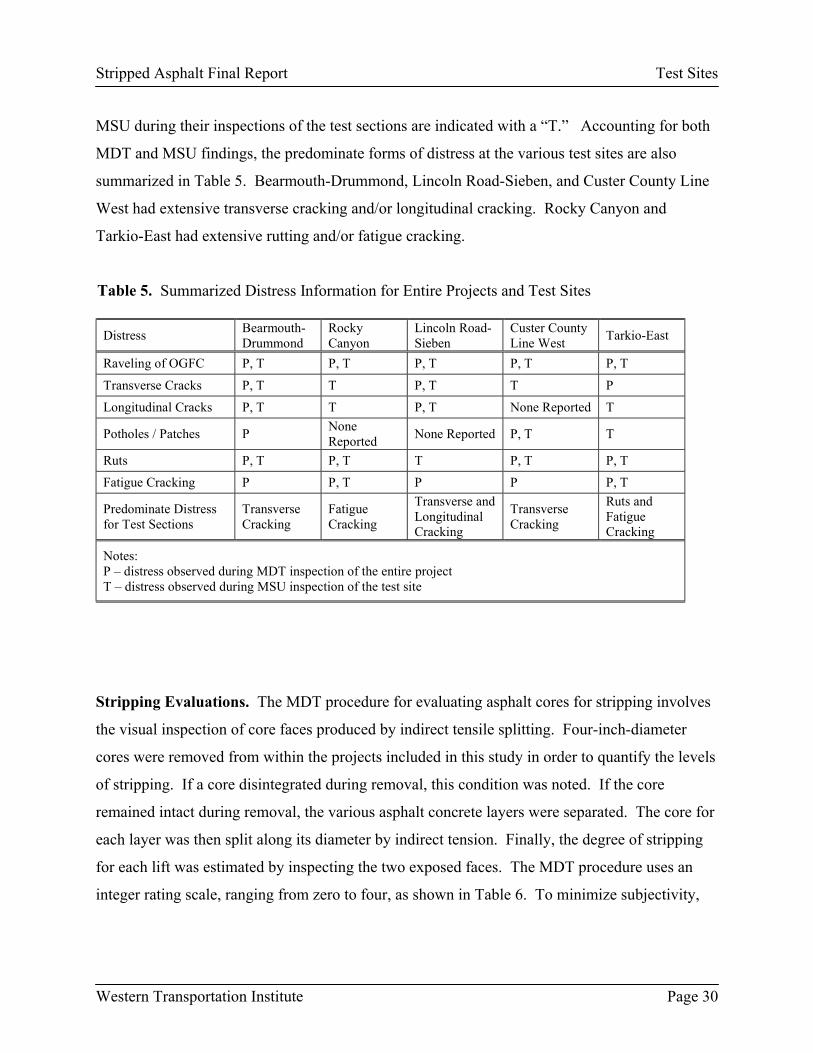
Distress types found at the various sites are summarized in Table 5. Those found by
MDT during their inspections of the entire projects are indicated with a �P.� Those found by
Western Transportation Institute Page 29
Stripped Asphalt Final Report Test Sites
MSU during their inspections of the test sections are indicated with a �T.� Accounting for both
MDT and MSU findings, the predominate forms of distress at the various test sites are also
summarized in Table 5. Bearmouth-Drummond, Lincoln Road-Sieben, and Custer County Line
West had extensive transverse cracking and/or longitudinal cracking. Rocky Canyon and
Tarkio-East had extensive rutting and/or fatigue cracking.
Table 5. Summarized Distress Information for Entire Projects and Test Sites Distress Bearmouth-
Drummond Rocky Canyon
Lincoln Road-Sieben
Custer County Line West Tarkio-East
Raveling of OGFC P, T P, T P, T P, T P, T
Transverse Cracks P, T T P, T T P
Longitudinal Cracks P, T T P, T None Reported T
Potholes / Patches P None Reported None Reported P, T T
Ruts P, T P, T T P, T P, T
Fatigue Cracking P P, T P P P, T
Predominate Distress for Test Sections
Transverse Cracking
Fatigue Cracking
Transverse and Longitudinal Cracking
Transverse Cracking
Ruts and Fatigue Cracking
Notes: P � distress observed during MDT inspection of the entire project T � distress observed during MSU inspection of the test site
Stripping Evaluations. The MDT procedure for evaluating asphalt cores for stripping involves
the visual inspection of core faces produced by indirect tensile splitting. Four-inch-diameter
cores were removed from within the projects included in this study in order to quantify the levels
of stripping. If a core disintegrated during removal, this condition was noted. If the core
remained intact during removal, the various asphalt concrete layers were separated. The core for
each layer was then split along its diameter by indirect tension. Finally, the degree of stripping
for each lift was estimated by inspecting the two exposed faces. The MDT procedure uses an
integer rating scale, ranging from zero to four, as shown in Table 6. To minimize subjectivity,
Western Transportation Institute Page 30

Stripped Asphalt Final Report Test Sites
MDT maintains a reference booklet of color photographs showing split core faces, along with
their designated ratings.
Table 6. MDT Rating Scheme for Stripping Damage in Cores Core Rating Description
0 (no core) Asphalt is mostly gone from all sizes of aggregate or the core has disintegrated.
1 (severely stripped) Most of the aggregate is so clean, the colors of the rock are decipherable.
2 (stripping) In addition to moisture damage, some large aggregate is not coated.
3 (moisture damaged) Loss of sheen; dull appearance; some smaller aggregate (minus No. 60 sieve) is uncoated.
4 (good core) The face is shiny and black. All aggregate particles are coated.
Results from the inspections for stripping damage are summarized in Table 7. According
to the MDT procedures, all five sites were experiencing severe stripping damage. Generally, the
overlays received ratings that were similar to or worse than those for the original asphalt
concrete surface layer. There were not substantial differences between the driving lanes and the
passing lanes. In terms of severity of stripping, the sites grouped as follows: Custer County
Line West and Tarkio-East had the worst ratings, Rocky Canyon and Lincoln Road-Sieben had
intermediate ratings, and Bearmouth-Drummond had the least severe ratings.
Western Transportation Institute Page 31
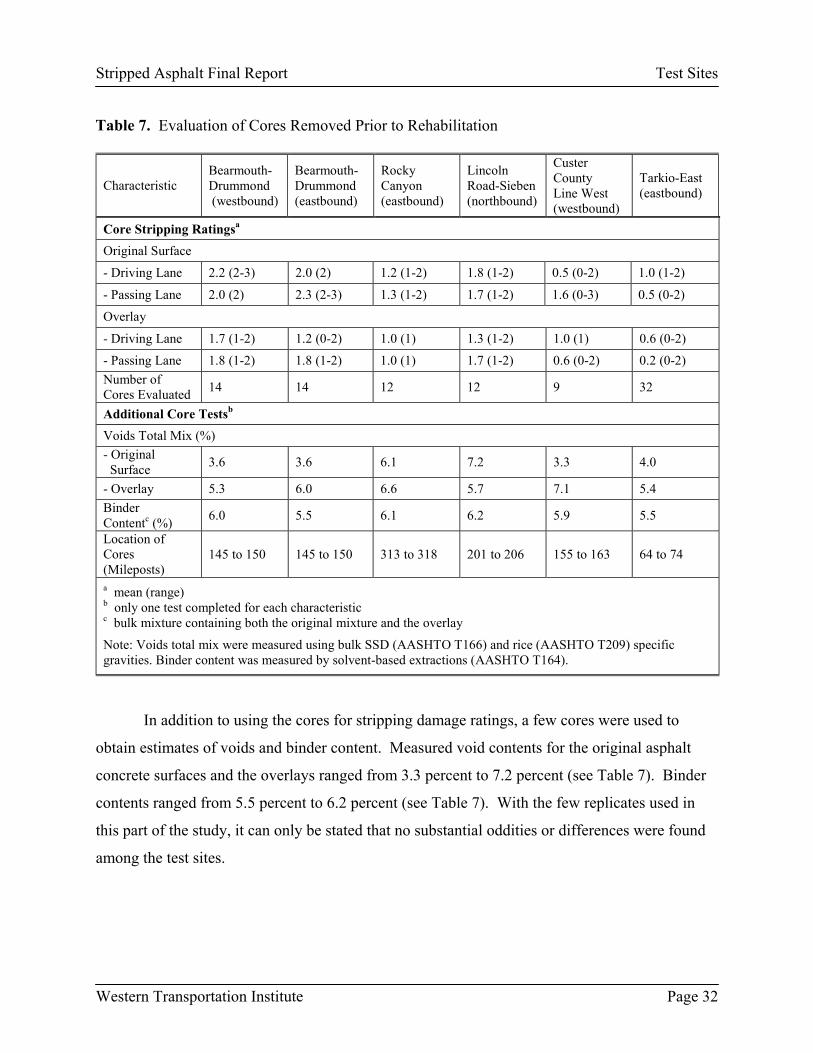
Stripped Asphalt Final Report Test Sites
Table 7. Evaluation of Cores Removed Prior to Rehabilitation
Characteristic Bearmouth-Drummond (westbound)
Bearmouth-Drummond (eastbound)
Rocky Canyon (eastbound)
Lincoln Road-Sieben (northbound)
Custer County Line West (westbound)
Tarkio-East (eastbound)
Core Stripping Ratingsa Original Surface
- Driving Lane 2.2 (2-3) 2.0 (2) 1.2 (1-2) 1.8 (1-2) 0.5 (0-2) 1.0 (1-2)
- Passing Lane 2.0 (2) 2.3 (2-3) 1.3 (1-2) 1.7 (1-2) 1.6 (0-3) 0.5 (0-2)
Overlay
- Driving Lane 1.7 (1-2) 1.2 (0-2) 1.0 (1) 1.3 (1-2) 1.0 (1) 0.6 (0-2)
- Passing Lane 1.8 (1-2) 1.8 (1-2) 1.0 (1) 1.7 (1-2) 0.6 (0-2) 0.2 (0-2) Number of Cores Evaluated 14 14 12 12 9 32
Additional Core Testsb Voids Total Mix (%) - Original Surface 3.6 3.6 6.1 7.2 3.3 4.0
- Overlay 5.3 6.0 6.6 5.7 7.1 5.4 Binder Contentc (%) 6.0 5.5 6.1 6.2 5.9 5.5
Location of Cores (Mileposts)
145 to 150 145 to 150 313 to 318 201 to 206 155 to 163 64 to 74
a mean (range) b only one test completed for each characteristic c bulk mixture containing both the original mixture and the overlay
Note: Voids total mix were measured using bulk SSD (AASHTO T166) and rice (AASHTO T209) specific gravities. Binder content was measured by solvent-based extractions (AASHTO T164).
In addition to using the cores for stripping damage ratings, a few cores were used to
obtain estimates of voids and binder content. Measured void contents for the original asphalt
concrete surfaces and the overlays ranged from 3.3 percent to 7.2 percent (see Table 7). Binder
contents ranged from 5.5 percent to 6.2 percent (see Table 7). With the few replicates used in
this part of the study, it can only be stated that no substantial oddities or differences were found
among the test sites.
Western Transportation Institute Page 32
Stripped Asphalt Final Report Test Sites
5.2 Rehabilitation Scenarios
At each site, rehabilitation construction began with milling operations. In the control
sections, milling depths ranged from two and a half to five inches, as shown in Table 8. Milling
was deep enough to remove the existing OGFC and the existing overlay. With exception for the
Tarkio-East site, milling in the control section was deep enough to penetrate into the asphalt
concrete that was placed as part of the original pavement. In the test sections, milling was only
used to remove the OGFC.
Western Transportation Institute Page 33

Stripped Asphalt Final Report Test Sites
Table 8. Details of Rehabilitation Construction
Distress Bearmouth-Drummond Rocky Canyon Lincoln Road-Sieben
Custer County Line West Tarkio-East
Control Section Cold Mill,a ft (in.) 0.30 (3.5) 0.40 (5.0) 0.25 (3.0) 0.25 (3.0) 0.20 (2.5) Improved Existing Materialb 0.80 ft CTPB
New Material (First Lift)
0.15 ft PMS
(hot recycle) 0.15 ft PMS
(hot recycle) 0.25 ft PMS 0.15 ft PMS (hot recycle)
New Material (Top Lift)
0.15 ft PMS (polymer-mod.)
0.40 ft PMS (polymer-mod.) 0.15 ft PMS
(polymer-mod.) 0.40 ft PMS (polymer-mod.)
0.20 ft PMS (polymer-mod.)
Surface Treatmentc Seal & Cover Seal & Cover Seal & Cover Seal & Cover Seal & Cover Change in Pavement Thickness, ft (in.) 0.00 (0.0) 0.00 (0.0) +0.05 (0.5) +0.40 (5.0) +0.15 (2.0)
Test Section Cold Mill,d ft (in.) 0.05 (0.5) 0.05 (0.5) 0.05 (0.5) 0.05 (0.5) 0.05 (0.5)
Overlay 0.15 ft PMS (polymer-mod.)
0.30 ft PMS (polymer-mod.)
0.15 ft PMS (polymer-mod.)
0.40 ft PMS (polymer-mod.)
0.20 ft PMS (polymer-mod.)
Surface Treatmentc Seal & Cover Seal & Cover Seal & Cover Seal & Cover Seal & Cover Change in Pavement Thickness, ft (in.) +0.10 (1.0) +0.25 (3.0) +0.10 (1.0) +0.35 (4.0) +0.15 (2.0)
PMS � plant-mix surface CTPB � cement-treated pulverized base
a deep enough to penetrate past the existing overlay and into the original plant mix surface b cement-stabilized the remaining plant-mix surface and part of the gravel base c Grade 4A aggregate d to remove the open-graded friction course Note: All asphalt concrete mixtures are Grade D, with exception for the surface layer at Custer County Line West, which is Grade S. The design of all asphalt concrete mixtures included the Modified Lottman Test (AASHTO T283) to ensure stripping resistance.
Rocky Canyon was the only site that involved stabilization of material prior to the
placement of the overlay. After milling the control section at Rocky Canyon, nine and a half
inches of the remaining material was pulverized and stabilized with portland cement. This one
and a half inches of material included about three and a half inches of asphalt concrete and about
six inches of underlying aggregate base. The test section did not involve any stabilization.
Western Transportation Institute Page 34

Stripped Asphalt Final Report Test Sites
Overlay thicknesses in control sections ranged from 3.5 to 8 inches, as shown in Table 8.
Overlay thicknesses in test sections ranged from 2 to 5 inches (Table 8). All top lifts of asphalt
concrete were modified with polymers. The Bearmouth-Drummond, Lincoln Road-Sieben, and
Tarkio-East projects all used hot recycling for the lower overlay lifts in the control sections. The
top lift at Lincoln Road-Sieben was the only case where polymer modification was accompanied
by hot recycling. As an added note, the lower lift at Lincoln Road-Sieben contained a relatively
high proportion of recycled mix, equal to 34 percent. All asphalt concrete mixtures were MDT
Grade D with exception for the top lift at Custer County Line West, which was an MDT Grade S.
This Grade S lift extended across both the control item and the test item. All test and control
sections were topped with a chip seal (i.e. �seal and cover�) with three eighths of an inch
maximum-size aggregate.
The control section at Bearmouth-Drummond did not involve an increase in pavement
thickness above subgrade, relative to the original pavement structure (Figure 7). The MDT
design personnel did not feel an increase in structural capacity was necessary at this site. The
final thickness of the control section at Rocky Canyon was the same as the original structure, but
the structural capacity was increased through stabilization (Figure 8). The control sections at
Lincoln Road-Sieben, Custer County Line West, and Tarkio-East involved increases in thickness
above subgrade of 0.5, 5, and 2 inches, respectively (see Table 8 and Figures 9, 10, and 11).
The structural capacities of the test sections at all sites were increased relative to the
original pavement structures. Milling was only deep enough to remove the OGFC, so all overlay
lift thicknesses were greater than the depth of removed material. Increases in total thickness
above subgrade for the test sections ranged from 1 to 4 inches, as shown in Table 8 and Figures 7
through 11.
In conclusion, stripped asphalt should last longer because they have more structural
strength. Therefore, we are not comparing the same structural number between the control and
test sections.
Western Transportation Institute Page 35
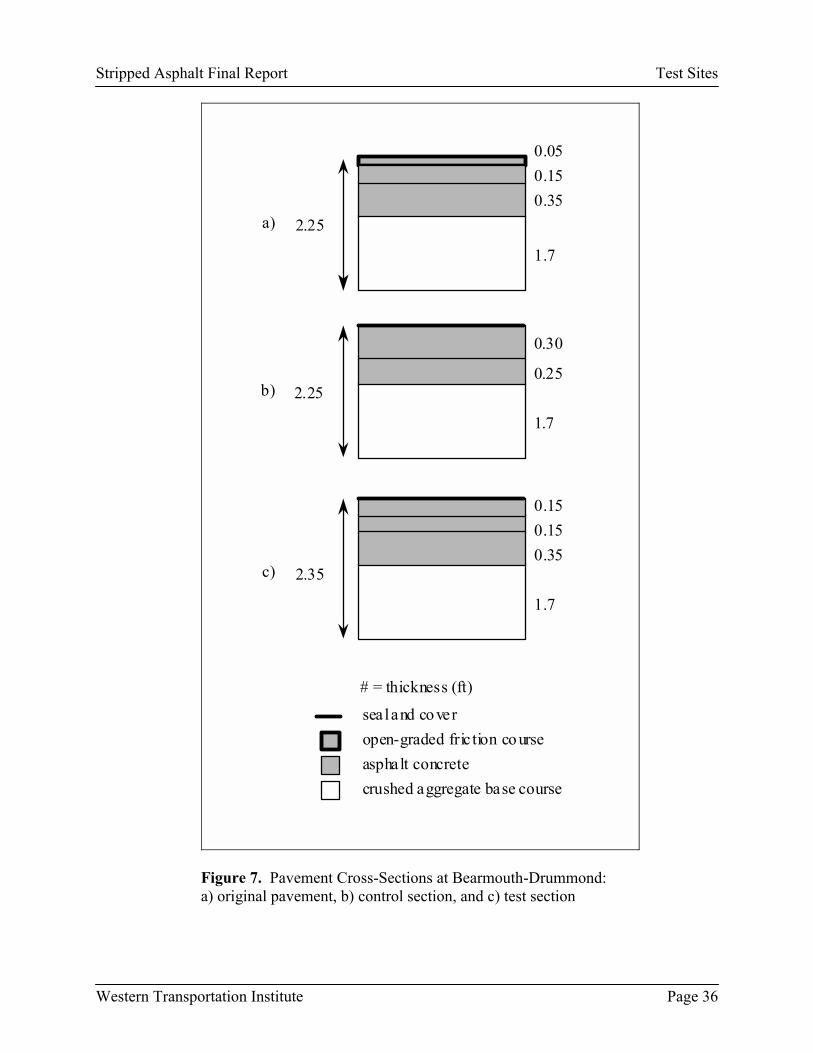
Stripped Asphalt Final Report Test Sites
Western Transportation Institute Page 36
1.7
0.350.150.05
1.7
1.7
0.25
0.350.150.15
# = thickness (ft)
2.25
0.30
2.25
2.35
a)
b)
c)
open-graded fric tion courseseal and cover
asphalt concretecrushed aggregate base course
Figure 7. Pavement Cross-Sections at Bearmouth-Drummond: a) original pavement, b) control section, and c) test section
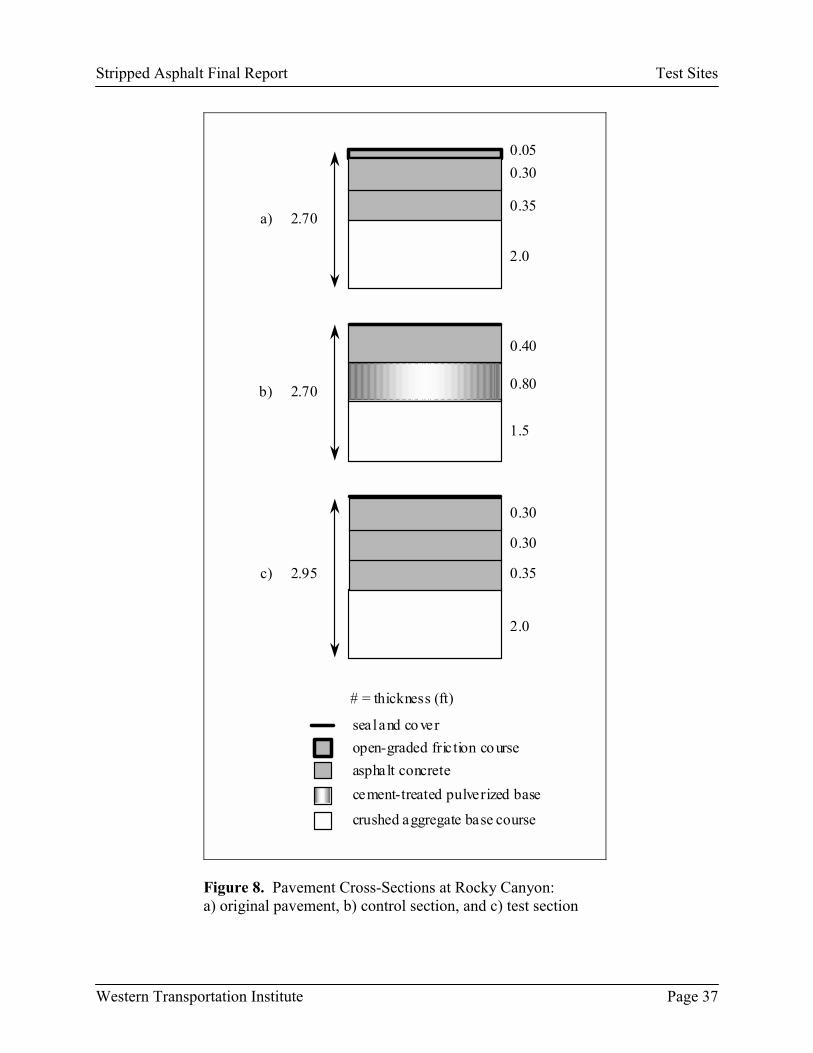
Stripped Asphalt Final Report Test Sites
Western Transportation Institute Page 37
2.0
0.35
0.300.05
1.5
2.0
0.80
0.35
0.30
0.30
2.70
0.40
2.70
2.95
a)
b)
c)
# = thickness (ft)
open-graded fric tion courseseal and co ver
asphalt concrete
crushed aggregate base course
cement-treated pulverized base
Figure 8. Pavement Cross-Sections at Rocky Canyon: a) original pavement, b) control section, and c) test section

Stripped Asphalt Final Report Test Sites
Western Transportation Institute Page 38
2.40
0.50
0.150.05
2.40
2.40
0.45
0.500.150.15
3.10
0.30
3.15
3.20
a)
b)
c)
# = thickness (ft)
open-graded fric tion courseseal and cover
asphalt concretecrushed aggregate base course
Figure 9. Pavement Cross-Sections at Lincoln Road-Sieben: a) original pavement, b) control section, and c) test section
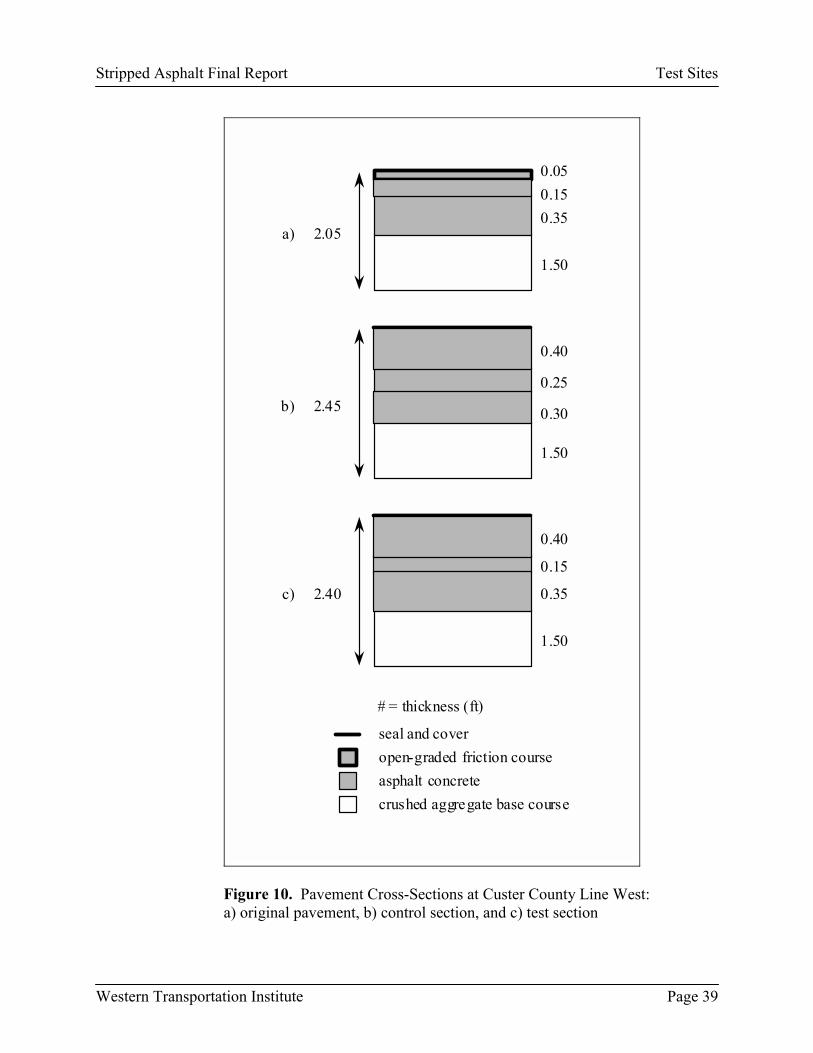
Stripped Asphalt Final Report Test Sites
Western Transportation Institute Page 39
1.50
0.350.150.05
1.50
1.50
0.30
0.35
0.15
0.40
2.05
0.40
2.45
2.40
a)
b)
c)
0.25
# = thickness (ft)
open-graded friction courseseal and cover
asphalt concretecrushed aggregate base course
Figure 10. Pavement Cross-Sections at Custer County Line West: a) original pavement, b) control section, and c) test section
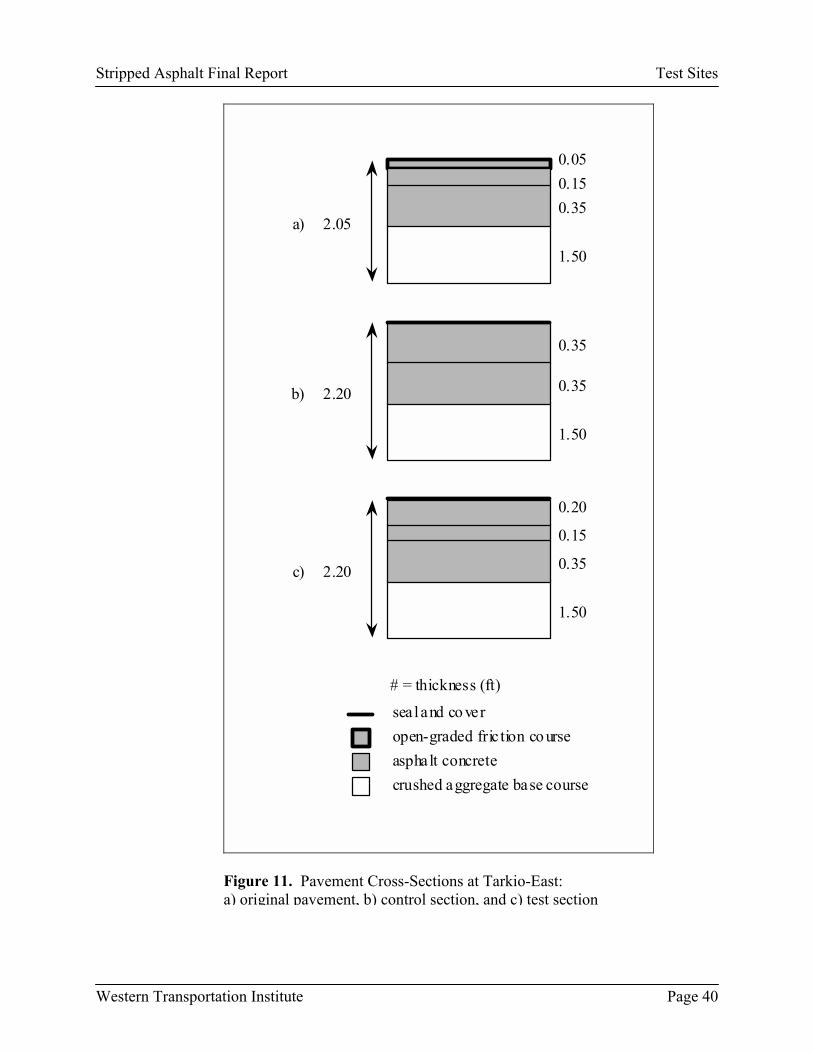
Stripped Asphalt Final Report Test Sites
Western Transportation Institute Page 40
1.50
0.350.150.05
1.50
1.50
0.35
0.35
0.15
0.20
2.05
2.20
2.20
a)
b)
c)
0.35
# = thickness (ft)
open-graded fric tion co urseseal and co ver
asphalt concretecrushed aggregate base course
Figure 11. Pavement Cross-Sections at Tarkio-East: a) original pavement, b) control section, and c) test section

Stripped Asphalt Final Report Test Sites
5.3 Pavement Performance Monitoring
The test sections at each site have been monitored annually for changes in structural
integrity, roughness, and distress. Structural integrity has been monitored with both a Road
Rater and a Jils falling-weight deflectometer (FWD). Roughness has been monitored with both a
South Dakota Profilometer and a Rainhart Profilograph. Distress monitoring has involved visual
inspections of the road surfaces.
Structural Integrity. The MDT recently transitioned from using a Road Rater to using an
FWD. Structural evaluations performed in 1997, or earlier, involved a Road Rater. Road Raters
apply a sinusoidal load to the pavement; frequency and peak load are controllable. Frequencies
of 12 to 15 Hz and a peak load of 4000 lb were used for the evaluations included in this study.
The FWD applies an impact load to the pavement; drop height is controllable, which affects the
acceleration of the mass at impact and subsequently, the force at impact. The drop heights used
in this study produced forces of approximately 5500, 8000, and 10000 lb. A 9000-lb �seating�
load preceded these forces. While the Road Rater was a trailer-type device, the Jils FWD used
for this experiment was mounted within the back of a truck.
Both Road Rater and FWD testing were performed every fifty feet within the
experimental sections. Most tests are performed in the outer wheelpath of the traveling lane.
Every fourth test, however, is performed in the outer wheelpath of the passing lane. Based on an
initial inspection of the collected data, differentiating tests by lane for the purpose of analyzing
results was not deemed necessary.
During Road Rater and FWD testing, the applied force and the pavement surface
deflections were measured. Surface deflections were measured at the following horizontal offset
distances from the load: 0, 8, 12, 18 (FWD only), 24, 36, and 48 inches. MDT retains peak
loads and peak deflections for analysis purposes. The peak deflections can be used to produce a
�deflection basin,� such as that shown in Figure 12. The deflection basin, in combination with
the known load and assumed layer thicknesses, can be used to estimate the elastic moduli of
pavement layers. This process is often referred to as �back-calculation� and usually involves the
Western Transportation Institute Page 41

Stripped Asphalt Final Report Test Sites
assumption that all layers are linear elastic. Modeling pavement layers as linear elastic materials
provides for an effective method of designing pavements and overlays.
Load
81218243648
offset from load (in.)
Center ofLoad Plate
deflection measurements
0
Figure 12. Deflection Basin Obtained During Road Rater and FWD Testing
Additional methods exist for using deflection basin data to characterize pavement
materials. For example, the geometric curvature of the deflection basin has been used to deduce
general pavement characteristics. Rohde (1990) summarized many techniques for characterizing
basin curvature, including the use of deflection ratios, where the deflections are measured at
different offset distances from the load. An additional useful pavement parameter is the overall
pavement response stiffness, which can be ascertained by simply dividing the applied load by the
deflection under the load (offset = 0 in.). The U.S. Army Corps of Engineers (USACE) refers to
this parameter as the pavement�s impulse stiffness modulus (ISM) and they use it to separate
airfield pavements into "features" of relatively uniform structural characteristics (USACE 2001).
Although these simplistic data analysis methods provide less information than the results
of back-calculation, they require no assumptions in terms of the number of layers or layer
thicknesses. Therefore, the simplistic analysis methods have advantages in cases when pavement
Western Transportation Institute Page 42

Stripped Asphalt Final Report Test Sites
layer thicknesses are either unkown or uncertain. In addition, when the primary concern for a
transportation agency is detecting changes in pavement properties over time (i.e. deterioration),
simplistic monitoring by either overall pavement stiffness or basin curvature is effective.
Roughness and Rut Depth. Roughness monitoring was performed with a South Dakota
Profilometer, which is an inertial profiler. The South Dakota Profilometer consists of a truck
equipped with accelerometers and lasers. Pavement roughness measurements are obtained at
speeds between 20 mph and 65 mph (typically at 60 mph). The accelerometers provide an
inertial reference and the lasers are used to measure the distance between the inertial reference
and the pavement surface.
Roughness was reported as International Roughness Index (IRI) values, which have units
of inches/mile (inches of vertical deviations per mile of road). As a pavement�s roughness
increases, its IRI increases. MDT ranks the conditions of paved surfaces in terms of IRI as
shown in Table 9.
Table 9. MDT Ranking of Pavement Roughness
Condition of Paved Surface International Roughness Index (in./mi)
Excellent < 16
Good 16 to 75
Fair 76 to 150
Poor 151 to 225
Very Poor > 225
The South Dakota Profilometer uses two lasers for measuring pavement surface
deviations in order to calculate IRI. These two lasers are attached so that they project into the
two wheelpaths. The South Dakota Profilometer has a third laser on the front bumper in order to
permit calculations of rut depth. The third laser is attached so that it is aimed at the middle of the
Western Transportation Institute Page 43

Stripped Asphalt Final Report Test Sites
lane, centered between the two wheelpaths. As the vehicle travels along the road, twenty to
thirty measurements are obtained by each laser per one-foot length of pavement. The differences
between the lengths measured by the lasers are used to estimate an average rut depth:
2)()( 2321 hhhh
depthrutaverage−+−
=
where
h1 and h3 = distances to the pavement surface in the wheelpaths and h2 = distance to the pavement surface at mid-lane
During the last two years of roughness and rut depth monitoring (1999 and 2000), the
Rainhart Profilograph was used to measure rut depth because it had demonstrated the ability to
supply accurate and reliable data during other recent MDT research studies. The Rainhart
Profilograph differs fundamentally from the South Dakota Profilometer because it measures ruts
by purely mechanical means. This profilograph consists of a rigid beam, which is supported
above the pavement surface by rigid legs. Typically, the beam is positioned transverse to a
roadway lane (Figure 13). Upon the beam rests a barrel to which a pen and lined graph paper are
attached. As the barrel is moved across the beam, a wheel that rides on the pavement surface
transcribes changes in elevation on the paper (Figure 14). The profilograph is placed at discrete
locations along the pavement and the surface elevation measurement wheel is moved from one
side of a lane to the other. For this research, the wheel was first moved from the shoulder to the
centerline. The marking pen was then moved slightly and a second profile of the same station
was made from the centerline to the shoulder. Scaling ratios were set so that surface roughness
was drawn with a 1:12 ratio (paper:pavement) horizontally and a 1:1 ratio vertically.
Western Transportation Institute Page 44

Stripped Asphalt Final Report Test Sites
Western Transportation Institute Page 45
Figure 13. Rainhart Profilograph

Stripped Asphalt Final Report Test Sites
Figure 14. Moving the Rut-Transcribing Mechanism Across the Rainhart Profilograph
Station locations were chosen randomly for each site. At each site, the station pattern
was identical for both the control section and the test section. An analysis of the previous work
with the profilograph indicated that a minimum of four stations should be investigated for each
experimental section. For four of the five test sites in this study (Custer County, Lincoln Road,
Rocky Canyon, and Tarkio), ten stations were chosen for each of the test and control sections.
Due to the shorter experimental section lengths at Bearmouth-Drummond, five stations were
chosen for each of the test and control sections.
Visual Distress Survey. Visual examinations and the methods for recording distress generally
followed the guidelines established by the Strategic Highway Research Program (SHRP 1993).
Western Transportation Institute Page 46
Stripped Asphalt Final Report Test Sites
Some modifications were implemented to meet the specific needs of this study. For example,
units of measure have been adjusted in some cases and rutting was not measured during the
initial visual inspections because the South Dakota Profilometer provided estimates of rut depth.
The final two visual inspections have collected rutting data with the Rainhart Prophilograph.
The types of distress that were included in the examinations performed for this study are shown
in Table 10.
Western Transportation Institute Page 47
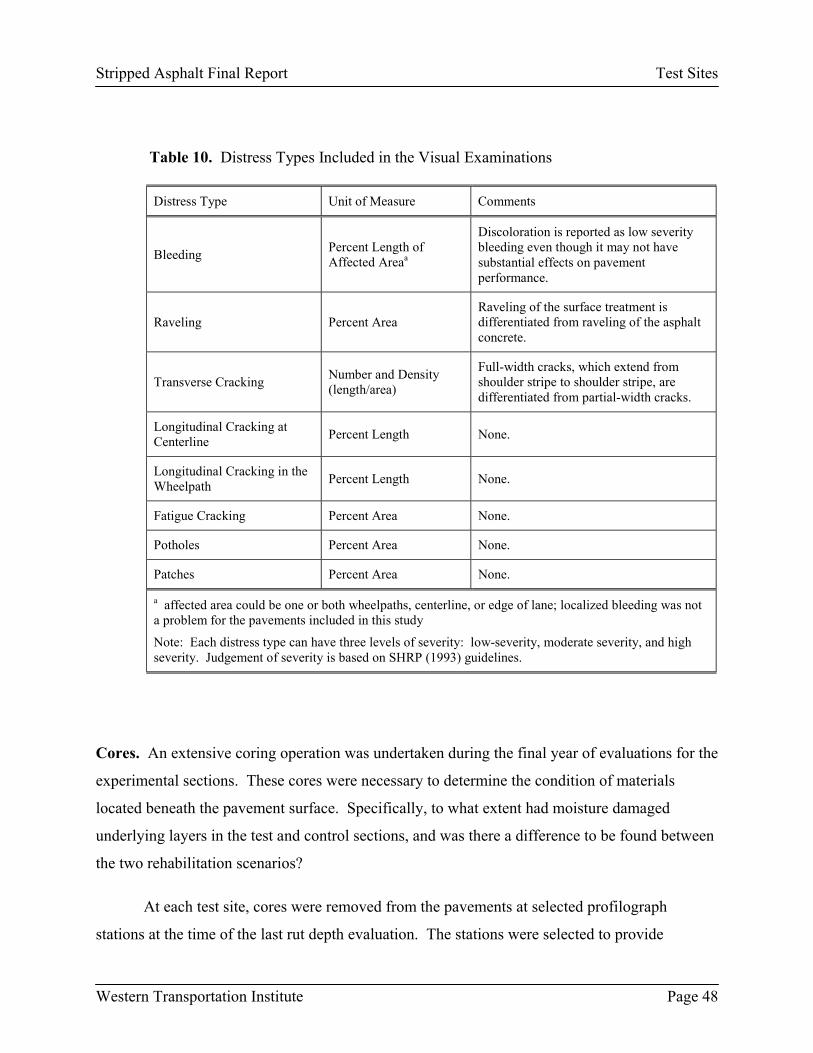
Stripped Asphalt Final Report Test Sites
Table 10. Distress Types Included in the Visual Examinations
Distress Type Unit of Measure Comments
Bleeding Percent Length of Affected Areaa
Discoloration is reported as low severity bleeding even though it may not have substantial effects on pavement performance.
Raveling Percent Area Raveling of the surface treatment is differentiated from raveling of the asphalt concrete.
Transverse Cracking Number and Density (length/area)
Full-width cracks, which extend from shoulder stripe to shoulder stripe, are differentiated from partial-width cracks.
Longitudinal Cracking at Centerline Percent Length None.
Longitudinal Cracking in the Wheelpath Percent Length None.
Fatigue Cracking Percent Area None.
Potholes Percent Area None.
Patches Percent Area None.
a affected area could be one or both wheelpaths, centerline, or edge of lane; localized bleeding was not a problem for the pavements included in this study
Note: Each distress type can have three levels of severity: low-severity, moderate severity, and high severity. Judgement of severity is based on SHRP (1993) guidelines.
Cores. An extensive coring operation was undertaken during the final year of evaluations for the
experimental sections. These cores were necessary to determine the condition of materials
located beneath the pavement surface. Specifically, to what extent had moisture damaged
underlying layers in the test and control sections, and was there a difference to be found between
the two rehabilitation scenarios?
At each test site, cores were removed from the pavements at selected profilograph
stations at the time of the last rut depth evaluation. The stations were selected to provide
Western Transportation Institute Page 48
Stripped Asphalt Final Report Test Sites
representation throughout each experimental section. Two stations were selected for each of the
control and test sections at Bearmouth-Drummond. Three or four stations were selected for each
of the control and test sections at the other test sites. At each of these stations three cores were
removed: one from the outside wheel path of the traveling lane, one from between wheel paths
in the traveling lane, and one from the outside wheel path of the passing lane. The condition of
each core was noted as it was removed. Each core was immediately marked for its respective
location, including site name, station number, and transverse position on roadway.
Cores were then transported back to the asphalt lab at Montana State University for
further analysis. This analysis consisted of measuring the cores for overall length, measuring the
thickness of each of the discernable different layers of bound materials, and performing a
stripping analysis consistent with Montana Method MT 331.
Western Transportation Institute Page 49
Stripped Asphalt Final Report Pavement Performance
6. Pavement Performance
Pavement evaluations at the test sites were performed annually for three to five years. As
previously stated, evaluations consisted of visual inspections consistent with SHRP methods and
standards, FWD or Road Rater evaluations, collection of IRI data, and for the final two years, the
collection of Rainhart profiles.
6.1 Structural Condition
Although pavement layer moduli were presented in interim reports for this project, they
were eliminated from the final project analyses. The primary reason for elimination is that more
simplistic analysis parameters (i.e. overall pavement response stiffness and basin curvature)
proved to be equally as effective for detecting changes in pavement properties over time.
Two types of NDT test parameters were selected for presentation in this final report:
pavement stiffness, represented as ISM, and basin curvature, represented as deflection ratios.
Two deflection ratios were selected: D1/D2 and D1/D3, where D1 is deflection at the center of
the load plate, D2 is deflection at 8 inches (0.20 m) offset, and D3 is deflection at 12 inches (0.30
m) offset. An increase in either of these curvature parameters would indicate a relative
weakening of layers near the pavement surface. ISM and basin curvature data are summarized in
Appendix B.
Comparisons between Road Rater data and FWD data verified that a fundamental
difference exists between the results obtained from these two test procedures. This difference
was expected because Road Rater machines apply sinusoidal loads and FWD machines apply
impulse loads. Only FWD data will be used in the structural analyses for this report.
Using data for all test locations, both ISM and basin curvature were tested for normality
and homogeneity of variance. These data generally passed normality tests (Kolmogorov-
Smirnov and Shapiro-Wilks), but variance was found to change significantly among sets of
treatments, where treatments included different experimental sections (control or test) and
different test dates. The transformation of ISM with the natural logarithm was found by the
Western Transportation Institute Page 50
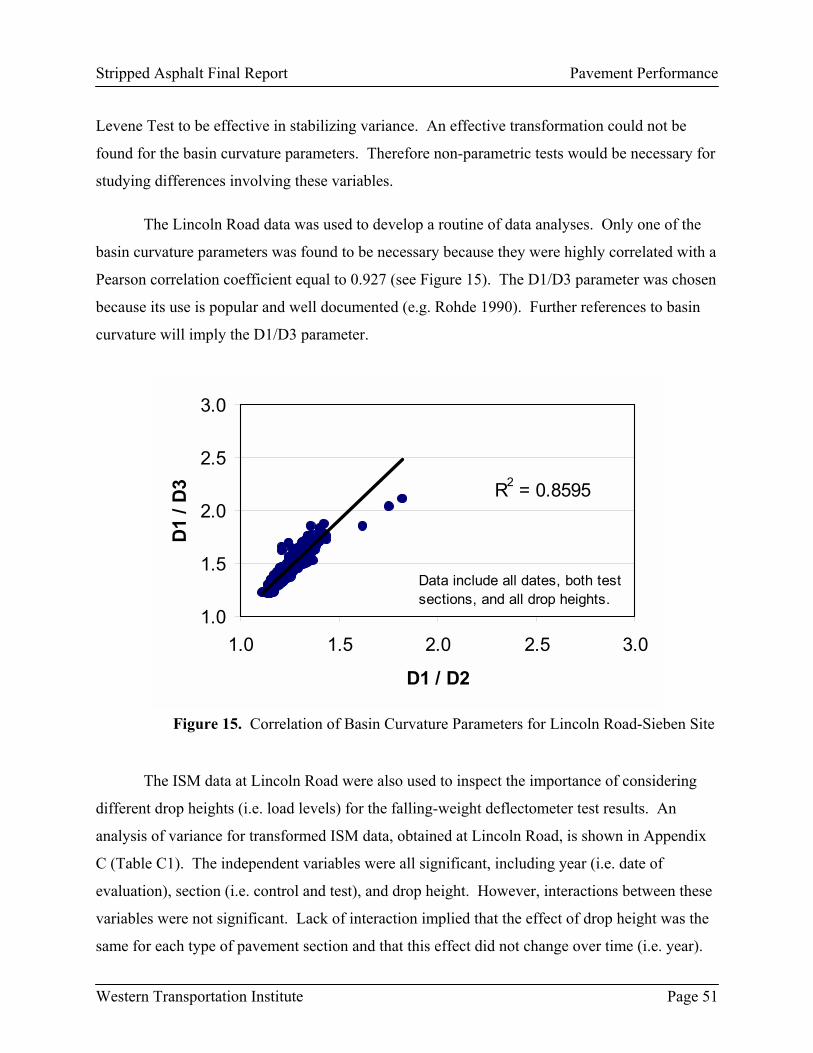
Stripped Asphalt Final Report Pavement Performance
Levene Test to be effective in stabilizing variance. An effective transformation could not be
found for the basin curvature parameters. Therefore non-parametric tests would be necessary for
studying differences involving these variables.
The Lincoln Road data was used to develop a routine of data analyses. Only one of the
basin curvature parameters was found to be necessary because they were highly correlated with a
Pearson correlation coefficient equal to 0.927 (see Figure 15). The D1/D3 parameter was chosen
because its use is popular and well documented (e.g. Rohde 1990). Further references to basin
curvature will imply the D1/D3 parameter.
R2 = 0.8595
1.0
1.5
2.0
2.5
3.0
1.0 1.5 2.0 2.5 3.0
D1 / D2
D1 /
D3
Data include all dates, both test sections, and all drop heights.
Figure 15. Correlation of Basin Curvature Parameters for Lincoln Road-Sieben Site
The ISM data at Lincoln Road were also used to inspect the importance of considering
different drop heights (i.e. load levels) for the falling-weight deflectometer test results. An
analysis of variance for transformed ISM data, obtained at Lincoln Road, is shown in Appendix
C (Table C1). The independent variables were all significant, including year (i.e. date of
evaluation), section (i.e. control and test), and drop height. However, interactions between these
variables were not significant. Lack of interaction implied that the effect of drop height was the
same for each type of pavement section and that this effect did not change over time (i.e. year).
Western Transportation Institute Page 51
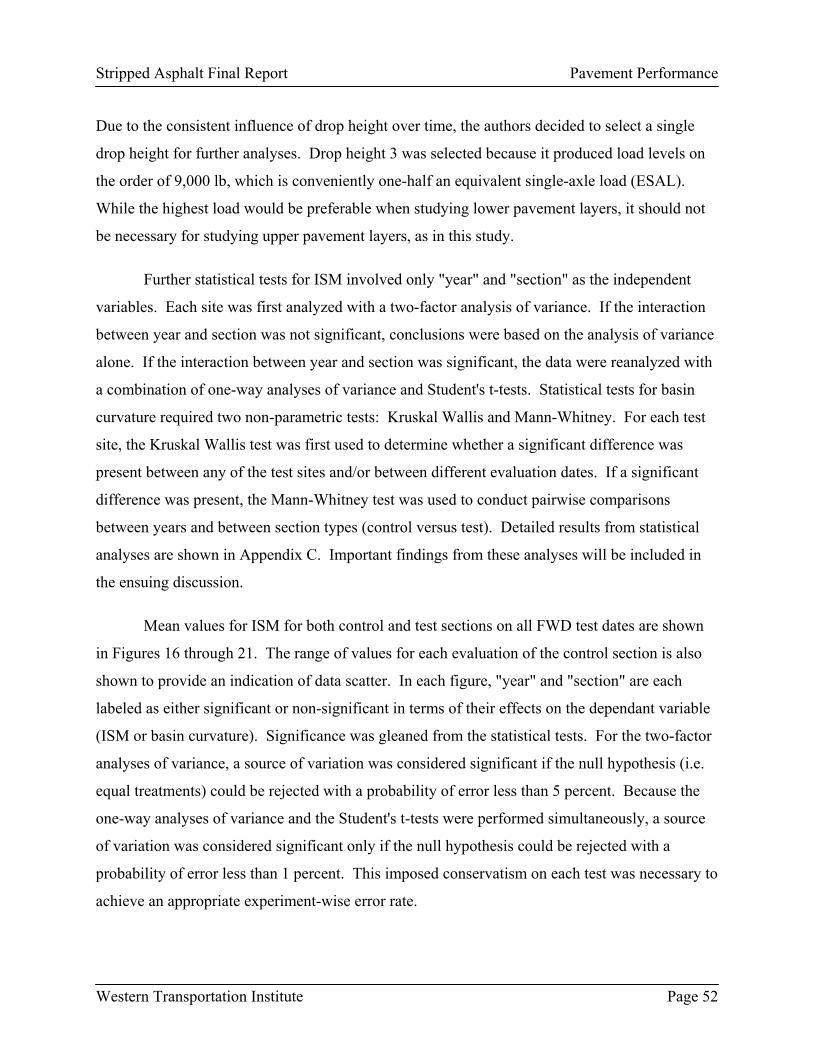
Stripped Asphalt Final Report Pavement Performance
Due to the consistent influence of drop height over time, the authors decided to select a single
drop height for further analyses. Drop height 3 was selected because it produced load levels on
the order of 9,000 lb, which is conveniently one-half an equivalent single-axle load (ESAL).
While the highest load would be preferable when studying lower pavement layers, it should not
be necessary for studying upper pavement layers, as in this study.
Further statistical tests for ISM involved only "year" and "section" as the independent
variables. Each site was first analyzed with a two-factor analysis of variance. If the interaction
between year and section was not significant, conclusions were based on the analysis of variance
alone. If the interaction between year and section was significant, the data were reanalyzed with
a combination of one-way analyses of variance and Student's t-tests. Statistical tests for basin
curvature required two non-parametric tests: Kruskal Wallis and Mann-Whitney. For each test
site, the Kruskal Wallis test was first used to determine whether a significant difference was
present between any of the test sites and/or between different evaluation dates. If a significant
difference was present, the Mann-Whitney test was used to conduct pairwise comparisons
between years and between section types (control versus test). Detailed results from statistical
analyses are shown in Appendix C. Important findings from these analyses will be included in
the ensuing discussion.
Mean values for ISM for both control and test sections on all FWD test dates are shown
in Figures 16 through 21. The range of values for each evaluation of the control section is also
shown to provide an indication of data scatter. In each figure, "year" and "section" are each
labeled as either significant or non-significant in terms of their effects on the dependant variable
(ISM or basin curvature). Significance was gleaned from the statistical tests. For the two-factor
analyses of variance, a source of variation was considered significant if the null hypothesis (i.e.
equal treatments) could be rejected with a probability of error less than 5 percent. Because the
one-way analyses of variance and the Student's t-tests were performed simultaneously, a source
of variation was considered significant only if the null hypothesis could be rejected with a
probability of error less than 1 percent. This imposed conservatism on each test was necessary to
achieve an appropriate experiment-wise error rate.
Western Transportation Institute Page 52
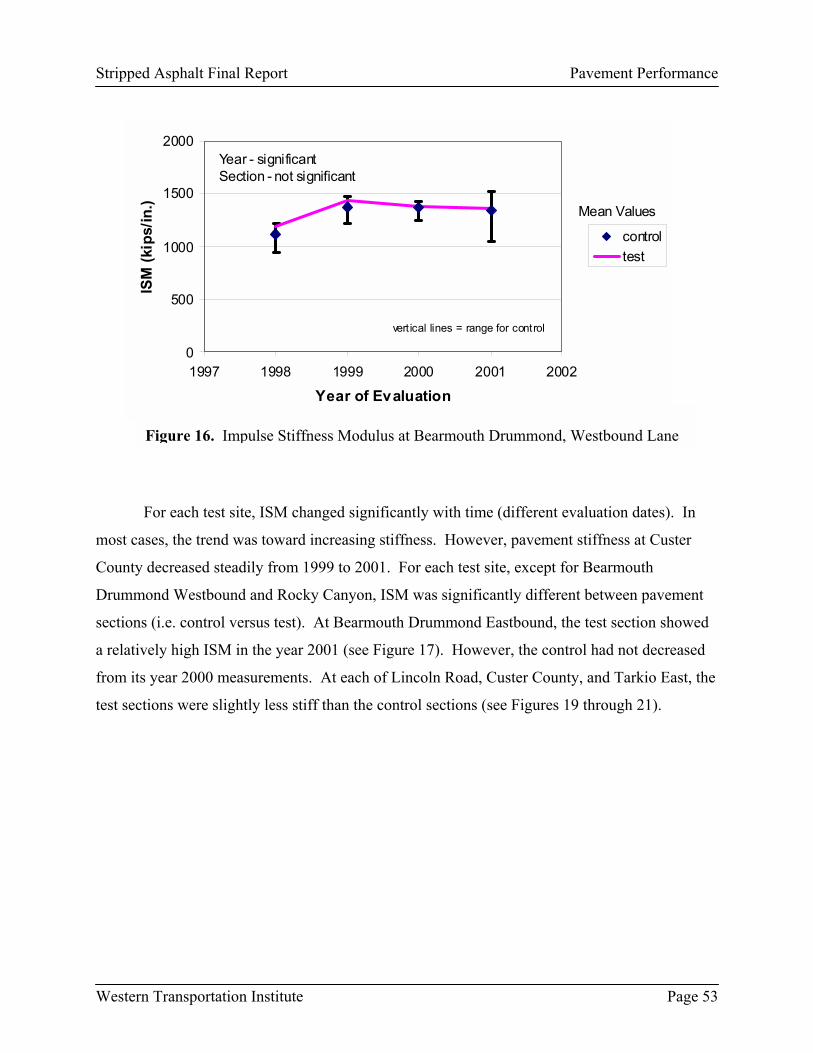
Stripped Asphalt Final Report Pavement Performance
0
500
1000
1500
2000
1997 1998 1999 2000 2001 2002
Year of Evaluation
ISM
(kip
s/in
.)
controltest
Year - significantSection - not significant
vert ical lines = range for control
Mean Values
most c
County
Drumm
section
a relati
from it
test sec
Wester
Figure 17. Impule Stiffness Modulus at Bearmouth Drummond, Westbound Lane Figure 16. Impulse Stiffness Modulus at Bearmouth Drummond, Westbound Lane
For each test site, ISM changed significantly with time (different evaluation dates). In
ases, the trend was toward increasing stiffness. However, pavement stiffness at Custer
decreased steadily from 1999 to 2001. For each test site, except for Bearmouth
ond Westbound and Rocky Canyon, ISM was significantly different between pavement
s (i.e. control versus test). At Bearmouth Drummond Eastbound, the test section showed
vely high ISM in the year 2001 (see Figure 17). However, the control had not decreased
s year 2000 measurements. At each of Lincoln Road, Custer County, and Tarkio East, the
tions were slightly less stiff than the control sections (see Figures 19 through 21).
n Transportation Institute Page 53
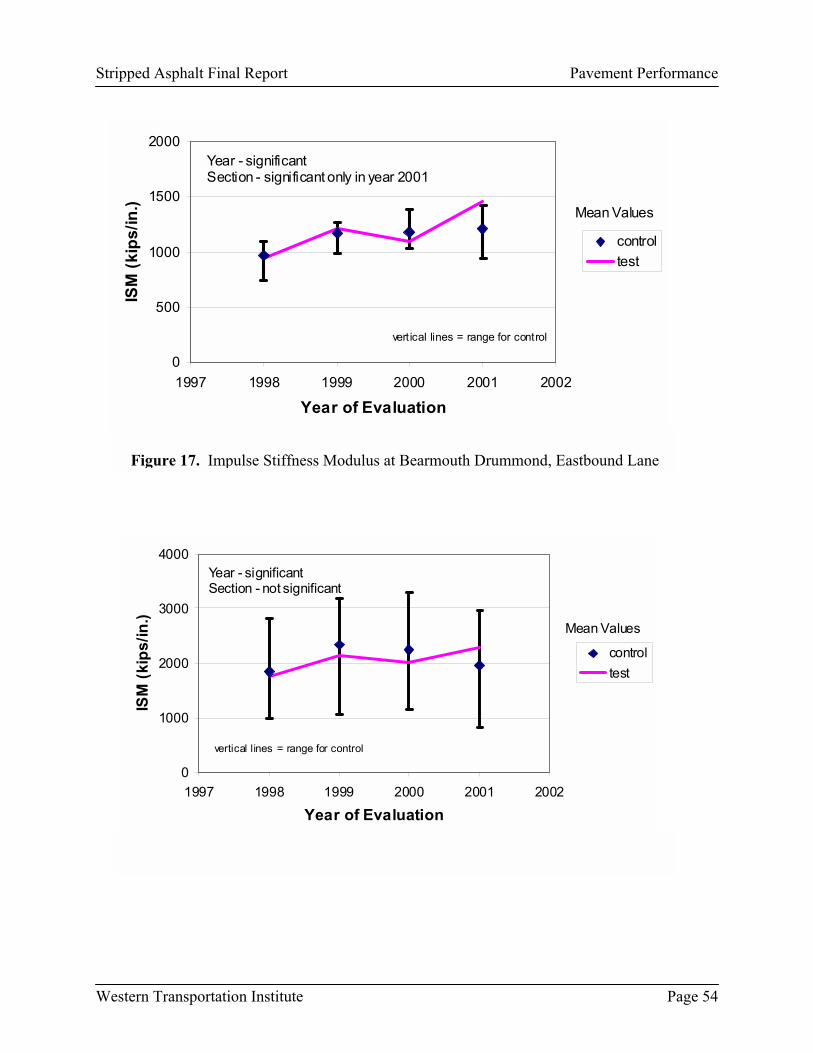
Stripped Asphalt Final Report Pavement Performance
0
500
1000
1500
2000
1997 1998 1999 2000 2001 2002
Year of Evaluation
ISM
(kip
s/in
.)
controltest
Year - significantSection - significant only in year 2001
vertical lines = range for control
Mean Values
Figure 18. Impulse Stiffness Modulus at Bearmouth Drummond, Eastbound Lane Figure 17. Impulse Stiffness Modulus at Bearmouth Drummond, Eastbound Lane
0
1000
2000
3000
4000
1997 1998 1999 2000 2001 2002
Year of Evaluation
ISM
(kip
s/in
.)
controltest
Year - significantSection - not significant
vertical lines = range for control
Mean Values
Figure 19. Impulse Stiffness Modulus at Rocky Canyon Figure 18. Impulse Stiffness Modulus at Rocky Canyon
Western Transportation Institute Page 54

Stripped Asphalt Final Report Pavement Performance
0
500
1000
1500
2000
1997 1998 1999 2000 2001 2002
Year of Evaluation
ISM
(kip
s/in
.)
controltest
Year - significantSection - significant
vertical lines = range for control
Mean Values
W
Figure 20. Impulse Stiffness Modulus at Lincoln Road
Figure 19. Impulse Stiffness Modulus at Lincoln Road
0
500
1000
1500
2000
2500
1997 1998 1999 2000 2001 2002
Year of Evaluation
ISM
(kip
s/in
.)
controltest
Year - significantSection - significant
vertical lines = range for control
Mean Values
Line
Figure 21. Impulse Stiffness Modulus at Custer County Figure 20. Impulse Stiffness Modulus at Custer County Line
estern Transportation Institute Page 55

Stripped Asphalt Final Report Pavement Performance
0
500
1000
1500
2000
1997 1998 1999 2000 2001 2002
Year of Evaluation
ISM
(kip
s/in
.)
controltest
Year - significantSection - significant for all but year 2000
vertical lines = range for control
Mean Values
Figure 22. Impulse Stiffness Modulus at Tarkio East Figure 21. Impulse Stiffness Modulus at Tarkio East
However, these differences did not change over time. These differences should therefore
be considered as reflections of different pavement cross-sections, rather than as reflections of the
durability of different rehabilitation techniques.
The high variability in ISM for the control section at Rocky Canyon is interesting (see
Figure 18). Rehabilitation of this pavement included the placement of 9.6 in. of cement-treated
pulverized base (CTPB). The variability in ISM may be a reflection of spatial variability in the
strength attained in the CTPB.
Similarly, basin curvature generally changed significantly over time. In most cases, the
trend was toward increasing pavement stiffness (see Figures 22 through 27). Custer County was
the only test site where curvature increased over time, indicating a weakening of near-surface
pavement layers (see Figure 26). This weakening was consistent with ISM results. Differences
between control and test sections were not significant.
Western Transportation Institute Page 56

Stripped Asphalt Final Report Pavement Performance
0.0
0.5
1.0
1.5
2.0
1997 1998 1999 2000 2001 2002
Year of Evaluation
Bas
in C
urva
ture
(D1/
D3)
controltest
Year - significantSection - not significant
vertical lines = range for control
Mean Values
Figure 22. Basin Curvature at Bearmouth Drummond, Westbound Lane
Western Transportation Institute Page 57
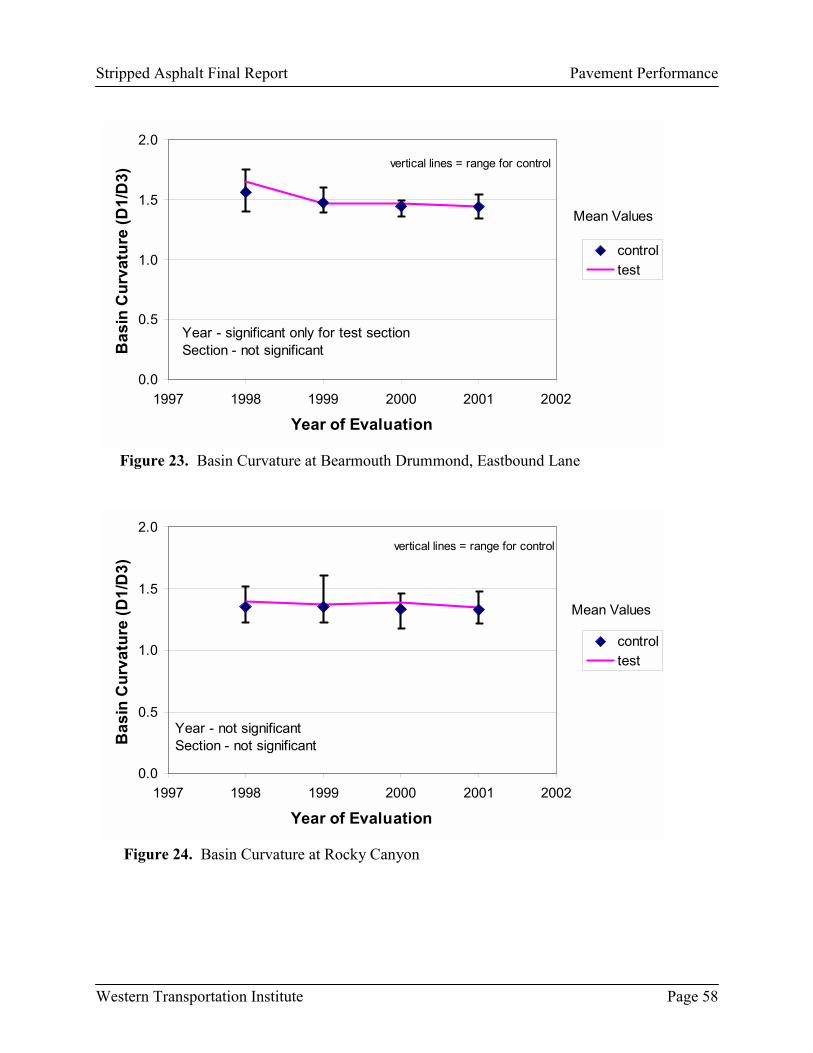
Stripped Asphalt Final Report Pavement Performance
0.0
0.5
1.0
1.5
2.0
1997 1998 1999 2000 2001 2002
Year of Evaluation
Bas
in C
urva
ture
(D1/
D3)
controltest
Year - significant only for test sectionSection - not significant
vertical lines = range for control
Mean Values
Figure 23. Basin Curvature at Bearmouth Drummond, Eastbound Lane
0.0
0.5
1.0
1.5
2.0
1997 1998 1999 2000 2001 2002
Year of Evaluation
Bas
in C
urva
ture
(D1/
D3)
controltest
Year - not significantSection - not significant
vertical lines = range for control
Mean Values
Figure 24. Basin Curvature at Rocky Canyon
Western Transportation Institute Page 58
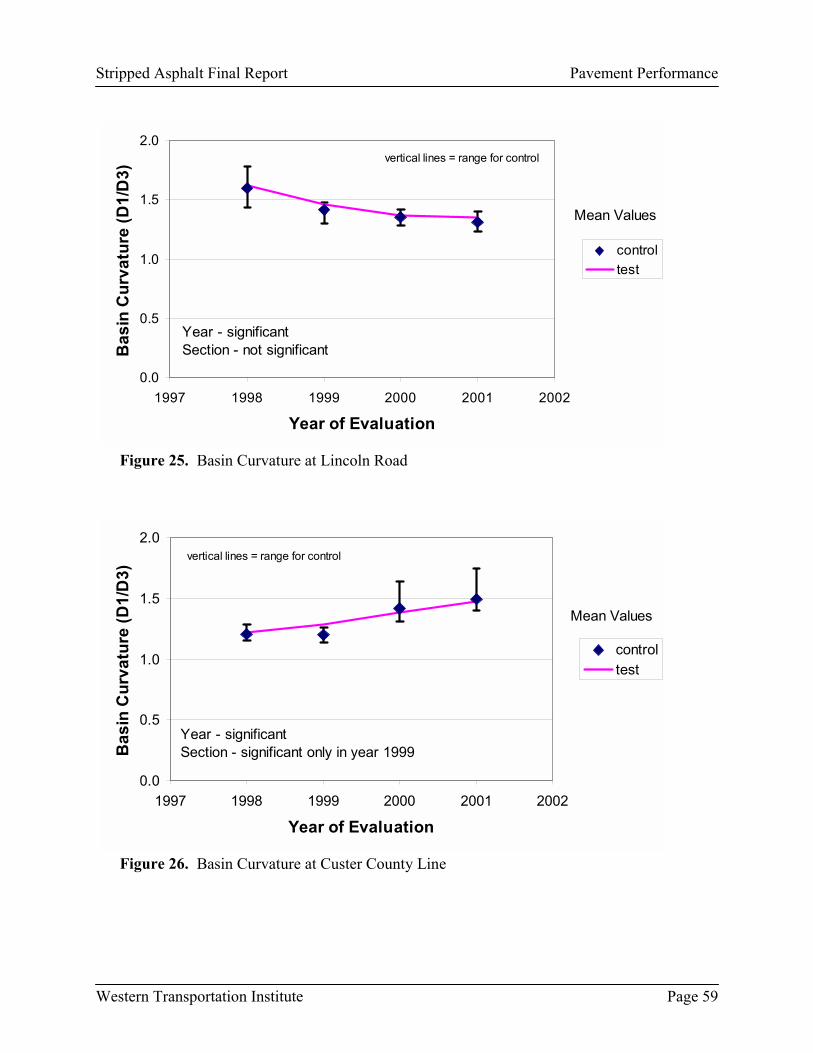
Stripped Asphalt Final Report Pavement Performance
0.0
0.5
1.0
1.5
2.0
1997 1998 1999 2000 2001 2002
Year of Evaluation
Bas
in C
urva
ture
(D1/
D3)
controltest
Year - significantSection - not significant
vertical lines = range for control
Mean Values
Figure 25. Basin Curvature at Lincoln Road
0.0
0.5
1.0
1.5
2.0
1997 1998 1999 2000 2001 2002
Year of Evaluation
Bas
in C
urva
ture
(D1/
D3)
controltest
Year - significantSection - significant only in year 1999
vertical lines = range for control
Mean Values
Figure 26. Basin Curvature at Custer County Line
Western Transportation Institute Page 59

Stripped Asphalt Final Report Pavement Performance
W
0
1
2
3
1997 1998 1999 2000 2001 2002
Year of Evaluation
Bas
in C
urva
ture
(D1/
D3)
controltest
Year - significantSection - significant only in year 1998
vertical lines = range for control
Mean Values
st
Figure 28. Basin Curvature at Tarkio Ea Figure 27. Basin Curvature at Tarkio Eastestern Transportation Institute Page 60
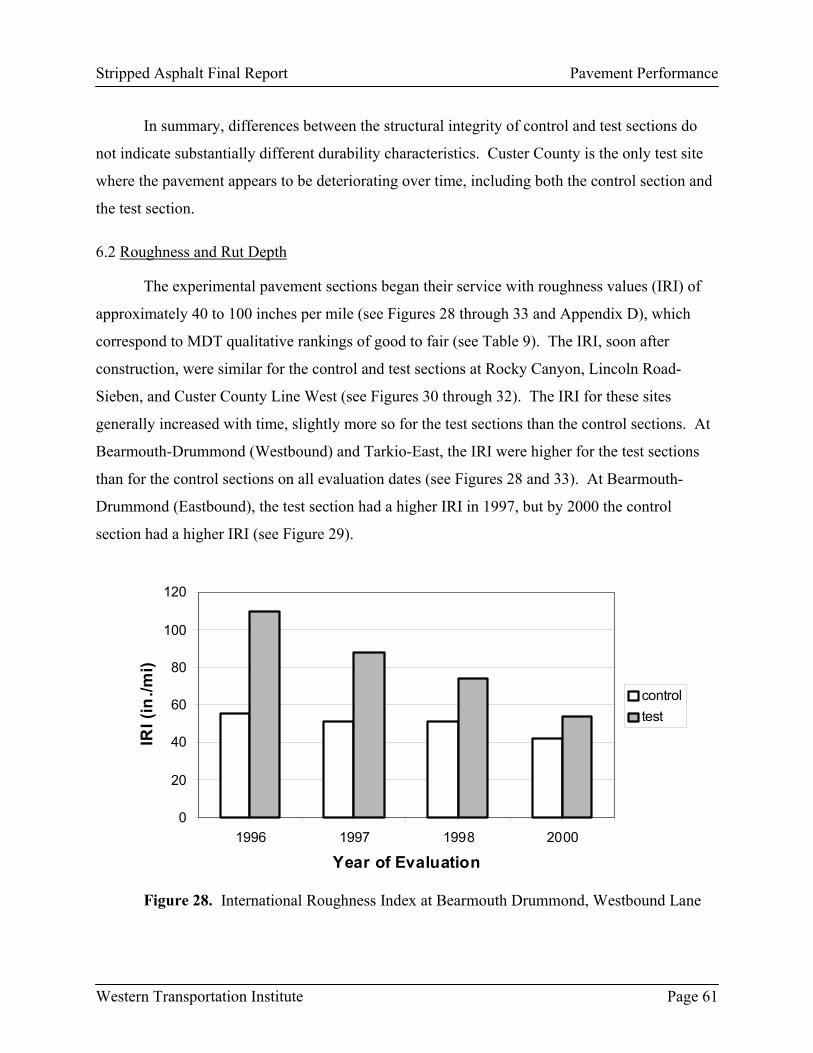
Stripped Asphalt Final Report Pavement Performance
In summary, differences between the structural integrity of control and test sections do
not indicate substantially different durability characteristics. Custer County is the only test site
where the pavement appears to be deteriorating over time, including both the control section and
the test section.
6.2 Roughness and Rut Depth
The experimental pavement sections began their service with roughness values (IRI) of
approximately 40 to 100 inches per mile (see Figures 28 through 33 and Appendix D), which
correspond to MDT qualitative rankings of good to fair (see Table 9). The IRI, soon after
construction, were similar for the control and test sections at Rocky Canyon, Lincoln Road-
Sieben, and Custer County Line West (see Figures 30 through 32). The IRI for these sites
generally increased with time, slightly more so for the test sections than the control sections. At
Bearmouth-Drummond (Westbound) and Tarkio-East, the IRI were higher for the test sections
than for the control sections on all evaluation dates (see Figures 28 and 33). At Bearmouth-
Drummond (Eastbound), the test section had a higher IRI in 1997, but by 2000 the control
section had a higher IRI (see Figure 29).
0
20
40
60
80
100
120
1996 1997 1998 2000
Year of Evaluation
IRI (
in./m
i)
controltest
Figure 28. International Roughness Index at Bearmouth Drummond, Westbound Lane
Western Transportation Institute Page 61
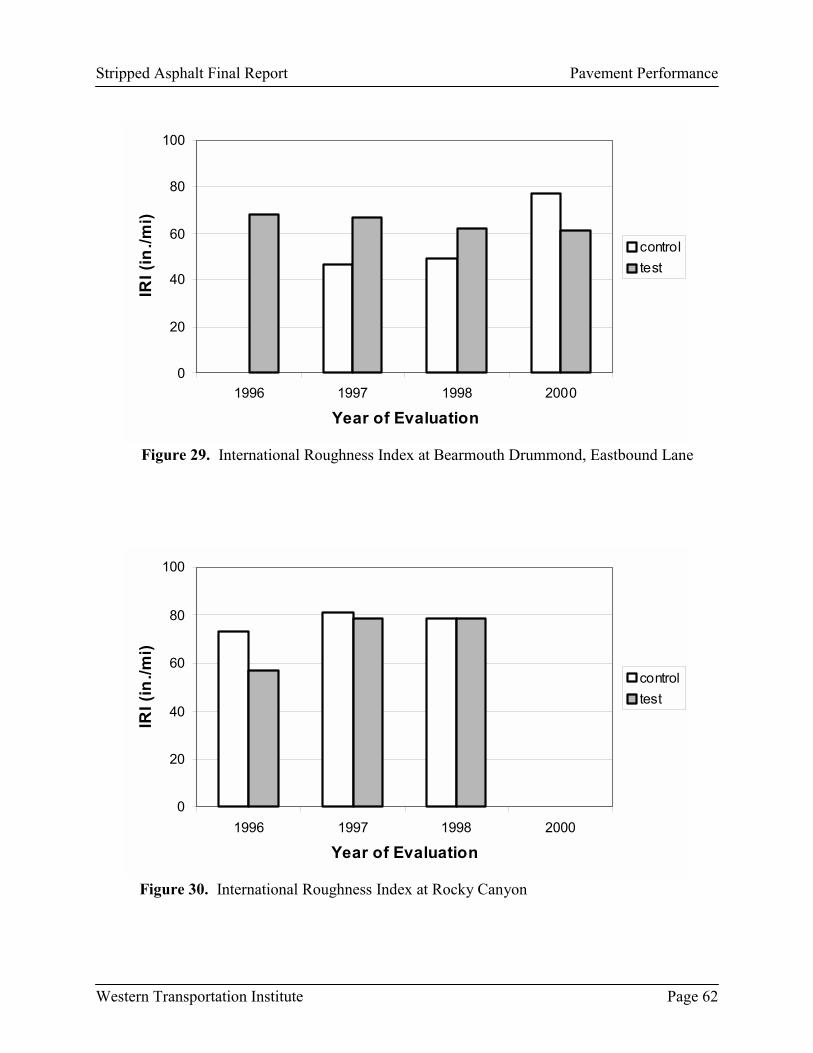
Stripped Asphalt Final Report Pavement Performance
0
20
40
60
80
100
1996 1997 1998 2000
Year of Evaluation
IRI (
in./m
i)
controltest
Figure 29. International Roughness Index at Bearmouth Drummond, Eastbound Lane
0
20
40
60
80
100
1996 1997 1998 2000
Year of Evaluation
IRI (
in./m
i)
controltest
Figure 30. International Roughness Index at Rocky Canyon
Western Transportation Institute Page 62
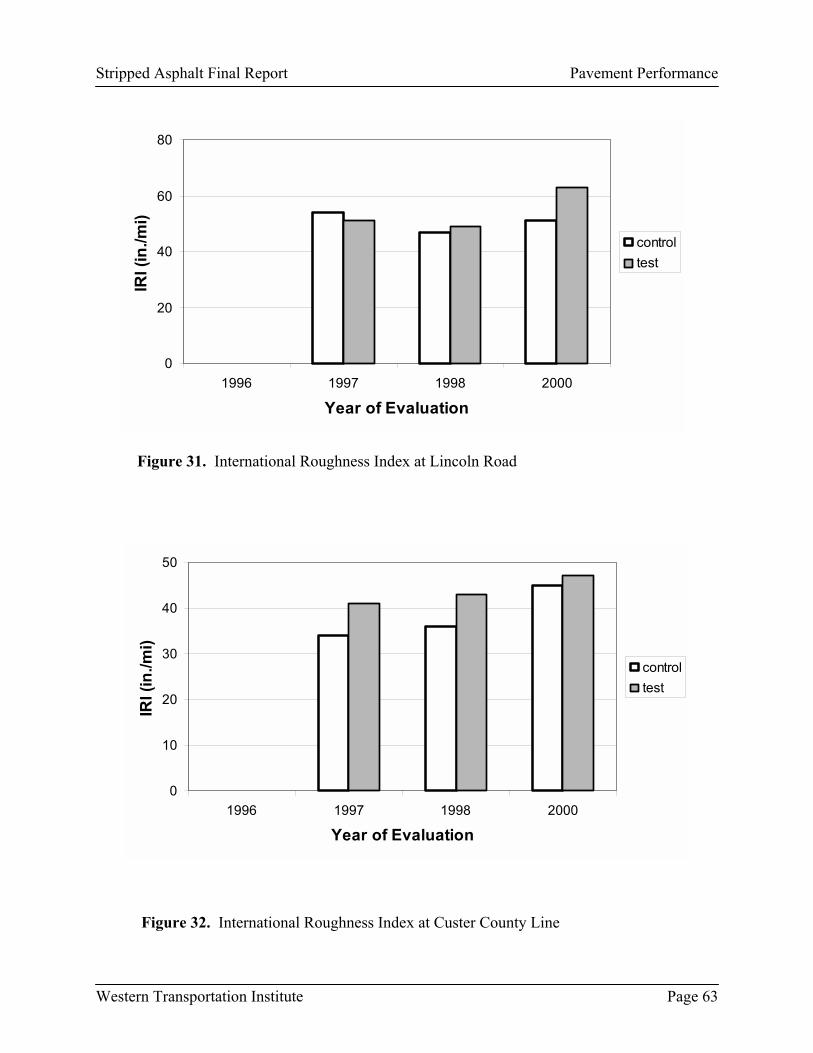
Stripped Asphalt Final Report Pavement Performance
0
20
40
60
80
1996 1997 1998 2000
Year of Evaluation
IRI (
in./m
i)
controltest
Figure 31. International Roughness Index at Lincoln Road
0
10
20
30
40
50
1996 1997 1998 2000
Year of Evaluation
IRI (
in./m
i)
controltest
Figure 32. International Roughness Index at Custer County Line
Western Transportation Institute Page 63
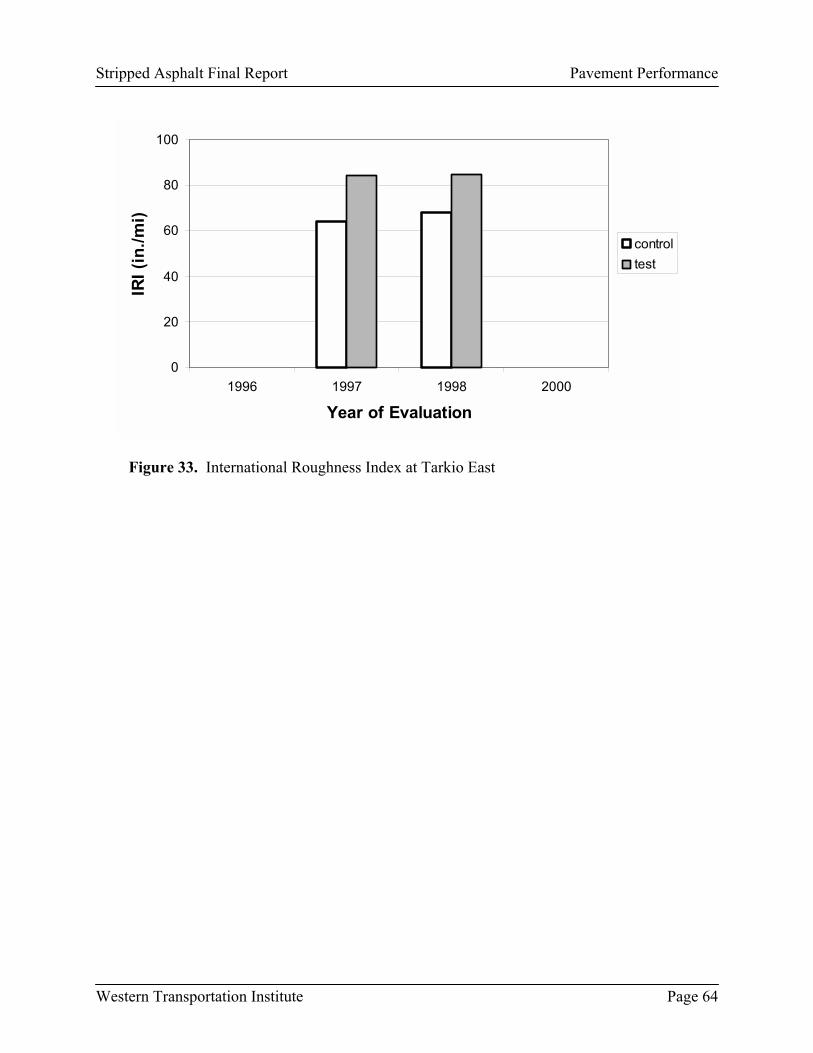
Stripped Asphalt Final Report Pavement Performance
0
20
40
60
80
100
1996 1997 1998 2000
Year of Evaluation
IRI (
in./m
i)
controltest
Figure 33. International Roughness Index at Tarkio East
Western Transportation Institute Page 64

Stripped Asphalt Final Report Pavement Performance
In summary, the control sections were generally smoother than the test sections. The
control sections involved more milling and thicker placements of new material, which should
promote a smoother product, relative to the thin milling and overlay used for test sections.
However, during the last year of evaluations (year 2000), there was no pavement section with an
IRI greater than approximately 80 in/mi., which is considered by MDT to be borderline good to
fair.
The experimental pavement sections began their service with average rut depths of 0.15
inch or less (Appendix D). At that time, no consistent differences were observed between ruts in
the control and test sections. These initial rut measurements were obtained with the South
Dakota Profilometer.
Rutting data for each pavement section, for the years 1999 and 2000, were tested for
normality and homogeneity of variance. These rut data, which were obtained with the Rainhart
Profilograph, were generally found to be normal (as determined by Kolmogorov-Smirnov and
Shapiro-Wilks tests). However, at some sites, variances for rutting data were found to be
unequal among sections and test dates. Therefore, the raw rutting data (in.) was transformed by
the natural logarithm. The transformation was successful in stabilizing variance between
treatments (section type and evaluation year).
The analysis of rutting will concentrate on Rainhart Profilograph measurements because
they were obtained after the longest duration of trafficking and they were believed to be more
reliable than measurements obtained with the South Dakota Profilometer. Similar to the
statistical analyses for NDT data, a two-factor analysis of variance was first used to test for
significant differences among rutting at different pavement sites, specifically seeking differences
between sections (control versus test) and differences between dates of evaluation (year 1999
versus year 2000). A source of variation was considered significant if the null hypothesis (i.e.
equal treatments) could be rejected with a probability of error less than 5 percent. Summaries of
results from these statistical procedures are included in Appendix C.
In no case was interaction between year and section found to be significant. Therefore,
all conclusions for the main effects (section and year) could be obtained from the two-factor
Western Transportation Institute Page 65
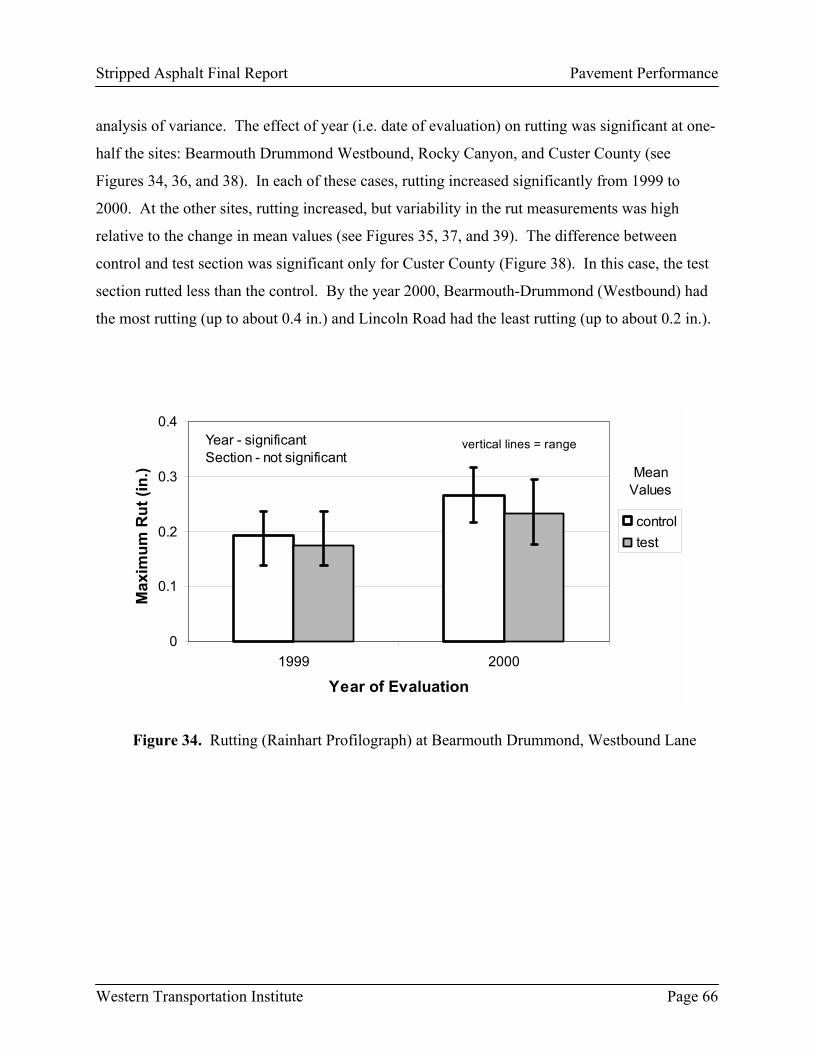
Stripped Asphalt Final Report Pavement Performance
analysis of variance. The effect of year (i.e. date of evaluation) on rutting was significant at one-
half the sites: Bearmouth Drummond Westbound, Rocky Canyon, and Custer County (see
Figures 34, 36, and 38). In each of these cases, rutting increased significantly from 1999 to
2000. At the other sites, rutting increased, but variability in the rut measurements was high
relative to the change in mean values (see Figures 35, 37, and 39). The difference between
control and test section was significant only for Custer County (Figure 38). In this case, the test
section rutted less than the control. By the year 2000, Bearmouth-Drummond (Westbound) had
the most rutting (up to about 0.4 in.) and Lincoln Road had the least rutting (up to about 0.2 in.).
0
0.1
0.2
0.3
0.4
1999 2000
Year of Evaluation
Max
imum
Rut
(in.
)
controltest
Year - significantSection - not significant
vertical lines = range
MeanValues
Figure 34. Rutting (Rainhart Profilograph) at Bearmouth Drummond, Westbound Lane
Western Transportation Institute Page 66

Stripped Asphalt Final Report Pavement Performance
Western Transportation Institute Page 67
0
0.2
0.4
0.6
1999 2000
Year of Evaluation
Max
imum
Rut
(in.
)
controltest
Year - significantSection - not significant
MeanValues
vertical lines = range
Figure 36. Rutting (Rainhart Profilograph) at Rocky Canyon
0
0.2
0.4
0.6
0.8
1999 2000
Year of Evaluation
Max
imum
Rut
(in.
)
controltest
Year - not significantSection - not significant
vertical lines = range
MeanValues
Figure 35. Rutting (Rainhart Profilograph) at Bearmouth Drummond, Eastbound Lane

Stripped Asphalt Final Report Pavement Performance
Western Transportation Institute Page 68
0
0.1
0.2
0.3
0.4
1999 2000
Year of Evaluation
Max
imum
Rut
(in.
)
controltest
Year - significantSection - significant
vertical lines = range
MeanValues
Figure 38. Rutting (Rainhart Profilograph) at Custer County Line
0
0.1
0.2
0.3
0.4
1999 2000
Year of Evaluation
Max
imum
Rut
(in.
)
controltest
Year - not significantSection - not significant
vertical lines = range
MeanValues
Figure 37. Rutting (Rainhart Profilograph) at Lincoln Road
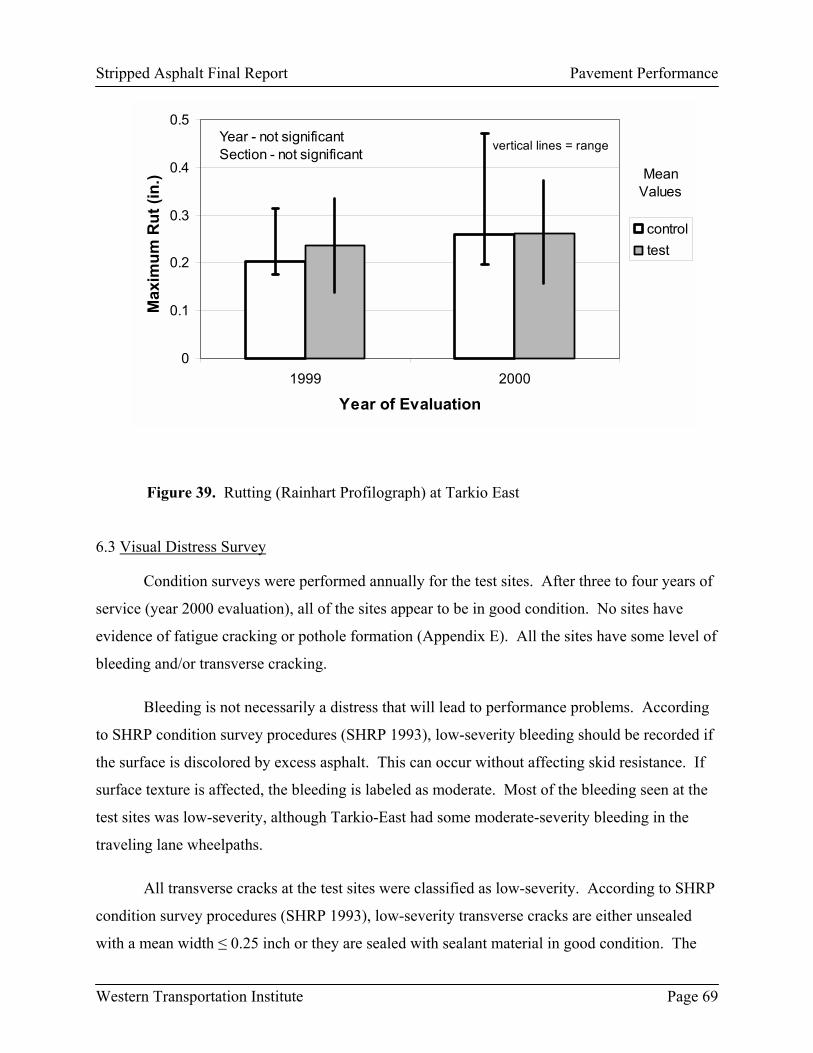
Stripped Asphalt Final Report Pavement Performance
0
0.1
0.2
0.3
0.4
0.5
1999 2000
Year of Evaluation
Max
imum
Rut
(in.
)
controltest
Year - not significantSection - not significant vertical lines = range
MeanValues
Figure 39. Rutting (Rainhart Profilograph) at Tarkio East
6.3 Visual Distress Survey
Condition surveys were performed annually for the test sites. After three to four years of
service (year 2000 evaluation), all of the sites appear to be in good condition. No sites have
evidence of fatigue cracking or pothole formation (Appendix E). All the sites have some level of
bleeding and/or transverse cracking.
Bleeding is not necessarily a distress that will lead to performance problems. According
to SHRP condition survey procedures (SHRP 1993), low-severity bleeding should be recorded if
the surface is discolored by excess asphalt. This can occur without affecting skid resistance. If
surface texture is affected, the bleeding is labeled as moderate. Most of the bleeding seen at the
test sites was low-severity, although Tarkio-East had some moderate-severity bleeding in the
traveling lane wheelpaths.
All transverse cracks at the test sites were classified as low-severity. According to SHRP
condition survey procedures (SHRP 1993), low-severity transverse cracks are either unsealed
with a mean width ≤ 0.25 inch or they are sealed with sealant material in good condition. The
Western Transportation Institute Page 69

Stripped Asphalt Final Report Pavement Performance
only two sites with sealed cracks were Rocky Canyon and Lincoln Road-Sieben. By the year
2000, the Lincoln Road-Sieben site had the highest density of transverse cracks with 17 full-
width cracks in the control section and 24 full-width cracks in the test section. The Custer
County site has the fewest number of cracks with 2 full-width cracks in the control section and 4
full-width cracks in the test section. It should be noted that the Custer County site is the only
experimental pavement site that used a Superpave mix design. Control and test sections
experienced similar transverse cracking at most sites. At Rocky Canyon, however, the control
section cracked more than the test section: 9 full-width cracks for the control section versus 1
full-width crack for the test section. This difference in observed transverse cracks at Rocky
Canyon can be attributed to the installation of a cement-treated base in the control section.
6.4 Cores
Between 6 and 12 cores were removed from each experimental pavement section at each
site (see Table 11). Initial inspection of the core data revealed no reason to differentiate between
cores removed from different transverse locations on the pavements. Therefore, cores will be
referenced only by test site and experimental pavement section type (control or test). The cores
verified thicknesses of asphalt concrete that were commensurate with expected thicknesses based
on MDT records (see Figure 40). The range of core thicknesses was particularly high for test
sections at both Rocky Canyon and Lincoln Road, with ranges equal to 0.8 and 0.5 times the
expected values, respectively.
Western Transportation Institute Page 70
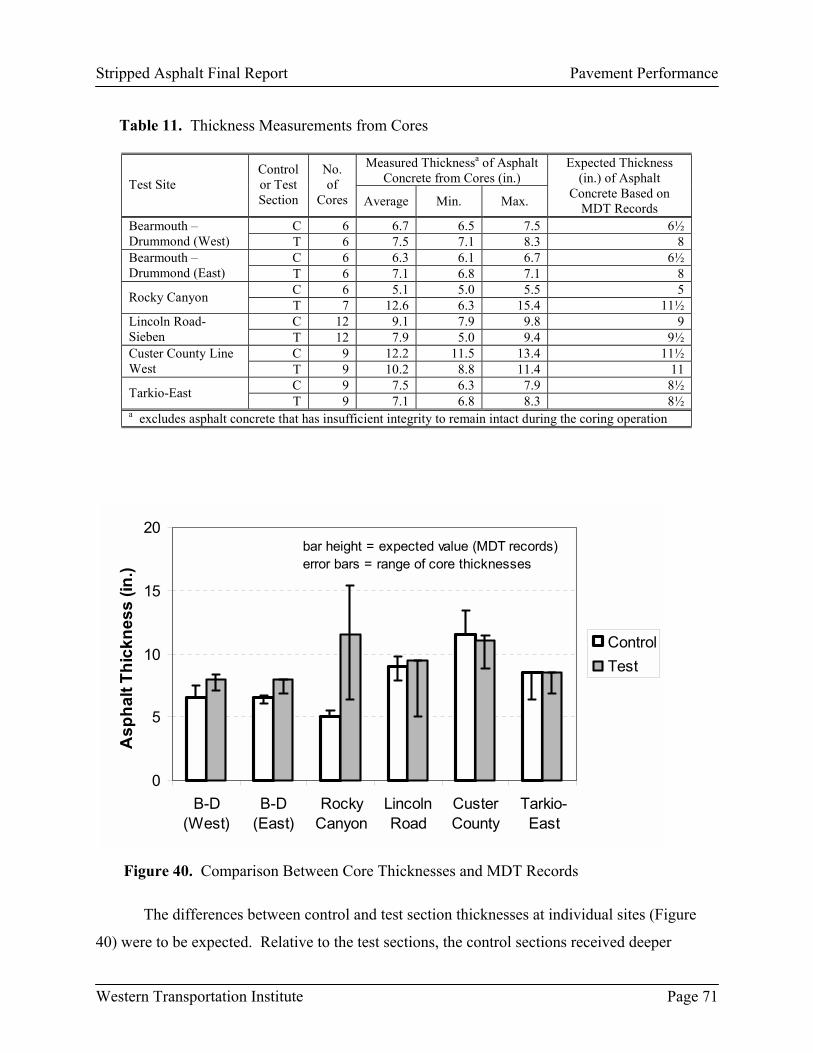
Stripped Asphalt Final Report Pavement Performance
Table 11. Thickness Measurements from Cores
Measured Thicknessa of Asphalt
Concrete from Cores (in.) Test Site Control or Test Section
No. of
Cores Average Min. Max.
Expected Thickness (in.) of Asphalt
Concrete Based on MDT Records
C 6 6.7 6.5 7.5 6½ Bearmouth � Drummond (West) T 6 7.5 7.1 8.3 8
C 6 6.3 6.1 6.7 6½ Bearmouth � Drummond (East) T 6 7.1 6.8 7.1 8
C 6 5.1 5.0 5.5 5 Rocky Canyon T 7 12.6 6.3 15.4 11½ C 12 9.1 7.9 9.8 9 Lincoln Road-
Sieben T 12 7.9 5.0 9.4 9½ C 9 12.2 11.5 13.4 11½ Custer County Line
West T 9 10.2 8.8 11.4 11 C 9 7.5 6.3 7.9 8½ Tarkio-East T 9 7.1 6.8 8.3 8½
a excludes asphalt concrete that has insufficient integrity to remain intact during the coring operation
0
5
10
15
20
B-D(West)
B-D(East)
RockyCanyon
LincolnRoad
CusterCounty
Tarkio-East
Asp
halt
Thic
knes
s (in
.)
ControlTest
bar height = expected value (MDT records)error bars = range of core thicknesses
Figure 40. Comparison Between Core Thicknesses and MDT Records
The differences between control and test section thicknesses at individual sites (Figure
40) were to be expected. Relative to the test sections, the control sections received deeper
Western Transportation Institute Page 71
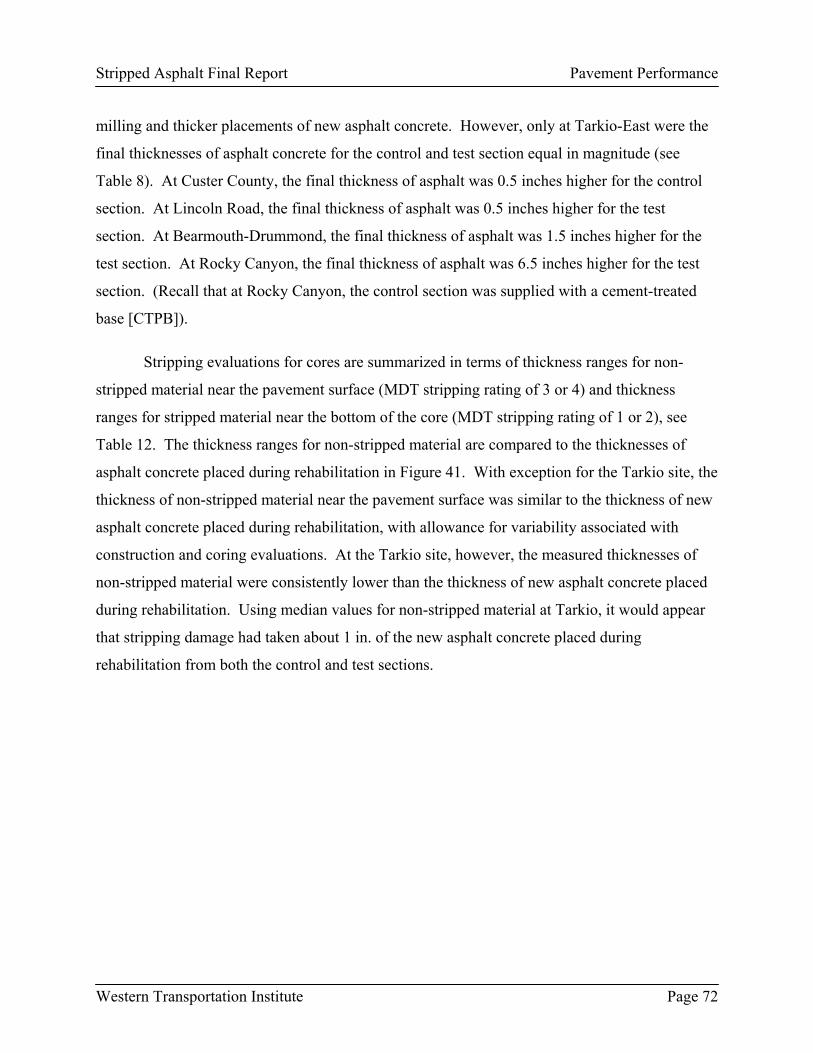
Stripped Asphalt Final Report Pavement Performance
milling and thicker placements of new asphalt concrete. However, only at Tarkio-East were the
final thicknesses of asphalt concrete for the control and test section equal in magnitude (see
Table 8). At Custer County, the final thickness of asphalt was 0.5 inches higher for the control
section. At Lincoln Road, the final thickness of asphalt was 0.5 inches higher for the test
section. At Bearmouth-Drummond, the final thickness of asphalt was 1.5 inches higher for the
test section. At Rocky Canyon, the final thickness of asphalt was 6.5 inches higher for the test
section. (Recall that at Rocky Canyon, the control section was supplied with a cement-treated
base [CTPB]).
Stripping evaluations for cores are summarized in terms of thickness ranges for non-
stripped material near the pavement surface (MDT stripping rating of 3 or 4) and thickness
ranges for stripped material near the bottom of the core (MDT stripping rating of 1 or 2), see
Table 12. The thickness ranges for non-stripped material are compared to the thicknesses of
asphalt concrete placed during rehabilitation in Figure 41. With exception for the Tarkio site, the
thickness of non-stripped material near the pavement surface was similar to the thickness of new
asphalt concrete placed during rehabilitation, with allowance for variability associated with
construction and coring evaluations. At the Tarkio site, however, the measured thicknesses of
non-stripped material were consistently lower than the thickness of new asphalt concrete placed
during rehabilitation. Using median values for non-stripped material at Tarkio, it would appear
that stripping damage had taken about 1 in. of the new asphalt concrete placed during
rehabilitation from both the control and test sections.
Western Transportation Institute Page 72
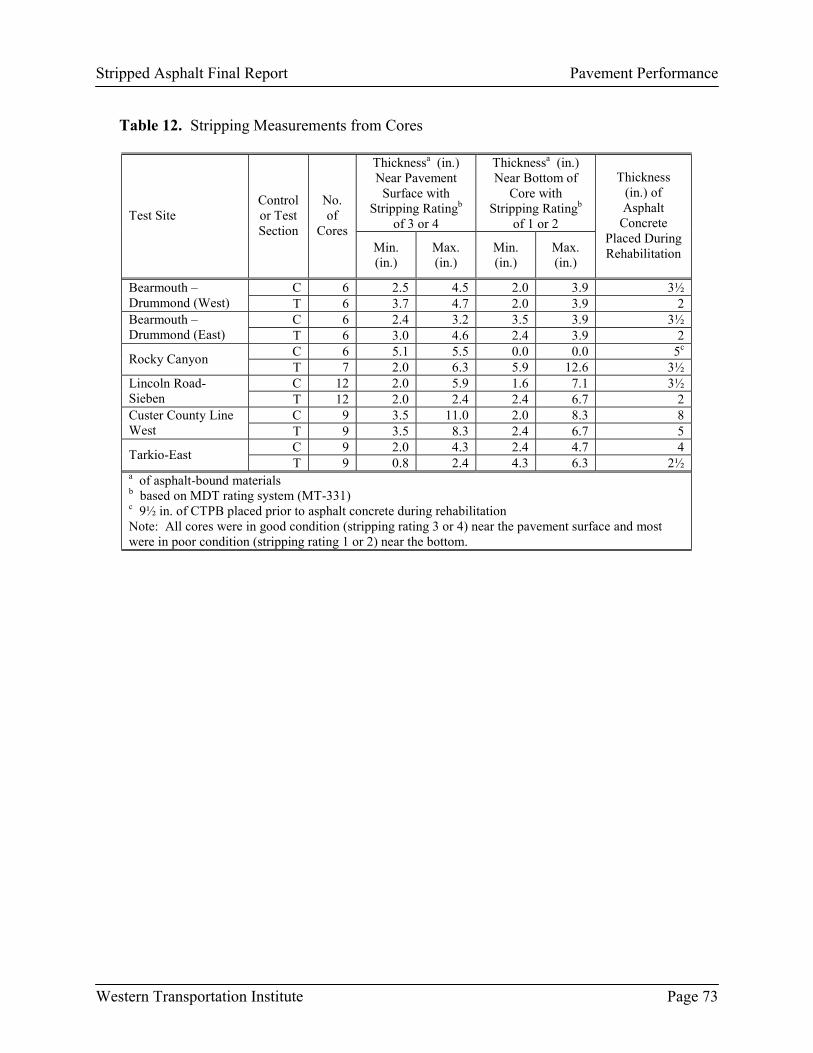
Stripped Asphalt Final Report Pavement Performance
Table 12. Stripping Measurements from Cores
Thicknessa (in.) Near Pavement
Surface with Stripping Ratingb
of 3 or 4
Thicknessa (in.) Near Bottom of
Core with Stripping Ratingb
of 1 or 2 Test Site Control or Test Section
No. of
Cores Min. (in.)
Max. (in.)
Min. (in.)
Max. (in.)
Thickness (in.) of Asphalt
Concrete Placed During Rehabilitation
C 6 2.5 4.5 2.0 3.9 3½ Bearmouth � Drummond (West) T 6 3.7 4.7 2.0 3.9 2
C 6 2.4 3.2 3.5 3.9 3½ Bearmouth � Drummond (East) T 6 3.0 4.6 2.4 3.9 2
C 6 5.1 5.5 0.0 0.0 5c Rocky Canyon T 7 2.0 6.3 5.9 12.6 3½ C 12 2.0 5.9 1.6 7.1 3½ Lincoln Road-
Sieben T 12 2.0 2.4 2.4 6.7 2 C 9 3.5 11.0 2.0 8.3 8 Custer County Line
West T 9 3.5 8.3 2.4 6.7 5 C 9 2.0 4.3 2.4 4.7 4 Tarkio-East T 9 0.8 2.4 4.3 6.3 2½
a of asphalt-bound materials b based on MDT rating system (MT-331) c 9½ in. of CTPB placed prior to asphalt concrete during rehabilitation Note: All cores were in good condition (stripping rating 3 or 4) near the pavement surface and most were in poor condition (stripping rating 1 or 2) near the bottom.
Western Transportation Institute Page 73
Stripped Asphalt Final Report Pavement Performance
0
5
10
15
B-D(West)
B-D(East)
RockyCanyon
LincolnRoad
CusterCounty
Tarkio-East
Asp
halt
Thic
knes
s (in
.)
ControlTest
bar height = surface material placed during rehabilitationerror bars = range of core thicknesses for non-stripped material (MDT rating of 3 or 4)
Figure 41. Thickness of Non-stripped Asphalt Concrete Near the Pavement Surface
6.5 Precipitation
Portions of Montana experienced relatively low levels of annual precipitation during this
experiment. Lack of moisture would certainly affect a study concerned with stripping damage in
asphalt concrete. To investigate the possibility of low moisture at the five test sites, summary
precipitation data were collected for the years 1981 through 2000. Table 13 and Figure 42
compare average annual precipitation during the experiment with average annual precipitation
for over a decade prior to the experiment. The data for the years prior to the experiment provide
an indication of the moisture made available to the pavements during the period that they
originally suffered stripping damage (i.e. prior to rehabilitation). The figure shows that while
Bearmouth Drummond, Rocky Canyon, and Custer County experienced lower-than-normal
levels of rainfall during the experiment (15, 21, and 23 percent low, respectively), Tarkio
experienced slightly higher-than-normal levels of rainfall (7 percent high), and Lincoln Road
experienced normal levels of rainfall.
Western Transportation Institute Page 74
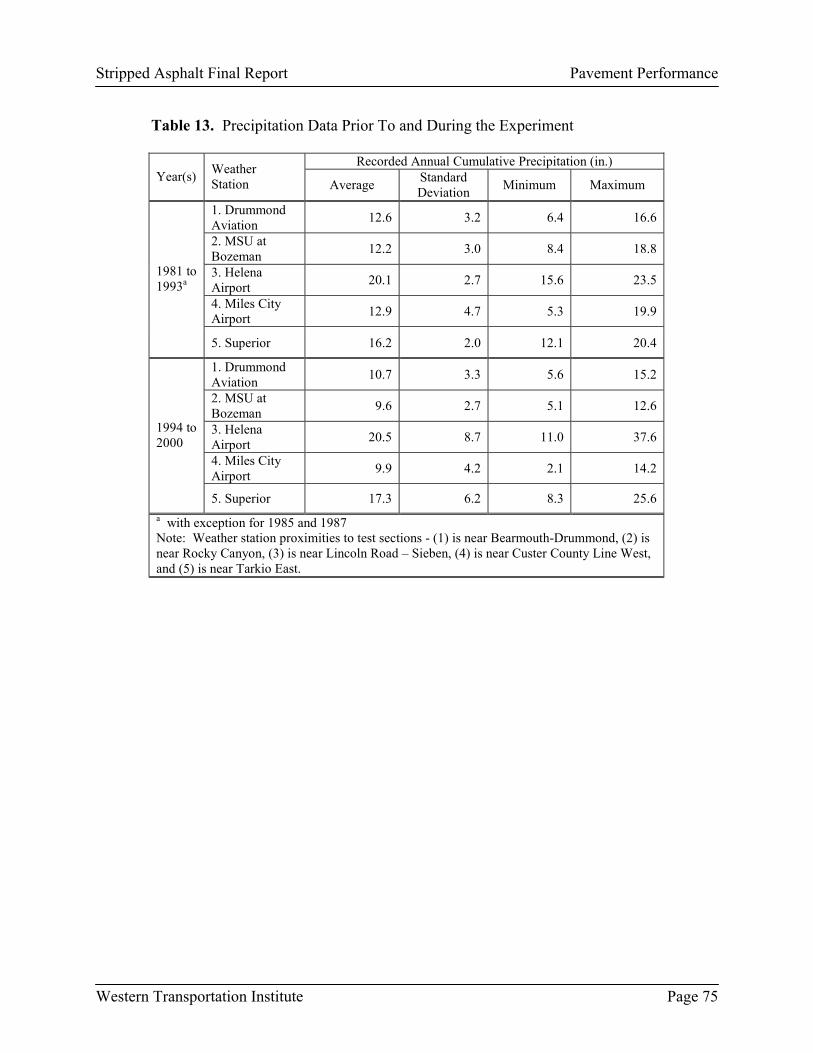
Stripped Asphalt Final Report Pavement Performance
Table 13. Precipitation Data Prior To and During the Experiment
Recorded Annual Cumulative Precipitation (in.)
Year(s) Weather Station Average Standard
Deviation Minimum Maximum
1. Drummond Aviation 12.6 3.2 6.4 16.6
2. MSU at Bozeman 12.2 3.0 8.4 18.8
3. Helena Airport 20.1 2.7 15.6 23.5
4. Miles City Airport 12.9 4.7 5.3 19.9
1981 to 1993a
5. Superior 16.2 2.0 12.1 20.4
1. Drummond Aviation 10.7 3.3 5.6 15.2
2. MSU at Bozeman 9.6 2.7 5.1 12.6
3. Helena Airport 20.5 8.7 11.0 37.6
4. Miles City Airport 9.9 4.2 2.1 14.2
1994 to 2000
5. Superior 17.3 6.2 8.3 25.6 a with exception for 1985 and 1987 Note: Weather station proximities to test sections - (1) is near Bearmouth-Drummond, (2) is near Rocky Canyon, (3) is near Lincoln Road � Sieben, (4) is near Custer County Line West, and (5) is near Tarkio East.
Western Transportation Institute Page 75

Stripped Asphalt Final Report Pavement Performance
0
5
10
15
20
25
BearmouthDrummond
RockyCanyon
LincolnRoad
CusterCounty
Tarkio-East
Ave
rage
Ann
ual P
reci
pita
tion
(in.)
1981-19931994-2000
Figure 43. Average Annual Precipitation Near Test Sites During the Experiment
Therefore, it would appear that lack of normal moisture should not have skewed the
research results at Tarkio or Lincoln Road. However, lower-than-normal rainfall is a factor that
should be taken under consideration when analyzing the results for Bearmouth Drummond,
Rocky Canyon, and Custer County. In summary, it does not appear that the reduced
precipitation in Montana in recent years should have a substantial effect on this asphalt stripping
experiment.
6.6 Test Section Summaries
Bearmouth-Drummond site results: The Bearmouth-Drummond test site (on I-90, near
Drummond) includes both a 500-foot control section and a 500-foot test section in each of the
eastbound and westbound lanes. In the control section, 3.5 inches of stripped material was
milled and replaced with an overlay of the same thickness (half hot-recycled neat binder course
and half polymer-modified surface course). In the test section, 0.5 inches of stripped open-
graded friction course (OGFC) was removed by milling, followed by an overlay of
approximately 1.5 inches of polymer-modified plant-mix.
Western Transportation Institute Page 76
Stripped Asphalt Final Report Pavement Performance
Annual structural integrity evaluations (both Impulse Stimulus Modulus and Basin
Curvature) indicated a trend toward increased stiffness over time with no significant difference
in results between the control and test sections (except for a one-time relatively high ISM result
in the eastbound lane test section). Roughness evaluations in the westbound lanes indicated
decreased roughness over time; however, roughness values were significantly higher each year in
the test section than in the control section. In the eastbound lanes, roughness values decreased
over time in the test section, and increased over time in the control section, and by the final
evaluation year the roughness value in the control section exceeded that of the test section. The
Bearmouth-Drummond site had the most rutting (up to about 0.4 inches) of any of the test sites,
with a significant increase in the westbound lanes from 1999 to 2000. However, the difference
in rutting between the control and test sections was not significant. Visual distress evaluations
indicated that the site is in good condition, with no evidence of fatigue cracking or pothole
formation. Both westbound and eastbound lanes show low severity bleeding and low severity
transverse cracking, but with no significant difference between the control and test sections.
Core evaluations suggest that stripping damage has not progressed significantly in either the
control or test sections. Finally, precipitation evaluations indicate that the Bearmounth-
Drummond site experienced rainfall levels 15 percent lower than normal over the course of this
evaluation project; this lack of moisture may have affected the results at this site.
Rocky Canyon site results: The Rocky Canyon test site (on I-90, near Bozeman)
includes a 1370-foot control section and a 1370-foot test section in the eastbound lane, separated
by a bridge. In the control section, 5 inches of stripped asphalt concrete was removed by milling.
The remaining asphalt concrete and part of the unbound aggregate base was mixed in-situ with
Portland cement to create a stabilized layer with a thickness of approximately 9.5 inches. The
control section overlay included 5 inches of polymer-modified plant-mix. For the test section,
the 0.5-inch OGFC was removed by milling, followed by a 3.5-inch overlay of polymer-
modified surface course.
The Impulse Stimulus Modulus evaluation indicated a slight overall trend toward
increased stiffness over the course of the project in both the control and test sections, although
there was a relatively high variability from one year to the next (i.e. an increase one year, a
Western Transportation Institute Page 77

Stripped Asphalt Final Report Pavement Performance
decrease the next). By contrast, Basin Curvature values changed very little at Rocky Canyon,
with very close results between the control and test sections. Roughness evaluations indicated
increased roughness over time; the roughness value was initially higher for the control section,
but by the last evaluation year, the values in the control and test sections were nearly equal. At
the Rocky Canyon site, rutting increased significantly from 1999 to 2000; however, the
difference in rutting between the control and test sections was not significant. Visual distress
evaluations indicated that the site is in good condition, with no evidence of fatigue cracking or
pothole formation, and all evidence of bleeding is low severity. However, the control section
experienced more transverse cracking than the test section: 9 full-width cracks for the control
section versus 1 full-width crack for the test section. Core evaluations suggest that stripping
damage has not progressed significantly in either the control or test sections. Precipitation
evaluations indicate that the Rocky Canyon site experienced rainfall levels 21 percent lower than
normal over the course of this evaluation project; this lack of moisture may have affected the
results at this site.
Finally, it is important to note that the Rocky Canyon site was the only site where the
control and test sections were separated by a bridge. The experimental sections were carefully
analyzed to determine whether the presence of a bridge had an impact on the results.
Researchers did not find a disproportionate amount of distress near the bridge, so its presence
was judged to be inconsequential.
Lincoln Road site results: The Lincoln Road-Sieben test site (on I-15, near Helena)
includes a 1320-foot control section and a 1320-foot test section in the northbound lane. In the
control section, 3 inches of stripped asphalt concrete was removed by milling, followed by an
overlay of 3.5 inches (half hot-recycled binder course and half polymer-modified surface course,
which included the process of hot recycling). In the test section, the 0.5-inch OGFC was
removed by milling and the overlay included approximately 1.5 inches of polymer-modified
asphalt, which was accomplished with hot recycling. Among the pavements in this experiment,
these were the only pavement sections that were surfaced with polymer-modified asphalt that
was uniquely accomplished with hot-recycling technology.
Western Transportation Institute Page 78
Stripped Asphalt Final Report Pavement Performance
Annual structural integrity evaluations (both Impulse Stimulus Modulus and Basin
Curvature) indicated a trend toward increased stiffness over time with very close results between
the control and test sections. Roughness evaluations indicated a slight decrease in roughness for
the control section, but an increase for the test section. The Lincoln Road site had the least
rutting (up to about 0.2 inches) of any of the test sites, with no significant difference between the
control and test sections. Visual distress evaluations indicated that the site is in good condition,
with no evidence of fatigue cracking or pothole formation, and all evidence of bleeding is low
severity. However, this site had the highest density of transverse cracks: 17 full-width cracks in
the control section and 24 full width cracks in the test section. Core evaluations suggest that
stripping damage has not progressed significantly in either the control or test sections. Finally,
precipitation evaluations indicate that during this experiment, the Lincoln Road site experienced
rainfall levels commensurate with pre-1994 averages.
Custer County site results: The Custer County Line West test site (on I-94, near Miles
City) includes a 1320-foot control section and a 1320-foot test section in the westbound lane. In
the control section, 3 inches of stripped asphalt was removed by milling, followed by an asphalt
overlay with thickness of almost 8 inches (3 inches of unmodified binder course, followed by 5
inches of polymer-modified surface course). In the test section, 0.5 inches of stripped OGFC was
removed by milling, followed by an overlay of approximately 5 inches of polymer-modified
asphalt plant mix.
Custer County was the only site where annual structural integrity evaluations (both
Impulse Stimulus Modulus and Basin Curvature) indicated that pavement stiffness decreased
steadily over the course of the project, in both the control and test sections. These results indicate
pavement deterioration. Roughness evaluations indicated an increase in roughness over time,
slightly more so for the test section than for the control section. At the Custer County site, rutting
increased significantly from 1999 to 2000, with the control section rutting more than the test
section. Visual distress evaluations indicated that the site is in good condition, with no evidence
of fatigue cracking or pothole formation, and all evidence of bleeding is low severity. Custer
County also had the lowest incidence of transverse cracking, with all cracks being low severity.
Core evaluations suggest that stripping damage has not progressed significantly in either the
Western Transportation Institute Page 79

Stripped Asphalt Final Report Pavement Performance
control or test sections. Finally, precipitation evaluations indicate that the Custer County site
experienced rainfall levels 23 percent lower than normal over the course of this evaluation
project; this lack of moisture may have affected the results at this site.
Tarkio East site results: The Tarkio East test site (on I-90, near Tarkio) includes a 1320-
foot control section and a 1320-foot test section in the eastbound lane. In the control section, 2.5
inches of stripped asphalt was removed by milling, followed by a 4-inch overlay (1.5 inches of
hot-recycled binder course, topped with 2.5 inches of polymer-modified surface course). In the
test section, 0.5 inches of stripped OGFC was removed by milling, followed by an overlay of
approximately 2.5 inches of polymer-modified surface course.
Annual structural integrity evaluations (both Impulse Stimulus Modulus and Basin
Curvature) indicated a trend toward increased stiffness over time. The ISM evaluation suggested
that the test section was slightly less stiff than the control section, but the Basin Curvature
evaluation produced very close results between the control and test sections. The International
Roughness Index was higher for the test section than the control section on all evaluation dates.
At the Tarkio site, rutting increased slightly, but with little significant difference between the
control and test sections. Visual distress evaluations indicated that the site is in good condition,
with no evidence of fatigue cracking or pothole formation, and only one transverse crack. The
Tarkio site was the only location to show some evidence of moderate severity bleeding. It was
also the only site where core evaluations suggested that significant stripping damage had
occurred: it appears that stripping damage had taken about 1 inch of the new asphalt concrete
placed during rehabilitation from both the control and test sections. Finally, precipitation
evaluations indicate that the Tarkio site experienced average rainfall 7 percent higher than pre-
1994 averages.
Western Transportation Institute Page 80
Stripped Asphalt Final Report Summary
7. Summary
1. This experiment compared the performance of two methods for rehabilitating stripped
asphalt concrete pavements: milling to remove most stripped material, followed by an
overlay, versus a simple overlay. Mill and overlay is the conventional rehabilitation
approach for the Montana Department of Transportation. In the simple overlay approach
used in this study, only the porous friction course material was removed from the pavement
surface; all the remaining stripped material was assumed to serve as a base course. Five sites
at various locations around the state were included in the study. These sites are referred to as
Bearmouth-Drummond, Rocky Canyon, Lincoln Road-Sieben, Custer County Line West,
and Tarkio-East. Rehabilitations were performed from 1995 to 1997 and the sites were
monitored until the year 2000.
2. The original pavements selected for this experiment included 4 to 6 inches of asphalt
concrete over 18 to 29 inches of crushed aggregate base. Bearmouth-Drummond and Rocky
Canyon were rehabilitated in 1995, Lincoln Road and Custer County were rehabilitated in
1996, and Tarkio was rehabilitated in 1997. The conventional rehabilitation approach
(control) involved milling 2.5 to 5 inches and typically placing 3.5 to 5 inches of new asphalt
concrete. As one exception, Custer County received 8 inches of new material because the
pre-rehabilitation structural evaluation found the pavement to be of marginal quality. The
second exception was Rocky Canyon, where 9.5 inches of cement-treated pulverized base
(CTPB) was placed prior to the overlay because projected traffic levels at this site were very
high. The simple overlay rehabilitation techniques involved placing 2 to 5 inches of new
asphalt concrete on top of the stripped asphalt concrete. All asphalt concrete placed during
rehabilitations contained lime for improved resistance to stripping.
3. Structural evaluations, provided by a falling-weight deflectometer, revealed that for most
sites, the structures increased in stiffness over time. Custer County, as the exception, showed
a steady decline in stiffness, but this trend was at least partially attributable to high testing
temperatures during the years 2000 and 2001. Structural evaluations at Rocky Canyon
showed high spatial variability for the control section, which included the CTPB layer.
Western Transportation Institute Page 81
Stripped Asphalt Final Report Summary
4. Roughness values (IRI) were generally lower for the control sections than for the test
sections. Roughness did not generally increase with time for either the control sections or the
test sections. Almost all IRI measurements were less than 80, which is considered by the
MDT to be borderline good to fair.
5. Rutting was monitored with a Rainhart Profilograph. There was not a consistent difference
between the performance of the control and test sections. The only statistically significant
difference in rutting between control and test sections occurred at Custer County, where the
control section rutted significantly more than the test section. A reasonable cause for the
higher rutting in the control section for this site could not be determined.
6. The predominant visual distress at the test sites was transverse cracking. By the year 2000,
all transverse cracks remained at a low severity level. With the exception of Rocky Canyon,
substantial differences between control and test sections were generally not observed. At
Rocky Canyon (year 2000) the control section contained nine full-width cracks while the test
section contained only one. The CTPB in this case appears to have worsened cracking
problems, possibly due to drying shrinkage. The Lincoln Road site had the highest overall
quantity of cracks: 17 for the control section and 24 for the test section. This site was the
most severely cracked prior to rehabilitation. Also, this was the only site where polymer-
modification of asphalt was used in conjunction with hot-mix recycling.
7. During the last year of visual inspections (year 2000), cores were removed from the
experimental pavement sections to inspect for stripping damage. With the exception of the
Tarkio site, stripping had not progressed significantly. At Tarkio, the newly placed asphalt
concrete had stripped from the bottom by a maximum of approximately 2 inches, thus
leaving a minimum of 2 inches of intact material in the control section and leaving a
minimum of about 0.75 inches of intact material in the test section. Tarkio was the only site
that experienced precipitation during the experiment that was high relative to normal, where
normal was defined as the average precipitation for the previous 13 years.
Western Transportation Institute Page 82
Stripped Asphalt Final Report Primary Conclusion
8. Primary Conclusion
Leaving stripped asphalt concrete surface material in place during rehabilitation, to be
overlayed with new asphalt concrete, did not tend to make the rehabilitated pavement more
susceptible to either stripping damage or load-induced damage. Also, in the case of
rehabilitating a pavement that had severe transverse temperature cracking, the removal of the top
2.5 to 5 inches of stripped material did not seem to substantially improve resistance to reflective
cracking. Milling and placement of new asphalt concrete in two lifts, however, did result in
slightly smoother pavements than the direct placement of a single-lift overlay (with only the very
thin removal of a porous friction course).
Western Transportation Institute Page 83
Stripped Asphalt Final Report Recommendations
9. Recommendations
1.
2.
3.
All sites should continue to be monitored, both structurally and visually. Although the
Lincoln Road and Tarkio sites experienced sufficient precipitation to permit conclusive
evidence for this study, the other three sites had relatively dry weather during the
experiment. Continued monitoring, through what will hopefully be wet years, will
provide additional information.
Continued structural monitoring for the Custer County site is of particular interest. This
site showed signs of structural deterioration for both the control and test sections. If
deterioration continues, the falling-weight deflectometer will have successfully identified
deterioration at its early stages.
Continued monitoring of stripping damage for the Tarkio site is of particular interest.
Both the control and the test section have experienced a significant and equal amount of
deterioration from the bottom of the newly-placed asphalt concrete. Because the test
section received a thinner overlay than the control section (2.5 inches versus 4 inches),
the test section has less intact material left near the surface (less than 1 in. in some cases).
The test section will, therefore, most likely show stripping damage at the pavement
surface before the control section. Life-cycle cost analyses, however, should consider
rate of stripping deterioration (in./year) to be the same for either rehabilitation technique
(i.e. either mill and overlay or simple overlay). Overlay thickness and mix design
methods for resisting stripping are the important factors for extending the life of a
rehabilitated stripped asphalt pavement.
Western Transportation Institute Page 84
Stripped Asphalt Final Report References
10. References
[AASHTO]. American Association of State Highway and Transportation Officials. Standard Specifications for Transportation Materials and Methods of Sampling and Testing: Part II (Tests), Washington, D.C., 2000.
Al-Swailmi, S. and Terrel, R.L. �Evaluation of Water Damage of Asphalt Concrete Mixtures Using the Environmental Conditioning System (ECS),� Journal of the Association of Asphalt Paving Technologists, Vol. 61, 1992.
Amirkhanian, S. N., and J. L. Burati, �A Study of Re-Use of Moisture Damaged Asphalt Mixtures,� Report No. FHWA-SC-92-05, South Carolina Department of Highways and Public Transportation, Columbia, South Carolina, September 1992.
Asphalt Institute, �Cause and Prevention of Stripping in Asphalt Pavements,� Educational Series No. 10 (ES-10), College Park, Maryland, 1981.
[ASTM]. American Society of Testing and Materials. Annual Book of ASTM Standards, Vol. 04.03, West Conshohocken, PA, 2000.
Brown, L. R., and G. S. Pabst, �The Contribution of Microorganisms to Stripping of Asphalt Pavements,� Final Report to Mississippi State Highway Department, MSHD-RD-88-89, Jackson, Mississippi, December 1988.
Bruce, B., �Evaluation of Test Methods to Predict Moisture Damage in Asphalt Concrete,� Report No. FHWA TS-90-039, Montana Department of Highways, Helena, Montana, January 1990.
Button, J. W., C. K. Estakhri, and D. N. Little, �How States Use Hot-in-Place Recycling,� Better Roads, July 1995, pp. 19-20.
Button, J. W., D. N. Little, and C. K. Estakhri, �Hot In-Place Recycling of Asphalt Concrete,� NCHRP Synthesis of Highway Practice 193, Transportation Research Board, National Research Council, Washington, D.C., 1994.
Canessa, W., �Facts You Need to Know about Cold-in-Place Recycling,� Better Roads, July 1995, pp. 21-22.
Das, B.M. 1990. Principles of Geotechnical Engineering, PWS-Kent Publishing Company, Boston, Massachusetts.
Epps, J. A., D. N. Little, R. J. Homgreen, and R. L. Terrel, �Guidelines for Recycling Pavement Materials,� NCHRP Report No. 224, Transportation Research Board, National Research Council, Washington, D.C., September 1980.
Western Transportation Institute Page 85

Stripped Asphalt Final Report References
Fanning, M., and M. Day, �Colorado Increases Structural Strength with 100% RAP Milling,�
Better Roads, July 1995, pp. 23-24.
Hicks, R. G., �Moisture Damage in Asphalt Concrete,� NCHRP Synthesis of Highway Practice 175, Transportation Research Board, National Research Council, Washington, D.C., October 1991.
Kandahl, P. S., �Moisture Susceptibility of HMA Mixes: Identification of Problem and Recommended Solutions,� NCAT Report 92-1, National Center for Asphalt Technology, Auburn University, May 1992.
Kandhal, P.S. and Rickards, I.J., �Premature Failure of Asphalt Overlays from Stripping: Case Histories,� NCAT Report No. 2001-1, National Center of Asphalt Technology, Auburn, AL, 2001.
Kennedy, T. W., F. L. Roberts, and K. W. Lee, �Evaluation of Moisture Effects on Asphalt Concrete Mixtures,� Transportation Research Record 911, Transportation Research Board, National Research Council, Washington, D.C., 1983.
Kiggundu, B. M., and F. L. Roberts, �Stripping in HMA Mixtures: State-of-the-Art and Critical Review of Test Methods,� NCAT Report 88-2, National Center for Asphalt Technology, Auburn University, September 1988.
Kolmogorov-Smirnov (test method), SPSS© for Windows, Release 10.0.7, SPSS Inc., Chicago, Il, 2000.
Krusmal-Wallis (test method), SPSS© for Windows, Release 10.0.7, SPSS Inc., Chicago, Il, 2000.
Lottman, R. P., �Predicting Moisture-Induced Damage to Asphaltic Concrete,� NCHRP Report No. 192, Transportation Research Board, National Research Council, Washington, D.C., 1978.
Lottman, R. P., �Predicting Moisture-Induced Damage to Asphaltic Concrete, Field Evaluation,� NCHRP Report No. 246, Transportation Research Board, National Research Council, Washington, D.C., May 1982.
Mann-Whitney (test method), SPSS© for Windows, Release 10.0.7, SPSS Inc., Chicago, Il, 2000.
Maupin, G. W., �Assessment of Stripped Asphalt Pavement,� Report No. FHWA/VA-89/14, Virginia Department of Transportation, Richmond, Virginia, January 1989.
[NCHRP]. National Cooperature Highway Research Program, �Moisture Damage in Asphalt Concrete,� NCHRP Project 20-5, Topic 19-09, Transportation Research Board, Washington, D.C., 1991.
Western Transportation Institute Page 86

Stripped Asphalt Final Report References
Western Transportation Institute Page 87
Parker, F., �Stripping of Asphalt Concrete: Physical Testing,� Report No. FHWA/AL-105A/88, State of Alabama Highway Department, Montgomery, Alabama, January 1987.
Ramamurti, K., and G. P. Jayaprakash, �Bacteria and Asphalt Stripping,� Report No. FHWA-KS-87/1, Kansas Department of Transportation, Topeka, Kansas, August 1987.
Ramamurti, K., and G. P. Jayaprakash, �Asphalt Stripping Bacteria,� Journal of Chemical Technology and Biotechnology, 1992, Vol. 54, pp. 171-174.
Rohde, G.T., "The Mechanistic Analysis of Pavement Deflections on Subgrades Varying in Stiffness with Depth," Dissertation, Texas A&M University, 1990.
Shapiro-Wilks (test method), SPSS© for Windows, Release 10.0.7, SPSS Inc., Chicago, Il, 2000.
Shatnawi, S., M. Nagarajaiah, and J. Harvey, �Moisture Sensitivity Evaluation of Binder-Aggregate Mixtures,� Pre-Print Paper No. 950108, Transportation Research Board, 1995.
[SHRP] Strategic Highway Research Program. 1993. �Distress Identification Manual for the Long-Term Pavement Performance Project,� SHRP-P-338, National Research Council, Washington, D.C.
[SHRP]. Strategic Highway Research Program. "The SUPERPAVE Mix Design System Manual of Specifications, Test Methods, and Practices," SHRP-A-379, National Research Council, Washington, D.C., 1994.
Tunnicliff, D. G., and R. E. Root, �Use of Antistripping Additives in Asphaltic Concrete Mixtures: Laboratory Phase,� NCHRP Report No. 274, Transportation Research Board, National Research Council, Washington, D.C., December 1984.
[USACE] U.S. Army Corps of Engineers, "Airfield Pavement Evaluation," TI 826-01/UFC 3-260-3, 2001.
[Wyoming SHD], Wyoming State Highway Department �Recycling of Asphaltic Concrete Pavements No.2,� Initial Report on Experimental Project, Cheyenne, Wyoming, 1995.
Yoon, H. H., and A. R. Tarrer, �Effect of Aggregate Properties on Stripping,� Transportation Research Record 1171, Transportation Research Board, National Research Council, Washington, D.C., 1988,