
REHABILITATION DESIGN METHODOLOGY FOR HAUL ROADS...
13
REHABILITATION DESIGN METHODOLOGY FOR HAUL ROADS ASSOCIATED WITH A WIND FARM DEVELOPMENT IN SOUTHWESTERN ONTARIO Ludomir Uzarowski, Ph.D., P.Eng., Principal, Golder Associates Ltd. Rabiah Rizvi, B.A.Sc., Pavement and Materials Engineering, Golder Associates Ltd. James D. Rodger, P.Eng., Principal, Golder Associates Ltd. Paper prepared for presentation at the Effects of Specialty Vehicles on Pavement Network Operation Session of the 2012 conference of the Transportation Association of Canada Fredericton, New Brunswick
Transcript of REHABILITATION DESIGN METHODOLOGY FOR HAUL ROADS...
REHABILITATION DESIGN METHODOLOGY FOR HAUL ROADS ASSOCIATED WITH A WIND FARM DEVELOPMENT IN
SOUTHWESTERN ONTARIO Ludomir Uzarowski, Ph.D., P.Eng., Principal, Golder Associates Ltd.
Rabiah Rizvi, B.A.Sc., Pavement and Materials Engineering, Golder Associates Ltd. James D. Rodger, P.Eng., Principal, Golder Associates Ltd.
Paper prepared for presentation at the
Effects of Specialty Vehicles on Pavement Network Operation Session
of the 2012 conference of the Transportation Association of Canada
Fredericton, New Brunswick
ABSTRACT
This paper describes the impact of very heavy vehicles carrying wind turbine components on haul roads and the rehabilitation design methodology that was used for the haul roads located in the Town of Lakeshore in Southwestern Ontario. A wind farm consisting of 72 turbines was constructed in the Town. For the construction of the wind farm, number of turbine components were hauled on a network of rural low-volume roads. The original design and construction of these low-volume roads did not take in to consideration the large wheel loads that would be applied by the wind farm haul traffic. Therefore, the Town of Lakeshore commissioned a study to accomplish the following:
• Establish baseline conditions of the roads along the proposed haul route; • Evaluate the pavement condition of the roads after the passage of the haul traffic; • Comparison of the baseline and post-haul pavement condition; and • Rehabilitation recommendations for the roads along the haul route.
Pavement condition is typically classified based on four criteria: visual distresses; structural capacity; safety (typically skid resistance); and roughness. For the purpose of this investigation only the first two criteria were used to characterize the condition of the pavement. A pavement condition survey was done for the roads along the haul route both before and after the haul traffic. The pavement structural condition was evaluated by carrying out Falling Weight Deflectometer (FWD) load/deflection testing. The FWD testing was carried out to determine the baseline structural capacity of the roads and subsequently to quantitatively determine the potential loss in structural capacity due to the haul traffic. FWD data was analyzed to determine the normalized deflection and pavement surface modulus. The normalized deflections were then utilized to determine the remaining life of the pavement.
Rehabilitation recommendations were provided for each section of roads along the haul route by combining visual distress observations and comparison of the baseline and post-haul pavement structural condition. The study found that although some of the haul roads experienced significant deterioration after the haul period, still others were found to have adequate bearing capacity and no significant development of visual distresses after the haul period had been completed.
1.0 INTRODUCTION
The Town of Lakeshore (the Town) is located in Essex County (County) in Southwestern Ontario and is comprised of predominantly rural population. The road network in the town consists of gravel, surface treated and flexible (asphalt) pavements which were designed for a relatively low volume of traffic. In 2011, a number of the roadways located in the Town were used for hauling number of wind turbine components for the construction of a wind farm consisting of 72 turbines. The original design and construction of these low-volume roads did not take in to consideration the large wheel loads that would be applied by the wind farm haul traffic. Therefore there was a potential for the roadways to experience a significant degree of damage due to the haul traffic which would result in a reduction in the usable life of the road. In order to quantify the extent of the damage and to determine the rehabilitation required to restore the roadway segments to pre-haul conditions the Town of Lakeshore commissioned a study to carry out the following tasks.
• Establish baseline conditions of the roads along the proposed haul route; • Evaluate the pavement condition of the roads after the passage of the haul traffic; • Comparison of the baseline and post-haul pavement condition; and • Rehabilitation recommendations for the roads along the haul route.
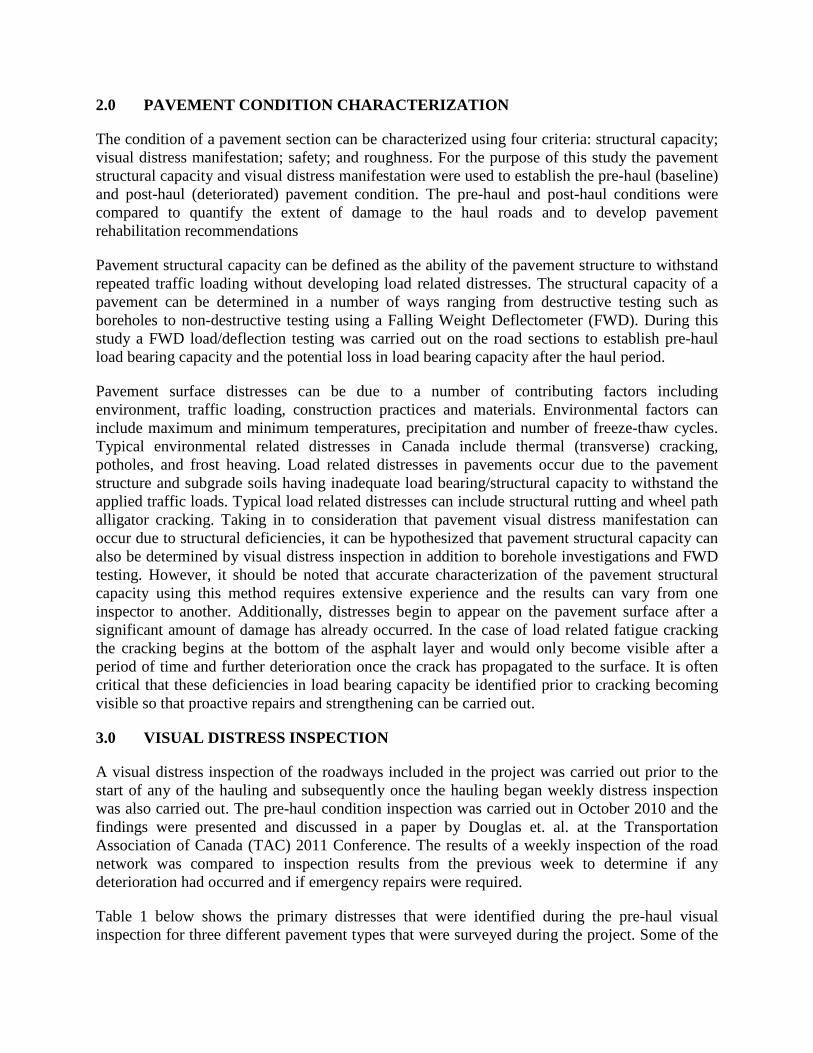
The portion of the road network that was included in the study was bounded to the north by Highway 401 and to the south by County Road 8. The study area is bordered to the east and west by the Town of Tilsbury and the Town of Essex, respectively. Figure 1 shows a map of the road network contained with the limits of the study section. The roads shown in red are County Roads that are managed are Essex County and the roadways shown in grey are roadways managed by the Town of Lakeshore. In general the roadways that are managed by the County tend to be higher traffic volume roads that the Town roads and have a higher structural capacity.
Figure 1 – Road Network within Project Limits
2.0 PAVEMENT CONDITION CHARACTERIZATION
The condition of a pavement section can be characterized using four criteria: structural capacity; visual distress manifestation; safety; and roughness. For the purpose of this study the pavement structural capacity and visual distress manifestation were used to establish the pre-haul (baseline) and post-haul (deteriorated) pavement condition. The pre-haul and post-haul conditions were compared to quantify the extent of damage to the haul roads and to develop pavement rehabilitation recommendations
Pavement structural capacity can be defined as the ability of the pavement structure to withstand repeated traffic loading without developing load related distresses. The structural capacity of a pavement can be determined in a number of ways ranging from destructive testing such as boreholes to non-destructive testing using a Falling Weight Deflectometer (FWD). During this study a FWD load/deflection testing was carried out on the road sections to establish pre-haul load bearing capacity and the potential loss in load bearing capacity after the haul period.
Pavement surface distresses can be due to a number of contributing factors including environment, traffic loading, construction practices and materials. Environmental factors can include maximum and minimum temperatures, precipitation and number of freeze-thaw cycles. Typical environmental related distresses in Canada include thermal (transverse) cracking, potholes, and frost heaving. Load related distresses in pavements occur due to the pavement structure and subgrade soils having inadequate load bearing/structural capacity to withstand the applied traffic loads. Typical load related distresses can include structural rutting and wheel path alligator cracking. Taking in to consideration that pavement visual distress manifestation can occur due to structural deficiencies, it can be hypothesized that pavement structural capacity can also be determined by visual distress inspection in addition to borehole investigations and FWD testing. However, it should be noted that accurate characterization of the pavement structural capacity using this method requires extensive experience and the results can vary from one inspector to another. Additionally, distresses begin to appear on the pavement surface after a significant amount of damage has already occurred. In the case of load related fatigue cracking the cracking begins at the bottom of the asphalt layer and would only become visible after a period of time and further deterioration once the crack has propagated to the surface. It is often critical that these deficiencies in load bearing capacity be identified prior to cracking becoming visible so that proactive repairs and strengthening can be carried out.
3.0 VISUAL DISTRESS INSPECTION
A visual distress inspection of the roadways included in the project was carried out prior to the start of any of the hauling and subsequently once the hauling began weekly distress inspection was also carried out. The pre-haul condition inspection was carried out in October 2010 and the findings were presented and discussed in a paper by Douglas et. al. at the Transportation Association of Canada (TAC) 2011 Conference. The results of a weekly inspection of the road network was compared to inspection results from the previous week to determine if any deterioration had occurred and if emergency repairs were required.
Table 1 below shows the primary distresses that were identified during the pre-haul visual inspection for three different pavement types that were surveyed during the project. Some of the
surface treated and flexible pavement road sections were displaying load relates longitudinal wheel path and alligator cracking prior to the hauling traffic beginning.
Table 1 – Primary Distresses Identified During Pre-Haul Pavement Visual Condition Inspection
Flexible Pavement Surface Treated Roads Gravel Roads 1. Raveling and coarse aggregate loss 2. Wheel track rutting 3. Distortion 4. Longitudinal track cracking 5. Longitudinal joint cracking 6. Pavement edge cracking 7. Transverse (thermal cracking)
1. Cover gravel Loss 2. Flushing 3. Potholing 4. Pavement edge cracking 5. Wheel track rutting 6. Distortion 7. Longitudinal (non wheel path) cracking 8. Pavement edge cracking 9. Alligator cracking
1. Loose gravel 2. Dust 3. Potholes 4. Washboarding 5. Distortion
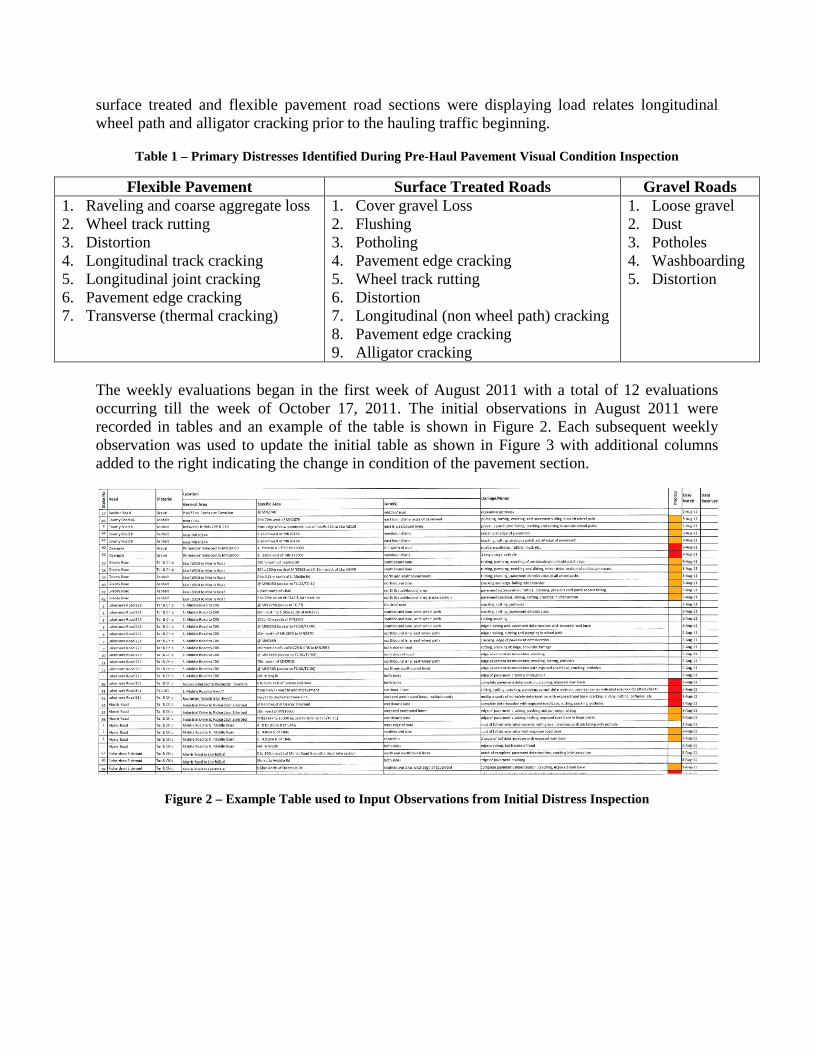
The weekly evaluations began in the first week of August 2011 with a total of 12 evaluations occurring till the week of October 17, 2011. The initial observations in August 2011 were recorded in tables and an example of the table is shown in Figure 2. Each subsequent weekly observation was used to update the initial table as shown in Figure 3 with additional columns added to the right indicating the change in condition of the pavement section.
Figure 2 – Example Table used to Input Observations from Initial Distress Inspection
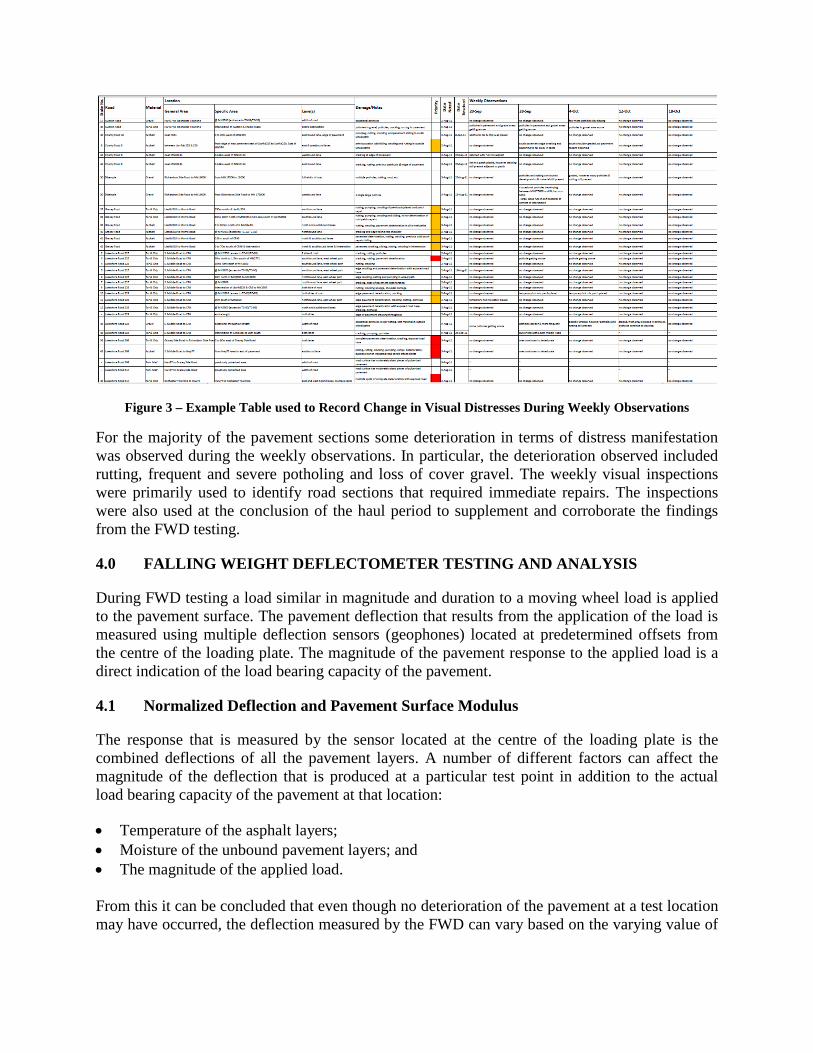
Figure 3 – Example Table used to Record Change in Visual Distresses During Weekly Observations
For the majority of the pavement sections some deterioration in terms of distress manifestation was observed during the weekly observations. In particular, the deterioration observed included rutting, frequent and severe potholing and loss of cover gravel. The weekly visual inspections were primarily used to identify road sections that required immediate repairs. The inspections were also used at the conclusion of the haul period to supplement and corroborate the findings from the FWD testing.
4.0 FALLING WEIGHT DEFLECTOMETER TESTING AND ANALYSIS
During FWD testing a load similar in magnitude and duration to a moving wheel load is applied to the pavement surface. The pavement deflection that results from the application of the load is measured using multiple deflection sensors (geophones) located at predetermined offsets from the centre of the loading plate. The magnitude of the pavement response to the applied load is a direct indication of the load bearing capacity of the pavement.
4.1 Normalized Deflection and Pavement Surface Modulus
The response that is measured by the sensor located at the centre of the loading plate is the combined deflections of all the pavement layers. A number of different factors can affect the magnitude of the deflection that is produced at a particular test point in addition to the actual load bearing capacity of the pavement at that location:
• Temperature of the asphalt layers; • Moisture of the unbound pavement layers; and • The magnitude of the applied load.
From this it can be concluded that even though no deterioration of the pavement at a test location may have occurred, the deflection measured by the FWD can vary based on the varying value of
the above three factors. In order for results to be comparable the measured deflections have to be normalized to a standard temperature, load and moisture condition.
At each test location varying loads, typically about 30, 40 and 50 kN, are applied to the pavement. The deflections measured by the central sensor are subsequently normalized to a standard load of 40 kN, the standard wheel load, by linear interpolation. The linear relationship for each test location is developed using the multiple load levels applied the pavement.
In addition to load normalization, the deflections are also normalized to a standard temperature of 21°C. Asphalt cement is a visco-elastic material whose elasticity changes depending on its temperature. When asphalt cement is hot is behaves more as a liquid and conversely when it is cold it behaves more like a solid. Due to this visco-elastic nature, deflection measured by the central sensor at a particular location can vary significantly depending on the temperature of the asphalt layer.
The moisture contained in the unbound granular layers and the subgrade soils can have a large impact on their bearing capacity. It is commonly believed that the time of year when the pavement is weakest is during the spring thaw when the granular layer and subgrade have the highest moisture content. This spring weakening can be taken in to account by adjusting the representative normalized deflection for a pavement section to spring conditions using a correction factor. However, this factor can vary depending on the time of year the testing was carried out, the severity of the prior winter, the type of subgrade soils and the site drainage characteristics.
4.2 Layer Moduli
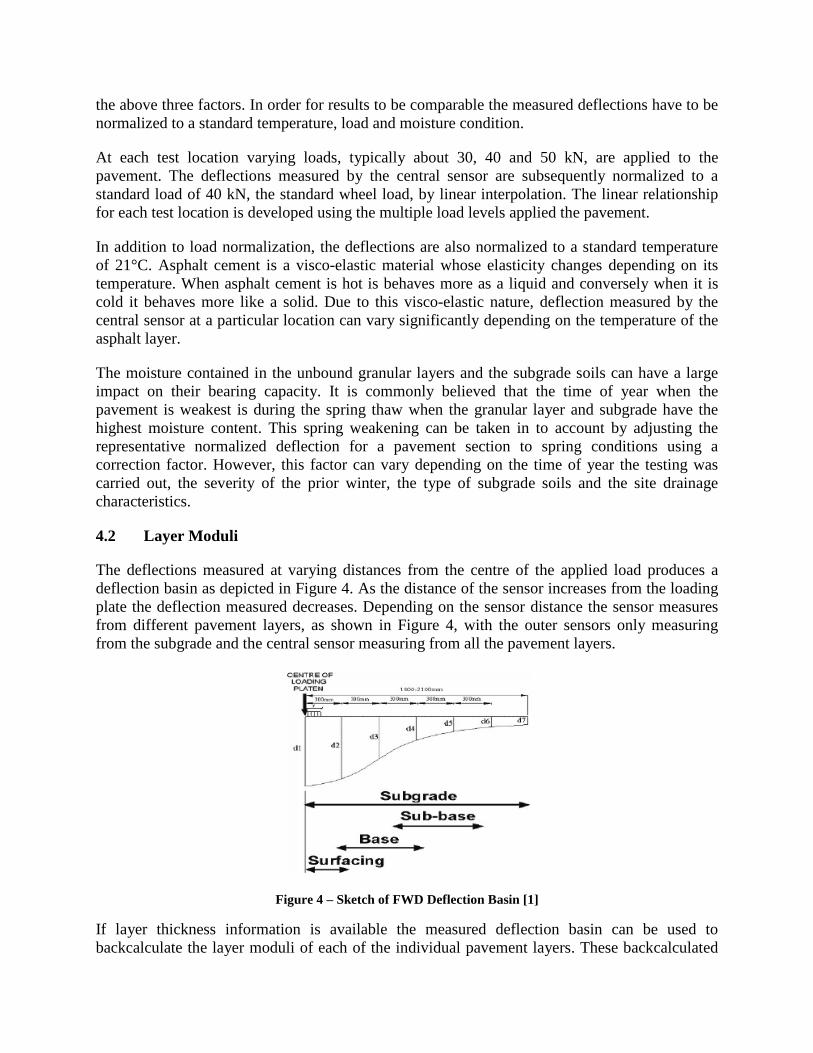
The deflections measured at varying distances from the centre of the applied load produces a deflection basin as depicted in Figure 4. As the distance of the sensor increases from the loading plate the deflection measured decreases. Depending on the sensor distance the sensor measures from different pavement layers, as shown in Figure 4, with the outer sensors only measuring from the subgrade and the central sensor measuring from all the pavement layers.
Figure 4 – Sketch of FWD Deflection Basin [1]
If layer thickness information is available the measured deflection basin can be used to backcalculate the layer moduli of each of the individual pavement layers. These backcalculated
layers moduli can subsequently be used to determine the critical stresses and strains developing in the pavement structure to determine its load bearing capacity.
5.0 PAVEMENT STRUCTURAL EVALUATION FOR WIND FARM PROJECT
5.1 FWD Testing
Each road section used for hauling wind farm components was tested initially for its baseline structural condition prior to the beginning of the haul. The baseline testing was carried out in October 2010 for some road sections and May 2011 for others. Following the hauling period, FWD testing was again carried out on the same road section in August 2011 and September 2011. On each road section testing was carried out at 200 m intervals and test points in adjacent lanes were staggered by 100 m. At each test points three load levels of about 30, 40 and 50 kN were applied to the pavement in addition to the seating drop. The deflections were measured by sensors located at 0, 200, 300, 500, 600, 900, 1200 and 1500 mm from the centre of the loading plate.
Table 2 shows the road sections in the network that were tested to evaluate their structural condition. The majority of the road sections that are managed by the Town are gravel surfaced with relatively lower traffic volumes. Conversely, the road sections that are managed by County are asphalt surfaced and have higher traffic volumes.
Table 2 – Listing of Road Sections that were Evaluated
County Roads Town Roads 1. County Road 8 - from County Road 27 to
1.08 km east of Lakeshore Road 22 2. County Road 8 - from 1.08 km east of
Lakeshore Road 245 to County Road 31 N 3. County Road 8 - from County Road 31 N
to Lakeshore Road 245 4. County Road 8 - from 2.4 km west of
Gracey Sideroad to Gracey Sideroad 5. County Road 31 - from County Road 8 to
South Middle Road 6. County Road 46 - from 620 m west of
Myers Road to Rochester Townline 7. County Road 46 - from Rochester
Townline to Highway 77 8. County Road 46 - from Highway 77 to
Gracey Sideroad 9. Gracey Sideroad - from County Road 8 to
South Middle Road 10. Gracey Sideroad - from South Middle
Road to County Road 46 11. Gracey Sideroad - from County Road 46 to
Morris Road
1. Lakeshore Road 225 - from County Road 8 to South Middle Road - Section 1
2. Lakeshore Road 229 - from County Road 8 to South Middle Road - Section 1
3. Lakeshore Road 309 - from Highway 77 to Gracey Sideroad
4. Lakeshore Road 310 - from Highway 77 to Gracey Sideroad
5. Morris Road - from Industrial Drive to Gracey Sideroad
6. Myers Road - from County Road 46 to North Middle Road
7. South Middle Road - from County Road 31 S to Rochester Townline
8. Lakeshore Road 225 - from County Road 8 to South Middle Road - Section 1
9. Lakeshore Road 229 f- from County Road 8 to South Middle Road - Section 2
10. South Middle Road - from Lakeshore Road 225 to Lakeshore Road 229
11. South Middle Road - from Lakeshore Road 229 to County Road 31 N
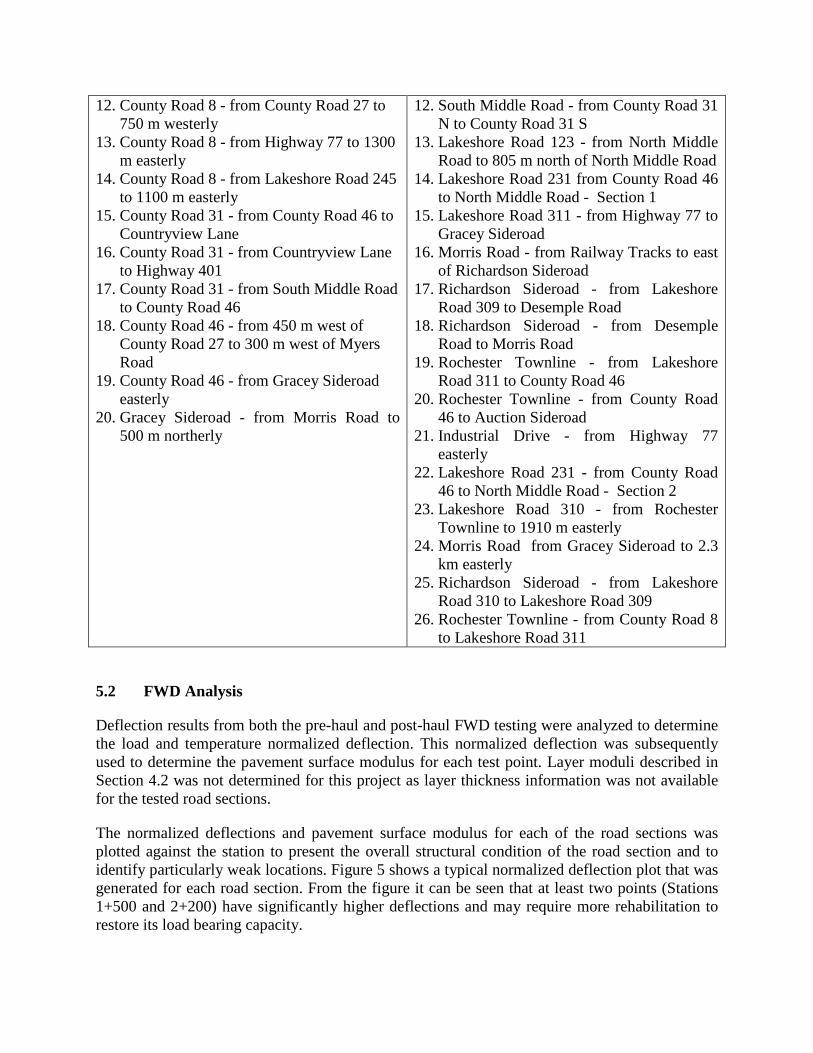
12. County Road 8 - from County Road 27 to 750 m westerly
13. County Road 8 - from Highway 77 to 1300 m easterly
14. County Road 8 - from Lakeshore Road 245 to 1100 m easterly
15. County Road 31 - from County Road 46 to Countryview Lane
16. County Road 31 - from Countryview Lane to Highway 401
17. County Road 31 - from South Middle Road to County Road 46
18. County Road 46 - from 450 m west of County Road 27 to 300 m west of Myers Road
19. County Road 46 - from Gracey Sideroad easterly
20. Gracey Sideroad - from Morris Road to 500 m northerly
12. South Middle Road - from County Road 31 N to County Road 31 S
13. Lakeshore Road 123 - from North Middle Road to 805 m north of North Middle Road
14. Lakeshore Road 231 from County Road 46 to North Middle Road - Section 1
15. Lakeshore Road 311 - from Highway 77 to Gracey Sideroad
16. Morris Road - from Railway Tracks to east of Richardson Sideroad
17. Richardson Sideroad - from Lakeshore Road 309 to Desemple Road
18. Richardson Sideroad - from Desemple Road to Morris Road
19. Rochester Townline - from Lakeshore Road 311 to County Road 46
20. Rochester Townline - from County Road 46 to Auction Sideroad
21. Industrial Drive - from Highway 77 easterly
22. Lakeshore Road 231 - from County Road 46 to North Middle Road - Section 2
23. Lakeshore Road 310 - from Rochester Townline to 1910 m easterly
24. Morris Road from Gracey Sideroad to 2.3 km easterly
25. Richardson Sideroad - from Lakeshore Road 310 to Lakeshore Road 309
26. Rochester Townline - from County Road 8 to Lakeshore Road 311
5.2 FWD Analysis
Deflection results from both the pre-haul and post-haul FWD testing were analyzed to determine the load and temperature normalized deflection. This normalized deflection was subsequently used to determine the pavement surface modulus for each test point. Layer moduli described in Section 4.2 was not determined for this project as layer thickness information was not available for the tested road sections.
The normalized deflections and pavement surface modulus for each of the road sections was plotted against the station to present the overall structural condition of the road section and to identify particularly weak locations. Figure 5 shows a typical normalized deflection plot that was generated for each road section. From the figure it can be seen that at least two points (Stations 1+500 and 2+200) have significantly higher deflections and may require more rehabilitation to restore its load bearing capacity.
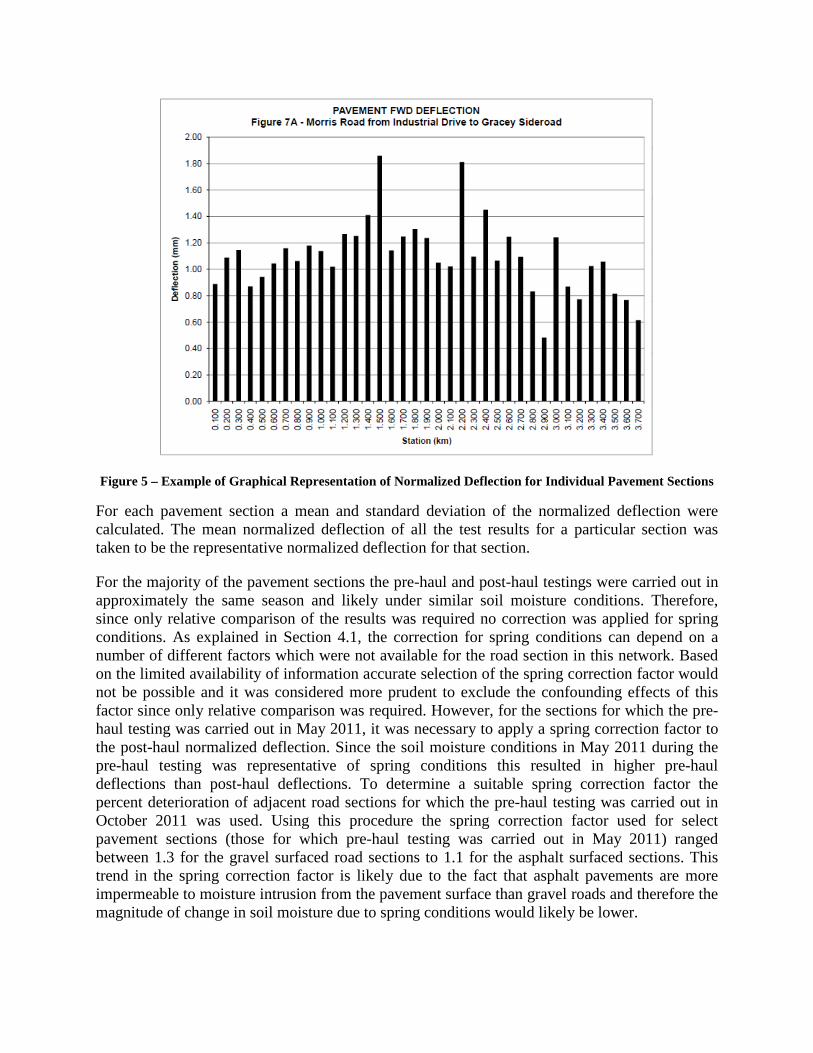
Figure 5 – Example of Graphical Representation of Normalized Deflection for Individual Pavement Sections
For each pavement section a mean and standard deviation of the normalized deflection were calculated. The mean normalized deflection of all the test results for a particular section was taken to be the representative normalized deflection for that section.
For the majority of the pavement sections the pre-haul and post-haul testings were carried out in approximately the same season and likely under similar soil moisture conditions. Therefore, since only relative comparison of the results was required no correction was applied for spring conditions. As explained in Section 4.1, the correction for spring conditions can depend on a number of different factors which were not available for the road section in this network. Based on the limited availability of information accurate selection of the spring correction factor would not be possible and it was considered more prudent to exclude the confounding effects of this factor since only relative comparison was required. However, for the sections for which the pre-haul testing was carried out in May 2011, it was necessary to apply a spring correction factor to the post-haul normalized deflection. Since the soil moisture conditions in May 2011 during the pre-haul testing was representative of spring conditions this resulted in higher pre-haul deflections than post-haul deflections. To determine a suitable spring correction factor the percent deterioration of adjacent road sections for which the pre-haul testing was carried out in October 2011 was used. Using this procedure the spring correction factor used for select pavement sections (those for which pre-haul testing was carried out in May 2011) ranged between 1.3 for the gravel surfaced road sections to 1.1 for the asphalt surfaced sections. This trend in the spring correction factor is likely due to the fact that asphalt pavements are more impermeable to moisture intrusion from the pavement surface than gravel roads and therefore the magnitude of change in soil moisture due to spring conditions would likely be lower.
The Asphalt Institute Manual Series Number 17 (MS-17) includes nomographs that can be used to determine the remaining ESALs that a pavement sections can withstand based on representative spring deflection for a section under static loading [2]. Deflections measured during FWD testing are by application of a dynamic load. Conversely, other non-destruction load/deflection measuring devices such as the Benkleman Beam measure deflection under static loading. The representative dynamic normalized deflection for each section was converted to an equivalent static normalized deflection using a conversion factor of 1.5.
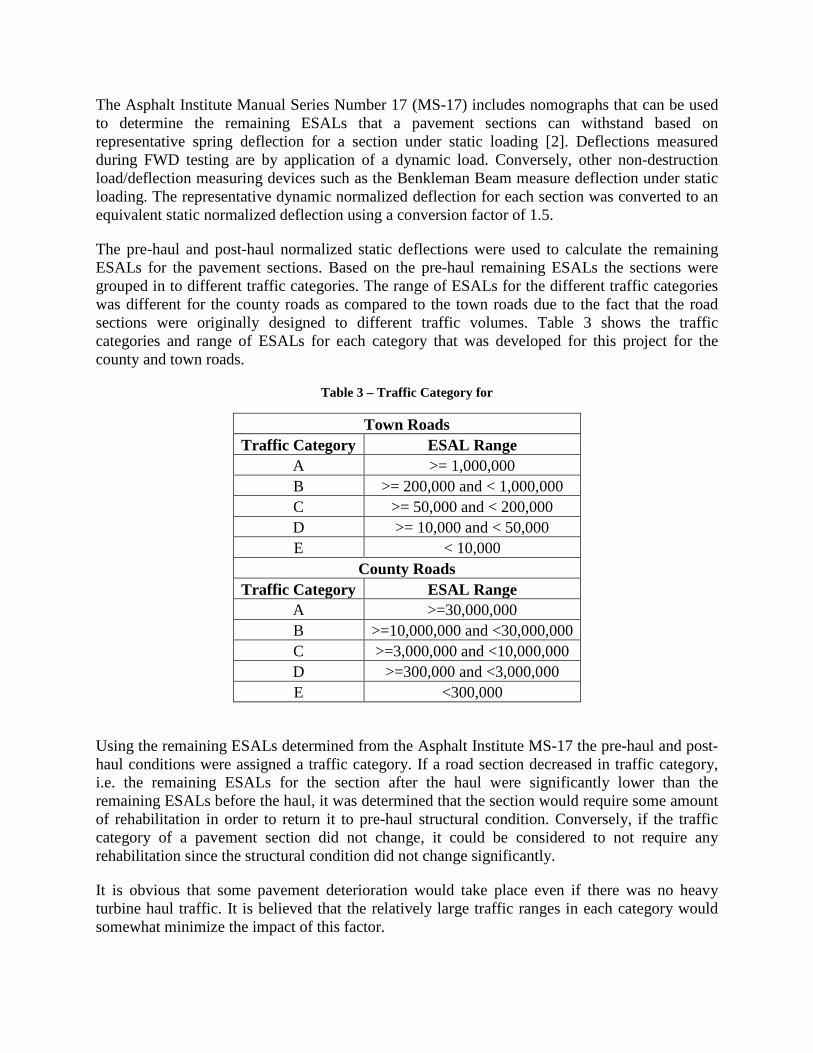
The pre-haul and post-haul normalized static deflections were used to calculate the remaining ESALs for the pavement sections. Based on the pre-haul remaining ESALs the sections were grouped in to different traffic categories. The range of ESALs for the different traffic categories was different for the county roads as compared to the town roads due to the fact that the road sections were originally designed to different traffic volumes. Table 3 shows the traffic categories and range of ESALs for each category that was developed for this project for the county and town roads.
Table 3 – Traffic Category for
Town Roads Traffic Category ESAL Range
A >= 1,000,000 B >= 200,000 and < 1,000,000 C >= 50,000 and < 200,000 D >= 10,000 and < 50,000 E < 10,000
County Roads Traffic Category ESAL Range
A >=30,000,000 B >=10,000,000 and <30,000,000 C >=3,000,000 and <10,000,000 D >=300,000 and <3,000,000 E <300,000
Using the remaining ESALs determined from the Asphalt Institute MS-17 the pre-haul and post-haul conditions were assigned a traffic category. If a road section decreased in traffic category, i.e. the remaining ESALs for the section after the haul were significantly lower than the remaining ESALs before the haul, it was determined that the section would require some amount of rehabilitation in order to return it to pre-haul structural condition. Conversely, if the traffic category of a pavement section did not change, it could be considered to not require any rehabilitation since the structural condition did not change significantly.
It is obvious that some pavement deterioration would take place even if there was no heavy turbine haul traffic. It is believed that the relatively large traffic ranges in each category would somewhat minimize the impact of this factor.
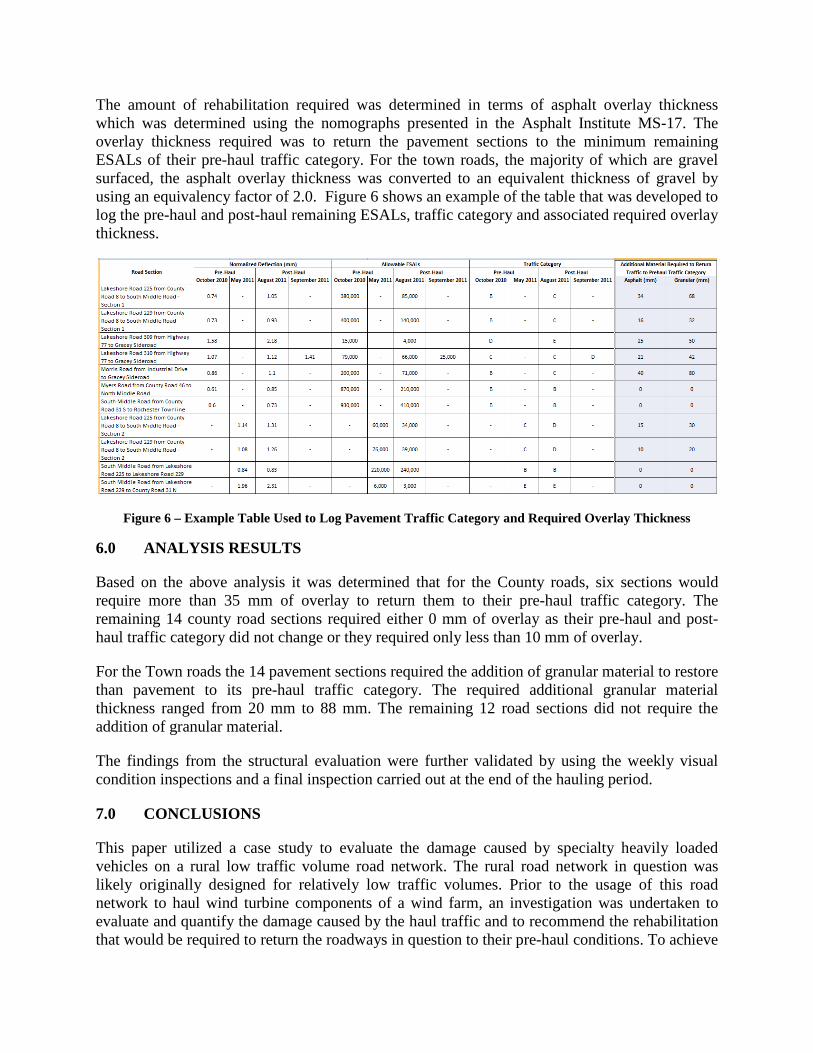
The amount of rehabilitation required was determined in terms of asphalt overlay thickness which was determined using the nomographs presented in the Asphalt Institute MS-17. The overlay thickness required was to return the pavement sections to the minimum remaining ESALs of their pre-haul traffic category. For the town roads, the majority of which are gravel surfaced, the asphalt overlay thickness was converted to an equivalent thickness of gravel by using an equivalency factor of 2.0. Figure 6 shows an example of the table that was developed to log the pre-haul and post-haul remaining ESALs, traffic category and associated required overlay thickness.
Figure 6 – Example Table Used to Log Pavement Traffic Category and Required Overlay Thickness
6.0 ANALYSIS RESULTS
Based on the above analysis it was determined that for the County roads, six sections would require more than 35 mm of overlay to return them to their pre-haul traffic category. The remaining 14 county road sections required either 0 mm of overlay as their pre-haul and post-haul traffic category did not change or they required only less than 10 mm of overlay.
For the Town roads the 14 pavement sections required the addition of granular material to restore than pavement to its pre-haul traffic category. The required additional granular material thickness ranged from 20 mm to 88 mm. The remaining 12 road sections did not require the addition of granular material.
The findings from the structural evaluation were further validated by using the weekly visual condition inspections and a final inspection carried out at the end of the hauling period.
7.0 CONCLUSIONS
This paper utilized a case study to evaluate the damage caused by specialty heavily loaded vehicles on a rural low traffic volume road network. The rural road network in question was likely originally designed for relatively low traffic volumes. Prior to the usage of this road network to haul wind turbine components of a wind farm, an investigation was undertaken to evaluate and quantify the damage caused by the haul traffic and to recommend the rehabilitation that would be required to return the roadways in question to their pre-haul conditions. To achieve
the goals of the investigation pavement condition was determined using the visual distresses and the structural of load bearing capacity of the pavement.
The visual condition of the pavement was initially evaluated for the entire network of haul roads prior to the haul period and then was subsequently evaluated each week to determine the change in visual distresses from one week to the next. These distress inspections were used to determine the immediate maintenance needs of the various roads to maintain driver safety. The weekly inspections were also used to validate the findings of the structural evaluation.
The structural condition of the pavement sections was determined using FWD load/deflection testing. FWD testing was first carried out for all the roadways prior to the hauling period and once the hauling was completed. The pre-haul and post-haul test results were analyzed and then compared to determine whether significant deterioration of the road sections had occurred. If the pavement sections were found to have deteriorated significantly, the amount of asphalt overlay or additional granular material required to return the pavement sections to their pre-haul conditions was determined.
The methods utilized during this investigation provided an economically feasible and timely method of determining how a road network is affected by a heavy traffic loads that it was not originally designed to withstand. Additionally, the investigation also recommended suitable rehabilitation options for the entire network in question in the absence of project level information.
REFERENCES
1. FHWA, “Geotechnical Aspects of Pavement Reference Manual: Chapter 4.0 Geotechnical Exploration and Testing” United States Department of Transportation – Federal Highway Administration, retrieved from http://www.fhwa.dot.gov/engineering/geotech/pubs /05037/04b.cfm, on April 5, 2012.
2. The Asphalt Institute “Asphalt Overlays for Highway and Street Rehabilitation”, Manual Series No. 17 (MS-17), Asphalt Institute, Lexington, KY, 2000.