Regulatory T cells in tumor-associated tertiary lymphoid ...
28
Regulatory T Cells in Tumor-Associated Tertiary Lymphoid Structures Suppress Anti-tumor T Cell Responses The MIT Faculty has made this article openly available. Please share how this access benefits you. Your story matters. Citation Joshi, Nikhil S. et al. “Regulatory T Cells in Tumor-Associated Tertiary Lymphoid Structures Suppress Anti-Tumor T Cell Responses.” Immunity 43.3 (2015): 579–590. As Published http://dx.doi.org/10.1016/j.immuni.2015.08.006 Publisher Elsevier/Cell Press Version Author's final manuscript Citable link http://hdl.handle.net/1721.1/105341 Terms of Use Creative Commons Attribution-NonCommercial-NoDerivs License Detailed Terms http://creativecommons.org/licenses/by-nc-nd/4.0/
Transcript of Regulatory T cells in tumor-associated tertiary lymphoid ...

Regulatory T Cells in Tumor-Associated Tertiary LymphoidStructures Suppress Anti-tumor T Cell Responses
The MIT Faculty has made this article openly available. Please share how this access benefits you. Your story matters.
Citation Joshi, Nikhil S. et al. “Regulatory T Cells in Tumor-AssociatedTertiary Lymphoid Structures Suppress Anti-Tumor T CellResponses.” Immunity 43.3 (2015): 579–590.
As Published http://dx.doi.org/10.1016/j.immuni.2015.08.006
Publisher Elsevier/Cell Press
Version Author's final manuscript
Citable link http://hdl.handle.net/1721.1/105341
Terms of Use Creative Commons Attribution-NonCommercial-NoDerivs License
Detailed Terms http://creativecommons.org/licenses/by-nc-nd/4.0/

Regulatory T cells in tumor-associated tertiary lymphoid structures suppress anti-tumor T cell responses
Nikhil S. Joshi1, Elliot H. Akama-Garren1, Yisi Lu1, Da-Yae Lee1, Gregory P. Chang1, Amy Li1, Michel DuPage1, Tuomas Tammela1, Natanya R. Kerper1, Anna F. Farago1, Rebecca Robbins1, Denise M. Crowley1, Roderick T. Bronson3, and Tyler Jacks1,2,§
1Koch Institute for Integrative Cancer Research and Department of Biology, Massachusetts Institute of Technology, Cambridge, MA 02142
2Howard Hughes Medical Institute, Massachusetts Institute of Technology, Cambridge, MA 02142
3Department of Pathology, Tufts University School of Medicine and Veterinary Medicine, North Grafton, Massachusetts 01536, USA
4Cancer Center and Department of Pathology, Massachusetts General Hospital, Boston, MA 02114
SUMMARY
Infiltration of regulatory T (Treg) cells into many tumor types correlates with poor patient
prognoses. However, mechanisms of intratumoral Treg cell function remain to be elucidated. We
investigated Treg cell function in a genetically-engineered mouse lung adenocarcinoma model and
found Treg cells suppress anti-tumor responses in tumor-associated tertiary lymphoid structures
(TA-TLS). TA-TLS have been described in human lung cancers, but their function remains to be
determined. TLS in this model were spatially associated with >90% of tumors and facilitated
interactions between T cells and tumor-antigen presenting dendritic cells (DCs). Costimulatory
ligand expression by DCs and T cell proliferation rates increased in TA-TLS upon Treg cell
depletion, leading to tumor destruction. Thus, we propose Treg cells in TA-TLS can inhibit
endogenous immune responses against tumors, and targeting these cells may provide therapeutic
benefit for cancer patients.
INTRODUCTION
Non-small cell lung cancer (NSCLC), including lung adenocarcinoma, accounts for ~25% of
all cancer deaths (Jemal et al., 2010), and, despite improvements in therapy, NSCLC
mortality remains around 80% (http://seer.cancer.gov/statfacts/html/lungb.html).
Immunotherapy uses the immune system to attack cancer and has demonstrated durable
tumor regression in “immunogenic” tumor types like melanoma (Pardoll, 2012). Yet, until
§CONTACT Author for correspondence: [email protected].
Author ContributionN.S.J. and T.J. designed the study, and N.S.J. wrote the manuscript. N.S.J., E.H.A-G., Y.L., D-Y.L., G.P.C., A.L., R.R., D.M.C., and A.F.F. generated primary data. M.D. initiated the project. T.T. and N.R.K. established the CLARITY method in the laboratory. R.T.B. graded tumors. T.J. supervised data analysis and experiments.
HHS Public AccessAuthor manuscriptImmunity. Author manuscript; available in PMC 2016 April 09.
Published in final edited form as:Immunity. 2015 September 15; 43(3): 579–590. doi:10.1016/j.immuni.2015.08.006.
Author M
anuscriptA
uthor Manuscript
Author M
anuscriptA
uthor Manuscript

recently, NSCLC was considered “non-immunogenic” because tumors responded poorly to
immunotherapeutics (Raez et al., 2005). Furthermore, it was thought that lung tumors might
not elicit strong endogenous T cell responses compared to melanoma, even though these
tumor types had similar numbers of mutations and predicted neoantigens (Rajasagi et al.,
2014; Vogelstein et al., 2013). The recent success of immune checkpoint inhibitors in
NSCLC patients demonstrates that anti-tumor T cell responses do exist in a significant
fraction of lung cancer patients, but they are functionally inhibited by poorly understood
immunosuppressive mechanisms (Pardoll, 2012). Overcoming these mechanisms will be
essential for generating more effective immunotherapies for this disease.
Regulatory T cell (Treg) deficiency, through mutation or deletion of the X-linked Forkhead
box P3 (Foxp3) gene, leads to a fatal lymphoproliferative disease (Josefowicz et al., 2012).
However, Treg cells may also facilitate tumor progression by suppressing adaptive immunity
against tumors. Treg cell depletion in transplantable, carcinogen-induced, and autochthonous
tumor models demonstrates increased anti-tumor immune responses, even against previously
established tumors, which results in reductions in tumor size (Sakaguchi, 2004; Bos et al.,
2013; Teng et al., 2010). Yet, many questions remain about how and where Treg cells
function in the context of developing tumors.
Treg cells suppress self-reactive T cells in secondary lymphoid organs (SLOs; e.g. lymph
nodes (LNs) and spleen). Similarly, Treg cells can suppress anti-tumor responses in tumor-
draining LNs (Boissonnas et al., 2010; Campbell and Koch, 2011). However, Treg cells
inside tumor tissues might also be important in natural tumor progression. Treg cells are
often enriched in tumor tissue, and a high ratio of intratumoral Treg cells to effector T cells
generally predicts poor patient outcomes (Fridman et al., 2012). Furthermore, the ability of
anti-CTLA-4 antibodies to deplete intratumoral, but not LN, Treg cells is critical for their
efficacy in animal cancer models (Marabelle et al., 2013; Selby et al., 2013; Simpson et al.,
2013). However, while previous data suggest that intratumoral Treg cells promote tumor
development, the mechanisms by which they do so remain to be fully determined.
In patients, across cancer types, lymphocytes can be found in LN-like, large, complex
tumor-associated tertiary lymphoid structures (TA-TLS; Fridman et al., 2012; Goc et al.,
2013). Amongst patients with early-stage NSCLC, ~70% have TA-TLS, which contain
immune cells with an activated phenotype, similar to TLS observed after viral infection
(Neyt et al., 2012; de Chaisemartin et al., 2011; Dieu-Nosjean et al., 2008). TA-TLS
presence also correlates with increased overall survival. Thus, it is thought that TA-TLS
promote anti-tumor responses. However, TA-TLS have not been described in animal models
and their proposed functions have not been experimentally tested. It is also uncertain
whether immunosuppressive pathways are active in TA-TLS.
Genetically-engineered mouse models (GEMMs) of cancer have greatly informed
understanding of tumor biology and therapy (Hayes et al., 2014; Kwon and Berns, 2013).
Tumors in GEMMs develop from untransformed cells in their native microenvironment, and,
importantly, in the presence of a fully functional immune system. However, tumors in
GEMMs are often poorly immunogenic and, consequentially, the use of GEMMs for tumor
immunology studies has lagged (DuPage and Jacks, 2013). We previously programmed
Joshi et al. Page 2
Immunity. Author manuscript; available in PMC 2016 April 09.
Author M
anuscriptA
uthor Manuscript
Author M
anuscriptA
uthor Manuscript
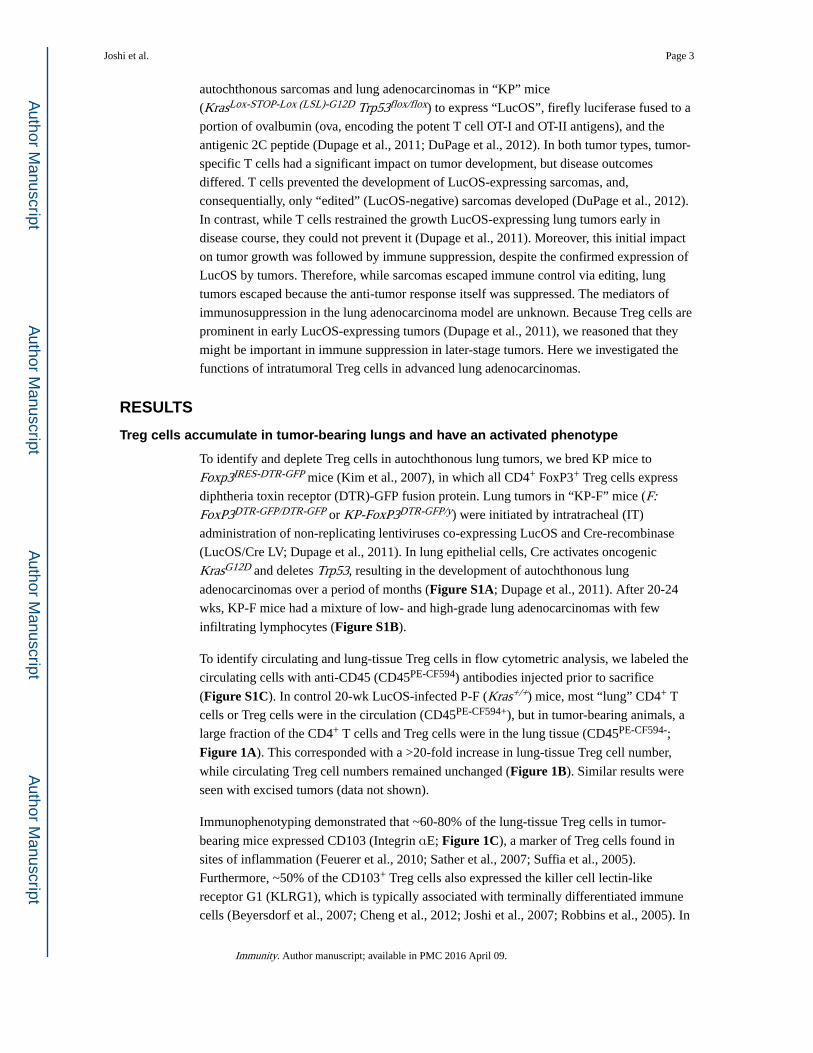
autochthonous sarcomas and lung adenocarcinomas in “KP” mice
(KrasLox-STOP-Lox (LSL)-G12D Trp53flox/flox) to express “LucOS”, firefly luciferase fused to a
portion of ovalbumin (ova, encoding the potent T cell OT-I and OT-II antigens), and the
antigenic 2C peptide (Dupage et al., 2011; DuPage et al., 2012). In both tumor types, tumor-
specific T cells had a significant impact on tumor development, but disease outcomes
differed. T cells prevented the development of LucOS-expressing sarcomas, and,
consequentially, only “edited” (LucOS-negative) sarcomas developed (DuPage et al., 2012).
In contrast, while T cells restrained the growth LucOS-expressing lung tumors early in
disease course, they could not prevent it (Dupage et al., 2011). Moreover, this initial impact
on tumor growth was followed by immune suppression, despite the confirmed expression of
LucOS by tumors. Therefore, while sarcomas escaped immune control via editing, lung
tumors escaped because the anti-tumor response itself was suppressed. The mediators of
immunosuppression in the lung adenocarcinoma model are unknown. Because Treg cells are
prominent in early LucOS-expressing tumors (Dupage et al., 2011), we reasoned that they
might be important in immune suppression in later-stage tumors. Here we investigated the
functions of intratumoral Treg cells in advanced lung adenocarcinomas.
RESULTS
Treg cells accumulate in tumor-bearing lungs and have an activated phenotype
To identify and deplete Treg cells in autochthonous lung tumors, we bred KP mice to
Foxp3IRES-DTR-GFP mice (Kim et al., 2007), in which all CD4+ FoxP3+ Treg cells express
diphtheria toxin receptor (DTR)-GFP fusion protein. Lung tumors in “KP-F” mice (F: FoxP3DTR-GFP/DTR-GFP or KP-FoxP3DTR-GFP/y) were initiated by intratracheal (IT)
administration of non-replicating lentiviruses co-expressing LucOS and Cre-recombinase
(LucOS/Cre LV; Dupage et al., 2011). In lung epithelial cells, Cre activates oncogenic
KrasG12D and deletes Trp53, resulting in the development of autochthonous lung
adenocarcinomas over a period of months (Figure S1A; Dupage et al., 2011). After 20-24
wks, KP-F mice had a mixture of low- and high-grade lung adenocarcinomas with few
infiltrating lymphocytes (Figure S1B).
To identify circulating and lung-tissue Treg cells in flow cytometric analysis, we labeled the
circulating cells with anti-CD45 (CD45PE-CF594) antibodies injected prior to sacrifice
(Figure S1C). In control 20-wk LucOS-infected P-F (Kras+/+) mice, most “lung” CD4+ T
cells or Treg cells were in the circulation (CD45PE-CF594+), but in tumor-bearing animals, a
large fraction of the CD4+ T cells and Treg cells were in the lung tissue (CD45PE-CF594-;
Figure 1A). This corresponded with a >20-fold increase in lung-tissue Treg cell number,
while circulating Treg cell numbers remained unchanged (Figure 1B). Similar results were
seen with excised tumors (data not shown).
Immunophenotyping demonstrated that ~60-80% of the lung-tissue Treg cells in tumor-
bearing mice expressed CD103 (Integrin αE; Figure 1C), a marker of Treg cells found in
sites of inflammation (Feuerer et al., 2010; Sather et al., 2007; Suffia et al., 2005).
Furthermore, ~50% of the CD103+ Treg cells also expressed the killer cell lectin-like
receptor G1 (KLRG1), which is typically associated with terminally differentiated immune
cells (Beyersdorf et al., 2007; Cheng et al., 2012; Joshi et al., 2007; Robbins et al., 2005). In
Joshi et al. Page 3
Immunity. Author manuscript; available in PMC 2016 April 09.
Author M
anuscriptA
uthor Manuscript
Author M
anuscriptA
uthor Manuscript

contrast, the presence of tumors did not affect CD103 and KLRG1 expression by Treg cells
in the lung circulation, tumor-draining mediastinal LN (mLN), and control inguinal LN
(iLN ;Figure 1C). CD103+ KLRG1+ double positive (DP) Treg cells expressed high
amounts of several additional molecules previously associated with activated Treg cells,
including two markers of T cell activation, CD44 and CD69, and the ectonucleotidase CD39
(Figure 1D). DP Treg cells also expressed high amounts of the IL-2 high-affinity receptor,
IL-2Rα (CD25) as well as the immunoinhibitory receptor PD-1 (Figure 1D). The expression
of these markers by DP Treg cells was higher than CD103+ KLRG1− single positive (SP) or
CD103− KLRG1− double negative (DN) Treg cells in the lung tissue (Figure 1D). Treg cells
in lung tissue also expressed higher amounts of CTLA-4 than Treg cells in the mLN (Figure 1E). Together these data suggest that tumor-infiltrating Treg cells exhibit an activated
phenotype, similar to Treg cells found at sites of inflammation. As few Treg cells with this
phenotype were observed in the draining LN, it is likely that Treg cells acquired their
activated phenotype within the tumor-bearing lung.
Treg cells actively suppress anti-tumor responses targeting established lung adenocarcinomas
We next assessed the effect of Treg cell depletion on tumors in KP-F mice. Two
intraperitoneal (IP) injections of DT (50ug/g) into tumor-bearing (~18-20 wks post infection,
pi) or non-tumor-bearing KP-F mice efficiently eliminated Treg cells in the lungs and
lymphoid tissues (Figure 2A and S2A-B). However, FoxP3DTR mice, but not FoxP3WT
mice, became moribund within ~2-3 weeks of depletion, requiring sacrifice (Figure S2C).
Additionally, in tumor-bearing KP-Foxp3DTR-GFP/+ (KP-F/+) mice, in which only 50% of all
Treg cells express DTR-GFP due to X-inactivation (Figure S2D), DT treatment did not
cause morbidity (data not shown). Therefore, the observed morbidity was caused by an
autoimmune response triggered by transient Treg cell depletion and was not a side effect of
DT treatment. Consistent with this, 12 days post depletion most T cells in KP-F mice, but
not KP-F/+ mice, were activated (CD44hi) and mice had dramatic lymphadenopathy and
splenomegaly, with lymphocytic infiltration in several tissues throughout the body (Figure S2E-H; Kim et al., 2007). Of note, regardless of tumor status, we observed lymphocytic
infiltration near the major airways in the lungs of Treg cell-depleted mice, accompanied by
goblet cell metaplasia, similar to what is seen in FoxP3-deficient mice (Figure S2I-J; Lin et
al., 2005). However, in non-tumor bearing animals, the alveolar spaces in the lungs (where
tumors normally develop) were free from infiltration.
To track tumor cell fate after Treg cell depletion, KP-F mice were bred to
Rosa26LSL-tdTomato(tdT) mice to generate “KPT-F” mice, in which Cre induces tdT
expression in tumor cells (Figure S1A; Madisen et al., 2010). Immunofluorescence (IF)
staining of tumors from untreated ~20wk KPT-F mice demonstrated they were composed of
abundant, healthy-appearing tdT+ tumor cells that were arranged primarily in papillary
structures with EpCAM staining junctions between adjacent tumor cells (Figure 2B). In
contrast, day-12 Treg cell-depleted tumors had a range of cellular infiltration and disruption
of regular tissue architecture (Figure 2B). Quantification of 85 control and 108 Treg cell-
depleted tumors showed >80% of the Treg cell-depleted tumors had moderate or severe
disruption (Figure 2C). To visualize tumor destruction more comprehensively, we
Joshi et al. Page 4
Immunity. Author manuscript; available in PMC 2016 April 09.
Author M
anuscriptA
uthor Manuscript
Author M
anuscriptA
uthor Manuscript

performed CLARITY (Chung et al., 2013) on lungs from control and Treg cell-depleted
KPT-F mice. This allowed whole tumor 3-dimensional (3-D) confocal imaging of 15 control
and 10 Treg cell-depleted tumors. Tumors from the Treg cell-depleted mice showed
extensive cellular infiltration (Figure 2D and Movie S1), and contained cavities filled with
densely packed (non-tumor) cells. Furthermore, tumor cells in the Treg cell-depleted mice
were thin and elongated and no longer formed connections with adjacent tumor cells
(Figure 2B and 2D). These data demonstrate that the cellular density and morphology of
tumors were severely disrupted by Treg cell depletion.
Immunohistochemical (IHC) analysis showed that most of the infiltrating cells in Treg cell-
depleted tumors were CD45+ immune cells (Figure 2E). Infiltration was highly focused in
the areas near tumors, as distal areas were free of immune infiltrates (Figure S3A). Immune
infiltration was not observed in tumors from Treg cell-depleted KPT-F/+ mice, indicating
that depletion of more than half of the Treg cell population was required for anti-tumor
effects (Figure S3B). FACS analysis revealed the number of CD4+ and CD8+ T cells in the
lung increased after Treg cell depletion (Figure 2F). In contrast, B cell number was not
increased. IF analyses showed that in undepleted mice, CD3+ T cells in tumors were
primarily located within or near blood vessels, and CD11c+ macrophages were located
within airway-like pockets surrounded by tumor cells (Figure S4AB). In contrast, in the
absence of Treg cells, CD4+ and CD8+ T cells were located throughout the tumor
parenchyma (Figure 2G), and tumors were heavily infiltrated by macrophages that were
faintly positive for tdT (Figure 2H). Moreover, a small number of macrophages had tdT+
vesicles, suggesting phagocytosis of tumor cells. Together, these data demonstrate that Treg
cells actively suppress immune destruction of established tumors.
Lung-tissue Treg cells are contained within tumor-associated tertiary lymphoid structures
We next investigated Treg cell localization in tumor-bearing lungs. Tumors in 20-wk KP-F
mice had few infiltrating Treg cells and, instead, most Treg cells (>80-fold increase) were
located in perivascular immune cell patches resembling TLS (Figure 3A and B). These
structures also contained CD11c+ dendritic cells (DCs) and B220+ B cells, two cell types
that have the potential to interact directly with Treg cells (Figure 3C). TA-TLS have been
observed in patients with lung adenocarcinoma (Fridman et al., 2012), but not in animal
tumor models. Therefore, we quantified the extent to which TLS were associated with
tumors in this model and identified whether they displayed features of TA-TLS in human
cancers.
Because tumors span several hundred microns, we reasoned that analyses of thin (5 μm)
lung sections might underestimate the presence of TLS in tumor-bearing lungs. Therefore,
we quantified the presence of TLS in 30 μm thick sections of tumor-bearing lungs from 8
mice and counted the number of tumors that were associated with TLS in three in silico-
reconstructed tumor-bearing lung lobes (Figure 3D). Analysis of the 30 μm sections
revealed ~60% (18/31) of tumors were directly associated with at least one TLS (defined as
B cell clusters of >10 cells directly associated with T cells), and analysis of the in silico reconstructed lungs showed at least one TLS associated with ~93% (70/75) of tumors
analyzed (data not shown).
Joshi et al. Page 5
Immunity. Author manuscript; available in PMC 2016 April 09.
Author M
anuscriptA
uthor Manuscript
Author M
anuscriptA
uthor Manuscript
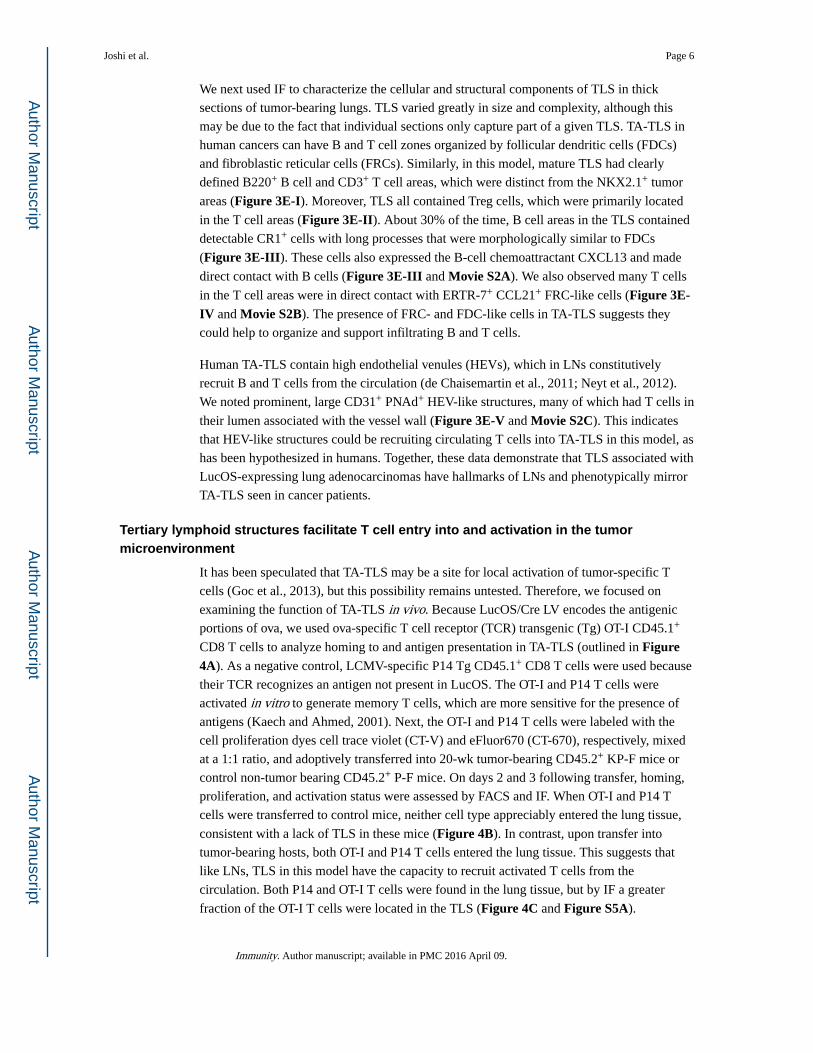
We next used IF to characterize the cellular and structural components of TLS in thick
sections of tumor-bearing lungs. TLS varied greatly in size and complexity, although this
may be due to the fact that individual sections only capture part of a given TLS. TA-TLS in
human cancers can have B and T cell zones organized by follicular dendritic cells (FDCs)
and fibroblastic reticular cells (FRCs). Similarly, in this model, mature TLS had clearly
defined B220+ B cell and CD3+ T cell areas, which were distinct from the NKX2.1+ tumor
areas (Figure 3E-I). Moreover, TLS all contained Treg cells, which were primarily located
in the T cell areas (Figure 3E-II). About 30% of the time, B cell areas in the TLS contained
detectable CR1+ cells with long processes that were morphologically similar to FDCs
(Figure 3E-III). These cells also expressed the B-cell chemoattractant CXCL13 and made
direct contact with B cells (Figure 3E-III and Movie S2A). We also observed many T cells
in the T cell areas were in direct contact with ERTR-7+ CCL21+ FRC-like cells (Figure 3E-IV and Movie S2B). The presence of FRC- and FDC-like cells in TA-TLS suggests they
could help to organize and support infiltrating B and T cells.
Human TA-TLS contain high endothelial venules (HEVs), which in LNs constitutively
recruit B and T cells from the circulation (de Chaisemartin et al., 2011; Neyt et al., 2012).
We noted prominent, large CD31+ PNAd+ HEV-like structures, many of which had T cells in
their lumen associated with the vessel wall (Figure 3E-V and Movie S2C). This indicates
that HEV-like structures could be recruiting circulating T cells into TA-TLS in this model, as
has been hypothesized in humans. Together, these data demonstrate that TLS associated with
LucOS-expressing lung adenocarcinomas have hallmarks of LNs and phenotypically mirror
TA-TLS seen in cancer patients.
Tertiary lymphoid structures facilitate T cell entry into and activation in the tumor microenvironment
It has been speculated that TA-TLS may be a site for local activation of tumor-specific T
cells (Goc et al., 2013), but this possibility remains untested. Therefore, we focused on
examining the function of TA-TLS in vivo. Because LucOS/Cre LV encodes the antigenic
portions of ova, we used ova-specific T cell receptor (TCR) transgenic (Tg) OT-I CD45.1+
CD8 T cells to analyze homing to and antigen presentation in TA-TLS (outlined in Figure 4A). As a negative control, LCMV-specific P14 Tg CD45.1+ CD8 T cells were used because
their TCR recognizes an antigen not present in LucOS. The OT-I and P14 T cells were
activated in vitro to generate memory T cells, which are more sensitive for the presence of
antigens (Kaech and Ahmed, 2001). Next, the OT-I and P14 T cells were labeled with the
cell proliferation dyes cell trace violet (CT-V) and eFluor670 (CT-670), respectively, mixed
at a 1:1 ratio, and adoptively transferred into 20-wk tumor-bearing CD45.2+ KP-F mice or
control non-tumor bearing CD45.2+ P-F mice. On days 2 and 3 following transfer, homing,
proliferation, and activation status were assessed by FACS and IF. When OT-I and P14 T
cells were transferred to control mice, neither cell type appreciably entered the lung tissue,
consistent with a lack of TLS in these mice (Figure 4B). In contrast, upon transfer into
tumor-bearing hosts, both OT-I and P14 T cells entered the lung tissue. This suggests that
like LNs, TLS in this model have the capacity to recruit activated T cells from the
circulation. Both P14 and OT-I T cells were found in the lung tissue, but by IF a greater
fraction of the OT-I T cells were located in the TLS (Figure 4C and Figure S5A).
Joshi et al. Page 6
Immunity. Author manuscript; available in PMC 2016 April 09.
Author M
anuscriptA
uthor Manuscript
Author M
anuscriptA
uthor Manuscript

Furthermore, OT-I T cells were observed interacting with DCs in the T cell areas of the TLS
(Figure 4D). To determine whether these contacts were functionally relevant, we assessed
whether OT-I and P14 T cells form immunologic synapses in vivo with DCs. Sections were
stained with γ-tubulin (a marker of the microtubule organizing center, MTOC) and CD11c,
and immunologic synapses were quantified based on MTOC position and interaction with a
DC (Figure S5B). In cells forming synapses, the MTOC is repositioned to lie behind the
synapse, and as such, can be used to determine the direction a T cell is oriented (Billadeau et
al., 2007). Using this metric, along with the accumulation of cell proliferation dye (which
non-specifically labels cellular protein) at the T cell-DC interface, OT-I T cells formed 2.7-
fold more synapses relative to P14 T cells in TLS (Figure 4E). A similar increase was seen
amongst OT-I T cells transferred into LucOS/Cre LV-infected vs. Cre LV-infected recipients,
which have tumors that do not express LucOS (data not shown). Therefore, while OT-I and
P14 T cells were both recruited into tumor-bearing lungs, OT-I T cells preferentially
interacted with DCs in TLS. This interaction had a meaningful effect on the OT-I T cells as
they upregulated CD69, an early marker of T cell activation, and proliferated within lung
tissue, while P14 T cells did not (Figure 4F). Similar activation and proliferation patterns
were seen in the tumor-draining mLN, but not in the in iLN, spleen, or the lung circulation
(Figure 4F and data not shown). OT-I T cells did not upregulate CD69 or proliferate in the
lung tissue or mLN when transferred into control P-F mice (data not shown). These data
clearly demonstrate that infiltrating T cells can interact with tumor antigens in both the mLN
and the TA-TLS.
Because some DCs in the TLS could have been directly infected by LucOS/Cre LV (20 wks
prior) and, thus, their presentation of antigens might not be tumor specific, we analyzed DCs
in KPT-F mice for the presence of tdT by IF. As the highly-active and ubiquitously-
expressed CAG promoter drives tdT expression after Cre-mediated recombination in KPT-F
mice (Madisen et al., 2010), direct infection of any cell type results in strong tdT signal.
Twenty weeks after LucOS/Cre LV infection, directly infected round CD11c+ macrophages
were easily identified based on an abundant tdT signal, similar in intensity to tumor cells
(data not shown). In contrast, some CD11c+ DCs (distinguished from macrophages based on
smaller size and dendritic morphology; Thornton et al., 2012) had faint signal for tdT in TA-
TLS in KPT-F mice, implying these cells had phagocytosed tumor-derived products (Figure 4G). Additionally, we sorted lung tissue DCs from tumor-bearing lungs and confirmed they
could present tumor-derived antigens to naïve OT-I CD8 T cells in vitro (Figure S5C-D).
Together, these data demonstrate that much like the tumor-draining LN, tumor-associated
TLS in this tumor model are functional structures capable of recruiting circulating CD8 T
cells and facilitating their interactions with antigen-presenting DCs.
Local immune responses in tumor-associated tertiary lymphoid structures after Treg cell depletion
We next assessed the impact of Treg cell depletion on tumor-associated TLS. The area of the
lung covered by TLS from ~20-wk LucOS/Cre LV-infected KP-F mice expanded ~7-fold in
the 12 days after Treg cell depletion (Figure 5A). However, because it was unclear whether
this increase was due to local lymphocyte expansion or recruitment, we analyzed TA-TLS
for signs of immune activity at early time points following Treg cell depletion. Antigen-
Joshi et al. Page 7
Immunity. Author manuscript; available in PMC 2016 April 09.
Author M
anuscriptA
uthor Manuscript
Author M
anuscriptA
uthor Manuscript

driven lymphocyte activation is strongly correlated with cell division; therefore, we treated
mice with the nucleoside analog bromodeoxyuridine (BrdU) 4 hours before sacrifice to label
proliferation of lymphocytes. IHC analysis showed that the proportion of proliferating
lymphocytes in TLS was increased at days 4 and 6 after Treg cell depletion (Figure 5B and S6A). Moreover, analysis of BrdU incorporation by FACS and IF revealed that the increased
rates of proliferation were largely amongst CD4+ and CD8+ T cells in TLS, which increased
~5x- and ~10x-fold after Treg cell depletion (Figures 5C-D). Collectively, these data
suggest that TA-TLS is a local site for T cell proliferation shortly after Treg cell depletion;
although it is possible some T cells proliferated elsewhere and migrated to TA-TLS during
the 4-hour window of our assay.
Treg cells directly regulate costimulatory molecules on DCs in SLOs (Kim et al., 2007), and,
therefore, we reasoned that increased expression of costimulatory molecules on DCs
immediately after Treg cell depletion could indicate sites of Treg cell function. CD80 (B7-1)
and CD86 (B7-2) expression were examined on lung-tissue DCs 2 days after Treg cell
depletion, when changes would most likely be due to direct effects in TLS. FACS analysis of
day 2 and 6 Treg cell-depleted mice revealed that lung-tissue DCs had higher expression of
CD80 and CD86 at day 2 after depletion (Figure 5E). These data are consistent with the
possibility that, similar to their functions other SLOs, Treg cells in TA-TLS regulate DC
function by reducing costimulatory levels. Furthermore, after Treg cell depletion, the overall
microenvironment in the TA-TLS may become more immunostimulatory, promoting anti-
tumor responses by T cells.
Local Treg cell depletion triggers anti-tumor responses targeting established lung adenocarcinomas
Intraperitoneal DT treatment of tumor-bearing KP-F mice causes acute systemic Treg cell
depletion throughout the mouse. To verify that Treg cells in the local microenvironment of
the lung suppress anti-tumor responses, we treated mice with repeated low doses of
intratracheal DT, to deplete Treg cells locally within the lung. 20-wk LucOS/Cre LV-infected
KP-F mice were treated with 6 daily doses of 50 ng DT IT. IT administration of DT did not
result in LN enlargement, with the exception of the lung-draining mLN, and no morbidity
was observed (data not shown). Local Treg cell depletion triggered immune infiltration of
~80% of lung tumors (Figure 5F and S6B). Therefore, local Treg cell depletion was
sufficient to trigger strong anti-tumor effects, consistent with the idea that Treg cells in the
TLS (and possibly in the mLN) regulate local anti-tumor responses. Moreover, these data
demonstrate that efficient, local Treg cell depletion could be an effective means for
triggering endogenous anti-tumor immune responses, without the systemic toxicity
associated with whole body Treg cell depletion.
Programmed antigen expression is not required for anti-tumor responses following Treg cell depletion
We next examined whether Treg cell depletion enhanced responses by the CD8 T cells
targeting the potent T cell antigens in LucOS. Surprisingly, however, we found that the
number of endogenous SIINFEKL-specific CD8 T cells (identified with SIINFEKL-loaded
H2-Kb MHC I tetramers) was not dramatically altered by Treg cell depletion (Figures 6A).
Joshi et al. Page 8
Immunity. Author manuscript; available in PMC 2016 April 09.
Author M
anuscriptA
uthor Manuscript
Author M
anuscriptA
uthor Manuscript

Additionally, the responses of naïve T cell OT-I CD8 T cells transferred into tumor-bearing
recipients were not enhanced by the absence of Treg cells (data not shown). These data
suggested that programmed antigen expression by tumors was not required to elicit anti-
tumor responses following Treg cell depletion. Thus, we infected KP-F and KP x
FoxP3IRES-RFP (KP-RFP) mice with Cre LV (previously referred to as Lenti-X in Dupage et
al., 2011), and ~18 wks later, were treated with DT. After 12 days, lung tumors were
analyzed for infiltration by immune cells and evidence of tumor destruction. Treg cell
depletion resulted in dramatic infiltration of lung tissues by CD45+ cells, particularly in the
perivascular and peribronchiolar regions (data not shown). Moreover, ~75% of tumors in
Treg cell-depleted mice (n=174 tumors from 10 mice) were moderately (immune infiltration
in 30-50% of the tumor area) or severely (greater than 50%) infiltrated and most showed
evidence of immune-mediated tumor disruption (Figure 6B-C). In contrast, ~20% of the
tumors from DT-treated KP-RFP (n=45 tumors from 6 mice) mice had moderate or severe
immune infiltration (Figure 6B-C). Similarly, only 10% of non-DT treated week 20 KP-F
mice (n=58 tumors from 5 mice) had severe or moderate infiltration. These data clearly
demonstrate that the anti-tumor response seen following Treg cell depletion does not require
the programmed expression of strong tumor antigens by tumors.
DISCUSSION
It is thought that the intratumoral Treg cells in cancer patients have important roles in
immunosuppression, but it has not been possible to functionally explore these roles in
humans. Here we demonstrated that Treg cells regulate anti-tumor immune responses in TA-
TLS in a mouse model of lung adenocarcinoma. We observed that TLS recruit T cells from
the circulation and facilitate their interaction with tumor-antigen presenting DCs. Treg cells
in TLS actively suppress potent anti-tumor responses and, thus, the TLS is a primary site for
T cell expansion upon Treg cell depletion. Subsequently, T cells and macrophages infiltrate
tumors, resulting in significant tumor destruction. Collectively, these data point to
immunosuppressive Treg cell function within TLS as one mechanism that prevents anti-
tumor responses and allows continued tumor development.
TA-TLS have been observed in several human cancer types (Fridman et al., 2012; Goc et al.,
2013) but it is not known how they form or function. In this model, TA-TLS formed during
the course of tumor development, and were closely associated with ~90% of the LucOS-
expressing tumors. Interestingly, antigen expression by tumors might impact TLS formation
as TLS in lungs from Cre LV infected mice appear larger and are located centrally in the
lungs, distal to tumors (N.S.J. and T.J. unpublished data).
In most studies, the presence of TA-TLS correlates with better survival for cancer patients,
suggesting TA-TLS have anti-tumor functions. However, one study found that high numbers
of Treg cells in TA-TLS, but not the tumor parenchyma, correlate with poor survival of
breast cancer patients (Gobert et al., 2009). It has been difficult to study the function of TA-
TLS, including how immunosuppressive pathways, like Treg cells, influence anti-tumor
responses from within these structures. In this model, we observed that Treg cells are
prominent in TA-TLS and that, upon Treg cell depletion, T cells within TA-TLS proliferate,
coincident with tumor infiltration. Thus, we propose that TA-TLS may serve both pro- and
Joshi et al. Page 9
Immunity. Author manuscript; available in PMC 2016 April 09.
Author M
anuscriptA
uthor Manuscript
Author M
anuscriptA
uthor Manuscript

anti-tumor functions depending on the state of disease progression as well as the presence of
immunosuppressive cell types, including Treg cells. However, TA-TLS also probably
facilitate influx of new effector T cells into the tumor site following Treg cell depletion
through HEVs, and amplify the anti-tumor response. Therefore, TA-TLS could be intimately
involved in many aspects of the anti-tumor immune response, both at steady state and
following therapeutic interventions.
The data presented here do not exclude the possibility that Treg cells in this model also
suppress anti-tumor responses in the tumor-draining mLN. In contrast, because tumor-
antigens are presented in TA-TLS and the mLN, regulation of anti-tumor immune responses
likely requires immunosuppression at both sites. Because Treg cells function through a
variety of mechanisms (Josefowicz et al., 2012), Treg cells in TA-TLS and the mLN could
rely on distinct effector pathways. Consistent with this idea, Treg cells in TA-TLS were
phenotypically more activated and expressed higher levels of multiple effector molecules.
For example, Treg cells in our model (and others) express higher amounts of CTLA-4 in the
tumor microenvironment compared to the tumor-draining LN (Marabelle et al., 2013;
McDermott et al., 2014; Selby et al., 2013; Simpson et al., 2013). In the steady state, Treg
cells use CTLA-4 to reduce the amounts of costimulatory proteins on DCs, thus inhibiting T
cell activation and preventing autoimmunity (Qureshi et al., 2011; Wing et al., 2008).
Likewise, Treg cells in TLS could use CTLA-4 to regulate anti-tumor responses through
DCs. TA-TLS Treg cells also expressed high amounts of CD39, which, along with CD73,
produces adenosine, a potent T cell inhibitor (Antonioli et al., 2013). Interestingly, chemical
inhibition of CD39 has been shown to reduce early tumor growth in a Kras-driven Atg5-
deficient mouse lung cancer model, possibly through Treg cell function (Rao et al., 2014).
Further investigation will be required to more firmly establish the functional importance of
these and other effector pathways active in Treg cells in TLS and to determine whether these
pathways can be therapeutically exploited to improve anti-tumor immune responses.
CD8 T cell responses against the strong ova-antigen in LucOS were not dramatically
enhanced by Treg cell depletion. This is perhaps because Treg cells preferentially suppress
responses by T cells that have weak, lower-affinity interactions with their cognate antigen
(Pace et al., 2012), more like those seen with self- or tumor-antigens (Aleksic et al., 2012).
Therefore, in addition to Cre-derived antigens, after Treg cell depletion, T cells may also
have been responding to self-antigens expressed by tumors in this model. Over- and
abnormally expressed (non-mutated) antigens are frequent targets in human cancer (Finn,
2008), and advanced lung tumors in KP mice can express embryonic proteins and proteins
normally found other locations, such as the gut (Snyder et al., 2013). Responses against
these antigens would be suppressed under steady state conditions, but it is possible that Treg
cell depletion permits responses by T cells with low affinity for these tumor-associated
antigens. Identification of the types of tumor antigens recognized by T cells following Treg
cell depletion will be helpful for guiding the development of future immune-based therapies.
Immune checkpoint blockers have enormous potential for treating a variety of types of
human cancers, but positive clinical responses correlate with immune-related adverse events
(Pardoll, 2012). As immune checkpoint pathways are important for preventing naturally-
occurring autoimmune diseases, immunotherapies walk a fine line between promoting
Joshi et al. Page 10
Immunity. Author manuscript; available in PMC 2016 April 09.
Author M
anuscriptA
uthor Manuscript
Author M
anuscriptA
uthor Manuscript

strong anti-cancer effects and minimizing autoimmune toxicity. Treg cells are prime
immunotherapeutic targets. In our model, systemic Treg cell depletion unleashed a powerful
anti-tumor response, but also resulted in significant morbidity. Therefore, it seems possible
that the autoimmune response triggered by systemic Treg cell depletion in patients could be
difficult to control once initiated. This concern underscores the need to identify mechanisms
for localized therapeutic depletion or targeted blockade of Treg cells in the tumor
microenvironment. For example, some CTLA-4 antibodies can deplete intratumoral Treg
cells, and treatment of metastatic melanoma patients with a Treg cell-depleting antibody
ipilimumab provides an increase in overall survival, while treatment with a non-depleting
antibody tremelimumab does not (Hodi et al., 2010; Ribas et al., 2013; Marabelle et al.,
2013; McDermott et al., 2014; Selby et al., 2013; Simpson et al., 2013). From a therapeutic
standpoint, specifically targeting immunosuppressive mediators in TA-TLS (like Treg cells)
could make it possible to promote local anti-tumor responses and maintain immune
homeostasis outside of the tumor microenvironment. Our study supports the development of
additional targets for local Treg cell inhibition within the tumor microenvironment as a
strategy that may provide safer, more effective therapy for patients with cancer.
EXPERIMENTAL PROCEDURES
Mice and treatments
KP and Foxp3IRES-DTR-GFP mice have been described (Dupage et al., 2011; Kim et al.,
2007). OT-I TCR Tg and Rosa26LSL-tdT mice (B6.Cg-
Gt(ROSA)26Sortm14(CAG-tdTomato)Hze/J) were purchased from Jackson Laboratory (Jax, Bar
Harbor, ME) and P14 TCR Tg mice from Taconic (Hudson, NY). For systemic Treg
depletion, mice were injected IP with 50 ng / g DT in PBS on days 0 and 1 (2 doses). For
lung-specific Treg depletion, mice were treated with 50 ng DT IT in 50-100 μL PBS on days
0-5 (6 doses). IT DT was well tolerated by mice, and no morbidity or mortality was
observed. Furthermore, IT DT did not trigger splenomegaly or lymphadenopathy, except in
the lung-draining mediastinal LN (data not shown). Details of BrdU labeling, in vivo labeling and MRI imaging are in Supplemental Experimental Procedures. All studies were
performed under an Institutional Animal Care and Use Committee- and Massachusetts
Institute of Technology Committee on Animal Care-approved animal protocol. Mice were
assessed for morbidity according to MIT division of comparative medicine (DCM)
guidelines and were always humanely sacrificed prior to natural expiration.
Lentiviral production
Mice were infected IT with 2.5-5×10⁴ PFU of Cre or LucOS/Cre LV to initiate tumors.
Details of the viruses and production are in Supplemental Experimental Procedures.
Tissue isolation, Immunohistochemistry and Immunofluorescence
Lungs were isolated, flushed with bronchoalveolar lavage and/or lung circulatory perfusion,
then allocated for IHC, IF, FACS and/or CLARITY. For IHC and IF, tissues were preserved
overnight using PLP fixative, then embedded in paraffin (IHC) or cryoprotected with 30%
sucrose/PBS (IF) and embedded in optimum cutting temperature (O.C.T.) compound (VWR,
Joshi et al. Page 11
Immunity. Author manuscript; available in PMC 2016 April 09.
Author M
anuscriptA
uthor Manuscript
Author M
anuscriptA
uthor Manuscript

Radnor, PA). Details of isolation, fixation, and IF/IHC staining are in Supplemental
Experimental Procedures.
Confocal imaging
Images were acquired on an Olympus FV1200 Laser Scanning Confocal Microscope or a
Nikon A1R Ultra-Fast Spectral Scanning Confocal Microscope with 10x, 20x, and 30x
objectives and analyzed with ImageJ (NIH, Bethesda, MD) and Photoshop CS4 (Adobe
Systems Inc, San Jose, CA). For whole lung reconstructions, individual sections were
manually aligned using ImageJ and photoshop as detailed in Supplemental Experimental
Procedures.
Flow cytometry
Spleens and LNs were processed as described (Joshi et al., 2007). Lungs were prepared
using a gentleMACS dissociator and C tubes (Miltenyi biotech, San Diego, CA), as
described in Supplemental Experimental Procedures. Samples were analyzed using an LSR
II (BD) and FlowJo software (Treestar, Ashland, OR). Cell sorting was performed on a
FACSAria III (BD).
Statistical analyses and quantifications
p-values from unpaired two-tailed student's T-tests were used for all statistical comparisons.
Tumor destruction based on the disruption of tumor morphology and infiltration by CD45+
immune cells was scored as described in Supplemental Experimental Procedures.
In vitro T cell activation and adoptive transfer
Splenocytes from OT-I or P14 TCR Tg mice were stimulated in vitro, stained with cell
proliferation dyes and mixed at a 1:1 ratio, as detailed in the supplemental experimental
materials. 1-5x10⁶ cells were then transferred IV into ~20-wk LucOS/Cre LV-infected
recipient 45.2 KP-F mice.
Quantifying the percent BrdU+ from IHC sections
Sections of lungs were stained for BrdU by IHC, counterstained, and imaged using an
Aperio Slide scanner (Leica). TA-TLS (distinct clusters of lymphocytes associated with
blood vessels) were cropped using photoshop. Cropped images were quantified by Cell
profiler for nuclei and BrdU+ cells to determine the fraction of proliferating lymphocytes.
Supplementary Material
Refer to Web version on PubMed Central for supplementary material.
ACKNOWLEDGMENTS
We thank Professor Alexander Rudensky (Memorial Sloan-Kettering Cancer Center) for the generous gift of Foxp3DTR-GFP mice and Jacks’ lab members for reviewing the manuscript. We also thank Swanson Biotechnology Center (SBC): Kathleen Cormier in the Hope Babette Tang (1983) Histology Facility, Eliza Vasile and Jeff Wyckoff in the Microscopy Facility, Scott Malstrom in the Animal Imaging & Preclinical Testing Core Facility, Glenn Paradis in the Flow cytometry facility, and the KI Media Facility. This work was supported by an NCI Cancer Center Support Grant P30-CA14051 and grants from the Howard Hughes Medical Institute (T.J.), 1
Joshi et al. Page 12
Immunity. Author manuscript; available in PMC 2016 April 09.
Author M
anuscriptA
uthor Manuscript
Author M
anuscriptA
uthor Manuscript
U54 CA126515-01 (T.J.), R01 – CA185020-01 (T.J.), and T32 GM007753 (A.L.) from the NIH, the Damon Runyon Cancer Foundation (N.S.J.), the Margaret A. Cunningham Immune Mechanisms in Cancer Research Fellowship Award (N.S.J.) and the Lung Cancer Research Foundation (N.S.J.). T.J. is a Howard Hughes Investigator and a Daniel K. Ludwig Scholar. This paper is dedicated to Professor Herman Eisen and Officer Sean Collier, for his caring service to the MIT community and for his sacrifice.
REFERENCES
Aleksic M, Liddy N, Molloy PE, Pumphrey N, Vuidepot A, Chang KM, Jakobsen BK. Different affinity windows for virus and cancer-specific T-cell receptors: implications for therapeutic strategies. European journal of immunology. 2012; 42:3174–3179. [PubMed: 22949370]
Antonioli L, Pacher P, Vizi ES, Hasko G. CD39 and CD73 in immunity and inflammation. Trends in molecular medicine. 2013; 19:355–367. [PubMed: 23601906]
Beyersdorf N, Ding X, Tietze JK, Hanke T. Characterization of mouse CD4 T cell subsets defined by expression of KLRG1. European journal of immunology. 2007; 37:3445–3454. [PubMed: 18034419]
Billadeau DD, Nolz JC, Gomez TS. Regulation of T-cell activation by the cytoskeleton. Nature reviews. 2007; 7:131–143.
Boissonnas A, Scholer-Dahirel A, Simon-Blancal V, Pace L, Valet F, Kissenpfennig A, Sparwasser T, Malissen B, Fetler L, Amigorena S. Foxp3+ T cells induce perforin-dependent dendritic cell death in tumor-draining lymph nodes. Immunity. 2010; 32:266–278. [PubMed: 20137985]
Bos PD, Plitas G, Rudra D, Lee SY, Rudensky AY. Transient regulatory T cell ablation deters oncogene-driven breast cancer and enhances radiotherapy. J Exp Med. 2013; 210:2435–2466. [PubMed: 24127486]
Campbell DJ, Koch MA. Phenotypical and functional specialization of FOXP3+ regulatory T cells. Nature reviews. 2011; 11:119–130.
Cheng G, Yuan X, Tsai MS, Podack ER, Yu A, Malek TR. IL-2 receptor signaling is essential for the development of Klrg1+ terminally differentiated T regulatory cells. J Immunol. 2012; 189:1780–1791. [PubMed: 22786769]
Chung K, Wallace J, Kim SY, Kalyanasundaram S, Andalman AS, Davidson TJ, Mirzabekov JJ, Zalocusky KA, Mattis J, Denisin AK, et al. Structural and molecular interrogation of intact biological systems. Nature. 2013; 497:332–337. [PubMed: 23575631]
de Chaisemartin L, Goc J, Damotte D, Validire P, Magdeleinat P, Alifano M, Cremer I, Fridman WH, Sautes-Fridman C, Dieu-Nosjean MC. Characterization of chemokines and adhesion molecules associated with T cell presence in tertiary lymphoid structures in human lung cancer. Cancer research. 2011; 71:6391–6399. [PubMed: 21900403]
Dieu-Nosjean MC, Antoine M, Danel C, Heudes D, Wislez M, Poulot V, Rabbe N, Laurans L, Tartour E, de Chaisemartin L, et al. Long-term survival for patients with non-small-cell lung cancer with intratumoral lymphoid structures. Journal of clinical oncology : official journal of the American Society of Clinical Oncology. 2008; 26:4410–4417. [PubMed: 18802153]
Dupage M, Cheung AF, Mazumdar C, Winslow MM, Bronson RT, Schmidt LM, Crowley D, Chen J, Jacks T. Endogenous T cell responses to antigens expressed in lung adenocarcinomas delay malignant tumor progression. Cancer cell. 2011; 19:72–85. [PubMed: 21251614]
DuPage M, Jacks T. Genetically engineered mouse models of cancer reveal new insights about the antitumor immune response. Curr Opin Immunol. 2013; 25:192–199. [PubMed: 23465466]
DuPage M, Mazumdar C, Schmidt LM, Cheung AF, Jacks T. Expression of tumour-specific antigens underlies cancer immunoediting. Nature. 2012; 482:405–409. [PubMed: 22318517]
Feuerer M, Hill JA, Kretschmer K, von Boehmer H, Mathis D, Benoist C. Genomic definition of multiple ex vivo regulatory T cell subphenotypes. Proceedings of the National Academy of Sciences of the United States of America. 2010; 107:5919–5924. [PubMed: 20231436]
Finn OJ. Cancer immunology. The New England journal of medicine. 2008; 358:2704–2715. [PubMed: 18565863]
Fridman WH, Pages F, Sautes-Fridman C, Galon J. The immune contexture in human tumours: impact on clinical outcome. Nature reviews. 2012; 12:298–306.
Joshi et al. Page 13
Immunity. Author manuscript; available in PMC 2016 April 09.
Author M
anuscriptA
uthor Manuscript
Author M
anuscriptA
uthor Manuscript

Gobert M, Treilleux I, Bendriss-Vermare N, Bachelot T, Goddard-Leon S, Arfi V, Biota C, Doffin AC, Durand I, Olive D, et al. Regulatory T cells recruited through CCL22/CCR4 are selectively activated in lymphoid infiltrates surrounding primary breast tumors and lead to an adverse clinical outcome. Cancer research. 2009; 69:2000–2009. [PubMed: 19244125]
Goc J, Fridman WH, Sautes-Fridman C, Dieu-Nosjean MC. Characteristics of tertiary lymphoid structures in primary cancers. Oncoimmunology. 2013; 2:e26836. [PubMed: 24498556]
Hayes SA, Hudson AL, Clarke SJ, Molloy MP, Howell VM. From mice to men: GEMMs as trial patients for new NSCLC therapies. Seminars in cell & developmental biology. 2014; 27:118–127. [PubMed: 24718320]
Hodi FS, O'Day SJ, McDermott DF, Weber RW, Sosman JA, Haanen JB, Gonzalez R, Robert C, Schadendorf D, Hassel JC, et al. Improved survival with ipilimumab in patients with metastatic melanoma. The New England journal of medicine. 2010; 363:711–723. [PubMed: 20525992]
Jemal A, Siegel R, Xu J, Ward E. Cancer statistics, 2010. CA Cancer J Clin. 2010; 60:277–300. [PubMed: 20610543]
Josefowicz SZ, Lu LF, Rudensky AY. Regulatory T cells: mechanisms of differentiation and function. Annual review of immunology. 2012; 30:531–564.
Joshi NS, Cui W, Chandele A, Lee HK, Urso DR, Hagman J, Gapin L, Kaech SM. Inflammation directs memory precursor and short-lived effector CD8(+) T cell fates via the graded expression of T-bet transcription factor. Immunity. 2007; 27:281–295. [PubMed: 17723218]
Kaech SM, Ahmed R. Memory CD8+ T cell differentiation: initial antigen encounter triggers a developmental program in naive cells. Nature immunology. 2001; 2:415–422. [PubMed: 11323695]
Kim JM, Rasmussen JP, Rudensky AY. Regulatory T cells prevent catastrophic autoimmunity throughout the lifespan of mice. Nature immunology. 2007; 8:191–197. [PubMed: 17136045]
Kwon MC, Berns A. Mouse models for lung cancer. Mol Oncol. 2013; 7:165–177. [PubMed: 23481268]
Lin W, Truong N, Grossman WJ, Haribhai D, Williams CB, Wang J, Martin MG, Chatila TA. Allergic dysregulation and hyperimmunoglobulinemia E in Foxp3 mutant mice. The Journal of allergy and clinical immunology. 2005; 116:1106–1115. [PubMed: 16275384]
Madisen L, Zwingman TA, Sunkin SM, Oh SW, Zariwala HA, Gu H, Ng LL, Palmiter RD, Hawrylycz MJ, Jones AR, et al. A robust and high-throughput Cre reporting and characterization system for the whole mouse brain. Nature neuroscience. 2010; 13:133–140. [PubMed: 20023653]
Marabelle A, Kohrt H, Sagiv-Barfi I, Ajami B, Axtell RC, Zhou G, Rajapaksa R, Green MR, Torchia J, Brody J, et al. Depleting tumor-specific Tregs at a single site eradicates disseminated tumors. J Clin Invest. 2013; 123:2447–2463. [PubMed: 23728179]
McDermott D, Lebbe C, Hodi FS, Maio M, Weber JS, Wolchok JD, Thompson JA, Balch CM. Durable benefit and the potential for long-term survival with immunotherapy in advanced melanoma. Cancer treatment reviews. 2014
Neyt K, Perros F, GeurtsvanKessel CH, Hammad H, Lambrecht BN. Tertiary lymphoid organs in infection and autoimmunity. Trends in immunology. 2012; 33:297–305. [PubMed: 22622061]
Pace L, Tempez A, Arnold-Schrauf C, Lemaitre F, Bousso P, Fetler L, Sparwasser T, Amigorena S. Regulatory T cells increase the avidity of primary CD8+ T cell responses and promote memory. Science. 2012; 338:532–536. [PubMed: 23112334]
Pardoll DM. The blockade of immune checkpoints in cancer immunotherapy. Nature reviews. 2012; 12:252–264.
Qureshi OS, Zheng Y, Nakamura K, Attridge K, Manzotti C, Schmidt EM, Baker J, Jeffery LE, Kaur S, Briggs Z, et al. Trans endocytosis of CD80 and CD86: a molecular basis for the cell-extrinsic function of CTLA-4. Science. 2011; 332:600–603. [PubMed: 21474713]
Raez LE, Fein S, Podack ER. Lung cancer immunotherapy. Clinical medicine & research. 2005; 3:221–228. [PubMed: 16303887]
Rajasagi M, Shukla SA, Fritsch EF, Keskin DB, DeLuca D, Carmona E, Zhang W, Sougnez C, Cibulskis K, Sidney J, et al. Systematic identification of personal tumor-specific neoantigens in chronic lymphocytic leukemia. Blood. 2014; 124:453–462. [PubMed: 24891321]
Joshi et al. Page 14
Immunity. Author manuscript; available in PMC 2016 April 09.
Author M
anuscriptA
uthor Manuscript
Author M
anuscriptA
uthor Manuscript

Rao S, Tortola L, Perlot T, Wirnsberger G, Novatchkova M, Nitsch R, Sykacek P, Frank L, Schramek D, Komnenovic V, et al. A dual role for autophagy in a murine model of lung cancer. Nature communications. 2014; 5:3056.
Ribas A, Kefford R, Marshall MA, Punt CJ, Haanen JB, Marmol M, Garbe C, Gogas H, Schachter J, Linette G, et al. Phase III randomized clinical trial comparing tremelimumab with standard-of-care chemotherapy in patients with advanced melanoma. Journal of clinical oncology : official journal of the American Society of Clinical Oncology. 2013; 31:616–622. [PubMed: 23295794]
Robbins SH, Tessmer MS, van Kaer L, Brossay L. Direct effects of T-bet and MHC class I expression, but not STAT1, on peripheral NK cell maturation. European journal of immunology. 2005; 35:757–765. [PubMed: 15719366]
Sakaguchi S. Naturally arising CD4+ regulatory t cells for immunologic self-tolerance and negative control of immune responses. Annual review of immunology. 2004; 22:531–562.
Sather BD, Treuting P, Perdue N, Miazgowicz M, Fontenot JD, Rudensky AY, Campbell DJ. Altering the distribution of Foxp3(+) regulatory T cells results in tissue-specific inflammatory disease. J Exp Med. 2007; 204:1335–1347. [PubMed: 17548521]
Selby MJ, Engelhardt JJ, Quigley M, Henning KA, Chen T, Srinivasan M, Korman AJ. Anti-CTLA-4 antibodies of IgG2a isotype enhance antitumor activity through reduction of intratumoral regulatory T cells. Cancer immunology research. 2013; 1:32–42. [PubMed: 24777248]
Simpson TR, Li F, Montalvo-Ortiz W, Sepulveda MA, Bergerhoff K, Arce F, Roddie C, Henry JY, Yagita H, Wolchok JD, et al. Fc-dependent depletion of tumor-infiltrating regulatory T cells co-defines the efficacy of anti-CTLA-4 therapy against melanoma. J Exp Med. 2013; 210:1695–1710. [PubMed: 23897981]
Snyder EL, Watanabe H, Magendantz M, Hoersch S, Chen TA, Wang DG, Crowley D, Whittaker CA, Meyerson M, Kimura S, et al. Nkx2-1 represses a latent gastric differentiation program in lung adenocarcinoma. Molecular cell. 2013; 50:185–199. [PubMed: 23523371]
Suffia I, Reckling SK, Salay G, Belkaid Y. A role for CD103 in the retention of CD4+CD25+ Treg and control of Leishmania major infection. J Immunol. 2005; 174:5444–5455. [PubMed: 15845457]
Teng MW, Ngiow SF, von Scheidt B, McLaughlin N, Sparwasser T, Smyth MJ. Conditional regulatory T-cell depletion releases adaptive immunity preventing carcinogenesis and suppressing established tumor growth. Cancer research. 2010; 70:7800–7809. [PubMed: 20924111]
Thornton EE, Looney MR, Bose O, Sen D, Sheppard D, Locksley R, Huang X, Krummel MF. Spatiotemporally separated antigen uptake by alveolar dendritic cells and airway presentation to T cells in the lung. J Exp Med. 2012; 209:1183–1199. [PubMed: 22585735]
Vogelstein B, Papadopoulos N, Velculescu VE, Zhou S, Diaz LA Jr. Kinzler KW. Cancer genome landscapes. Science. 2013; 339:1546–1558. [PubMed: 23539594]
Wing K, Onishi Y, Prieto-Martin P, Yamaguchi T, Miyara M, Fehervari Z, Nomura T, Sakaguchi S. CTLA-4 control over Foxp3+ regulatory T cell function. Science. 2008; 322:271–275. [PubMed: 18845758]
Joshi et al. Page 15
Immunity. Author manuscript; available in PMC 2016 April 09.
Author M
anuscriptA
uthor Manuscript
Author M
anuscriptA
uthor Manuscript

Figure 1. Treg cells in tumor-bearing lungs have an activated phenotypeKP-F and P-F (control) mice were analyzed ~20 wks (18-24 wks) after LucOS/Cre LV
infection by flow cytometry.
(A) FACS plots gated on lung CD4+ T cells. Tissue (black) and circulating (red) FoxP3+
Treg cell frequency indicated. Note, control and uninfected (naïve) lungs were
indistinguishable. n > 30 mice.
Joshi et al. Page 16
Immunity. Author manuscript; available in PMC 2016 April 09.
Author M
anuscriptA
uthor Manuscript
Author M
anuscriptA
uthor Manuscript

(B) Graph of total CD4 T cell and tissue and circulating Treg cell numbers in lungs from
naïve (n=11) and tumor-bearing (20 wk, n=30) animals. Median and fold difference
indicated. *, p = 0.03.
(C) CD103 and KLRG1 on the Treg cell populations in 1A. n > 30 mice.
(D) Expression of indicated markers by circulating DN (filled gray line) and tissue DN, SP,
and DP Treg cells (red, dashed blue, and black lines, respectively). Gated as in 1C. n = 9-35
mice.
(E) CTLA-4 expression by mLN (gray filled line), mesenteric (mes) LN (dashed blue line)
and lung tissue Treg cells (black line). n = 7 mice.
Joshi et al. Page 17
Immunity. Author manuscript; available in PMC 2016 April 09.
Author M
anuscriptA
uthor Manuscript
Author M
anuscriptA
uthor Manuscript

Figure 2. Treg cells maintain immune quiescence in advanced tumors~18-20-wk LucOS/Cre LV-infected KP-F (A) or KPT-F (B-H) mice were treated 1x (A) or
2x (B-H) with DT (IP; 50ng/g) and analyzed 2 (A) or 12 (B-H) days later.
(A) FACS plots show lung CD4+ T cells, gated as in 1A. n > 6 mice.
(B) Confocal IF images show range (no/low, moderate, or severe) of tumor destruction in
untreated (left panel) and Treg cell-depleted (right 3 panels) mice. Red: tdTomato+; green:
EpCAM; blue: Dapi; Dashed line: tumor border.
Joshi et al. Page 18
Immunity. Author manuscript; available in PMC 2016 April 09.
Author M
anuscriptA
uthor Manuscript
Author M
anuscriptA
uthor Manuscript

(C) Quantitation of tumor destruction from images in 2C. n = 85/13 control and 108/17 Treg
cell-depleted tumors/mice.
(D) Control (left panels) and Treg cell-depleted (right panels) lungs were optically cleared
using CLARITY. Images show optical slices through tumors. Red: tdTomato+; green: YO-
PRO-1. See also Movie S1. n = 15/7 control and 10/3 Treg cell-depleted tumors/mice.
(E) IHC images show control and Treg cell-depleted tumors for lung (NKX2.1, brown) and
immune (CD45, pink) cells. n = 71/11 control and 55/9 Treg cell-depleted tumors/mice.
(F) Graph of median lung-tissue CD4+ and CD8+ (Thy1.2+) T cell and (B220+ CD19+) B
cell numbers in Treg cell-depleted (black bars, n=6) and control mice (white bars, n=5) ±
SEM. *, p=0.0150. **, p=0.0175.
(G) Confocal IF images show control (n=39) and Treg cell-depleted (n=15) tumors. Red:
tdTomato+; green: CD4; blue: CD8 T cells.
(H) Confocal IF image shows Treg cell-depleted tumor. Red: tdTomato+; green: CD11c+
macrophage (large round cells). Inset optical slice of macrophage with tdT+ vesicles (z-
depth different than larger image). n = 4 mice.
Joshi et al. Page 19
Immunity. Author manuscript; available in PMC 2016 April 09.
Author M
anuscriptA
uthor Manuscript
Author M
anuscriptA
uthor Manuscript

Figure 3. Treg cells in tumor-bearing lungs are located in tumor-associated TLSKP-F or KPT-F mice were analyzed 18-20 wks after LucOS/Cre LV infection.
(A) IHC images show FoxP3 (black), hematoxylin (blue) and eosin (pink). Tumor, dashed
line; TLS, solid line. Left panel, 4x. Right panel, 20x. n = 10 mice.
(B) Median Treg cell number in tumor (n=88) and TLS (n=45) from 9 mice. Normalized by
pixel area. *, p=3.89×10⁻²⁵.
(C) IF image shows TLS. Red, CD11c; Green, FoxP3; Blue, B220; White, Dapi. n = 6 mice.
Joshi et al. Page 20
Immunity. Author manuscript; available in PMC 2016 April 09.
Author M
anuscriptA
uthor Manuscript
Author M
anuscriptA
uthor Manuscript

(D) 3-D rendering of in silico reconstructed tumor-bearing lung lobe. ~20 IF sections
(50μM, ~1 mm depth) imaged by confocal microscopy. Blue, NKX2.1; red, CD3; green,
B220. Center panel same as left with NXK2.1 removed. Right panel, TLS in box. n = 3
mice.
(E) Confocal IF images show TLS in serial stained sections (30 μm) stained for indicated
markers. I, tumor, dashed line; TLS, solid line. n = 16 mice.
Joshi et al. Page 21
Immunity. Author manuscript; available in PMC 2016 April 09.
Author M
anuscriptA
uthor Manuscript
Author M
anuscriptA
uthor Manuscript

Figure 4. TLS serves as a local site of tumor antigen presentation(A) Schematic diagram for B-F. In vitro-activated CT-670+ P14 and CT-V+ OT I Tg
CD45.1+ CD8+ T cells were transferred into ~20-wk LucOS/Cre LV-infected CD45.2+
tumor-bearing KP-F and control P-F recipients.
(B) FACS plots show lung CD45.1+ CD8+ P14 and OT-I T cells 2-3 days after transfer. n
>12 per group.
Joshi et al. Page 22
Immunity. Author manuscript; available in PMC 2016 April 09.
Author M
anuscriptA
uthor Manuscript
Author M
anuscriptA
uthor Manuscript

(C) Graph showing the median fraction (± SEM) of transferred OT-I (black bars, n = 620) or
P14 (white bars, n = 238) CD8 T cells in the indicated tissue (see also Figure S5A). *, p =
1.89×10⁻³. **, p = 3.59×10⁻³.
(D) Confocal IF images of TLS. Green: CT-V (OT-I T cells); blue: NKX2.1, and red: CD3
(left panel, n = 13) or CD11c (right panel, n >20).
(E) Graph showing the mean fraction (± SEM) of OT-I (black bar, n = 231) or P14 (white
bar, n = 122) T cells forming synapses (see also Figure S5B). *, p=5.62×10⁻¹¹.
(F) FACS plots showing transferred P14 or OT-I CD8+ T cells (gated as in 5B). n >12
recipients.
(G) Confocal IF image shows tumor/TLS in ~20 wk LucOS/Cre LV-infected KPT-F mouse.
Green, CD3; cyan, CD11c (DCs are small cells); red, tdTomato. Note, signal intensity
difference between tumor cells and DCs. n = 5 mice.
Joshi et al. Page 23
Immunity. Author manuscript; available in PMC 2016 April 09.
Author M
anuscriptA
uthor Manuscript
Author M
anuscriptA
uthor Manuscript

Figure 5. TLS is a site of immune activation following Treg cell depletion~20-wk LucOS/Cre LV-infected KP-F mice were treated IP (A-F) or IT (F) with DT. (B-D)
mice treated with BrdU to label proliferating cells.
(A) Graph quantifying TLS / lung size of 22 control and 10 day-12 Treg cell-depleted mice.
*, p=1.8×10⁻⁴.
(B) Graph shows the percent of BrdU+ lymphocytes in TLS after Treg cell depletion. Day 0,
no DT. Points are the average of lymphocytes in all the TLS in a section. Bar: median. See
also Figure S6A. n=7, days 0 and 4 and n=11, days 2 and 6. *, p<0.005.
Joshi et al. Page 24
Immunity. Author manuscript; available in PMC 2016 April 09.
Author M
anuscriptA
uthor Manuscript
Author M
anuscriptA
uthor Manuscript

(C) FACS plots show BrdU staining in lung-tissue CD8 and CD4 (FoxP3neg) T cells and
B220+ CD19+ B cells. Average of 3 control and 6 Treg-depleted mice ± SEM.
(D) Confocal IF images show control (n=18/9 TLS/mice) and day 6 Treg cell-depleted
(n=57/12) TLS. Green, CD8; red, CD4; white, BrdU. Arrowheads: BrdU+ CD8 (green) and
CD4 (red) T cells.
(E) Graphs show median (± SEM) CD80 and CD86 MFI (median fluorescence intensity) on
lung-tissue CD11b+ CD11c+ MHCII+ DCs. n=8, no DT; n=12, day 2; n=13, day 6 post DT.
Fold change indicated. ns=non-significant. *, p<0.05.
(F) Graph shows blind quantification of IHC on lung sections from control (n=630/23),
day-12 IP DT treated (systemic depletion, n=136/15 tumors/mice), and day-12 IT DT treated
(lung-restricted depletion, n=266/11) mice stained for CD45 and NKX2.1. no/little, < 30%;
moderate 30-50%; severe, >50% CD45+ cell infiltration. *, p<0.005.
Joshi et al. Page 25
Immunity. Author manuscript; available in PMC 2016 April 09.
Author M
anuscriptA
uthor Manuscript
Author M
anuscriptA
uthor Manuscript
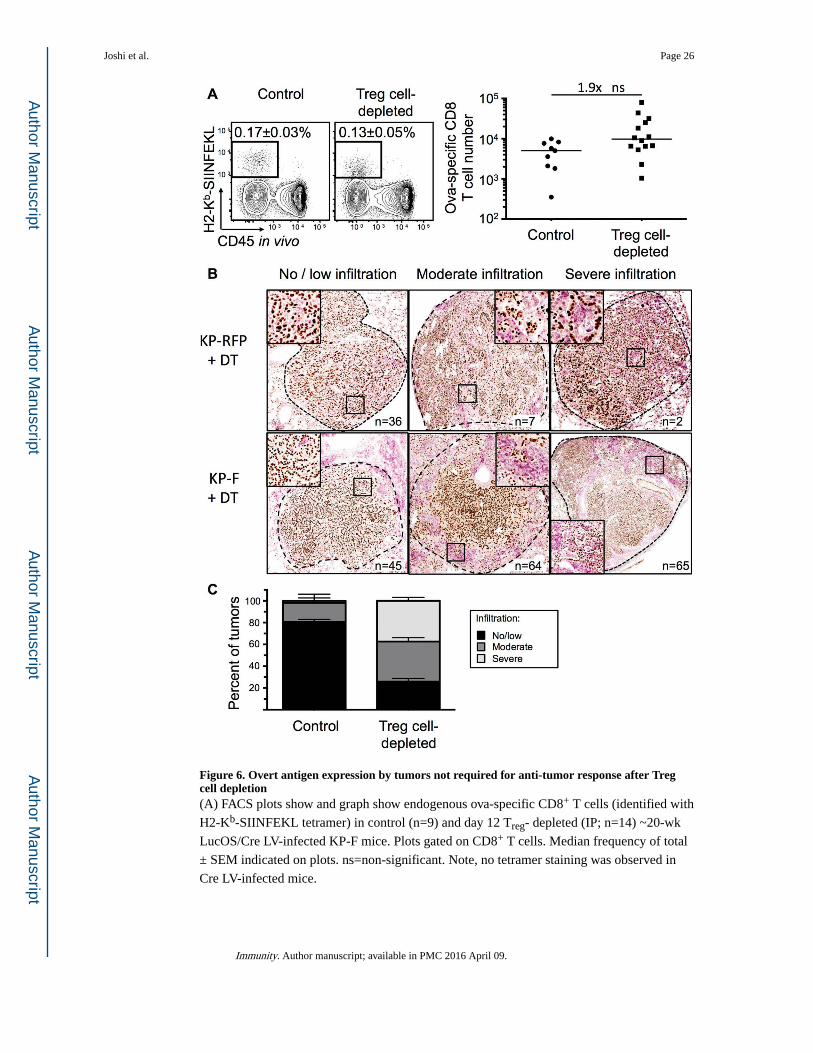
Figure 6. Overt antigen expression by tumors not required for anti-tumor response after Treg cell depletion(A) FACS plots show and graph show endogenous ova-specific CD8+ T cells (identified with
H2-Kb-SIINFEKL tetramer) in control (n=9) and day 12 Treg- depleted (IP; n=14) ~20-wk
LucOS/Cre LV-infected KP-F mice. Plots gated on CD8+ T cells. Median frequency of total
± SEM indicated on plots. ns=non-significant. Note, no tetramer staining was observed in
Cre LV-infected mice.
Joshi et al. Page 26
Immunity. Author manuscript; available in PMC 2016 April 09.
Author M
anuscriptA
uthor Manuscript
Author M
anuscriptA
uthor Manuscript

(B) IHC images show NKX2.1 (brown) and CD45 (pink) in ~18-wk Cre LV-infected KP-F
(n=15) and KP-RFP (control, n=6) mice 12 days after IP DT. no/little, < 30%; moderate
30-50%; severe, >50% CD45+ cell infiltration. n = tumor number.
(C) Graph quantifying IHC in 6B. Control includes tumors from DT-treated KP RFP (n= 45
tumors/6 mice) and untreated KP-F (n=58 tumors/5 mice). n = 174 Treg cell-depleted
tumors from 10 mice.
Joshi et al. Page 27
Immunity. Author manuscript; available in PMC 2016 April 09.
Author M
anuscriptA
uthor Manuscript
Author M
anuscriptA
uthor Manuscript