Regulation of Superoxide Radicals in Escherichia coli Sara H. Schilling 2007.
58
Regulation of Superoxide Radicals in Escherichia coli Sara H. Schilling 2007
-
Upload
tracy-burke -
Category
Documents
-
view
216 -
download
0
Transcript of Regulation of Superoxide Radicals in Escherichia coli Sara H. Schilling 2007.

Regulation of Superoxide Radicals in Escherichia coli
Sara H. Schilling2007

University of St. Thomas
QuickTime™ and aTIFF (Uncompressed) decompressor
are needed to see this picture.
QuickTime™ and aTIFF (Uncompressed) decompressor
are needed to see this picture.

To learn more about the regulatory systems that protect E. coli bacteria
cells from harmful superoxide radicals
Overall Goal
www.science.howstuffworks.com
Why?
Information about protective systems in E. coli can be applied to understand similar systems in humans

Superoxide Radicals in E. coli
Fe2+ + O2

Superoxide Radicals in E. coli
Fe2+ + O2 Fe3+ + O2•
Radicals damage DNA, creating mutations

Breakdown of Superoxide Radicals
SOD
2O2 • + 2H+

Breakdown of Superoxide Radicals
SOD
2O2 • + 2H+ H2O2 + O2

Gene Expression
DNA
sodA

Gene Expression
DNA mRNA
Transcription
sodA

Gene Expression
DNA ProteinmRNA
Transcription Translation
sodA SOD
Protein Regulation
sodA gene SOD protein

Protein Regulation
Fur
sodA gene SOD protein
Previous Research
• Fur activates sodA transcription (Schaeffer, 2006)

Previous Research
• Fur activates sodA transcription (Schaeffer, 2006)
Fur sodA gene MORE SOD protein

Previous Research• Fur activates sodA transcription (Schaeffer, 2006)
Fur sodA gene MORE SOD protein
• Fur regulates sodA transcription when there are Fe+2 and many superoxide radicals present(Rollefson, et al. 2004)

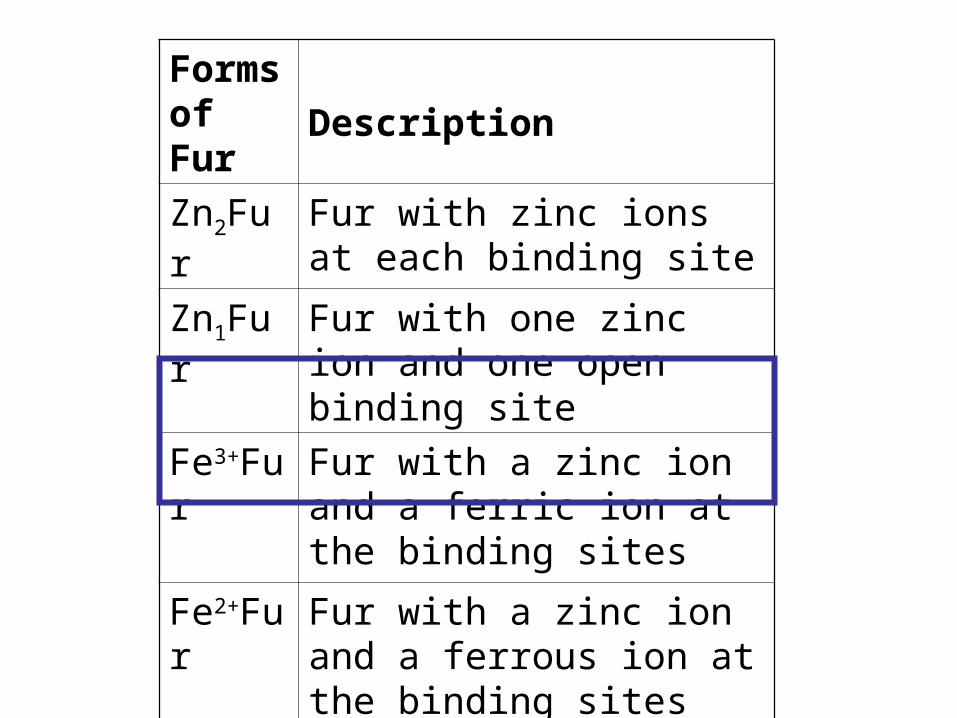
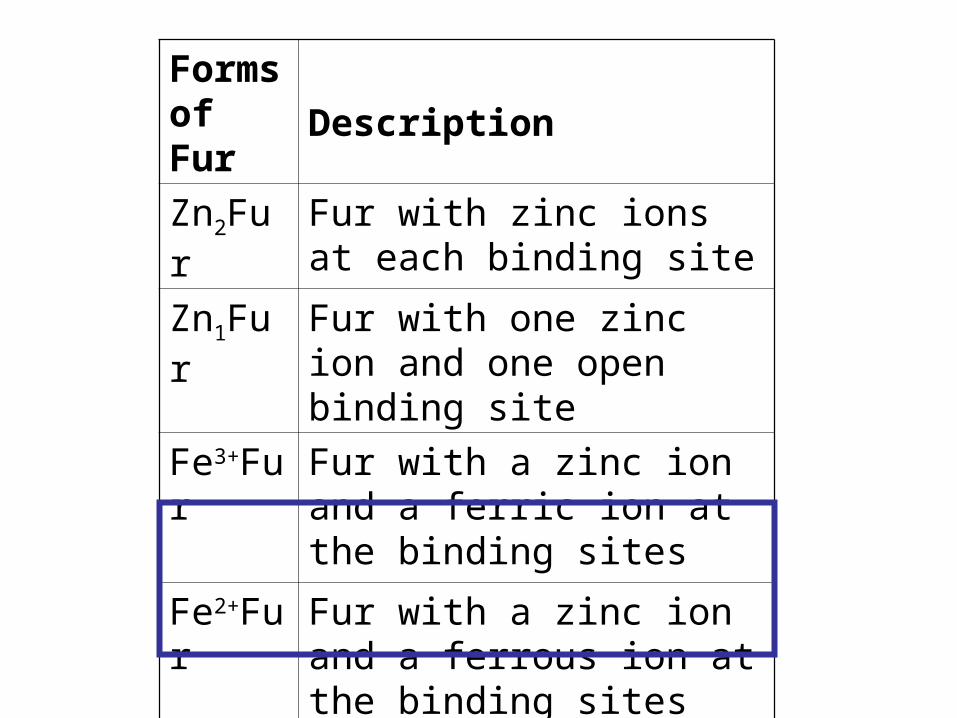
Forms of Fur Description
Zn2Fur Fur with zinc ions at each binding site
Zn1Fur Fur with one zinc ion and one open binding site
Fe3+Fur Fur with a zinc ion and a ferric ion at the binding sites
Fe2+Fur Fur with a zinc ion and a ferrous ion at the binding sites

Forms of Fur Description
Zn2Fur Fur with zinc ions at each binding site
Zn1Fur Fur with one zinc ion and one open binding site
Fe3+Fur Fur with a zinc ion and a ferric ion at the binding sites
Fe2+Fur Fur with a zinc ion and a ferrous ion at the binding sites
Forms of Fur Description
Zn2Fur Fur with zinc ions at each binding site
Zn1Fur Fur with one zinc ion and one open binding site
Fe3+Fur Fur with a zinc ion and a ferric ion at the binding sites
Fe2+Fur Fur with a zinc ion and a ferrous ion at the binding sites
Forms of Fur Description
Zn2Fur Fur with zinc ions at each binding site
Zn1Fur Fur with one zinc ion and one open binding site
Fe3+Fur Fur with a zinc ion and a ferric ion at the binding sites
Fe2+Fur Fur with a zinc ion and a ferrous ion at the binding sites

Forms of Fur Description
Zn2Fur Fur with zinc ions at each binding site
Zn1Fur Fur with one zinc ion and one open binding site
Fe3+Fur Fur with a zinc ion and a ferric ion at the binding sites
Fe2+Fur Fur with a zinc ion and a ferrous ion at the binding sites

First Goal
To compare activation of sodA transcription in the presence of the three metal-ion complexes of Fur:
• Zn1Fur
• Zn2Fur
• Fe3+Fur

First Hypothesis
Based on the research by Rollefson, et al. (2004), I hypothesized that Zn2Fur would be the metal-ion complex of Fur that most activates sodA transcription
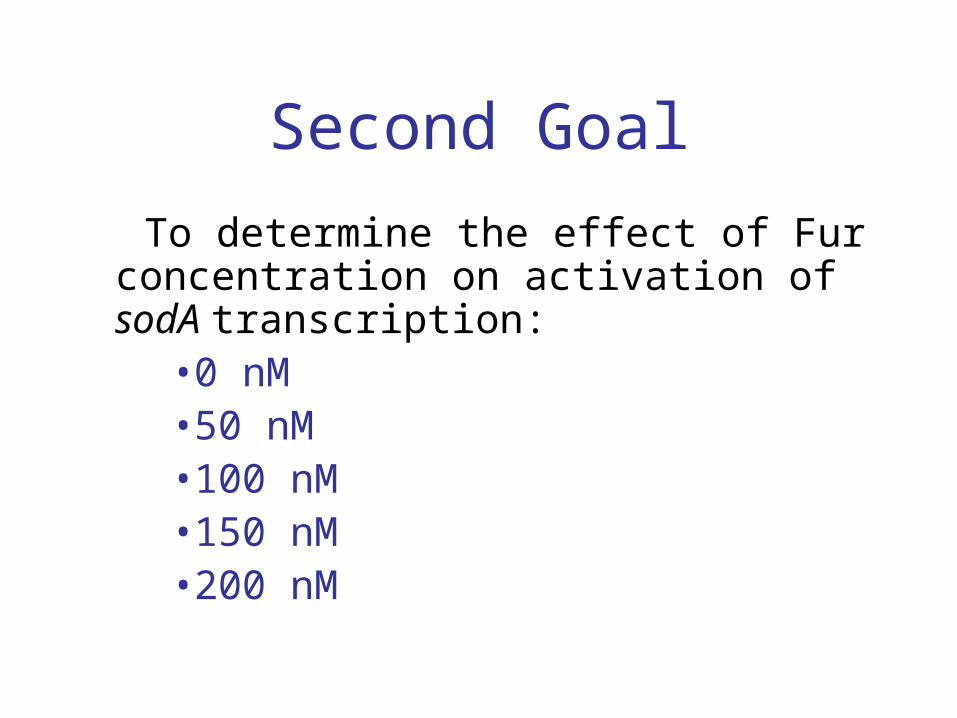
Second Goal
To determine the effect of Fur concentration on activation of sodA transcription:
• 0 nM• 50 nM• 100 nM• 150 nM• 200 nM

Second Hypothesis
Based on research by Shaeffer (2006), I hypothesized that increased Fur concentration would increase activation of sodA transcription

Third Goal To determine the root of and eliminate the
negative control signaling that was present in the Schaeffer study
Third Goal To determine the root of and eliminate the
negative control signaling that was present in the Schaeffer study
Fourth Goal
To optimize DNA band signaling by
modifying the Schaeffer Protocols

Methods—PCR
Polymerase Chain Reaction
Diagramed used by permission from K. Shaeffer
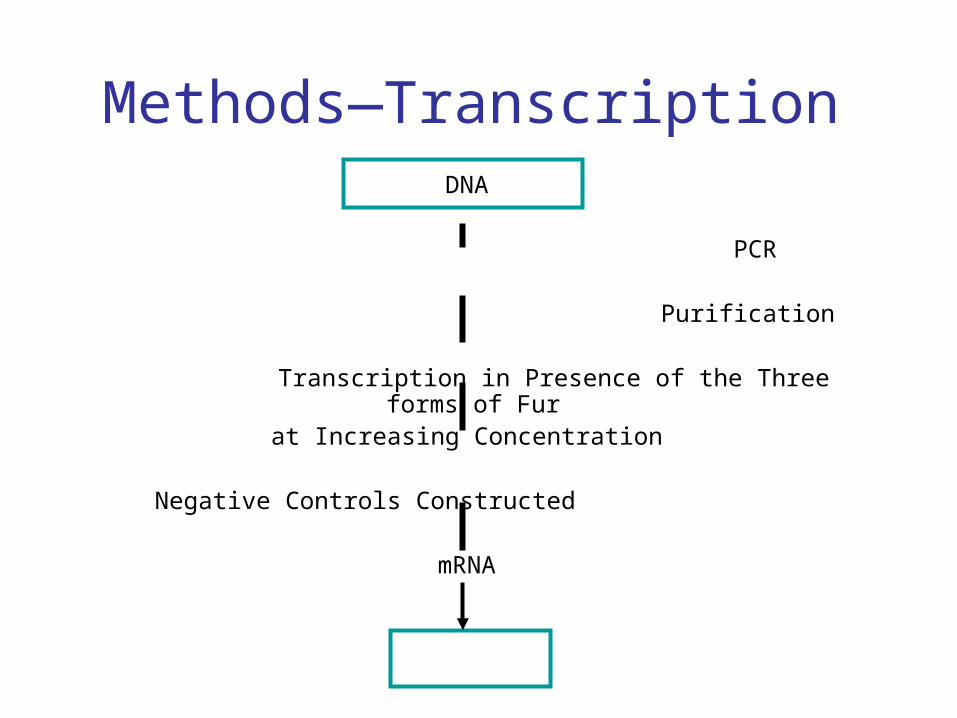
Methods—TranscriptionDNA
PCR Purification
Transcription in Presence of the Three forms of Fur at Increasing Concentration
Negative Controls Constructed
mRNA

Methods—Reverse TranscriptionmRNA
Reverse Transcription
Negative Controls Constructed
cDNA
PCR
Amplified cDNA

Methods—Gel Electrophoresis
Photo by Author

Methods—Visualization
QuickTime™ and aTIFF (Uncompressed) decompressor
are needed to see this picture.
VersaDoc CameraPhoto by K. Shaeffer used with permission

Results—sodA transcription of Zn1Fur
QuickTime™ and aTIFF (Uncompressed) decompressor
are needed to see this picture.
Lane 1-2: sodA transcribed in absence of Zn1Fur, Lane 3-4: sodA transcribed in presence of 50 nM Zn1Fur; Lane 5-6: sodA transcribed in presence of 100 nM Zn1Fur, Lane 7-8: sodA transcribed in presence of 150 nM Zn1Fur, Lane 9-10: sodA transcribed in presence of 0 nM Zn1Fur

Results—sodA transcription with Fe+3Fur
QuickTime™ and aTIFF (Uncompressed) decompressor
are needed to see this picture.
Lane 1-2: sodA transcribed in absence of Fe3+Fur, Lane 3-4: sodA transcribed in presence of 50 nM Fe3+Fur; Lane 5-6: sodA transcribed in presence of 100 nM Fe3+Fur, Lane 7-8: sodA transcribed in presence of 150 nM Fe3+Fur, Lane 9-10: sodA transcribed in presence of 0 nM Fe3+Fur

Results—sodA Transcription with Zn2Fur
QuickTime™ and aTIFF (Uncompressed) decompressor
are needed to see this picture.
Lane 1-2: sodA transcribed in absence of Zn2Fur, Lane 3-4: sodA transcribed in presence of 50 nM Zn2Fur; Lane 5-6: sodA transcribed in presence of 100 nM Zn2Fur, Lane 7-8: sodA transcribed in presence of 150 nM Zn2Fur, Lane 9-10: sodA transcribed in presence of 0 nM Zn2Fur
Results—Negative Controls Initial Trial
QuickTime™ and aTIFF (Uncompressed) decompressor
are needed to see this picture.
Lanes 1-3: positive controls, Lane 4: negative control (without Master Mix), Lane 5: negative control (without RT primers), Lane 6: empty, Lane 7: negative control (without cDNA), Lanes 8-10: positive controls
No cDNA

Results—Negative ControlsTranscription Assay Components
QuickTime™ and aTIFF (Uncompressed) decompressor
are needed to see this picture.
Lane 1: NTP-initiator mixture, Lane 2: RT primer #2, Lane 3: RT primer #3, Lane 4: negative control (without NTP-initiator mixture), Lane 5: negative control (without mRNA), Lane 6: negative control (without DNase), Lane 7: dNTP mixture,Lane 8: positive control
Lane 1-2: empty, Lane 3: DNase, Lane 4: RNA polymerase, Lane 5: negative control (without DNA), Lane 6: RNase inhibitor, Lane 7: empty, Lane 8: negative control (without cDNA)
QuickTime™ and aTIFF (Uncompressed) decompressor
are needed to see this picture.

Results—Negative Controls
QuickTime™ and aTIFF (Uncompressed) decompressor
are needed to see this picture.
Signaling Components Run with DNase
Lane 1: positive control, Lane 2: empty, Lane 3: RNase inhibitor incubated with DNase, Lane 4: NTP-initiator mixture incubated with DNase, Lane 5: 0.5 L RNA polymerase incubated with DNase, Lane 6: 2.0 RNA polymerase incubated with DNase, Lane 7: RNase inhibitor, NTP-initiator mixture, and RNA polymerase incubated with DNase, Lane 8: DNA incubated with DNase
Positive Control
Results—Negative Controls
QuickTime™ and aTIFF (Uncompressed) decompressor
are needed to see this picture.
Constructed during RT-PCR
Lane 1: positive control used in the negative controls (originally run in Figure 9, Lane 1), Lane 2: positive control (originally run in Figure 4, Lane 2), Lane 3: negative control (without mRNA, RT primers 2 and 3, reverse transcriptase, and dNTP mixture), Lane 4: negative control (without RT primers 2 and 3), Lane 5: negative control (without reverse transcriptase), Lane 6: negative control (without mRNA), Lane 7: negative control (without dNTP mixture), Lane 8: negative control (without cDNA), Lane 9: negative control (without Master Mix), Lane 10: negative control (without cDNA or RT primers)

Results—Protocol Optimization
QuickTime™ and aTIFF (Uncompressed) decompressor
are needed to see this picture.
PCR Products with Different Concentrations of Primers
Lane 4: PCR product containing 4 L of sodA primers; Lane 6: PCR product containing 1 L of sodA primers; Lane 8: PCR product containing 8 L sodA primers
4 L

Results—Protocol Optimization
QuickTime™ and aTIFF (Uncompressed) decompressor
are needed to see this picture.
PCR Products with Different Concentrations of Primers
Lane 4: PCR product containing 4 L of sodA primers; Lane 6: PCR product containing 1 L of sodA primers; Lane 8: PCR product containing 8 L sodA primers
8 L

Results—Protocol Optimization
QuickTime™ and aTIFF (Uncompressed) decompressor
are needed to see this picture.
PCR Products with Different Concentrations of Primers
Lane 4: PCR product containing 4 L of sodA primers; Lane 6: PCR product containing 1 L of sodA primers; Lane 8: PCR product containing 8 L sodA primers
1 L

Discussion—First Goal
• Hypothesis neither supported nor refuted
-sodA transcription in presence of Zn2Fur unsuccessful
• Zn1Fur most activated sodA transcription
To determine what form of Fur most activates sodA transcription

Future Work—First Goal
• Repeat sodA transcription in presence of Zn2Fur
• Perform sodA transcription in the presence of other metal-ion complexes of Fur

Discussion—Second Goal
• Hypothesis correct
-Activation of sodA transcription did increase with Fur concentration
To determine the effect of Fur concentration on sodA transcription

Discussion—Third Goal
• Partially successful
-Negative control signaling present
-Cause of signaling determined to originate during process of RT-PCR
To eliminate and determine the cause of negative control signaling

Future Work—Third Goal
• Determine what in RT-PCR is causing the signaling - Examine each component of the RT-PCR assay
Discussion—Fourth Goal
• PCR product with 1 L of each sodA primer produced the best signaling– Amplification protocol was modified to
reflect the optimization
To optimize the Shaeffer PCR Protocol

Applications of Research
• Break down more harmful superoxide radicals

Applications of Research
• Break down more harmful superoxide radicals
• Fur–sodA interaction may serve as model in human systems
Applications of Research
• Break down more harmful superoxide radicals
• Fur–sodA interaction may serve as model in human systems
• May lead to synthesis of drugs that model regulatory proteins and modify expression of genes

Acknowledgements
• Dr. Kathy Olson
• University of St. Thomas Chemistry and Biology Departments
• Mrs. Lois Fruen
• Dr. Jacob Miller
• Team Research

Regulation of Superoxide Radicals in Escherichia coli
Sara H. Schilling2007