
REGULATION OF SAND SUPPLY · Mines and Mineral Act No 33 of 1992 Mines and Minerals (Amendment)...
45
REGULATION OF SAND SUPPLY ROLE OF THE GEOLOGICAL SURVEY AND MINES BUREAU Geological Survey and Mines Bureau SRI LANKA Eng. K. V. Jagath B.Sc. Eng. (SL) MIT(SL) REGIONAL MINING ENGINEER
Transcript of REGULATION OF SAND SUPPLY · Mines and Mineral Act No 33 of 1992 Mines and Minerals (Amendment)...

REGULATION OF SAND SUPPLY
ROLE OF THE
GEOLOGICAL SURVEY AND MINES BUREAU
Geological Survey and Mines Bureau
SRI LANKA
Eng. K. V. JagathB.Sc. Eng. (SL)
MIT(SL)
REGIONAL MINING ENGINEER

GSMB
Vision Connecting earth, natural resources & people to drive
socio economic development of Sri Lanka.
Mission In achieving its vision GSMB advocates for the
collective interests of Sri Lanka's natural resources and
the environment through education and collaboration
with our industry members, government, and other
stakeholders.
Mines and Mineral Act No 33 of 1992
Mines and Minerals (Amendment) Act, No.66 of
2009
ACTs and REGULATIONS

GSMB…
The Bureau comes under the purview of the
Ministry of Mahaweli Development &
Environment
Provides the institutional support structure to
the entire mineral sector while administering the
Mines and Minerals Act.
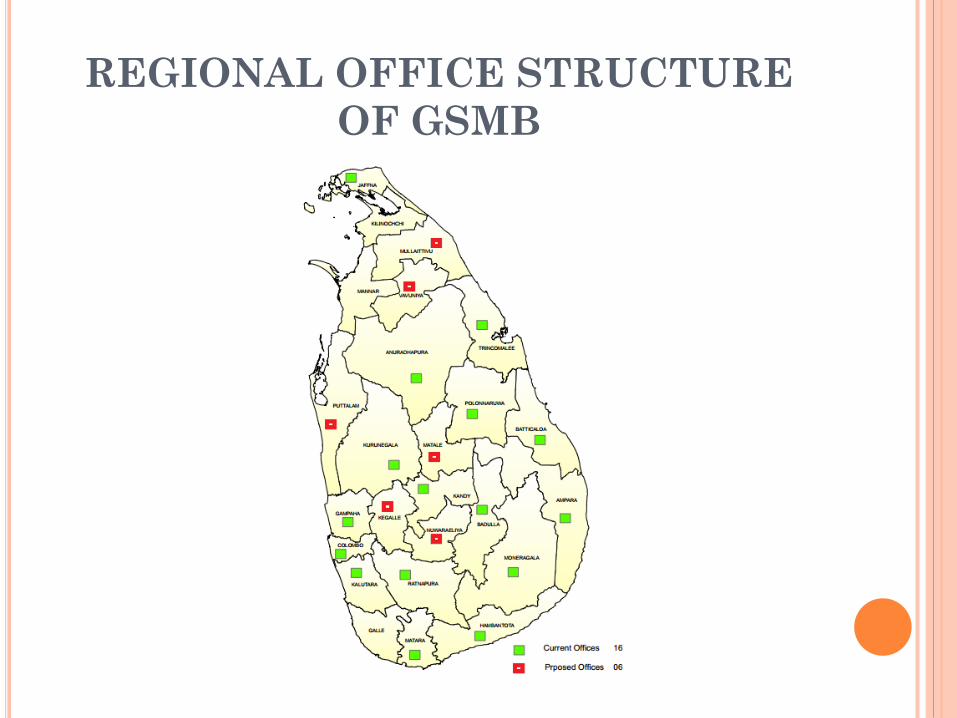
REGIONAL OFFICE STRUCTURE
OF GSMB
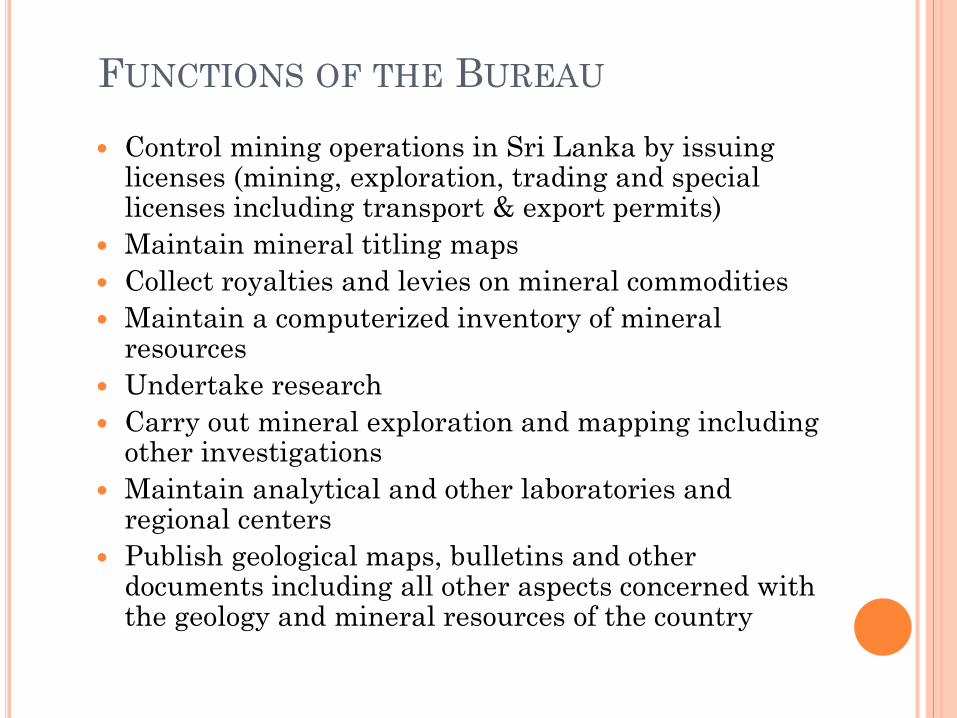
FUNCTIONS OF THE BUREAU
Control mining operations in Sri Lanka by issuing licenses (mining, exploration, trading and special licenses including transport & export permits)
Maintain mineral titling maps
Collect royalties and levies on mineral commodities
Maintain a computerized inventory of mineral resources
Undertake research
Carry out mineral exploration and mapping including other investigations
Maintain analytical and other laboratories and regional centers
Publish geological maps, bulletins and other documents including all other aspects concerned with the geology and mineral resources of the country

LICENSE INFORMATION
Under the Mines & Minerals Act No. 33 of 1992,
the GSMB issues following types of licenses.
Exploration Licences
Mining Licences (Artisanal, Industrial,
Reserved Minerals)
Trading Licences
Export Licences
Transport Licences

MINERALS INDUSTRY
An Overview
Sri Lanka, though a small nation, is reasonably
endowed with industrial minerals but not with metallic
and energy minerals. The industrial minerals base of
Sri Lanka as a group constitute the most important
physical resource-base in terms of quantity and value.
No energy minerals have been found yet on land or
within the Exclusive Economic Zone of Sri Lanka
offshore.

MINERAL SAND OCCURRENCES ALONG THE
BEACH ZONES OF SRI LANKA
Pesalai
(Mannar District)
Kirinda
(Hambantota District)
Kathiraveli
(Batticaloa District)
Lankapatuna
(Trincomalee District)

CERAMIC RAW MATERIALS:
Kaolin or China clay:
Confined to the south west sector of the island.
Residual deposits
Occur as lenses and pockets of kaolin in swampy ground.
The two best known deposits are at Boralegamuwa and
Meetiyagoda,
Lanka ceramic ltd., The main producer in the country.

Ball Clay:
best ball clays occur at Dediyawala in the Kaluthara
district.
Over 90% of particles in the clay material are less
than 10 microns in diameter.
The reserves of ball clay are sufficient for the next 5
to 6 decades.
Ball clays also occur in the Nilwala Ganga flood
plains and in other areas
Alluvial Clay:
Sri Lanka is devoid of exploitable deposits of
consolidated clays such as mudstones and shales
used mainly in the brick and tile industry of the
world.
Over 50% of the brick and tile industry is
concentrated in the lower reaches of the Maha Oya in
the Kochchikade and Dankotuwa areas where a large
number of tile factories operate on alluvial clays to
produce over 60 mln. roofing tiles per annum.

FLEDSPAR
The main occurrences of feldspar are found at
Haputale, Kaikawala, Timbolketiya, Elahera,
Namal Oya and Koslanda is in the Owella
Estate, Rattota which is mined by Lanka
Ceramic Ltd.
Number of small to medium feldspar occurrences
have been reported recently in Ratnapura

QUARTZ (SILICA):
The best deposits occur in the Opanaike,
Pelmadulla, Pussella, Rattota, Ratnapura and
Galaha areas.

SILICA SAND:
The best known silica sand deposits are found in
the Marawila, Madampe and Nattandiya areas.
A very large deposit occurs in the Ampan-
Vallipuram area in the Jaffna Peninsula.
Main silica sand uses are Piramal Glass Ltd.,
Lanka Tiles PLC and Royal Ceramic Lanka Ltd.
Export of silica sand in any form is not
permitted.

SILICA SAND MINING & PROCESSING
Silica Sand Mining
Removing Impurities by
Washing
Particle Size Separation

CALCITE:
The best known deposit occurs in the Blangoda
area.
It is used mostly for the manufacture of ceramic
products, in the chemical industry, in
formulation of glazes and as fillers and in the
paint, fertilizer, lime, cement and whiting
industry.
The transparent and clear crystals are used in
the optical industry

CONSTRUCTION MATERIALS:
Miocene Limestone:
The miocene limestone occurs in the north western
coastal belt and the jaffna peninsula.
Surficial deposits.
Best known outcrops are located north of karativu,
near puttalam, from aruakkalu hill to kudremalai
point.

DIMENSION STONE:
Dimension stones are cut to specific shapes and
sizes for use in buildings and for other
construction purposes.
Sri Lanka has large resources of rocks suitable
for dimension stone, but dimension stone and
polished slabs are still turned out in limited
quantities.
Different types of dimension stone are imported
to meet the local demand.

CRUSHED AND BROKEN ROCK:
Different sizes of broken and crushed rock are
produced according to the requirements of
building and road construction industries.
Total number of licensed metal quarries in
operation is 1 435.
Annual production of crushed and broken rock is
about 7.28 million cubic meters.
INLAND CORAL:
The best known coral deposits are found in the
Akurala - Hikkaduwa area
Coral deposits are also found overlying the
Miocene limestone in the Jaffna Penninsula.
Other areas where coral beds have been recorded
are Kuchchaveli and Delft Island.

FERTILIZER MATERIALS:
Dolomite:
Dolomite deposits are found in the Digana,
Talatuoya, Matale, Badulla and Ratnapura of areas.
The magnesium content varies and dolomite with a
MgO content of 18-22% is of common occurrence.

APATITE (PHOSPHATE ROCK):
The famous apatite (Phosphate rock) deposit is
situated in the North Central province in the
district of Anuradhapura.
Total reserves are estimated around 60 million
tonnes.
The deposit occurs in the form of a number of
surface hillocks.
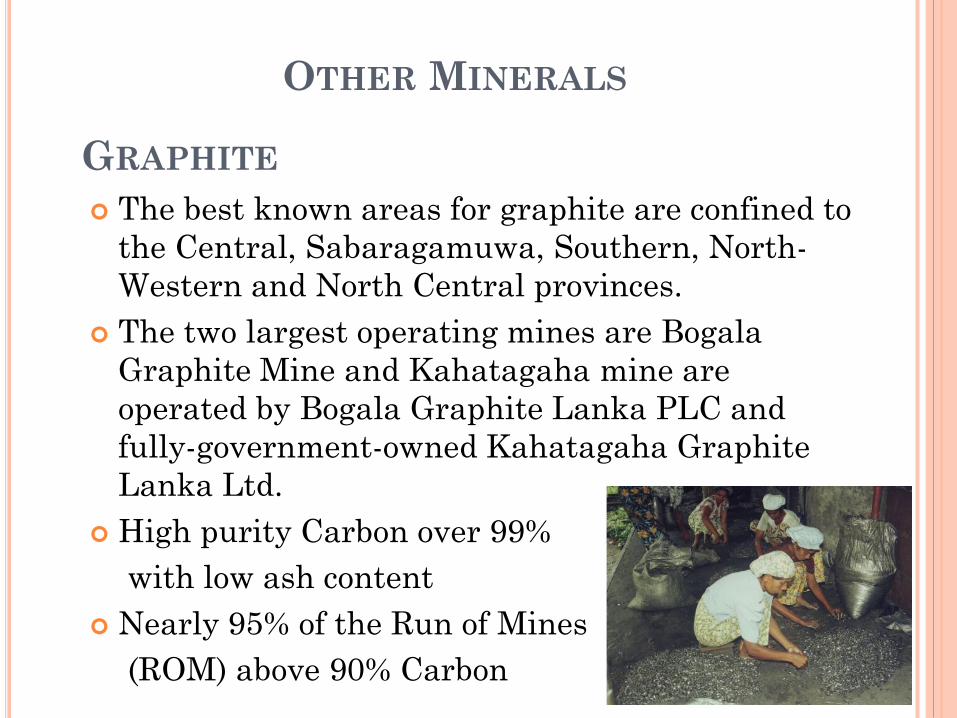
GRAPHITE
The best known areas for graphite are confined to
the Central, Sabaragamuwa, Southern, North-
Western and North Central provinces.
The two largest operating mines are Bogala
Graphite Mine and Kahatagaha mine are
operated by Bogala Graphite Lanka PLC and
fully-government-owned Kahatagaha Graphite
Lanka Ltd.
High purity Carbon over 99%
with low ash content
Nearly 95% of the Run of Mines
(ROM) above 90% Carbon
OTHER MINERALS
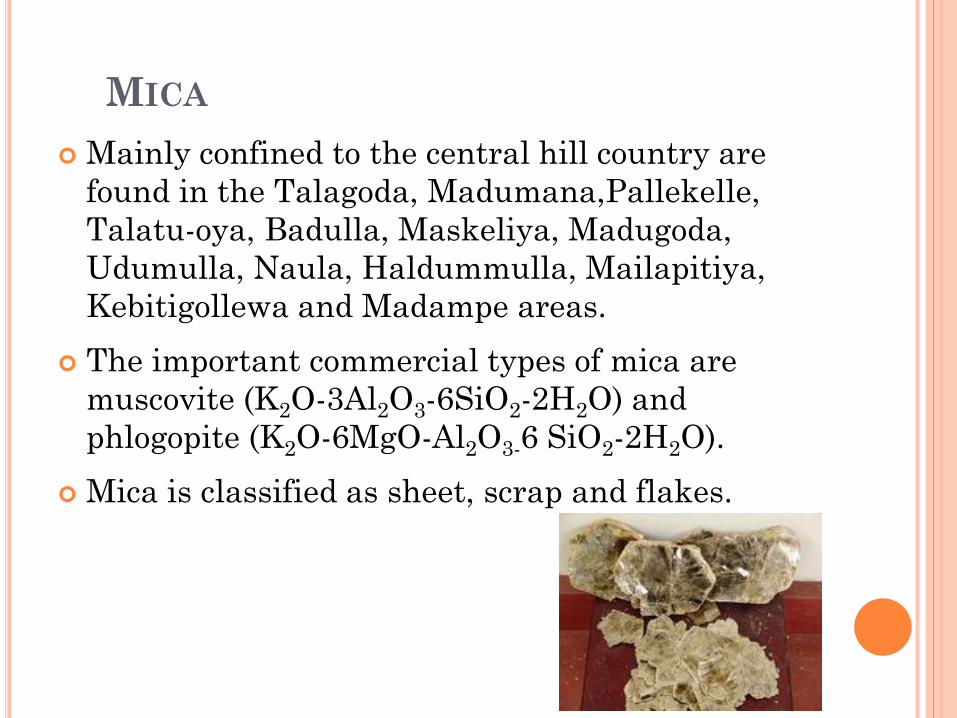
MICA
Mainly confined to the central hill country are
found in the Talagoda, Madumana,Pallekelle,
Talatu-oya, Badulla, Maskeliya, Madugoda,
Udumulla, Naula, Haldummulla, Mailapitiya,
Kebitigollewa and Madampe areas.
The important commercial types of mica are
muscovite (K2O-3Al2O3-6SiO2-2H2O) and
phlogopite (K2O-6MgO-Al2O3-6 SiO2-2H2O).
Mica is classified as sheet, scrap and flakes.

SERUWILA COPPER – MAGNETITE DEPOSIT
Near Trincomalee
First base metal find in the
country by the department of
geological survey, the
predecessor to the geological
survey and mines bureau.
Ore reserve of 4 million tonnes
of which 40% is iron (Fe) and
1.5 to 2% is copper (Cu).
Indications of the presence of
minor amounts of nickel,
cobalt, silver, and bismuth
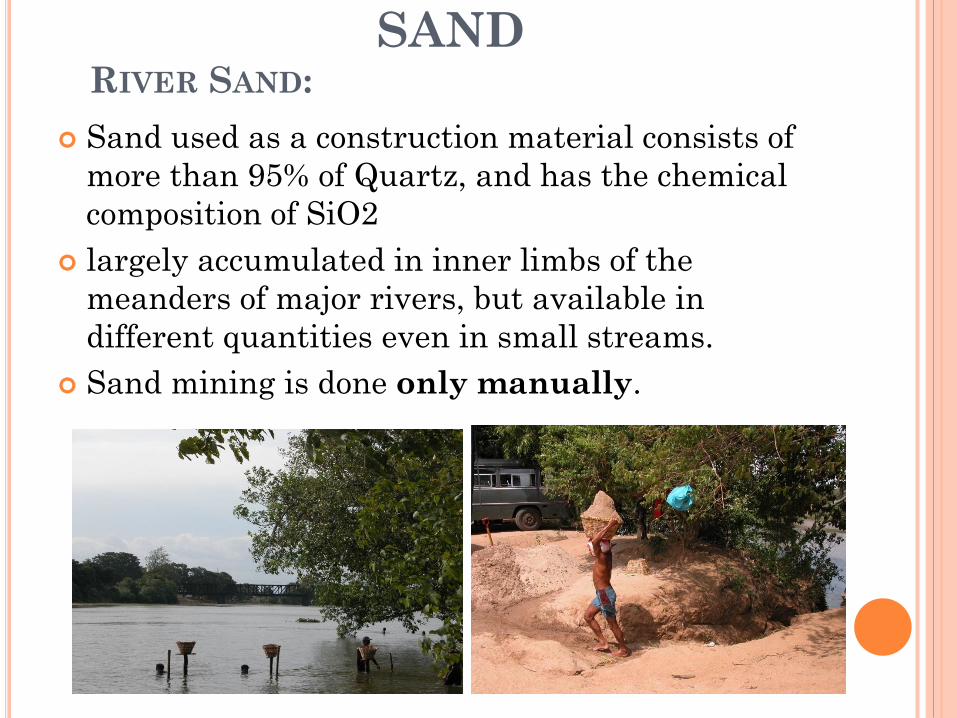
SANDRIVER SAND:
Sand used as a construction material consists of
more than 95% of Quartz, and has the chemical
composition of SiO2
largely accumulated in inner limbs of the
meanders of major rivers, but available in
different quantities even in small streams.
Sand mining is done only manually.
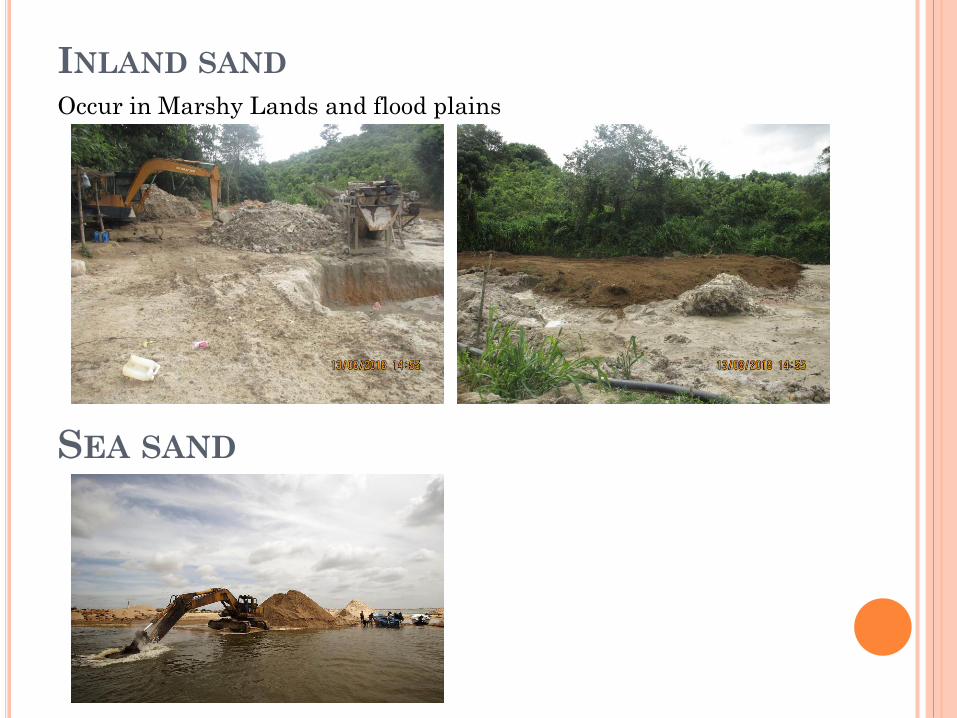
INLAND SAND
Occur in Marshy Lands and flood plains
SEA SAND

OFF SHORE SAND
PROCESSING SAND
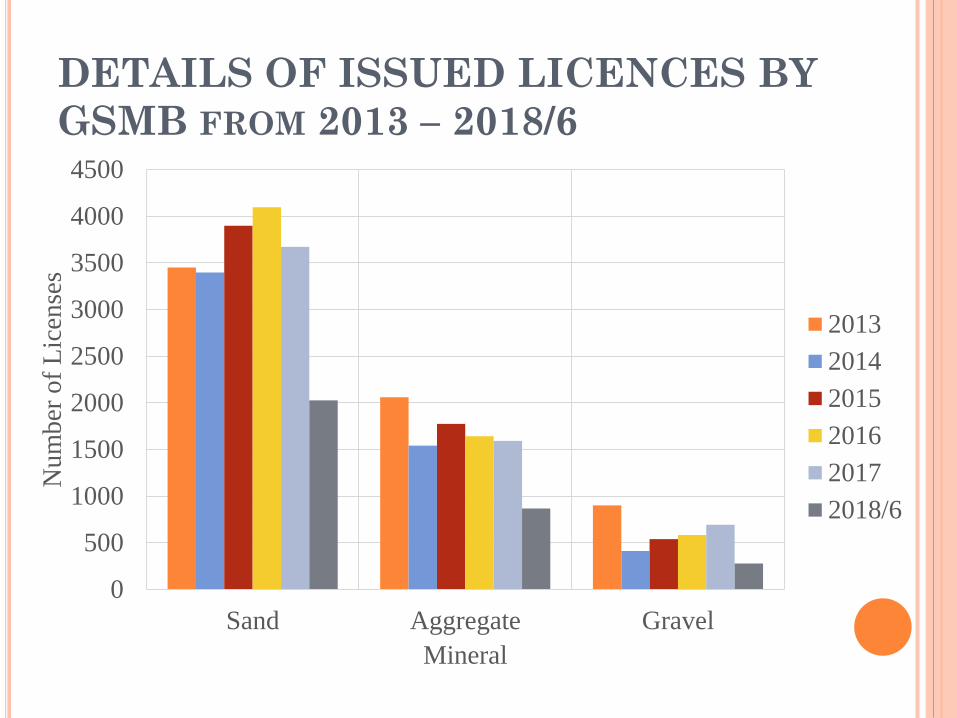
DETAILS OF ISSUED LICENCES BY
GSMB FROM 2013 – 2018/6
0
500
1000
1500
2000
2500
3000
3500
4000
4500
Sand Aggregate Gravel
Nu
mb
er o
f L
icen
ses
Mineral
2013
2014
2015
2016
2017
2018/6
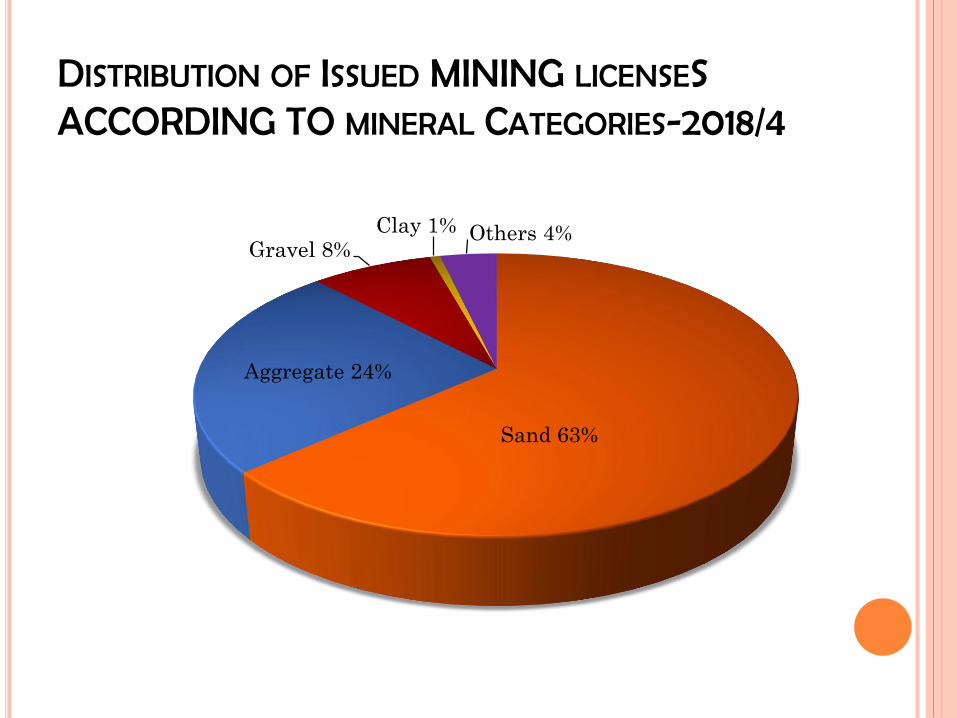
DISTRIBUTION OF ISSUED MINING LICENSESACCORDING TO MINERAL CATEGORIES-2018/4
Sand 63%
Aggregate 24%
Gravel 8%Clay 1% Others 4%
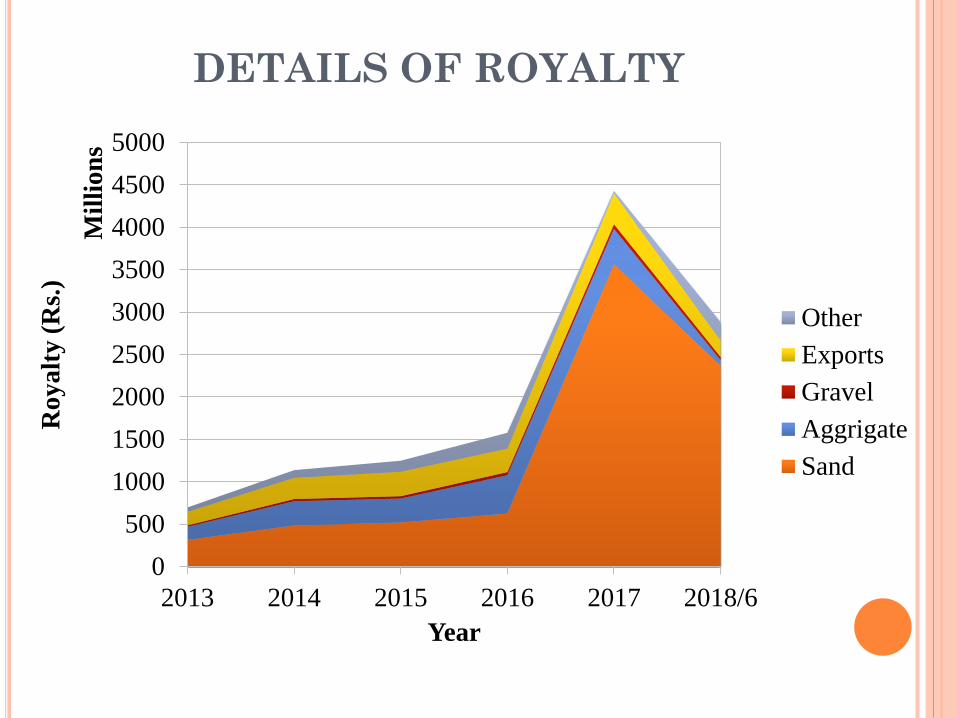
DETAILS OF ROYALTY
0
500
1000
1500
2000
2500
3000
3500
4000
4500
5000
2013 2014 2015 2016 2017 2018/6
Ro
ya
lty (
Rs.
)
Mil
lion
s
Year
Other
Exports
Gravel
Aggrigate
Sand
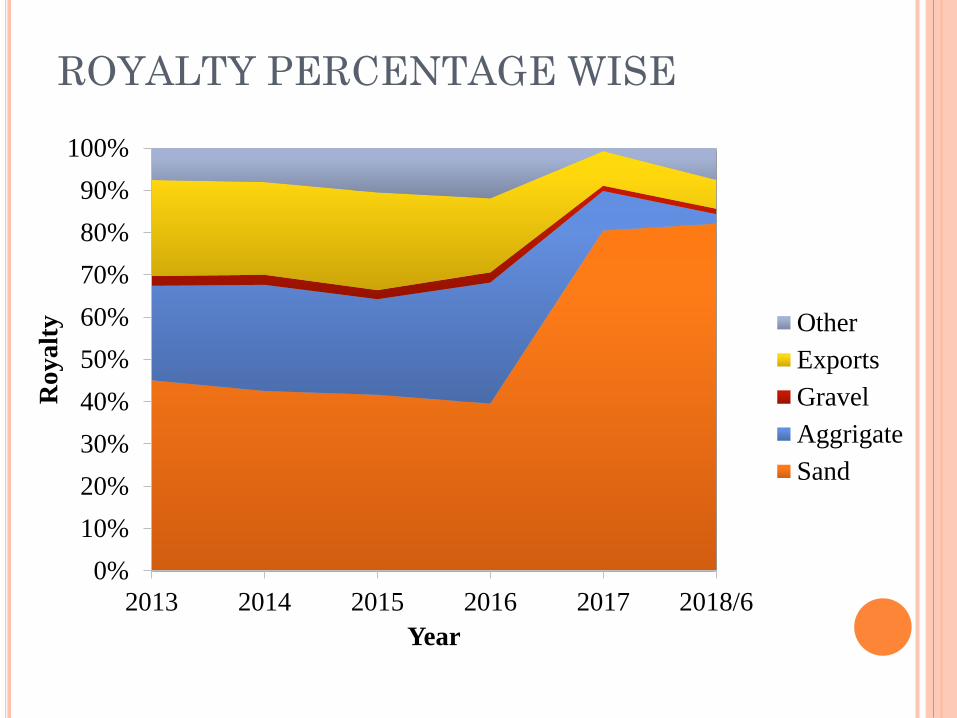
ROYALTY PERCENTAGE WISE
0%
10%
20%
30%
40%
50%
60%
70%
80%
90%
100%
2013 2014 2015 2016 2017 2018/6
Ro
ya
lty
Year
Other
Exports
Gravel
Aggrigate
Sand

Mineral Quantities covered by GSMB
Licenses
0
5
10
15
20
25
2013 2014 2015 2016 2017 2018/6
Qu
an
tity
(cu
bes
)
Mil
lion
s
Year
Gravel
Aggrigate
Sand

Sand Quantities covered by GSMB
Licenses
0
2
4
6
8
10
12
2016 2017 2018/6
Qu
an
tity
(cu
bes
)
Mil
lio
ns
Year
Process sand
Inland sand
River sand
Sea sand
Sand

DescriptionYear
2013 2014 2015
Cement (MT '000)Local production 1910 1884 2287
Imports 4123 4363 4092
Total cement usage within the
country 6033 6247 6379
Equivalent sand cubes
(1 cube = 2.83 m3 Sand specific gravity = 2600 kg/m3)
cement: sand as 1:3.5 2869734 2971528 3034316
cement: sand as 1:4 3279696 3396032 3467790
cement: sand as 1:4.5 3689658 3820535 3901264
cement: sand as 1:5 4099619 4245039 4334738
SAND DEMAND VS SAND PRODUCTION
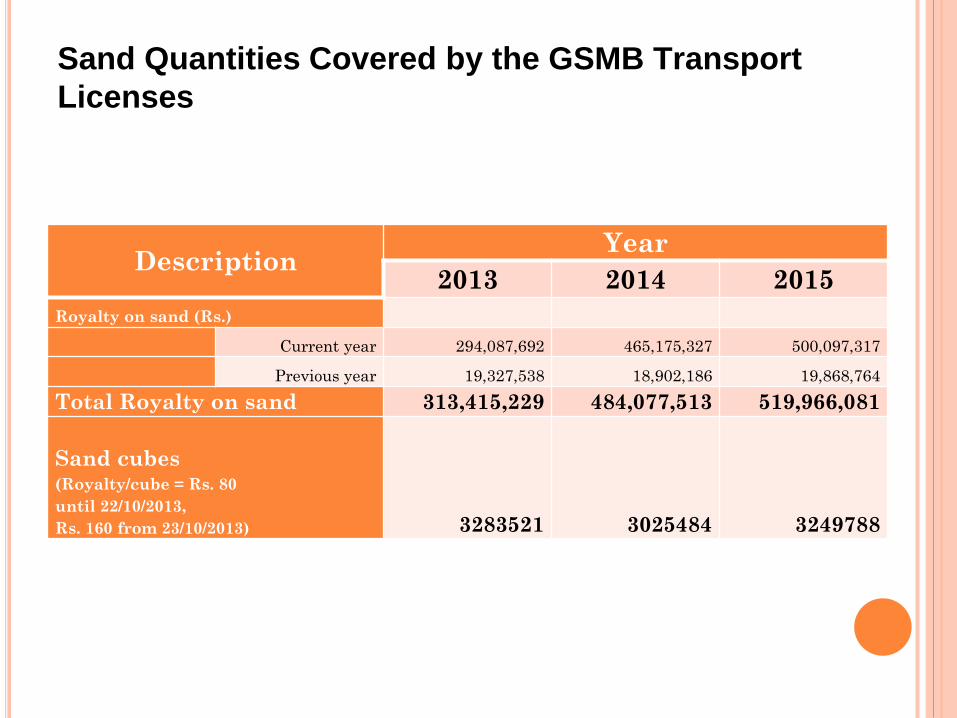
Sand Quantities Covered by the GSMB Transport
Licenses
DescriptionYear
2013 2014 2015
Royalty on sand (Rs.)
Current year 294,087,692 465,175,327 500,097,317
Previous year 19,327,538 18,902,186 19,868,764
Total Royalty on sand 313,415,229 484,077,513 519,966,081
Sand cubes(Royalty/cube = Rs. 80
until 22/10/2013,
Rs. 160 from 23/10/2013) 3283521 3025484 3249788

Gap between sand demand and supply
Cement/sand amounts
(cubes)
Year
2013 2014 2015
Cement 676763 700768 715576
Ca
lcu
late
d s
an
d d
em
an
d
cement: sand as
1:3.5 3013220 3120104 3186032
cement: sand as
1:4 3443680 3565833 3641180
cement: sand as
1:4.5 3874140 4011562 4096327
cement: sand as
1:5 4304600 4457291 4551475
Sand amount covered
by GSMB TPLs 3283521 3025484 3249788

PERCENTAGE TO CEMENT BASED
CALCULATED SAND AMOUNT
Difference as a percentage to cement
based calculated sand amountYear
2013 2014 2015
cem
en
t: s
an
d 1:3.5 ratio -9 3 -2
1:4 ratio 5 15 11
1:4.5 ratio 15 25 21
1:5 ratio 24 32 29

-15
-10
-5
0
5
10
15
20
25
30
35
2013 2014 2015
Vari
ati
on
(%
)
Year
consumption > regulate
consumption < regulate1:3.5
1:4
1:4.5
1:5
Above graph indicate that more than 65% of sand circulate
within the country was covered by the GSMB licenses, if we
assume cement: sand ratio as 1:5

EXISTING WEAKNESSES,
DRAWBACKS AND ISSUES High demand of building materials due to recent
development projects
People who need to purchase minerals must depend
on the Mining license holder
Time consumption to obtain a license
Forged Transport licenses
No online checking of the legality of issued Transport
licenses
No proper enforcement mechanism either GSMB or
police on illegal activities

SOME ENVIRONMENTAL PROBLEMS DUE
TO EXCESSIVE SAND MINING
Land Degradation
River Bank Erosion
Salinity Intrusion
Loss of Bio Diversity

Long-term solutions
Research and development to find an alternative
materials to fulfil the demand and supply gap of
natural building materials
Transport licenses must be issued to the
transporters
As river sand gradually diminishes, we
should find alternatives.
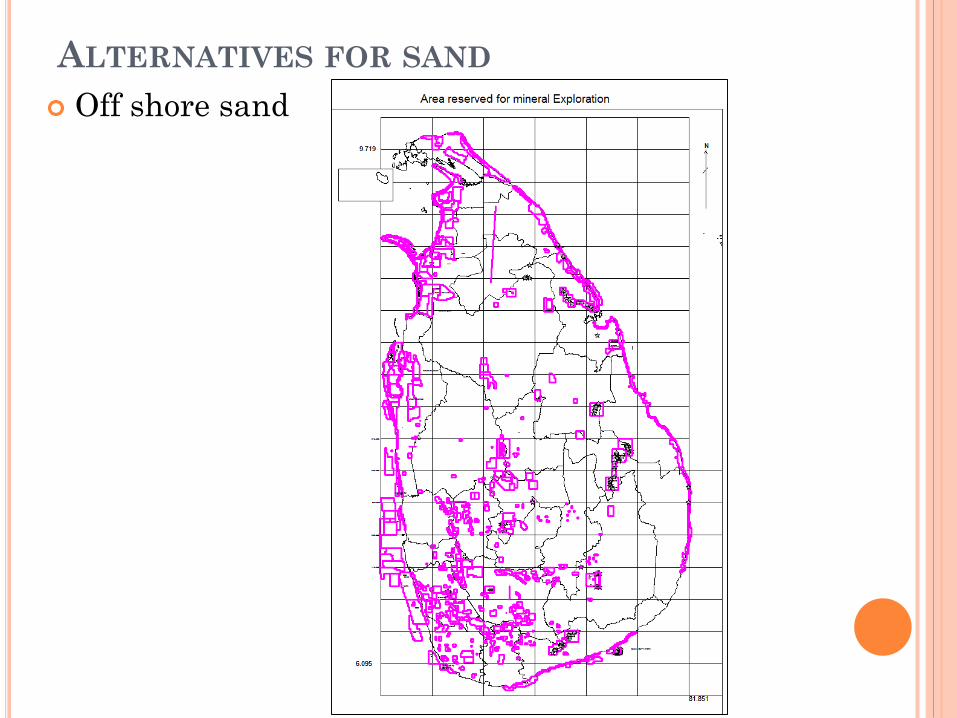
ALTERNATIVES FOR SAND
Off shore sand

THANK YOU..!

![THE MINES AND MINERALS (DEVELOPMENT AND REGULATION) ACT ... · 4 THE MINES AND MINERALS (DEVELOPMENT AND REGULATION) ACT, 1957 ACT NO. 67 OF 1957 [28 th December, 1957.] An Act to](https://static.fdocuments.in/doc/165x107/5f01ef7c7e708231d401c334/the-mines-and-minerals-development-and-regulation-act-4-the-mines-and-minerals.jpg)


![THE MINES ACT, 1952 ACT 1952.pdf · THE MINES ACT, 1952 ACT NO. 35 OF 1952 1* [15th March, 1952.] An Act to amend and consolidate the law relating to the regulation of labour and](https://static.fdocuments.in/doc/165x107/5f9260a20ec72777345fbdef/the-mines-act-act-1952pdf-the-mines-act-1952-act-no-35-of-1952-1-15th-march.jpg)
![Anti-Personnel Mines prohition Act [No. 36 of 2003] mines 2.pdf · unilaterally destroyed all the Republic’s stockpiled anti-personnel mines, save ... Act No. 36,2003 ANTI-PERSONNEL](https://static.fdocuments.in/doc/165x107/5b95a86609d3f2de4a8c4f28/anti-personnel-mines-prohition-act-no-36-of-2003-mines-2pdf-unilaterally.jpg)