REGULATION OF GLUCOSE METABOLISM IN A HEPATIC AND …
104
REGULATION OF GLUCOSE METABOLISM IN A HEPATIC AND MUSCLE CELL LINE BY ADIPONECTIN Except where reference is made to the work of others, the work described in this thesis is my own or was done in collaboration with my advisory committee. This thesis does not include proprietary or classified information. ________________________________________ Min Ding Certificate of Approval: ____________________________ ___________________________ Robert J. Kemppainen Robert L. Judd, Chair Professor Associate Professor Anatomy, Physiology and Anatomy, Physiology and Pharmacology Pharmacology ____________________________ ___________________________ Doug White Marie W. Wooten Associate Professor Professor Nutrition and Food Science Biological Sciences ____________________________ Stephen L. McFarland Acting Dean Graduate School
Transcript of REGULATION OF GLUCOSE METABOLISM IN A HEPATIC AND …

REGULATION OF GLUCOSE METABOLISM IN A HEPATIC AND MUSCLE CELL
LINE BY ADIPONECTIN
Except where reference is made to the work of others, the work described in this thesis is my own or was done in collaboration with my advisory committee. This thesis does not
include proprietary or classified information.
________________________________________ Min Ding
Certificate of Approval:
____________________________ ___________________________ Robert J. Kemppainen Robert L. Judd, Chair Professor Associate Professor Anatomy, Physiology and Anatomy, Physiology and Pharmacology Pharmacology ____________________________ ___________________________ Doug White Marie W. Wooten Associate Professor Professor Nutrition and Food Science Biological Sciences
____________________________ Stephen L. McFarland Acting Dean Graduate School

REGULATION OF GLUCOSE METABOLISM IN A HEPATIC AND MUSCLE CELL
LINE BY ADIPONECTIN
Min Ding
A Thesis
Submitted to
The Graduate Faculty of
Auburn University
In Partial Fulfillment of the
Requirements for the
Degree of
Master of Science
Auburn, Alabama
Dec. 16, 2005
iii
REGULATION OF GLUCOSE METABOLISM IN A HEPATIC AND MUSCLE CELL
LINE BY ADIPONECTIN
Min Ding
Permission is granted to Auburn University to make copies of this thesis at its discretion, upon request of individuals or institutions and at their expense. The author reserves all
publication rights.
______________________________ Signature of Author
______________________________ Date

iv
VITA
Min Ding, daughter of Shannan Wang and Li Ding, was born on August 22, 1978,
in Haian, Jiangsu, People’s Republic of China. She graduated from Jiangsu Haian High
School in 1995. She studied in Nanjing Medical University for five years and graduated
with a Bachelor of Medicine degree in Clinical Medicine in July, 2000. She attended
Cellular and Molecular Biosciences Graduate Program of Auburn University in August,
2002.

v
THESIS ABSTRACT
REGULATION OF GLUCOSE METABOLISM IN A HEPATIC AND MUSCLE CELL
LINE BY ADIPONECTIN
Min Ding
Master of Science, Dec.16, 2005 (B.M., Nanjing Medical University, 2000)
104 Typed Pages
Directed by Dr. Robert L. Judd
Adiponectin is a 30-kD protein secreted by adipose tissue under normal
conditions. Serum adiponectin concentrations are decreased in obesity and type 2
diabetes. AdipoR1 and AdipoR2 are two receptors of adiponectin with AdipoR1
abundantly expressed in muscle and AdipoR2 predominantly expressed in liver.
Adiponectin has been demonstrated to decrease hepatic glucose production by inhibiting
hepatic G-6-Pase and PEPCK mRNA expression, but its effects on hepatic glycogen
synthesis have not been examined. In addition, eukaryotically and bacterially expressed
adiponectin may have different effects on glucose metabolism due to some important
structural differences. In this study, we investigated the effects of eukaryotically and

vi
bacterially expressed adiponectin on hepatic glycogen synthesis as well as the
mechanisms involved in this process. We also compared the effects of these two sources
of adiponectin on muscle basal glucose uptake. A human hepatoma cell line (HepG2) and
a rat ventricular cell line (H9c2) were utilized in our experiments. Hepatic basal and
insulin-stimulated glycogen synthesis was evaluated in HepG2 cells treated for 3 h with
eukaryotically expressed adiponectin (1 µg/ml and 5µg/ml), bacterially expressed
adiponectin (20 µg/ml and 30 µg/ml), 1nM insulin and 1 nM insulin plus eukaryotically
expressed adiponectin (1 µg/ml and 5µg/ml). Also, HepG2 cells were used to determine if
adiponectin impacted insulin receptor signaling. Muscle glucose uptake was evaluated in
H9c2 cells treated for 10 min with the same concentrations of eukaryotically and
bacterially expressed adiponectin. The results indicated that AdipoR2 is present in
HepG2 cells by western blotting and real-time PCR, and its expression is inhibited by
insulin. AdipoR1 mRNA is also verified to be present in H9c2 cells by real-time PCR.
For the metabolic effects, eukaryotically but not bacterially expressed adiponectin
inhibits basal and insulin-stimulated glycogen synthesis in HepG2 cells, while bacterially
but not eukaryotically expressed adiponectin stimulates basal glucose uptake in H9c2
cells. Importantly, adiponectin does not utilize the insulin signal pathway to produce the
effect on hepatic glycogen synthesis, as IRS-1 was not phosphorylated by adiponectin in
HepG2 cells. Our data suggest that multimer formation of higher order structure is very
important for adiponectin’s function in liver but not in muscle. A major effect of
adiponectin on hepatic glucose metabolism may be to inhibit glycogen synthesis thereby
providing more glucose for glycolysis and ATP generation.
vii
ACKNOWLEDGMENTS
The author expresses her sincere thanks and appreciation to her major professor,
Dr. Robert L. Judd for his continuous guidance, patience, understanding and great
support during the entire course of this study. She also thanks Dr. Robert J. Kemppainen
for providing some adiponectin, and helpful suggestions and constant support on the
whole project. She expresses her sincere thanks to Ms. Qiao Zhong and Ms. Kathy
O’Donnell for some experimental technical help. In addition, she thanks the other
graduate committee members, Dr. Doug White and Dr. Marie M. Wooten for their
guidance and support.
The author would like to thank her parents, and her brother, Xin Wang for their
encouragement and support during these years. She also wishes to thank Haibo Fan for
his help, encouragement and endless support. She expresses special thanks to Boshell
Diabetes and Metabolic Diseases Research Program, and Auburn University Cellular and
Molecular Biosciences Program for giving her the opportunity to complete the degree.

viii
Style manual or journal used Diabetes________________________________________
________________________________________________________________
Computer Software used Windows XP, Microsoft Word 2000 and Excel 2000________ _______________________________________________________________________

ix
TABLE OF CONTENTS
LIST OF FIGURES...................................................................................................... xii
LIST OF TABLES........................................................................................................xiv
INTRODUCTION...........................................................................................................1
Overview of glucose metabolism..................................................................................1
Alterations of glucose metabolism in type 2 diabetes....................................................5
Introduction of adipocyte secretory products and adiponectin.......................................6
Objectives of this study ................................................................................................8
LITERATURE REVIEW...............................................................................................11
Molecular mechanisms of obesity and insulin resistance ............................................11
Discovery of adiponectin............................................................................................12
Structure and function studies of adiponectin..............................................................13
Adiponectin gene expression and regulation...............................................................18
Adiponectin receptors ................................................................................................20

x
AdipoR1/R2 receptor gene expression and regulation.................................................22
Physiological functions and mechanisms of adiponectin.............................................24
Molecular action of adiponectin in important organs ..................................................26
Effects of adiponectin on liver and muscle insulin sensitivity .....................................28
MATERIALS ................................................................................................................34
METHODS ...................................................................................................................36
Isolation of mouse hepatocytes...................................................................................36
Cell culture ................................................................................................................38
Production of bacterially expressed recombinant mouse adiponectin ..........................40
Measurement of glucose production ...........................................................................41
Isolation of HepG2 cell membranes............................................................................41
Measurement of protein concentration of the HepG2 cell membrane suspensions.......42
Analysis of AdipoR2 expression by Western Blotting.................................................42
Isolation of total RNA from both HepG2 cells and H9c2 myotubes ............................43
Analysis of AdipoR1/R2 expression by Real-Time PCR.............................................44
Measurement of glycogen synthesis ...........................................................................45
Measurement of IRS-1 phosphorylation .....................................................................45
xi
Measurement of glucose uptake..................................................................................47
Statistical analysis ......................................................................................................48
RESULTS......................................................................................................................49
Effect of adiponectin on pyruvate-stimulated gluconeogenesis ...................................49
The presence of AdipoR2 receptor in HepG2 cells......................................................51
Effect of insulin on AdipoR2 protein level in HepG2 cells..........................................54
Effect of insulin on basal glycogen synthesis in HepG2 cells ......................................56
Effect of adiponectin on basal and insulin-stimulated glycogen synthesis in HepG2
cells ...........................................................................................................................58
Effects of insulin and adiponectin on IRS-1 phosphorylation in HepG2 cells ..............62
The presence of AdipoR1 receptor in H9c2 myotubes ................................................64
Effect of adiponectin on basal glucose uptake in H9c2 cells .......................................66
Western blotting image of eukaryotically expressed adiponectin and bacterially
expressed adiponectin ................................................................................................68
DISCUSSION ...............................................................................................................70
SUMMARY ..................................................................................................................75
BIBLIOGRAPHY………………………………………………………………………..76
xii
LIST OF FIGURES
Figure 1: Overview of glucose metabolism…………………………………………. ….. 2
Figure 2: Structure of mouse and human adiponectin .....................................................15
Figure 3: Different forms of adiponectin activate AMPK pathway in liver and skeletal
muscle . .........................................................................................................................17
Figure 4: Molecular action of adiponectin on target tissues and other important peripheral
organs............................................................................................................................27
Figure 5: Model for molecular action of adiponectin in liver. .........................................30
Figure 6: Model for molecular action of adiponectin in skeletal muscle .........................32
Figure 7: Primary Mouse Hepatocytes. ..........................................................................39
Figure 8: HepG2 Cells. ..................................................................................................39
Figure 9: H9c2 Myotubes. .............................................................................................39
Figure 10: Eukaryotically expressed adiponectin inhibits pyruvate-stimulated
gluconeogenesis in primary mouse hepatocytes. ............................................................50
Figure 11: AdipoR2 receptor is present in HepG2 cells. .................................................52
Figure 12: AdipoR2 mRNA is expressed in HepG2 cells..................................................53
Figure 13: AdipoR2 protein expression is inhibited by insulin. ......................................55

xiii
Figure 14: Insulin stimulates glycogen synthesis in HepG2 cells....................................57
Figure 15: Eukaryotically expressed adiponectin inhibits basal glycogen synthesis in
HepG2 cells. ..................................................................................................................59
Figure 16: Eukaryotically expressed adiponectin inhibits insulin-stimulated glycogen
synthesis in HepG2 cells.. ..............................................................................................61
Figure 17: IRS-1 is not phosphorylated by adiponectin in HepG2 cells. .........................63
Figure 18: AdipoR1 mRNA is expressed in H9c2 myotubes...........................................65
Figure 19: Bacterially expressed adiponectin stimulates basal glucose uptake in H9c2
cells.. .............................................................................................................................67
Figure 20: Western blotting image of eukaryotically expressed and bacterially expressed
adiponectin.. ..................................................................................................................69

xiv
LIST OF TABLES
Table 1: Functions and effects of adipocyte secretory proteins………………………7

1
INTRODUCTION
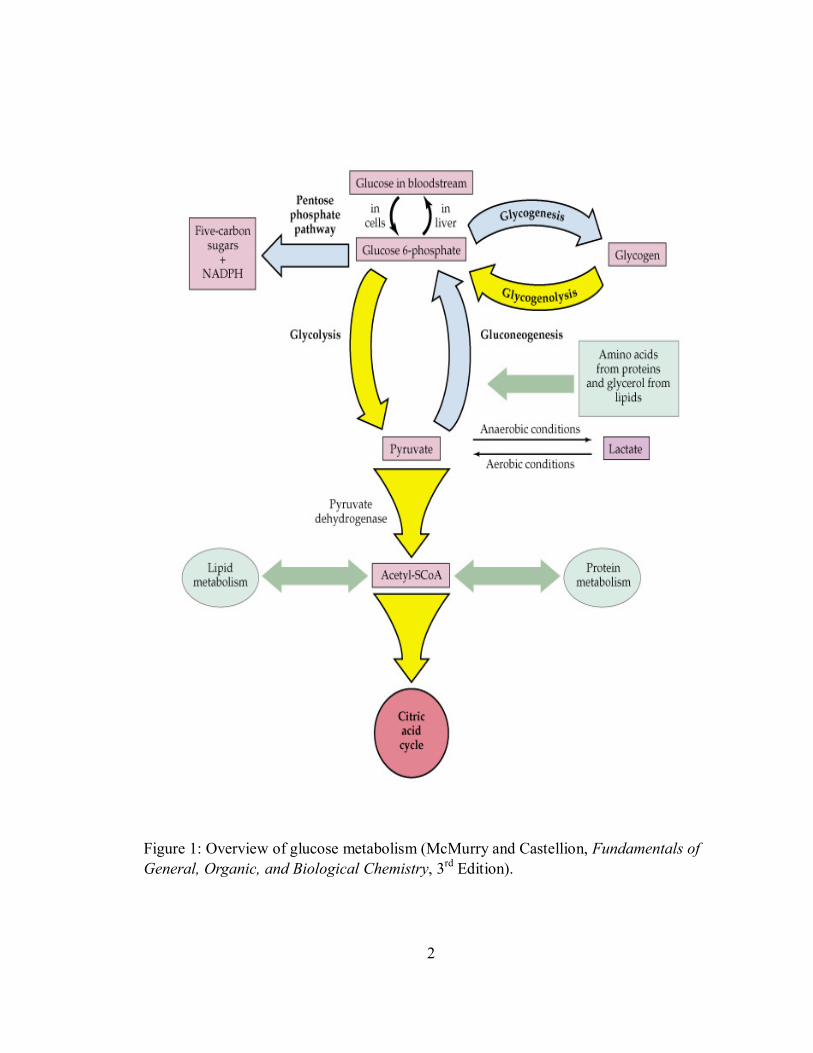
Overview of glucose metabolism
Glucose is a very important molecule in metabolism, both as a fuel and as a
precursor of essential structural carbohydrates and other biomolecules. There are two
pathways involved in glucose metabolism: anabolism (synthesis) and catabolism
(degradation) pathways (Figure 1) (1). Gluconeogenesis and glycogenesis are anabolic
pathways, during which glucose and glycogen are synthesized. Glycolysis and
glycogenolysis belong to catabolic pathways, during which pyruvate and glucose-6-
phosphate are generated. Under aerobic conditions, pyruvate can be oxidized to acetyl-
CoA, which enters citric acid cycle. This cycle marks the “hub” of the metabolic system:
It accounts for the major portion of carbohydrate, fatty acid, and amino acid oxidation
and generates a lot of biosynthetic precursors.
Endogenous glucose production is the sum of gluconeogenesis and
glycogenolysis, both feed the glucose-6-phosphate pool, which is the immediate
precursor of the glucose molecules produced by glucose-6-phosphatase and released by
liver and kidney into the blood stream. Glutamine is the preferential substrate for renal
glucose production accounted for primarily by gluconeogenesis (2). Hepatic
2
Figure 1: Overview of glucose metabolism (McMurry and Castellion, Fundamentals of General, Organic, and Biological Chemistry, 3rd Edition).

3
gluconeogenesis utilizes amino acids from proteins and glycerol from lipids, as well as
lactate and pyruvate from muscle release as substrates. The cori cycle describes a
connection between muscle metabolism of gluconeogenic precursors and liver
gluconeogenesis. In this cycle, lactate is produced by glycolysis in muscle and
transported to the liver for glucose production. The bloodstream then carries the glucose
back to the muscles, where it may be stored as glycogen and used on demand by
glycogenolysis and glycolysis. Hepatic gluconeogenesis is regulated by a number of
enzymes. For example, the conversion of pyruvate into glucose is catalyzed by pyruvate
carboxylase - phosphoenolpyruvate carboxylase (PEPCK), fructose bisphosphatase
(FBPase) and glucose-6-phosphatase (G-6-Pase). These enzymes are also significantly
involved in the effects of some hormones on hepatic gluconeogenesis. A widespread view
holds that hepatic gluconeogenesis is primarily responsible for fasting and post-meal
hyperglycemia in type 2 diabetic patients (3).
Another important anabolic pathway is glycogenesis. Muscles contain 1-2% and
liver cells consist of 10% glycogen by weight, which serves as huge energy storage for
the whole body. The enzymes involved in glycogen synthesis are UDP-glucose
pyrophosphorylase, glycogen synthase and glycogen branching enzyme, some of which is
confirmed to be genetically deficient in disease states. It should also be noted that
insulin-stimulated glycogenesis has been observed to be impaired in insulin-resistant type
2 diabetes (3).
4
Insulin plays an important role in the regulation of hepatic glucose metabolism. It
stimulates the utilization and storage of glucose as lipid and glycogen and reduces
glucose synthesis and release, which is accomplished through a coordinated regulation of
enzyme synthesis and activity. Insulin can also stimulate the expression of genes
encoding glycolytic and fatty-acid synthetic enzymes, such as glucokinase,
phosphofructokinase and pyruvate kinase, while inhibiting the expression of those
encoding gluconeogenic enzymes. These effects are mediated by a series of transcription
factors and co-factors, including sterol regulatory element-binding protein (SREBP)-1,
hepatic nuclear factor (HNF)-4, the forkhead protein family (Fox) and PPAR co-activator
1 (PGC1). In addition, insulin regulates the activities of some other enzymes, including
glycogen synthase and citrate lyase, through alterations in their phosphorylation state. All
these actions lead to a direct hypoglycemic effect of insulin.
Recently research revealed that besides insulin, there are many other proteins that
also affect the expression of enzymes and transcription factors involved in glucose
metabolism. Adiponectin, a cytokine secreted exclusively from adipose tissue (adipokine),
is one of such proteins. The purpose of this study is to investigate the role of adiponectin
in the regulation of glucose metabolism.
5
Alterations of glucose metabolism in type 2 diabetes
Type 2 diabetes mellitus is a group of disorders characterized by hyperglycemia
and associated with microvascular (optic, renal, and possibly neuropathic) and
macrovascular (coronary and peripheral vascular) complications. It is also characterized
by insulin resistance, possibly due to a beta-cell defect and/or changes in tissue insulin
responsiveness. The primary alterations of glucose metabolism in type 2 diabetes are first
in insulin-mediated suppression of endogenous glucose production and insulin-dependent
stimulation of glucose utilization. Gluconeogenesis, glucose transport, glucose
phosphorylation, glycogenesis and glucose oxidation are insulin-resistant. Also the
insulin-independent routes of glucose metabolism may be changed. In addition, abnormal
lipid metabolism is likely to play a prominent role to cause hyperglycemia in type 2
diabetes (3).
Since the insulin-dependent and independent glucose metabolism process may be
significantly changed in type 2 diabetes, further research needs to be performed to
identify new drugs or agents that can improve hyperglycemia and insulin resistance.
Recently one study confirmed that replenishment of adiponectin, an adipocyte secretory
protein, represents a novel treatment strategy for insulin resistance and type 2 diabetes
(4).
6
Introduction of adipocyte secretory products and adiponectin
Adipose tissue is composed mainly of lipid-filled fat cells surrounded by immune
cells, fibroblasts, blood vessels and collagen fibers (5). These lipid-filled fat cells are
named adipocytes. Based on histology, adipose tissue can be divided into two types,
white and brown adipose tissue, with white adipose tissue the predominant type in
humans (6).
White adipose tissue is now identified not only to be an energy storage organ but
also an active hormone system involved in the regulation of metabolism. It secretes many
products named “adipocytokines” (“adipokines”), including leptin, TNF-α (tumor
necrosis factor-α), IL-6 (interleukin-6), PAI-1 (plasminogen activator inhibitor-1), adipsin,
adiponectin, resistin, and visfatin - the functions and effects of which are listed in Table 1
(5;7;8). These adipokines play an important autocrine role in white adipose tissue
physiology and participate in the energy and glucose metabolism of the whole body.
Since adipocyte secretory products can influence both local adipocyte physiology
and distant organ system metabolism, such as the central nervous system, liver, pancreas
and skeletal muscle, adipose tissue disorders may sometimes cause insulin resistance and
its complications, including obesity, diabetes mellitus, hypertriglyceridemia, low levels of
high-density lipoprotein cholesterol, as well as hepatic steatosis (9). Studies of adipose
tissue biology are very important as cases of obesity and diabetes are increasing in
number all over the world. Among all those adipokines, adiponectin has recently been

7
Table 1: Functions and effects of adipocyte secretory proteins (Burrell et al., Am J Physiol Endocrinol Metab., 280:E827-E847, 2001, modified)
Molecule Functions/Effects
Leptin Signals to the brain regarding body fat stores Regulates appetite and energy expenditure
TNF-α Interferes with insulin receptor signaling and may cause the development of insulin resistance in obesity
IL-6 Implicated in host defense and in glucose and lipid metabolism
PAI-1 Promotes thrombosis by inhibiting endogenous fibrinolytic system
Tissue factor Major cellular initiator of the coagulation cascade
Angiotensinogen Precursor of angiotensin II Regulator of blood pressure and electrolyte homeostasis
Adipsin Possible link between the activation of the alternative complement pathway and adipose tissue metabolism
ASP Influences the rate of triacylglycerol synthesis in adipose tissue
Adipophilin May be a specific marker for lipid accumulation in the cells
Adiponectin Regulates intermediary metabolism and may be involved in regulating insulin-resistance, inflammation, angiogenesis and atherosclerosis
Resistin May play a role in insulin resistance
PGI2 and GF2α Implicated in regulatory functions such as inflammation and blood clotting, ovulation, menstruation, and acid secretion
TGFβ Regulates a wide variety of biological responses, including proliferation, differentiation, apoptosis, and development
IGF-1 Stimulates proliferation of a wide variety of cells and mediates many of the effects of growth hormone
MIF Involved in proinflammatory processes and immunoregulation
Visfatin Mimics the effects of insulin and activates the insulin receptor
8
identified as a novel insulin-sensitizing protein with anti-inflammatory, anti-angiogenic,
anti-atherosclerotic, and anti-tumor properties (10). Unlike many other adipokines, serum
adiponectin concentrations are decreased in obesity and type 2 diabetes. Also,
hypoadiponectinaemia has been associated with lipodystrophy, insulin resistance, and
cardiovascular diseases. Therefore, this protein may provide a critical link between
obesity, type 2 diabetes, and insulin resistance. In addition, several studies have
demonstrated that adiponectin participates in the regulation of whole-body glucose
homeostasis by decreasing hepatic glucose output. Adiponectin concentrations also
inversely correlate with basal and insulin-suppressed endogenous glucose production in
humans (11). These findings further support the possibility that adiponectin may be a
novel treatment strategy for insulin resistance and type 2 diabetes.
Objectives of this study
Obesity is a significant public health crisis both in the United States and in the
other developed countries. A recent study conducted by the Centers for Disease Control
and Prevention confirms that 56.4% of Americans are either overweight or obese, and the
incidence of obesity has increased 61% since 1991. Obesity is considered to be a major
risk factor for the development of insulin-resistance and type 2 diabetes. More than 18
million Americans (6.3% of the population) have type 2 diabetes and about 5 million
don't know that they have this disease. Another 41 million have "prediabetes" (impared
9
glucose tolerance). The problems behind these numbers are even more alarming. Diabetes
is the leading cause of blindness and kidney failure among adults. It also causes mild to
severe nerve damage coupled with circulatory problems, often leading to lower extremity
amputates. Moreover, it significantly increases the risk of heart diseases. Based on
statistical data, diabetes is found to be the sixth leading cause of death in the U.S.,
directly causing almost 60,000 deaths every year and contributing to thousands more.
The facts listed above show that obesity and type 2 diabetes mellitus are
becoming more and more prevalent in the U.S. and all over the world. However, the
pathophysiological link among obesity, insulin resistance and diabetes has not been
clearly identified, which is critical to providing better treatment and possibly a cure for
all of these disorders.
Adipose tissue is now considered an organ capable of producing a number of
hormones affecting energy intake and expenditure, as well as carbohydrate and lipid
metabolism, including nutrient partitioning and fuel selection. Adiponectin has insulin-
sensitizing properties and may provide a link between obesity, insulin-resistance and type
2 diabetes mellitus. As mentioned, this protein can affect the expression of enzymes
involved in hepatic glucose metabolism. It has been found to inhibit the expression of
hepatic gluconeogenic enzymes (PEPCK, G-6-Pase) and the rate of endogenous glucose
production, but its effects on hepatic glycogen synthesis have not been investigated yet.
Since type 2 diabetic patients have significant glucose metabolism alterations compared

10
with normal persons, the present study focuses on the regulation of glucose metabolism
in liver and muscle by adiponectin.
The primary objective of this study is to investigate the effects of adiponectin on
hepatic basal and insulin-stimulated glycogen synthesis, as well as the mechanisms
involved in this process. Recombinant mouse adiponectin expressed in HEK293-T cells
and in E.Coli were used in this study. Since they might have different effects on glucose
metabolism due to some important structural differences, another important aim of this
study is to compare the effects of eukaryotically and bacterially expressed adiponectin on
hepatic basal glycogen synthesis and muscle basal glucose uptake. In addition,
adiponectin receptor studies are included investigating the effect of insulin on adiponectin
receptor expression.

11
LITERATURE REVIEW
Molecular mechanisms of obesity and insulin resistance
Obesity, type 2 diabetes and insulin resistance are closely related. Obesity is
defined as increased mass of adipose tissue, which confers a high risk of metabolic
disorders such as diabetes and hyperlipidemia, as well as cardiovascular diseases (12). A
common characteristic of both obesity and type 2 diabetes is impaired glucose and lipid
metabolism, which leads to increased lipid storage in some insulin-targeted organs such
as liver and muscle, thus leading to insulin resistance. Recently, research focused on the
function of adipocyte has been performed to investigate the molecular mechanisms of
obesity and insulin-resistance. Studies confirmed that pharmacological inhibitors of the
transcription factor PPARγ / RXR (peroxisome proliferator-activated receptorγ / retinoid
X receptor) can improve high-fat diet-induced insulin resistance in type 2 diabetes (4),
suggesting the possible role of nuclear receptor in the development of insulin resistance.
CBP protein (CREB binding protein), a transcriptional coactivator with intrinsic histone
acetyltransferase (HAT) activity, may also be involved in the molecular mechanisms of
obesity and insulin resistance. Studies have found that heterozygous CBP protein
deficiency decreases the production of molecules causing insulin resistance and increases

12
the insulin-sensitizing hormones such as leptin and adiponectin, therefore preventing
adipocyte hypertrophy and increasing insulin sensitivity (12). In addition, SNPs (single
nucleotide polymorphisms) may lead to the development of insulin resistance and type 2
diabetes. A SNP is a single base substitution of one nucleotide with another, where both
versions are observed in the general population at a frequency greater than 1%. Subjects
with the G/G genotype of SNP276 in the adiponectin gene were found at increased risk
for type 2 diabetes compared with those having the T/T genotype (4).
In summary, the above studies suggest that nuclear receptor and transcription
coactivators may affect adipocyte function, resulting in the production of a series of
adipokines which eventually leads to the development of insulin resistance and type 2
diabetes. Among those adipokines, adiponectin is a very important insulin-sensitizing
protein, and a SNP in the adiponectin gene is also significantly involved in developing
obesity and type 2 diabetes.
Discovery of adiponectin
Adiponectin is a 30-kDa protein secreted predominantly by adipose tissue under
normal conditions. It is very abundant in plasma, accounting for 0.01% of total plasma
proteins in humans (13) and 0.05% in rodents (14). Plasma concentrations of adiponectin
range from 3 to 30 µg/mL across species (15). Adiponectin was discovered by four
different groups using different experimental methods, and therefore it has other four

13
different names: apM1, Acrp30, adipoQ and GBP28. In 1995, Scherer et al. cloned
mouse adiponectin cDNA from 3T3-L1 adipocytes for the first time and found that
adiponectin mRNA was significantly upregulated during differentiation of preadipocytes
to adipocytes. The respective protein was named Acrp30 (adipocyte complement-related
protein of 30 kDa) (16). In the following year, a Japanese group isolated adiponectin
cDNA from human adipose tissue library and named the corresponding protein apM1
(Adipose Most Abundant gene transcript) (17). Another group then used mRNA
differential display to identify adiponectin gene in rats and mice and termed it adipoQ
(14). Human adiponectin protein was isolated and purified from human plasma by using
its affinity to gelatin-Cellulofine and named GBP28 (gelatin binding protein of 28 kDa)
(18). In 1999, a Japanese group suggested a common name for this protein-adiponectin
(19). Adiponectin is the currently most popular nomenclature used for this protein and is
how this protein will be identified throughout this text.
Structure and function studies of adiponectin
Adiponectin is encoded by gene APM1 located on the chromosome 3q27 locus
(20), which has recently been identified as a novel susceptible locus for early-onset
diabetes and the metabolic syndrome (21). Human adiponectin contains 244 amino acid
residues (17), while mouse adiponectin consists of 247 amino acids (16). This protein has
four domains: a N-terminal signal sequence, a non-homologous domain, a collagen-like
14
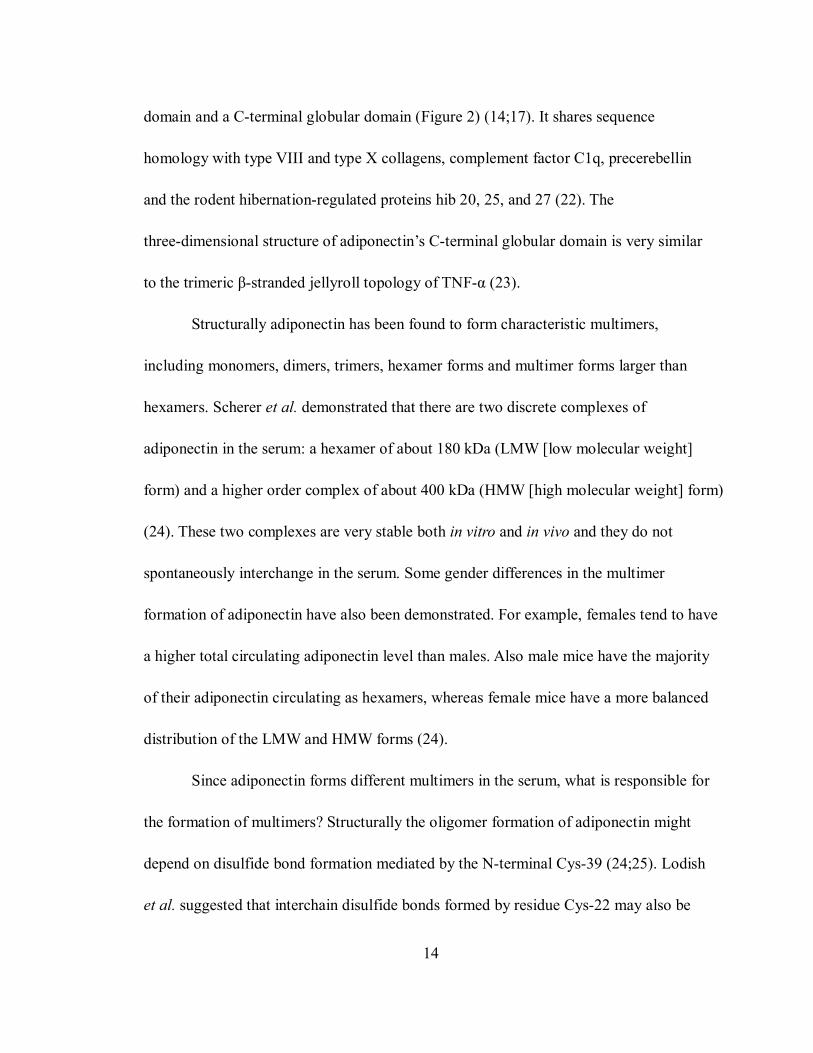
domain and a C-terminal globular domain (Figure 2) (14;17). It shares sequence
homology with type VIII and type X collagens, complement factor C1q, precerebellin
and the rodent hibernation-regulated proteins hib 20, 25, and 27 (22). The
three-dimensional structure of adiponectin’s C-terminal globular domain is very similar
to the trimeric β-stranded jellyroll topology of TNF-α (23).
Structurally adiponectin has been found to form characteristic multimers,
including monomers, dimers, trimers, hexamer forms and multimer forms larger than
hexamers. Scherer et al. demonstrated that there are two discrete complexes of
adiponectin in the serum: a hexamer of about 180 kDa (LMW [low molecular weight]
form) and a higher order complex of about 400 kDa (HMW [high molecular weight] form)
(24). These two complexes are very stable both in vitro and in vivo and they do not
spontaneously interchange in the serum. Some gender differences in the multimer
formation of adiponectin have also been demonstrated. For example, females tend to have
a higher total circulating adiponectin level than males. Also male mice have the majority
of their adiponectin circulating as hexamers, whereas female mice have a more balanced
distribution of the LMW and HMW forms (24).
Since adiponectin forms different multimers in the serum, what is responsible for
the formation of multimers? Structurally the oligomer formation of adiponectin might
depend on disulfide bond formation mediated by the N-terminal Cys-39 (24;25). Lodish
et al. suggested that interchain disulfide bonds formed by residue Cys-22 may also be

15
Figure 2: Structure of mouse and human adiponectin (Scherer et al., J Biol Chem., 270(45):26746-9, 1995, modified).

16
necessary for the oligomerization of adiponectin beyond the basic trimer, as well as the
formation of hexamer and HMW multimers seen in freeze etch electron microscopy (26).
As a whole picture of adiponectin multimer complex, it was speculated that the carboxyl
terminus of adiponectin might be outside and the amino terminus inside, which was
connected by the amino-terminal disulfide bond (25).
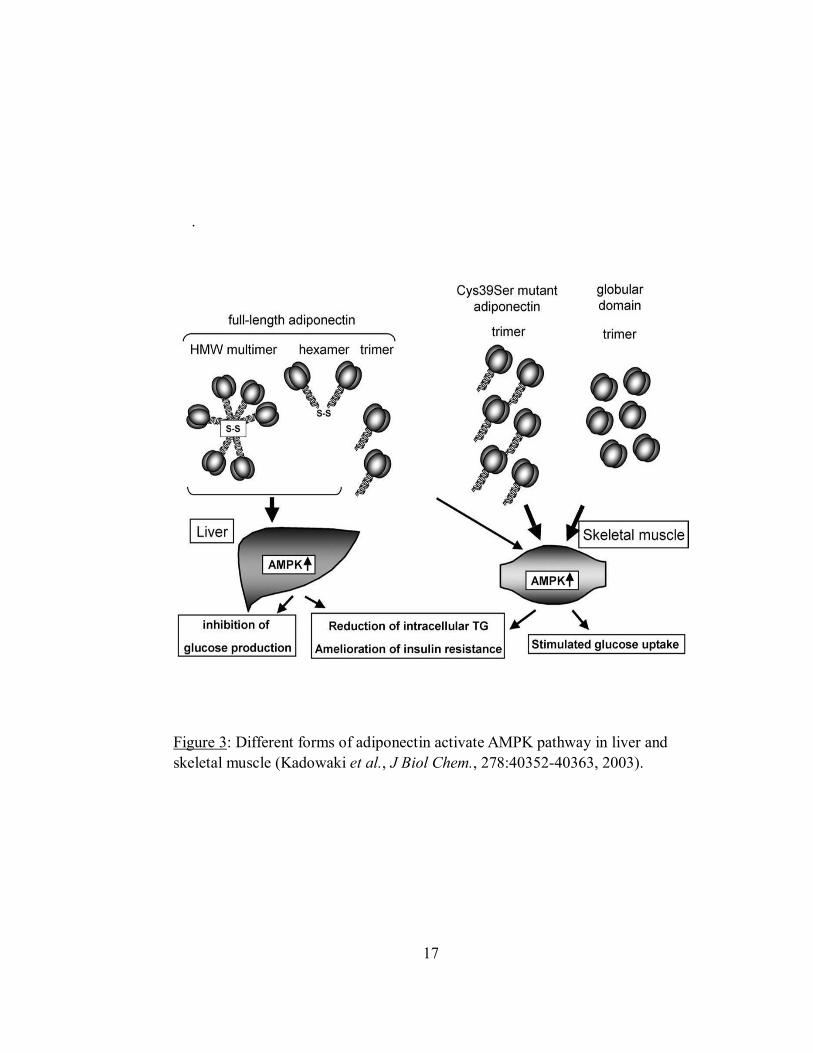
Studies also demonstrated that different adiponectin multimer species can activate
different signal transduction pathways in different organs. Only trimeric, hexameric and
HMW forms of adiponectin activate AMPK (AMP-activated protein kinase) pathway in
hepatocytes; while in myocytes, globular domain of adiponectin can activate AMPK
pathway. AMPK is the downstream component of a protein kinase cascade that acts as an
intracellular energy sensor maintaining the energy balance within a cell. The increased
AMPK by adiponectin leads to inhibition of hepatic glucose production, reduction of
intracellular triglycerides, amelioration of hepatic insulin resistance and enhancement of
muscle glucose uptake (Figure 3) (25).
Lodish et al. studied adiponectin and the regulated signal transduction pathways
(26). They suggested that trimeric adiponectin could activate AMPK, and hexameric and
HMW forms of adiponectin activated NF-κB (nuclear factor kappa B) (26). The
biological significance of NF-κB activation is still not very clear. In addition, a recent
study done by Matsuzawa et al. revealed that only HMW adiponectin selectively
suppressed endothelial cell apoptosis, whereas the LMW form did not have this effect
17
.
Figure 3: Different forms of adiponectin activate AMPK pathway in liver and skeletal muscle (Kadowaki et al., J Biol Chem., 278:40352-40363, 2003).
18
(27). All these studies appear to demonstrate that HMW form of adiponectin is the most
biologically active form.
As for the relationship of its structure and function, the hydroxylation and
glycosylation of the four conserved lysine residues in the collagen domain of adiponectin
are also very important. These modifications have been reported to be involved in the
inhibition effect of adiponectin on hepatic glucose production. Hydroxylation and
glycosylation-deficient adiponectin produced in E.coli exhibits a decreased ability in
inhibiting hepatic glucose production (28).
Based on the findings that different forms of adiponectin have different biological
activity, Scherer et al. recently proposed a new index that takes the different circulating
forms of serum adiponectin into account and called this index the adiponectin sensitivity
index (SA). It is defined as the percentage of the HMW forms compared to the total
circulating adiponectin (29). This index may help to assess a patient’s hepatic insulin
sensitivity in combination with other parameters, such as oral glucose tolerance tests and
and the measurement of inflammatory cytokines, etc.
Adiponectin gene expression and regulation
Adiponectin is a very abundant protein in plasma. It is secreted exclusively by
adipose tissue under normal conditions (16). However, adiponectin mRNA was also
detectable in mouse hepatocytes after the treatment with carbon tetrachloride, and in

19
human hepatoma cell line (HepG2) when treated with IL-6 (30). In addition, transcription,
translation and secretion of adiponectin have been confirmed in human osteoblasts (31).
In that study, adiponectin was found to play a functional role in bone homeostasis, which
suggested that this protein might be an important signal linking fat and body weight to
bone density (31).
There are several mechanisms that regulate the synthesis and secretion of
adiponectin. Insulin stimulates, while IL-6, Forskolin, TNF, and dexamethasone inhibit
adiponectin gene expression and secretion from 3T3-L1 adipocytes (16;32). Peroxisome
proliferators-activated receptors (PPAR), which belong to the nuclear hormone receptor
superfamily, also play a role in the regulation of adiponectin synthesis. PPAR α agonists
(ie. fibrates) decrease adiponectin mRNA in white adipose tissue of obese db/db mice
which lacks functional leptin receptors (33), whereas PPAR γ agonists (ie.
thiazolidinediones) stimulate adiponectin gene expression in obese mice and
insulin-resistant obese humans (34). In addition, stimulation of the cAMP-PKA pathway
by the β-adrenergic agonist isoproterenol or the synthetic cAMP analogue
dibutyryl-cAMP reduces the level of adiponectin mRNA in 3T3-L1 adipocytes (35;36).
Since adipose tissue is very sensitive to oxidative stress, this can also decrease
adiponectin secretion in 3T3-L1 adipocytes (37). Another very important regulator is
testosterone. Research has shown that testosterone decreases adiponectin secretion in
3T3-L1 adipocytes, and reduces plasma adiponectin concentration in both sham-operated
20
and castrated male mice (38). Importantly, this hormone selectively inhibits high
molecular weight form of adiponectin secreted from rat adipocytes (39). This might be
able to explain why men tend to have lower circulating levels of adiponectin than women,
and HMW multimers are significantly more abundant in female subjects than in male
subjects.
In some disease conditions, serum adiponectin concentrations often change
compared with the normal situation. Studies have demonstrated increased serum
adiponectin level in anorexia nervosa, type 1diabetes and chronic renal failure. However,
in obesity, type 2 diabetes, the metabolic syndrome and coronary artery disease, serum
adiponectin level is decreased (40). The pathophysiological mechanisms responsible for
these changes are still not very clear.
Adiponectin receptors
Adiponectin has a number of important biological functions, including changing
hepatic gene expression, modulating the endothelial cell inflammatory response,
regulating immune cell function and suppressing macrophage-to-foam cell transformation,
etc. In 2003, Kadowaki et al. cloned two adiponectin receptors in mouse, which were
named AdipoR1 and AdipoR2. AdipoR1 is abundantly expressed in skeletal muscle as a
high-affinity receptor for globular adiponectin and a low-affinity receptor for full-length
adiponectin; AdipoR2 is expressed predominantly in liver as an intermediate-affinity
21
receptor for both forms of adiponectin (41). These two receptors are distantly related to
the family of seven-transmembrane spanning G-protein-coupled receptors. Since they
have an inverted topology with the N-terminus intracellular portion, and their
extracellular domain is small, they are distinct from the seven-transmembrane spanning
receptors (42). These two receptors can mediate increased AMPK and PPAR-α ligand
activities, as well as fatty-acid oxidation and glucose uptake in the presence of
adiponectin (41).
Besides AdipoR1 and AdipoR2, T-cadherin was recently identified to be another
receptor for hexameric and HMW forms of adiponectin (42). Cadherins are a superfamily
of adhesion molecules that mediate Ca2+dependent cell–cell adhesion in all solid tissues
of the organism (43). T-cadherin is an atypical member of the cadherin family which
lacks both the transmembrane and cytoplasmic domains. The only known function of
T-cadherin is to participate in the regulation of neuron growth during embryogenesis (44),
and it is expressed only in endothelial and smooth muscle cells, but not in hepatocytes.
Since liver is an important target for adiponectin, maybe some other cell types in the liver
such as fibroblast, endotheial or blood derived cells have this receptor so that hexameric
and high molecular weight forms of adiponectin can work in the liver (42). The detailed
function and signal downstream of this receptor are not very clear yet.

22
AdipoR1/R2 receptor gene expression and regulation
In addition to the two target organs, liver and muscle, AdipoR1 and AdipoR2
receptors are also expressed in other cell types. For instance, expression of both receptors
was reported at high levels in human and rat pancreatic β cells, and their expression
regulation was suggested to be a mechanism modulating the effects of circulating
adiponectin (45). Also, bone-forming cells express both AdipoR1 and AdipoR2 (31).
Moreover, it was reported that these two receptors are expressed in brown and white
adipocytes of lean mice, which mediate paracrine effects of adiponectin in adipose tissue
(46).
Like adiponectin itself, AdipoR1 and AdipoR2 gene expression has been found to
be regulated under different conditions both in vitro and in vivo. AdipoR2 synthesis is
significantly increased during the differentiation of 3T3-L1 preadipocytes, and its mRNA
expression can also be induced by growth hormone in 3T3-L1 adipocytes (47). On the
other hand, TNF-α downregulates AdipoR2, but not AdipoR1 mRNA levels in pig
stromal-vascular cell culture (48). In addition, a parallel circadian gene expression pattern
for both AdipoR1 and AdipoR2 was recently identified, with lower expression at night
and higher expression during the day in brown, epigonadal and subcutaneous adipose
tissue (46).
Another very important agent that is able to regulate adiponectin receptor gene
expression is insulin. It was reported that the expression of AdipoR1 and/or AdipoR2

23
appears to be inversely regulated by insulin in some physiological and pathophysiological
conditions, such as fasting/refeeding, insulin deficiency and hyperinsulinemia, and may
also be correlated with adiponectin sensitivity. Recently Kadowaki et al. demonstrated
that the expression of AdipoR1/R2 in skeletal muscle and liver were significantly
increased in fasted mice with lower circulating insulin levels, and decreased in refed mice
with higher insulin levels. STZ-induced insulin deficiency increased and the insulin
replenishment reduced the expression of AdipoR1/R2 in vivo. Insulin might also decrease
AdipoR1/R2 gene expression via the PI3-kinase/Foxol 1 pathway in vitro (49). Moreover,
the expression of AdipoR1/R2 in insulin-resistant ob/ob mice were significantly
decreased in skeletal muscle and adipose tissue, which were correlated with decreased
adiponectin binding to membrane fractions of skeletal muscle as well as decreased
AMPK activation by adiponectin. These decreased adiponectin effects are termed
“adiponectin resistance” (49).
On the other hand, only AdipoR1 mRNA concentrations are increased in muscles
of STZ induced diabetic mice and decreased in type 2 diabetic db/db mice, while hepatic
AdipoR2 expression was not significantly changed in either STZ or genetically obese
mice (50). This is almost the same as the findings of several other groups, all of which
suggested that regulation of AdipoR1, but not that of AdipoR2 may be involved in
glucose and lipid metabolism in diabetic states (50-53).

24
Physiological functions and mechanisms of adiponectin
Adiponectin predominantly has three physiological functions, the most important
of which is its insulin-sensitizing property. In addition, it has anti-inflammatory and
anti-atherogenic functions (54). Recently it has been confirmed that this protein may also
have anti-angiogenic and anti-tumor functions (55). These properties have made this
novel adipocytokine a promising therapeutic tool for the future.
The insulin-sensitizing function of adiponectin has been suggested by several
studies. In Pima Indians, Caucasians and Asians, hypoadiponectinemia was more closely
linked to hyperinsulinaemia and insulin resistance than to adiposity (56-58). Importantly,
low basal adiponectin concentrations in Pima Indians predicted the decreased insulin
sensitivity independent of adiposity (58). In addition, studies performed in Rhesus
monkeys clearly indicated that the drop in adiponectin levels preceded the development
of hyperinsulinaemia (59;60), which suggested that low adiponectin levels might be a
cause and not a consequence of hyperinsulinaemia.
There are four possible mechanisms involved in the insulin-sensitizing property of
adiponectin: 1) increased lipid oxidation; 2) direct improvement of insulin signaling at
the receptor/post-receptor level; 3) change of glucose metabolism in the liver; and 4)
inhibition of TNF-α signaling in adipose tissue (61). First, since both circulating fatty
acids and tissue triglycerides are involved in the pathogenesis of insulin resistance,
increased fatty acid catabolism mediated by adiponectin improves insulin sensitivity (62).

25
Second, increased insulin-induced tyrosine phosphorylation of insulin receptor
substrate-1 (IRS-1) and of protein kinase B in skeletal muscle by adiponectin improves
insulin sensitivity (63). In addition, Combs et al. have observed that intravenous
adiponectin infusion had no effect on glucose uptake, glycolysis and glycogen synthesis,
but decreased hepatic glucose production by reducing the expression of enzymes
involved in gluconeogenesis (64). Furthermore, some data appear to indicate that
adiponectin can reduce both TNF-α secretion and signaling in macrophages/vascular
endothelial cells, this reduced activity of TNF-α could improve insulin sensitivity in
adipose tissue also (65).
Another important function of adiponectin is that it has anti-inflammatory
property. It might suppress the activation of transcription factor NF-κB in vascular
endothelium, which is involved in inflammation. Since this activation is mediated by
TNF-α and accompanied by accumulation of cAMP, and is blocked by adenyl cyclase
and protein kinase A inhibitors, adiponectin might modulate the endothelial cell
inflammatory response via cAMP-PKA and NF-κB pathways (66). These pathways may
also play a major role in the adhesion of adiponectin to the damaged vessel wall.
Since adiponectin can suppress the expression of adhesion molecules in vascular
endothelial cells and the production of cytokine from macrophages, it will inhibit the
inflammatory processes that occur during the early phases of atherosclerosis. Therefore, it
is possible that hypoadiponectinemia may cause the development of atherosclerotic

26
vascular disease (54).
Molecular action of adiponectin in important organs
As mentioned, serum adiponectin level often changes in some disease states. For
instance, decreased circulating adiponectin level has been found in obesity, insulin
resistance, hyperinsulinemia and type 2 diabetes, and adiponectin concentrations can
increase concomitantly with weight loss. This negative correlation between adiponectin
and visceral adiposity is very unique. Studies have demonstrated that the synthesis and
secretion of adiponectin is mostly regulated in adipocytes. Under normal conditions,
small adipocytes secrete insulin-sensitizing hormones, such as adiponectin and leptin.
Adipocyte hypertrophy induced by high-fat diet decreases the production of adiponectin
and increases leptin, TNF-α and resistin secretion, among which the increased production
of TNF-α and resistin leads to insulin resistance in obesity. Because TNF-α expression is
positively correlated with adiposity and there is evidence indicating a mutual negative
regulation between TNF-α and adiponectin, TNF-α could be the adipokine responsible for
the suppression of adiponectin levels when fat tissue is increased (40).
Figure 4 (67) summarizes the action of adiponectin on some important peripheral
organs. Liver and skeletal muscles are the two most important target organs for
adiponectin. When full-length adiponectin binds to AdipoR2 receptor in the liver, it
decreases lipid synthesis and glucose production. The binding of globular adiponectin to

27
Figure 4: Molecular action of adiponectin on target tissues and other important peripheral organs (Richelsen et al., Obes.Rev., 6:13-21, 2005).

28
AdipoR1 receptor in the muscles leads to decreased triglyceride production and increased
fatty acid oxidation, glucose uptake, as well as energy dissipation. These important
actions in target organs produce decreased glucose and free fatty acids concentrations in
the blood and increased insulin sensitivity (40). In the brain, adiponectin can activate
melanocortin pathway to decrease body weight and increase thermogenesis (68).
Moreover, adiponectin negatively regulates myelomonocytic progenitor cell growth and
TNF-α production in macrophages, as well as suppresses macrophage-to-foam cell
transformation. Also, it inhibits endothelial cell production of adhesion molecules in vitro,
suppressing the adhesion of monocytes (69). The above two actions in macrophages and
endothelial cells entitle this protein to the anti-atherosclerosis and anti-inflammation
properties.
Effects of adiponectin on liver and muscle insulin sensitivity
Ever since adiponectin was discovered in 1995, studies have been performed to
investigate the effects of adiponectin on hepatic glucose production. Scherer et al. found
that full-length mammalian-cell expressed adiponectin increased insulin sensitivity in the
liver, resulting in reduced hepatic glucose output and decreased serum glucose levels (70).
This glucose-lowering effect of adiponectin was not associated with an increase in insulin
levels. Importantly, they found that adiponectin increased the ability of sub-physiological
concentrations of insulin to suppress glucose production, which suggested that this

29
protein might be a potent insulin enhancer connecting adipose tissue and whole-body
glucose metabolism. In addition, Rossetti et al. did some in vivo studies on adiponectin.
They demonstrated that adiponectin significantly inhibited glucose production and
G-6-Pase flux, but the rate of glucose cycling was unchanged (64). Furthermore, infusion
with recombinant adiponectin did not significantly alter the rates of hepatic glucose
uptake, glycolysis and glycogen synthesis. As for the enzyme change by adiponectin,
Rossetti et al. showed that this protein markedly decreased the levels of G-6-Pase and
PEPCK mRNA expression in liver (64). This may explain in part why the rate of
endogenous glucose production was inhibited by adiponectin. Besides PEPCK and
G-6-Pase, Kadowaki et al. verified that the glucose lowering effect of adiponectin also
required in part the activation of liver AMPK (71). Adiponectin activates AMPK in liver,
thereby directly regulating glucose metabolism and insulin sensitivity both in vitro and in
vivo.
The following graph is a model for molecular action of adiponectin in liver
(Figure 5) (72). Only trimeric, hexameric and high molecular weight forms of
adiponectin can increase insulin sensitivity in the liver. The binding of adiponectin to the
adipoR2 receptor in hepatocytes activates AMPK and PPAR-α (peroxisome
proliferator-activated receptor α), resulting in decreased expression of enzymes involved
in gluconeogenesis such as PEPCK and G-6-Pase. The activation of AMPK can also lead
to phosphorylation and inhibition of acetyl CoA carboxylase (ACC), an enzyme

30
Figure 5: Model for molecular action of adiponectin in liver (Gil et al., Clin. Nutr., 23:963-974, 2004).

31
responsible for triglycerides synthesis, therefore, triglycerides synthesis is decreased and
fatty acid oxidation is increased. On the other hand, full-length adiponectin may directly
increase the phosphorylation of insulin receptor substrate-1 (IRS-1) and activate the
phosphatidylinositol 3–kinase (PI-3 Kinase) pathway, thus increasing hepatic insulin
sensitivity.
Several other studies also investigated the effects of adiponectin on muscle insulin
sensitivity. Ruderman et al. found increased muscle fat oxidation and glucose transport
by globular adiponectin. During this process, AMPK activity was also increased, and
ACC was phosphorylated and inhibited (73). In addition, Sweeney et al. showed that
globular adiponectin increased glucose uptake, GLUT4 myc translocation, and fatty acid
oxidation and lactate production as well, while decreased basal and insulin-stimulated
rates of glycogen synthesis in rat skeletal muscle cells (74). Also increased AMPK and
decreased ACC activity by globular adiponectin were observed in these cells (74).
Figure 6 summarizes the molecular action of adiponectin in the skeletal muscle
(72). Both full-length and globular adiponectin can bind to Adipo R1 receptor in muscle
cells, which is associated with increased AMPK phosphorylation and p38 MAPK
(mitogen-activated protein kinase) phosphorylation. The phosphorylation of AMPK
causes activation of PPAR-α and inhibition of ACC so that triglycerides synthesis is
decreased, fatty acid oxidation and lactate production are increased. On the other hand,
phosphorylation of p38 MAPK may cause increased GLUT4 translocation and glucose

32
Figure 6: Model for molecular action of adiponectin in skeletal muscle (Gil et al., Clin. Nutr., 23:963-974, 2004).

33
uptake in skeletal muscle by adiponectin.
From the above literature review, we summarize that adiponectin can reduce
hepatic glucose output and serum glucose levels by decreasing the expression of enzymes
involved in hepatic gluconeogenesis, such as PEPCK and G-6-Pase. This glucose
lowering effect may also require in part the activation of liver AMPK. In the liver,
adiponectin can increase AMPK and PPAR-α ligand activities, therefore increasing
hepatic insulin sensitivity. However, its effects on hepatic glycogen synthesis and energy
metabolism have not been examined and will be a focus of our study. Also the
mechanisms involved in this process have not yet been identified.
Structurally, adiponectin has been found to form characteristic multimers,
including monomers, dimers, trimers and hexamers. These multimers have been
demonstrated to activate different signal transduction pathways in different organs.
Whether they also have different metabolic effects on hepatic and muscle glucose
metabolism has not yet been determined and will also be a focus of our study.

34
MATERIALS
C57BL6J mice were obtained from Harlan (Indianapolis, IN). A human hepatoma
cell line (HepG2) and a rat ventricular cell line (H9c2) were purchased from American
Type Culture Collection (Manassas, VA). Recombinant eukaryotically expressed mouse
adiponectin was purchased from both Apotech (San Diego, CA) and Biovendor (Candler,
NC). Recombinant bacterially generated mouse adiponectin was produced by Dr. Robert
J. Kemppainen. Hank’s Balanced Salt Solution and streptomycin-penicillin were
purchased from Mediatech Inc (Herndon, VA). Type I collagenase was purchased from
Worthington Biochemical Corporation (Lakewood, NJ). RPMI 1640 medium was
obtained from Fisher Scientific (Pittsburgh, PA). Insulin, fetal bovine serum (FBS),
gentamycin, dexamethasone, Trypan Blue, Trizol, and Dulbecco’s modified Eagle’s
medium (DMEM) were supplied by Invitrogen (Grand Island, NY). A glucose analysis
kit was purchased from Wako Chemicals (Richmond, VA). D-[14C] glucose was obtained
from New England Nuclear (Boston, MA). 2-[3H] deoxyglucose was purchased from
Perkin Elmer Life Sciences (Boston, MA). AdipoR2 antibody was purchased from Alpha
Diagnostic International (San Antonio, TX). A goat anti-rabbit antibody conjugated to
horseradish peroxidase was purchased from Cell Signaling (Beverley, MA). Anti-IRS-1
35
antibody, antiphosphotyrosine antibody (4G10) and a mouse anti-rabbit antibody
conjugated to horseradish peroxidase were purchased from Upstate Biotechnology (Lake
Placid, NY). Chemiluminescence reagents were obtained from Amersham Biosciences
(England). All other reagents from commercial sources were of analytical grade.

36
METHODS
Isolation of mouse hepatocytes
C57BL6J mice (20-25g) were obtained at about 7-8 weeks old. They had access
to food and water ad libitum and were maintained on a 12:12-h light/dark cycle. All
experimental protocols were approved by the Auburn University Institutional Animal
Care and Use Committee (AU-IACUC) prior to initiation.
Mouse hepatocytes were isolated by modified in situ perfusion as described by
Harman et al. (75). The mice were administered heparin (1000 U/kg, i.p.) 20 min before
anesthetization and then anesthetized with sodium pentobarbital (250 mg/kg, i.p.). A
longitudinal incision was made into the abdomen, and curved forceps were used to place
and tie a ligature loosely around the vena cava just prior to the renal veins. A 22 gauge ×1
inch IV type catheter was inserted into the vena cava approximately 3-5 mm distal to the
ligature. The stylet was removed and the catheter was advanced in order that its tip was
anterior to the renal veins. The ligature was then gently tightened and knotted but not
constricted. The infusion tubing was connected to the catheter and the infusion pump was
started at low speed (approximately 3 ml/min). The portal vein was then severed and the
pump flow rate was immediately increased to about 6 ml/min. The diaphragm was cut
37
through to expose the thoracic cavity and the anterior vena cava was clamped off between
the heart and the diaphragm with a small hemostat. The liver changed from dark
red-brown to a light tan color as the blood was flushed out. Then the liver was perfused in
a retrograde fashion for 3 min with a modified Hank’s buffer (pH =7.4, 37°C) containing
0.1mM EGTA. Perfusion was continued for a further 6 min with modified Hank’s buffer
containing 1mM CaCl2 and 0.2 mg/ml Type I collagenase. After perfusion, the liver was
excised and gently teased apart using a blunt spatula. The resulting cell suspension was
filtered through two layers of nylon mesh (250 and 100 µm) to remove undigested
material and placed in the 4°C refrigerator for 10 min, then washed three times with
Hepatocyte Wash Medium (Invitrogen, Grand Island, NY). Cells were resuspended in
RPMI 1640 medium with L-glutamine and 2000 mg/L D-glucose, 10% FBS, 50 µg/ml
gentamycin, 10nM dexamethasone and 1nM insulin. Trypan blue staining was performed
to count cell number and evaluate the viability of cells. Normally 5-8×10⁶ cells were
obtained from one mouse and a viability of 80% - 90% was attained. Mouse hepatocytes
were then plated in 60-mm collagen I coated dishes and put in an incubator maintained at
37°C in a humidified 95% air, 5% CO2. Cells typically adhered to the plate within 2-4
hours. Non-adherent cells were removed prior to cell culture.

38
Cell culture
Mouse hepatocytes were cultured in RPMI 1640 medium with L-glutamine and
2000 mg/L D-glucose, 0.4% FBS and 50 µg/ml gentamycin, and maintained at 37°C in a
humidified 95% air, 5% CO2 for one day prior to experiments. HepG2 cells were cultured
in DMEM containing 5.5 mM D-glucose, 10% FBS, 100 U/ml penicillin and100 µg/ml
streptomycin, and passaged every three days. For experiments, HepG2 cells were
cultured in either 24-well plate or 60-mm normal dishes, grown to 70% confluence, and
maintained in serum-free DMEM medium overnight. Cells were then treated with insulin
and adiponectin as described. H9c2 cells were also cultured in DMEM containing 5.5
mM D-glucose, 10% FBS, 100 U/ml penicillin and100 µg/ml streptomycin. Cells were
grown to about 90% confluence, culture medium was changed to complete DMEM
medium containing 1% FBS and maintained for 14 days. During this process, H9c2
myoblasts differentiated into myotubes. For experiments, H9c2 myotubes were serum
starved overnight in DMEM with 0.5% FBS, then treated with insulin and adiponectin as
indicated. All of the above three types of cells were grown in an incubator maintained at
37°C in a humidified 95% air, 5% CO2.
The following pictures are morphologies of primary mouse hepatocytes, HepG2
cells and H9c2 myotubes.

39
Figure 7: Primary Mouse Hepatocytes.
Low Density High Density
Figure 8: HepG2 Cells.
Figure 9: H9c2 Myotubes.
40
Production of bacterially expressed recombinant mouse adiponectin
Mouse adiponectin was cloned using reverse transcription-polymerase chain
reaction (RT-PCR). Briefly, RNA was extracted from mouse epididymal fat using
guanidine isothiocyanate/phenol (Trizol, Invitrogen, Grand Island, NY). Approximatey 1
ug of total RNA was used in the RT reaction. For PCR cloning, the mouse adiponectin
GenBank sequence accession number (U37222) was used for primer design. Primers
were designed to include amino acids 18 through 247 of the adiponectin gene and
therefore did not include the signal sequence. The 693 base pair coding region was
generated by PCR using primers with BamH1 and Sal1 restriction sites to facilitate
cloning into plasmid pQE-80L (Qiagen, Valencia, CA). The resulting plasmid was
sequenced to verify that the adioponectin sequence was correct and in frame with the
6-histidine tag encoded by pQE-80L. This plasmid was transformed into BL21-DE3
bacteria for recombinant protein production. Following overnight growth in Luria Broth
(LB) containing chloramphenicol and ampicillin, the bacteria were diluted 1:50 into fresh
LB and allowed to grow for an additional 3 hours. At that time, IPTG was added to a final
concentration of 1 mM. Three hours later, bacteria were collected by centrifugation and
their cytosolic contents extracted using B-PER reagent (Pierce Biochemical, Rockford, IL)
with benzonase (Novagen, San Diego, CA). The 6-histidine-adiponectin was purified
using a column of nickel-agarose with elution with increasing concentrations of imidizole.
The fractions containing eluted adiponectin were pooled and dialyzed overnight in 10

41
mM Tris HCL, pH=7.5. The protein was mixed with glycerol (10% final vol:vol) and
stored frozen in aliquots.
Measurement of glucose production
Primary mouse hepatocytes were cultured in 60-mm dishes pre-coated with type I
collagen. Cells were incubated in complete RPMI 1640 medium with/without 33 pM
insulin and/or 2 µg/ml of adiponectin for 24 hours. Media was removed and glucose
production was measured by incubating these cells in glucose-free RPMI 1640 medium
in the presence or absence of 5 mM of pyruvate for another 6 hours. The medium in each
dish was then collected and a glucose analysis kit (Wako Chemicals, Richmond, VA) was
utilized to analyze the glucose concentration in each group.
Isolation of HepG2 cell membranes
HepG2 cells were cultured in 60-mm dishes. Cells were rinsed with 3.0 ml of
warm PBS (Mediatech Inc, Herndon, VA). After the PBS was aspirated, ice-cold Buffer A
(250 mM sucrose, 20 mM HEPES, 1 mM EDTA and one tablet Complete EDTA-free
protease inhibitor, pH = 7.4) was added. Cells were then scraped and transferred to a 12
ml centrifuge tube. Cell suspensions were homogenized in a glass Dounce homogenizer
and supernatant was centrifuged at 30,000 g (16,000 rpm JA20 rotor) for 22 min at 4°C to
yield a pellet of total cellular membranes. The cytosolic supernatant was then removed

42
and cell membranes were resuspended in Buffer B (20 mM HEPES, 1 mM EDTA and
one tablet Complete EDTA-free protease inhibitor, pH = 7.4) for further protein assay.
Measurement of protein concentration of the HepG2 cell membrane suspensions
Bio-Rad Non-DC protein assay method (Bio-Rad, Hercules, CA) was utilized to
measure protein concentration of the HepG2 cell membrane suspensions. 0.5 mg/ml, 0.4
mg/ml, 0.2 mg/ml, 0.1 mg/ml and 0.05 mg/ml of BSA (Bovine Serum Albumin) solution
were prepared from the BSA stock solution (1.44 mg/ml) as standard solutions. Dye
reagent was prepared by 1:4 dilution of the original concentrate. The HepG2 cell
membrane samples were also diluted if necessary. 10 µl of each standard and diluted
sample solution and 200 µl of the dye reagent were added into each well of a microtiter
plate. After incubated at room temperature for 5 min, all of the samples and dye reagents
were mixed thoroughly using a microplate mixer and the light absorbance of each sample
was measured at 595 nm wavelength. Protein concentration of each cell membrane
sample was calculated based on the generated standard curve.
Analysis of AdipoR2 expression by Western Blotting
Total cell membranes were prepared from HepG2 cells analyzed by western
blotting for the presence of AdipoR2. In addition, cells were treated with/without insulin
(1, 10, 100 nM) for 24 hours and the isolated cell membranes were analyzed by western
43
blotting. The processes of western blotting were as follows: 40 µg of cell membrane
sample protein was separated by 10% SDS-polyacrylamide gel electrophoreses
(SDS-PAGE) and electrophoretically transferred to nitrocellulose membranes in a transfer
buffer containing 20 mM Tris-HCl, 154 mM glycine and 20% methanol. The membranes
were blocked with 7% nonfat dry milk in Tris-buffered saline with 0.1% Tween 20
(TBS-T buffer, pH=7.6) and incubated overnight with a primary AdipoR2 antibody
(1:500 dilution), followed by incubation with a goat anti-rabbit secondary antibody
(1:1000 dilution) for one hour. Blots were developed by ECL chemiluminescence
reagents. Immunoreactive bands were then visualized and the optical pixel density of the
bands was determined using the Bio-Rad Quantity One Flour-S Multi-Imager System.
Isolation of total RNA from both HepG2 cells and H9c2 myotubes
HepG2 cells and H9c2 myotubes were cultured in 60-mm dishes. Cells were
washed with cold PBS and 1.0 ml of Trizol was added into each dish. After the Trizol was
transferred to sterile Eppendorf tubes, chloroform:isoamyl alcohol (Fluka Biochemika,
Switzerland) was added and mixed by inversion. The mixture of solution was centrifuged
cold at 12000 g for 15 min, top aqueous layer was removed to another clean Eppendorf
tube and ice-cold 100% isopropyl alcohol was added. This mixture was again centrifuged
cold at 12000 g for 10 min. Supernatant was poured off and discarded, the remaining
pellet was visualized and ice-cold 75% ethanol was added to wash it. The resuspended

44
pellet was then centrifuged cold at 7500 g for 5 min and the acquired RNA was dissolved
in RNase free water for concentration determination.
Analysis of AdipoR1/R2 expression by Real-Time PCR
Total RNA (1 µg) from either HepG2 cells or H9c2 myotubes was reverse
transcribed into cDNA using iScript cDNA synthesis kit (Bio-Rad, Hercules, CA).
Real-Time polymerase chain reaction (PCR) analyses were performed in the iCycler IQ
Real-Time PCR detection system (Bio-Rad, Hercules, CA). The 30 µl amplification
mixture contained 2 µl of cDNA, 200 nM of AdipoR1/R2 primer and 1X iCycler
SYBRGREEN SuperMix (Bio-Rad, Hercules, CA). PCR primers (Invitrogen, Grand
Island, NY) utilized to detect rat AdipoR1 in H9c2 myotubes and human AdipoR2 in
HepG2 cells were as follows: rat AdipoR1 (forward: 5’-CTTCTACTGCTCCCCACAGC
-3’ and reverse: 5’-TCCCAGGAACACTCCTGCTC-3’) and human AdipoR2 (forward:
5’-ATAGTCTCCCAGTGGGACATG-3’ and reverse: 5’-AGGATCCGGGCAGCATACA
-3’). The PCR cycling condition for rat AdipoR1 primer was carried out with an initial
denaturing at 95°C for 3 min, followed by 40 cycles consisting of denaturing at 95°C for
30 sec, annealing at 60.7°C for 1 min, and extending at 72°C for 30 sec. For human
AdipoR2 primer the annealing temperature was 58°C. After PCR, a Ct value was
obtained using the software provided by the manufacturer. Identification the presence of
AdipoR1/R2 receptors was accomplished by obtaining one peak on each melting curve

45
graph.
Measurement of glycogen synthesis
HepG2 cells were cultured in 24-well plates and serum starved overnight before
experiments. Cells were treated with different concentrations of insulin and/or
adiponectin and 0.5 µCi D-[14C] glucose for 3 hours at 37°C. After the media was
removed, 1.0 M KOH containing 1mg glycogen was added and the incubation was
continued for another 1 h and 40 min at 60°C. Ice-cold ethanol was subsequently added
to precipitate the glycogen. The precipitated glycogen was then separated by
centrifugation at 3,600 g for 10 min and washed twice with ice-cold ethanol. Final
precipitable radioactivity is solubilized in 0.2 N HCl and counted in a liquid scintillation
counter.
Measurement of IRS-1 phosphorylation
HepG2 cells were cultured in 60-mm dishes and serum starved overnight before
treated with insulin (10 nM), bacterially generated adiponectin (20 µg/ml), mammalian-
cell expressed adiponectin (1 µg/ml) and the combination of insulin and adiponectin for
30 minutes. Then cells were lysed with RIPA buffer (1% NP40, 1% sodium deoxycholate,
0.1% SDS, 0.9% NaCl, 25 mM Tris, 1mM EDTA, pH=6.8) containing phosphatase and
protease inhibitors.
46
Protein concentrations of these cell lysates were determined using Bio-Rad DC
protein assay method as follows: 1.5 mg/ml, 0.8 mg/ml, 0.4 mg/ml, 0.2 mg/ml and 0.1
mg/ml of BSA were prepared from stock solution (15 mg/ml) as standard solutions.
Reagent A1 was prepared by mixing reagent S and A (Bio-Rad, Hercules, CA). 5 µl of
each standard and cell lysate sample, 25 µl of reagent A1 and 200 µl of reagent B were
added into each well of a microtiter plate and incubated at room temperature for 15 min.
All the samples and reagents were mixed thoroughly using a microplate mixer and the
light absorbance of each sample was measured at 750 nm wavelength. Protein
concentration of each cell lysate sample was also calculated based on the generated
standard curve.
Anti-IRS-1 antibody was utilized to immunoprecipitate IRS-1 molecule from
those cell lysates. Cell lysates were first diluted to a concentration of 1 µg/µl and
transferred to microcentrifuge tubes. Anti-IRS-1 antibody was added into these tubes and
the reaction mixture was gently rocked at 4°C overnight. The immunocomplex was
captured by adding washed Protein A agarose bead slurry into the tubes and gently
rocking the reaction mixture at 4°C for 2 h. The agarose beads were collected by brief (60
sec) centrifugation (1000 rpm), resuspended in 2X Laemmli buffer and boiled for 5 min.
Supernatant fraction of the immunoprecipitation products were then subjected to western
blotting analysis: 20 µl of the supernatants was separated by 7% SDS-PAGE and
electrophoretically transferred to nitrocellulose membranes. The membranes were then

47
blocked with 3% nonfat dry milk and incubated overnight with a primary
antiphosphotyrosine antibody (4G10) (1:500 dilution), followed by incubation with a
mouse anti-rabbit secondary antibody (1:500 dilution) for one and a half hours. Resultant
bands were visualized by the BioRad Quantity One Flour-S Multi-Imager System to
determine the amount of phosphorylated IRS-1 in each sample.
Measurement of glucose uptake
H9c2 myotubes were grown in a 24-well plate and serum starved overnight before
experiments. The myotubes were washed twice with 500 µl warm modified PBS (137
mM NaCl, 2.7 mM KCl, 15.2 mM Na2HPO4, 1.5 mM KH2PO4, 0.1 mM CaCl2, 0.1 mM
MgCl2 and 10 mM HEPES, pH= 7.4), then treated with/without insulin (10 nM),
bacterially generated adiponectin (20 µg/ml and 30 µg/ml) and mammalian-cell generated
adiponectin (1 µg/ml and 5 µg/ml) in 200 µl warm PBS for 20 min. After treatment,
uptake of 10 µM 2-[3H] deoxyglucose was measured over 10min. Reactions were
terminated by the removal of the incubation media and rapid washing with ice-cold 20
µM phloretin. The myotubes were then dissolved in 500 µl of 0.1 N KOH, and aliquots
were counted by liquid scintillation counting.

48
Statistical analysis
Results were expressed as means ± the standard error of the mean (SEM).
Unpaired Student’s t tests were performed to analyze the differences between various
treatment groups. p<0.05 was considered significant for all analysis.

49
RESULTS
Effect of adiponectin on pyruvate-stimulated gluconeogenesis
Scherer et al. previously demonstrated that adiponectin enhanced hepatic insulin
action by enhancing the suppression of hepatic glucose production (70). To evaluate if the
eukaryotically expressed adiponectin has biological activity and works in our
experimental system, we examined its effect on hepatic gluconeogenesis. Under basal
conditions, the subphysiological concentration of insulin did not affect hepatic glucose
production. Adiponectin did not have any effect on basal gluconeogenesis either.
Pyruvate stimulated hepatic glucose production by about 20% compared to control. The
subphysiological concentration of insulin did not have any effect on this
pyruvate-stimulated gluconeogenesis. Importantly, the presence of adiponectin led to a
20% decrease in the pyruvate-stimulated gluconeogenesis, which almost completely
reverted the increased glucose production to control levels (Figure 10).

50
0
50
100
150
200
250
Con Ins Ins+Ad Pyr Pyr+Ins Pyr+Ins+Ad
Glu
cose
Pro
duct
ion
(mg
gluc
ose/
ug p
rote
in.6
h)
Figure 10: Eukaryotically expressed adiponectin inhibits pyruvate-stimulated gluconeogenesis in primary mouse hepatocytes. Primary mouse hepatocytes were incubated in complete RPMI 1640 medium with/without 33 pM insulin and/or 2 µg/ml of adiponectin for 24 h, glucose production was then measured by incubating these cells in glucose-free RPMI 1640 medium in the presence or absence of 5 mM pyruvate for another 6 h. The medium in each dish was collected and a glucose analysis kit was utilized to analyze the glucose concentration. Hepatic glucose production was calculated by measuring the amount of glucose produced in 6 hours per µg of hepatocyte lysate protein. Data are the means ± S.E.M., *p<0.05 vs control under basal conditions; **p<0.05 vs pyruvate-stimulated control. Abbreviation: Con: Control; Ins: Insulin; Pyr: Pyruvate; Ad: Adiponectin.
*
**

51
The presence of AdipoR2 receptor in HepG2 cells
Our initial studies in primary mouse hepatocytes demonstrated an effect of
adiponectin on hepatic glucose metabolism. In order to further characterize this important
metabolic observation, we chose a hepatic cell culture model frequently used to study
insulin signaling and glucose responsiveness. To determine the effect of adiponectin on
hepatic glycogen synthesis as well as its signal transduction pathway in the liver, we used
a human hepatoma cell line (HepG2) as an experimental model. Since adiponectin has
two receptors, AdipoR1 and AdipoR2, with AdipoR2 predominantly expressed in liver
(41), western blotting analysis was first performed to determine if HepG2 cells express
the AdipoR2 receptor. Utilizing western blotting analysis, we determined that HepG2
cells have AdipoR2 receptor (Figure 11). This was later confirmed by another group
using several hepatoma cell line models (76).
We also utilized Real-Time polymerase chain reaction (PCR) analysis to detect
AdipoR2 gene expression in HepG2 cells. A relative Ct value of 18.68 was quantified for
AdipoR2 gene expression in this cell line (Figure 12A). In the melt curve graph, only one
peak was identified at around 87°C, which was the melting temperature of AdipoR2
(Figure 12B).

52
Figure 11: AdipoR2 receptor is present in HepG2 cells. Western blotting analysis: AdipoR2 antibody was used to confirm the presence of AdipoR2 (~35.4 kDa) in total membranes prepared from HepG2 cells. Lane1: standard marker; Lane 2 and 3: cell membrane samples.
35.4 kDa AdipoR2
1 2 3

53
Figure 12A: AdipoR2 mRNA is expressed in HepG2 cells. Real-Time PCR base line quantification graph: a relative Ct value of 18.68 was quantified for AdipoR2 gene expression HepG2 cells.
Figure 12B: AdipoR2 mRNA is expressed in HepG2 cells. Real-Time PCR melt curve graph: only one peak was identified at around 87°C, which was the melting temperature of AdipoR2.
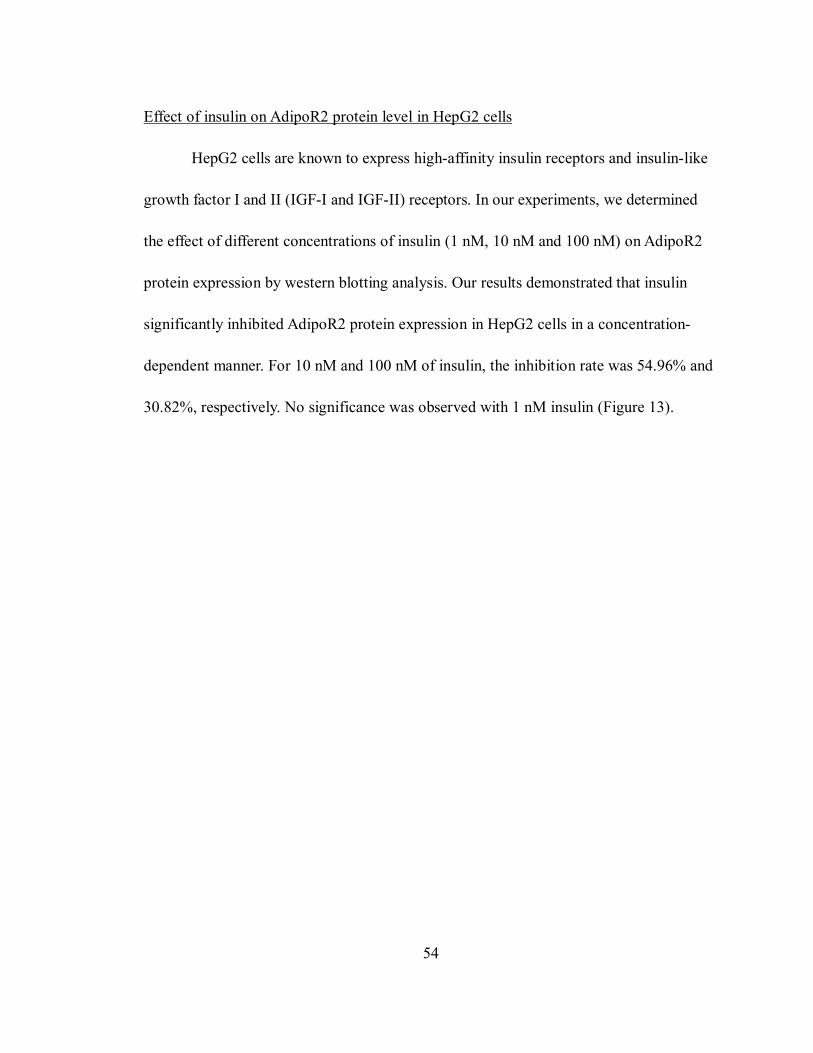
54
Effect of insulin on AdipoR2 protein level in HepG2 cells
HepG2 cells are known to express high-affinity insulin receptors and insulin-like
growth factor I and II (IGF-I and IGF-II) receptors. In our experiments, we determined
the effect of different concentrations of insulin (1 nM, 10 nM and 100 nM) on AdipoR2
protein expression by western blotting analysis. Our results demonstrated that insulin
significantly inhibited AdipoR2 protein expression in HepG2 cells in a concentration-
dependent manner. For 10 nM and 100 nM of insulin, the inhibition rate was 54.96% and
30.82%, respectively. No significance was observed with 1 nM insulin (Figure 13).

55
Con Ins (1 nM) Ins (10 nM) Ins (100 nM)
0
20
40
60
80
100
120
Con Ins (1 nM) Ins (10 nM) Ins (100 nM)
Adi
poR2
Exp
ress
ion
(% C
ontr
ol)
Figure 13: AdipoR2 protein expression is inhibited by insulin. HepG2 cells were treated with 1 nM, 10 nM and 100 nM insulin for 24 hours after serum-starved overnight. Cell membrane lysates were subjected to the same western blotting analysis as in Fig 11. Data are the means ± S.E.M for three independent experiments and are shown as % of control; *p<0.05 vs control. A representative blot is shown in the upper portion of the graph. Lane 1 and 2: control group; Lane 3 and 4: Insulin (1nM) group; Lane 5 and 6: Insulin (10 nM) group; Lane 7 and 8: Insulin (100 nM) group.
*
*

56
Effect of insulin on basal glycogen synthesis in HepG2 cells
Due to their insulin responsiveness, HepG2 cells are an excellent model system to
study glycogen synthesis and insulin signaling, which can be verified by using this model
to investigate the effect of insulin on hepatic basal glycogen synthesis. In this experiment,
we treated HepG2 cells with 35 pM, 0.1 nM, 1 nM, 10 nM and 100 nM of insulin for 3
hours and glycogen synthesis during this period was evaluated. We demonstrated that
insulin stimulates glycogen synthesis in a concentration dependent manner in HepG2
cells. 0.1 nM, 1 nM, 10 nM and 100 nM of insulin can stimulate glycogen synthesis by
21%, 32%, 48% and 58% respectively compared with the control group (Figure 14).
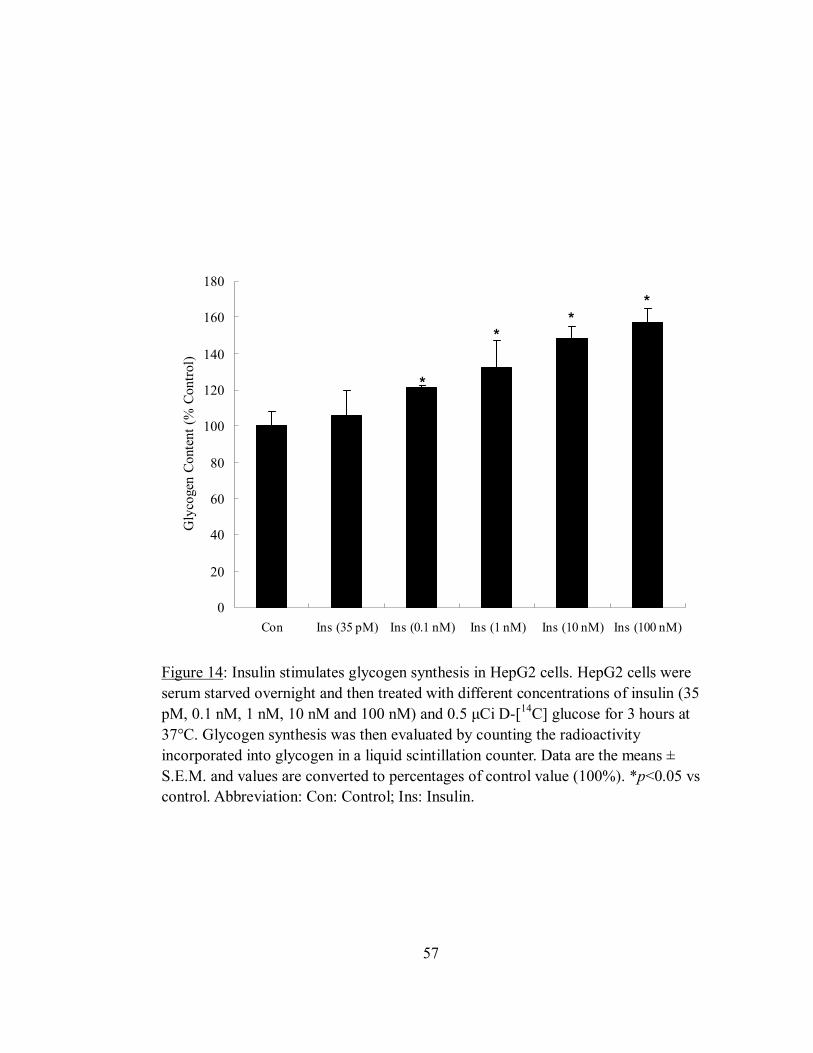
57
0
20
40
60
80
100
120
140
160
180
Con Ins (35 pM) Ins (0.1 nM) Ins (1 nM) Ins (10 nM) Ins (100 nM)
Gly
coge
n Co
nten
t (%
Con
trol)
Figure 14: Insulin stimulates glycogen synthesis in HepG2 cells. HepG2 cells were serum starved overnight and then treated with different concentrations of insulin (35 pM, 0.1 nM, 1 nM, 10 nM and 100 nM) and 0.5 µCi D-[14C] glucose for 3 hours at 37°C. Glycogen synthesis was then evaluated by counting the radioactivity incorporated into glycogen in a liquid scintillation counter. Data are the means ± S.E.M. and values are converted to percentages of control value (100%). *p<0.05 vs control. Abbreviation: Con: Control; Ins: Insulin.
**
*
*

58
Effect of adiponectin on basal and insulin-stimulated glycogen synthesis in HepG2 cells
Full-length adiponectin has been reported to decrease hepatic glucose production
by inhibiting hepatic G-6-Pase and PEPCK mRNA expression (64). However, the effects
of adiponectin on hepatic glycogen synthesis have not been determined. In our studies,
we first examined the effects of both bacterially generated and eukaryotically expressed
adiponectin on basal hepatic glycogen synthesis. HepG2 cells were serum starved
overnight and treated with different concentrations of bacterially generated adiponectin
(20 µg/ml and 30 µg/ml) or eukaryotically expressed adiponectin (1 µg/ml and 5 µg/ml)
together with 0.5 µCi D-[14C] glucose for 3 hours at 37°C. Here we utilized physiological
concentrations of eukaryotically expressed adiponectin. Since bacterially generated
adiponectin may contain fewer biological active forms than eukaryotically expressed one,
we utilized higher concentrations of bacterially generated adiponectin. Glycogen
synthesis was calculated in an identical fashion as in the insulin-stimulation experiment.
Bacterially generated adiponectin did not have any effects on hepatic basal glycogen
synthesis in HepG2 cells, while eukaryotically expressed adiponectin significantly
inhibited hepatic glycogen synthesis (Figure 15). For 1 µg/ml eukaryotically expressed
adiponectin, the inhibition rate was about 37% compared with control; 5 µg/ml of
eukaryotically expressed adiponectin inhibited hepatic glycogen synthesis about 28%
compared with control. Our result demonstrated that only eukaryotically expressed but
not bacterially expressed adiponectin can affect basal glycogen synthesis in liver.

59
0
20
40
60
80
100
120
Con bAd (20 µg/ml) bAd (30 µg/ml) Ad (1 µg/ml) Ad (5 µg/ml)
Gly
coge
n Co
nten
t (%
Con
trol
)
Figure 15: Eukaryotically expressed adiponectin inhibits basal glycogen synthesis in HepG2 cells. HepG2 cells were serum starved overnight and treated with different concentrations of bacterially generated adiponectin (20 µg/ml and 30 µg/ml) or eukaryotically expressed adiponectin (1 µg/ml and 5 µg/ml) together with 0.5 µCi D-[14C] glucose for 3 hours at 37°C. Glycogen synthesis was calculated in the same way as in Fig 14. Both 1 µg/ml and 5 µg/ml of eukaryotically expressed adiponectin significantly inhibited basal glycogen synthesis, however, neither concentrations of bacterially generated adiponectin have any apparent effect on hepatic glycogen synthesis. Data are the means ± S.E.M. and values are converted to percentages of control value (100%). *p<0.05 vs control group. Abbreviation: Con: Control; bAd: Bacterially generated adiponectin; Ad: Eukaryotically expressed adiponectin.
**
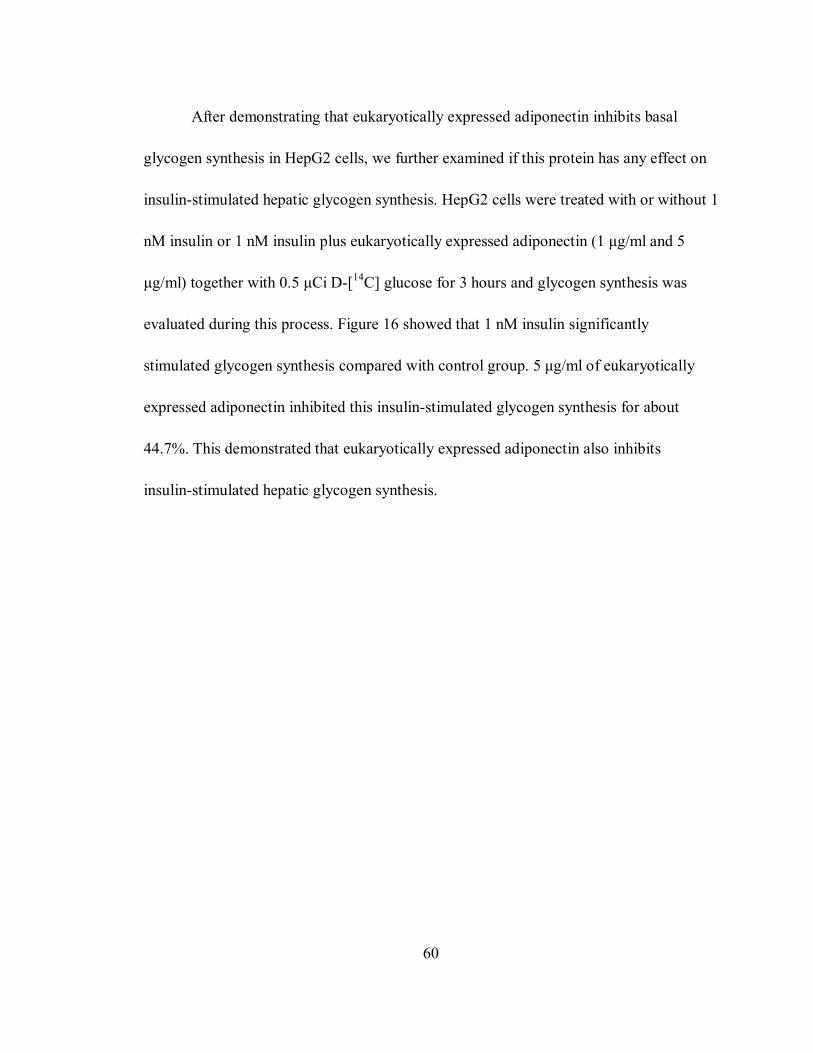
60
After demonstrating that eukaryotically expressed adiponectin inhibits basal
glycogen synthesis in HepG2 cells, we further examined if this protein has any effect on
insulin-stimulated hepatic glycogen synthesis. HepG2 cells were treated with or without 1
nM insulin or 1 nM insulin plus eukaryotically expressed adiponectin (1 µg/ml and 5
µg/ml) together with 0.5 µCi D-[14C] glucose for 3 hours and glycogen synthesis was
evaluated during this process. Figure 16 showed that 1 nM insulin significantly
stimulated glycogen synthesis compared with control group. 5 µg/ml of eukaryotically
expressed adiponectin inhibited this insulin-stimulated glycogen synthesis for about
44.7%. This demonstrated that eukaryotically expressed adiponectin also inhibits
insulin-stimulated hepatic glycogen synthesis.
61
0
20
40
60
80
100
120
140
160
Con Ins (1 nM) Ins+Ad (1 µg/ml) Ins+Ad (5 µg/ml)
Gly
coge
n Co
nten
t (%
Con
trol)
Figure 16: Eukaryotically expressed adiponectin inhibits insulin-stimulated glycogen synthesis in HepG2 cells. HepG2 cells were serum starved overnight and treated with or without 1 nM insulin, 1 nM insulin plus eukaryotically expressed adiponectin (1 µg/ml and 5 µg/ml) together with 0.5 µCi D-[14C] glucose for 3 hours and glycogen synthesis was evaluated during this process. 5 µg/ml of eukaryotically expressed adiponectin was found to inhibit insulin-stimulated glycogen synthesis significantly. Data are the means ± S.E.M. and values are converted to percentages of control value (100%). *p<0.05 vs control group. **p<0.05 vs insulin-stimulated control group. Abbreviation: Con: Control; Ins: Insulin; Ad: Eukaryotically expressed adiponectin.
*
**
62
Effects of insulin and adiponectin on IRS-1 phosphorylation in HepG2 cells
Since eukaryotically expressed adiponectin can inhibit basal and
insulin-stimulated glycogen synthesis in liver, we next determined the mechanism
involved in this process. Adiponectin may work through the insulin signaling pathway to
activate the IRS-1 and PI-3 Kinase, therefore increasing hepatic insulin sensitivity (72).
In our experiments, we examined if adiponectin can phosphorylate IRS-1 by using both
immunoprecipitation and western blotting analysis. Our data demonstrates that IRS-1 is
not phosphorylated by either bacterially generated or eukaryotically expressed
adiponectin in HepG2 cells (Figure 17). However, as a positive control, phosphorylation
of IRS-1 is observed in the presence of insulin (10 nM). Therefore, adiponectin does not
signal through the traditional insulin signaling pathway to inhibit hepatic glycogen
synthesis.
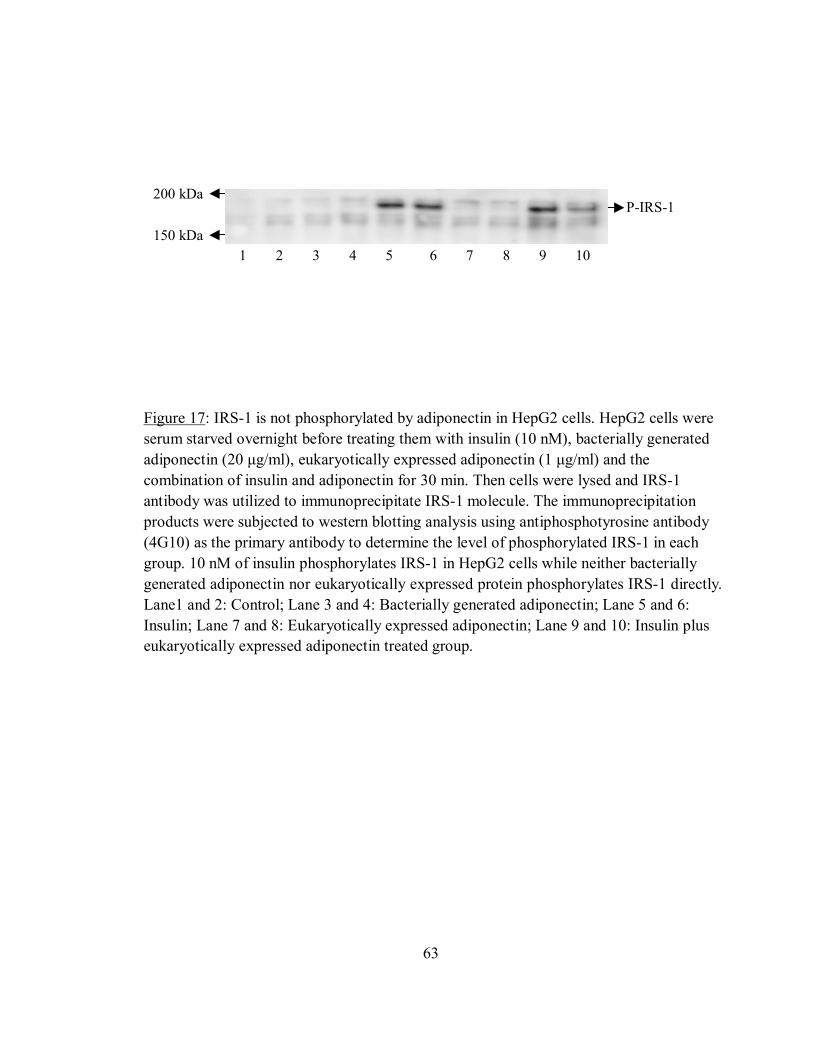
63
Figure 17: IRS-1 is not phosphorylated by adiponectin in HepG2 cells. HepG2 cells were serum starved overnight before treating them with insulin (10 nM), bacterially generated adiponectin (20 µg/ml), eukaryotically expressed adiponectin (1 µg/ml) and the combination of insulin and adiponectin for 30 min. Then cells were lysed and IRS-1 antibody was utilized to immunoprecipitate IRS-1 molecule. The immunoprecipitation products were subjected to western blotting analysis using antiphosphotyrosine antibody (4G10) as the primary antibody to determine the level of phosphorylated IRS-1 in each group. 10 nM of insulin phosphorylates IRS-1 in HepG2 cells while neither bacterially generated adiponectin nor eukaryotically expressed protein phosphorylates IRS-1 directly. Lane1 and 2: Control; Lane 3 and 4: Bacterially generated adiponectin; Lane 5 and 6: Insulin; Lane 7 and 8: Eukaryotically expressed adiponectin; Lane 9 and 10: Insulin plus eukaryotically expressed adiponectin treated group.
150 kDa
P-IRS-1 200 kDa
1 2 3 4 5 6 7 8 9 10

64
The presence of AdipoR1 receptor in H9c2 myotubes
We have demonstrated that eukaryotically expressed adiponectin inhibits basal
and insulin-stimulated glycogen synthesis in HepG2 cells. We next want to examine the
effects of adiponectin on muscle basal glucose uptake. A rat ventricular cell line H9c2
with many properties of skeletal muscle was utilized in this study. We first determined if
H9c2 myotubes express AdipoR1 receptor.
Here we only utilized Real-Time PCR analysis to detect AdipoR1 gene expression
in H9c2 myotubes. A relative Ct value of 21.63 was quantified for AdipoR1 gene
expression (Figure 18A) and only one peak was identified at around 87.5°C in the melt
curve, which was the melting temperature of AdipoR1 (Figure 18B).

65
Figure 18A: AdipoR1 mRNA is expressed in H9c2 myotubes. Real-Time PCR base line quantification graph: a relative Ct value of 21.63 was quantified for AdipoR1 gene expression H9c2 myotubes.
Figure 18B: AdipoR1 mRNA is expressed in H9c2 myotubes. Real-time PCR melt curve graph: only one peak was identified at around 87.5°C, which was the melting temperature of AdipoR1.

66
Effect of adiponectin on basal glucose uptake in H9c2 cells
Globular adiponectin has recently been shown to increase glucose uptake in
skeletal muscle cells via GLUT4 translocation (74). After we proved that AdipoR1
receptor is present in H9c2 cells by Real-Time PCR, we further examined the effects of
adiponectin on basal glucose uptake in this cell line. Cells were treated with or without 10
nM of insulin, different concentrations of bacterially generated (20 µg/ml and 30µg/ml)
and eukaryotically expressed (1µg/ml and 5µg/ml)adiponectin for about 20 min, then
uptake of 2-[3H] deoxyglucose was measured over 10min and radioactivity in myotube
lysates was counted by liquid scintillation counting. Our experimental result (Figure 19)
showed that 10 nM of insulin, 20 µg/ml and 30 µg/ml of bacterially expressed
adiponectin stimulate basal glucose uptake for about 2.5 fold, 105% and 92%
respectively compared with control group, while eukaryotically expressed adiponectin
does not have any apparent effect on basal glucose uptake in H9c2 cells. This
demonstrated that only bacterially generated adiponectin but not eukaryotically expressed
protein can stimulate basal glucose uptake in H9c2 cells.
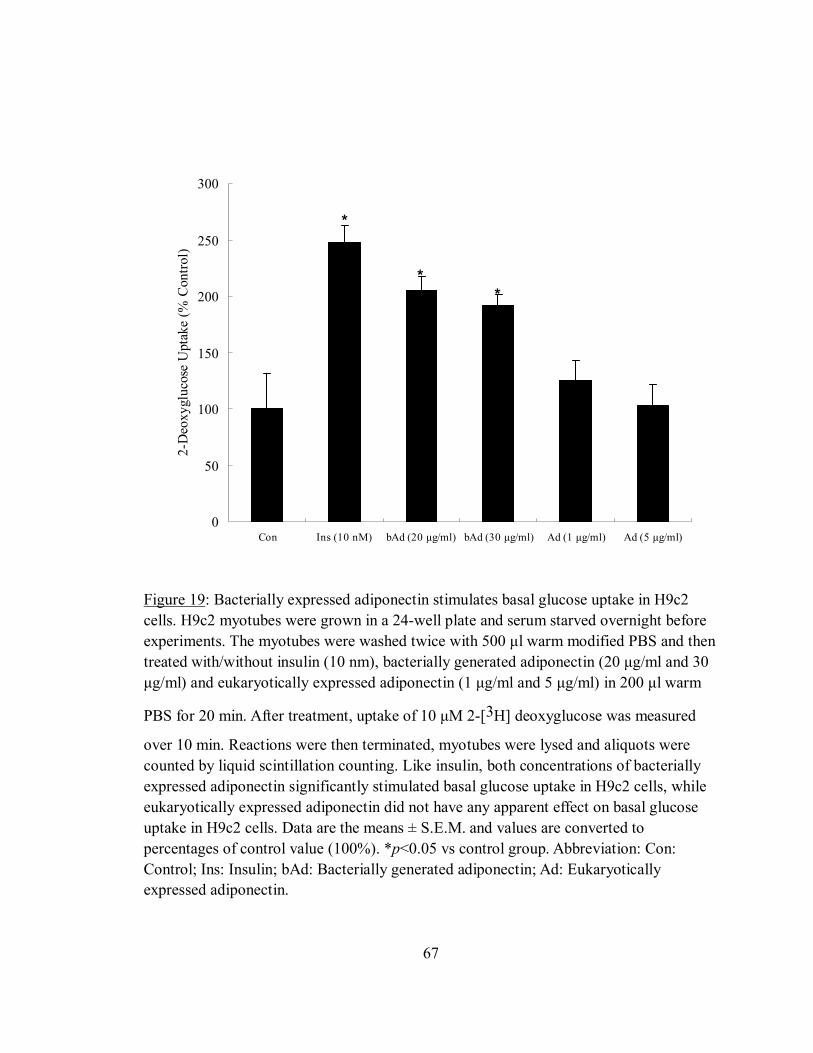
67
0
50
100
150
200
250
300
Con Ins (10 nM) bAd (20 µg/ml) bAd (30 µg/ml) Ad (1 µg/ml) Ad (5 µg/ml)
2-D
eoxy
gluc
ose
Upt
ake
(% C
ontro
l)
Figure 19: Bacterially expressed adiponectin stimulates basal glucose uptake in H9c2 cells. H9c2 myotubes were grown in a 24-well plate and serum starved overnight before experiments. The myotubes were washed twice with 500 µl warm modified PBS and then treated with/without insulin (10 nm), bacterially generated adiponectin (20 µg/ml and 30 µg/ml) and eukaryotically expressed adiponectin (1 µg/ml and 5 µg/ml) in 200 µl warm
PBS for 20 min. After treatment, uptake of 10 µM 2-[3H] deoxyglucose was measured
over 10 min. Reactions were then terminated, myotubes were lysed and aliquots were counted by liquid scintillation counting. Like insulin, both concentrations of bacterially expressed adiponectin significantly stimulated basal glucose uptake in H9c2 cells, while eukaryotically expressed adiponectin did not have any apparent effect on basal glucose uptake in H9c2 cells. Data are the means ± S.E.M. and values are converted to percentages of control value (100%). *p<0.05 vs control group. Abbreviation: Con: Control; Ins: Insulin; bAd: Bacterially generated adiponectin; Ad: Eukaryotically expressed adiponectin.
**
*
68
Western blotting image of eukaryotically expressed adiponectin and bacterially expressed
adiponectin
Our studies have demonstrated that eukaryotically expressed adiponectin can
affect hepatic glycogen synthesis while bacterially expressed adiponectin does not have
this effect. Also, bacterially expressed adiponectin affects muscle glucose uptake, but
eukaryotically expressed adiponectin does not. We next determined if there is any
difference between the multimer formations of these two sources of adiponectin. The
same amount of HEK293 cell-generated and bacterially expressed mouse adiponectin
was subjected to western blotting analysis using mouse adiponectin antibody as primary
antibody. Samples were analyzed under normal, heating, reducing conditions as well as
the combination of heating and reducing conditions. The image (Figure 20) shows
monomer and dimer formations of the protein. Under normal conditions (Lane 1 and 3),
both sources of protein contain very similar amount of monomer and dimer. Heating and
reducing (Lane 2 and 6) make all the multimers larger than a monomer convert into
monomers, the amount of which is higher in denatured eukaryotically expressed
adiponectin than in denatured bacterially expressed adiponectin. This suggests that the
amount of higher molecular weight form of adiponectin may be higher in eukaryotically
expressed adiponectin than in bacterially expressed adiponectin.

69
1 2 3 4 5 6
Figure 20: Western blotting image of eukaryotically expressed and bacterially expressed adiponectin. HEK293 cell-generated and bacterially expressed mouse adiponectin were subjected to 10% SDS-PAGE with or without 100°C heat denaturation for 5 min, and with or without reduction by 5% 2-mercaptoethanol. Adiponectin was detected by anti-mouse adiponectin antibody. Lane 1 and 3 show the monomer and dimer formations of both sources of adiponectin under normal conditions (High molecular weight forms can not be shown here). Both were converted to monomers when heat-denatured and reduced (Lane 2 and 6). Bacterially expressed adiponectin was converted to monomers and dimers under heating conditions (Lane 4), to monomers when reduced (Lane 5) [This figure was obtained from Qiao Zhong with permission].
dimer
monomer 30 kDa
60 kDa

70
DISCUSSION
Adiponectin is a 30 kDa protein secreted exclusively by adipose tissue under
normal conditions. It is a metabolic hormone whose serum level is decreased in obesity
and type 2 diabetes mellitus. Two adiponectin receptors that regulate its anti-diabetic
effect have recently been cloned in mice, AdipoR1 and AdipoR2. AdipoR1 is
ubiquitously and most abundantly expressed in muscle, whereas AdipoR2 is most
abundantly expressed in liver. These two receptors are capable of mediating increased
AMPK and PPARα ligand activities, as well as fatty-acid oxidation and glucose uptake
by adiponectin.
In the present study, we utilized two approaches to demonstrate that HepG2 cells
express both AdipoR2 protein and mRNA. We subsequently investigated the effects of
two sources of adiponectin on hepatic glycogen sysnthesis as well as the mechanisms
involved in this process. We also demonstrated that H9c2 cells express AdipoR1 mRNA,
which enabled us to study and compare the effects of those two sources of adiponectin on
muscle glucose uptake. In addition, we did some preliminary studies on the regulation of
AdipoR2 expression, which suggested that HepG2 cells might be a good model to study
adiponectin receptors in the future.

71
Our study demonstrated for the first time that eukaryotically, but not bacterially
expressed adiponectin inhibits hepatic basal glycogen synthesis, which suggested that
these two sources of adiponectin contain different multimers. SDS-PAGE image of these
proteins under reducing and heating conditions demonstrated that eukaryotically
expressed adiponectin might contain more higher molecular weight forms than bacterially
produced adiponectin, which is very similar to some previous findings. Because bacteria
are unable to process the hydroxyl-prolinated collagenous domain and allow for proper
folding and orientation of the disulfide bond within this domain, the bacterially produced
adiponectin is secreted as lower order forms (77). Scherer et al. suggested that
adiponectin’s effect on hepatic insulin sensitivity is highly dependent on the presence of
higher order structures, such as hexamers and HMW forms (29). Importantly, some
previous studies showed that the hepatic effects of adiponectin require hydroxylation and
glycosylation of residues within the collagenous domain of adiponectin (28), which may
also explain why the bacterially produced adiponectin lacking post-translational
modifications in the collagenous domain does not affect hepatic glucose metabolism.
We have demonstrated that eukaryotically expressed adiponectin inhibits
pyruvate-stimulated gluconeogenesis in primary mouse hepatocytes, which is similar to
Scherer et al (70). Adiponectin can enhance the inhibition effect of insulin on hepatic
gluconeogenesis, which shows the insulin-sensitizing property of this protein. In our
study, we proved that eukaryotically expressed adiponectin also inhibits

72
insulin-stimulated glycogen synthesis in liver, which suggested that adiponectin might
play a major role in inhibiting hepatic glycogen synthesis, therefore providing more
glucose for glycolysis and ATP generation in liver.
We further investigated the mechanisms involved in the effects of adiponectin on
hepatic glycogen synthesis. This may also help to investigate the whole hepatic signal
transduction pathway of adiponectin in the future. There are two pathways through which
eukaryotically expressed adiponectin may work to inhibit hepatic glycogen synthesis:
First it may work through the insulin-signaling pathway; also it may stimulate AMPK
activity, phosphorylate and inactivate glycogen synthase, thus inhibiting glycogen
synthesis. Our experimental result showed that insulin phosphorylates IRS-1 in HepG2
cells, while neither bacterially generated nor eukaryotically expressed protein
phosphorylates IRS-1 directly. So adiponectin does not work through insulin signal
pathway to inhibit basal glycogen synthesis. We then examined if eukaryotically
expressed adiponectin can increase AMPK phosphorylation. Our western blotting data
(not shown) appear to show that this protein did not increase the phosphorylation of
AMPK in HepG2 cells either. Because we did not see the phosphorylation of AMPK by
AICAR (5'-phosphoribosyl-5-aminoimidazole-4-carboxamide), an AMPK activator, in
HepG2 cells, we could not exclude the possibility that our experimental conditions or
process masked the stimulation effect. Since adiponectin has anti-tumor function, it might
suppress the growth and energy metabolism of HepG2 cells, and the effects of
73
adiponectin on phosphorylation of AMPK might be concealed.
Scherer et al. found that the effects of adiponectin on muscle only occur with the
bacterially produced full-length or the globular domain of adiponectin (29). In our studies,
we demonstrated that bacterially but not eukaryotically expressed adiponectin stimulates
basal glucose uptake in the muscle, which is very similar to their finding. Also Sweeney
et al. found that globular adiponectin increases GLUT4 translocation and glucose uptake
but reduces glycogen synthesis in rat skeletal muscle cells (74), which suggested a similar
effect of globular adiponectin in muscle. Whether this effect is purely pharmacological or
a reflection of a physiological aspect of adiponectin function has not been decided yet, as
forming a multimer of higher molecular weight is very important for its bioactivity in
liver but not in muscle. We have identified that AdipoR1 mRNA is present in H9c2 cells
by realtime PCR. AdipoR1 is reported to be expressed predominantly in skeletal muscle
and exhibits a higher affinity for globular adiponectin (41). Since bacterially expressed
adiponectin is secreted as lower order forms, it might contain globular adiponectin as
well. Differences in binding affinity of bacterially and eukaryotically expressed
adiponectin in muscle cells might also be able to explain its different effect on muscle.
The present study verified the presence of AdipoR1 mRNA in H9c2 cells and
AdipoR2 in HepG2 cells for the first time. In addition, insulin was found to inhibit
AdipoR2 protein expression in HepG2 cells. Kadowaki et al. suggested that insulin may
also be a negative regulator to AdipoR2 mRNA level (49). This implied that AdipoR2

74
might also be involved in the metabolic effect of adiponectin. However, some other
groups suggested that AdipoR1, but not AdipoR2 is involved in glucose or lipid
metabolism (50-53). Our realtime-PCR data (not shown) appear to demonstrate that
insulin does not affect AdipoR2 mRNA expression in HepG2 cells. There might be some
post-translational effect of insulin on AdipoR2 expression.
75
SUMMARY
Eukaryotically expressed adiponectin inhibits pyruvate-stimulated
gluconeogenesis in primary mouse hepatocytes.
AdipoR2 protein and mRNA are expressed in HepG2 cells.
Insulin inhibits AdipoR2 protein expression in HepG2 cells.
Eukaryotically but not bacterially expressed adiponectin inhibits basal and
insulin-stimulated glycogen synthesis in HepG2 cells.
IRS-1 is not phosphorylated by adiponectin in HepG2 cells.
AdipoR1 mRNA is expressed in H9c2 cells.
Bacterially but not eukaryotically expressed adiponectin stimulates basal
glucose uptake in H9c2 cells.
Eukaryotically expressed adiponectin contains more higher molecular weight
forms than bacterially expressed adiponectin.

76
BIBLIOGRAPHY
1. McMurry and Castellion: Carbohydrate Metabolism. 95 A.D.,
2. Stumvoll M, Perriello G, Meyer C, Gerich J: Role of glutamine in human
carbohydrate metabolism in kidney and other tissues. Kidney Int. 55:778-792,
1999
3. Bonadonna RC: Alterations of glucose metabolism in type 2 diabetes mellitus. An
overview. Rev.Endocr.Metab Disord. 5:89-97, 2004
4. Kadowaki T, Hara K, Yamauchi T, Terauchi Y, Tobe K, Nagai R: Molecular
mechanism of insulin resistance and obesity. Exp.Biol.Med.(Maywood.)
228:1111-1117, 2003
5. Haque WA, Garg A: Adipocyte biology and adipocytokines. Clin.Lab Med.
24:217-234, 2004
6. Abate N, Garg A: Heterogeneity in adipose tissue metabolism: causes,
implications and management of regional adiposity. Prog.Lipid Res. 34:53-70,
1995

77
7. Fruhbeck G, Gomez-Ambrosi J, Muruzabal FJ, Burrell MA: The adipocyte: a
model for integration of endocrine and metabolic signaling in energy metabolism
regulation. Am.J.Physiol Endocrinol.Metab 280:E827-E847, 2001
8. Fukuhara A, Matsuda M, Nishizawa M, Segawa K, Tanaka M, Kishimoto K,
Matsuki Y, Murakami M, Ichisaka T, Murakami H, Watanabe E, Takagi T,
Akiyoshi M, Ohtsubo T, Kihara S, Yamashita S, Makishima M, Funahashi T,
Yamanaka S, Hiramatsu R, Matsuzawa Y, Shimomura I: Visfatin: a protein
secreted by visceral fat that mimics the effects of insulin. Science 307:426-430,
2005
9. Garg A: Lipodystrophies. Am.J.Med. 108:143-152, 2000
10. Ouchi N, Kihara S, Funahashi T, Matsuzawa Y, Walsh K: Obesity, adiponectin
and vascular inflammatory disease. Curr.Opin.Lipidol. 14:561-566, 2003
11. Stefan N, Stumvoll M, Vozarova B, Weyer C, Funahashi T, Matsuzawa Y,
Bogardus C, Tataranni PA: Plasma adiponectin and endogenous glucose
production in humans. Diabetes Care 26:3315-3319, 2003
12. Tsuchida A, Yamauchi T, Kadowaki T: Nuclear receptors as targets for drug
development: molecular mechanisms for regulation of obesity and insulin
resistance by peroxisome proliferator-activated receptor gamma, CREB-binding

78
protein, and adiponectin. J.Pharmacol.Sci. 97:164-170, 2005
13. Arita Y, Kihara S, Ouchi N, Takahashi M, Maeda K, Miyagawa J, Hotta K,
Shimomura I, Nakamura T, Miyaoka K, Kuriyama H, Nishida M, Yamashita S,
Okubo K, Matsubara K, Muraguchi M, Ohmoto Y, Funahashi T, Matsuzawa Y:
Paradoxical decrease of an adipose-specific protein, adiponectin, in obesity.
Biochem.Biophys.Res.Commun. 257:79-83, 1999
14. Hu E, Liang P, Spiegelman BM: AdipoQ is a novel adipose-specific gene
dysregulated in obesity. J.Biol.Chem. 271:10697-10703, 1996
15. Arita Y, Kihara S, Ouchi N, Maeda K, Kuriyama H, Okamoto Y, Kumada M,
Hotta K, Nishida M, Takahashi M, Nakamura T, Shimomura I, Muraguchi M,
Ohmoto Y, Funahashi T, Matsuzawa Y: Adipocyte-derived plasma protein
adiponectin acts as a platelet-derived growth factor-BB-binding protein and
regulates growth factor-induced common postreceptor signal in vascular smooth
muscle cell. Circulation 105:2893-2898, 2002
16. Scherer PE, Williams S, Fogliano M, Baldini G, Lodish HF: A novel serum
protein similar to C1q, produced exclusively in adipocytes. J.Biol.Chem.
270:26746-26749, 1995
79
17. Maeda K, Okubo K, Shimomura I, Funahashi T, Matsuzawa Y, Matsubara K:
cDNA cloning and expression of a novel adipose specific collagen-like factor,
apM1 (AdiPose Most abundant Gene transcript 1).
Biochem.Biophys.Res.Commun. 221:286-289, 1996
18. Nakano Y, Tobe T, Choi-Miura NH, Mazda T, Tomita M: Isolation and
characterization of GBP28, a novel gelatin-binding protein purified from human
plasma. J.Biochem.(Tokyo) 120:803-812, 1996
19. Funahashi T, Nakamura T, Shimomura I, Maeda K, Kuriyama H, Takahashi M,
Arita Y, Kihara S, Matsuzawa Y: Role of adipocytokines on the pathogenesis of
atherosclerosis in visceral obesity. Intern.Med. 38:202-206, 1999
20. Vasseur F, Lepretre F, Lacquemant C, Froguel P: The genetics of adiponectin.
Curr.Diab.Rep. 3:151-158, 2003
21. Comuzzie AG, Funahashi T, Sonnenberg G, Martin LJ, Jacob HJ, Black AE, Maas
D, Takahashi M, Kihara S, Tanaka S, Matsuzawa Y, Blangero J, Cohen D,
Kissebah A: The genetic basis of plasma variation in adiponectin, a global
endophenotype for obesity and the metabolic syndrome. J.Clin.Endocrinol.Metab
86:4321-4325, 2001

80
22. Beltowski J: Adiponectin and resistin--new hormones of white adipose tissue.
Med.Sci.Monit. 9:RA55-RA61, 2003
23. Tsao TS, Murrey HE, Hug C, Lee DH, Lodish HF: Oligomerization
state-dependent activation of NF-kappa B signaling pathway by adipocyte
complement-related protein of 30 kDa (Acrp30). J.Biol.Chem. 277:29359-29362,
2002
24. Pajvani UB, Du X, Combs TP, Berg AH, Rajala MW, Schulthess T, Engel J,
Brownlee M, Scherer PE: Structure-function studies of the adipocyte-secreted
hormone Acrp30/adiponectin. Implications fpr metabolic regulation and
bioactivity. J.Biol.Chem. 278:9073-9085, 2003
25. Waki H, Yamauchi T, Kamon J, Ito Y, Uchida S, Kita S, Hara K, Hada Y, Vasseur
F, Froguel P, Kimura S, Nagai R, Kadowaki T: Impaired multimerization of
human adiponectin mutants associated with diabetes. Molecular structure and
multimer formation of adiponectin. J.Biol.Chem. 278:40352-40363, 2003
26. Tsao TS, Tomas E, Murrey HE, Hug C, Lee DH, Ruderman NB, Heuser JE,
Lodish HF: Role of disulfide bonds in Acrp30/adiponectin structure and signaling
specificity. Different oligomers activate different signal transduction pathways.
J.Biol.Chem. 278:50810-50817, 2003

81
27. Kobayashi H, Ouchi N, Kihara S, Walsh K, Kumada M, Abe Y, Funahashi T,
Matsuzawa Y: Selective suppression of endothelial cell apoptosis by the high
molecular weight form of adiponectin. Circ.Res. 94:e27-e31, 2004
28. Wang Y, Xu A, Knight C, Xu LY, Cooper GJ: Hydroxylation and glycosylation of
the four conserved lysine residues in the collagenous domain of adiponectin.
Potential role in the modulation of its insulin-sensitizing activity. J.Biol.Chem.
277:19521-19529, 2002
29. Trujillo ME, Scherer PE: Adiponectin--journey from an adipocyte secretory
protein to biomarker of the metabolic syndrome. J.Intern.Med. 257:167-175, 2005
30. Yoda-Murakami M, Taniguchi M, Takahashi K, Kawamata S, Saito K,
Choi-Miura NH, Tomita M: Change in expression of GBP28/adiponectin in
carbon tetrachloride-administrated mouse liver. Biochem.Biophys.Res.Commun.
285:372-377, 2001
31. Berner HS, Lyngstadaas SP, Spahr A, Monjo M, Thommesen L, Drevon CA,
Syversen U, Reseland JE: Adiponectin and its receptors are expressed in
bone-forming cells. Bone 35:842-849, 2004
32. Fasshauer M, Kralisch S, Klier M, Lossner U, Bluher M, Klein J, Paschke R:
Adiponectin gene expression and secretion is inhibited by interleukin-6 in 3T3-L1

82
adipocytes. Biochem.Biophys.Res.Commun. 301:1045-1050, 2003
33. Moore GB, Chapman H, Holder JC, Lister CA, Piercy V, Smith SA, Clapham JC:
Differential regulation of adipocytokine mRNAs by rosiglitazone in db/db mice.
Biochem.Biophys.Res.Commun. 286:735-741, 2001
34. Maeda N, Takahashi M, Funahashi T, Kihara S, Nishizawa H, Kishida K,
Nagaretani H, Matsuda M, Komuro R, Ouchi N, Kuriyama H, Hotta K, Nakamura
T, Shimomura I, Matsuzawa Y: PPARgamma ligands increase expression and
plasma concentrations of adiponectin, an adipose-derived protein. Diabetes
50:2094-2099, 2001
35. Kappes A, Loffler G: Influences of ionomycin, dibutyryl-cycloAMP and tumour
necrosis factor-alpha on intracellular amount and secretion of apM1 in
differentiating primary human preadipocytes. Horm.Metab Res. 32:548-554, 2000
36. Fasshauer M, Klein J, Neumann S, Eszlinger M, Paschke R: Adiponectin gene
expression is inhibited by beta-adrenergic stimulation via protein kinase A in
3T3-L1 adipocytes. FEBS Lett. 507:142-146, 2001
37. Soares AF, Guichardant M, Cozzone D, Bernoud-Hubac N, Bouzaidi-Tiali N,
Lagarde M, Geloen A: Effects of oxidative stress on adiponectin secretion and
lactate production in 3T3-L1 adipocytes. Free Radic.Biol.Med. 38:882-889, 2005

83
38. Nishizawa H, Shimomura I, Kishida K, Maeda N, Kuriyama H, Nagaretani H,
Matsuda M, Kondo H, Furuyama N, Kihara S, Nakamura T, Tochino Y, Funahashi
T, Matsuzawa Y: Androgens decrease plasma adiponectin, an insulin-sensitizing
adipocyte-derived protein. Diabetes 51:2734-2741, 2002
39. Xu A, Chan KW, Hoo RL, Wang Y, Tan KC, Zhang J, Chen B, Lam MC, Tse C,
Cooper GJ, Lam KS: Testosterone selectively reduces the high molecular weight
form of adiponectin by inhibiting its secretion from adipocytes. J.Biol.Chem.
2005
40. Meier U, Gressner AM: Endocrine regulation of energy metabolism: review of
pathobiochemical and clinical chemical aspects of leptin, ghrelin, adiponectin,
and resistin. Clin.Chem. 50:1511-1525, 2004
41. Yamauchi T, Kamon J, Ito Y, Tsuchida A, Yokomizo T, Kita S, Sugiyama T,
Miyagishi M, Hara K, Tsunoda M, Murakami K, Ohteki T, Uchida S, Takekawa S,
Waki H, Tsuno NH, Shibata Y, Terauchi Y, Froguel P, Tobe K, Koyasu S, Taira K,
Kitamura T, Shimizu T, Nagai R, Kadowaki T: Cloning of adiponectin receptors
that mediate antidiabetic metabolic effects. Nature 423:762-769, 2003
42. Hug C, Wang J, Ahmad NS, Bogan JS, Tsao TS, Lodish HF: T-cadherin is a
receptor for hexameric and high-molecular-weight forms of Acrp30/adiponectin.
Proc.Natl.Acad.Sci.U.S.A 101:10308-10313, 2004
84
43. Kemler R: Classical cadherins. Semin.Cell Biol. 3:149-155, 1992
44. Ivanov DB, Philippova MP, Tkachuk VA: Structure and functions of classical
cadherins. Biochemistry (Mosc.) 66:1174-1186, 2001
45. Kharroubi I, Rasschaert J, Eizirik DL, Cnop M: Expression of adiponectin
receptors in pancreatic beta cells. Biochem.Biophys.Res.Commun. 312:1118-1122,
2003
46. Bluher M, Fasshauer M, Kralisch S, Schon MR, Krohn K, Paschke R: Regulation
of adiponectin receptor R1 and R2 gene expression in adipocytes of C57BL/6
mice. Biochem.Biophys.Res.Commun. 329:1127-1132, 2005
47. Fasshauer M, Klein J, Kralisch S, Klier M, Lossner U, Bluher M, Paschke R:
Growth hormone is a positive regulator of adiponectin receptor 2 in 3T3-L1
adipocytes. FEBS Lett. 558:27-32, 2004
48. Lord E, Ledoux S, Murphy BD, Beaudry D, Palin MF: Expression of adiponectin
and its receptors in swine. J.Anim Sci. 83:565-578, 2005
49. Tsuchida A, Yamauchi T, Ito Y, Hada Y, Maki T, Takekawa S, Kamon J,
Kobayashi M, Suzuki R, Hara K, Kubota N, Terauchi Y, Froguel P, Nakae J,
Kasuga M, Accili D, Tobe K, Ueki K, Nagai R, Kadowaki T: Insulin/Foxo1
pathway regulates expression levels of adiponectin receptors and adiponectin

85
sensitivity. J.Biol.Chem. 279:30817-30822, 2004
50. Inukai K, Nakashima Y, Watanabe M, Takata N, Sawa T, Kurihara S, Awata T,
Katayama S: Regulation of adiponectin receptor gene expression in diabetic mice.
Am.J.Physiol Endocrinol.Metab 2004
51. Wang H, Zhang H, Jia Y, Zhang Z, Craig R, Wang X, Elbein SC: Adiponectin
receptor 1 gene (ADIPOR1) as a candidate for type 2 diabetes and insulin
resistance. Diabetes 53:2132-2136, 2004
52. Staiger H, Kaltenbach S, Staiger K, Stefan N, Fritsche A, Guirguis A, Peterfi C,
Weisser M, Machicao F, Stumvoll M, Haring HU: Expression of adiponectin
receptor mRNA in human skeletal muscle cells is related to in vivo parameters of
glucose and lipid metabolism. Diabetes 53:2195-2201, 2004
53. Civitarese AE, Jenkinson CP, Richardson D, Bajaj M, Cusi K, Kashyap S, Berria
R, Belfort R, DeFronzo RA, Mandarino LJ, Ravussin E: Adiponectin receptors
gene expression and insulin sensitivity in non-diabetic Mexican Americans with
or without a family history of Type 2 diabetes. Diabetologia 47:816-820, 2004
54. Diez JJ, Iglesias P: The role of the novel adipocyte-derived hormone adiponectin
in human disease. Eur.J.Endocrinol. 148:293-300, 2003

86
55. Brakenhielm E, Veitonmaki N, Cao R, Kihara S, Matsuzawa Y, Zhivotovsky B,
Funahashi T, Cao Y: Adiponectin-induced antiangiogenesis and antitumor activity
involve caspase-mediated endothelial cell apoptosis. Proc.Natl.Acad.Sci.U.S.A
101:2476-2481, 2004
56. Kondo H, Shimomura I, Matsukawa Y, Kumada M, Takahashi M, Matsuda M,
Ouchi N, Kihara S, Kawamoto T, Sumitsuji S, Funahashi T, Matsuzawa Y:
Association of adiponectin mutation with type 2 diabetes: a candidate gene for the
insulin resistance syndrome. Diabetes 51:2325-2328, 2002
57. Menzaghi C, Ercolino T, Di Paola R, Berg AH, Warram JH, Scherer PE, Trischitta
V, Doria A: A haplotype at the adiponectin locus is associated with obesity and
other features of the insulin resistance syndrome. Diabetes 51:2306-2312, 2002
58. Lindsay RS, Funahashi T, Hanson RL, Matsuzawa Y, Tanaka S, Tataranni PA,
Knowler WC, Krakoff J: Adiponectin and development of type 2 diabetes in the
Pima Indian population. Lancet 360:57-58, 2002
59. Hotta K, Funahashi T, Bodkin NL, Ortmeyer HK, Arita Y, Hansen BC,
Matsuzawa Y: Circulating concentrations of the adipocyte protein adiponectin are
decreased in parallel with reduced insulin sensitivity during the progression to
type 2 diabetes in rhesus monkeys. Diabetes 50:1126-1133, 2001

87
60. Hotta K, Gustafson TA, Yoshioka S, Ortmeyer HK, Bodkin NL, Hansen BC:
Relationships of PPARgamma and PPARgamma2 mRNA levels to obesity,
diabetes and hyperinsulinaemia in rhesus monkeys. Int.J.Obes.Relat Metab
Disord. 22:1000-1010, 1998
61. Havel PJ: Update on adipocyte hormones: regulation of energy balance and
carbohydrate/lipid metabolism. Diabetes 53 Suppl 1:S143-S151, 2004
62. Fruebis J, Tsao TS, Javorschi S, Ebbets-Reed D, Erickson MR, Yen FT, Bihain BE,
Lodish HF: Proteolytic cleavage product of 30-kDa adipocyte complement-related
protein increases fatty acid oxidation in muscle and causes weight loss in mice.
Proc.Natl.Acad.Sci.U.S.A 98:2005-2010, 2001
63. Yamauchi T, Kamon J, Waki H, Terauchi Y, Kubota N, Hara K, Mori Y, Ide T,
Murakami K, Tsuboyama-Kasaoka N, Ezaki O, Akanuma Y, Gavrilova O, Vinson
C, Reitman ML, Kagechika H, Shudo K, Yoda M, Nakano Y, Tobe K, Nagai R,
Kimura S, Tomita M, Froguel P, Kadowaki T: The fat-derived hormone
adiponectin reverses insulin resistance associated with both lipoatrophy and
obesity. Nat.Med. 7:941-946, 2001
64. Combs TP, Berg AH, Obici S, Scherer PE, Rossetti L: Endogenous glucose
production is inhibited by the adipose-derived protein Acrp30. J.Clin.Invest
108:1875-1881, 2001
88
65. Ruan H, Lodish HF: Insulin resistance in adipose tissue: direct and indirect effects
of tumor necrosis factor-alpha. Cytokine Growth Factor Rev. 14:447-455, 2003
66. Ouchi N, Kihara S, Arita Y, Okamoto Y, Maeda K, Kuriyama H, Hotta K, Nishida
M, Takahashi M, Muraguchi M, Ohmoto Y, Nakamura T, Yamashita S, Funahashi
T, Matsuzawa Y: Adiponectin, an adipocyte-derived plasma protein, inhibits
endothelial NF-kappaB signaling through a cAMP-dependent pathway.
Circulation 102:1296-1301, 2000
67. Lihn AS, Pedersen SB, Richelsen B: Adiponectin: action, regulation and
association to insulin sensitivity. Obes.Rev. 6:13-21, 2005
68. Qi Y, Takahashi N, Hileman SM, Patel HR, Berg AH, Pajvani UB, Scherer PE,
Ahima RS: Adiponectin acts in the brain to decrease body weight. Nat.Med.
10:524-529, 2004
69. Ouchi N, Kihara S, Arita Y, Nishida M, Matsuyama A, Okamoto Y, Ishigami M,
Kuriyama H, Kishida K, Nishizawa H, Hotta K, Muraguchi M, Ohmoto Y,
Yamashita S, Funahashi T, Matsuzawa Y: Adipocyte-derived plasma protein,
adiponectin, suppresses lipid accumulation and class A scavenger receptor
expression in human monocyte-derived macrophages. Circulation 103:1057-1063,
2001
89
70. Berg AH, Combs TP, Du X, Brownlee M, Scherer PE: The adipocyte-secreted
protein Acrp30 enhances hepatic insulin action. Nat.Med. 7:947-953, 2001
71. Yamauchi T, Kamon J, Minokoshi Y, Ito Y, Waki H, Uchida S, Yamashita S, Noda
M, Kita S, Ueki K, Eto K, Akanuma Y, Froguel P, Foufelle F, Ferre P, Carling D,
Kimura S, Nagai R, Kahn BB, Kadowaki T: Adiponectin stimulates glucose
utilization and fatty-acid oxidation by activating AMP-activated protein kinase.
Nat.Med. 8:1288-1295, 2002
72. Gil-Campos M, Canete RR, Gil A: Adiponectin, the missing link in insulin
resistance and obesity. Clin.Nutr. 23:963-974, 2004
73. Tomas E, Tsao TS, Saha AK, Murrey HE, Zhang CC, Itani SI, Lodish HF,
Ruderman NB: Enhanced muscle fat oxidation and glucose transport by ACRP30
globular domain: acetyl-CoA carboxylase inhibition and AMP-activated protein
kinase activation. Proc.Natl.Acad.Sci.U.S.A 99:16309-16313, 2002
74. Ceddia RB, Somwar R, Maida A, Fang X, Bikopoulos G, Sweeney G: Globular
adiponectin increases GLUT4 translocation and glucose uptake but reduces
glycogen synthesis in rat skeletal muscle cells. Diabetologia 48:132-139, 2005
75. Harman AW, McCamish LE, Henry CA: Isolation of hepatocytes from postnatal
mice. J Pharmacol.Methods 17:157-163, 1987

90
76. Miyazaki T, Bub JD, Uzuki M, Iwamoto Y: Adiponectin activates c-Jun
NH(2)-terminal kinase and inhibits signal transducer and activator of transcription
3. Biochem.Biophys.Res.Commun. 333:79-87, 2005
77. Shapiro L, Scherer PE: The crystal structure of a complement-1q family protein
suggests an evolutionary link to tumor necrosis factor. Curr.Biol. 8:335-338, 1998