Regulation in Swiss Cantons: Data for one Century
26
Regulation in Swiss Cantons: Data for one Century Simon Luechinger Mark Schelker CESIFO WORKING PAPER NO. 5663 CATEGORY 1: PUBLIC FINANCE ORIGINAL VERSION: DECEMBER 2015 THIS VERSION: MARCH 2016 An electronic version of the paper may be downloaded • from the SSRN website: www.SSRN.com • from the RePEc website: www.RePEc.org • from the CESifo website: www.CESifo-group.org/wpISSN 2364-1428
Transcript of Regulation in Swiss Cantons: Data for one Century

Regulation in Swiss Cantons: Data for one Century
Simon Luechinger Mark Schelker
CESIFO WORKING PAPER NO. 5663 CATEGORY 1: PUBLIC FINANCE
ORIGINAL VERSION: DECEMBER 2015 THIS VERSION: MARCH 2016
An electronic version of the paper may be downloaded • from the SSRN website: www.SSRN.com • from the RePEc website: www.RePEc.org
• from the CESifo website: Twww.CESifo-group.org/wp T
ISSN 2364-1428

CESifo Working Paper No. 5663 Regulation in Swiss Cantons: Data for one Century
Abstract We present and illustrate novel data on more than a century of regulation in Switzerland. We provide quantitative measures for Swiss cantons on the annual stock of legally binding rules from 2006-2013 and on regulatory activity as reflected in the annual changes to such regulation from 1908-2013. We measure the stock of regulation by the number of enactments and characters, and the regulatory activity by the number of changed enactments and pages. We break down the measures by the level in the hierarchy of legal norms and by the issuing authority. The data reveal substantial cantonal heterogeneity in the stock of regulation and the extent and development of regulatory activity. Regulatory activity generally increased over the century, though in a non-monotonic and volatile manner. Quantitatively, regulation at the level of decrees and regulation by the executive dominate. We also construct our measures for the federal level from 2006-2013 (stock) and 1848-2013 (activity).
JEL-Codes: H100, H700, K200, Y100.
Keywords: regulation, regulatory activity.
Simon Luechinger Department of Economics
University of Lucerne Frohburgstrasse 3
Switzerland – 6002 Lucerne [email protected]
Mark Schelker Department of Economics
University of Fribourg Bd. de Perolles 90
Switzerland – 1700 Fribourg [email protected]
March 3, 2016 A brief description of our research project and the data in German and French can be found in Luechinger and Schelker (2015a;b). We gratefully acknowledge financing by the Profilbereich Wirtschaftspolitik of the University of St. Gallen, the Dr. Heinrich Wachter-Stiftung, the Swiss National Science Foundation (SNF-Sinergia-Grant 130648, subproject 10), and the canton of Graubünden. We thank the whole data collection team for their great efforts. The data collection was coordinated by Christian Marti and later by Benjamin Krebs; other members of the team were Elian Debrunner, Judith Gamp, Severine Hänni, Simon Kiener, Rino Kungl, Mathias Probst, Simona Richard, Nicolas Scheurer, Reto Stalder, Daniel Steinberg, and Cung Truong Hoang. An early version of the data was used by Christian Marti in his PhD dissertation (Marti 2016).

2
1. Introduction
Political commentators regularly assert a surge in regulation. Explanations range from an
increase in economic and social complexity, institutional changes and special interest
politics.1 An often cited and prominent example of regulatory zeal is the U.S. Dodd-Frank
Act, with 848 pages.2 Given the disagreement about the causes, it comes as no surprise that
there is no agreement about the consequences. While some deem it to be an adequate response
to economic and social developments, others fret about a decrease in the quality of legislation
and legal certainty. So far, this debate has been based mostly on anecdotal evidence.
However, a rigorous analysis of the causes and consequences requires systematic and
comparable data. We present unique data, along with the major facts and trends, for one
century of regulation in Swiss cantons (equivalent to U.S. states), and for the sake of
completeness, at the Swiss federal level. Looking at the Swiss subnational level is particularly
interesting as the 26 cantons all share a common national institutional environment, but have
considerable autonomy and feature great institutional variation.
Our measures capture the amount of regulation, differentiated by the authorities issuing the
regulation and the hierarchy of legal norms. In the spirit of the seminal contributions of Moser
(1952), Linder et al. (1985) and Mulligan and Shleifer (2005), we quantify regulation by the
number of enactments, pages, and characters. Thereby, we distinguish between the legislature,
the executive, and other authorities, as well as between the constitutional, statutory, and other
levels in the hierarchy of legal norms.
A few other papers use similar measures of regulation. In the Swiss context, there are earlier
data series for two individual cantons and the federal level. These are data series for Berne
1894-1951 (Moser 1952), Vaud 1948-1982 (Linder et al. 1985), and for the federal level
1948-2007 (Linder et al. 1985, 2009) and 1960-2013 (Buomberger 2014).3
In the international context, similar measures have been used to address a large range of
questions. Mulligan and Shleifer (2005) show that, in a cross-section of U.S. states, the
amount of regulation measured in kilobytes increases with population size. This is consistent
with the notion of the fixed costs of the regulatory process. Alesina et al. (2005) analyze the
scale and scope of European Union legislation by counting the number of enactments in
1 Economist, “In love with regulation,” July 31, 1997; Economist, “United States’ economy. Over-regulated
America,” February 18, 2012; Neue Zürcher Zeitung, “Qualität der Gesetzgebung im Sinkflug,” February 8,
2013; Neue Zürcher Zeitung, “Für jedes neue Problem ein neues Gesetz,” November 9, 2011. 2 Economist, “The Dodd-Frank act. Too big not to fail,” February 18, 2012.
3 In the Appendix we discuss and illustrate how our data compare to these data series.

3
different regulatory areas. In a time-series model at the U.S. federal level, Dawson and Seater
(2013) analyze the effect of the number of pages of federal regulation on private sector output
and total factor productivity. Dal Bó and Rossi (2011) and Braendle and Stutzer (2012) use,
among other measures, the numbers of bills proposed or ratified and the number of
interpellations to investigate legislative activity.
In contrast to these overall measures, papers using measures of specific regulatory content
abound (e.g., Djankov et al. 2002; Botero et al. 2004). Acknowledging the obvious
advantages of content measures, they do not allow researchers to capture overall regulatory
activity and often require somewhat arbitrary decisions about the considered components, the
impacts of specific laws, the aggregation procedure, and weights. Hence, overall and content
measures are complementary.
In what follows, Section 2 introduces the measurement methodology and sources, Section 3
illustrates the data at the cantonal level, Section 4 presents the data at the federal level,
Section 5 concludes.
2. Data: Measures and sources
The amount of regulation can be quantified with two conceptually distinct measures, i.e.,
stock and activity. The stock captures all legally binding rules at a particular point in time
(e.g., Linder et al. 1985, Mulligan and Shleifer 2005). In contrast, activity refers to new
enactments, amendments, and repeals occurring during a particular time interval (e.g., Moser
1952, Dal Bó and Rossi 2011). Importantly, the activity measure is not identical to a change
in stock, since it sums all changes. The measures of stock and activity allow different
questions of interest to be answered.
Practically, we count the number of enactments (in the case of both the stock and activity
measures), the pages (in the case of activity measures), and the characters (in the case of stock
measures). The number of enactments is straightforward to count, but provides no information
on the extent of regulation. Therefore, we supplement this measure with the number of
characters or pages. However, the number of pages is potentially noisy because of differences
in publication practices.
We always distinguish the hierarchy of legal norms and the authority issuing the regulation.
We distinguish four levels of the hierarchy of norms: Constitution, statutes, decrees (decrees,
ordinances, resolutions), and inter-jurisdictional treaties. Overall, the main authorities are the

4
legislature and the executive. Typically, changes to the Constitution or to statutes originate in
the legislature. Popular initiatives in all cantons and citizen assemblies in some complement
the legislature as a source of new legislation. For decrees, the main sources are the legislature
and the executive. Sometimes, the legislature and the executive issue a decree jointly, or the
issuing authority could not be identified. Inter-jurisdictional treaties form a separate group.
They contain any treaties and agreements between cantons or regions, including regions in
other countries. For the federal level, we organize international treaties in a separate category.
Finally, we lump together third parties issuing decrees, such as courts and special councils.
Stock
We collect the stock measures from so-called “systematic” law collections containing the
currently applicable rules. They are published in binders so that the collections can be
continually updated. Collections for earlier years exist only in rare cases. Since 2006, the
project LexFind (http://www.lexfind.ch/) hosted by the Zentrum für Rechtsinformation
(hereafter ZRI) has digitally stored the collections. We commissioned an algorithm to extract
the number of enactments and characters for every year.
Activity
To gather the activity measures, we rely on so-called “chronological” law collections or
official journals, which are generally available in libraries or cantonal archives back to 1908
and online in later years. They comprise all regulatory changes, i.e., new enactments,
amendments, and repeals, made in a given time interval. For practical reasons, we assign
enactments to years according to the year of publication. In rare cases, precise information on
the publication date is not available and we have to use the enactment date. For example,
Graubünden in 1935-1950 published three-year volumes without additional information on
the publication date. However, publication usually immediately follows enactment.
After test-runs to define the coding framework, research assistants manually recorded the
following information from each relevant entry of the cantonal law collections and journals:
publication year, enactment type, and the page numbers or start and end pages. For the
enactment type, research assistants could choose from pre-defined canton-specific lists or
record the exact title in case the enactment assignment was unclear. Our legal expert, Dr.
Marius Roth of the ZRI, assigned enactment types to the legal hierarchy and the issuing
authority. Denominations of enactment types differ vastly across cantons and time. As some
cantonal law collections also contain other information, Dr. Roth defined a comparable core

5
of generally binding rules. Specifically, we exclude re-printed federal laws, electoral results,
collective labor agreements, cantonal budgets, codes on the internal organization of public
entities, various announcements, etc.
Depending on the structure of the cantonal law collection, research assistants either coded the
start and end pages of enactments or manually counted page numbers. As a general rule, every
enactment counts at least one page, even if a canton published more than one enactment on
one page. Similarly, every started page is fully counted. We do not account for layout
differences across cantons and time, except in one very pronounced case. Jura publishes its
journal in a format that is almost twice the normal size, but is structured in two columns per
page. Therefore, we count the number of columns, instead of pages. Moreover, it is not
possible to account for discrepancies in publication practices across cantons and over time.
For example, there might be differences in the extent to which unchanged passages are
published alongside amendments.
To ensure data quality, we checked all extreme values (zeroes and visible spikes) and a
random sample of 2-10% of canton-years per research assistant. We discarded and recollected
the data if the error rate was above 3%. Specific issues that we had to take into account:
Publication practices differ between cantons with respect to the publication of laws that have
to pass a popular referendum. No danger of miscounting emerges if cantons only publish legal
texts that were approved in the referendum. Corrections were required in two cases: Some
cantons publish the referendum text in their official journal before the new legal text passes
the referendum, while others publish the texts before and after the referendum if they pass.
The following cantons employ one of the latter publication strategies during at least some
periods: Appenzell Ausserrhoden, Jura, Nidwalden, Obwalden, Thurgau, and Uri. In order to
avoid miscounting, we had to go through all referendums and eliminate laws that were not
accepted in a subsequent referendum or that have been published twice. A further challenge
was to avoid double counting due to the practice of some cantons of first publishing the text,
and as a second step, publishing the activation of the regulation (Appenzell Ausserrhoden,
Schaffhausen, and Uri).
In 22 out of 25 cantons (Jura was only founded in 1979), the information is systematically
available from 1908 onwards. For some cantons we found law collections that reach even
further back in time: Aargau (1885), Bern (1882), Luzern (1906), Schaffhausen (1884), Uri
(1901), Valais (1897), and Zurich (1907). The law collections of the federal level date back to
the founding year in 1848. In a few cantons sources are available only after 1908. No law

6
collections are available for Appenzell Ausserrhoden 1908-1914 and Glarus 1908-1923. To
date, Appenzell Innerrhoden does not officially publish legal changes. However, a collection
of legal changes has been kept in the cantonal archive, or in later years, the cantonal library.
Publications of enactments in the years 1908-1973 are haphazardly stored in boxes in the
cantonal archive and coding the respective years would have been prohibitively costly.
Below, we work with an unbalanced panel from 1908-2013.
Table 1. Overview of categories.
All observations: 200,292 recorded entries
654,081 recorded pages
Core: 189,938 recorded enactments (94.8% w.r.t. all observations)
620,438 recorded pages (94.9%)
Core 1908-2013: 188,355 recorded enactments (99.2% w.r.t. total observations in the core)
611,771 recorded pages (98.6%)
Issuing authority
Hierarchy of legal norms Legislature Executive Joint 3rd
parties Unknown Total
Constitution, enactments 732 732
(0.4%) (0.4%)
Constitution, pages 2281 2281
(0.4%) (0.4%)
Statues, enactments 28,124 28,124
(14.9%) (15.0)
Statues, pages 137,215 137,215
(22.4%) (22.4%)
Decrees, enactments 34,822 98,648 12,516 1165 147,151
(18.5%) (52.4%) (6.6%) (0.6%) (78.1%)
Decrees, pages 81,738 292,234 53,342 4988 432,302
(13.4%) (47.8%) (8.7%) (0.8%) (70.7%)
Treaties, enactments 5509 5509
(2.9%) (2.9%)
Treaties, pages 20,615 20,615
(3.4%) (3.4%)
Other, enactments 6839 6839
(3.6%) (3.6%)
Other, pages 19,358 19,358
(3.2%) (3.2%)
Total, enactments 63,678 98,648 18,025 1165 6839 188,355
(33.8%) (52.4%) (9.6%) (0.6%) (3.6%) (100.0%)
Total, pages 221,234 292,234 73,957 4988 19,358 611,771
(36.2%) (47.8%) (12.1%) (0.8%) (3.2%) (100.0%)

7
Table 1 provides an overview of the cantonal data. The respective information for the federal
level is discussed in Section 4. Overall, we coded 200,292 entries running over 654,081
pages. Defining the core of legally binding rules eliminates 10,354 irrelevant entries and
33,643 pages, leaving us with 189,938 enactments (94.8% of all enactments) and 620,438
pages (94.9%). When further restricting to the period 1908-2013, we keep 188,355 entries
(99.2% of the core) and 611,771 pages (98.6%).
Table 1 breaks down the total numbers of enactments and pages according to the different
categories in the hierarchy of legal norms and the issuing authorities. With 52.4% of all
enactments and 47.8% of all pages, the executive is the most active authority. This translates
into a high share of regulation issued at the level of decrees, amounting to 78.1% of all
enactments and 70.7% of all pages.
3. Illustration of cantonal data
Table 2 presents summary statistics for the stock and activity measures. Panel A contains the
stock measures for 2006-2013 and Panel B the activity measures for 1908-2013. Separate
summary statistics are provided for the number of enactments and the number of either
characters (stock) or pages (activity) by the different levels in the hierarchy of legal norms.
Table 2. Summary statistics, cantons, part 1
Panel A. Stock, 2006-2013
Mean Std. dev. Min Max
Number of enactments
Constitution 1 0 1 1
Statutes 121 52 52 294
Decrees 297 113 102 524
Treaties 83 39 33 211
Other 161 135 19 651
Total 663 224 333 1279
Number of characters
Constitution 55,314 18,206 27,123 135,516
Statutes 2,785,712 1,716,115 936,849 13,828,645
Decrees 3,496,524 1,945,956 916,562 12,093,478
Treaties 795,871 310,928 283,100 1,658,089
Other 902,945 629,160 96,303 2,604,409
Total 8,036,366 3,899,613 3,224,635 29,122,198
To be continued.

8
Table 2. Summary statistics, cantons, part 2
Panel B. Activity, 1908-2013
Mean Std. dev. Min Max
Number of enactments
Constitution 0 1 0 10
Statutes 11 21 0 243
Decrees 57 47 0 322
Treaties 2 4 0 47
Other 3 14 0 220
Total 73 65 1 409
Number of pages
Constitution 1 4 0 54
Statutes 53 74 0 837
Decrees 167 147 0 3061
Treaties 8 15 0 327
Other 7 29 0 460
Total 236 206 1 3260
Notes: N = 208 in Panel A; N = 2591 in Panel B.
On average, the cantonal stock of regulation in 2006-2013 was covered in 663 enactments
with a total of 8,036,366 characters (or roughly twice the number of characters in the Bible4).
Decrees are the most prevalent type of legal norm, with an average share of around 43.5%
(characters) to 44.8% (enactments). Even more pronounced are the differences across cantons.
The number of enactments and characters differ by factors of 3.8 and 9, respectively, between
the briefest and most wordy bodies of rules. Over all cantons and the years 1908-2013, the
changes to cantonal bodies of rules reached 73 enactments or 236 pages per year on average.
Stock
Figure 1 shows the cantonal heterogeneity in the stock of regulation. Panels A and B contain
the measures with totals over all enactment categories, while Panels C and D contain the
measures with respect to statutes only.
A clear pattern emerges: The stock of regulation is higher in the mainly French or Italian
speaking cantons, i.e., Geneva (GE), Fribourg (FR), Jura (JU), Neuchâtel (NE), Ticino (TI),
Valais (VS), and Vaud (VD), and in more urban cantons, i.e., Basel (BS), Geneva (GE), Vaud
(VD), and Zurich (ZH). At the other end of the spectrum are the small, rural, and German-
speaking cantons of Appenzell Ausserrhoden (AR), Appenzell Innerrhoden (AI), Uri (UR),
and others. There are some deviations from this general pattern: For example, Valais (VS) is
4 According to the following website, the Bible has 4,017,010 characters: http://www.madore.org/~david/misc/
orders_mag.html; accessed: October 23, 2015.

9
not a top-regulator in terms of overall enactments, but in terms of statutes. For Zurich (ZH),
the opposite is true. Also, Bern (BE) is among the extensively regulated cantons in terms of
characters, but not enactments.
Figure 1. Stock, 2013
Panel A. Number of enactments, total Panel B. Number of characters, total
Notes: [300,400], (400,500], (500,600],
(600,700], (700,800], (800,1300].
Notes: [3,5], (5,7], (7,9], (9,11], (11,13],
(13,17]; in millions.
Panel C. Number of enactments, statutes Panel D. Number of characters, statutes
Notes: [50,75], (75,100], (100,125],
(125,150], (150,300].
Notes: [.9,1.5], (1.5,2], (2,2.5], (2.5,3],
(3,5], (5,7.02]; in millions.
The observed patterns across language regions are not due to linguistic differences.
Comparing the number of characters of identical regulation in French, Italian, Rumantsch, and
German at the federal level and/or in multilingual cantons, we find that German uses 98.3% of
the characters of the French and 99.8% of the Italian version, on average, at the federal level,
and 96.4% (French), 96.1% (Italian), and 91.6% (Rumantsch) at the cantonal level.
From stock to activity
The relationship between the stock and activity measures is shown in Figure 2. Importantly,
the change in the stock from one year to another is not equivalent to the activity measure
because the activity measure captures the number of changed enactments and sums new
enactments, amendments, and repeals.

10
Figure 2. Changes in stock versus activity, canton of Zurich, 2007-2013
Notes: Number of changed enactments (—) and changes in number of enactments (—).
Figure 2 illustrates the two measures for Zurich. The changes in the overall stock of
regulation are trending downwards and are much lower than the activity measure. In 2010, the
activity measure peaks with slightly less than 300 adjustments, while the change in the stock
is close to zero. In 2013, the (negative) change in the stock measure indicates that the overall
number of legally binding regulations actually decreased, whereas more than 200 adjustments
have been made. These examples illustrate the complementarity of the two measures. On the
one hand, the activity measure captures the idea that – even without changes in the overall
stock – individuals and firms might have to adjust their behavior due to changes in the
regulatory environment. On the other hand, the stock approximates the overall regulatory
environment or regulatory density for a particular year.
Despite the conceptual differences between the two measures, Figure 3 reveals a high positive
cross-sectional correlation: Cantons with a large stock also tend to be the more active ones.

11
Figure 3. Number of changed enactments, avrg. 2004-2013, versus number of
enactments, 2013
Activity
As with the stock, there is also large heterogeneity in regulatory activity across the cantons.
Panel A of Figure 4 shows the number of changes to all categories of enactments, while Panel
B focuses on statutes only. In order not to be overly repetitive, the illustrations focusing on
the number of pages are omitted. The overall patterns, however, are similar.
Figure 4. Activity, avrg. 2004-2013
Panel A. Number of enactments, total Panel B. Number of enactments, statutes
Notes: [0,50], (50,100], (100,150],
(150,200], (200,250], (250,350].
Notes: [0,10], (10,20], (20,30], (30,40],
(40,50], (50,200].

12
The high correlation between stock and activity measures shown in Figure 3 also manifests
itself in the similarity of the choropleth map for stock and activity. Again, the most
regulatorily active cantons are the urban, and the mainly French or Italian speaking cantons,
the least active are the rural, German-speaking cantons. Two noticeable differences to the
corresponding figures for the stock are the relatively high level of activity in Appenzell
Innerrhoden (AI) and the comparatively low amount of changes to statutes in Valais (VS).
The true potency of our regulatory activity measure lies in its capacity to unveil more than a
century of regulatory development. Figure 5 depicts the time series for the 26 cantons. Those
for Appenzell Ausserrhoden (lower), Zurich (middle), and Geneva (upper) are highlighted.
Figure 5. Regulatory activity, total, all cantons, 1908-2013
Notes: The black lines represent the cantons Appenzell Ausserrhoden (lower), Zurich (middle),
and Geneva (upper).
The most striking properties are the secular rise, the nonlinearity, and the strong volatility of
regulatory activity. The great heterogeneity across cantons that we encountered at the end of
the period in previous illustrations is a stable feature and is already present at the beginning.
This cantonal heterogeneity at both the beginning and the end of the period, as well as the
general increase in regulatory activity, are also apparent in Figures 6 and 7. The new
13
observation that emerges from these figures is the large heterogeneity in the growth of
regulatory activity across cantons.
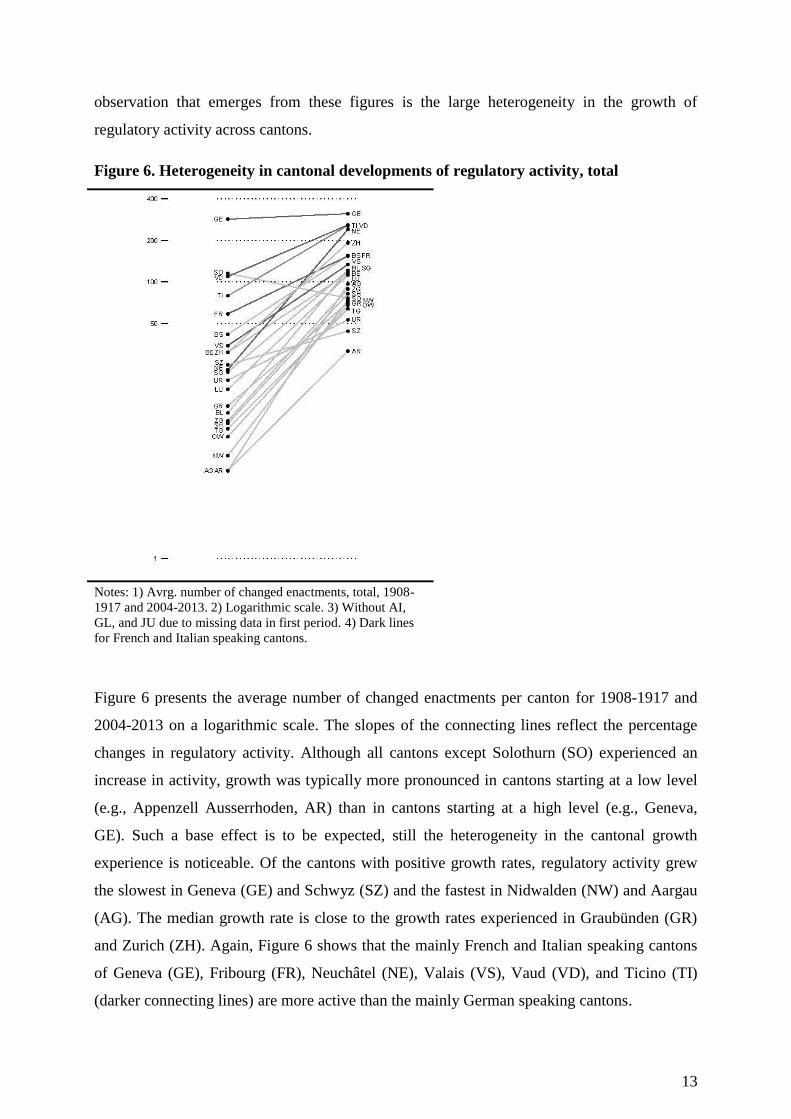
Figure 6. Heterogeneity in cantonal developments of regulatory activity, total
Notes: 1) Avrg. number of changed enactments, total, 1908-
1917 and 2004-2013. 2) Logarithmic scale. 3) Without AI,
GL, and JU due to missing data in first period. 4) Dark lines
for French and Italian speaking cantons.
Figure 6 presents the average number of changed enactments per canton for 1908-1917 and
2004-2013 on a logarithmic scale. The slopes of the connecting lines reflect the percentage
changes in regulatory activity. Although all cantons except Solothurn (SO) experienced an
increase in activity, growth was typically more pronounced in cantons starting at a low level
(e.g., Appenzell Ausserrhoden, AR) than in cantons starting at a high level (e.g., Geneva,
GE). Such a base effect is to be expected, still the heterogeneity in the cantonal growth
experience is noticeable. Of the cantons with positive growth rates, regulatory activity grew
the slowest in Geneva (GE) and Schwyz (SZ) and the fastest in Nidwalden (NW) and Aargau
(AG). The median growth rate is close to the growth rates experienced in Graubünden (GR)
and Zurich (ZH). Again, Figure 6 shows that the mainly French and Italian speaking cantons
of Geneva (GE), Fribourg (FR), Neuchâtel (NE), Valais (VS), Vaud (VD), and Ticino (TI)
(darker connecting lines) are more active than the mainly German speaking cantons.
14
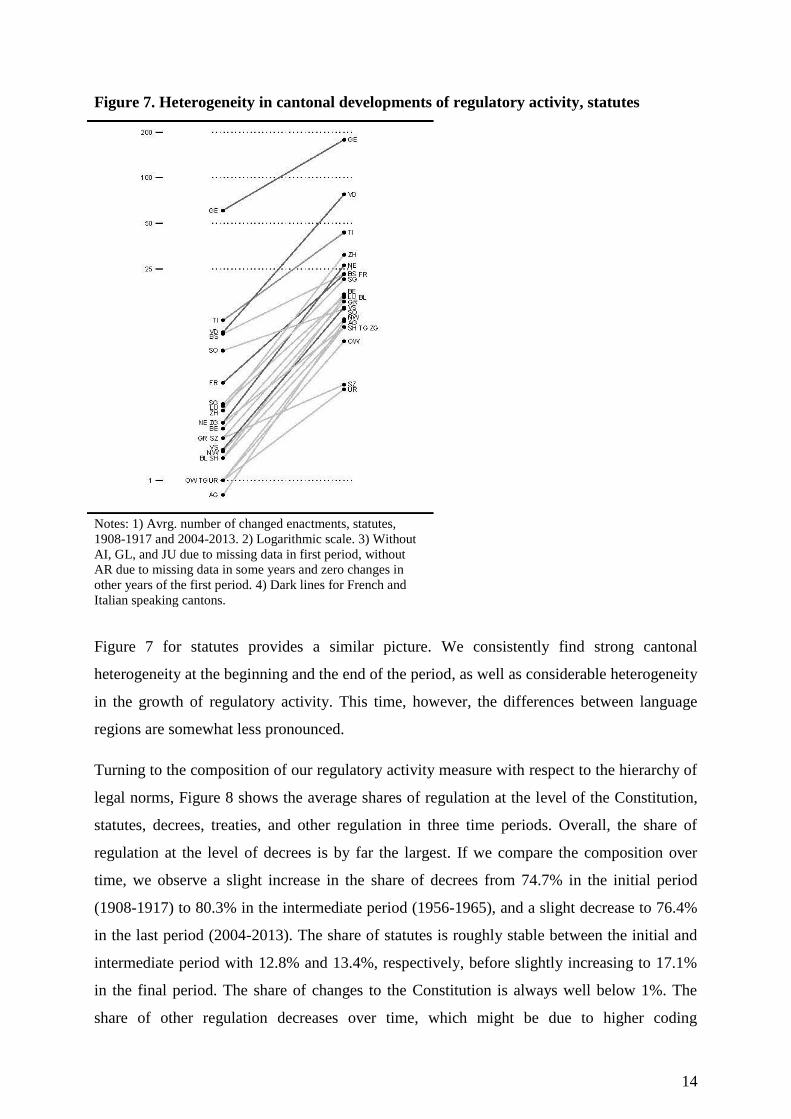
Figure 7. Heterogeneity in cantonal developments of regulatory activity, statutes
Notes: 1) Avrg. number of changed enactments, statutes,
1908-1917 and 2004-2013. 2) Logarithmic scale. 3) Without
AI, GL, and JU due to missing data in first period, without
AR due to missing data in some years and zero changes in
other years of the first period. 4) Dark lines for French and
Italian speaking cantons.
Figure 7 for statutes provides a similar picture. We consistently find strong cantonal
heterogeneity at the beginning and the end of the period, as well as considerable heterogeneity
in the growth of regulatory activity. This time, however, the differences between language
regions are somewhat less pronounced.
Turning to the composition of our regulatory activity measure with respect to the hierarchy of
legal norms, Figure 8 shows the average shares of regulation at the level of the Constitution,
statutes, decrees, treaties, and other regulation in three time periods. Overall, the share of
regulation at the level of decrees is by far the largest. If we compare the composition over
time, we observe a slight increase in the share of decrees from 74.7% in the initial period
(1908-1917) to 80.3% in the intermediate period (1956-1965), and a slight decrease to 76.4%
in the last period (2004-2013). The share of statutes is roughly stable between the initial and
intermediate period with 12.8% and 13.4%, respectively, before slightly increasing to 17.1%
in the final period. The share of changes to the Constitution is always well below 1%. The
share of other regulation decreases over time, which might be due to higher coding

15
uncertainties in the early years, where the categorization of some enactments was no longer
possible and had to be coded as “other”.
Figure 8. Regulatory activity by hierarchy of legal norms
Notes: 1) Percentage of ten-year averages of the number of changed enactments at the level of
Constitution, statutes, decrees, treaties, and other. 2) Unweighted average of all
available cantonal percentages of ten-year averages.
Figure 9 presents the composition with respect to the issuing authority, i.e., the legislature, the
executive, and other authorities. This last category includes third parties (such as courts and
special councils) and enactments where the legislature and the executive are jointly involved
(e.g., inter-jurisdictional treaties). In all three periods, the executive holds the highest share. In
the initial period, the share of the executive of 39.0% is close to the share of the legislature of
38.0%, and the remaining 22.9% of activity is from other authorities. In the intermediate
period, the share of the executive increases to 46.1%, the share of the legislature remains
roughly stable at 39.6% and, thus, the share of other authorities decreases. This could also be
due to the higher coding uncertainty in the early period. The last period shows a strong
decrease in the share of the legislature to 31.7%, while the share of the executive is roughly
unchanged at 48.0%. The category “other authorities” became increasingly important in later
years, rising to 20.3%. Interestingly, the two observations of the dominance of the executive
and the increase in the importance of “other authorities” (including inter-jurisdictional
treaties) at the expense of the legislature in recent years are consistent with the findings in the
research on the role of cantonal legislatures summarized in Vatter (2014).

16
Figure 9. Regulatory activity by authority
Notes: 1) Percentage of ten-year averages of the number of changed enactments by the
legislature, executive, and other authorities. 2) Unweighted average of all available
cantonal percentages of ten-year averages.
4. Illustration of federal data
In total, we coded 50,493 entries and 265,436 pages of regulatory activity for the period 1848-
2013 at the federal level. The core contains 31,072 enactments (61.5% of all entries) and
204,220 pages (76.9%). The share of the core relative to the total number of entries is
substantially lower for the federal level, compared to the cantonal level. The main reason is
that the federal level publishes content from a diverse range of sources. On the one hand,
cantonal regulations in the form of intercantonal treaties are published again at the federal
level, even though the source of regulation is the cantons and not the confederation. On the
other hand, abundant international regulation and appendices of international organizations
are published. We only take into account regulation by international treaties that are binding
on Switzerland. Entries without direct and generally binding legal implications were coded as
irrelevant. Even though important delimitations in the category of international law had to be
made, international treaties account for an important share of total regulation in the core:
36.0% of enactments and 33.0% of pages in the core are related to international treaties. This
is the second most important category behind decrees with a share of 55.8% (enactments) and
55.3% (pages). Statutes have a share of 6.1% of enactments and 8.7% of pages. The overall
involvement of the legislature is only slightly higher, at 6.2% (enactments) and 8.8% (pages).
In comparison, the share of the executive is with 55.4% (enactments) and 55.0% (pages)
much more pronounced.

17
Table 3. Summary statistics, federal level
Panel A. Stock, 2006-2013
Mean Std. dev. Min Max
Number of enactments
Constitution 1 0 1 1
Statutes 310 4 303 317
Decrees 1534 64 1453 1613
Intercantonal treaties 12 1 10 13
International treaties 2655 118 2475 2800
Other 44 21 33 94
Total 4556 156 4337 4787
Number of characters
Constitution 474,543 60,465 346,866 531,977
Statutes 12,836,735 890,394 11,449,542 14,042,896
Decrees 34,044,575 2,219,332 31,067,848 36,856,656
Intercantonal treaties 120,372 18,063 76,956 130,608
International treaties 66,456,192 4,850,169 58,842,812 72,306,544
Other 197,043 34,976 167,485 277,165
Total 114,129,459 7,979,229 102,061,189 124,032,429
Panel B. Activity, 1848-2013
Mean Std. dev. Min Max
Number of enactments
Constitution 0 0 0 3
Statutes 11 12 0 66
Decrees 102 154 1 527
Treaties 66 71 0 302
Other 4 5 0 29
Total 183 230 5 855
Number of pages
Constitution 1 7 0 56
Statutes 106 122 0 578
Decrees 666 1008 2 4431
Treaties 399 424 0 2207
Other 35 75 0 477
Total 1206 1513 28 6607
Notes: N = 8 in Panel A; N = 166 in Panel B.
Table 3 presents summary statistics for the stock and activity measures at the federal level.5
Panel A contains the stock measures for the period 2006-2013 and Panel B the activity
measures for the period 1848-2013. On average, the stock of federal regulations from 2006-
2013 is covered in 4556 enactments with a total of 114,129,459 characters (or roughly 28
times the number of characters in the Bible; see footnote 3). International treaties are the most
prevalent type of legal norm, with a share of around 58.2% (characters) to 58.3% 5 There is a slight inconsistency between our stock and activity measures at the federal level. While a small
number of intercantonal treaties (12 enactments) with some relevance for the federal level are included in the
stock measure, the activity measure for the federal level contains no changes to intercantonal treaties.

18
(enactments). Decrees are the second most important category, with 1534 enactments and
34,044,575 characters. The share of statutes in the stock of federal regulation accounts for
6.8% (enactments) and 11.3% (characters) of the total stock of regulation in the period 2006-
2013.
Over the entire period 1848-2013, the changes to the federal body of rules reached an annual
average of 183 enactments or 1206 pages. However, these averages mask large differences
across years, with a range of 5 to 855, in the case of enactments, and of 28 to 6607 pages.
Figure 10. Regulatory activity, federal level, 1848-2013
Notes: Number of changed enactments at the level of Constitution,
statutes, decrees, treaties, and other.
Figure 10 demonstrates that these differences are due to a tremendous increase in regulatory
activity in the early 1970s. The two major sources of this increase of regulatory activity are
changes to decrees and international treaties. While the average number of regulatory changes
amounted to roughly 101 (enactments) in the 1960s, this number increased to an average of
780 in the last 10 years of the sample period. However, a word of caution is due: The increase
starting in the 1970s is less pronounced with other delineations of the core (see Appendix).
5. Conclusion
We present novel data on more than a century of regulation in Switzerland. We measure the
stock of regulation by the annual number of enactments and characters, and regulatory
activity by the annual number of changed enactments and pages at the Swiss cantonal and

19
federal levels. The measures differentiate the hierarchy of legal norms and distinguish
between the issuing authorities.
The heterogeneity in the regulatory stock and activity across cantons is large, and regulatory
activity is generally increasing, though the increase is nonlinear and volatile. We find a strong
positive correlation between stock and activity. Cantons that tend to have larger stocks are
also the ones that tend to feature higher activity. Regulation is dominated by legal norms at
the level of decrees and norms issued by the executive. The French and Italian speaking
cantons tend to be more active and have larger regulatory stocks in comparison to their
German speaking counterparts.
This dataset provides the foundation to address a broad range of research questions. We are
interested in the determinants and the consequences of regulation. Regarding the
determinants, we intend to study institutional features (e.g., legislative referenda), political
factors (e.g., party compositions), and economic and demographic drivers. In addition, the
data allow us to shed light on interactions in regulatory activity between jurisdictions and
across categories of legal norms. Regarding the consequences, we are interested in the effects
on legal certainty, fiscal policy, economic development, and welfare.

20
References
Alesina, Alberto, Ignazio Angeloni, and Ludger Schuknecht (2005). What does the European
Union do? Public Choice 123(3): 275-319.
Botero, Juan C., Simeon Djankov, Rafael La Porta, Florencio Lopez-de-Silanes, and Andrei
Shleifer (2004). The regulation of labor. Quarterly Journal of Economics 119(4): 1339-
1382.
Braendle, Thomas and Alois Stutzer (2013). Political selection of public servants and
parliamentary oversight. Economics of Governance 14(1): 45-76.
Buomberger, Peter (2014). Auswege aus dem Regulierungsdickicht. Beunruhigende Fakten
und erfolgversprechende Lösungsansätze für die Schweiz. Diskussionspapier, Avenir
Suisse, Zürich.
Dal Bó, Ernesto and Martín A. Rossi (2011). Term length and the effort of politicians. Review
of Economic Studies 78(4): 1237-1263.
Dawson, John W. and John J. Seater (2013). Federal regulation and aggregate growth.
Journal of Economic Growth 18(2): 137-177.
Djankov, Simeon, Rafael La Porta, Florencio Lopez-de-Silanes, and Andrei Shleifer (2002).
The regulation of entry. Quarterly Journal of Economics 117(1): 1-37.
Linder, Wolf, Oliver Hümbelin, and Michael Sutter (2009). Die Entwicklung der
eidgenössischen Gesetzgebungstätigkeit 1983–2007: eine quantitative Analyse. Bern:
Institut für Politikwissenschaft.
Linder, Wolf, Oliver Hümbelin, and Michael Sutter (2011). Datenbank über die zwischen
1983 und 2007 gültigen, normativen Erlasse des schweizerischen Bundesrechts
[Datensatz]. Universität Bern. Distributed by FORS, Lausanne.
Linder, Wolf, Stefan Schwager, and Fabrizio Comandini (1985). Inflation législative? Une
recherche sur l’évolution du droit suisse 1948-82. Lausanne: IDHEAP.
Luechinger, Simon and Mark Schelker (2015a). Kantone regulieren unterschiedlich. Die
Volkswirtschaft 10/2015: 29-31.
Luechinger, Simon and Mark Schelker (2015b). Tous les cantons ne légifèrent pas au même
rythme. La Vie Economique 10/2015: 28-30.

21
Marti, Christian (2016). Voting and Legislation in Direct Democracies. PhD Dissertation,
EDIS 4479, University of St. Gallen, forthcoming.
Moser, Anton (1952). Haben wir eine Gesetzesinflation? Ein Versuch zur statistischen
Prüfung von Gesetzessammlungen. Schweizerische Zeitschrift für Volkswirtschaft und
Statistik 88(3): 250-261.
Mulligan, Casey and Andrei Shleifer (2005). The extent of the market and the supply of
regulation. Quarterly Journal of Economics 120(4): 1445-1473.
Vatter, Adrian (2014). Das politische System der Schweiz. Baden-Baden: Nomos.

22
Appendix
As discussed in Section 1, there are prior time series on regulatory activity for individual
cantons and the federal level in Switzerland. Data are publicly available for Berne 1894-1951
(Moser 1952), Vaud 1948-1982 (Linder et al. 1985), and for the federal level 1948-2007
(Linder et al. 1985, 2009). In this Appendix we briefly elaborate on how our data compare to
these data series.
Generally speaking, there are three main differences between the datasets.
1. Definition of the core. All datasets are mainly based on chronological law collections that
also contain information without regulatory implications. Therefore, all authors have to define
a core of generally binding rules. We delineate the core by excluding all types of enactments
that typically do not adhere to our definition of regulation explained in Section 2. Linder et al.
(1985, 2009) address this issue by analyzing the content of the enactments and by consulting
the few available systematic law collections. Moser’s (1952) definition is based on content
analysis and the issuing authority.
2. Treatment of repeals. Our interest lies in regulatory activity. Therefore, we only count
explicit repeals requiring a regulatory act and an official publication in the chronological law
collection or the official journal. In contrast, Linder et al. (1985, 2009) reconstruct the
evolution in the stock of regulation. Thus, they also record implicit repeals, i.e., repeals due to
(i) temporary limitations, (ii) loss of relevance of regulatory domain, and (iii) new enactments
with contradictory content (Linder et al. 1985: 71). Further, if one legal act repeals several
enactments at once (“Entrümpelungsgesetz”, “Bereinigungsgesetz”, “loi d’épuration”;
henceforth “omnibus repeals”) our approach counts such an omnibus repeal as one act, while
Linder et al. (1985, 2009) count the total number of repealed acts. The publication strategy
regarding multiple repeals might differ across cantons and time, which would introduce some
inconsistencies in our data.
3. Omnibus bills. Sometimes one regulatory decision – published as one new legal act – may
change multiple earlier enactments simultaneously (henceforth “omnibus bills”). Again, we
count such an omnibus bill as one enactment, while Linder et al. (1985, 2009) count all
changes separately.
In the following, we discuss how these issues affect the different time series.

23
Canton of Berne
Moser (1952) uses the same legal sources and similar coding rules as we do. Therefore, the
differences are minor (see Figure A1) and mainly due to the different definition of the core.
Figure A1. Data comparison Berne
Notes: Our data (—) and data from Moser (1952) (—).
Canton of Vaud
In addition to the chronological law collections, Linder et al. (1985) use systematic law
collections as complementary sources. Furthermore, as discussed above, their approach differs
with respect to the coding strategy and the definition of the core. When comparing our data to
those collected by Linder et al. (1985), two differences become apparent (see Figure A2).
First, we generally have a higher level of activity because our approach to delineate the core
leads to a slightly broader definition compared to the one by Linder et al. (1985) in the case of
Vaud. Second, the data of Linder et al. (1985) exhibit several visible peaks caused by
omnibus repeals. If we exclude all repeals (i.e., explicit, implicit, and omnibus repeals) from
their data series (see dashed line), we observe very similar patterns in our and their data.

24
Figure A2. Data comparison Vaud
Notes: Our data (—), data from Linder et al. (1985) (—), and data from
Linder et al. (1985) without repeals (---)
Federal level
Again, Linder et al. (1985, 2009) use additional sources (systematic law collections and a list
of repeals), a different coding strategy, and a different definition of the core. Large differences
between the datasets occur until the seventies. These are mostly due to a different delineation
of the core. Over the entire period, we generally count lower numbers of enactments. An
important factor is that we do not count implicit repeals and count omnibus repeals or
omnibus bills as one enactment.
In order to assess the relevance of other potential discrepancies, we adjust the two data series
for the differences in the core and the treatment of repeals as far as possible. Specifically, we
abandon our definition of the core and include all enactments, while we exclude all repeals in
the data series of Linder et al. (1985, 2009). Figure A3 shows that with these adjustments the
two data series are similar. Thus, other discrepancies play at most a minor role. A few larger
differences can still be observed though. An example is the divergence in the years 2006 and
2007, which results mostly from omnibus bills.

25
Figure A3. Data comparison federal level
Notes: Our data (—), data from Linder et al. (1985, 2009, 2011) (—)