Regulation and private sector investment in infrastructure...
43
Regulation and private sector investment in infrastructure: Evidence from Latin America by Sheoli Pargal* World Bank Policy Research Working Paper 3037, April 2003 The Policy Research Working Paper Series disseminates the findings of work in progress to encourage the exchange of ideas about development issues. An objective of the series is to get the findings out quickly, even if the presentations are less than fully polished. The papers carry the names of the authors and should be cited accordingly. The findings, interpretations, and conclusions expressed in this paper are entirely those of the authors. They do not necessarily represent the view of the World Bank, its Executive Directors, or the countries they represent. Policy Research Working Papers are available online at http://econ.worldbank.org. * The World Bank. Funding from the Regional Studies Program of the LAC Region of the World Bank is gratefully acknowledged, as is the invaluable guidance of Luis Serven. Thanks to Cesar Calderon and Luis Serven for disaggregated investment data and Luis Guasch for information on the characteristics of regulatory regimes. Thanks also to Phil Keefer, Michel Kerf, Arijit Sen, and Nils Tcheyan for helpful comments.
Transcript of Regulation and private sector investment in infrastructure...

Regulation and private sector investment in infrastructure:
Evidence from Latin America
by
Sheoli Pargal*
World Bank Policy Research Working Paper 3037, April 2003 The Policy Research Working Paper Series disseminates the findings of work in progress to encourage the exchange of ideas about development issues. An objective of the series is to get the findings out quickly, even if the presentations are less than fully polished. The papers carry the names of the authors and should be cited accordingly. The findings, interpretations, and conclusions expressed in this paper are entirely those of the authors. They do not necessarily represent the view of the World Bank, its Executive Directors, or the countries they represent. Policy Research Working Papers are available online at http://econ.worldbank.org. * The World Bank. Funding from the Regional Studies Program of the LAC Region of the World Bank is gratefully acknowledged, as is the invaluable guidance of Luis Serven. Thanks to Cesar Calderon and Luis Serven for disaggregated investment data and Luis Guasch for information on the characteristics of regulatory regimes. Thanks also to Phil Keefer, Michel Kerf, Arijit Sen, and Nils Tcheyan for helpful comments.

2
Abstract
This paper assesses the importance of the regulatory framework as a determinant of private sector investment in infrastructure, using recently compiled data on private and public sector investment in the water, power, telecommunications, railroads and roads sectors between 1980 and 1998 in nine large countries in Latin America. We find that the most significant institutional determinant of private investment volumes is the passage of legislation liberalizing the investment regime. This is important because it indicates that the legal basis for reform is probably more critical in determining the quality of the investment climate than specific aspects of the institutional framework governing private sector participation. In accordance with intuition, our results indicate that government action to increase regulatory certainty and minimize the perceived risk of expropriation through the establishment of independent regulatory bodies is a critical determinant of the volume of private investment flows. We also find that the general relationship of private to public investment is one of substitutability.
3
I. Introduction
This paper assesses the importance of the regulatory framework as a determinant of
private sector investment in infrastructure, using recently compiled data on private and public
sector investment in the water, power, telecommunications, roads and railways sectors in nine
large countries in Latin America. Controlling for standard determinants of investment, we
analyze the impact of variables that represent different aspects of the prevailing regulatory
regime on a country’s ability to attract private investment in infrastructure.
During the last decades of the twentieth century many countries in Latin America
undertook public sector reform and introduced private participation in formerly state-dominated
sections of their economies through management contracts, concessions or outright
privatizations. In the infrastructure sectors this was motivated by a desire to improve
performance and increase efficiency in service provision, as well as by the fact that governments
were constrained in increasing service coverage or improving public utility performance by
limited fiscal resources and a multitude of competing claims on these resources. But investment
in infrastructure is characterized by large up-front, usually sunk, costs that lead to a high risk of
expropriation, long gestation lags before revenues are generated and revenues that are usually
generated in local currency. These aspects lead to a need for both long-term commitment and
long-term financing in local currencies. However, the limited depth of nascent capital markets is
rarely able to generate funding of the maturity and volume that were necessary to finance private
infrastructure investment in Latin America, which resulted in an effort to attract foreign capital.
Analysts agree that an environment of macroeconomic and political stability, policy
credibility, and the existence of a sound regulatory framework are necessary for lowering the
perceived risk of expropriation and thus for attracting private capital. In particular, the character

4
of the entities entrusted with regulation determines confidence in the integrity of the system as a
whole (see, e.g., Kerf et al 1998). In this paper, we relate the amount of private investment
attracted in each infrastructure sector in the countries studied to a set of independent variables
that includes the characteristics of regulatory entities. This is a first attempt to test the assertion
that the lack of independent regulation can be a major hindrance to attracting private sector
investment in infrastructure in developing countries.
The study is of particular relevance for reforming countries since the LAC region is,
among the regions in the world, furthest along the road to deregulation of basic infrastructure
services. It faces second-generation issues of appropriate regulation that others have yet to
encounter. By characterizing regimes in terms of their ability to attract private investment in
infrastructure, the analysis provides an empirical foundation for policy choices related to
institutional structure and regulatory frameworks. In accordance with intuition, our results
indicate that government action to increase regulatory certainty and minimize the perceived risk
of expropriation through the establishment of independent regulatory bodies is a critical
determinant of the volume of private investment flows.
This paper is organized as follows. Section II provides background on the broad
experience of the countries being studied and the approach taken here towards assessing the
quality of the regulatory environment. Section III discusses the data. Section IV and V describe
the estimation strategy and empirical findings of the analysis.
II. Private investment in infrastructure in Latin America
Our study covers Argentina, Brazil, Bolivia, Chile, Colombia, Ecuador, Mexico, Peru and
Venezuela between roughly 1980 and 1998. Average annual public and private investment
5
levels by sector and country before and after the passage of legislation permitting private entry
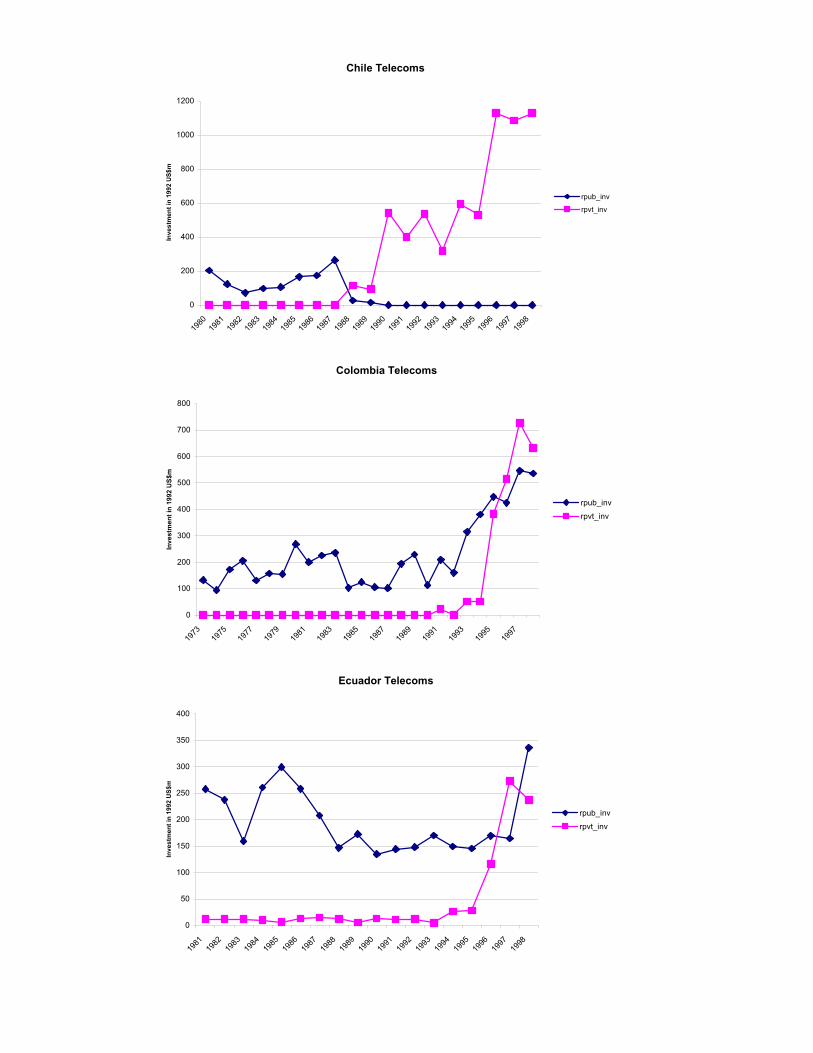
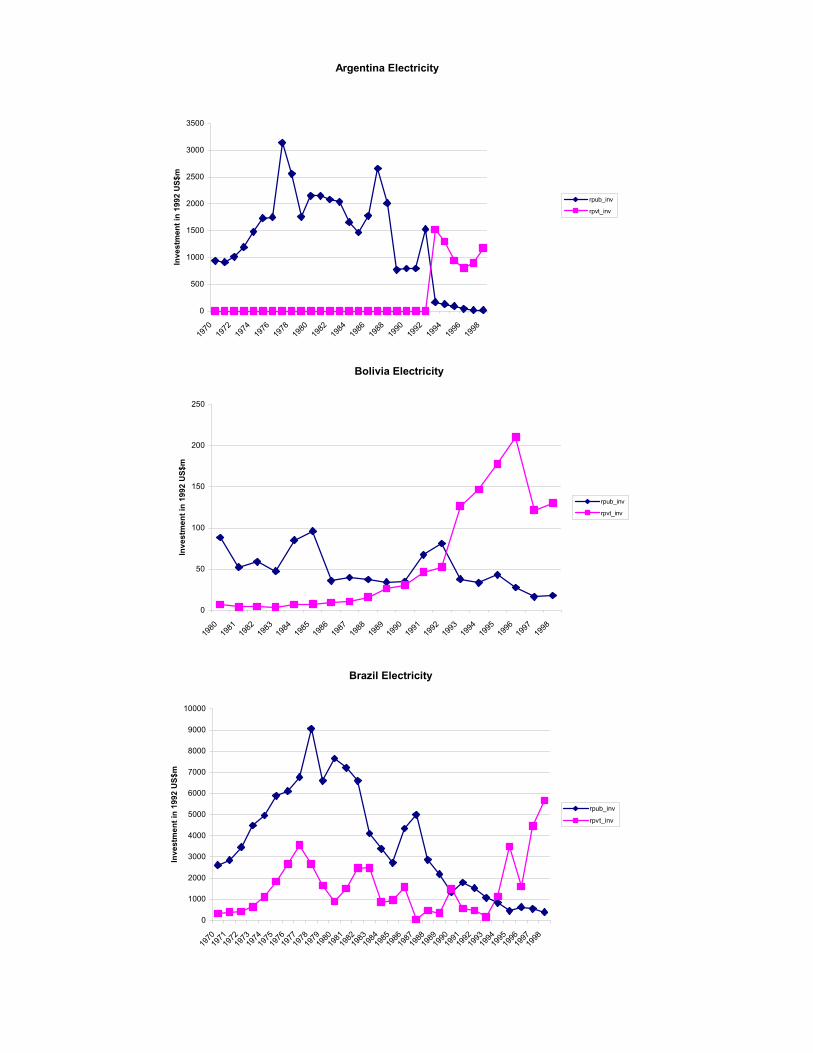
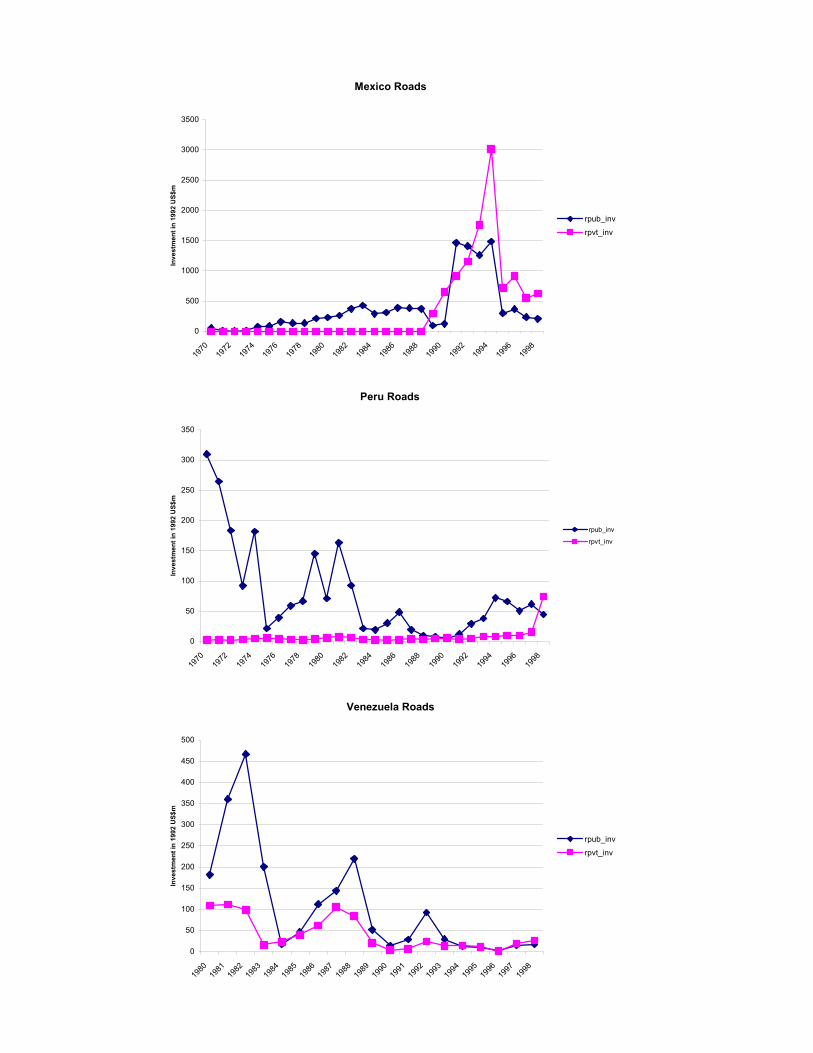
are shown in appendix I (Table 5a). Appendix II displays the evolution of private and public
investment by sector and country over the period studied.
Telecommunications, power, and roads are the sectors for which almost all the countries
in our sample had passed liberalizing legislation by the mid 1990s. There is wide variation in the
year in which legislation was passed in these countries, with Chile and Argentina being the
earliest movers -- the first infrastructure regulatory agency in Chile (Subtel) was established in
1977. Liberalization (through the introduction of competition and private sector participation)
has also been deepest and most wide-ranging in Chile and Argentina. For example, these are the
only countries to have enacted legislation opening the water sector to private investment.
Interestingly, the passage of legislation permitting private entry was not always a pre-condition
for private sector investment in different sectors. In Bolivia, for instance, three railway
concessions were granted in 1996 while the relevant legislation was enacted only in 1998.
However, in general, the enactment of legislation formalizes the liberalization of the sector and
provides greater security about the irreversibility of the process of opening up.
The striking increase in average annual investment in telecommunications and electricity,
as well as the large jump in the share of private sector investment in these sectors and in the
roads sector after liberalization are illustrated in Figures 1 through 6. In telecommunications and
power the average annual share of public spending in total investment spending declined to
significantly less than 50% almost across the board after liberalization. Prior to the opening of
the sector, in fact, private investment in telecommunications was negligible or actually zero.
Following liberalization, private investment increased and public investment declined, so that by
1998 private investment exceeded public spending in the sector in almost all the countries

6
studied. Most countries in the sample granted initial exclusivity periods to privatized
telecommunications firms or set limits on entry into the sector.1 In general, the liberalization of
access and tariffs came later. Similarly, between 1980 and 1998, public investment in the power
sector generally declined while private investment increased, ultimately exceeding public
spending. Liberalization in the power sector was usually accompanied by the restructuring of
vertically integrated utilities.
While legislation permitting private entry into the roads sector had been approved in five
of the nine countries by 1993, the role of the state continued to be substantial even after that.
With the striking exception of Mexico, which launched an ambitious toll-road program in the
late 1980s, annual public investment in roads in most Latin American countries remained much
higher than private investment. Private investment in roads increased slowly – the share of the
private sector in total investment after liberalization typically remained below 50%.
Public investment in the water sector also greatly exceeded private investment in Latin
America throughout the period, reflecting the limited liberalization of the sector. This was true
even in Chile. However, largely driven by the concession contract for Buenos Aires, private
investment in water in Argentina grew to exceed public spending during the 1990s.
Interestingly, private investment in Bolivia’s water sector also rose to substantially exceed public
spending, particularly after 1991 – despite in the absence of the passage of enabling legislation.
A possible explanation for the difference in the average share of private investment in
roads and water as compared to power and telecommunications may lie in the natural monopoly
elements of the roads and water sectors. The low traffic density of rural and secondary road
networks means that they are less amenable to cost covering tariffs and thus less attractive to
1 Colombia and Ecuador did not privatize. However, Colombia allowed “controlled competition” in long distance and free entry in fixed line local service.

7
private concessions. So there is likely to always be a need for public spending on roads. A
similar argument relating to the cost of provision and scale economies has been applied to rural
water systems. In addition it is often politically difficult to “auction off” the responsibility to
ensure road access or the responsibility for basic water service to the private sector because of
the perception that these are core infrastructure services that it is the state’s obligation to provide.
Finally, water and power are the sectors in which the need for tariff adjustment is usually most
pressing. This makes the political economy of private entry especially relevant in these sectors.
Particularly in the case of water, where the general public (and not a small group) is often
affected, anecdotal evidence points to the political difficulty of raising tariffs to cover costs. In
fact, such tariff increases led to the failure of several concession contracts in the late 1990s.
III. Analytical approach
While there is a large empirical literature on the determinants of investment, including
investment in infrastructure, this literature has mainly focused on testing traditional economic
theories of investment behavior (see Everhart and Sumlinksi (2001) for a recent overview) rather
than on assessing the contribution of the regulatory framework to the environment for
investment. Recent empirical work has, however, demonstrated the critical role of the
institutional environment in determining the magnitude of investment flows. For instance, the
option approach to investment reviewed by Serven (1996b) underlines the deterrent effect of
uncertainty on private investment, especially when investment is sunk. Investor perceptions
about the probability of reform reversal are often a key determinant of their willingness to invest.
The general lesson from this analytical and empirical literature is that, by affecting investor
confidence, the stability and predictability of the incentive framework may be even more
8
important than the level of investment incentives in determining the volume of private
investment.
Recent econometric work by Scott Wallsten (2001a, 2002) on telecommunications
reform in developing countries is very relevant to the analysis described in this paper. Wallsten
(2001a) finds that country level telecommunications performance is positively related to
regulation, as measured by a dummy indicating whether the country had established a separate
telecommunications agency not directly under the control of a ministry. That study uses a fixed
effects approach to explore the impact of privatization, competition and regulation on
telecommunications performance in Africa and Latin America between 1984 and 1997.
Wallsten (2002) shows that countries that established separate regulatory authorities prior to
privatization saw increased telecommunications investment compared to countries that did not,
and, also, that investors are willing to pay more for telecommunications firms in such countries.
These findings are consistent with the hypothesis that investors require a risk premium to invest
where regulatory rules remain unclear. Our analysis contributes to this literature on the role of
regulation in private sector development. We use detailed data on measures of regulatory
independence in addition to sectoral data on both private and public investment across the major
economies of Latin America. This allows us to more thoroughly investigate the importance of
independent regulatory institutions for the climate for private investment.
The effectiveness of regulatory institutions depends on the structure and process of
regulation, key aspects of which are the independence, competence and clarity of mandate of the
regulatory agency, the transparency and openness of the regulatory process and the existence of
formal oversight and timely judicial review.2 Smith (1997a, b) discussing the “desirable”
attributes of utility regulators considers independence from the regulated firm, customers and 2 See Noll (2000) for an exposition.

9
political authorities as being essential. He underlines the important trade-off between the need to
limit regulatory discretion (as, for example, through regulation by contract) in order to reduce the
risk of expropriation and the need to retain the flexibility to respond to new environmental and
market conditions (for example, in rapidly changing sectors like telecoms). The openness and
transparency of the regulatory process lessen the probability of capture by different interest
groups. An important additional consideration is the country’s stability and reputation for
respecting private property rights -- which can go a fair way in assuaging investor concerns, and
would allow the regulator to retain substantial discretion without significantly increasing the cost
of capital. But the ultimate accountability of the regulator is critical.
In this paper we have described the regulatory environment in the countries and periods
under study in terms of the following aspects:
o The passage of legislation that permits private investment in sectors traditionally reserved
for the public sector. The passage of enabling legislation is particularly important
because Latin American regulatory frameworks are rooted in civil law.
o The existence of a regulatory body.
o Whether the regulator is autonomous or not. Autonomy or independence is captured by
the regulator’s attributes – whether the regulatory body is housed outside the government;
whether the regulator has a separate source of funding (i.e., independent of the vagaries
of annual budgetary appropriations); and, the degree of popular support for the regulator,
measured by whether both the legislature and the executive branch are involved in
appointing the regulatory body. Lacking data, we were unable to assess the importance
of aspects of independence such as security and nature and length of tenure of regulators
(e.g., staggered terms that are not coincident with the electoral cycle), etc.
10
o The size of the regulatory agency. A larger body would limit the probability of capture
by different interest groups (as well as the government). Whether or not the prospect of
being able to capture the agency would make a smaller agency more attractive to private
investors is an empirical question. A larger size would allow for a range of professional
expertise and diversity of opinion (see, e.g., Smith 1997a, b, c), both critical to the
competence of the agency. On the other hand, commentators have argued that a smaller
agency could be more efficient in decision making and more predictable and that
individual regulators might be more accountable than those in large commissions – which
would all make a smaller agency more attractive from the investor point of view. Thus,
the direction of the relationship between the size of the regulatory body and private
investment would depend on the net effect of these factors.
o The degree of risk borne by the investor as measured by whether the tariff regime is rate
of return or price-cap. Rate- of-return tariff regulation limits the risk taken by the
investor vis a vis a price-cap regime and might hence be positively related to private
investment in infrastructure. Also, Alexander and Irwin (1996) present evidence that
price-cap regulation, by subjecting firms to greater risk, increases the cost of capital.
IV. Data
Data sources are described in Table 1. Macroeconomic data are taken from the World
Bank’s World Development Indicators database and the IMF’s International Financial Statistics.
Investment data by sector were obtained from official publications and directly from the
governments of the countries studied. (Further details are provided in Calderon and Easterly
(2001)). Data on regulatory variables were obtained from Guasch (2001).

11
As a control variable, we use a physical measure of the infrastructure capital stock each
year by sector. This consists of the following: for roads, total road length and paved road length;
for railroads, total length of the rail network; for telecommunications, the number of telephone
mainlines; for energy, the electric generating capacity in kilowatts, and, for water, the growth in
the percentage of the population with access to clean water. Pritchett (2000) has pointed out that
standard expenditure-based units of capital, particularly public capital, are often inaccurate in
what they measure. Especially when it comes to the public sector and in countries where the
government is a large investor, the divergence between investment effort and public sector
capital stock is very high.3 This renders suspect analyses that equate public spending on
infrastructure to the value of infrastructure capital. With that caveat in mind, we have chosen to
use physical measures of capital stock as controls, even though they are not comparable across
sectors.
The regressions include a dummy that is 1 in years following the passage of legislation
permitting private investment in utilities (since these sectors were often considered the
prerogative of the state). Even though private entry had commenced prior to the passage of
relevant legislation or the setting-up of formal legal and judicial frameworks for private
participation in some countries, we use the passage of legislation (rather than the earliest private
entry into the sector in each country) as our measure of liberalization since there is greater
certainty implied by the existence of a formal legal basis for private investment.
Summary descriptive statistics for the entire dataset and for the set of variables measuring
regulatory structure are included in Appendix I, Tables 1a and 2a. Since, for the most part,
3 “(T)he potential contribution to current and future production of a capital stock is not the same as what happened to have been spent on it, especially when governments are the investors.” Pritchett (2000), pp xx.

12
liberalization and the development of regulatory frameworks started only in the 1990s, there are
substantially fewer observations on the regulatory variables.
Table 1. Data sources
Variable Data source
Real GDP WB World Development Indicators Investment deflator WB World Development Indicators GDP deflator WB World Development Indicators Interest rate IMF IFS Real public investment Calderon and Easterly, 2001 Real private investment Calderon and Easterly, 2001 Regulatory variables Guasch, 2001 Physical capital stock Calderon and Easterly, 2001
Appendix I, Table 3a is the correlation matrix for the complete dataset and indicates how
different determinants of private investment flows in infrastructure hang together. Public and
private investment are significantly negatively correlated, supporting the idea that they are
overall substitutes. Private investment is also significantly positively correlated with the dummy
for the passage of reform legislation and with the existence of a regulatory body. The passage of
reform legislation and the existence of a regulatory body are highly positively correlated but not
perfectly so – reform legislation had been passed in only 40% of sector-country combinations
prior to the establishment of a regulatory authority. Appendix I, Table 4a is the correlation
matrix for the set of variables measuring aspects of the regulatory regime. The correlation
between private investment levels and the passage of legislation opening the sector to private
investment is significantly more positive in this subset of the data.
13
V. Estimation
This paper examines two basic models in which fixed effects regressions are used to
explore the relationship between different groups of independent variables and private
infrastructure investment. In all models the dependent variable is the log of real private sector
investment by country, year, and infrastructure sub-sector.
The first model examines the determinants of private infrastructure investment using (1) a
dummy for whether or not a regulatory body existed that year, and (2) a dummy for whether
enabling legislation had been passed by that year, as the only indicators of the regulatory
environment. This model is also estimated for the four major sectors separately –
telecommunications, roads, electricity and water – in an effort to capture sector specific
idiosyncrasies. The second model is estimated for the years during which a regulatory body
exists. This permits the inclusion of characteristics of the regulatory regime as explanatory
variables in the analysis and provides an opportunity to assess the impact of the type of
regulatory regime on private investment flows to infrastructure.
The reduced form equation being estimated, for each country i, sector j, and year t is:
Ipijt= f (Igijt, GDPit-1, rijt, pijt, Kijt-1, Rij , Dijt ),
where,
Ipijt= Private sector investment Igijt= Public sector investment GDPit-1 = Gross domestic product lagged rijt = Real rate of interest pijt = Price of investment goods Kijt-1 = Previous period physical capital stock in the sector Rij = Regulatory regime Dijt = Dummy for whether or not a reform law has been passed

14
We are agnostic about whether public sector investment is complementary to or a
substitute for private investment in the sector, noting the lack of consensus on this issue in the
literature. Lagged capital stock would be expected to be negatively related to investment based
on standard accelerator theories as well as marginal productivity and cost of capital arguments.
The sign on lagged GDP is expected to be positive since higher income should lead to greater
capacity to invest. The real rate of interest is included to capture the impact of the cost of
financing on investment decisions, and a measure of overall investment goods prices4 is included
to account for the actual cost of investment. Both these “price” variables reflect the opportunity
cost of capital and are expected to have a negative relationship with the amount of private
investment attracted to a particular sector.
The existence of a regulatory body and the passage of reform legislation would both be
expected to be positively related to the volume of private investment flows since both represent
government commitment to constraints on its own power. This results in less scope for
discretionary/arbitrary action (e.g., against investor interests) and thus would imply a more
certain business environment. The notion that investors require a risk premium to invest where
regulatory rules remain unclear is supported by Wallsten (2002), who finds higher investor
willingness to pay for telecommunications firms in countries that have established regulatory
authorities.
In the second set of regressions the dummy for the passage of reform legislation is
augmented by the following regulatory indicators: whether regulatory decisions involve
ministerial input or the regulatory body is part of a ministry; whether the appointment of
regulators involves both the legislature and the executive or only the executive; the size of the
regulatory body; whether the regulatory body is funded solely by the government; and, whether 4 Investment price is calculated as the ratio of the investment deflator to the GDP deflator.
15
the tariff regime is rate of return or not. Most of these variables capture the degree of autonomy
of the regulator from the executive branch and the susceptibility of the regulatory regime to
government control or subversion by capture (e.g., by regulated entities).
Regulators who are appointed by the executive branch of the government and those that
are entirely dependent on the government for funding are unlikely to be independent. Low
autonomy, as indicated by these two variables, is expected to be negatively related to investor
confidence and private investment flows.
One would expect that the regulatory body being housed in a ministry or ministerial
involvement in decision-making would be negatively related to private sector confidence since
an arms-length relationship between the regulator and the government is generally desired. On
the other hand, a ministerial stamp can be an important signal of commitment for private
investors, which would imply a positive relationship with private investors.
The expected sign on the coefficient of agency size is ambiguous: To the extent that a
larger agency is likely to be more balanced and competent -- and less likely to be captured -- a
positive relationship between the size of the regulatory body and private investment might be
expected. However, ease of capture might be attractive in some governance contexts.
VI. Empirical findings
This exploration of the determinants of private infrastructure investment over time uses
the log of annual private sector investment (in millions of 1992 US$) in each sector and country
(e.g., telecommunications in Argentina in 1995) as the dependent variable. Economy-wide
control variables are: the log of public investment in the sector and country each year, real GDP
lagged one year, one period lagged physical capital stock in the sector in the country, the real
16
price of investment goods, the real rate of interest, whether or not a law permitting private entry
has been passed, and whether or not a regulatory body for the sector exists in the country. We
include a time trend and sector dummies (omitted sectors are railways and gas) and pool the data
over all years, sectors and countries covered. The estimation accounts for the panel structure of
the data by using country fixed effects.
We report results of regressions in which both the investment price and the real rate of
interest are included although including the real rate of interest leads to the loss of some 200
observations. This is because comparable real interest rate data was not available for some
countries during the earliest years covered in this analysis.5
Determinants of private sector investment
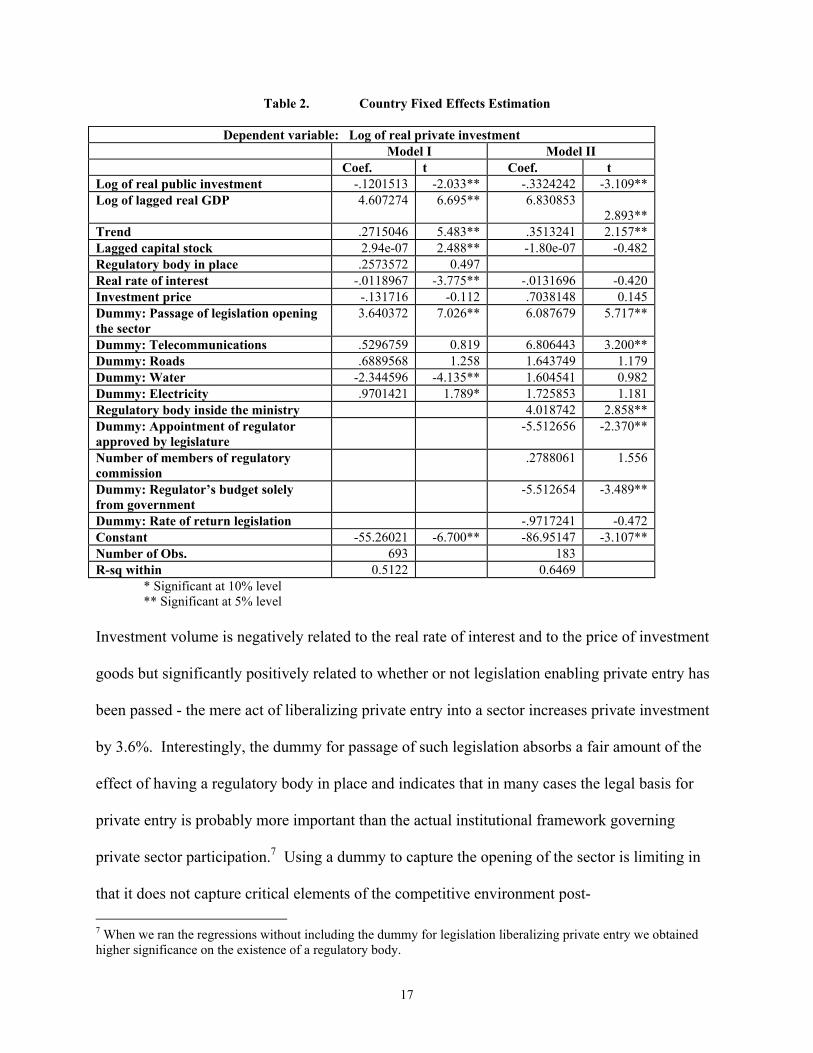
The results of the primary regressions are presented in Models I-II in Table 2. Model I is
largely consistent with intuition. The overall relationship of private investment and public
investment is one of substitutability. As might be expected, private investment is positively
related to past period real GDP, indicating that richer economies generate higher private
investment flows. A 1% increase in previous period real GDP is associated with an increase of
4.6% in private investment levels. We use lagged real GDP as the explanatory variable to reflect
the potential causal relationship between GDP and private investment.6
5 Dropping the real rate of interest from the regressions and using only the investment price led to higher significance of the latter and no changes of note in the signs or significance of the coefficient estimates on the other variables. 6 Since the dependent variable is private investment in different infrastructure sub-sectors, and not total investment in the economy, the issue of reverse causality from investment to income or GDP is less likely to be a problem. We expect the effect on GDP of private investment to be very attenuated and, given that infrastructure investment has long gestation lags, to act only over time.
17
Table 2. Country Fixed Effects Estimation
Dependent variable: Log of real private investment Model I Model II
Coef. t Coef. t Log of real public investment -.1201513 -2.033** -.3324242 -3.109** Log of lagged real GDP 4.607274 6.695** 6.830853
2.893** Trend .2715046 5.483** .3513241 2.157** Lagged capital stock 2.94e-07 2.488** -1.80e-07 -0.482 Regulatory body in place .2573572 0.497 Real rate of interest -.0118967 -3.775** -.0131696 -0.420 Investment price -.131716 -0.112 .7038148 0.145 Dummy: Passage of legislation opening the sector
3.640372 7.026** 6.087679 5.717**
Dummy: Telecommunications .5296759 0.819 6.806443 3.200** Dummy: Roads .6889568 1.258 1.643749 1.179 Dummy: Water -2.344596 -4.135** 1.604541 0.982 Dummy: Electricity .9701421 1.789* 1.725853 1.181 Regulatory body inside the ministry 4.018742 2.858** Dummy: Appointment of regulator approved by legislature
-5.512656 -2.370**
Number of members of regulatory commission
.2788061 1.556
Dummy: Regulator’s budget solely from government
-5.512654 -3.489**
Dummy: Rate of return legislation -.9717241 -0.472 Constant -55.26021 -6.700** -86.95147 -3.107** Number of Obs. 693 183 R-sq within 0.5122 0.6469
* Significant at 10% level ** Significant at 5% level
Investment volume is negatively related to the real rate of interest and to the price of investment
goods but significantly positively related to whether or not legislation enabling private entry has
been passed - the mere act of liberalizing private entry into a sector increases private investment
by 3.6%. Interestingly, the dummy for passage of such legislation absorbs a fair amount of the
effect of having a regulatory body in place and indicates that in many cases the legal basis for
private entry is probably more important than the actual institutional framework governing
private sector participation.7 Using a dummy to capture the opening of the sector is limiting in
that it does not capture critical elements of the competitive environment post- 7 When we ran the regressions without including the dummy for legislation liberalizing private entry we obtained higher significance on the existence of a regulatory body.

18
opening/privatization which would affect incentives to invest. Whether a firm facing
competition is likely to invest more or less than a monopoly is an empirical question. In several
cases Latin American state-owned infrastructure firms were privatized as monopolies or granted
“exclusivity periods” of varying lengths, as in the telecommunications sector. As shown by
Wallsten (2001b) in his study of telecommunications privatization in developing countries,
granting a monopoly concession seriously reduces investment by the privatized firm relative to
firms that face competition. Unfortunately such data were not available for most of the sectors
and countries studied.8
The estimation includes previous period capital stock since the coefficient on it is highly
significant, although it is a physical measure that varies by sector and is not easy to interpret.
The coefficient on capital stock is positive, which is contrary to what theory would suggest.
However, this appears to be an artifact of aggregation since it is uniformly negative in the
regressions disaggregated by sector.9 Finally, the primary regressions show that after controlling
for other factors, the water sector received significantly less private investment than the other
sectors, while private investment in power was relatively higher than in the other sectors.
Characteristics of the regulatory system
Given that a regulatory body exists, what aspects of the regulatory structure are critical to
attracting private investment in infrastructure? Model II in Table 2 presents the results of a fixed
effects regression restricted to the years after a regulatory body had been established. The
8 In a study of Latin American countries, Martin et al (2001) show that infrastructure privatization has an impact on GDP per capita, with the effect both, being dependent on whether privatization occurs in the transport or the utilities sectors and varying by the form of privatization: whether it is through greenfield investment, divestitures or concessions. Since our investment data are not disaggregated by the form of private participation we have used the date of the passage of legislation opening up the sector in the analysis. 9 Dropping this variable made no difference to the sign or significance of other variables.

19
passage of legislation opening the sector is still a significant and positive determinant of the
volume of private investment flows, and public investment volumes are clearly being substituted
for by private investment. While the sign and significance of the other economy-wide variables
are unchanged, the real rate of interest and investment price index are no longer significantly
different from zero. Also, after controlling for regulatory factors, the telecommunications sector
appears to attract significantly more private investment than the others.
In terms of the regulatory variables, some results warrant deeper analysis. For instance,
private investment volumes are significantly positively related to the regulatory body being
located inside a ministry or with ministerial involvement in regulatory decision-making.10 In
addition, systems in which regulators are appointed by the executive are associated with greater
private investment than those in which the selection of the regulator involves both the legislature
and executive. On the face of it, both these aspects of the regulatory structure should militate
against private investor interest since they imply lower constraints on the government’s power to
expropriate the value of an investment. However, on more reflection, these results may
underline the critical need of investors for regulatory predictability and credibility. For instance,
investors are likely to expect that decisions taken by a regulator housed in a ministry will not be
overturned. In addition, a regulatory body appointed by the executive may be considered
stronger by virtue of having the full power of the executive branch behind it, and be perceived to
speak with a clearer voice than a regulatory body whose appointees have to go through approval
by the legislature. A natural question is whether these considerations are specific to Latin
10 Smith (1997a) notes that a dedicated regulatory unit set up within a ministry is often a first step in the transition from the traditional model of ministerial regulation to a fully autonomous agency. Such a unit coordinates regulatory activity and fosters the development of the necessary technical skills and professional norms, often contracting outside professionals for technical tasks. Alternatively, as in some agencies in Colombia, ministerial participation in the regulatory agency is observed, although the agency has most of the attributes of an independent entity.

20
America. They may result from the historical existence of generally strong executive branches
on the continent, which would mean that such arrangements increase investor certainty about
government intentions and would, thus, result in higher private investment than otherwise.
Consistent with intuition, , private investment is positively associated with the regulator
not being funded solely by the government. This is an important element of regulatory
independence. In addition, the number of commissioners or regulators is positively related to
investment volumes (significant at 12%) reflecting the possibly greater independence, broader
expertise, and lower likelihood of capture of a larger commission.11 Although not significant,
investment volumes are negatively related to rate-of-return tariff regulation which limits both
downside and upside risk and also caps possible returns to investment. Alternative tariff
regulatory mechanisms such as price caps would provide the opportunity to earn higher than the
fixed rate of return, which would compensate for the higher risk of investment in sectors like
infrastructure.
Sector specific results
Table 3 presents the results of the base regression for the telecommunications, roads,
electricity and water sectors separately. Multicollinearity among the indicators of regulatory
structure and lack of variation of these variables over time within each country led to the
decision not to run sector specific models with regulatory variables included.
Public and private investment in telecommunications and power are strong substitutes. A
somewhat weaker but still substitutable relationship is observed in the water sector. In roads the
relationship is complementary but not significant. A complementary relationship between public
11 As noted earlier, ease of capture could go either way in attracting investor interest. It is likely, however, that the true relationship between the size of the regulatory body and private investment is non-linear – reflecting the trade-offs in terms of speed of decision-making vs. risk of capture between small and large regulatory bodies.

21
and private investment in the roads sector would indeed be expected because of the difficulty of
obtaining private financing for non-primary highways.12 In all cases higher lagged GDP is
associated with higher private investment volumes, and, in contrast to the findings of Models I
and II, lagged capital stock is negative and significant in all the sectoral regressions apart from
the one for water.
Table 3. Fixed Effects regressions by sector
ln_pvt Telecoms Roads Power Water
Coef. t Coef. t Coef. t Coef. t Log of real public investment
-0.2942 -3.189** 0.1825 0.409 -0.7662 -2.500** -1.0194 -1.55
Log of lagged real GDP
5.8493 4.356** 5.7597 4.312** 4.0419 3.435** 6.4141 4.003**
Trend 0.4144 3.608** 0.3525 3.278** 0.5119 4.703** 0.3059 2.852** Lagged capital stock 0.0000 -2.168** 0.0000 -4.703** -0.0004 -4.101** 0.0018 0.000 Regulatory body in place
-1.0046 -1.077 -0.6995 -0.692 0.1993 0.202 0.3486 0.292
Investment price 1.3759 0.628 4.2064 1.815* 1.6965 0.783 1.7566 0.798 Real rate of interest -0.0058 -0.967 -0.0059 -1.007 -0.0092 -1.620 -0.0205 -3.493** Dummy: Legislation opening the sector
5.2836 5.6** 5.4172 5.148** 1.8347 1.780* 1.8979 1.476
Constant -67.5412 -4.189** -66.2719 -4.447** -41.5051 -2.912** -76.1823 -3.974** Number of Obs. 159 142 159 109 R-sq within 0.7068 0.6322 0.5499 0.5274 * Significant at 10% level ** Significant at 5% level
The passage of legislation opening the sector to private entry is significantly positively
related to private investment volumes in telecommunications and roads but less significant in the
power sector and virtually not at all in the water sector. The result on power is somewhat
surprising since liberalization of telecommunications and power has been deeper and wider than
of the other sectors, with a decline in the importance of government investment going hand-in-
hand with the increase in private participation. This may reflect the fundamentally competitive
12 Consistent with our findings on roads, Dailami and Leipziger (1998)’s analysis of credit risk premiums in foreign currency private loans to greenfield infrastructure projects in developing countries finds that road projects commanded the highest risk premium in 1994-96.

22
nature of power generation, which may make the formal liberalization of entry less important
than in other less contestable sectors. As in the regression on pooled data (Model I), the
existence of a regulatory body is not a significant determinant of private investment in any sector
after controlling for the passage of enabling legislation.
This leads to the question of whether the water sector perhaps differs in some crucial
respect from other infrastructure sectors. As mentioned earlier, the natural monopoly aspects of
water distribution and transmission are stronger than in other utilities. Also, opening up the
water sector to private investment, which may require an increase in tariffs to cover costs,
generally tends to be politically more difficult than liberalization in “non-essential” sectors.13
Investors may thus expect higher scrutiny for water sector investments. In view of the risks
deriving from both the political sensitivities of privatizing water service provision and the huge
sunk costs of investment in the sector, investors are likely to be less willing to invest in water
simply because the necessary legislation permitting private entry into the sector has been passed.
They may look for a better developed regulatory framework and more detailed investor
protections before committing funds to the sector. Finally, it is worth noting that private entry
into the water sector has usually taken place through the award of large concession contracts –
which may not be linked to the passage of legislation. All these factors would lead to the
observed lack of correlation between private investment and the passage of legislation permitting
private entry.
13 Perhaps in view of the perceived higher political risk of investments in water, the number of large private international operators is lower than in the other sectors.
23
VII. Conclusions
This paper has presented findings on institutional factors that affect the investment
climate for infrastructure using recent data from the nine largest Latin American countries. We
find that the most significant determinant of private investment volumes overall (after lagged
GDP) is the passage of legislation liberalizing the investment regime. This is important because
it indicates that the legal basis for reform is probably more critical in determining the quality of
the investment climate than specific aspects of the institutional framework governing private
sector participation. We also find that the general relationship of private to public investment is
one of substitutability.
The results on regulatory structure underline investors’ need for stability and
predictability and reflect the historical existence of strong executive branches in most Latin
American countries. A particularly intuitive result is that private investment is positively
associated with the independence and credibility of the regulator, particularly its ability to
commit.
Over the period analyzed, controlling for other factors, the water sector received
significantly less private investment than other sectors while private investment in power was
relatively higher than in the other sectors. The sectoral analysis indicates that the water sector
differs materially from the other three sectors: private investment in water is not significantly
affected by the passage of reform legislation in the sector and public expenditure is very
important and only mildly substitutable for private spending. Political economy considerations
appear to make private investors more wary of entering the water sector than the roads, power
and telecoms sectors.

24
References
Alexander, Ian and Timothy Irwin. 1996. “Price Caps, Rate-of-Return Regulation, and the Cost of Capital.” Viewpoint 87. The World Bank, Washington DC. Aschauer, David A. 1989. “Does Public Capital Crowd out Private Capital?” Journal of Monetary Economics 24:171-188. Calderon, Cesar and William Easterly. 2001. “How did Latin America’s Infrastructure fare in the Era of Macroeconomic Crises?” Mimeo. The World Bank, Washington DC. Canning, David. 1999. “The Contribution of Infrastructure to Aggregate Output”. Policy Research Working Paper 2246. The World Bank, Washington DC. Dailami, Mansoor and Danny Leipziger. 1998. “Infrastructure Project Finance and Capital Flows: A New Perspective”. World Development 26(7):1283-1298. Everhart, Stephen S. and Mariusz A. Sumlinski. 2001. “Trends in Private Investment in Developing Countries and the Impact on Private Investment of Corruption and the Quality of Public Investment”. Discussion Paper 44. International Finance Corporation. Washington, DC. Glaeser, Edward L. and Andrei Shleifer. 2001. “The Rise of the Regulatory State”. Discussion Paper 1934. Harvard Institute of Economic Research. Harvard University, Cambridge, Massachusetts. Guasch, Jose Luis. 2001. “Contract renegotiation in LAC.” Mimeo. The World Bank. Kerf, Michel, R. David Gray, Timothy Irwin, Celine Levesque and Robert R. Taylor. 1998. “Concessions for Infrastructure: A Guide to their Design and Award.” World Bank Technical Paper 399. The World Bank, Washington DC. Martin, Noelia, Antonio Estache, Javier Campos and Lourdes Trujillo. 2001. “Macroeconomic effects of private participation in Latin America’s infrastructure”. Mimeo. The World Bank, Washington DC. Noll, Roger G. 2000. “Progress in Telecommunications Reform in Mexico.” Background paper prepared for the “Country Framework Report on Infrastructure in Mexico”. The World Bank, Washington DC. Pritchett, Lant, H. 2000. “The Tyranny of Concepts: CUDIE (Cumulated, Depreciated, Investment Effort) is Not Capital.” Policy Research Working Paper 2341. The World Bank, Washington DC.

25
Reinikka, Ritva and Jakob Svensson. 1999. “How inadequate provision of Public Infrastructure and Services affects Private Investment”. Policy Research Working Paper 2262. The World Bank, Washington DC. Serven, Luis. 1996a. “Does public capital crowd-out private capital? Evidence from India”. Policy Research Working Paper 1613. The World Bank, Washington DC. Serven, Luis. 1996b. “Irreversibility, Uncertainty and Private Investment: Analytical Issues and Some Lessons for Africa”. Policy Research Working Paper 1722. The World Bank, Washington DC. Smith, Warrick. 1997a. “Utility Regulators – The Independence Debate.” Viewpoint 127. The World Bank, Washington DC. Smith, Warrick. 1997b. “Utility Regulators – Roles and Responsibilities.” Viewpoint 128. The World Bank, Washington DC. Smith, Warrick. 1997c. “Utility Regulators – Decision Making Structures, Resources and Start-up Strategy.” Viewpoint 129. The World Bank, Washington DC. Wallsten, Scott. 2002. “Does Sequencing Matter? Regulation and Privatization in Telecommunications Reforms”. Policy Research Working Paper 2817. The World Bank, Washington DC. Wallsten, Scott. 2001a. “An Econometric Analysis of Telecom Competition, Privatization, & Regulation in Africa and Latin America,” Journal of Industrial Economics 40(1). Wallsten, Scott. 2001b. “Telecommunications Privatization in Developing Countries: The Real Effects of Exclusivity Periods”. Mimeo. The World Bank, Washington DC.

26
Appendix I
Table 1a. Descriptive Statistics
Variable Obs Mean Std.Dev. Min Max ln_pvt 1039 -1.508701 6.58633 -9.21034 8.642539 ln_pub 1039 4.353829 3.421206 -9.21034 9.1114 ln_lgdp 995 11.10819 1.305327 8.168795 13.53596 trend 1039 6.180943 7.640273 -10 18 year 1039 1986.181 7.640273 1970 1998 lag_k 975 600168.2 1695603 -.1339746 1.74e+07 rbexist 966 .2691511 .4437484 0 1 dreform 1039 .201155 .4010567 0 1 rroi 796 10.59798 52.92596 -98.47225 388.1028 invprice 1039 1.031041 .2023544 .6601342 2.1052
Table 2a. Descriptive Statistics (If regulatory body exists)
Variable Obs Mean Std. Dev. Min Max ln_pvt 260 1.986591 6.069542 -9.21034 8.642539 ln_pub 260 3.5557 4.241931 -9.21034 7.889421 ln_lgdp 258 11.22734 1.275387 8.627512 13.53596 trend 260 13.96923 3.958157 0 18 year 260 1993.969 3.958157 1980 1998 lag_k 244 784008.1 2054862 -.1339746 1.74e+07 dreform 260 .6307692 .4835273 0 1 rroi 260 7.519959 15.01653 -68.56507 94.56563 invprice 260 .9823314 .168972 .7030305 1.479487 rbminis 260 .8961538 .3056492 0 1 drbelec 260 .1115385 .3154049 0 1 rbnum 195 4.333333 2.553887 1 9 rbudgov 255 .4784314 .5005169 0 1 d_ror 260 .0884615 .2845126 0 1
Table 3a. Correlation matrix for complete dataset
Obs=646 ln_pvt ln_pub ln_lgdp year lag_k rbexist dreform rroi invprice ln_pvt 1.0000 ln_pub -0.2141 1.0000 ln_lgdp 0.0006 0.2294 1.0000 year 0.5117 -0.2134 0.0846 1.0000 lag_k 0.2445 0.0124 0.3014 0.1308 1.0000 rbexist 0.2978 -0.1864 0.0472 0.6419 0.0168 1.0000 dreform 0.3371 -0.1475 0.1640 0.5442 0.1849 0.5717 1.0000 rroi -0.0319 0.1689 0.3266 0.0332 0.1213 -0.0779 -0.0093 1.0000 invprice -0.1225 0.0498 -0.2828 -0.2159 -0.0607 -0.2123 -0.2536 -0.2069 1.0000
27
Table 4a. Correlation matrix for regulatory variables
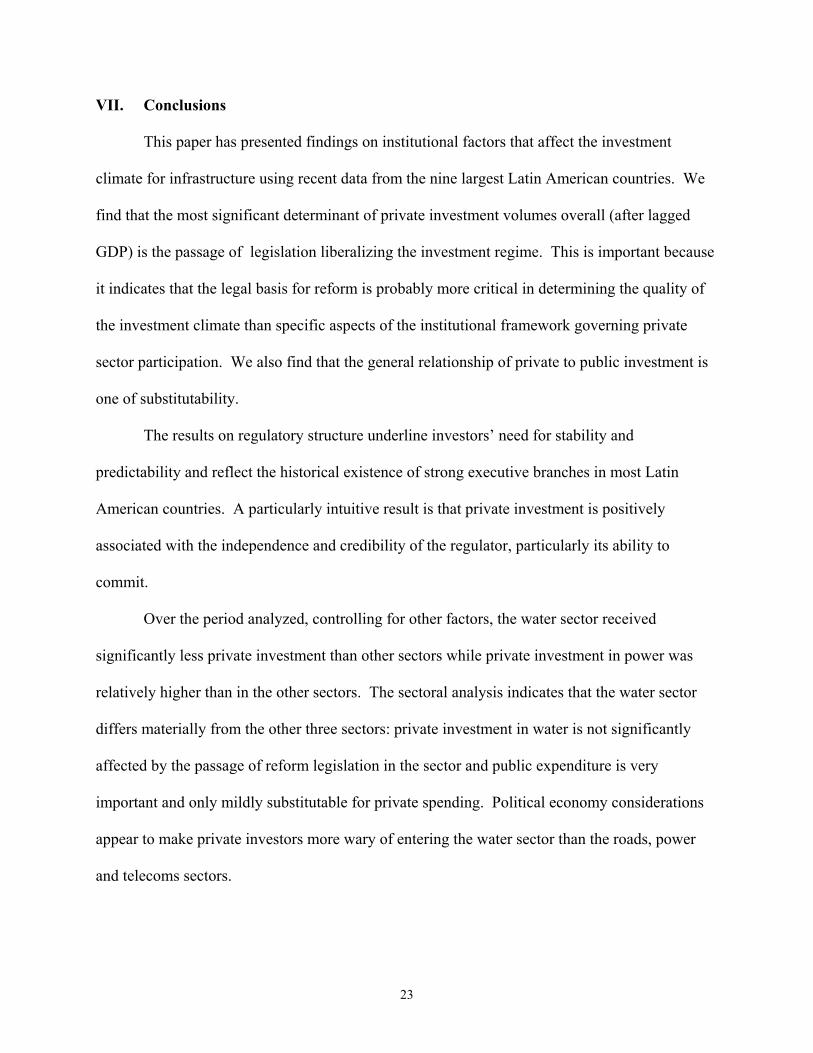
Table 5a. Public and private investment per annum before and after the passage of reform legislation
Country Sector Investment Source
Average investment pa in 1992 US$m -- period before liberalization
Average investment pa in 1992 US$m -- period after liberalization
Argentina Telecoms Public 502.57 144.00Argentina Telecoms Private 0.00 1233.00Argentina Electricity Public 1814.00 437.00Argentina Electricity Private 0.00 664.00Argentina Gas Public 207.00 75.00Argentina Gas Private 0.00 294.00Argentina Railways Public 315.00 108.00Argentina Railways Private 0.00 197.00Argentina Roads Public 826.00 349.00Argentina Roads Private 0.00 161.00Argentina water Public 209.00 138.00Argentina water Private 0.00 110.00Bolivia Telecoms Public 23.00 0.00Bolivia Telecoms Private 56.00 103.00Bolivia Electricity Public 57.00 28.00Bolivia Electricity Private 25.00 157.00Bolivia Railways Public 19.00 21.00Bolivia Railways Private 9.00 3.00Bolivia Roads Public 82.00 88.00Bolivia Roads Private 11.00 51.00Brazil Telecoms Public 1427.00 1601.00Brazil Telecoms Private 1121.00 3132.00Brazil Electricity Public 4218.00 504.00Brazil Electricity Private 1229.00 3806.00Brazil Railways Public 887.00 73.00Brazil Railways Private 912.00 259.00Brazil Roads Public 747.00 311.00Brazil Roads Private 131.00 326.00Chile Telecoms Public 120.00 46.00Chile Telecoms Private 0.00 463.00Chile Electricity Public 515.00 217.00Chile Electricity Private 0.00 400.00Chile Roads Public 283.00 494.00Chile Roads Private 0.00 165.00
obs=191 dreform rbminis drbelec rbnum rbudgov d_ror ln_pvt dreform 1.0000 rbminis -0.1293 1.0000 drbelec 0.0013 0.1538 1.0000 rbnum 0.2213 -0.1073 -0.1665 1.0000 rbudgov -0.0455 0.1394 -0.3288 -0.0854 1.0000 d_ror -0.0006 0.1268 -0.1185 -0.2729 0.0632 1.0000 ln_pvt 0.4604 -0.0763 0.1662 0.1997 -0.1691 -0.0708 1.0000
28
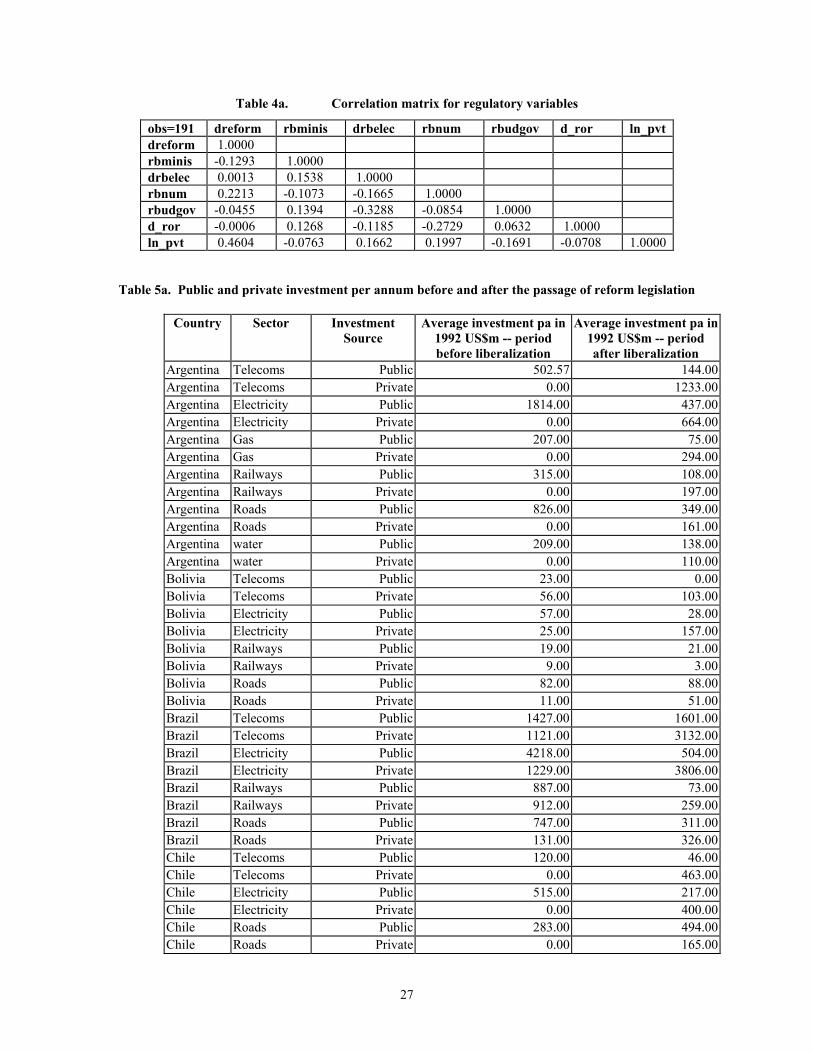
Chile water Public 72.00 140.00Chile water Private 0.00 20.00Colombia Telecoms Public 164.00 378.00Colombia Telecoms Private 0.00 298.00Colombia Electricity Public 857.00 1421.00Colombia Electricity Private 0.00 776.21Colombia Roads Public 598.19 632.52Colombia Roads Private 0.00 123.21Ecuador Electricity Public 120.09 231.29Ecuador Electricity Private 49.77 49.07Mexico Telecoms Public 659.00 538.00Mexico Telecoms Private 0.00 1116.00Mexico Roads Public 207.97 696.26Mexico Roads Private 0.00 1059.93Peru Telecoms Public 75.11 131.22Peru Telecoms Private 2.58 312.48Peru Electricity Public 190.30 40.12Peru Electricity Private 3.00 243.49Venezuela Telecoms Public 177.09 13.80Venezuela Telecoms Private 23.42 484.93
Table 6a. Aspects of regulatory structure by sector and country
Country Sector Year
established Name In
ministry or minister involved in decisions
Regulator Appointed by Legislature and Executive
Size Tenure Funded solely by Govt.
Tariff Regulation
ARG Electricity 1992 ENRE 0 0 5 5 0 Price Cap ARG Railways 1996 CNRT 1 0 5 5 0 Price Cap ARG Roads 1993 MEOSP/ Ocraba 1 0 5 1 0 Price Cap ARG Telecoms 1990 CNC 1 0 EP 5 0 Price Cap ARG water 1993 ETOSS 0 0 8 6 0 Price Cap BOL Electricity 1994 Superintendencia de
Electricidad 1 1 1 5 0 Price Cap
BOL Railways 1995 Superintendencia de Transporte
1 1 1 5 0 Price Cap
BOL Roads 1995 Superintendencia de Transporte
1 1 1 5 0 Price Cap
BOL Telecoms 1994 Superintendencia de Telecomunicaciones
1 1 5 Price Cap
BOL water 1994 Superintendencia de Agua
1 0 1 5 0 Rate of return
BRA Electricity 1996 ANEEL 1 1 5 4 0 Price Cap BRA Railways 1996 Ministerio de
Transportes 1 0 EP EP 1 Price Cap
BRA Roads 1993 DNER 1 0 EP 1 1 Price Cap BRA Telecoms 1997 Anatel 1 0 EP EP 1 Price Cap BRA water 1995 Municipality 1 0 EP EP 1 Price Cap CHL Electricity 1978 CNE 1 0 6 EP 0 Price Cap

29
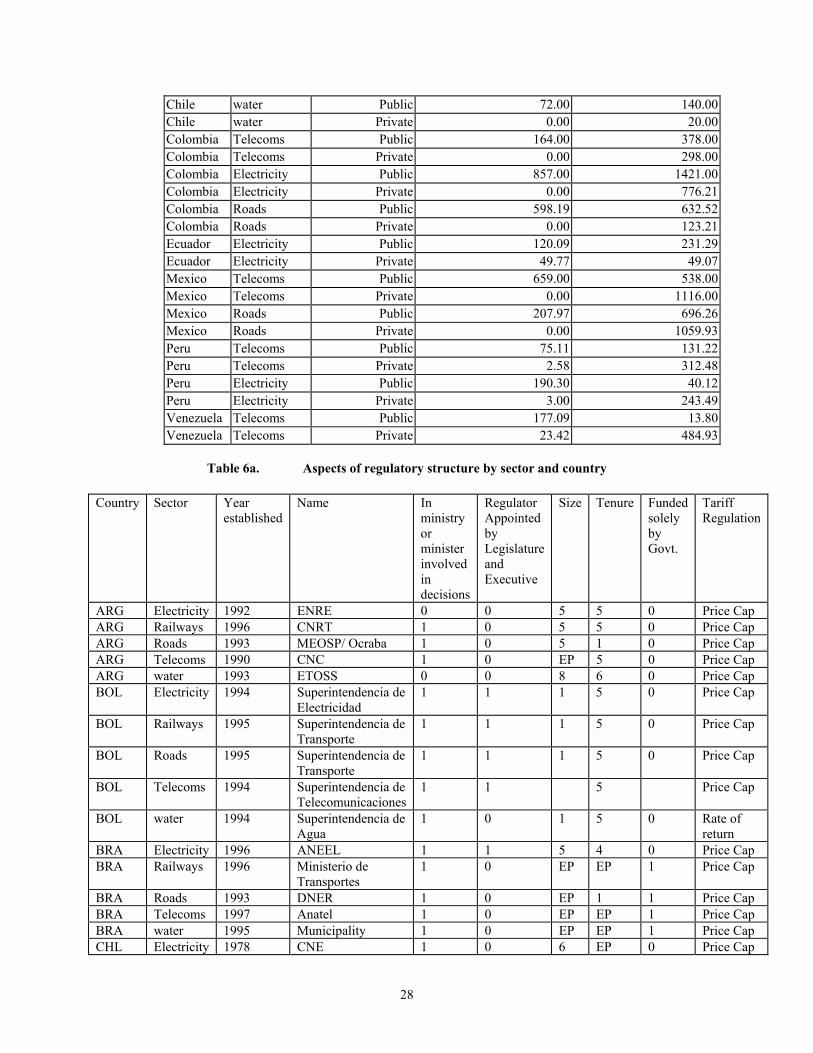
Country Sector Year established
Name In ministry or minister involved in decisions
Regulator Appointed by Legislature and Executive
Size Tenure Funded solely by Govt.
Tariff Regulation
CHL Railways 1984 MOP 1 0 1 EP 0 Price Cap CHL Roads 1984 MOP 1 0 1 EP 0 Price Cap CHL Telecoms 1977 Subtel 1 0 7 5 1 Revenue
Cap CHL water 1990 Superintendencia de
Servicios Sanitarios 1 0 1 EP 1 Rate of
return COL Electricity 1992 CREG 1 0 8 4 0 Price Cap COL Railways 1992 Invias 1 0 1 EP 1 Price Cap COL Roads 1992 Invias 1 0 1 EP 1 Price Cap COL Telecoms 1994 CRT 1 0 3 2 1 Price Cap COL water 1994 CRA 1 0 9 EP 1 Price Cap ECU Electricity 1996 CONELEC 1 0 7 4 0 Rate of
return ECU Railways ECU Roads Direccion de
Concesiones 1 0 EP EP 1
ECU Telecoms 1992 CONATEL 1 0 6 EP 0 Price Cap ECU water MEX Electricity 1995 CRE 0 0 1 5 1 Price Cap MEX Railways 1995 SCT 1 0 EP EP 1 Price Cap MEX Roads 1985 Caminos y Puentes
Federales 1 0 5 EP 1 Price Cap
MEX Telecoms 1996 COFETEL 0 0 4 EP 1 None MEX water 1989 C N A 1 0 1 EP 1 Price Cap PER Electricity 1993 CTE/ Osinerg 1 0 EP EP 0 Rate of
return PER Railways 1998 OSITRAN 1 0 4 5 0 Price Cap PER Roads 1998 OSITRAN 1 0 4 5 0 Price Cap PER Telecoms 1991 OSIPTEL 1 1 6 3 0 Price Cap PER water 1992 SUNASS 1 0 EP 1 Price Cap VEN Electricity 1992 CREE 1 0 EP EP 0 Price Cap VEN Railways 1995 MTC 1 0 EP EP 1 Price Cap VEN Roads 1991 MTC 1 0 EP EP 1 Price Cap VEN Telecoms 1991 CONATEL 1 0 5 EP 1 Price Cap VEN water
Source: Guasch, 2001.

Figure 1: Annual average share of the private sector in total Telecoms sector investment
0.00%10.00%20.00%30.00%40.00%50.00%60.00%70.00%80.00%90.00%
100.00%
Argenti
naBoliv
iaBraz
ilChile
Colombia
Ecuad
or
Mexico Peru
Venez
uela
Before liberalizationAfter liberalization
Figure 2: Annual average share of the private sector in total Electricity sector
investment
0.00%10.00%20.00%30.00%40.00%50.00%60.00%70.00%80.00%90.00%
100.00%
Argenti
naBoli
viaBraz
ilChil
e
Colombia
Ecuad
or
Mexico Peru
Venez
uela
Before liberalizationAfter liberalization
Figure 3: Annual average share of the private sector in total investment in the
Roads sector
0.00%
10.00%
20.00%
30.00%
40.00%
50.00%
60.00%
70.00%
Argenti
inaBoli
viaBraz
ilChil
e
Colombia
Equad
or
Mexico Peru
Venez
uela
Before liberalizationAfter liberalization

31
Figure 4: Average Annual Investment in Telecoms in US$m of 1992
0500
100015002000250030003500400045005000
Argenti
naBoli
viaBraz
ilChil
e
Colombia
Ecuad
or
Mexico Peru
Venez
uela
Before liberalizationAfter liberalization
Figure 5: Average Annual Investment in Electricity in US$m of 1992
0
1000
2000
3000
4000
5000
6000
Argenti
naBoli
viaBraz
ilChil
e
Columbia
Ecuad
or
Mexico Peru
Venez
uela
Before liberalizationAfter liberalization
Figure 6: Average Annual Investment in Roads in US$ of 1992
0200400600800
100012001400160018002000
Argenti
naBoli
viaBraz
ilChil
e
Colombia
Ecuad
or
Mexico Peru
Venez
uela
Before liberalizationAfter liberalization

Argentina Telecoms
0
500
1000
1500
2000
2500
1970
1972
1974
1976
1978
1980
1982
1984
1986
1988
1990
1992
1994
1996
1998
Inve
stm
ent i
n 19
92 U
S$m
rpub_invrpvt_inv
Bolivia Telecoms
0
100
200
300
400
500
600
700
1980
1981
1982
1983
1984
1985
1986
1987
1988
1989
1990
1991
1992
1993
1994
1995
1996
1997
1998
Inve
stm
ent i
n 19
92 U
S$m
rpub_invrpvt_inv
Brazil Telecoms
0
500
1000
1500
2000
2500
3000
3500
4000
4500
5000
1970
1972
1974
1976
1978
1980
1982
1984
1986
1988
1990
1992
1994
1996
1998
Inve
stm
ent i
n 19
92 $
USm
rpub_invrpvt_inv
Chile Telecoms
0
200
400
600
800
1000
1200
1980
1981
1982
1983
1984
1985
1986
1987
1988
1989
1990
1991
1992
1993
1994
1995
1996
1997
1998
Inve
stm
ent i
n 19
92 U
S$m
rpub_inv
rpvt_inv
Colombia Telecoms
0
100
200
300
400
500
600
700
800
1973
1975
1977
1979
1981
1983
1985
1987
1989
1991
1993
1995
1997
Inve
stm
ent i
n 19
92 U
S$m
rpub_invrpvt_inv
Ecuador Telecoms
0
50
100
150
200
250
300
350
400
1981
1982
1983
1984
1985
1986
1987
1988
1989
1990
1991
1992
1993
1994
1995
1996
1997
1998
Inve
stm
ent i
n 19
92 U
S$m
rpub_invrpvt_inv

Mexico Telecoms
0
500
1000
1500
2000
2500
1970
1972
1974
1976
1978
1980
1982
1984
1986
1988
1990
1992
1994
1996
1998
Inve
stm
ent i
n 19
92 U
S$m
rpub_invrpvt_inv
Peru Telecoms
0
100
200
300
400
500
600
1970
1972
1974
1976
1978
1980
1982
1984
1986
1988
1990
1992
1994
1996
1998
Inve
stm
ent i
n 19
92 U
S$m
rpub_invrpvt_inv
Venezuela Telecoms
0
200
400
600
800
1000
1200
1980
1981
1982
1983
1984
1985
1986
1987
1988
1989
1990
1991
1992
1993
1994
1995
1996
1997
1998
Inve
stm
ent i
n 19
92 U
S$m
rpub_inv
rpvt_inv
Argentina Electricity
0
500
1000
1500
2000
2500
3000
3500
1970
1972
1974
1976
1978
1980
1982
1984
1986
1988
1990
1992
1994
1996
1998
Inve
stm
ent i
n 19
92 U
S$m
rpub_inv
rpvt_inv
Bolivia Electricity
0
50
100
150
200
250
1980
1981
1982
1983
1984
1985
1986
1987
1988
1989
1990
1991
1992
1993
1994
1995
1996
1997
1998
Inve
stm
ent i
n 19
92 U
S$m
rpub_inv
rpvt_inv
Brazil Electricity
0
1000
2000
3000
4000
5000
6000
7000
8000
9000
10000
1970
1971
1972
1973
1974
1975
1976
1977
1978
1979
1980
1981
1982
1983
1984
1985
1986
1987
1988
1989
1990
1991
1992
1993
1994
1995
1996
1997
1998
Inve
stm
ent i
n 19
92 U
S$m
rpub_inv
rpvt_inv

Chile Electricity
0
200
400
600
800
1000
1200
1980
1981
1982
1983
1984
1985
1986
1987
1988
1989
1990
1991
1992
1993
1994
1995
1996
1997
1998
Inve
stm
ent i
n 19
92 U
S$m
rpub_inv
rpvt_inv
Colombia Electricity
0
500
1000
1500
2000
2500
3000
1973
1975
1977
1979
1981
1983
1985
1987
1989
1991
1993
1995
1997
Inve
stm
ent i
n 19
92 U
S$m
rpub_inv
rpvt_inv
Ecuador Electricity
0
50
100
150
200
250
300
350
1981
1982
1983
1984
1985
1986
1987
1988
1989
1990
1991
1992
1993
1994
1995
1996
1997
1998
Inve
stm
ent i
n 19
92 U
S$m
rpub_inv
rpvt_inv

Mexico Electricity
0
500
1000
1500
2000
2500
1980
1981
1982
1983
1984
1985
1986
1987
1988
1989
1990
1991
1992
1993
1994
1995
1996
1997
1998
Inve
stm
ent i
n 19
92 U
S$m
rpub_invrpvt_inv
Peru Electricity
0
100
200
300
400
500
600
1970
1972
1974
1976
1978
1980
1982
1984
1986
1988
1990
1992
1994
1996
1998
Inve
stm
ent i
n 19
92 U
S$m
rpub_invrpvt_inv
Venezuela Electricity
0
20
40
60
80
100
120
140
160
180
1980
1981
1982
1983
1984
1985
1986
1987
1988
1989
1990
1991
1992
1993
1994
1995
1996
1997
1998
Inve
stm
ent i
n 19
92 U
S$m
rpub_invrpvt_inv

Argentina Roads
0
200
400
600
800
1000
1200
1400
1600
1970
1972
1974
1976
1978
1980
1982
1984
1986
1988
1990
1992
1994
1996
1998
Inve
stm
ent i
n 19
92 U
S$m
rpub_invrpvt_inv
Bolivia Roads
0
20
40
60
80
100
120
140
1980
1981
1982
1983
1984
1985
1986
1987
1988
1989
1990
1991
1992
1993
1994
1995
1996
1997
1998
Inve
stm
ent i
n 19
92 U
S$m
rpub_invrpvt_inv
Brazil Roads
0
200
400
600
800
1000
1200
1400
1600
1800
2000
1970
1972
1974
1976
1978
1980
1982
1984
1986
1988
1990
1992
1994
1996
1998
Inve
stm
ent i
n 19
92 U
S$m
rpub_invrpvt_inv

Chile Roads
0
100
200
300
400
500
600
700
800
900
1980
1981
1982
1983
1984
1985
1986
1987
1988
1989
1990
1991
1992
1993
1994
1995
1996
1997
1998
Inve
stm
ent i
n 19
92 U
S$m
rpub_inv
rpvt_inv
Colombia Roads
0
200
400
600
800
1000
1200
1973
1975
1977
1979
1981
1983
1985
1987
1989
1991
1993
1995
1997
Inve
stm
ent i
n 19
92 U
S$m
rpub_invrpvt_inv
Ecuador Roads
0
20
40
60
80
100
120
140
160
180
1981
1982
1983
1984
1985
1986
1987
1988
1989
1990
1991
1992
1993
1994
1995
1996
1997
1998
Inve
stm
ent i
n 19
92 U
S$m
rpub_invrpvt_inv
Mexico Roads
0
500
1000
1500
2000
2500
3000
3500
1970
1972
1974
1976
1978
1980
1982
1984
1986
1988
1990
1992
1994
1996
1998
Inve
stm
ent i
n 19
92 U
S$m
rpub_invrpvt_inv
Peru Roads
0
50
100
150
200
250
300
350
1970
1972
1974
1976
1978
1980
1982
1984
1986
1988
1990
1992
1994
1996
1998
Inve
stm
ent i
n 19
92 U
S$m
rpub_inv
rpvt_inv
Venezuela Roads
0
50
100
150
200
250
300
350
400
450
500
1980
1981
1982
1983
1984
1985
1986
1987
1988
1989
1990
1991
1992
1993
1994
1995
1996
1997
1998
Inve
stm
ent i
n 19
92 U
S$m
rpub_invrpvt_inv

Argentina Water
0
50
100
150
200
250
300
350
400
450
500
1970
1972
1974
1976
1978
1980
1982
1984
1986
1988
1990
1992
1994
1996
1998
Inve
stm
ent i
n 19
92 U
S$m
rpub_invrpvt_inv
Bolivia Water
0
10
20
30
40
50
60
70
80
1980
1981
1982
1983
1984
1985
1986
1987
1988
1989
1990
1991
1992
1993
1994
1995
1996
1997
1998
Inve
stm
ent i
n 19
92 U
S$m
rpub_invrpvt_inv
Brazil Water
0.0
500.0
1000.0
1500.0
2000.0
2500.0
3000.0
1980
1981
1982
1983
1984
1985
1986
1987
1988
1989
1990
1991
1992
1993
1994
1995
1996
1997
1998
Inve
stm
ent i
n 19
92 $
USm
rpub_invrpvt_inv
Chile Water
0.0
50.0
100.0
150.0
200.0
250.0
300.0
350.0
400.0
1980
1981
1982
1983
1984
1985
1986
1987
1988
1989
1990
1991
1992
1993
1994
1995
1996
1997
1998
Inve
stm
ent i
n 19
92 U
S$m
rpub_invrpvt_inv
Colombia Water
0
100
200
300
400
500
600
700
800
1973
1975
1977
1979
1981
1983
1985
1987
1989
1991
1993
1995
1997
Inve
stm
ent i
n 19
92 U
S$m
rpub_invrpvt_inv
Ecuador Water
0
50
100
150
200
250
rpub_invrpvt_inv

Mexico Water
0
200
400
600
800
1000
1200
1980
1981
1982
1983
1984
1985
1986
1987
1988
1989
1990
1991
1992
1993
1994
1995
1996
1997
1998
Inve
stm
ent i
n 19
92 U
S$m
rpub_invrpvt_inv
Peru Water
0
5
10
15
20
25
30
35
40
45
1970
1972
1974
1976
1978
1980
1982
1984
1986
1988
1990
1992
1994
1996
1998
Inve
stm
ent i
n 19
92 U
S$m
rpub_invrpvt_inv
Venezuela Water
0
1
2
3
4
5
6
7
rpub_invrpvt_inv