Regulation and prediction of dry matter intake - BR-Corte · Regulation and prediction of dry...
28
2 Regulation and prediction of dry matter intake José Augusto Gomes Azevêdo, Sebastião de Campos Valadares Filho, Luiz Fernando Costa e Silva, Alana Batista dos Santos, Lígia Lins Souza, Polyana Pizzi Rotta, Luciana Navajas Rennó, Ivanor Nunes do Prado INTRODUCTION Dry matter intake (DMI) is the most important variable affecting animal performance (Waldo and Jorgensen, 1981), because it guarantees the organism adequate nutrients and energy substrates for biochemical reactions that contribute to oscillations in cell metabolism, especially in cattle for meat production. One must consider the economic importance and complex digestive systems of these animals, which are characterized by unusual metabolic functions (Forbes, 2007). In beef cattle production, variations in feed intake are necessary during the growth cycle to maintain a dynamic balance in face of constant challenges from metabolic and environmental needs. Limitations on feed intake can prevent nutrient requirements to be met. As the majority of the nutrients of the beef cattle diet are used to meet maintenance requirements, a small alteration in feed intake can limit the efficiency of the productive processes, resulting in decreased growth rate. The genetic potential for gain will not be reached, and the profitability of the livestock-raising activity will be reduced. Furthermore, problems can arise in association with feed stress, resulting in negative health impacts and digestive disturbances. FEED INTAKE REGULATION BY CATTLE Neuro-hormonal factors The brain is the organ that coordinates feeding behavior. According to Konturek et al. (2005), there is indication that the solitary tract nucleus (STN), in the brain stem, works as gateway for neural signals coming from the gastrointestinal tract to the central intake regulator in the hypothalamus. These authors also suggest that the amygdaloid body, the prefrontal cortex and the area postrema (chemical receptor trigger zone or “vomit center”) have been considered responsible for feeding disorders and inadequate energy storage or conservation. The arcuate nucleus (ARC) and the paraventricular nucleus (PVN) are also important centers in feed intake control. The ARC and PVN are sites where several hormones, released from the gastrointestinal tract and adipose tissue, converge to regulate feed intake and energy expenditure (Crespo et al., 2014). Hetherington and Ranson (1940) and Anand and Brobeck (1951) were the pioneers to propose a model consisting of the hunger center in the lateral hypothalamic (LHA) and of satiation in the ventromedial hypothalamic region. The lateral area of the hypothalamus has neurons that induce the animal to start a new feeding cycle, while stimuli in the ventromedial area induce satiation (Mayer and Thomas, 1967). There are indications that the lateral hypothalamus region, known as the hunger center, would always be ready to induce hunger. Or so, this region would be chronically active, and its activity would be temporarily inhibited by the satiation center in the ventromedial hypothalamus (Konturek et al., 2005). Thus, feed intake could be stimulated by the absence of satiation signals (Allen et al., 2005). Therefore, the hypothalamic nucleus does not act separately in the context of energy homeostasis control but rather acts synergistically with other structures; the signals between them are transmitted by specific neuropeptides. The ARC plays an important role in integrating signals that regulate intake (Stanley et al., 2005). A series of complex systems maintain energy homeostasis in order to maintain the body weight and make sufficient energy available for all the metabolic processes
Transcript of Regulation and prediction of dry matter intake - BR-Corte · Regulation and prediction of dry...
2
Regulation and prediction of dry matter intake
José Augusto Gomes Azevêdo, Sebastião de Campos Valadares Filho, Luiz Fernando Costa e Silva, Alana
Batista dos Santos, Lígia Lins Souza, Polyana Pizzi Rotta, Luciana Navajas Rennó, Ivanor Nunes do Prado
INTRODUCTION
Dry matter intake (DMI) is the most
important variable affecting animal
performance (Waldo and Jorgensen, 1981),
because it guarantees the organism adequate
nutrients and energy substrates for
biochemical reactions that contribute to
oscillations in cell metabolism, especially in
cattle for meat production. One must consider
the economic importance and complex
digestive systems of these animals, which are
characterized by unusual metabolic functions
(Forbes, 2007).
In beef cattle production, variations in
feed intake are necessary during the growth
cycle to maintain a dynamic balance in face of
constant challenges from metabolic and
environmental needs.
Limitations on feed intake can prevent
nutrient requirements to be met. As the
majority of the nutrients of the beef cattle diet
are used to meet maintenance requirements, a
small alteration in feed intake can limit the
efficiency of the productive processes,
resulting in decreased growth rate. The
genetic potential for gain will not be reached,
and the profitability of the livestock-raising
activity will be reduced. Furthermore,
problems can arise in association with feed
stress, resulting in negative health impacts
and digestive disturbances.
FEED INTAKE REGULATION BY
CATTLE
Neuro-hormonal factors
The brain is the organ that coordinates
feeding behavior. According to Konturek et
al. (2005), there is indication that the solitary
tract nucleus (STN), in the brain stem, works
as gateway for neural signals coming from the
gastrointestinal tract to the central intake
regulator in the hypothalamus. These authors
also suggest that the amygdaloid body, the
prefrontal cortex and the area postrema
(chemical receptor trigger zone or “vomit
center”) have been considered responsible for
feeding disorders and inadequate energy
storage or conservation. The arcuate nucleus
(ARC) and the paraventricular nucleus (PVN)
are also important centers in feed intake
control. The ARC and PVN are sites where
several hormones, released from the
gastrointestinal tract and adipose tissue,
converge to regulate feed intake and energy
expenditure (Crespo et al., 2014).
Hetherington and Ranson (1940) and
Anand and Brobeck (1951) were the pioneers
to propose a model consisting of the hunger
center in the lateral hypothalamic (LHA) and
of satiation in the ventromedial hypothalamic
region. The lateral area of the hypothalamus
has neurons that induce the animal to start a
new feeding cycle, while stimuli in the
ventromedial area induce satiation (Mayer
and Thomas, 1967). There are indications that
the lateral hypothalamus region, known as the
hunger center, would always be ready to
induce hunger. Or so, this region would be
chronically active, and its activity would be
temporarily inhibited by the satiation center in
the ventromedial hypothalamus (Konturek et
al., 2005). Thus, feed intake could be
stimulated by the absence of satiation signals
(Allen et al., 2005).
Therefore, the hypothalamic nucleus
does not act separately in the context of
energy homeostasis control but rather acts
synergistically with other structures; the
signals between them are transmitted by
specific neuropeptides. The ARC plays an
important role in integrating signals that
regulate intake (Stanley et al., 2005).
A series of complex systems maintain
energy homeostasis in order to maintain the
body weight and make sufficient energy
available for all the metabolic processes

Nutrient Requirements of Zebu and Crossbred Cattle – BR-CORTE
16
(Dietrich and Horvath, 2009). According to
Forbes and Provenza (2000), animals regulate
their daily intake to avoid metabolic or physical
discomfort.
After feed intake, signals from receptors
located in the pharynx and orogastric veins
travel to the brainstem, which is part of the
central nervous system (CNS). Further, gastric
distension mechanisms, chemical stimulation of
receptors in the gastrointestinal mucosa and
several hormones are released from the
gastrointestinal mucus (Konturek et al., 2005).
In addition, there are receptors in the wall of the
dorsal anterior rumen-reticulum region that can
send information, via afferent fibers, projected
to the feed intake control centers in the STN
(Leek, 1986).
In this way, the CNS receives (through
the STN) several neural impulses and hormones
from peripheral organs, especially from the
gastrointestinal tract, adipose tissue and the
pancreas. These structures are involved in short-
and long-term feeding control, managing
information on energy expenditure in response
to constant alterations in energy balance
(Konturek et al., 2005).
Intestinal peptides signal to the
hypothalamus via the ARC to mediate appetite
stimuli (+), that are activated by neurons that
secrete Y neuropeptide (YNP) and agouti -
related peptide (AgRP), or appetite inhibiting
factors (-) through neurons that contain a pro-
opiomelanocortin (POMC) precursor of the
alpha-melanocyte stimulating hormone (α-
MSH) and through peptide from the production
of the cocaine and amphetamine regulated
transcript (CART) to the hunger center in the
LHA, and satiation center in the PVN in the
mid-hypothalamus (Currie et al., 2005).
In one study about the intake control
center in ruminants, Miner (1992) suggested
that YNP is a neurotransmitter involved in
intake regulation by the CNS. YNP / AgRP and
POMC / CART in the arcuate nucleus of the
hypothalamus play key roles in regulating the
energy balance. Activation of the YNP / AgRP
neurons has an orexigenic effect, promoting
feed intake, while the POMC/CART neurons
have the opposite effect, that is, anorexigenic.
POMC is activated by post transcriptional
modifications to the α-MSH. These two neuron
circuits receive signals from circulating
hormones.
The summary of neural hormonal
control on feed control described by Bell et al.
(2005) suggests that:
- Leptin is secreted by adipose tissue, and its
circulatory levels are proportional to the adipose
reserve of the body, its effects are exercised
through the leptin receptor (LEPR), inhibiting
the YNP / AgRP neurons and stimulating the
POMC / CART neurons;
- The pancreas secretes insulin, that has an
anorexigenic influence on the ARC, but
increase in insulin plasma levels is stimulated
by YNP;
- Ghrelin, is mostly produced (60%) by the
stomach and stimulates the YNP / AgRP
neurons through receptors that secrete the
growth hormone (GH);
- YY 3-36 (PYY3-36) peptide is secreted in the
distal gastrointestinal tract, and has an affinity
with and bonds to the Y2 (Y2Rs) receptors,
produces inhibitory effects on the YNP / AgRP
neurons and therefore is a powerful peripheral
anorexigenic signal;
- The YNP / AgRP neurons also have an
inhibiting effect on the POMC / CART neurons
through the release of γ-aminobutyric (GABA)
acid, that can be stimulated from the bonding of
ghrelin to GH;
- The orexigenic and anorexigenic signals, that
are produced by the YNP / AgRP and POMC /
CART neurons, respectively, are then sent to
second order flow effector neurons that also
receive afferent modifications for signals from
dopamine, serotonin and endocannabinoids; and
- These effector neurons express receptors that
include the Y1 receptor (Y1R) and the
melanocortin 4 receptor.
Among the anorexigenic peptides, the
first recognized feed intake inhibitor was
cholecystokinin (CCK), product of endocrine
cells I in the duodenal-jejunum. CCK is a
physiological mediating hormone for short term
feed intake inhibition. It collaborates with
signals from gastrointestinal tract
mechanoreceptors that are generated by
digestive tract distension, and are transmitted to
the brain by the afferent vagus nerve (Konturek
et al., 2005).
However, in ruminants, there is a longer
time interval between feed intake and arrival in
the duodenum, where CCK is produced. Thus
CCK is less important in ruminants than in non-
ruminant animals. Nevertheless, increase was

Regulation and prediction of dry matter intake
17
observed in the CCK plasma concentrations in
cows three hours after feeding (Choi and
Palmquist, 1996), indicating that CCK also has
some function in feed intake control in
ruminants.
These modulators interact to establish a
total balance between feed intake and energy
expenditure and thus provoke stimuli in the
animal to begin or not a new feeding cycle.
Psychogenic factors
Psychogenic regulation of feed intake,
such as perception and learning, involves
animal behavior in response to inhibiting or
stimulating factors in the feed or feed
management, that are not related to the energy
value of the feed, nor to the filling effect. The
psychogenic factors that alter feed intake consist
of feed flavor, smell and texture; vision,
emotional states, social interactions and animal
learning, and the greatest impact on
psychogenic feed intake modulation is
palatability (Mertens, 1994).
Animal related factors
a) Body weight
Body weight (BW) is a determining
factor in cattle DMI. Galyean and Hubbert
(1992) observed that initial body weight
represented 59.8% of the variation in the DMI
in diets with NEm concentrations ranging from
1 to 2.4 Mcal/kg DM. In a wide discussion on
DMI prediction models, Pittroff and Kothmann
(2001) assessed 12 different equations and,
regardless of their degree of complexity and
mathematical sophistication, ten of them took
into consideration body weight, giving great
importance to the inclusion of this variable in
DMI prediction equations.
b) Genetic group
According to the NRC (1987), genetic
selection for performance has produced animals
with greater DMI potential and suggests
specific adjustment factors for DMI prediction.
Allen (1992) stated that Continental (European)
breeds can intake 10% more than British breeds
and, based on this information, the AFRC
(1993) proposed adjustment factors in DMI
prediction for several pure breeds.
The NRC (2000), in its DMI prediction
model, adopted the adjustments for breed
proposed by Fox et al. (1988), where the DMI
prediction should be increased by 8% for the
Holstein cattle and by 4% for Holstein and
British crossbred animals. The NRC (2000)
does not suggest alterations in the DMI for
Zebu cattle.
c) Body composition
The body composition of feedlot cattle
is not constant and changes over feedlot time
and with increase in BW. Body composition,
specifically the body fat percentage, seems to be
the main component that affects the DMI
(NRC, 1987). According to Grant and Helferich
(1991), this is due to the deceleration of the
muscle growth and adipose tissue development,
with the increase in BW. Fox et al. (1988)
suggested altering the DMI when cattle
presented empty body fat percentage higher
than 21.3%. Jorge et al. (1997) observed higher
body fat percentage (24.41) for Nellore animals
compared to beef crossbred (21.62%) and dairy
crossbred cattle (19.50%). Fox et al. (1988)
suggested reducing the DMI by 3, 10, 18 and
27% when the empty body fat percentage was,
respectively, 23.8, 26.5, 29.0 and 31.5%.
d) Sex
Marcondes et al. (2008), Véras et al.
(2008) and Lage et al. (2012) did not report
influence from the sexes: heifers, steers and
bulls for DMI, but Paulino et al. (2008)
observed that DMI was greater in heifers
compared to bulls, while the steers DMI did
not differ from either.
The NRC (1984) suggested that DMI
prediction should be decreased by 10% for
heifers with medium body condition, because
heifers reach physiological maturity before
males (NRC, 2000), which could allow for
greater body fat accumulation at an earlier
time-point in comparison to males. As fat
indirectly influences DMI, by leptin secretion
by the adipocytes, a hormone that has been
correlated to intake reductions (Nkrumah et
al., 2005), it is expected that the DMI capacity
of the heifers decreases with increase in BW.
Thus, the sex effect cannot be considered in
isolation because the body condition or body

Nutrient Requirements of Zebu and Crossbred Cattle – BR-CORTE
18
fat percentage is directly influenced by sex.
According to Huuskonen et al. (2013), sex
influence on the DMI may be confused with
other random experimental effects.
Environmental factors
The weather in Brazil is diverse due to
factors such as geographic, territorial
extension, relief and air mass dynamics. The
latter is extremely important because it acts
directly on both temperature and rainfall,
causing regional climatic differences.
However, the Brazilian cattle herd is found in
greater density in the tropical region with
temperatures normally above 25oC, because
the cattle herd distribution is concentrated
mainly in the states of Mato Grosso, Minas
Gerais, Mato Grosso do Sul and Goiás, that
together represent more than 40% (Alvares et
al., 2013; Teixeira and Hespanhol, 2015).
Regarding to the environmental
factors, Fox et al. (1988) suggested to reduce
DMI prediction by 10% in temperatures
ranging from 25 to 35oC and when over 35oC,
reducing by 35%.
Ingvartsen et al. (1992) assessed the
effect of day length on DMI capacity and
observed that the expected DMI may be 1.5 to
2% larger on long days and 1.5 to 2% smaller
on short days.
Management and diet factors
There is a relationship between the
energy concentration of the diet and DMI for
beef cattle. Based on the concept that in lower
digestible diets, that is, with low energy
(high-fiber), the DMI is controlled by factors
known as ruminal filling and physical
impediment of the digestive passage, while in
higher digestible, high energy (low-fiber)
diets, DMI is controlled by the energy
requirement of the animal and metabolic
factors (NRC, 1987).
The strong correlation between neutral
detergent fiber (NDF) and the physical
regulation of intake is due mainly to the high
volume occupied by the cell wall fraction of
forage (Mertens, 1994) and to its
characteristics of low density and slower
degradation compared to the cell content (Van
Soest, 1994; NRC, 2001). Distension in the
rumen-reticulum compartment caused by
filling stimulates receptors in the muscle layer
located, mainly, at the reticulum and cranial
sac level (Allen, 1996, 2000), where
mechanoreceptors are excited by mechanical
and chemical stimuli and tensoreceptors
respond to the distension itself (Allen, 2000),
stimulating the end of the feeding period.
However, this approach has been
criticized because it presumes that physical
and metabolic mechanisms are independent of
each other. This consideration is
physiologically unlikely, since the regulating
signals function in an integrated manner to
create positive or negative signal on voluntary
dry matter intake (Detmann et al., 2014).
NDF intake, or its diet concentration,
is associated to the physical mechanism
(Detmann, 2010), so a single estimate of NDF
concentration is not sufficient to understand
or predict cattle voluntary intake (Detmann et
al., 2014). Thus, separating the total NDF into
undigested NDF and potentially degradable
NDF (pdNDF) may improve the associations
with voluntary intake (Huhtanen et al., 2007;
Harper and McNeill, 2015). For tropical
conditions, Detmann et al. (2003) suggested
that NDF intake above 13.53 g/kg BW would
regulate intake by physical mechanisms, but
Oliveira et al. (2011) reported that the forage
source should be considered and indicated a
mean value of 13.2 g/kg BW for corn silage
and 9.4 g/kg BW for sugarcane. They also
recommend qualitative discrimination of the
NDF and lignin fractions for their efficacious
use in DMI prediction models.
With regard to tropical conditions,
Detmann et al. (2014) related DMI to
digestible organic matter content (DOM) and
undigested NDF and observed a quadratic
effect: DMI (g/kg) = -5.50 + 0.092 × DOM –
0.00007 × DOM2 with a maximum point of
658 g DOM/kg DM and a decreasing linear
effect: DMI (g/kg) = 27.8 – 0.016 ×
undigested NDF, respectively. These authors
observed that the point of equilibrium
between physical and chemical regulation of
intake for beef cattle occurred with a DMI of
20.86 g/kg BW, and this value was observed
for diets with DOM concentration of 660 g/kg
DM and undigested NDF of 228 g/kg DM.
This shows that the DMI is regulated
Regulation and prediction of dry matter intake
19
simultaneously by physical and physiological
limitations.
The protein deficiency (<7–8% CP) is
another diet characteristic that can decrease
DMI, because it limits the rumen
microorganisms from fully using the fibrous
carbohydrates in tropical forage (Lazzarini et
al., 2009; Sampaio et al., 2009). In a diet poor
in nitrogen but rich in forage fiber, the
supplementation with nitrogen increases DMI
(Galyean and Goetsch, 1993).
Therefore, the factors that control feed
intake are complex, truly multifactorial and
there is no consensus on how ruminants
regulate this important activity (Forbes,
2007).
All of these factors should be taken
into account when mathematically predicting
the true biological behavior of dry matter
intake by beef cattle under tropical conditions.
However, no type of equation will be
applicable if the feeding conditions (feed
availability, stocking rate, space in the pen,
access time to feed, feeding frequency, etc.)
are limiting intake (Mertens, 1992).
PREDICTION OF DRY MATTER
INTAKE FOR FEEDLOT CATTLE
To plan an efficient feeding program
capable to find the best feed management to
meet nutrient requirements, it is necessary to
predict with highest precision and accuracy
the voluntary intake of growing and finishing
cattle under ad libitum feeding.
A DMI prediction model is a
simplified representation of the complex
system of voluntary feed intake (Keady et al.,
2004). If it was possible to include all the
physiological, environmental, diet and
management factors that interfere in the DMI,
the model obtained might be difficult to
interpret biologically.
STATE OF THE ART ON DRY MATTER
INTAKE PREDICTION
For a long time, the DMI prediction
models proposed by the NRC (1984, 2000)
were the most commonly used prediction
models in Brazil. However, the models
proposed by the NRC (1984, 2000) were
developed mainly with Bos taurus taurus
animals. According to ANUALPEC (2015),
80% of the Brazilian herd consists of Zebu
cattle, with an estimate of 150 million Zebu.
The contribution of the Zebu cattle to meat
and milk production in Brazil in a self-
sustainable production system is due to their
characteristics of fertility, rusticity,
adaptability to the tropical condition and the
Brazilian meat production systems. The
Nellore breed is predominant in the beef
production systems in Brazil.
Fox et al. (1988) observed that the
genetic group is recognized as one of the
factors that interferes in the DMI. Based on
this study, the NRC (1987) and the AFRC
(1993) adopted the adjustment factor related
to the genetic group in DMI prediction
equations, because breeds were identified
with greater intake potential than others.
Furthermore, steroid stimulants were used in
the cattle in the database used for the DMI
prediction model proposed by the NRC (1984,
2000). In Brazil, steroid use was prohibited
for any purpose in 1961 and currently
Ministerial Regulation no 51 (Brasil, 1991) is
in force that prohibits production,
importation, commercialization and use of
products for purposes of growth and weight
gain in slaughter animals. Non-steroid
compounds with anabolizing effect are
prohibited even for therapeutic purposes.
According to Neal et al. (1984), DMI
prediction models should be tested under
conditions similar to those that characterize
the intended location of use. Therefore, there
is no single model that can be applied in every
situation, and DMI prediction models need to
be developed and validated for tropical
conditions. For this, equations to predict beef
cattle DMI under Brazilian conditions and
with Zebu cattle (Nellore cattle) were carried
out and validated by Valadares Filho et al.
(2006 a,b), that along with energy, protein
and mineral requirements resulted in the
publication entitled Nutrient Requirements for
Zebu cattle and Tables of Feed Composition –
BR-CORTE, described by Valadares Filho et
al. (2006b).
Fifteen dissertations and/or theses
were used in the BR-CORTE (2006) to
develop the database for Zebu animals
(mainly Nellore cattle). In the beef crossbred
database, 10 dissertations and/or theses were
Nutrient Requirements of Zebu and Crossbred Cattle – BR-CORTE
20
used generating a total of 273 experimental
units. Thus the following equations were
recommended to predict DMI:
- For Zebu cattle:
DMI (kg/d) = -2.4001 + 0.0201 × BW +
4.8195 × ADG – 1.5176 × ADG2
- For beef crossbred cattle:
DMI (kg/d) = -1.4105 + 0.0171 × BW +
5.4125 × ADG – 1.8691 × ADG2.
where: BW = mean body weight (kg) and
ADG = average daily gain (kg/d). The DMI
models proposed indicated that the predictive
values were equivalent to those observed
under practical feeding conditions for feedlot
beef cattle under tropical conditions.
Ribeiro et al. (2008) assessed the DMI
based on Zebu genetic group and compared
the values observed with those predicted by
the NRC (2000), CNCPS 5.0 and BR-CORTE
(2006) systems. The authors observed that the
Brazilian system (BR-CORTE, 2006) was
more efficient for DMI predictions by breed
and for Zebu cattle overall.
Valadares Filho et al. (2006a) also
observed lack of fit for the models proposed
by the NRC (1984, 2000) in predicting DMI
for beef cattle under tropical conditions. So,
the equations proposed by the NRC (1984,
2000) would not be able to explain the higher
percentage in the observed variation in the
DMI, compared to the equations adopted by
the BR-CORTE (2006).
Brazilian researchers collected data
from multiple published studies and tried to
establish a quantitative model that better
explains the observations. Generally, studies
differ due to their objectives and ignoring
these differences in joint data analysis results
in an erroneous estimate of the parameters
(intercept and slope) of the regression models.
Therefore, the use of meta-analysis was
proposed in the BR-CORTE, described by
Valadares Filho et al. (2010), to integrate the
study effect and random effects of the
interactions such as components of a mixed
model (St-Pierre, 2001) and generate more
precise and accurate DMI prediction models.
Thus, in the second edition of the Nutrient
Requirements of Zebu cattle, BR-CORTE
(2010), the database was increased for DMI
and the models used by the NRC were
assessed together with new equations to
predict DMI, using meta-analysis, which were
developed and validated.
The data included 561 observations
from 27 theses and/or dissertations (study)
that were published at the Federal University
of Viçosa and University of São Paulo. The
BR-CORTE (2010) showed that the equations
proposed by the NRC were not adequate to
predict DMI for cattle under tropical
conditions and the following DMI prediction
equations were suggested:
- For Zebu cattle:
DMI (kg/d) = -2.7878 + 0.08789 × BW0.75 +
5.0487 × ADG – 1.6835 × ADG2;
- For crossbred cattle:
DMI (kg/d) = -2.6098 + 0.08844 × BW0.75 +
4.4672 × ADG – 1.3579 × ADG2.
where BW0.75 = mean metabolic body weight
(kg) and ADG = average daily gain (kg/d).
The main research group that acted on
the changes regarding DMI prediction for
cattle intended for beef production in the 8th
edition of the BCNRM (2016) – Nutrient
Requirements of Beef Cattle Model – was led
by Professor and Researcher Michael L.
Galyean, from the Department of Animal and
Feed Sciences at the Texas Tech University.
His research group recently published
four articles on this subject. The first was
“Evaluation of the National Research Council
(1996) dry matter intake prediction equations
and relationships between intake and
performance by feedlot cattle” by
McMeniman et al. (2009). This article aims to
assess the NRC (1996) DMI prediction
models. From a database containing 3,363
records of pen collective, representing
632,306 animals on three commercial feedlot
collected over a four-year period (2003 to
2006), they concluded that the equations
proposed by the NRC (1996) were not useful
to predict DMI of commercial feedlot cattle
and suggested the need to develop new, and
more exact and precise equations.
The second article was “Development
and evaluation of feeding-period average dry
matter intake prediction equations from a
commercial feedlot database” by McMeniman

Regulation and prediction of dry matter intake
21
et al. (2010). These authors proposed DMI
prediction models that took into consideration
sex and previous DMI information at the start
of the feedlot.
In the third article, Galyean et al.
(2011) published “Predictability of feedlot
cattle growth performance”. These authors
validated the equations proposed by
McMeniman et al. (2010) and suggested
equations to predict DMI for feedlot beef
cattle fed high-concentrate diets.
In the fourth article, “Evaluation of
current methods and equation development”
by Anele et al. (2014), new equations were
developed but, according to these authors,
these equations gave only modest
improvements for the best of the hypotheses;
in some cases, they did not offer any true
advantage in comparison to the equations
proposed by the NRC (1996) for predicting
DMI in growing or finishing beef cattle.
Anele et al. (2014) reported that it was
disappointing to know that their research
managed to improve only a little the
prediction capacity for DMI, and recognized
difficulty to develop precise DMI predictions
for growing and finishing beef cattle. The
influence of the complex factors that control
DMI makes difficult to adequately explain
DMI biological performance using regression
mathematical models and some independent
variables.
According to Anele et al. (2014), the
BCNRM (2016) recommended to continue
the use of the equation proposed by the NRC
(2000) to predict net energy intake for
maintenance (NEIm, Mcal/d) and later
estimate the DMI, obtained by dividing the
NEIm by the net energy concentration for
maintenance of the diet (NEm):
- For yearlings:
NEIm (Mcal/d) = BW 0.75 × (0.2435 × NEm –
0.0466 × NEm2 – 0.0869),
where BW0.75 is mean metabolic body weight
for the feeding period. For diets with NEm
concentration ≤ 0.95 Mcal/kg MS, the
BCNRM (2016) recommended dividing the
result of this equation by 0.95.
However, because the results of this
equation under or overestimated the DMI
depending on the diet and animal conditions
as reported by Anele et al. (2014), the
BCNRM (2016) recommends that the DMI
equation as a function of body weight
described by Anele et al. (2014) also could be
used to predict DMI in growing or finishing
beef cattle:
DMI (% BW) = 1.2425 + 1.9218 × NEm –
0.7259 × NEm2 (R2 = 0.6188),
where BW = mean body weight (kg). The
BCNRM suggests there is no reason to
recommend a single equation to estimate
DMI.
Based on the validation study by
Galyean et al. (2011), the BCNRM (2016)
recommends the use of equations described
by McMeniman et al. (2010), with
adjustments for sex, to estimate the DMI of
feedlot cattle fed high-grain diets (≥ 2.06
Mcal/kg NEm and ≥ 1.4 Mcal/kg NEg):
- Steers:
DMI (kg/d) = 3.83 + 0.0143 ×iSBW;
- Heifers:
DMI (kg/d) = 3.184 + 0.01536 × iSBW,
where iSBW, mean initial shrunk body
weight.
In the seventh edition of the NRC
(2000), the methods described to predict DMI
were planned to give a general orientation.
There is no one equation that can be applied
to all the production situations. It would be
correct to develop specific DMI prediction
models for determined production situations.
Thus these models would be capable to
explain a greater percentage of the variation
observed in the DMI, compared to a
generalized model.
Although Brazil has a beef herd of a
practically stagnant size, improvement in
productive conditions has increased the
productivity indexes. For these indexes to
continue increasing to reduce production costs
and make the end product more accessible to
the consumer, the knowledge generated by
research must be constantly updated and
validated. This means that the greatest
number of variation sources should be known
and took into account. Likewise, increase in
the number of individual cattle intake data,

Nutrient Requirements of Zebu and Crossbred Cattle – BR-CORTE
22
from research under tropical conditions,
means that the statistical procedures to
estimate DMI become more sensitive to the
variations resulting from the various
production factors.
DESCRIPTION OF DATABASE USED
TO PREDICT NEW MODELS FOR
FEEDLOT CATTLE
Brazil is a country with continental
dimensions. There is wide climatic diversity
that permits raising cattle of predominantly
Zebu breeds and also the use of different
genetic groups specialized in meat production
to obtain benefits from the hybrid vigor to
increase the herd productivity.
Furthermore, in Brazil, a significant
part of the meat produced is from males
derived from dairy herds, which are used for
growing and finishing animals as beef cattle.
Faced by this genetic diversity among the
cattle raised in Brazil and knowing that
physiologically there are differences in
growth potential and nutrient requirements,
the database was separated into three genetic
groups to predict new models to estimate
DMI for cattle under tropical conditions:
Zebu cattle (predominantly Nellore animals),
beef crossbred cattle (animals derived from
crosses of Zebu with breeds specialized in
meat production, predominantly Angus x
Nellore) and dairy crossbred cattle (animals
derived from crosses of Zebu with breeds
specialized in milk production, mainly
Holstein).
An updated database is needed to
generate DMI prediction models capable of
being biologically representative and
explaining the greater percentage in variation
observed in the DMI of cattle under tropical
conditions. For this, the database that was
used to predict DMI in the BR-CORTE
(2010) was increased from 360 to 649
experimental units (EU) with Zebu cattle and
from 201 to 679 EU with beef or dairy
crossbred cattle (Table 2.1). The database
increased to 1,328 EU, derived from research
on growing or finishing cattle, with recorded
individual intake that also respected an
adaptation period to minimize the impact of
compensatory growth on DMI. The complete
references of the origin of the database used
to develop the equations can be accessed in
appendix 2.1 in www.brcorte.com.br/en.
Descriptive analysis (Triola, 1999)
(Table 2.1) of the data gave the dataset profile
from the central tendency and dispersion
means. In general, the total amplitudes of the
different variables present in the database
used to develop the DMI prediction equations
(Table 2.1) represented the Brazilian
characteristics of feedlot beef cattle
production systems, so there are variations
from low to high initial BW, final BW, ADG,
DMI and variations in the NDF and CP
intakes. Thus representative projections were
obtained, in the face of the universe of diets
used for cattle for beef production under
tropical conditions and their possible
interactions with genetic group and
interference in the DMI regulation patterns.

Regulation and prediction of dry matter intake
23
Table 2.1 - Descriptive statistics of the variables used to predict dry matter intake and nutrient
intake for Zebu cattle, and beef and dairy crossbred cattle
Variable N Mean SD Minimum Maximum
Zebu cattle
Feedlot, days 649 106 45.1 42.0 271
Initial body weight, kg 649 308 72.8 110 475
Final body weight, kg 649 400 84.4 125 580
ADG, kg/d 649 0.92 0.42 -0.36 1.84
Intake
Dry matter, kg/d 649 7.39 2.12 1.29 13.2
NDF, kg/d 472 3.17 1.17 0.79 7.61
iNDF, kg/d 388 1.24 0.55 0.13 2.43
Crude protein, kg/d 472 0.98 0.28 0.29 1.74
TDN, kg/d 470 4.84 1.56 1.00 10.2
Beef crossbred cattle
Feedlot, days 270 112 35.6 55.0 232
Initial body weight, kg 270 352 55.3 215 580
Final body weight, kg 270 455 78.6 220 607
ADG, kg/d 270 1.22 0.48 -0.19 2.37
Intake
Dry matter, kg/d 270 8.57 1.94 2.46 12.5
NDF, kg/d 188 3.25 1.24 0.83 6.97
iNDF, kg/d 30 0.81 0.16 0.50 1.09
Crude protein, kg/d 163 1.15 0.28 0.30 1.67
TDN, kg/d 141 5.52 1.50 1.74 9.22
Dairy crossbred cattle
Feedlot, days 409 107 53.7 30.0 242
Initial body weight, kg 409 323 77.3 139 494
Final body weight, kg 409 429 87.5 206 661
ADG, kg/d 409 1.06 0.52 -0.13 2.64
Intake
Dry matter, kg/d 409 8.03 2.41 2.18 15.1
NDF, kg/d 265 2.86 1.17 0.65 6.14
iNDF, kg/d 30 0.98 0.26 0.42 1.44
Crude protein, kg/d 264 0.99 0.35 0.18 2.01
TDN, kg/d 138 5.64 1.63 2.53 9.45 N: number of experimental units; SD: standard deviation; ADG: average daily gain; NDF: neutral detergent fiber;
iNDF: indigestible NDF; TDN: total digestible nutrients.
The Pearson correlation coefficient
was used to measure the intensity of the linear
relationship between DMI and the other
quantitative variables. The correlation
analysis showed that the greatest coefficients
found were those that explained the linear
relationship between the DMI and the cattle
weights and performance, with positive and
significant coefficients (P<0.05). The
variables related to the diets (NDF and CP,
g/kg), not only had low correlation
coefficients, regardless of the genetic group
assessed, but the NDF did not present
significant coefficients (P>0.05) and CP was
only significant for the Zebu and dairy
crossbred genetic groups. In face of the
results of the Pearson correlation, the BW0.75
and ADG were adopted as variables to be
used in the DMI prediction models.
According to St-Pierre (2001), the
study effect need to be verified on the
database. Study effect was observed
(P<0.0001) and this was considered in the
further analysis.
Equations were developed to predict
DMI as a function of the genetic groups.

Nutrient Requirements of Zebu and Crossbred Cattle – BR-CORTE
24
Zebu cattle: DMI (kg/d) = – 1.7824 + 0.07765 × BW0.75 +
4.0415 × ADG – 0.8973 × ADG2
(R2 = 0.821) (Equation 2.1)
Beef crossbred cattle: DMI (kg/d) = – 0.6273 + 0.06453 × BW0.75 +
3.871 × ADG – 0.614 × ADG2
(R2 = 0.626) (Equation 2.2)
Dairy crossbred cattle: DMI (kg/d) = – 2.8836 + 0.08435 × BW0.75 +
4.5145 × ADG – 0.9631 × ADG2
(R2 = 0.788) (Equation 2.3)
The negative coefficient for the ADG2
(kg/d) variable for all the equations fitted
indicated that the DMI estimates presented a
plateau. The explanation for this fact may be
directly related to the energy concentration of
the diets used. Starting from the principle that
was to reach maximum ADG, the diet energy
concentration must have been high, inhibiting
DMI, that suggests the theory of energy intake
regulation proposed by Mertens (1994).
Considering the importance of this
effect, the NRC (2000) proposed equations
that included the NEm and NEm2 variables.
However, due to the practical difficulties of
determining NEm before knowing which
feeds will make up the diet, Thornton et al.
(1985) developed a model to predict DMI that
included initial body weight and days on
feedlot (DOF). According to these authors,
DMI is represented in the form of a curve
where the initial DMI increases gradually as a
function of DOF due to increase in the body
fat content of the feedlot animals. Fat starts to
concentrate slowly in the carcass at the
beginning of the feeding period, but
accumulates rapidly at the end of the feeding
period (Simpfendorfer, 1974).
VALIDATING DRY MATTER INTAKE
PREDICTION EQUATIONS
The research results from mean values
(independent experiments) published from
2005 until October 2014 in the Revista
Brasileira de Zootecnia, Boletim da Indústria
Animal, and the Arquivo Brasileiro de
Medicina Veterinária and Zootecnia
(complete references can be accessed in
Appendix 2.2 at www.brcorte.com.br/en)
were compiled and used to construct a
database to validate the DMI prediction
equations for Zebu cattle and beef and dairy
crossbred finishing on feedlot under tropical
conditions (Table 2.2).
Table 2.2 shows dispersion of the
variables used in the database to validate the
DMI prediction equations. The minimum and
maximum values for BW, ADG and DMI
indicate that a large number of diets was used.
It can be observed that the selection criterion
used was efficacious, permitting good
representativeness, because it did not interfere
in the mean values of the variables used to
develop the DMI prediction equations. It is
important to point out that in this database for
validation, there are data from different
Brazilian states that give larger representation
of the national herd.
The ratios obtained between the
observed and predicted values by the
equations as a function of the genetic groups:
Zebu, beef and dairy crossbred (Table 2.3),
show that the probability values both for the
intercept and slope do not differ (P>0.05)
from zero and 1, respectively, that is, the DMI
values (Table 2.3) predicted by the equations
developed are equivalent to the DMI observed
in practical beef cattle feeding conditions, on
feedlot under tropical conditions.
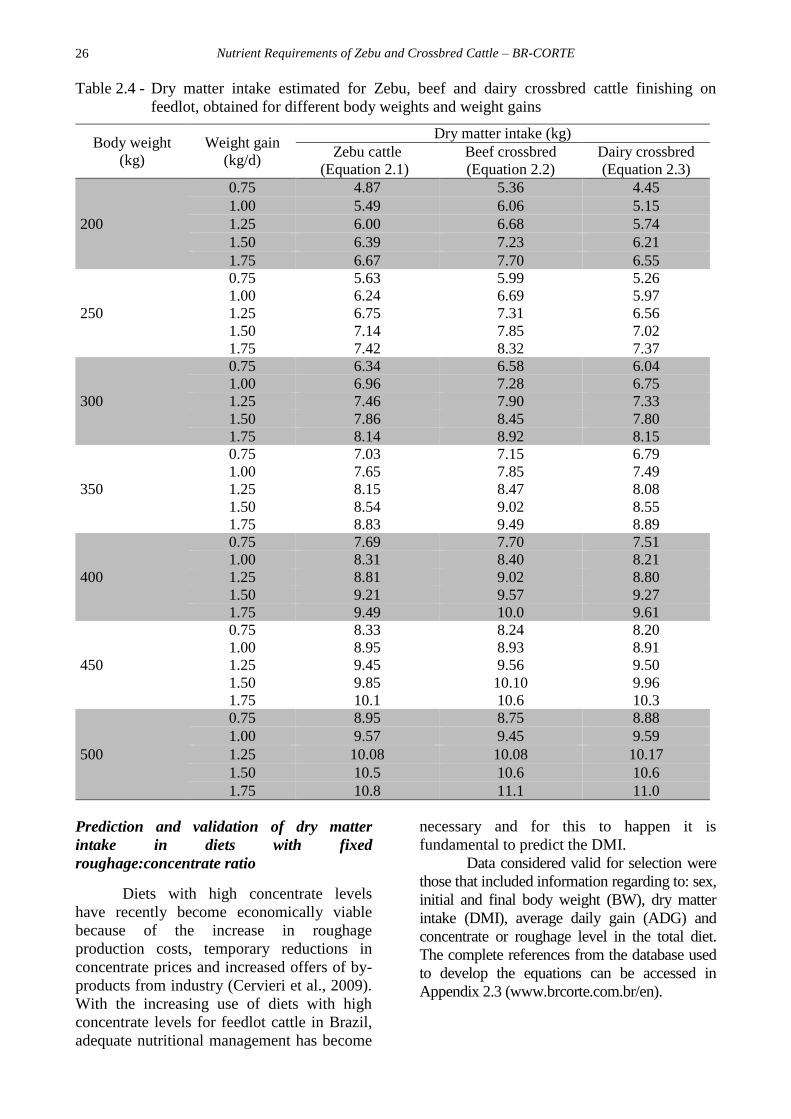
Table 2.4 shows the dry matter intake
estimated for Zebu, beef and dairy crossbred
cattle finished on feedlot, obtained for
different body weight and weight gains.

Regulation and prediction of dry matter intake
25
Table 2.2 - Descriptive statistics of the variables used to validate the equations developed to predict
dry matter intake for Zebu cattle, and beef and dairy crossbred cattle on feedlot
Variable N Mean SD Minimum Maximum
Zebu cattle
Feedlot, d 78 95.4 27.5 56.0 194
Initial body weight, kg 78 364 43.5 251 438
Final body weight, kg 78 479 37.2 404 583
ADG, kg/d 78 1.20 0.24 0.63 1.75
Dry matter intake, kg/d 78 8.79 1.06 6.04 10.8
Beef crossbred cattle
Feedlot, d 111 103 29.6 21.0 199
Initial body weight, kg 111 326 62.8 18 463
Final body weight, kg 111 464 48.2 340 579
ADG, kg/d 111 1.38 0.25 0.76 2.15
Dry matter intake, kg/d 111 8.83 1.44 6.11 12.7
Dairy crossbred cattle
Feedlot, d 48 81.8 12.3 56.0 102
Initial body weight, kg 48 259 94.4 67.9 380
Final body weight, kg 48 336 116 151 499
ADG, kg/d 48 0.95 0.38 0.14 1.72
Dry matter intake, kg/d 48 6.69 2.24 2.80 11.1 N: number of experimental units; SD: standard deviation; ADG: average daily gain.
Table 2.3 - Statistics for the ratio between the observed and predicted values by the equations for
Zebu, and beef and dairy crossbred cattle on feedlot
Variable Zebu Beef crossbred Dairy crossbred
Intercept -0.8375 -1.5386 0.6697
P-value1 (H0: a = 0) 0.5313 0.2022 0.0710
Slope 1.0759 1.1316 0.9449
P-value2 (H0: b = 1) 0.6108 0.3150 0.3112
r2 0.4085 0.4087 0.8704
Mean bias -0.1586 -0.3329 0.3189
CCC 0.5522 0.5262 0.9234
MSEP 0.6874 1.3306 0.7557
Decomposition of the MSEP
Mean bias 0.0252 (3.66%) 0.1108 (8.33%) 0.1017 (13.46%)
Systemic error 0.0023 (0.33%) 0.0113 (0.85%) 0.0146 (1.93%)
Random error 0.6600 (96.01%) 1.2085 (90.82%) 0.6395 (84.62%) CCC = concordance correlation coefficient; MSEP = mean square error of prediction; 1Probability value for the
hypothesis test where value of parameter a = 0 (Neter et al., 1996). 2 Probability value for hypothesis test where value of
parameter b = 1 (Neter et al., 1996)
Nutrient Requirements of Zebu and Crossbred Cattle – BR-CORTE
26
Table 2.4 - Dry matter intake estimated for Zebu, beef and dairy crossbred cattle finishing on
feedlot, obtained for different body weights and weight gains
Body weight
(kg)
Weight gain
(kg/d)
Dry matter intake (kg)
Zebu cattle
(Equation 2.1)
Beef crossbred
(Equation 2.2)
Dairy crossbred
(Equation 2.3)
200
0.75 4.87 5.36 4.45
1.00 5.49 6.06 5.15
1.25 6.00 6.68 5.74
1.50 6.39 7.23 6.21
1.75 6.67 7.70 6.55
250
0.75 5.63 5.99 5.26
1.00 6.24 6.69 5.97
1.25 6.75 7.31 6.56
1.50 7.14 7.85 7.02
1.75 7.42 8.32 7.37
300
0.75 6.34 6.58 6.04
1.00 6.96 7.28 6.75
1.25 7.46 7.90 7.33
1.50 7.86 8.45 7.80
1.75 8.14 8.92 8.15
350
0.75 7.03 7.15 6.79
1.00 7.65 7.85 7.49
1.25 8.15 8.47 8.08
1.50 8.54 9.02 8.55
1.75 8.83 9.49 8.89
400
0.75 7.69 7.70 7.51
1.00 8.31 8.40 8.21
1.25 8.81 9.02 8.80
1.50 9.21 9.57 9.27
1.75 9.49 10.0 9.61
450
0.75 8.33 8.24 8.20
1.00 8.95 8.93 8.91
1.25 9.45 9.56 9.50
1.50 9.85 10.10 9.96
1.75 10.1 10.6 10.3
500
0.75 8.95 8.75 8.88
1.00 9.57 9.45 9.59
1.25 10.08 10.08 10.17
1.50 10.5 10.6 10.6
1.75 10.8 11.1 11.0
Prediction and validation of dry matter
intake in diets with fixed
roughage:concentrate ratio
Diets with high concentrate levels
have recently become economically viable
because of the increase in roughage
production costs, temporary reductions in
concentrate prices and increased offers of by-
products from industry (Cervieri et al., 2009).
With the increasing use of diets with high
concentrate levels for feedlot cattle in Brazil,
adequate nutritional management has become
necessary and for this to happen it is
fundamental to predict the DMI.
Data considered valid for selection were
those that included information regarding to: sex,
initial and final body weight (BW), dry matter
intake (DMI), average daily gain (ADG) and
concentrate or roughage level in the total diet.
The complete references from the database used
to develop the equations can be accessed in
Appendix 2.3 (www.brcorte.com.br/en).

Regulation and prediction of dry matter intake
27
The descriptive statistic of the data used
to validate DMI prediction of cattle fed a fixed
concentrate level diet is shown in Table 2.5.
The following equations were obtained
for the genetic groups:
Zebu cattle:
DMI (kg/d) = – 1.303 + 0.0029 × CL –
0.00005 × CL2 + 0.0843 × BW0.75 + 2.243 ×
ADG – 0.271 × ADG2
(R2 = 0.797) (Equation 2.4)
Beef crossbred cattle: DMI (kg/d) = – 4.8196 + 0.0081 × CL –
0.00011 × CL2 + 0.1239 × BW0.75 + 2.8189 ×
ADG – 0.775 × ADG2
(R2 = 0.717) (Equation 2.5)
where: CL = concentrate level in the diet (%
total diet DM); BW0.75 = mean metabolic
body weight; ADG = average daily gain, in
kg/d.
Table 2.5 - Descriptive statistics of the variables used to develop dry matter intake prediction
equation for cattle fed fixed concentrate level diet
Item N Mean SD Minimum Maximum
Zebu cattle
Dry matter intake, kg/d 983 7.55 2.07 2.05 13.8
Body weight, kg 983 362 88.3 133 647
Metabolic body weight, kg 983 82.9 15.8 39.2 128.2
Average daily gain, kg/d 983 0.97 0.41 -0.14 2.26
Concentrate level, % 983 45.6 24.0 0.00 85.0
Beef crossbred cattle
Dry matter intake, kg/d 432 8.22 1.73 2.75 12.9
Body weight, kg 432 383 61.8 231 538
Metabolic body weight, kg 432 86.4 10.6 59.3 112
Average daily gain, kg/d 432 1.32 0.34 0.48 2.44
Concentrate level, % 432 61.9 21.6 25.0 100 N: number of experimental units; SD: standard deviation.
An independent database was used to
validate the results with 106 experimental units
for Zebu and 137 for beef crossbred (Table 2.6).
The data were obtained from publications
between 2005 and 2015 in the Revista Brasileira
de Zootecnia, Arquivo Brasileiro de Medicina
Veterinária e Zootecnia, Semina: Ciências
Agrárias, Acta Scientiarum: Animal Sciences,
Revista de Ciência Agronômica, Journal of
Animal Science and Boletim da Indústria Animal
and these references can be accessed in
Appendix 2.4 (www.brcorte.com.br/en).
When selecting this database, there was
no concern to establish selection for high-
concentrate diets, so, to verify the sensitivity of
the prediction model for different proportions of
concentrate in the diet were evaluated. This can
be seen in the descriptive statistics for the
validation database (Table 2.6).

Nutrient Requirements of Zebu and Crossbred Cattle – BR-CORTE
28
Table 2.6 - Descriptive statistics of the variables used to validate dry matter intake prediction by
cattle fed different concentrate level
Variable N Mean SD Minimum Maximum
Zebu cattle
Dry matter intake, kg/d 106 8.68 1.61 2.96 12.3
Body weight, kg 106 416 53.5 223 494
Metabolic body weight, kg 106 91.9 9.18 57.7 105
Average daily gain, kg/d 106 1.19 0.30 0.15 1.75
Concentrate level, % total diet DM 106 62.1 20.3 0.00 95.4
Beef crossbred cattle
Dry matter intake, kg/d 137 8.98 1.47 6.11 13.60
Body weight, kg 137 394 48.2 265 520
Metabolic body weight, kg 137 88.3 8.18 65.6 109
Average daily gain, kg/d 137 1.40 0.27 0.76 2.17
Concentrate level, % total diet DM 137 55.0 17.9 11.0 100
N: number of experimental units; SD: standard deviation.
The results observed in Table 2.7
indicated that the DMI prediction equation
with fixed concentrate content can be used
safely. Thus, considering that the diet
formulator knows which concentrate level
will be used in the diet, or has a fixed
roughage: concentrate ratio, the BR-CORTE
suggested that this equation can be used.
Table 2.7 - Statistics for the ratio between the observed and predicted values by the DMI
prediction equations for cattle fed with different concentrate level
Item Zebu cattle Beef crossbred cattle
Intercept -1.3568 0.9373
P-value1 (H0: a = 0) 0.0623 0.2379
Slope 1.1577 0.9390
P-value2 (H0: b = 1) 0.0582 0.5064
r2 0.6552 0.4377
Mean bias 0.0105 0.4144
Concordance correlation coefficient 0.7602 0.5920
Mean square prediction error 0.9254 1.3961
Decomposition of the mean square prediction error
Bias square 0.0001 (0.01%) 0.1717 (12.30%)
Systemic bias 0.0315 (3.41%) 0.0040 (0.29%)
Random errors 0.8938 (96.58%) 1.2203 (87.41%) 1 Probability value for the hypothesis test where the value of parameter a = 0 (Neter et al., 1996). 2 Probability value for
hypothesis test where the value of the parameter b = 1 (Neter et al., 1996)
Based on Equations 2.4 and 2.5, the
Table 2.8 shows the estimated dry matter
intake for Zebu and beef crossbred finishing
on feedlot obtained for different body weights
and weight gains, considering three
concentrate contents (30, 60 and 90%) in the
diet.

Regulation and prediction of dry matter intake
29
Table 2.8 - Dry matter intake for Zebu and beef crossbred cattle finishing on feedlot obtained for
different body weights and weight gains, considering three concentrate levels (30, 60
and 90%)
Body weight
(kg)
Weight gain
(kg/d)
Concentrate
(%)
Dry matter intake (kg)
Zebu
(Equation 2.4)
Beef crossbred
(Equation 2.5)
200
0.5
30 4.28 3.13
60 4.23 3.08
90 4.09 2.82
1.0
30 5.19 3.96
60 5.15 3.90
90 5.01 3.65
1.5
30 5.98 4.40
60 5.93 4.34
90 5.79 4.09
300
0.5
30 5.87 5.47
60 5.82 5.42
90 5.68 5.17
1.0
30 6.79 6.30
60 6.74 6.25
90 6.60 5.99
1.5
30 7.57 6.74
60 7.52 6.69
90 7.38 6.43
400
0.5
30 7.33 7.62
60 7.28 7.57
90 7.15 7.32
1.0
30 8.25 8.45
60 8.20 8.40
90 8.07 8.14
1.5
30 9.03 8.89
60 8.99 8.84
90 8.85 8.58
500
0.5
30 8.71 9.64
60 8.66 9.59
90 8.52 9.33
1.0
30 9.62 10.47
60 9.58 10.42
90 9.44 10.16
1.5
30 10.41 10.91
60 10.36 10.86
90 10.22 10.60
Prediction and validation of dry matter
intake by pasture-raised cattle receiving
supplementation
Brazil is a country with continental
dimensions, and it is the fifth in the world in
terms of territorial extension, with an area of
8.5 million km2 where 172.3 million hectares
are under pasture (IBGE, 2007). It also has
great diversity of climate and vegetation,
which along with the territorial extension
enables the beef production systems to be
characterized by using forage as the diet base.

Nutrient Requirements of Zebu and Crossbred Cattle – BR-CORTE
30
Most of the Brazilian beef production
system is obtained with animals on pasture
and only 11.1% were finished on feedlot
(ABIEC, 2014) of the 42 million cattle
slaughtered in Brazil in 2014 (Anualpec,
2015).
According to Paulino et al. (2005),
sustainable pasture use for beef cattle
production should be highlighted, because
these resources are the main and most
economical source of nutrients for the
animals.
Predicting intake for pasture-raised
cattle is not an easy task. In their revision,
Coleman et al. (1999) observed that the DMI
of cattle on pasture varies as a function of the
forage quality and physical characteristics and
also the physiological state of the animal.
According to Lardy et al. (2004), the
main limitation to establish DMI prediction
models for cattle on pasture is that the main
studies were carried out with indirect
estimates using external and internal markers
to predict the DMI. Furthermore, animals on
pasture are able to assess the forage available
and select a diet that meets their nutrient
needs (Coleman and Sollenberger, 2007;
Launchbaugh and Doherty, 2007). Thus their
selectivity ends up interfering in the
possibility of quantifying the diet chemical
composition of animals on pasture and
predicting exactly which nutrients are
ingested by these animals.
Therefore, it should be considered that
the DMI prediction estimates for cattle on
pasture are more complex than those for
animals on feedlot and good sense should
prevail when using the equations developed.
Pasture should be understood as a highly
complex production component because it
supplies substrates to the animal and can vary
qualitatively and quantitatively over the year,
influenced mainly by abiotic factors: e.g.,
rainfall, temperature and solar radiation
(Detmann et al., 2004).
Using tropical grasses as the only
protein and energy source is not feasible to
meet the nutrient requirements of growing or
finishing cattle (Moore, 1999) because
pastures do not usually contain all the
essential nutrients in adequate proportions to
meet the nutrient requirements of the animal.
Therefore, feeding systems combining base
forage and concentrate supplement are
necessary to make nutritional adjustment and
improve animal production on pasture.
Moore (1980) reported three possible
effects to be identified between
supplementation and forage intake: additive,
associative and substitutional. In the first,
forage intake remains constant, regardless of
the level of supplementation, but the total
intake increases at the same proportion as the
supplemented level; in the associative effect,
the total intake also increases, but forage
intake decreases; while in the substitutional,
the total intake remains constant, but forage
intake decreases and is substituted by
supplement intake.
The replacement effect obtained with
supplementation is directly proportional to the
forage quality, where it is greater with high-
quality compared to low-quality forage
(Minson, 1990). With replacement, values
lower than 1.0 g/g are assumed, and reduction
is observed in pasture intake, but there is
increase in total intake (Costa et al., 2011).
Considering the importance of the
DMI estimate for pasture-raised cattle under
tropical conditions receiving supplementation,
the specific prediction model is recommended
that takes into consideration the supplement
intake (SI, kg/d). The database used to
develop this equation and the complete
references can be accessed in appendix 2.5 in
www.brcorte.com.br/en.
Wide variation in the data was
observed in the information regarding the
descriptive statistics of the database (Table
2.9), so that prediction equations could be
generated for more varied production
systems.
Regulation and prediction of dry matter intake
31
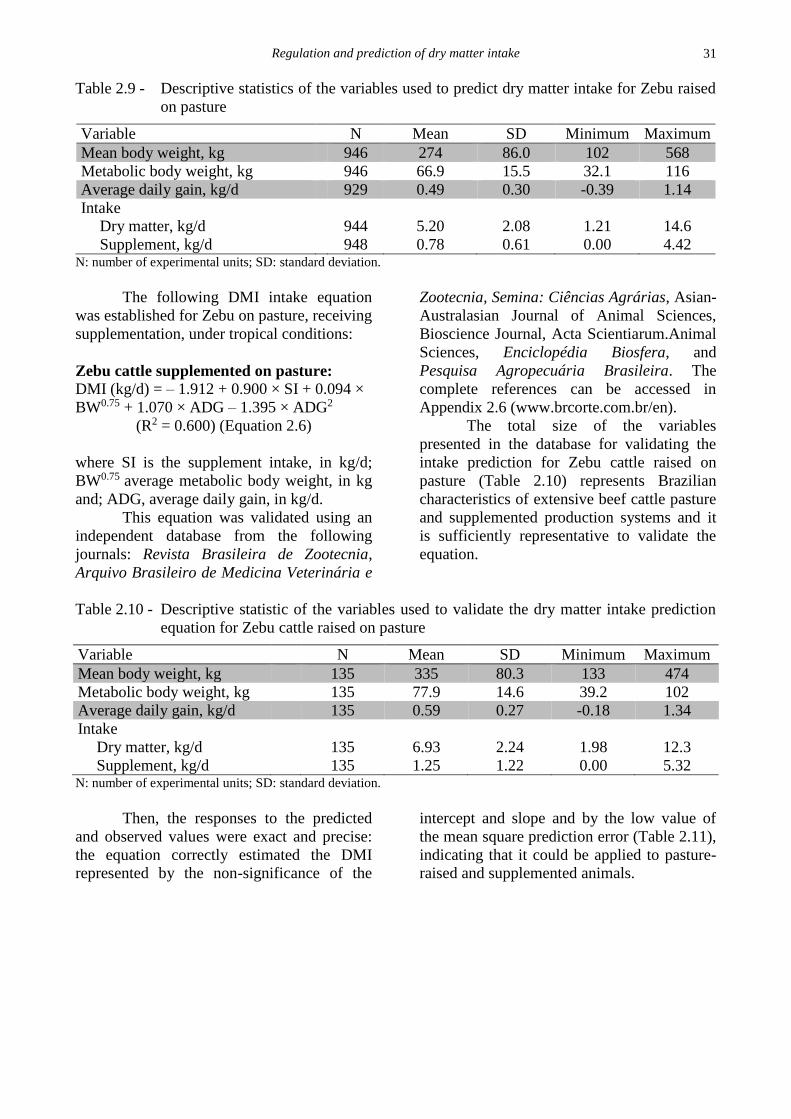
Table 2.9 - Descriptive statistics of the variables used to predict dry matter intake for Zebu raised
on pasture
Variable N Mean SD Minimum Maximum
Mean body weight, kg 946 274 86.0 102 568
Metabolic body weight, kg 946 66.9 15.5 32.1 116
Average daily gain, kg/d 929 0.49 0.30 -0.39 1.14
Intake
Dry matter, kg/d 944 5.20 2.08 1.21 14.6
Supplement, kg/d 948 0.78 0.61 0.00 4.42 N: number of experimental units; SD: standard deviation.
The following DMI intake equation
was established for Zebu on pasture, receiving
supplementation, under tropical conditions:
Zebu cattle supplemented on pasture: DMI (kg/d) = – 1.912 + 0.900 × SI + 0.094 ×
BW0.75 + 1.070 × ADG – 1.395 × ADG2
(R2 = 0.600) (Equation 2.6)
where SI is the supplement intake, in kg/d;
BW0.75 average metabolic body weight, in kg
and; ADG, average daily gain, in kg/d.
This equation was validated using an
independent database from the following
journals: Revista Brasileira de Zootecnia,
Arquivo Brasileiro de Medicina Veterinária e
Zootecnia, Semina: Ciências Agrárias, Asian-
Australasian Journal of Animal Sciences,
Bioscience Journal, Acta Scientiarum.Animal
Sciences, Enciclopédia Biosfera, and
Pesquisa Agropecuária Brasileira. The
complete references can be accessed in
Appendix 2.6 (www.brcorte.com.br/en).
The total size of the variables
presented in the database for validating the
intake prediction for Zebu cattle raised on
pasture (Table 2.10) represents Brazilian
characteristics of extensive beef cattle pasture
and supplemented production systems and it
is sufficiently representative to validate the
equation.
Table 2.10 - Descriptive statistic of the variables used to validate the dry matter intake prediction
equation for Zebu cattle raised on pasture
Variable N Mean SD Minimum Maximum
Mean body weight, kg 135 335 80.3 133 474
Metabolic body weight, kg 135 77.9 14.6 39.2 102
Average daily gain, kg/d 135 0.59 0.27 -0.18 1.34
Intake
Dry matter, kg/d 135 6.93 2.24 1.98 12.3
Supplement, kg/d 135 1.25 1.22 0.00 5.32 N: number of experimental units; SD: standard deviation.
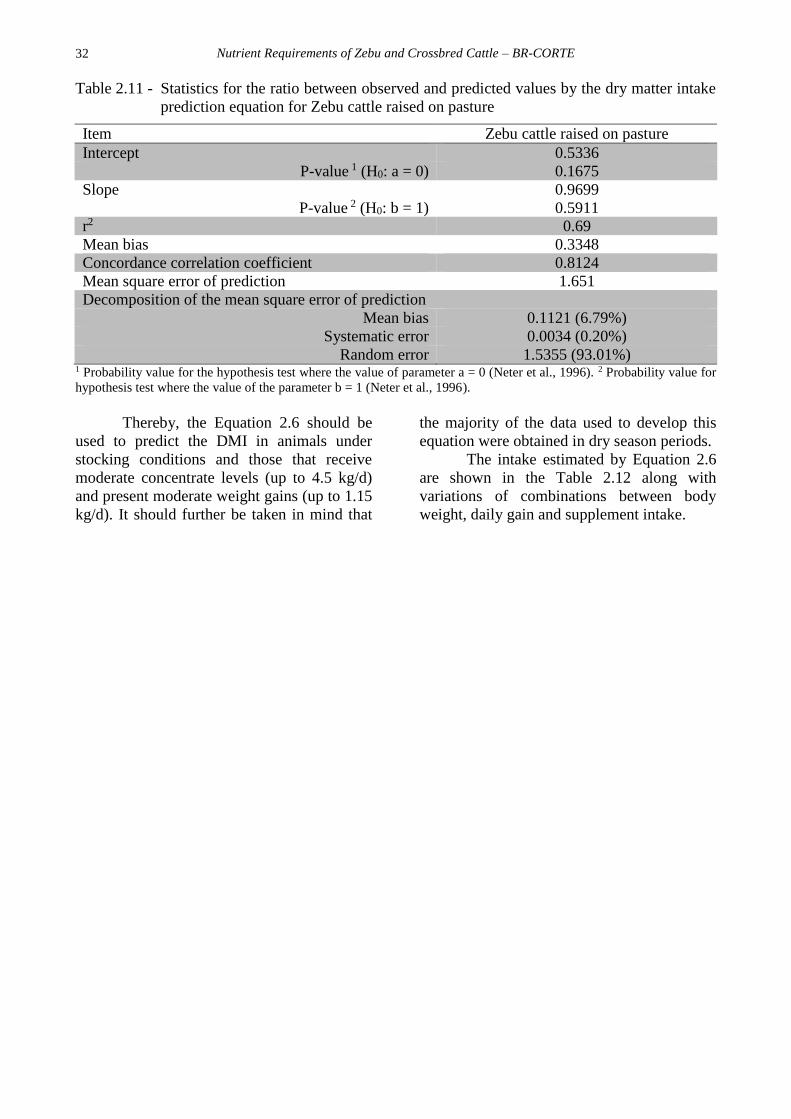
Then, the responses to the predicted
and observed values were exact and precise:
the equation correctly estimated the DMI
represented by the non-significance of the
intercept and slope and by the low value of
the mean square prediction error (Table 2.11),
indicating that it could be applied to pasture-
raised and supplemented animals.
Nutrient Requirements of Zebu and Crossbred Cattle – BR-CORTE
32
Table 2.11 - Statistics for the ratio between observed and predicted values by the dry matter intake
prediction equation for Zebu cattle raised on pasture
Item Zebu cattle raised on pasture
Intercept 0.5336
P-value 1 (H0: a = 0) 0.1675
Slope 0.9699
P-value 2 (H0: b = 1) 0.5911
r2 0.69
Mean bias 0.3348
Concordance correlation coefficient 0.8124
Mean square error of prediction 1.651
Decomposition of the mean square error of prediction
Mean bias 0.1121 (6.79%)
Systematic error 0.0034 (0.20%)
Random error 1.5355 (93.01%) 1 Probability value for the hypothesis test where the value of parameter a = 0 (Neter et al., 1996). 2 Probability value for
hypothesis test where the value of the parameter b = 1 (Neter et al., 1996).
Thereby, the Equation 2.6 should be
used to predict the DMI in animals under
stocking conditions and those that receive
moderate concentrate levels (up to 4.5 kg/d)
and present moderate weight gains (up to 1.15
kg/d). It should further be taken in mind that
the majority of the data used to develop this
equation were obtained in dry season periods.
The intake estimated by Equation 2.6
are shown in the Table 2.12 along with
variations of combinations between body
weight, daily gain and supplement intake.

Regulation and prediction of dry matter intake
33
Table 2.12 - Dry matter intake (DMI) estimated for grass-finishing cattle with different body
weights, weight gains and supplement intake (SI)
Body weight (kg) Weight gain (kg/d) SI (kg/d) DMI Eq. 2.6
200
0.00
0.00 3.09
0.80 3.81
1.60 4.53
0.50
0.00 3.27
0.80 3.99
1.60 4.71
1.00
0.00 2.76
0.80 3.48
1.60 4.20
300
0.00
0.00 4.86
1.20 5.94
2.40 7.02
0.50
0.00 5.05
1.20 6.13
2.40 7.21
1.00
0.00 4.54
1.20 5.62
2.40 6.70
400
0.00
0.00 6.50
1.60 7.94
3.20 9.38
0.50
0.00 6.68
1.60 8.12
3.20 9.56
1.00
0.00 6.17
1.60 7.61
3.20 9.05
500
0.00
0.00 8.03
2.00 9.83
4.00 11.6
0.50
0.00 8.21
2.00 10.0
4.00 11.8
1.00
0.00 7.70
2.00 9.50
4.00 11.3
DEVELOPMENT OF EQUATIONS TO
PREDICT RESIDUAL FEED INTAKE
AND RESIDUAL WEIGHT GAIN OF
ZEBU IN BRAZIL
Brazil has an outstanding position as a
supplier of animal protein to the world
population. In recent years, it has been the
biggest or second-biggest exporter of beef and
has the biggest commercial cattle herd in the
world (about 200 million head) (Anualpec,
2015).
Brazilian beef cattle system has gone
through deep transformations in the domestic
market, mainly from the moment when
competitiveness and market demands
increased for sustainable meat production,
under all aspects (economic, social and
environmental) and also for cheap high
quality beef production, that are now

Nutrient Requirements of Zebu and Crossbred Cattle – BR-CORTE
34
understood as nutritional and feed safety
qualities.
To adapt to these changes,
entrepreneurs in the agricultural sector have
become increasingly required to use
technologies coherent with the biological,
social and economic environments, ensuring
sustainable development, feed safety and
production conciliated with environmental
conservation.
To reach this aim, efficiency must be
increased in the cattle production systems to
ensure productivity increases and fewer
environmental impacts, that is, there is no
demand for just meat production but rather for
feed with high aggregated value, produced at
low costs and environmentally correct, with
low greenhouse gas and residue emission,
without needing to use areas currently
occupied with native vegetation or destined
for grain production.
Due to new challenges to increase
efficiency in the sustainable meat production
system, the efficiency of nutrient use in the
diet is important. The efficient use of
nutrients in the diet is one of the premises of
sustainable animal production systems,
because this approach could minimize or even
prevent excessive nutrient losses that are
damaging to the environment and affect the
economic feasibility of raising cattle.
Therefore, selecting individuals that
are genetically superior with regard to feed
efficiency becomes urgent. Lastly, knowledge
of DMI and the nutrient requirements of the
cattle are the basis of precision nutrition
because diets that are properly balanced with
respect to daily energy, protein and mineral
needs result in rational feed use and
consequently contribute to minimizing
environmental impacts and production costs.
Thereby, optimizing the competiveness, profit
and sustainability of raising beef cattle, and
also knowing how to select the best
individuals using these tools is a task that has
been developed in a different way by many
ranchers.
Information on residual feed intake
(RFI) has been used as an alternative
approach to identify more efficient animals in
beef cattle genetic breeding programs in
Brazil. However, according to Berry and
Crowley (2012), RFI is not correlated with
ADG, and although RFI may be a good
indicator of feed efficiency, it cannot be
accepted by all producers. The authors
affirmed that selecting the best individuals
based on RFI may result in the selection of
slow-growing individuals that consume
relatively small quantities of DM. Residual
body weight gain (RG) (Crowley et al., 2010)
is similar to the RFI but has the disadvantage
of selecting individuals with fast growth rates
that nonetheless consume large quantities of
dry matter. Considering the inconveniences of
each one of these factors, Berry and Crowley
(2012) proposed an index named residual
intake and body weight gain (RIG) that would
consider the following equation: RIG = –RFI
+ RG.
For this proposal to impact the
breeding of the Brazilian herd, DMI and ADG
prediction models that can be used reliably by
breeders are needed. Based on the database of
Zebu animals (Table 2.1), Zebu DMI and
ADG prediction models were developed in
Brazil as follows:
DMI (kg/d) = –1.5187 + 0.07941 × BW0.75 +
2.6519 × ADG
(R2 = 0.813) (Equation 2.7)
ADG (kg/d) = 0.3285 – 0.01113 × BW0.75 +
0.2041 × DMI
(R2 = 0.598) (Equation 2.8)
To verify the RFI and RG value
distribution in the database, ratios were
established between RFI and weight gain
(Figure 2.1) and between RG and weight gain
(Figure 2.2).
Differences were observed when using
RFI, RG or RIG values to select the 10% best
animals present in the database (Table 2.13).

Regulation and prediction of dry matter intake
35
Figure 2.1 - Residual feed intake as a function of weight gain of Zebu cattle.
Figure 2.2 - Residual weight gain as a function of dry matter intake of Zebu cattle.
Nutrient Requirements of Zebu and Crossbred Cattle – BR-CORTE
36
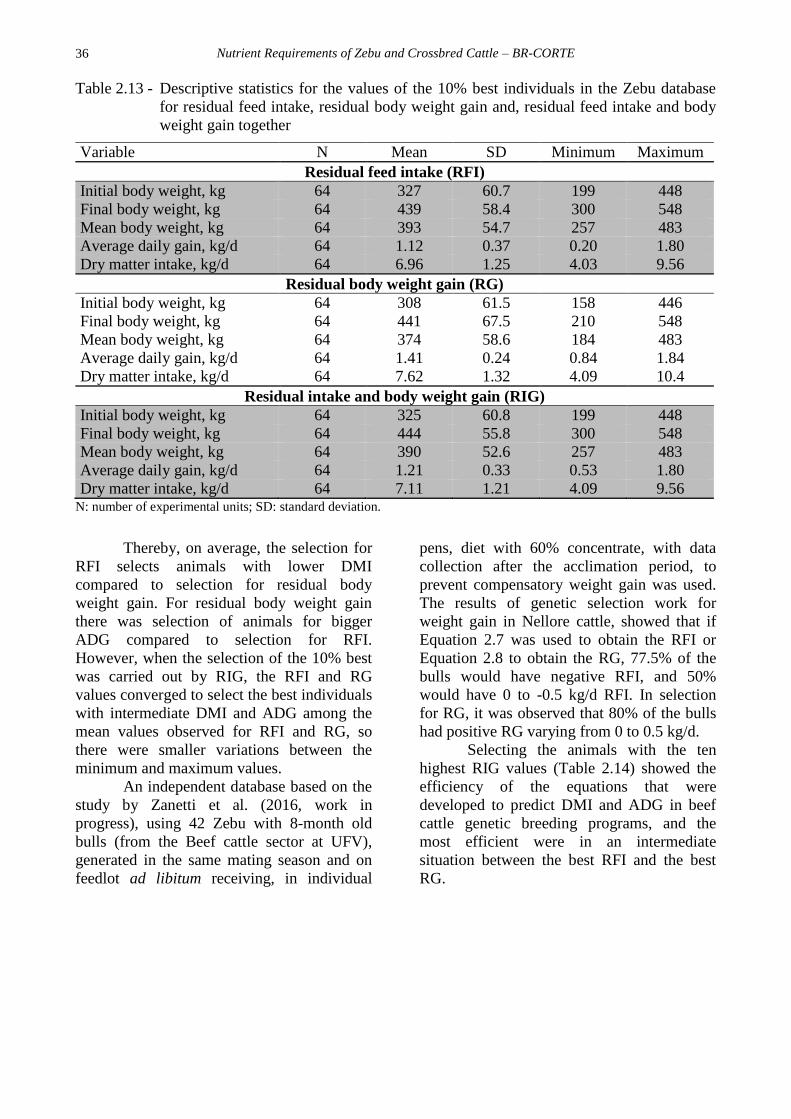
Table 2.13 - Descriptive statistics for the values of the 10% best individuals in the Zebu database
for residual feed intake, residual body weight gain and, residual feed intake and body
weight gain together
Variable N Mean SD Minimum Maximum
Residual feed intake (RFI)
Initial body weight, kg 64 327 60.7 199 448
Final body weight, kg 64 439 58.4 300 548
Mean body weight, kg 64 393 54.7 257 483
Average daily gain, kg/d 64 1.12 0.37 0.20 1.80
Dry matter intake, kg/d 64 6.96 1.25 4.03 9.56
Residual body weight gain (RG)
Initial body weight, kg 64 308 61.5 158 446
Final body weight, kg 64 441 67.5 210 548
Mean body weight, kg 64 374 58.6 184 483
Average daily gain, kg/d 64 1.41 0.24 0.84 1.84
Dry matter intake, kg/d 64 7.62 1.32 4.09 10.4
Residual intake and body weight gain (RIG)
Initial body weight, kg 64 325 60.8 199 448
Final body weight, kg 64 444 55.8 300 548
Mean body weight, kg 64 390 52.6 257 483
Average daily gain, kg/d 64 1.21 0.33 0.53 1.80
Dry matter intake, kg/d 64 7.11 1.21 4.09 9.56 N: number of experimental units; SD: standard deviation.
Thereby, on average, the selection for
RFI selects animals with lower DMI
compared to selection for residual body
weight gain. For residual body weight gain
there was selection of animals for bigger
ADG compared to selection for RFI.
However, when the selection of the 10% best
was carried out by RIG, the RFI and RG
values converged to select the best individuals
with intermediate DMI and ADG among the
mean values observed for RFI and RG, so
there were smaller variations between the
minimum and maximum values.
An independent database based on the
study by Zanetti et al. (2016, work in
progress), using 42 Zebu with 8-month old
bulls (from the Beef cattle sector at UFV),
generated in the same mating season and on
feedlot ad libitum receiving, in individual
pens, diet with 60% concentrate, with data
collection after the acclimation period, to
prevent compensatory weight gain was used.
The results of genetic selection work for
weight gain in Nellore cattle, showed that if
Equation 2.7 was used to obtain the RFI or
Equation 2.8 to obtain the RG, 77.5% of the
bulls would have negative RFI, and 50%
would have 0 to -0.5 kg/d RFI. In selection
for RG, it was observed that 80% of the bulls
had positive RG varying from 0 to 0.5 kg/d.
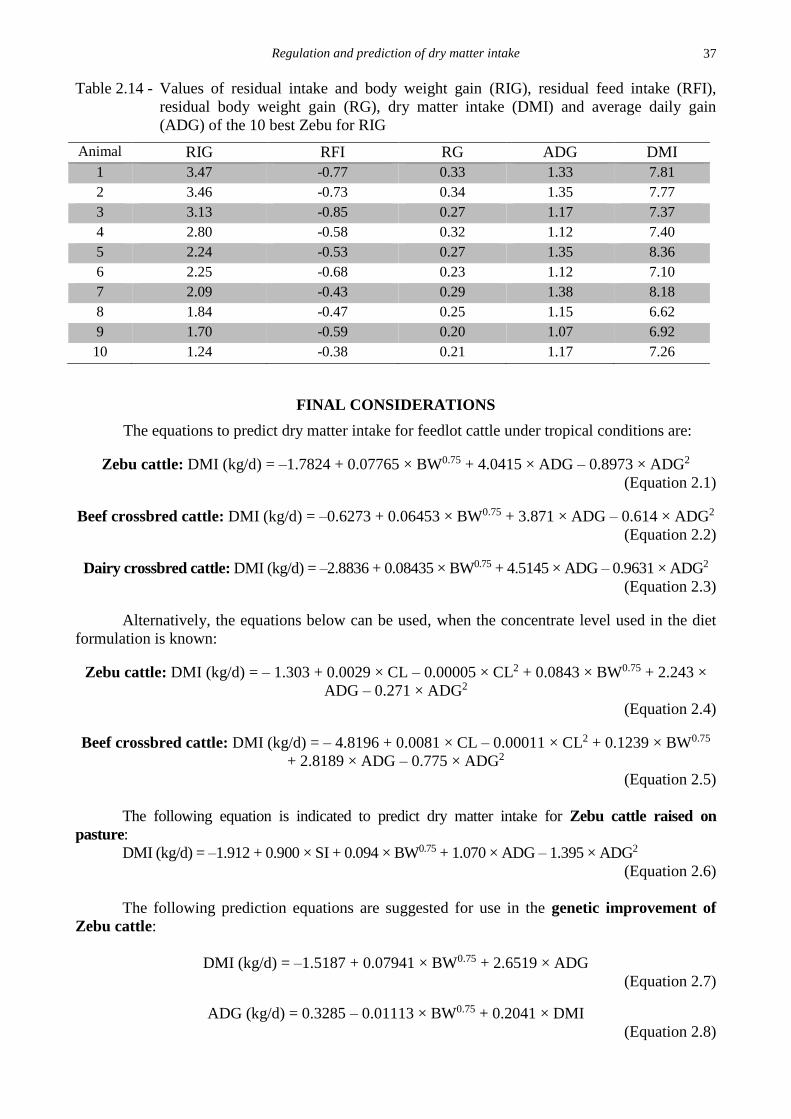
Selecting the animals with the ten
highest RIG values (Table 2.14) showed the
efficiency of the equations that were
developed to predict DMI and ADG in beef
cattle genetic breeding programs, and the
most efficient were in an intermediate
situation between the best RFI and the best
RG.
Regulation and prediction of dry matter intake
37
Table 2.14 - Values of residual intake and body weight gain (RIG), residual feed intake (RFI),
residual body weight gain (RG), dry matter intake (DMI) and average daily gain
(ADG) of the 10 best Zebu for RIG
Animal RIG RFI RG ADG DMI
1 3.47 -0.77 0.33 1.33 7.81
2 3.46 -0.73 0.34 1.35 7.77
3 3.13 -0.85 0.27 1.17 7.37
4 2.80 -0.58 0.32 1.12 7.40
5 2.24 -0.53 0.27 1.35 8.36
6 2.25 -0.68 0.23 1.12 7.10
7 2.09 -0.43 0.29 1.38 8.18
8 1.84 -0.47 0.25 1.15 6.62
9 1.70 -0.59 0.20 1.07 6.92
10 1.24 -0.38 0.21 1.17 7.26
FINAL CONSIDERATIONS
The equations to predict dry matter intake for feedlot cattle under tropical conditions are:
Zebu cattle: DMI (kg/d) = –1.7824 + 0.07765 × BW0.75 + 4.0415 × ADG – 0.8973 × ADG2
(Equation 2.1)
Beef crossbred cattle: DMI (kg/d) = –0.6273 + 0.06453 × BW0.75 + 3.871 × ADG – 0.614 × ADG2
(Equation 2.2)
Dairy crossbred cattle: DMI (kg/d) = –2.8836 + 0.08435 × BW0.75 + 4.5145 × ADG – 0.9631 × ADG2
(Equation 2.3)
Alternatively, the equations below can be used, when the concentrate level used in the diet
formulation is known:
Zebu cattle: DMI (kg/d) = – 1.303 + 0.0029 × CL – 0.00005 × CL2 + 0.0843 × BW0.75 + 2.243 ×
ADG – 0.271 × ADG2
(Equation 2.4)
Beef crossbred cattle: DMI (kg/d) = – 4.8196 + 0.0081 × CL – 0.00011 × CL2 + 0.1239 × BW0.75
+ 2.8189 × ADG – 0.775 × ADG2
(Equation 2.5)
The following equation is indicated to predict dry matter intake for Zebu cattle raised on
pasture:
DMI (kg/d) = –1.912 + 0.900 × SI + 0.094 × BW0.75 + 1.070 × ADG – 1.395 × ADG2
(Equation 2.6)
The following prediction equations are suggested for use in the genetic improvement of
Zebu cattle:
DMI (kg/d) = –1.5187 + 0.07941 × BW0.75 + 2.6519 × ADG
(Equation 2.7)
ADG (kg/d) = 0.3285 – 0.01113 × BW0.75 + 0.2041 × DMI
(Equation 2.8)
Nutrient Requirements of Zebu and Crossbred Cattle – BR-CORTE
38
ACKNOWLEDGMENT
We would like to thank professor Danilo
Domingues Millen of the Universidade Estadual
Paulista – Campus Dracena (UNESP), professor
Telma Berchielli of the Universidade Estadual
Paulista – Campus Jaboticabal (UNESP),
professor Ivanor Nunes do Prado of the
Universidade Estadual de Maringá (UEM), and
professor Fabiano Alvim Barbosa of the
Veterinary School at the Universidade Federal
de Minas Gerais (EV- UFMG) by providing data
of individual intake of cattle from researches in
these Institutions.
REFERENCES
Associação Brasileira das Indústrias exportadoras
de Carne – ABIEC. Exportações Brasileiras
de Carne Bovina. 2014. Disponível em:
http://www.abiec.com.br/texto.asp?id=8.
Acesso em 23 de junho de 2016.
Agricultural and Food Research Council –
AFRC. Energy and protein requirements of
ruminants. CAB International. Wallingford.
Oxon. UK. 159p. 1993.
Allen. D. Rationing Beef Cattle. Chalcombe
Publications. Church Lane. Kingston. UK. 79
p. 1992.
Allen. M. S. Effects of diet on short-term
regulation of feed intake by lactating dairy
cattle. Journal of Dairy Science. 83:1598-
1624. 2000.
Allen. M. S. Physical constraints on voluntary
intake of forages by ruminants. Journal of
Animal Science. 74:3063-3075. 1996.
Allen. M. S.; Bradford. B. J.; Harvatine. K. J.
The cow as a model to study food intake
regulation. Annual Review of Nutrition.
25:523-547. 2005.
Alvares. C. A.; Stape. J. L.; Sentelhas. P. C.; De
Moraes. G.; Leonardo. J.; Sparovek. G.
Köppen’s climate classification map for
Brazil. Meteorologische Zeitschrift. 22:711-
728. 2013.
Anand. B. K.; Brobeck. J. R. Localization of a
"feeding center" in the hypothalamus of the
rat. Proceedings of the Society for
Experimental Biology and Medicine. 77:323-
324. 1951.
Anele. U. Y.; Domby. E. M.; Galyean. M. L.
Predicting dry matter intake by growing and
finishing beef cattle: Evaluation of current
methods and equation development. Journal
of Animal Science. 92:2660-2667. 2014.
ANUALPEC – Anuário da Pecuária Brasileira.
22 Ed. São Paulo: Instituto FNP. 280 p. 2015.
Bell. C. G.; Walley. A. J.; Froguel. P. The
genetics of human obesity. Nature Reviews
Genetics. 6:221-234. 2005.
Berry. D. P.; Crowley. J. J. Residual intake and
body weight gain: a new measure of
efficiency in growing cattle. Journal of
Animal Science. 90:109-115. 2012.
Beef cattle Nutrient Requirements Model– BCNRM.
Nutrient Requirements of Beef Cattle. Eighth
Revised Edition. Washington. D.C: The National
Academies Press. 494 p. 2016.
BRASIL. Ministério da Agricultura. Portaria 51. de
24 de maio de 1991. Proíbe a produção.
importação. comercialização e uso de substâncias
naturais ou artificiais. com atividade
anabolizante. ou outras. dotadas dessa atividade
para fins de crescimento e ganho de peso dos
animais de abate. Diário Oficial. Brasília. 1991.
Cervieri. R. C.; Carvalho. J. C. F.; Martins. C. L.
Evolução do manejo nutricional nos
confinamentos brasileiros: importância da
utilização de subprodutos da agroindústria em
dietas de maior inclusão de concentrado. In:
Simpósio Internacional de Nutrição de
Ruminantes – Recentes avanços na nutrição de
bovinos confinados. Botucatu. 2009. Anais...
Botucatu: Simpósio de Nutrição de Ruminantes.
2-22. 2009.
Choi. B. R.; Palmquist. D. L. High fat diets
increase plasma cholecystokinin and
pancreatic polypeptide. and decrease plasma
insulin and feed intake in lactating cows. The
Journal of Nutrition. 126:2913-2919. 1996.
Coleman S. W.; Sollenberger. L. E. Plant-
herbivore interactions. In: Barnes. R. F.;
Nelson. C. J.; Lick. C. W. (Ed.) Forages: The
Science of Grassland Agriculture. Blackwell
Publishing. Ames. I.A.. 2:123-136. 2007.
Coleman. S. W.; Lippke. H.; Gill. M. Estimating
the nutritive potential of forages. In: Jung. H.
G.. Fahey Jr.. C. G. (Ed.) Nutritional ecology
of herbivores: Proc. Vth Int. Symp. Nutr.
Herbivores. Am. Soc. Anim. Sci.. Savoy. IL.
647–695. 1999.
Costa. V. A. C.; Detmann. E.; Paulino. M. F.;
Valadares Filho. S. C.; Carvalho. I. P. C.;
Monteiro. L. P. Consumo e digestibilidade em
bovinos em pastejo durante o período das
Regulation and prediction of dry matter intake
39
águas sob suplementação com fontes de
compostos nitrogenados e de carboidratos.
Revista Brasileira de Zootecnia. v. 40. n. 8.
p.1788-1798. 2011.
Crespo. C. S.; Cachero. A. P.; Jiménez. L. P.;
Barrios. V.; Ferreiro. E. A. Peptides and food
intake. Front Endocrinol (Lausanne). 5:58.
2014.
Crowley. J. J.; Mcgee. M.; Kenny. D. A.; Crews
Jr. D. H.; Evans. R. D.; Berry. D. P.
Phenotypic and genetic parameters for
different measures of feed efficiency in
different breeds of Irish performance-tested
beef bulls. Journal of Animal Science. 88:885-
894. 2010.
Currie. P. J.; Mirza. A.; Fuld. R.; Park. D.;
Vasselli. J. R. Ghrelin is an orexigenic and
metabolic signaling peptide in the arcuate and
paraventricular nuclei. American Journal of
Physiology-Regulatory. Integrative and
Comparative Physiology. 289:R353-R358.
2005.
Detmann. E. Fibra na nutrição de novilhas
leiteiras. In: Pereira. E. S.. Pimentel. P. G..
Queiroz. A. C.. Mizubuti. I. Y. (Ed.).
Novilhas leiteiras. Gráfica: Fortaleza. 253–
302. 2010.
Detmann. E.; Paulino. M. F.; Zervoudakis. J. T.;
Cecon. P. R.; Valadares Filho. S. C.;
Gonçalves. L. C.; Cabral. L. S.; Melo. A. J. N.
Níveis de proteína bruta em suplementos
múltiplos para terminação de novilhos
mestiços em pastejo durante a época seca:
desempenho produtivo e características de
carcaça. Revista Brasileira de Zootecnia.
33:169-180. 2004.
Detmann. E.; Queiroz. A. C. D.; Cecon. P. R.;
Zervoudakis. J. T.; Paulino. M. F.; Valadares
Filho. S. C.; Cabral. L. S.; Lana. R. P.
Consumo de fibra em detergente neutro por
bovinos em confinamento. Revista Brasileira
de Zootecnia. 32:1763-1777. 2003.
Detmann. E.; Gionbelli. M. P.; Huhtanen. P. A.
meta-analytical evaluation of the regulation of
voluntary intake in cattle fed tropical forage-
based diets. Journal of Animal Science.
92:4632-4641. 2014.
Dietrich. M. O.; Horvath. T. L. Feeding signals
and brain circuitry. European Journal of
Neuroscience. 30:1688-1696. 2009.
Forbes. J. M. A personal view of how ruminant
animals control their intake and choice of
food: minimal total discomfort. Nutrition
Research Reviews. 20:132-146. 2007.
Forbes. J. M.; Provenza. F. D. Integration of
learning and metabolic signals into a theory of
dietary choice and food intake. In: Cronje. P.
(Ed.) Ruminant Physiology: Digestion.
Metabolism. Growth and Reproduction. CAB
International. Wallingford. U.K. 3-19. 2000.
Fox. D. G.; Sniffen. C. J.; O´Conner. J. D.
Adjusting nutrient requirements of beef cattle
for animal and environmental variations.
Journal of Animal Science. 66:1475-1495.
1988.
Galyean. M. L.; Dilorenzo. N.; McMeniman. J.
P.; Defoor. P. J. Alpharma beef cattle
nutrition symposium: Predictability of feedlot
cattle growth performance. Journal of Animal
Science. 89:1865-1872. 2011.
Galyean. M. L.; Hubbert. M. E. Predicting intake
by beef cattle–Relationship of dry matter
intake to initial weight. Clayton Livest. Res.
Ctr. Prog. Rep. 80. 1992.
Galyean. M. L; Goetsch. A. L. Utilization of
forage fiber by ruminants. In: Jung. H. G.;
Buxton. D. R.; Hatfield. R. D.; Ralph. J. (Ed.)
Forage cell wall structure and digestibility.
Madison: ASA. CSSA. SSSA. 33-71. 1993.
Grant. A. L.; Helferich. W. G. An overview of
growth. In: Pearson. A. M.; Dutson. T. R.
(Eds.). Growth regulation in farm animals.
London: Elsevier Applied Science. 1-15.
1991.
Harper. K. J.; McNeill. D. M. The Role iNDF in
the Regulation of Feed Intake and the
Importance of Its Assessment in Subtropical
Ruminant Systems (the Role of iNDF in the
Regulation of Forage Intake). Agriculture.
5:778-790. 2015.
Hetherington. A. W.; Ranson. S. W.
Hypothalamic lesions and adiposity in the rat.
The Anatomical Record. 78:149-172. 1940.
Huhtanen. P.; Rinne. M.; Nousiainen. J.
Evaluation of the factors affecting silage
intake of dairy cows: A revision of the
relative silage dry matter intake index.
Animal. 1:758–770. 2007.
Huuskonen. A.; Huhtanen. P.; Joki-Tokola. E.
The development of a model to predict feed
intake by growing cattle. Livestock Science.
158:74-83. 2013.

Nutrient Requirements of Zebu and Crossbred Cattle – BR-CORTE
40
Instituto Brasileiro de Geografia e Estatística –
IBGE. Censo agropecuário 1920/2006. Até
1996. dados extraídos de: Estatística do
Século XX. Rio de Janeiro: IBGE. 2007.
Disponível em:
http://seriesestatisticas.ibge.gov.br/series.aspx
?vcodigo=AGRO02. Access in June. 20th.
2015.
Ingvartsen. K. L.; Andersen. H. R.; Foldager. J.
Random variation in voluntary dry matter
intake and the effect of day length on feed
intake capacity in growing cattle. Acta
Agriculturae Scandinavica A – Animal
Sciences. 42:121-126. 1992.
Jorge. A. M.; Fontes. C. A. A.; Soares. J. E..
Freitas. J. D.; Rodrigues. L. R. R.; Queiroz. A.
C.; Resende. F. D. Características
quantitativas da carcaça de bovinos e
bubalinos. abatidos em diferentes estádios de
maturidade. Revista Brasileira de Zootecnia.
26:1039-1047. 1997.
Keady. T.; Mayne. C.; Kilpatrick. D. An
evaluation of five models commonly used to
predict food intake of lactating dairy cattle.
Livestock Production Science. 89:129-138.
2004.
Konturek. P. C.; Konturek. J. W.; Czesnikiewicz-
Guzik. M.; Brzozowski. T.; Sito. E.;
Konturek. S. J. Neuro-hormonal control of
food intake: basic mechanisms and clinical
implications. Journal of Physiology and
Pharmacology: An Official Journal of the
Polish Physiological Society. 56:5-25. 2005.
Lage. I. N. K.; Paulino. P. V. R.; Pires. C. V.;
Villela. S. D. J.; Duarte. M. S.; Valadares
Filho. S. C.; Paulino. M. F.; Maia. B. A.;
Silva. L. H. P.; Teixeira. C. R. V. Intake.
digestibility. performance. and carcass traits
of beef cattle of different gender. Tropical
Animal Health and Production. 44:361-367.
2012.
Lardy. G. P.; Adams. D. C.; Klopfenstein. T. J.;
Patterson. H. H. Building beef cow nutritional
programs with the 1996 NRC beef cattle
requirements model. Journal of Animal
Science. 82:E83-E92. 2004.
Launchbaugh. K. L.; Dougherty. C. T. Grazing
animal Behavior. In: Barnes. R. F.; Nelson. C.
J.; Lick. C. W. (Ed.) Forages: The Science of
Grassland Agriculture. v. 2. n.6. Blackwell
Publishing. Ames. IA. 675–686. 2007.
Lazzarini. I.; Detmann. E.; Sampaio. C. B.;
Paulino. M. F.; Valadares Filho. S. C.; Souza.
M. A.; Oliveira. F. A. Dinâmicas de trânsito e
degradação da fibra em detergente neutro em
bovinos alimentados com forragem tropical de
baixa qualidade e compostos nitrogenados.
Arquivo Brasileiro de Medicina Veterinária.
61:635-647. 2009.
Leek. B.F. Sensory receptors in the ruminant
alimentary tract. In: Milligan. L. P.; Grovum.
W. L.; Dobson. A. (Eds.) Control of Digestion
and Metabolism in Ruminants. Prentice Hall.
New Jersey. 3–17. 1986.
Marcondes. M. I.; Valadares Filho. S. C.;
Paulino. P. V. R.; Detmann. E.; Paulino. M.
F.; Diniz. L. L.; Santos. T. R. Consumo e
desempenho de animais alimentados
individualmente ou em grupo e características
de carcaça de animais Nelore de três classes
sexuais. Revista Brasileira de Zootecnia.
37:2243-2250. 2008.
Mayer. J.; Thomas. D. W. Regulation of food
intake and obesity. Science. 156:328-337.
1967.
McMeniman. J. P.. Defoor. P. J.; Galyean. M. L.
Evaluation of the National Research Council
(1996) dry matter intake prediction equations
and relationships between intake and
performance by feedlot cattle. Journal of
Animal Science. 87:1138. 2009.
McMeniman. J. P.; Tedeschi. L. O.; Defoor. P. J.;
Galyean. M. L. Development and evaluation
of feeding-period average dry matter intake
prediction equations from a commercial
feedlot data base. Journal of Animal Science.
88:3009-3017. 2010.
Mertens. D. R. Análise da fibra e sua utilização
na avaliação de alimentos e formulação de
rações. In: Simpósio Internacional de
Ruminantes. 1992. Lavras. Anais... Lavras:
SBZ. 188-219. 1992.
Mertens. D. R. Regulation of forage intake. In:
Fahey Jr.. G. C.; Collins. M.; Mertens. D. R.;
Moser. L. E. (Eds.) Forage Quality.
Evaluation and Utilization. Madison:
American Society of Agronomy. Crop
Science of America. Soil Science of America.
450-493. 1994.
Miner. J. L. Recent advances in the central
control of intake in ruminants. Journal of
Animal Science. 70:1283-1289. 1992.
Minson. D. J. Forage in ruminant nutrition. San
Diego: Academic Press. 483 p. 1990.
Moore. J. E. Forage crops. In: Hoveland. C. S.
(Ed.) Crop quality. storage and utilization.
Madison: ASA and CSSA. 61-91. 1980.

Regulation and prediction of dry matter intake
41
Moore. J. E.; Brant. M. H.; Kunkle. W. E.;
Hopkins. D. I. Effects of supplementation on
voluntary forage intake. diet digestibility. and
animal performance. Journal of Animal
Science. 77:122-135. 1999.
National Research Council – NRC. Beef cattle.
In: Predicting Feed Intake of Food-Producing
Animals. Washington. DC. 56-74. 1987.
National Research Council – NRC. Nutrient
requirements of beef cattle. Updated 7th ed.
National Academy Press. Washington. DC. 244
p. 2000.
National Research Council – NRC. Nutrient
requirements of beef cattle. 7th. rev. ed.
Washington. DC. 244 p. 1996.
National Research Council – NRC. Nutrient
requirements of beef cattle. 6th. ed. Washington:
National Academy Press. 90 p. 1984.
National Research Council – NRC. Nutrient
requirements of dairy cattle. 7th. rev. ed.
Washington. D.C: National Academy Press.
381 p. 2001.
Neal. H. D. C.; Thomas. C.; Cobby. J. M.
Comparison of equations for predicting
voluntary intake by dairy cows. The Journal
of Agricultural Science. 103:1-10. 1984.
Neter. J.; Kutner. M. H.; Nachtsheim. C. J.;
Wasserman. W. Applied Linear Statistical
Models. 4th Ed. New York: McGraw-Hill. 1996.
Nkrumah. J. D.; Li. C.; Yu. J.; Hansen. C.;
Keisler. D. H.; Moore. S. S. Polymorphisms
in the bovine leptin promoter associated with
serum leptin concentration. growth. feed
intake. feeding behavior. and measures of
carcass merit. Journal of Animal Science.
83:20-28. 2005.
Oliveira. A. S. D.; Detmann. E.; Campos. J. M.
D. S.; Pina. D. D. S.; Souza. S. M. D.; Costa.
M. G. Meta-analysis of the impact of neutral
detergent fiber on intake. digestibility and
performance of lactating dairy cows. Revista
Brasileira de Zootecnia. 40:1587-1595. 2011.
Paulino. M. F.; Moraes. E.; Zervoudakis. J. T.;
Alexandrino. E.; Figueiredo. D. Fontes de
energia em suplementos múltiplos de auto-
regulação de consumo na recria de novilhos
mestiços em pastagens de Brachiaria
decumbens durante o período das águas.
Revista Brasileira de Zootecnia. 34:957-962.
2005.
Paulino. P. V. R.; Valadares Filho. S. C.;
Detmann. E.; Valadares. R. F. D.; Fonseca.
M. A.; Véras. R. M. L.; Oliveira. D. M.
Desempenho produtivo de bovinos Nelore de
diferentes classes sexuais alimentados com
dietas contendo dois níveis de oferta de
concentrado. Revista Brasileira de Zootecnia.
37:1079-1087. 2008.
Pittroff. W.; Kothmann. M. M. Quantitative
prediction of feed intake in ruminants II.
Conceptual and mathematical analysis of
models for cattle. Livestock Production
Science. 71:151-169. 2001.
Ribeiro. J. S.; Ladeira. M. M.; Gonçalves. T. M.;
Whately. M. A.; Bassi. M. S.; Vallone. M. M.
Avaliação das predições de consumo de
matéria seca obtidas por meio dos sistemas de
exigências nutricionais para grupos zebuínos
confinados. In: 45ª Reunião da Sociedade
Brasileira de Zootecnia. 2008. Lavras. Anais...
45ª Reunião Anual da Sociedade Brasileira de
Zootecnia. Lavras. 2008.
Sampaio. C. B.; Detmann. E.; Lazzarini. I.;
Souza. M. A. D.; Paulino. M. F.; Valadares
Filho. S. C. Rumen dynamics of neutral
detergent fiber in cattle fed low-quality
tropical forage and supplemented with
nitrogenous compounds. Revista Brasileira de
Zootecnia. 38:560-569. 2009.
Simpfendorfer. S. Relationship of body type. size.
sex and energy intake to the body composition
of cattle. Dissertation. Cornell University..
Ithaca. New York. 1974.
Stanley. S.; Wynne. K.; Mcgowan. B.; Bloom. S.
Hormonal regulation of food intake.
Physiological reviews. 85:1131-1158. 2005.
St-Pierre. N. R. Invited review: Integrating
quantitative findings from multiple studies
using mixed model methodology. Journal of
Dairy Science. 84:741-755. 2001.
Teixeira. J. C.; Hespanhol. A. N. A trajetória da
pecuária bovina brasileira. Caderno
Prudentino de Geografia. 36:26-38. 2015.
Thornton. J. H.; Owens. F. N.; Gill. D. R. Feed
intake by feedlot beef steers: Influence of
initial weight and time on feed. Annual
report-Oklahoma Agricultural Experiment
Station (USA). MP-117. 320. 1985.
Triola. M. F. Introdução à estatística. Tradução
Alfredo Alves de Farias. 7 ed. Rio de Janeiro:
LTC. 133. 1999.
Valadares Filho. S. C.; Azevêdo. J. A. G.; Pina.
D. S.; Detmann. E.; Valadares. R. F. D.
Predição do consumo de matéria seca de
bovinos de corte em condições tropicais. In:

Nutrient Requirements of Zebu and Crossbred Cattle – BR-CORTE
42
VIII Congresso Internacional de Zootecnia e
X Congresso Nacional de Zootecnia. Recife.
2006a. Anais... Recife: Universidade Federal
Rural de Pernambuco. 1-26. 2006a.
Valadares Filho. S. C.; Paulino. P. V. R.;
Magalhães. K. A. Nutrient requirements of
Zebu cattle and Tables of Feed Composition –
BR-CORTE. 1. ed. Viçosa. MG: UFV.
Suprema Gráfica Ltda. 142 p. 2006b.
Valadares Filho. S. C.; Marcondes. M. I.;
Chizzotti. M. L.; Paulino. P. V. R. Nutrient
requirements of Zebu cattle – BR-CORTE.
2.ed. Viçosa. MG: UFV. Suprema Gráfica
Ltda. 193 p. 2010.
Van Soest. P. J. Nutritional ecology of the
ruminant. 2. ed. Ithaca: Cornell University
Press. 476 p. 1994.
Véras. R. M. L.; Valadares Filho. S. C.; Azevêdo.
J. A. G.; Detmann. E.; Paulino. P. V. R.;
Barbosa. A. M.; Marcondes. M. I. Níveis de
concentrado na dieta de bovinos Nelore de
três condições sexuais: consumo.
digestibilidade total e parcial. produção
microbiana e parâmetros ruminais. Revista
Brasileira de Zootecnia. 37:951-960. 2008.
Waldo. D. R.; Jorgensen. N. A. Forages for high
animal production: nutritional factors and
effects of conservation. Journal of Dairy
Science. 64:1207-1229. 1981.
Zanetti. D. Water intake. environmental
contaminants. and mineral balance in Nellore
cattle Tese (Doutorado em Zootecnia) –
Universidade Federal de Viçosa. 162 p. Work
in progress.