Regulation and Education Authorisation and Monitoring ...
31
www.sra.org.uk Regulation and Education: Authorisation and monitoring report 1 September 2016–August 2017 Regulation and Education Authorisation and Monitoring Activity September 2017—August 2018
Transcript of Regulation and Education Authorisation and Monitoring ...
www.sra.org.uk Regulation and Education: Authorisation and monitoring report 1
September 2016–August 2017
Regulation and Education Authorisation and Monitoring Activity
September 2017—August 2018
www.sra.org.uk Regulation and Education: Authorisation and monitoring report 2
September 2017–August 2018
Contents
Introduction and overview of 2017/18 .................................................................... 3
Executive summary ................................................................................................. 4
Key findings ........................................................................................................... 4
The routes to qualification ...................................................................................... 6
Numbers admitted by route .................................................................................... 6
Providers of legal education and training ............................................................... 8
SRA Monitoring ....................................................................................................... 9
Legal Practice Course ........................................................................................... 9
Results by gender ................................................................................................ 12
Results by ethnicity .............................................................................................. 13
Results by disability ............................................................................................. 15
Annual Course Monitoring Reports – narratives ................................................ 16
The Common Professional Examination/Graduate Diploma in Law .................. 18
Results by gender ................................................................................................ 20
Results by ethnicity .............................................................................................. 21
Results by disability ............................................................................................. 22
Training .................................................................................................................. 23
Periods of recognised training.............................................................................. 23
Figure 11: PRT age band breakdown ............................................................... 24
Figure 12: PRT ethnicity breakdown ................................................................. 25
Figure 13: PRT Disability breakdown ............................................................... 26
Figure 14: PRT Gender breakdown .................................................................. 26
Qualified lawyer transfer scheme results data .................................................... 27
Equivalent means applications ............................................................................ 30
www.sra.org.uk Regulation and Education: Authorisation and monitoring report 3
September 2017–August 2018
Introduction and overview of 2017/18
1. We have a statutory responsibility for the education and training of solicitors, as
set out in the Solicitors Act 1974 and the Legal Services Act 2007. These
education and training requirements play a key part in helping us to protect
consumers of legal services. This report concerns our quality assurance activity
in relation to education and training. Unless otherwise stated, it relates to the
period 1 September 2017 to 31 August 2018.
2. During this time, we have continued to develop the Solicitors Qualifying
Examination (SQE), which all aspiring solicitors in England and Wales will need
to take to qualify. Following extensive consultation, in April 2017, our Board
approved proposals for the introduction of the SQE. In April 2018, the Legal
Services Board approved the SQE regulations, subject to a further application,
once the final form of the assessment has been designed. We appointed Kaplan
as the assessment organisation for the SQE in July 2018 after a lengthy
tendering process. We remain on target to introduce the SQE in Autumn 2021. A
pilot of the SQE1 assessment took place in March 2019 and the results of the
pilot were published. A pilot of SQE2 took place at the end of 2019.
3. Our new Standards and Regulations came into force on 25 November 2019.
These did not make any substantive changes to the academic stage of training.
But they did make changes to the vocational stage of training. Specifically, the
new regulations no longer require experience of three practice areas of English
and Welsh law during the period of recognised training (PRT). The requirement
to satisfy the Practice Skills Standards continues. The Practice Skills Standards
themselves have been revised so that they are aligned to the Statement of
Solicitor Competence.
www.sra.org.uk Regulation and Education: Authorisation and monitoring report 4
September 2017–August 2018
Executive summary
4. The majority of those who qualify as solicitors will have completed, in this order:
a) the academic stage of training – qualifying law degree (QLD) or common
professional examination (CPE)
b) the vocational stage of training – the legal practice course (LPC), the PRT
and professional skills course (PSC).
This report analyses the information we receive from the course providers that
we approve or authorise to provide courses. It also analyses information we
gather on the routes to qualification of those admitted to the profession.
Key findings
5. This year, rates of successful completion for the LPC fell from 66% (2016/17) to
56% (2017/18). Those for the CPE fell from 64% (2016/17) to 60% (2017-18).
We consider successful completion to be where a student has passed the LPC,
but students who have not successfully completed may have additional attempts
available to them and may have been referred or deferred in one or more
subjects. This means that students may go on to successfully complete the
LPC.1
6. However, there appear to be significant differences in the successful completion
rates between providers. There are a number of different factors which may
influence pass rates, including candidate ability and engagement, teaching
quality and assessment arrangements, but we are unable to draw firm
conclusions from the data available.
7. In addition to the differences in overall successful completion rates, there are
significant differences between providers in the proportion of students who
achieve pass, commendation or distinction grades.
1In this context "referred" students are those who have failed one or more assessments and
may re-sit, and "deferred" students who have postponed their assessments (eg because of
exceptional circumstances such as illness or bereavement).

www.sra.org.uk Regulation and Education: Authorisation and monitoring report 5
September 2017–August 2018
8. Data indicates that students from black and minority ethnic groups are less likely
to successfully complete the CPE and the LPC.
9. Male and female students appear to perform equally well on the CPE and LPC
and women outnumber men on both courses and at the point of admission.
10. Our data on the ethnic origin and disability of those undertaking a PRT is less
comprehensive. As is shown in figures 12 and 13, large numbers of training
contracts registered indicated ethnic background as “unknown” and few declared
a disability.
www.sra.org.uk Regulation and Education: Authorisation and monitoring report 6
September 2017–August 2018
The routes to qualification
Numbers admitted by route
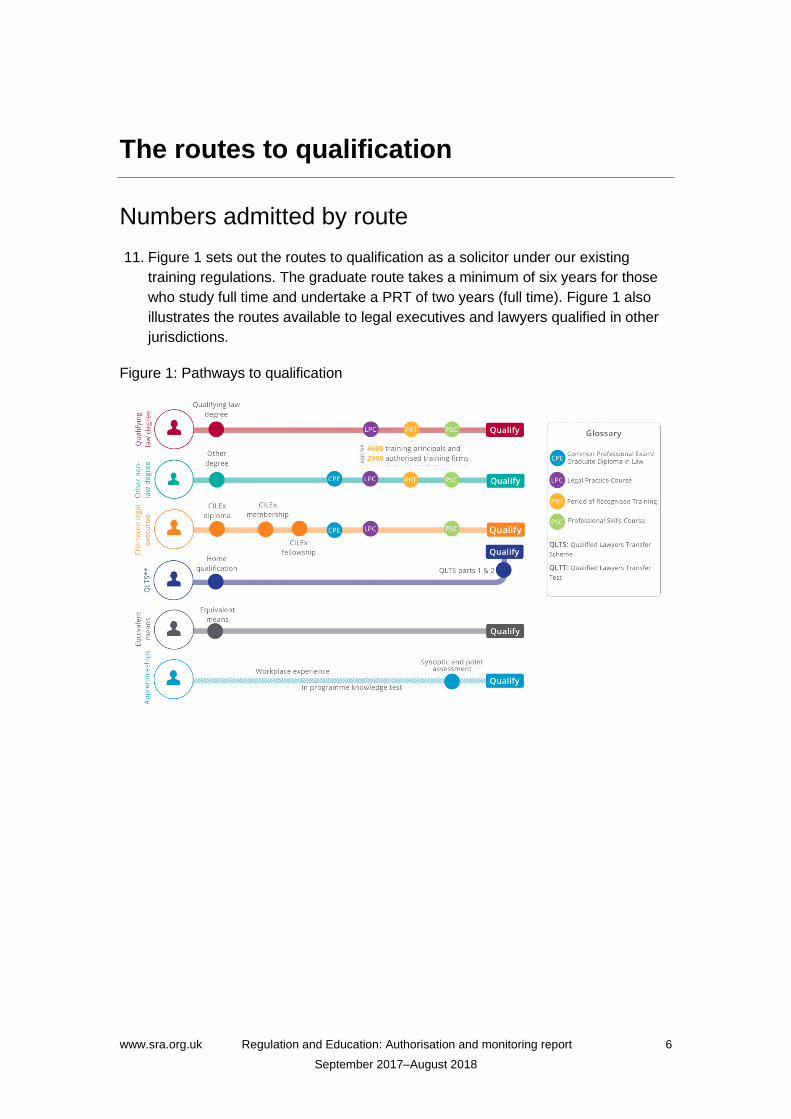
11. Figure 1 sets out the routes to qualification as a solicitor under our existing
training regulations. The graduate route takes a minimum of six years for those
who study full time and undertake a PRT of two years (full time). Figure 1 also
illustrates the routes available to legal executives and lawyers qualified in other
jurisdictions.
Figure 1: Pathways to qualification
www.sra.org.uk Regulation and Education: Authorisation and monitoring report 7
September 2017–August 2018
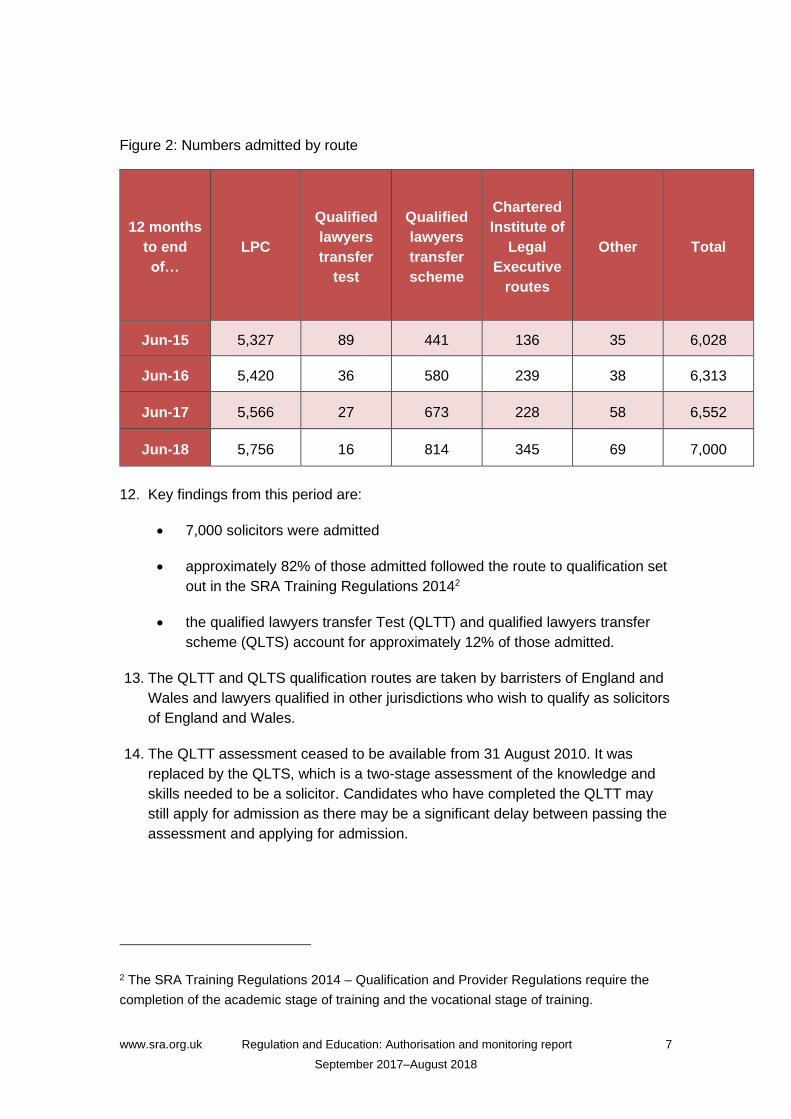
Figure 2: Numbers admitted by route
12 months
to end
of…
LPC
Qualified
lawyers
transfer
test
Qualified
lawyers
transfer
scheme
Chartered
Institute of
Legal
Executive
routes
Other Total
Jun-15 5,327 89 441 136 35 6,028
Jun-16 5,420 36 580 239 38 6,313
Jun-17 5,566 27 673 228 58 6,552
Jun-18 5,756 16 814 345 69 7,000
12. Key findings from this period are:
• 7,000 solicitors were admitted
• approximately 82% of those admitted followed the route to qualification set
out in the SRA Training Regulations 20142
• the qualified lawyers transfer Test (QLTT) and qualified lawyers transfer
scheme (QLTS) account for approximately 12% of those admitted.
13. The QLTT and QLTS qualification routes are taken by barristers of England and
Wales and lawyers qualified in other jurisdictions who wish to qualify as solicitors
of England and Wales.
14. The QLTT assessment ceased to be available from 31 August 2010. It was
replaced by the QLTS, which is a two-stage assessment of the knowledge and
skills needed to be a solicitor. Candidates who have completed the QLTT may
still apply for admission as there may be a significant delay between passing the
assessment and applying for admission.
2 The SRA Training Regulations 2014 – Qualification and Provider Regulations require the
completion of the academic stage of training and the vocational stage of training.
www.sra.org.uk Regulation and Education: Authorisation and monitoring report 8
September 2017–August 2018
Providers of legal education and training
15. Course providers range from universities that offer only a QLD to those that offer
a full range of pre and post-qualification courses. In 2017/18, all pre-qualification
education took place in providers that are also subject to regulation by the
Quality Assurance Agency for Higher Education (QAA).
16. The PRT takes place in firms and organisations we authorise to provide training.
Two providers offer their courses across a number of locations. Six providers
offer a programme that combines the QLD and the LPC (the exempting degree).
www.sra.org.uk Regulation and Education: Authorisation and monitoring report 9
September 2017–August 2018
SRA Monitoring
Legal Practice Course
17. When monitoring the quality and standards of education and training, we focus
on the two professional qualifications within the framework:
• the CPE (the academic award is more commonly known as the Graduate
Diploma in Law (GDL))
• the LPC.
18. For the CPE and the LPC, our monitoring involves an initial approval of the
course (CPE) or authorisation (LPC). Each provider must also submit an Annual
Course Monitoring Report. Our main quality assurance activity is reviewing
course providers’ reports on the programme they offer. They must submit this
information to us, and it must contain qualitative and quantitative data. If there
are issues, we have the power to make a monitoring visit to a provider.
19. The figures from LPC providers (and which are analysed in detail below)
indicate:
• 7,348 (56% of enrolled students) successfully completed the LPC,
compared with 66% in the previous year
• 2.9% failed the LPC in this period
• the remaining students were either withdrawn, suspended, or were referred
or deferred from their assessments.
www.sra.org.uk Regulation and Education: Authorisation and monitoring report 10
September 2017–August 2018
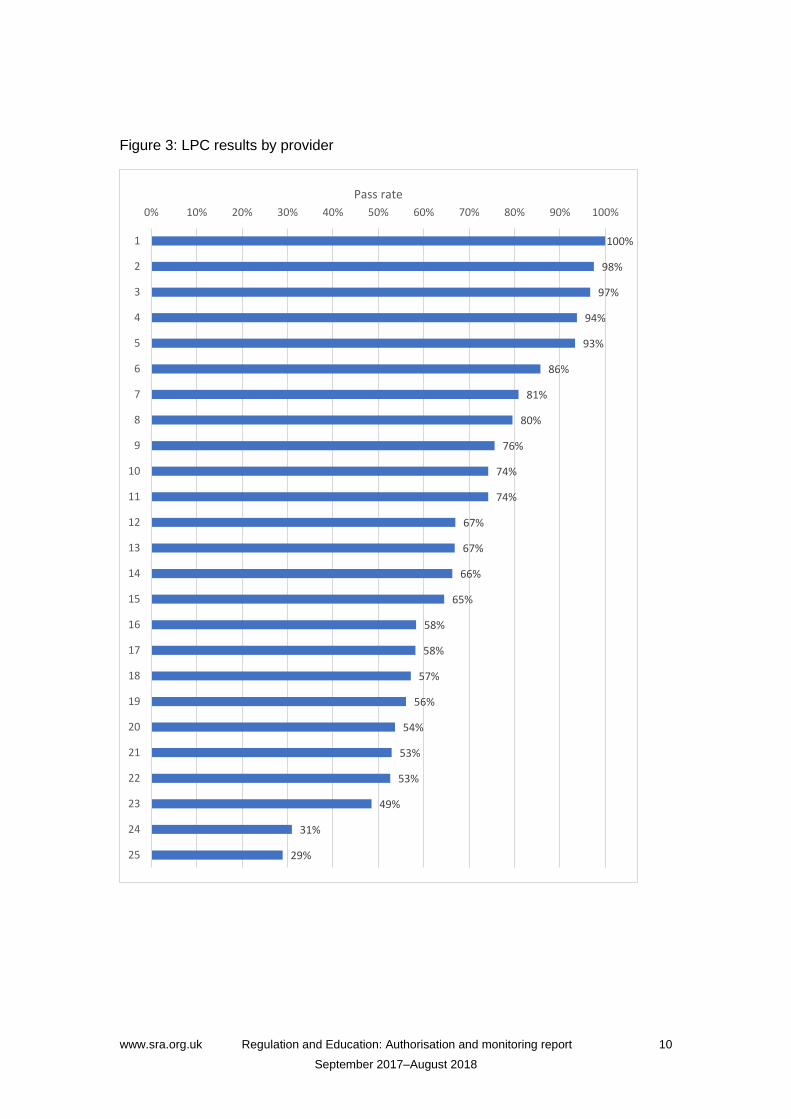
Figure 3: LPC results by provider
100%
98%
97%
94%
93%
86%
81%
80%
76%
74%
74%
67%
67%
66%
65%
58%
58%
57%
56%
54%
53%
53%
49%
31%
29%
0% 10% 20% 30% 40% 50% 60% 70% 80% 90% 100%
1
2
3
4
5
6
7
8
9
10
11
12
13
14
15
16
17
18
19
20
21
22
23
24
25
Pass rate
www.sra.org.uk Regulation and Education: Authorisation and monitoring report 11
September 2017–August 2018
20. Successful completion rates by provider vary from below 30% to 100%. In
addition to the variation in successful completion rates, there is significant
variation between providers in terms of the proportion of students obtaining pass,
commendation and distinction grades. It is unclear what the reasons are for such
a wide disparity in performance. There are very large differences in the size of
the different providers, from a group of 16 students to many thousands of
students spread over different locations. There may also be variation in
academic ability between different intakes, variable quality of teaching, and/or
different approaches to assessment. This makes it difficult to be confident about
consistent outcomes.
21. As stated, the size of LPC provision varies. The largest providers, BPP
University and the University of Law, offer the LPC across a number of different
locations. Between them, they shared approximately 80% (10,456) of the total
number of students enrolled to take assessments (77% in 2016/17). Several
providers had fewer than 50 students. As also stated above, the smallest course
had 16 students.
www.sra.org.uk Regulation and Education: Authorisation and monitoring report 12
September 2017–August 2018
Results by gender
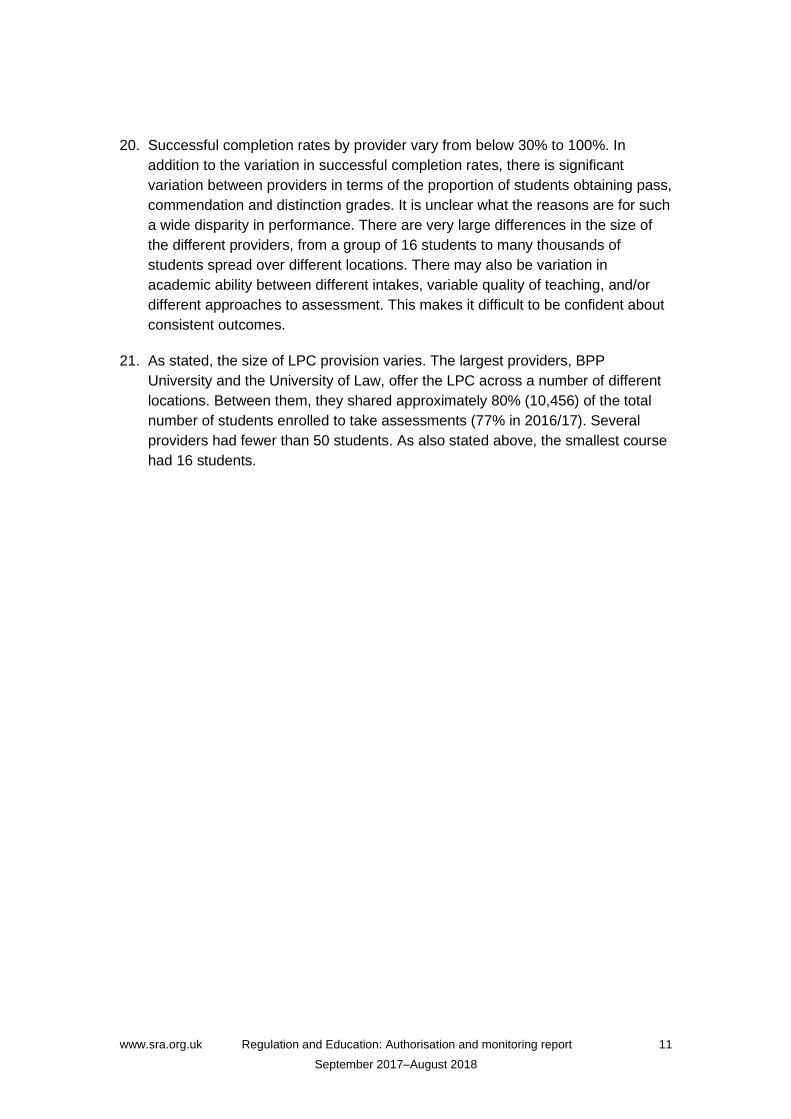
22. Some 64% of students in this cohort were female and 36% were male. This
indicates no change from 2016/17. There is little difference in performance on
the LPC by gender, in that approximately 56% of both male and female
candidates successfully completed the LPC. However, female students achieved
a higher proportion of distinctions.
Figure 4: LPC results by gender
www.sra.org.uk Regulation and Education: Authorisation and monitoring report 13
September 2016–August 2017
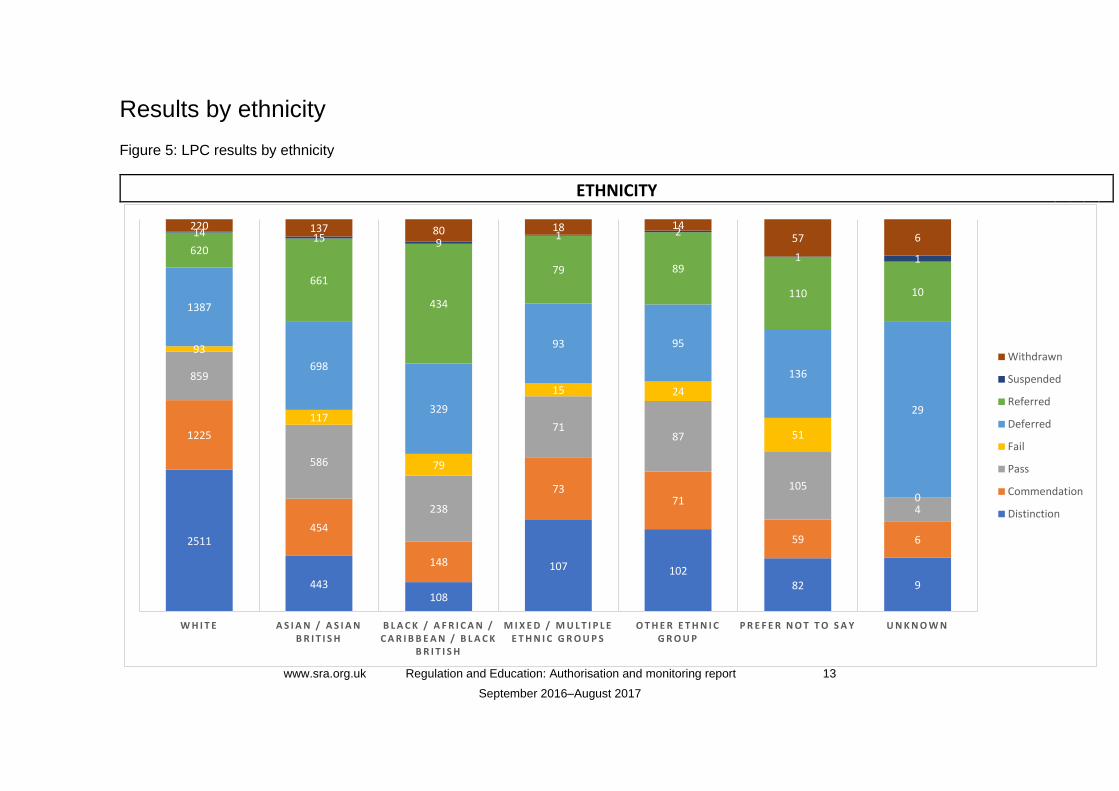
Results by ethnicity
Figure 5: LPC results by ethnicity
ETHNICITY
2511
443108
107 10282 9
1225
454
148
7371
59 6
859
586
238
7187
105
4
93
117
79
15 24
51
0
1387
698
329
93 95
136
29
620
661
434
79 89
110 10
14 15 91 2
1 1
220 137 80 18 1457 6
W H I T E A S I A N / A S I A N B R I T I S H
B L A C K / A F R I C A N / C A R I B B E A N / B L A C K
B R I T I S H
M I X E D / M U L T I P L E E T H N I C G R O U P S
O T H E R E T H N I C G R O U P
P R E F E R N O T T O S A Y U N K N O W N
Withdrawn
Suspended
Referred
Deferred
Fail
Pass
Commendation
Distinction

www.sra.org.uk Regulation and Education: Authorisation and monitoring report 14
September 2016–August 2017
23. Key findings show:
• 24% of students identified themselves as Asian/Asian British which is
comparable with 2016/17.
• approximately 11% as black/African/Caribbean/black British
• approximately 3% as mixed/multiple ethnic groups.
24. The table indicates that students from these ethnic backgrounds are less likely to
pass the LPC and more likely to fail or be referred or deferred in their
assessments. Approximately 66% of white students successfully completed the
LPC in the period in comparison with approximately 48% of Asian/Asian British
students and 35% of black students. The table indicates both higher “fail” rates
among these groups but also significantly higher rates of both referral and
deferral.
www.sra.org.uk Regulation and Education: Authorisation and monitoring report 15
September 2017–August 2018
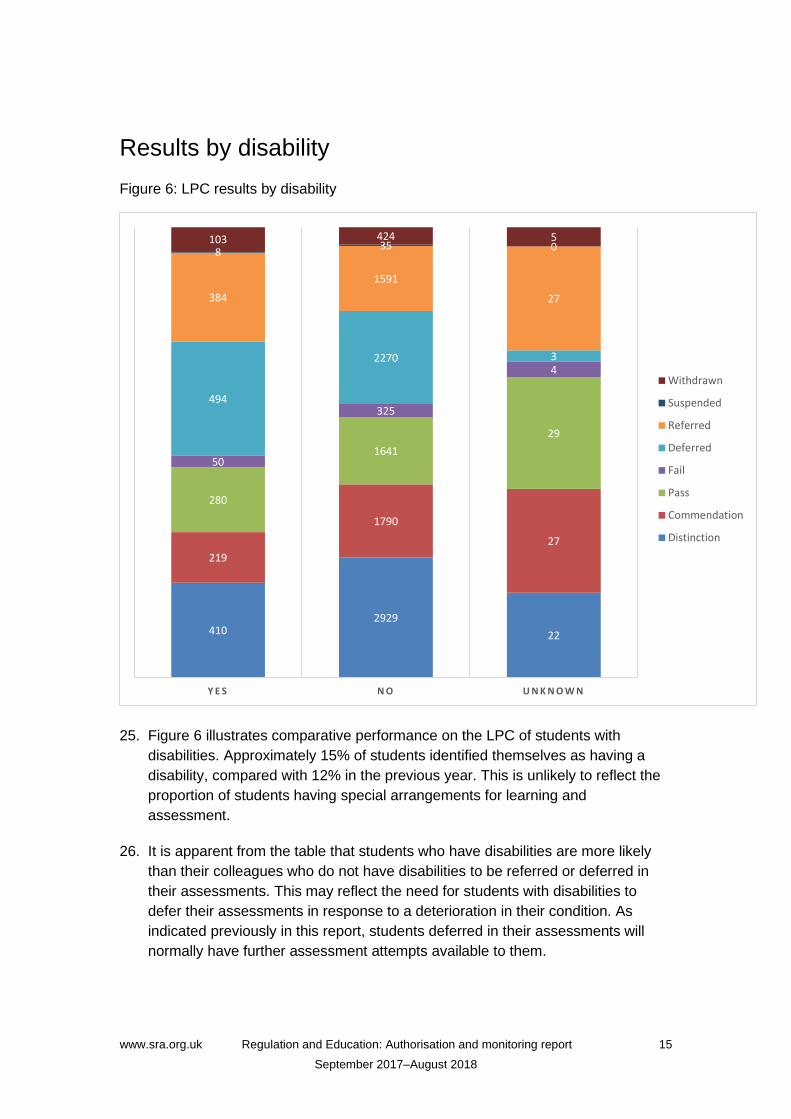
Results by disability
Figure 6: LPC results by disability
25. Figure 6 illustrates comparative performance on the LPC of students with
disabilities. Approximately 15% of students identified themselves as having a
disability, compared with 12% in the previous year. This is unlikely to reflect the
proportion of students having special arrangements for learning and
assessment.
26. It is apparent from the table that students who have disabilities are more likely
than their colleagues who do not have disabilities to be referred or deferred in
their assessments. This may reflect the need for students with disabilities to
defer their assessments in response to a deterioration in their condition. As
indicated previously in this report, students deferred in their assessments will
normally have further assessment attempts available to them.
4102929
22
219
1790
27
280
1641
29
50
325
4
494
2270 3
384
1591
27
835 0
103 424 5
Y E S N O U N K N O W N
Withdrawn
Suspended
Referred
Deferred
Fail
Pass
Commendation
Distinction

www.sra.org.uk Regulation and Education: Authorisation and monitoring report 16
September 2017–August 2018
Annual Course Monitoring Reports – narratives
27. All LPC providers must submit to us a narrative annual report on their LPC
course. In addition, providers appoint external examiners to review the quality
and standards of their assessments. Each of the LPC providers appoints its own
external examiners and the external examiners report to the LPC provider (rather
than to us). In their narrative Annual Course Monitoring Reports, the LPC
providers include a summary and analysis of issues raised by the external
examiners and the provider's response to those issues. From 2016/17 onwards,
we have asked the LPC providers to send us copies of the external examiners
reports with their own narrative reports.
28. Although we prescribe a template for the narrative report, there is inconsistency
in the amount of information provided. Some providers offer very brief
responses, whereas others offer a great deal of information on matters such as
the student feedback on the course and the external examiners' reports.
29. The external examiners are largely positive about the LPC overall, with providers
reporting positive comment in relation to:
• marking schemes and moderation processes
• up to date and professional curricula
• fair and effective assessments
• academic standards and programme quality
• learning and teaching strategies and materials.
30. Some areas of concern identified were:
• Different student outcomes depending on the date they started the course
(where learning materials and teachers were common to all provision). In
some instances it can be difficult to determine the causes of such
anomalies particularly where the cohort in question forms only a small
number of students and outcomes may not therefore be statistically
significant.
• Adverse student feedback on errors in assessments.
• Whether students chose their programme of study (and in particular
whether they decide to study for a Legal Practice Course programme

www.sra.org.uk Regulation and Education: Authorisation and monitoring report 17
September 2017–August 2018
incorporated into a Masters’ qualification) fully understanding the
implications of the additional workload or whether their decisions are
primarily motivated by the availability of student loan funding.
• Some issues with IT provision and support for LPC study.
• Need for students to seek employment to meet shortfall between
programme fees and level of loan funding.
• Issues of equality for mature, black and minority ethnic students, care
leavers and students with protected characteristics more generally.
• Technical issues with assessments and actions taken by Boards of
Examiners.
31. Where we have identified issues, we have addressed them with the providers
with the aim of resolving them.
32. We will continue to review the content of reports and external examiners reports
for the future.

www.sra.org.uk Regulation and Education: Authorisation and monitoring report 18
September 2017–August 2018
The Common Professional Examination/Graduate Diploma in Law
Figure 7: CPE/GDL results by provider
Note: the provider showing 0% had discontinued CPE provision, and had only 2
students remaining, both of whom were referred.
100%
100%
95%
90%
89%
88%
83%
82%
80%
79%
79%
78%
77%
76%
74%
70%
70%
68%
64%
62%
62%
60%
58%
56%
49%
45%
35%
0%
0% 10% 20% 30% 40% 50% 60% 70% 80% 90% 100%
1
2
3
4
5
6
7
8
9
10
11
12
13
14
15
16
17
18
19
20
21
22
23
24
25
26
27
28
Pass Rate
www.sra.org.uk Regulation and Education: Authorisation and monitoring report 19
September 2017–August 2018
33. Figure 7 shows CPE/GDL results. With rounding, the overall successful completion rate
was 60%.The total number of students who enrolled and were eligible to sit
assessments that would enable them to complete the CPE in the period of the report
was 5,479 (compared with 5,183 in the previous academic year). This includes:
• full-time students enrolling for the first time in September 2016 (or later)
• part-time students in their second year of study
• students who had referred or deferred assessment attempts.
CPE assessment rules permit three attempts at each assessment.
34. As with the LPC, the CPE/GDL is offered by a range of providers, all of which are also
subject to regulation by the QAA. Student numbers on the course vary considerably.
The largest providers, BPP University and the University of Law, offer the CPE across a
range of locations. As with the LPC, BPP and the University of Law dominate the
market, together accounting for approximately 76% of student recruitment. The smallest
student cohort was two students.
35. Rates of successful completion of the CPE/GDL by provider shown in figure 7 also vary
significantly, from fewer than 35% to 100%. In addition to the differences in rates of
successful completion, it is again apparent that (among those who do successfully
complete) there are very significant differences in the proportions obtaining pass,
commendation and distinction grades. Once again, it is difficult to draw firm conclusions
about the reasons for this. There is significant variation in size of providers. There may
also be student cohorts of different academic ability, differences in the quality of
teaching and/or in the approach to assessment.
36. Providers supply us with a summary and evaluation of issues raised by their external
examiners in their Annual Course Monitoring Reports. These did not raise any concerns
about quality and standards on the CPE/GDL.
www.sra.org.uk Regulation and Education: Authorisation and monitoring report 20
September 2017–August 2018
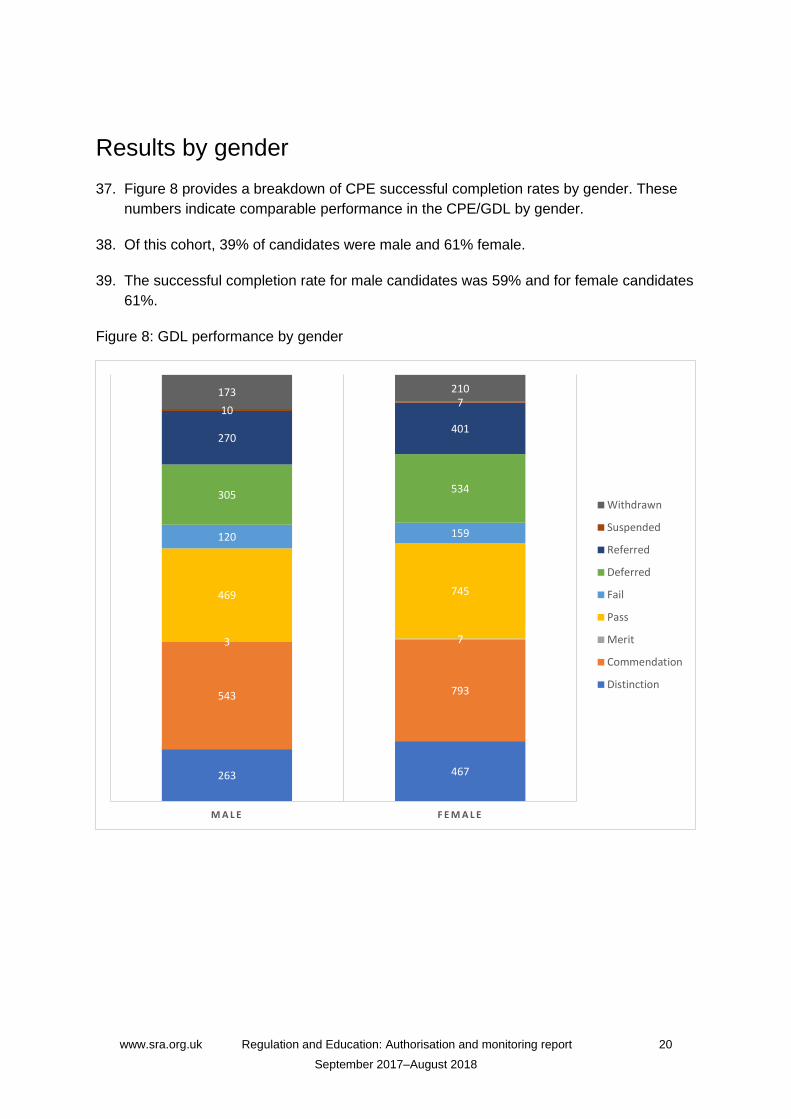
Results by gender
37. Figure 8 provides a breakdown of CPE successful completion rates by gender. These
numbers indicate comparable performance in the CPE/GDL by gender.
38. Of this cohort, 39% of candidates were male and 61% female.
39. The successful completion rate for male candidates was 59% and for female candidates
61%.
Figure 8: GDL performance by gender
263 467
543 793
3 7
469 745
120 159
305534
270401
107
173 210
M A L E F E M A L E
Withdrawn
Suspended
Referred
Deferred
Fail
Pass
Merit
Commendation
Distinction
www.sra.org.uk Regulation and Education: Authorisation and monitoring report 21
September 2017–August 2018
Results by ethnicity
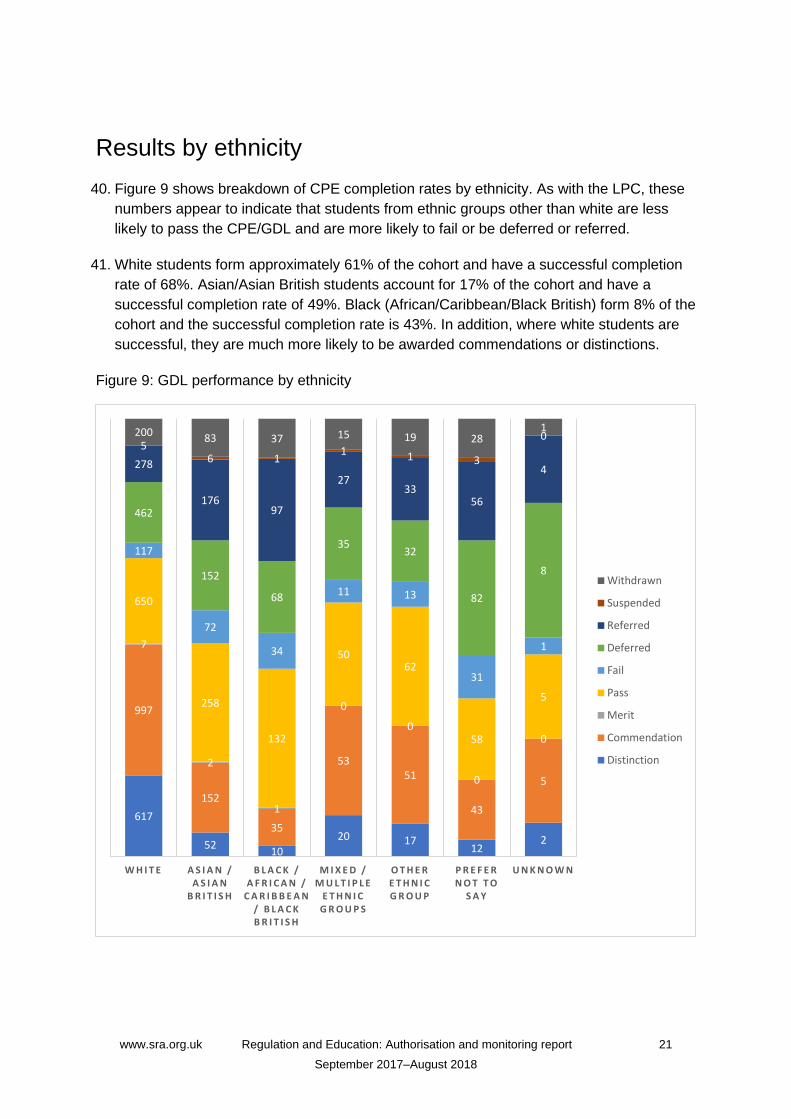
40. Figure 9 shows breakdown of CPE completion rates by ethnicity. As with the LPC, these
numbers appear to indicate that students from ethnic groups other than white are less
likely to pass the CPE/GDL and are more likely to fail or be deferred or referred.
41. White students form approximately 61% of the cohort and have a successful completion
rate of 68%. Asian/Asian British students account for 17% of the cohort and have a
successful completion rate of 49%. Black (African/Caribbean/Black British) form 8% of the
cohort and the successful completion rate is 43%. In addition, where white students are
successful, they are much more likely to be awarded commendations or distinctions.
Figure 9: GDL performance by ethnicity
617
5210
20 1712
2
997
152
35
5351
43
5
7
2
1
0
0
0
0
650
258
132
5062
58
5
117
72
34
11 13
31
1
462
152
68
3532
82
8
278
17697
2733
56
4
56 1
1 1 3
0200 83 37 15 19 281
W H I T E A S I A N / A S I A N
B R I T I S H
B L A C K / A F R I C A N /
C A R I B B E A N / B L A C K B R I T I S H
M I X E D / M U L T I P L E
E T H N I C G R O U P S
O T H E R E T H N I C G R O U P
P R E F E R N O T T O
S A Y
U N K N O W N
Withdrawn
Suspended
Referred
Deferred
Fail
Pass
Merit
Commendation
Distinction

www.sra.org.uk Regulation and Education: Authorisation and monitoring report 22
September 2017–August 2018
Results by disability
42. In this cohort of students, 14% declared a disability (although this is unlikely to reflect
the proportion of students having special arrangements for learning and assessment).
43. The successful completion rate for students declaring a disability was 55% in
comparison with 61% for students who did not declare a disability. Students declaring a
disability have higher rates of withdrawal from the course, referral for resit and deferral
of assessment.
Figure 10: GDL performance by disabilty
100 6291
1781154
4
010 0
154
1057
425
254
0158
680 1
128 543
0
116
0
43 337
3
Y E S N O P R E F E R N O T T O S A Y
Withdrawn
Suspended
Referred
Deferred
Fail
Pass
Merit
Commendation
Distinction
www.sra.org.uk Regulation and Education: Authorisation and monitoring report 23
September 2017–August 2018
Training
Periods of recognised training
44. The final stage of qualification pathway is a PRT (trainees will also need to undertake
the PSC). Training will take place in a firm or organisation approved by us to take
trainees and, if carried out on a full-time basis, will usually be for a period of two years
Full Time Equivalent (FTE).
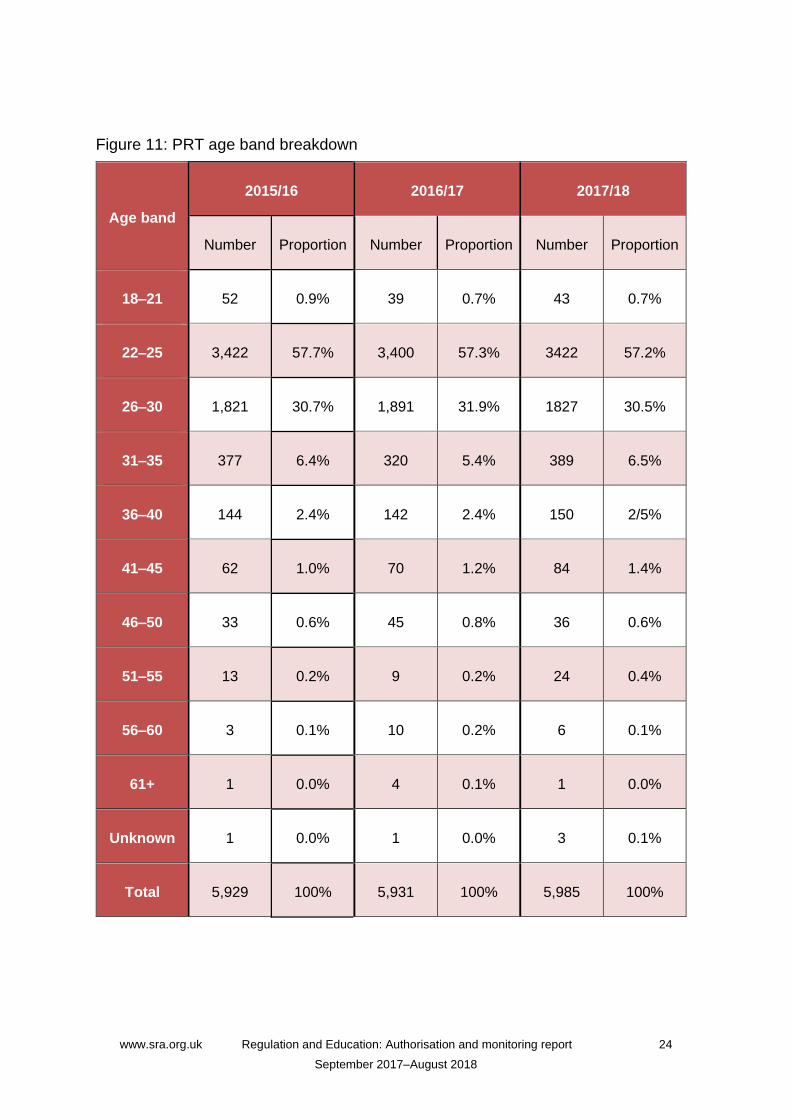
45. The tables in figure 14 provide details of the number of training contracts registered with
us in the last three periods: 2015/16, 2016/17 and 2017/18.
46. Percentages are based on the total known population. There is a very high number of
unknowns for ethnicity, as we do not collect EDI data routinely on students. Where the
ethnicity is known, it is likely that the individual has now been admitted (and entered
their data via their mySRA profile) or they were previously known to us for another
reason.
47. Data for previous years has also been refreshed, so there may be some changes when
compared to previously provided data.
www.sra.org.uk Regulation and Education: Authorisation and monitoring report 24
September 2017–August 2018
Figure 11: PRT age band breakdown
Age band
2015/16 2016/17 2017/18
Number Proportion Number Proportion Number Proportion
18–21 52 0.9% 39 0.7% 43 0.7%
22–25 3,422 57.7% 3,400 57.3% 3422 57.2%
26–30 1,821 30.7% 1,891 31.9% 1827 30.5%
31–35 377 6.4% 320 5.4% 389 6.5%
36–40 144 2.4% 142 2.4% 150 2/5%
41–45 62 1.0% 70 1.2% 84 1.4%
46–50 33 0.6% 45 0.8% 36 0.6%
51–55 13 0.2% 9 0.2% 24 0.4%
56–60 3 0.1% 10 0.2% 6 0.1%
61+ 1 0.0% 4 0.1% 1 0.0%
Unknown 1 0.0% 1 0.0% 3 0.1%
Total 5,929 100% 5,931 100% 5,985 100%
www.sra.org.uk Regulation and Education: Authorisation and monitoring report 25
September 2017–August 2018
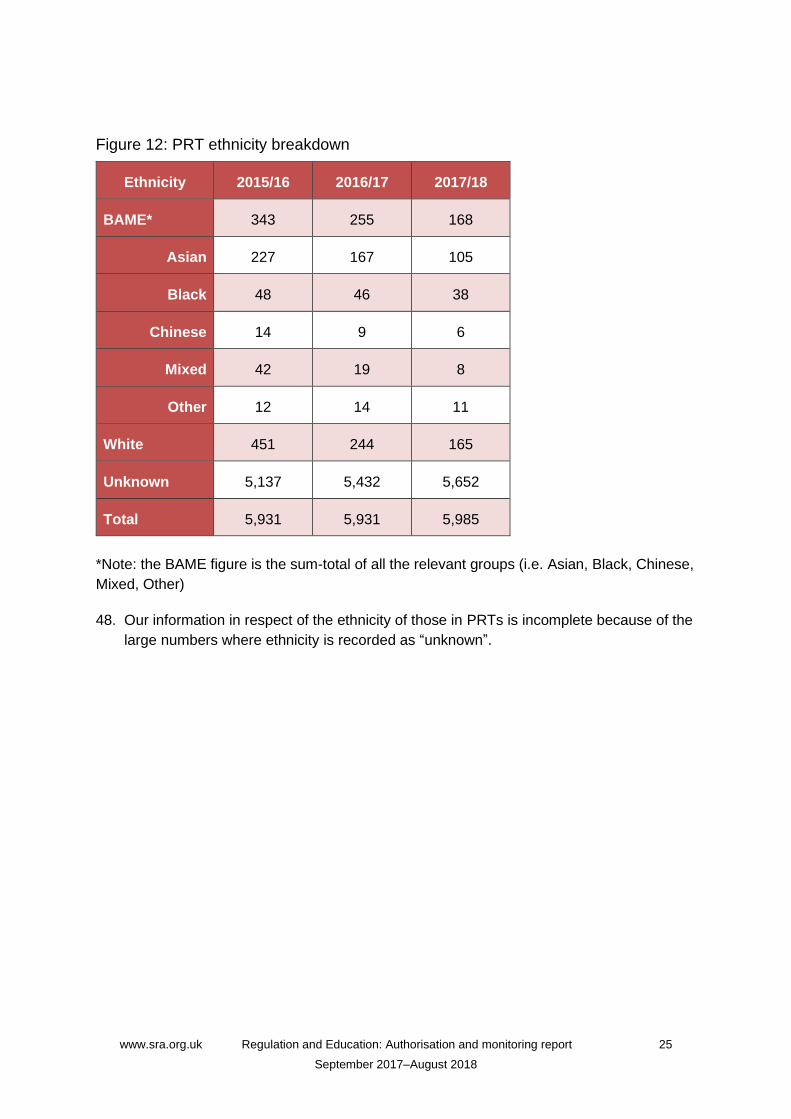
Figure 12: PRT ethnicity breakdown
Ethnicity 2015/16 2016/17 2017/18
BAME* 343 255 168
Asian 227 167 105
Black 48 46 38
Chinese 14 9 6
Mixed 42 19 8
Other 12 14 11
White 451 244 165
Unknown 5,137 5,432 5,652
Total 5,931 5,931 5,985
*Note: the BAME figure is the sum-total of all the relevant groups (i.e. Asian, Black, Chinese,
Mixed, Other)
48. Our information in respect of the ethnicity of those in PRTs is incomplete because of the
large numbers where ethnicity is recorded as “unknown”.
www.sra.org.uk Regulation and Education: Authorisation and monitoring report 26
September 2017–August 2018
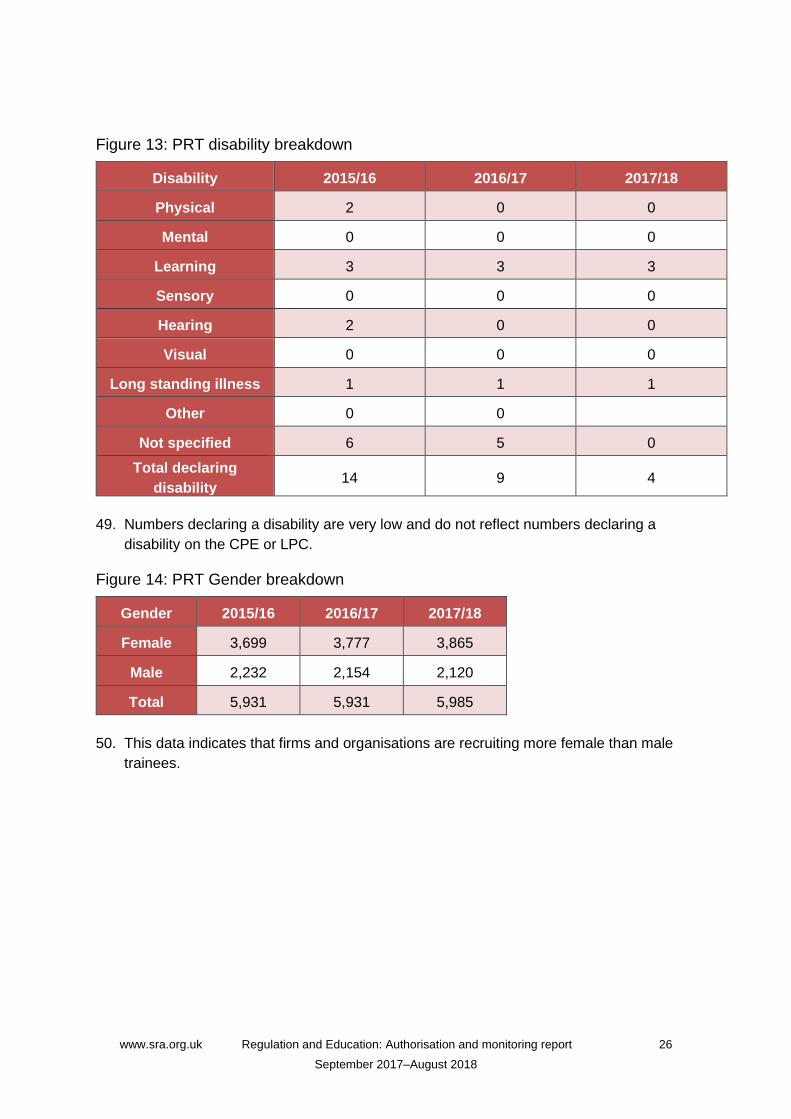
Figure 13: PRT disability breakdown
Disability 2015/16 2016/17 2017/18
Physical 2 0 0
Mental 0 0 0
Learning 3 3 3
Sensory 0 0 0
Hearing 2 0 0
Visual 0 0 0
Long standing illness 1 1 1
Other 0 0
Not specified 6 5 0
Total declaring
disability 14 9 4
49. Numbers declaring a disability are very low and do not reflect numbers declaring a
disability on the CPE or LPC.
Figure 14: PRT Gender breakdown
Gender 2015/16 2016/17 2017/18
Female 3,699 3,777 3,865
Male 2,232 2,154 2,120
Total 5,931 5,931 5,985
50. This data indicates that firms and organisations are recruiting more female than male
trainees.
www.sra.org.uk Regulation and Education: Authorisation and monitoring report 27
September 2017–August 2018
Qualified lawyer transfer scheme results data
51. Individuals may qualify through this route if they are a qualified lawyer in a jurisdiction
that we recognise and complete the QLTS assessments, or if they are a barrister of
England and Wales. The QLTS assesses an individual's competence by way of
multiple-choice testing (MCT) of legal knowledge and skills-based assessments, called
objective structured clinical examination (OSCE). Candidates must pass the MCT (stage
1) before being able to progress to the OSCE (stage 2). The assessments are operated
by Kaplan and the MCT assessment is offered at multiple centres around the world. The
OSCE assessments take place in London.
52. Between 1 January 2018 and 1 December 2018, 1,677 candidates attempted the MCT
assessment and 842 candidates attempted the OSCE.
53. The pass rates in percentages from the total number of candidates achieved by
candidates in different groups are set out in figure 15.

www.sra.org.uk Regulation and Education: Authorisation and monitoring report 28
September 2017–August 2018
Figure 15: QLTS results data and percentage pass rates (calendar year 2018)
Gender
Assessment Number of
Candidates Male Female Not stated
MCT 1,677 51.0% (770) 47,6% (895) 12
OSCE 842 70.1% (375) 76.2% (453) 14
Ethnic Group
Assessment Number of
Candidates BAME White Not stated
MCT 1,677 40.3% (857) 60.2% (598) 55.9% (222)
OSCE 842 68.1% (357) 79.4% (360) 68.8% (125)
First language English
Assessment Number of
Candidates Yes No Not stated
MCT 1,677 59.0% (774) 41.2% (903) 0
OSCE 842 79.5% (434) 66.2% (408) 0
Candidates declaring a Disability
Assessment Number of
Candidates Yes No Not stated
MCT 1,167 43.8% (16) 49.5% (1,661) 0
OSCE 842 67.6% (34) 73.3% (808) 0
54. Candidates from 91 jurisdictions took assessments (either the MCT or the OSCE) in
2018. We currently recognise more than 170 jurisdictions, which include, as separate
jurisdictions, the states of America and territories of Canada.
55. Some 51% of male candidates and 47.6% of female candidates who presented for
stage 1 MCT assessment in this period were successful and eligible to progress to
stage 2.
56. The pass rate for the OSCE was 70.1% for male candidates and 76.2% for female
candidates.
57. Pass rates by gender, ethnicity and first language are shown in figure 15.
www.sra.org.uk Regulation and Education: Authorisation and monitoring report 29
September 2017–August 2018
58. The results indicate that the pass rate on the MCT for white students is 60.2%. For black
and minority ethnic students it is 40.3% (a difference of 19.9%). We also have
information about the first language of candidates. The pass rate on the MCT for
students for whom English is their first language is 59%, whereas for those for whom
English is not their first language the pass rate is 41.2 %.
59. Once students have passed the MCT, however, the discrepancy in performance by
ethnic group/first language reduces in the OSCE. The pass rate is 79.4% for white
students, 68.1% for black and minority ethnic students (a difference of 11.3%). The pass
rate in the OSCE is 79.5% for those whose first language is English and 66.2% for those
whose first language is not English.
www.sra.org.uk Regulation and Education: Authorisation and monitoring report 30
September 2017–August 2018
Equivalent means applications
60. Since the introduction of the SRA Training Regulations 2014, applicants have been able
to meet the academic or vocational requirements of training by an equivalent means
application.
61. We may recognise previous learning and grant exemptions where:
• the level, standard, volume and content of previous learning is equivalent to all or
part of a particular stage of education and training
• there is relevant, sufficient and adequate evidence of this learning
We may also grant exemptions based on work-based experience and the achievement
derived from that experience. This is because we recognise the achievement of learning
and the subsequent outcomes, not the evidence that an applicant has had experience of
doing something.
62. Although numbers are still relatively low, they have been steadily increasing. Decisions
are made following our assessment of applicants’ workplace experience and/or
qualifications, considering them equivalent to the relevant academic or vocational stage
requirement.
63. Figure 16 shows the number of equivalent means applications for the period from 1 July
2014 to 30 August 2019.
64. The equivalent means application will continue to be available during the transition
period following the introduction of the SQE.

www.sra.org.uk Regulation and Education: Authorisation and monitoring report 31
September 2017–August 2018
Figure 16: Number of equivalent means applications July 2014–August 2018
Equivalent
means
applications
01.07.2014 to
16.08.19
Received Granted Refused Withdrawn Work in
progress
CPE 259 135 74 41 9
CPE for non-
graduates 67 48 5 12 2
LPC 46 18 9 17 2
PRT 453 309 44 69 31
PSC 22 7 1 14 0
Morgenbesser 17 4 partially
granted3 4 9 0
3 Two granted equivalence to the academic stage only and 2 granted equivalence to academic stage
and the LPC only


![PR COD 1amCom - European Parliament · No 2065/2003 [on smoke flavourings], Regulation (EC) No 1935/2004 [on food contact materials], Regulation (EC) No 1331/2008 [on the common authorisation](https://static.fdocuments.in/doc/165x107/5f698eba3fe8630f361f8922/pr-cod-1amcom-european-no-20652003-on-smoke-flavourings-regulation-ec-no.jpg)


![UK Financial Regulation - Intelivisto Fin... · authorisation, supervision, enforcement, sanctions and disciplinary action [FSMA] understand the Principles for Businesses [PRIN 1.1.2](https://static.fdocuments.in/doc/165x107/5f6647dbcd419d49647f2ec0/uk-financial-regulation-intelivisto-fin-authorisation-supervision-enforcement.jpg)