
Regulated Price Plan Supply Cost Report - oeb.ca · Regulated Price Plan Prices and the Global...
20
Regulated Price Plan Supply Cost Report (Formerly the Regulated Price Plan Price Report) May 1, 2018 to April 30, 2019 Ontario Energy Board April 19, 2018 (Updated April 20, 2018)
Transcript of Regulated Price Plan Supply Cost Report - oeb.ca · Regulated Price Plan Prices and the Global...

Regulated Price Plan Supply Cost Report
(Formerly the Regulated Price Plan Price Report)
May 1, 2018
to April 30, 2019
Ontario Energy Board
April 19, 2018 (Updated April 20, 2018)

Ontar io Energy Board 1
Executive Summary Until recently, the Ontario Energy Board (OEB) published a Regulated Price Plan: Price Report semi-annually in relation to the review and, where applicable, re-setting of Regulated Price Plan (RPP) prices. The last such report was issued on April 20, 2017.
With the coming into force of the Ontario Fair Hydro Plan Act, 2017 (OFHP Act) in June 2017, the basis on which RPP prices are set by the OEB has changed. Under the OFHP Act, RPP prices are not set on a forecast of the cost of supply over time. The initial RPP prices set by the OEB under the OFHP Act, for the period July 1, 2017 to April 30, 2018, are set out in the OEB’s June 22, 2017 report Regulated Price Plan Prices and the Global Adjustment Modifier for the Period July 1, 2017 to April 30, 2018. RPP prices for the period May 1, 2018 to April 30, 2019 (forecast period) are also being determined under the OFHP Act, and are set out in the OEB’s April 19, 2018 report Regulated Price Plan Prices and the Global Adjustment Modifier for the Period May 1, 2018 to April 30, 2019.
While a forecast of the cost of supply is therefore not required for the purposes of setting RPP prices for the forecast period, such a forecast is needed for two purposes under the OFHP Act:
• as an input in determining the “GA Modifier” for the forecast period, which is used to reduce the Global Adjustment charges payable by consumers that are “specified consumers” within the meaning of the OFHP Act but are not paying RPP prices; and
• to calculate the RPP time-of-use and tiered prices that would have been effective on May 1, 2018 if they had been determined using the method prescribed by the regulations made under section 79.16(1)(b) of the Ontario Energy Board Act, 1998 (OEB Act) and without taking into account any forecasted impact of any provision of the OFHP Act. This calculation is to support invoicing requirements under Ontario Regulation 196/17 made under the OFHP Act.
The estimated RPP supply cost provided in this Report was developed based on the methodology set out in the OEB’s Regulated Price Plan Manual1.
The calculation of the total RPP electricity supply cost for the forecast period is informed by several separate forecasts.
Average RPP Supply Cost
The forecast of the simple average market price for the forecast period is $19.64/MWh (or 1.964 cents per kWh). After accounting for the consumption pattern of RPP consumers, the average market price for electricity used by RPP consumers increases to $21.57/MWh (or 2.157 cents per kWh).
The combined effect of all other inputs affecting RPP supply cost increase this per kilowatt-hour price and are captured by the Global Adjustment. The forecast net impact of the Global Adjustment is to increase the average RPP supply cost for RPP customers by $103.80/MWh (or 10.380 cents per kWh).
1 Regulated Price Plan Manual issued February 16, 2016

Ontar io Energy Board 2
The forecast supply cost also considers the uncertainty associated with actual market prices and actual market demand as both are subject to random effects. Consequently, a minor adjustment is made to the RPP supply cost to account for the fact that these random effects are more likely to increase than to decrease supply costs during the forecast period. This adjustment was determined to be $1.00/MWh (or 0.100 cents per kWh).
As set out in Table ES-1, the resulting average RPP supply cost for the forecast period is $126.37/MWh (or 12.637 cents per kWh). This is $11.47/MWh, or 1.147 cents per kWh, higher than the forecast cost of $114.90/MWh determined for the May 1, 2017 to April 30, 2018 period.2
Table ES-1: Average RPP Supply Cost Summary
RPP Supply Cost Summary
for the period from May 1, 2018 through April 30, 2019 $/MWh Forecast Wholesale Electricity Price - Simple Average $19.64 Load-Weighted Costs for RPP Consumers Wholesale Electricity Cost - RPP-Weighted $21.57 Global Adjustment + $103.80 Adjustment to Address Bias Towards Unfavourable Variance + $1.00 Adjustment to Clear Existing Variance3 + $0.00 Average Supply Cost for RPP Consumers = $126.37
Source: Power Advisory
Regulated Price Plan: Time-of-Use Prices as Calculated under the OEB Act
There are two RPP pricing structures. One is for consumers with eligible time-of-use (or “smart”) meters who pay time-of-use (TOU) prices that are based on three periods per weekday4: Off-Peak (with a price of RPEMOFF), Mid-Peak (RPEMMID) and On-Peak (RPEMON). These consumers make up the majority of RPP consumers. The second RPP pricing structure is a tiered structure for consumers with conventional meters.
As noted above, to support invoicing requirements the OEB is required to calculate what RPP TOU and tiered prices would have been on May 1, 2018 if determined under section 79.16 of the OEB Act without taking into account any forecasted impact of any provision of OFHP Act.
The OEB has calculated the RPP TOU prices that would have been effective on May 1, 2018 if determined under section 79.16 of the OEB Act as follows:
o RPEMOFF = 10.0 cents per kWh;
o RPEMMID = 14.6 cents per kWh; and,
o RPEMON = 20.3 cents per kWh.
2 Regulated Price Plan Price Report May 1, 2017 to April 30, 2018 3 As discussed in Section 2.2.8, the OEB has adopted a value of $0.00 for the variance clearance adjustment. 4 Weekends and statutory holidays have one TOU period: Off-peak.

Ontar io Energy Board 3
These prices reflect the seasonal change in the TOU pricing periods which will take effect on May 1, 2018 and November 1, 2018.
Regulated Price Plan: Tiered Prices as Calculated under the OEB Act
RPP consumers that are not on TOU pricing pay prices in two tiers; one price (referred to as RPCMT1) for monthly consumption up to a tier threshold and a higher price (referred to as RPCMT2) for consumption over the threshold. The threshold for residential consumers changes twice a year on a seasonal basis: to 600 kWh per month during the summer season (May 1 to October 31) and to 1,000 kWh per month during the winter season (November 1 to April 30). The threshold for non-residential RPP consumers remains constant at 750 kWh per month for the entire year.
The OEB has calculated the RPP tiered prices that would have been effective on May 1, 2018 if determined under section 79.16 of the OEB Act as follows:
o RPCMT1 = 11.8 cents per kWh, and
o RPCMT2 = 13.8 cents per kWh.
Table ES-2: May 1, 2018 RPP Prices as Calculated under the OEB Act (Absent any Forecasted Impact of the OFHP Act)
Time-of-Use RPP Prices Off-Peak Mid-Peak On-Peak Average Price
Price per kWh 10.0¢ 14.6¢ 20.3¢ 12.6¢
% of TOU Consumption 65% 17% 18%
Tiered RPP Prices Tier 1 Tier 2 Average Price
Price per kWh 11.8¢ 13.8¢ 12.6¢
% of Tiered Consumption 57% 43%

Ontar io Energy Board 4
Table of Contents EXECUTIVE SUMMARY ............................................................................................................................................................ 1
AVERAGE RPP SUPPLY COST ....................................................................................................................................................... 1 REGULATED PRICE PLAN: TIME-OF-USE PRICES AS CALCULATED UNDER THE OEB ACT ........................................................... 2 REGULATED PRICE PLAN: TIERED PRICES AS CALCULATED UNDER THE OEB ACT ..................................................................... 3
LIST OF FIGURES & TABLES ................................................................................................................................................... 4 1. INTRODUCTION ............................................................................................................................................................... 5
1.1 ASSOCIATED DOCUMENTS ............................................................................................................................................. 6 1.2 PROCESS FOR RPP PRICE CALCULATIONS ..................................................................................................................... 6
2. CALCULATING THE RPP SUPPLY COST ................................................................................................................... 7 2.1 DEFINING THE RPP SUPPLY COST ................................................................................................................................. 7 2.2 COMPUTATION OF THE RPP SUPPLY COST .................................................................................................................... 8
2.2.1 Forecast Cost of Supply Under Market Rules .......................................................................................................... 9 2.2.2 RPP Share of the Global Adjustment ..................................................................................................................... 10 2.2.3 Cost Adjustment Term for Prescribed Generators.................................................................................................. 10 2.2.4 Cost Adjustment Term for Non-Utility Generators and Other Generation under Contract with the OEFC ........ 11 2.2.5 Cost Adjustment Term for Certain Renewable Generation Under Contract with the IESO ................................. 11 2.2.6 Cost Adjustment Term for Other Contracts with the IESO ................................................................................... 12 2.2.7 Estimate of the Global Adjustment ......................................................................................................................... 13 2.2.8 Cost Adjustment Term for IESO Variance Account .............................................................................................. 15
2.3 CORRECTING FOR THE BIAS TOWARDS UNFAVOURABLE VARIANCES ......................................................................... 15 2.4 TOTAL RPP SUPPLY COST ........................................................................................................................................... 15
3. CALCULATING THE RPP PRICE ................................................................................................................................. 17 3.1 TOU PRICES AS CALCULATED UNDER THE OEB ACT ................................................................................................. 17 3.2 TIERED PRICES AS CALCULATED UNDER THE OEB ACT .............................................................................................. 18
List of Figures & Tables List of Figures
Figure 1: Process Flow for Calculating the RPP Price ............................................................................................................... 6 Figure 2: Components of the RPP Supply Cost ....................................................................................................................... 14
List of Tables
Table 1: Ontario Electricity Market Price Forecast ($ per MWh) ............................................................................................. 9 Table 2: Total Electricity Supply Cost ....................................................................................................................................... 16 Table 3: Average RPP Supply Cost Summary .......................................................................................................................... 16 Table 4: RPP TOU and Tiered Prices as Calculated under the OEB Act (Absent Any Forecasted Impact of the OFHP Act)................................................................................................................................................................................................. 19

Introduction 5
1. Introduction Under amendments to the Ontario Energy Board Act, 1998 (OEB Act) contained in the Electricity Restructuring Act, 2004, the Ontario Energy Board (OEB) was mandated to develop a regulated price plan (RPP) for electricity prices to be charged to consumers that have been designated by legislation and that have not opted to switch to a retailer or to be charged the hourly spot market price. The first prices were implemented under the RPP effective on April 1, 2005, as set out by the Ontario Government in O. Reg. 95/05 (Classes of Consumers and Determination of Rates) made under the OEB Act.
As of July 1, 2017, RPP prices are to be set under the Ontario Fair Hydro Plan Act, 2017 (OFHP Act). As a result, RPP prices are no longer set based on a forecast of the cost of supply over time. The initial RPP prices set by the OEB under the OFHP Act, for the period July 1, 2017 to April 30, 2018, are set out in the OEB’s June 22, 2017 report Regulated Price Plan Prices and the Global Adjustment Modifier for the Period July 1, 2017 to April 30, 2018. RPP prices for the period May 1, 2018 to April 30, 2019 (forecast period) are also being determined under the OFHP Act, and are set out in the OEB’s April 19, 2018 report Regulated Price Plan Prices and the Global Adjustment Modifier for the Period May 1, 2018 to April 30, 2019.
While a forecast of the cost of supply is therefore not required for the purposes of setting RPP prices for the forecast period, such a forecast is needed for two purposes under the OFHP Act.
• The first purpose is to serve as an input to determining the “GA Modifier” for the forecast period, which is used to reduce the Global Adjustment charges payable by consumers that are “specified consumers” within the meaning of the OFHP Act but are not paying RPP prices. These are:
o consumers that are eligible for the RPP, but have opted out for a retail contract or for market-based pricing; and,
o consumers that are not eligible for the RPP but are eligible for the 8% rebate under the Ontario Rebate for Electricity Consumers Act, 2016.
• The second purpose is to calculate the RPP time-of-use (TOU) and tiered prices that would have been effective on May 1, 2018 if they had been determined using the method prescribed by the regulations made under section 79.16(1)(b) of the Ontario Energy Board Act, 1998 (OEB Act) and without taking into account any forecasted impact of any provision of the OFHP Act. This calculation is required to support invoicing requirements under Ontario Regulation 196/17 (Invoicing Requirements) made under the OFHP Act.5
5 Section 5(4) of Ontario Regulation 195/17 (Fair Adjustments under Part II of the Act) made under the OFHP Act states as follows: “The Board shall, for the purposes of allowing an electricity vendor or unit sub-meter provider to comply with Ontario Regulation 196/17 (Invoicing Requirements) made under the Act, calculate the time-of-use and tiered rates that would have been effective on May 1, 2018 if they had been determined using the method prescribed by the regulations made under clause 79.16 (1) (b) of the Ontario Energy Board Act, 1998 and without taking into account any forecasted impact of any provisions of the Act.

Introduction 6
This Report sets out details of the calculation of the RPP prices that would have been effective on May 1, 2018 if they had been determined under section 79.16 of the OEB Act, based on the methodology set out in the OEB’s Regulated Price Plan Manual (RPP Manual6).
This Report consists of three chapters as follows:
o Chapter 1. Introduction
o Chapter 2. Calculating the RPP Supply Cost
o Chapter 3. Calculating RPP Prices
1.1 Associated Documents
Three documents are closely associated with this Report:
o The RPP Manual, which describes the methodology for setting RPP prices under section 79.16 of the OEB Act;
o The Ontario Wholesale Electricity Market Price Forecast For the Period May 1, 2018 through October 31, 2019 (Market Price Forecast Report), prepared by Power Advisory LLC, which contains the Ontario wholesale electricity market price forecast and explains the material assumptions used to inform the hourly price forecast.
o The Regulated Price Plan Prices and the Global Adjustment Modifier for the Period May 1, 2018 to April 30, 2019 report that sets out the RPP TOU and tiered prices and the GA Modifier for the period May 1, 2018 to April 30, 2019, determined in accordance with the OFHP Act and Ontario Regulation 195/17 (Fair Adjustments under Part II of the Act) made under the OFHP Act.
1.2 Process for RPP Price Calculations
The diagram below illustrates the processes followed to calculate RPP price for both consumers with conventional meters and those with eligible time-of-use meters. This Report is organized according to this basic process.
Figure 1: Process Flow for Calculating the RPP Price
Analysis for Time-of-Use
Prices
RPP Price for Eligible Time-of-Use Meters • Market Price Generation
• OPG Regulated Assets • NUGs • Contracted Renewables • Other Contracted Generation • CDM Costs
RPP Supply
Cost
RPP Basic Price
Determination
Analysis for Tiers
RPP Price for Conventional
Meters
Source: RPP Manual
6 Regulated Price Plan Manual issued February 16, 2016

Calculat ing the RPP Supply Cost 7
2. Calculating the RPP Supply Cost The RPP supply cost calculation formula is set out in Equation 1 below. To calculate the RPP supply cost requires forecast data for the variables in Equation 1. Most of the variables depend on more than one underlying data source or assumption. This chapter describes the data or assumption source for each of the variables and explains how the data were used to calculate the RPP supply cost. More detail on this methodology is provided in the RPP Manual.
It is important to remember that the elements of Equation 1 are forecasts. In some cases, the calculation uses actual historical values, but in these cases the historical values constitute the best available forecast.
2.1 Defining the RPP Supply Cost
Equation 1 below defines the RPP supply cost. This equation is further explained in the RPP Manual.
Equation 1
CRPP = M + α [(A – B) + (C – D) + (E – F) + G] + H, where
o CRPP is the total RPP supply cost;
o M is the amount that the RPP supply would have cost under the Market Rules;
o α is the RPP proportion of the total Global Adjustment costs;7
o A is the amount paid to prescribed generators in respect of the output of their prescribed generation facilities;8
o B is the amount those generators would have received under the Market Rules;
o C is the amount paid to the Ontario Electricity Finance Corporation (OEFC) with respect to its payments under contracts with non-utility generators (NUGs);
o D is the amount that would have been received under the Market Rules for electricity and ancillary services supplied by those NUGs;
o E is the amount paid to the IESO with respect to its payments under certain contracts with renewable generators;
7 The elements in square brackets collectively represent the Global Adjustment. For RPP price setting purposes the elements of the Global Adjustment are described differently in this Report than they are in O. Reg. 429/04 (Adjustments under Section 25.33 of the Act) made under the Electricity Act, 1998. “G” in the expression in square brackets integrates two separate components of the Global Adjustment formula (G and H). “E” and “F” in the expression in square brackets include certain generation contracts that are associated with “G” in O. Reg. 429/04. This is necessary to ensure that there is no double-counting and thus over-recovery of generation costs because all RPP supply is included in “M”. As discussed below, the Global Adjustment is recovered through the RPP according to the allocation of the Global Adjustment between Class A and Class B consumers, and the RPP consumers’ share of Class B consumption. 8 As set out in regulation O. Reg. 53/05 (Payments under Section 78.1 of the Act) made under the OEB Act, the OEB sets payment amounts for energy produced from Ontario Power Generation’s nuclear and certain hydro-electric generating stations (the prescribed assets). The OEB’s most recent Order setting base payment amounts (EB-2016-0152) was issued on March 29, 2018.

Calculat ing the RPP Supply Cost 8
o F is the amount that would have been received under the Market Rules for electricity and ancillary services supplied by those renewable generators;
o G is (a) the amount paid by the IESO for its other procurement contracts for generation or for demand response or CDM, and (b) the sum of any OEB-approved amounts for CDM programs that are payable by the IESO to distributors; and
o H is the amount associated with the variance account held by the IESO. This includes any existing variance account balance needed to be recovered (or disbursed) in addition to any interest incurred (or earned).
The forecast per unit RPP supply cost will be the total RPP supply cost (CRPP) divided by the total forecast RPP demand. RPP prices will be calculated based on that forecast per unit cost.
2.2 Computation of the RPP Supply Cost
Broadly speaking, the steps involved in forecasting the RPP supply cost are:
1. Forecast wholesale market prices;
2. Forecast the load shape for RPP consumers;
3. Forecast the quantities in Equation 1; and
4. Forecast RPP Supply Cost = Total of Equation 1.
In addition to the four steps listed above, the calculation of the total RPP supply cost requires a forecast of the stochastic adjustment, which is not included in Equation 1. The stochastic adjustment is included in the RPP Manual as an additional cost factor calculated outside of Equation 1.
In May 2016, the Climate Change Mitigation and Low-carbon Economy Act, 2016 received Royal Assent and Ontario Regulation 144/16 was issued. Together, the legislation and regulation provide details about the Cap and Trade Program, which began on January 1, 2017. Under the legislation, large final emitters, natural gas distributors and electricity importers are required to verify and report their greenhouse gas emissions to the provincial government, and have to match their total emissions in each compliance period with an equivalent amount of “allowances.”
Accordingly, this RPP forecast accounts for the cap and trade program over the forecast period. As more fully detailed in the Market Price Forecast Report, the forecast of wholesale market prices reflects the forecast of natural gas prices using the weighted average price of carbon during the forecast period of $18.95 per metric ton (being C$18.44/tonne in 2018 and C$20.00/tonne in 2019), consistent with the results report of Ontario’s first joint cap and trade auction with the other members of the Western Climate Initiative (Joint Auction 14 – February 21, 2018), Canadian federal government policy on carbon pricing9, and an emissions factor for natural gas of 54.1 kilograms per MMBtu.
9 Government of Canada, Department of Environment and Natural Resources, Carbon pricing: regulatory framework for the output-based pricing system (https://www.canada.ca/en/services/environment/weather/climatechange/climate-action/pricing-carbon-pollution/output-based-pricing-system.html).

Calculat ing the RPP Supply Cost 9
The following sections will describe each term or group of terms in Equation 1, the data used for forecasting them, and the computational methodology to produce each component of the RPP supply cost.
2.2.1 Forecast Cost of Supply Under Market Rules
This section covers the first term of Equation 1:
CRPP = M + α [(A – B) + (C – D) + (E – F) + G] + H
The forecast cost of supply to RPP consumers under the Market Rules depends on two forecasts:
o The forecast of the simple average hourly Ontario electricity price (HOEP) in the IESO-administered market over all hours in each month of the year; and
o The forecast of the ratio of the load-weighted average market price paid by RPP consumers in each month to the simple average HOEP in that month.
The forecast of HOEP is taken directly from the Market Price Forecast Report. That Report also contains a detailed explanation of the assumptions that underpin the forecast such as generator fuel prices (e.g., natural gas). Table 1 below shows forecast seasonal on-peak, off-peak, and average prices. The prices provided in Table 1 are simple averages over all of the hours in the specified period (i.e., they are not load-weighted). These on-peak and off-peak periods differ from and should not be confused with the TOU periods associated with the RPP TOU prices discussed later in this report.
Table 1: Ontario Electricity Market Price Forecast ($ per MWh)
Source: Power Advisory, Market Price Forecast Report Note: On-peak hours include the hours ending at 8 a.m. through 11 p.m. Eastern Standard Time (EST) on working weekdays and off-peak hours include all other hours. The definition of “on-peak” and “off-peak” hours for this purpose bears no relation to the “on-peak”, “mid-peak” and “off-peak” periods used for RPP TOU pricing.
The forecasts of the monthly ratios of load-weighted vs. simple average HOEP are based on actual prices between April 2005 and March 2018. The on-peak to off-peak ratio is also based on data through March 2018.
As shown in Table 1, the forecast simple average HOEP for the period May 1, 2018 to April 30, 2019 is $19.64/MWh (1.964 cents per kWh). The forecast of the load weighted average price for RPP consumers (“M” in Equation 1) is $21.57/MWh (2.157 cents per kWh), or $1.3 billion in total, the result of RPP consumers having load patterns that are more peak oriented than the overall system.
Term Quarter Calendar Period On-Peak Off-Peak Average
Q1 May 2018 - Jul 2018 $23.32 $11.31 $16.83
Q2 Aug 2018 - Oct 2018 $25.08 $13.29 $18.68
Q3 Nov 2018 - Jan 2019 $28.05 $14.61 $20.74
Q4 Feb 2019 - Apr 2019 $26.27 $19.23 $22.39
Average May 2018 - Apr 2019 $25.68 $14.57 $19.64
Q1 May 2019 - Jul 2019 $22.32 $10.96 $16.19
Q2 Aug 2019 - Oct 2019 $23.94 $12.84 $17.91
Average May 2019 - Oct 2019 $23.13 $11.90 $17.05
RPP
Yea
rO
ther

Calculat ing the RPP Supply Cost 10
2.2.2 RPP Share of the Global Adjustment
Alpha (“α”) in Equation 1 represents the RPP consumers’ share of the Global Adjustment. Effective January 1, 2011, O. Reg. 429/04 (Adjustments under Section 25.33 of the Act) made under the Electricity Act, 1998 was amended to revise how the Global Adjustment is allocated to two sets of consumers, Class A and Class B (includes RPP consumers)10.
The first step to determine alpha is to estimate Class A’s share of the Global Adjustment. Based on the formula and periods defined in O. Reg. 429/04, the Class A share has increased to 16.7% for the July 2017 to June 2018 period, due to the expansion of the Ontario Government’s Industrial Conservation Initiative, which lowered the threshold for Class A eligibility. The Class A share is forecast to increase further to 18.5% for the July 2018 to June 2019 period, as more eligible consumers opt in to Class A.11 On average, Class B’s share of the Global Adjustment is forecast to be 81.8% over the forecast period.
The next step is to estimate RPP consumers’ share of Class B consumption. Based on historical data on RPP consumption as a share of total Ontario consumption, it is forecast that RPP consumption will represent about 59 TWh or 59.1% of total Class B consumption.12 The RPP share varies from month to month, ranging between 51.9% (before the increase in the Class A share, when total Class B consumption is larger) and 65.4% (after the Class A increase). The value of α therefore ranges between 0.433 and 0.533. Over the entire forecast period, the RPP consumers’ share of the Global Adjustment is forecast to be 48.8%.
2.2.3 Cost Adjustment Term for Prescribed Generators
This section covers the second term of Equation 1:
CRPP = M + α [(A – B) + (C – D) + (E – F) + G] + H
The prescribed generators are comprised of the rate-regulated nuclear and hydroelectric facilities of OPG for which the OEB sets payment amounts. The payment amounts for the prescribed generation as set out in the OEB’s March 29, 2018 Payment Amounts Order (EB-2016-0152) are: $82.58/MWh in 2018 and $87.50/MWh in 2019 for nuclear generation, and $42.70/MWh in 2018 and $44.22/MWh13 in 2019 for hydroelectric generation. These payment amounts include both base payment amounts and rate riders.
Quantity A was therefore forecast by multiplying payment amounts per MWh by the prescribed assets’ total forecast output per month in MWh.
10 O. Reg. 429/04 defines two classes of consumers; Class A, comprised of consumers whose maximum hourly demand for electricity exceeds a specified threshold; and Class B consumers, comprised of all other consumers, including RPP consumers. The demand threshold for Class A eligibility has been reduced over time, most recently by amendments to O. Reg. 429/04 made in 2016 (O. Reg. 366/16) and 2017 (O. Reg. 107/17). 11 For July 2017 to June 2018, the percentage of Class A Global Adjustment costs was based on Class A load during peak demand hours in the May 1, 2016 to April 30, 2017 period. The Class A peak demand factor effective for the July 1, 2018 to June 30, 2019 period will be based on peak load percentages in the May 1, 2016 to April 30, 2017 period. 12 The Class A/Class B split did not exist before January 2011. Data on RPP consumption as a share of total Class B consumption is available only for the January 2011 to March 2018 period. 13 This is an estimate, as the 2019 hydroelectric generation base payment amount has yet to be approved by the OEB.

Calculat ing the RPP Supply Cost 11
Quantity B was forecast by estimating the market values of each MWh of nuclear and prescribed hydraulic generation, and multiplying those market values by the volume of nuclear and prescribed hydraulic generation. The value of A is $4.9 billion, and the value of B is $1.5 billion.
2.2.4 Cost Adjustment Term for Non-Utility Generators and Other Generation under Contract with the OEFC
This section describes the calculation of the third term of Equation 1:
CRPP = M + α [(A – B) + (C – D) + (E – F) + G] + H
Although the details of these payments (amounts by recipient, volumes, etc.) are not public, published information from the IESO about aggregate monthly payments to non-utility generators (NUGs) has been used as the basis for forecasting payments in future months. This forecast was used to compute an estimate of the total payments to the NUGs under their contracts, or amount C in Equation 1.
The amount that the NUGs would receive under the Market Rules, quantity D in Equation 1, is their hourly production times the hourly Ontario energy price. These quantities were forecast on a monthly basis, as an aggregate for the NUGs as a whole.
The value of “C” in Equation 1 (i.e., the contract cost of the NUGs) is estimated to be $0.3 billion, and the value of “D” (i.e., the market value of the NUG output) is estimated to be $0.1 billion.
2.2.5 Cost Adjustment Term for Certain Renewable Generation Under Contract with the IESO
This section describes the calculation of the fourth term of Equation 1:
CRPP = M + α [(A – B) + (C – D) + (E – F) + G] + H
Quantities E and F in the above formula refer to certain renewable generators paid by the IESO under contracts related to output. Generators in this category are renewable generators under the following contracts:
o Renewable Energy Supply (RES) Request for Proposals (RFP) Phases I, II and III;
o the Renewable Energy Standard Offer Program (RESOP);
o the Feed-In Tariff (FIT) Program;
o the Hydroelectric Standard Offer Program (HESOP);
o the Hydroelectric Energy Supply Agreements (HESA) directive, covering new and redeveloped hydro facilities;
o the Hydro Contract Initiative (HCI), covering existing hydro plants;
o the Energy from Waste program; and
o Non-Utility Generators who are under contract with the IESO rather than OEFC.
Quantity E in Equation 1 is the forecast quantity of electricity supplied by these renewable generators times the fixed price they are paid under their contract with the IESO. The statistical model includes estimates of the fixed prices. In some cases, this is simply the announced contract price (e.g., $420/MWh for solar generation under RESOP). In others, the contract price needs to be adjusted in each year either partially or fully in proportion to inflation. In still others, detailed information on contract prices is not available, and they have been estimated based on publicly-

Calculat ing the RPP Supply Cost 12
available information (for example, the Ontario Government announced that the weighted average price for Renewable RFP I projects was $79.97/MWh, but did not announce prices for individual contracts).14
The size and generation type of the successful renewable energy projects to date have been announced by the Government and the IESO. The forecast includes additional renewable capacity coming into service during the RPP period, and the monthly output of both existing and new plants, using either historical values of actual outputs (where available), or estimates based on the plants’ capacities and estimated capacity factors. The forecast also considers average market revenues for each plant or type of plant. Quantity F in Equation 1 is therefore the forecast output of the renewable generation multiplied by the forecast average market revenue (based on market prices in the Market Price Forecast Report) at the time that output is generated.
The value of “E” in Equation 1 (i.e., the contract cost of renewable generation) is estimated to be $4.9 billion, and the value of “F” (i.e., the market value of renewable generation) is estimated to be $0.4 billion.
2.2.6 Cost Adjustment Term for Other Contracts with the IESO
This section describes the calculation of the fifth term of Equation 1:
CRPP = M + α [(A – B) + (C – D) + (E – F) + G] + H
The costs for three types of resources under contract with the IESO are included in G:
1. conventional generation (e.g., natural gas) whose payment relates to the generator’s capacity costs;
2. demand side management, demand response, capacity and energy sales contracts; and
3. Bruce Power, which has an output-based contract for generation from its Bruce A and B nuclear facilities.
The contribution of conventional generation under contract to the IESO to quantity G relates to several contracts:
o Clean Energy Supply (CES) and other contracts, which include conventional generation contracts as well as one demand response contract awarded to Loblaws;15
o The “early mover” contracts; and
o Contracts awarded for projects classified as Combined Heat and Power (CHP) projects16.
14 For information related to the FIT Price Schedule, see the IESO’s dedicated web page at: http://www.ieso.ca/sector-participants/feed-in-tariff-program/overview 15 Ten facilities holding CES and other contracts are operational during this forecast period: the GTAA Cogeneration Facility, the Loblaws Demand Response Program, eight large gas-fired plants (Portlands, Goreway, Greenfield, St. Clair, York Energy Centre, Halton Hills, Green Electron Power, and Napanee), and two biomass projects (Atikokan and Thunder Bay). The IESO entered into contracts with these facilities pursuant to directives from the Minister of Energy. 16 Seven facilities holding CHP Phase I contracts are expected to be operational during this forecast period: the Great Northern Tri-gen Facility, the Durham College District Energy Project, the Countryside London Cogeneration

Calculat ing the RPP Supply Cost 13
The costs of these generation contracts, for the purpose of calculating the RPP supply cost, are based on an estimate of the contingent support payments to be paid under the contract guidelines. The contingent support payment is the difference between the net revenue requirement (NRR) stipulated in the contracts and the “deemed” energy market revenues. The deemed energy market revenues were estimated based on the deemed dispatch logic as stipulated in the contract and the Market Price Forecast Report that underpins this RPP price setting activity. The NRRs and other contract parameters for each contract have been estimated based on publicly available information. Examples include the average NRR for the CES contracts which was announced by the Government to be $7,900 per megawatt-month,17as well as an NRR of $17,000 per megawatt-month for the cancelled Oakville Generating station which has been used as a guideline for some of the more recent gas plant additions.
The cost to the IESO of any additional CDM initiatives is also captured in term G of Equation 1. Starting on January 1, 2015, and continuing until December 31, 2020, electricity distributors are expected to continue to offer CDM programs to customers in their service area, consistent with the Minister of Energy’s Directive issued to the OEB and the Direction to the OPA, both dated March 31, 2014. Costs for these programs will be recovered and settled with the IESO, by way of contracts with the LDCs, for the period 2015 to 2020.
In December 2015, the IESO negotiated an amended agreement with Bruce Power in relation to the refurbishment and continued operation of the Bruce Power nuclear units18. The amended contract stipulates that an initial price of $65.73/MWh would be paid for the output of Bruce A and B. The amended contract also stipulates that the initial price will be indexed to inflation every April 1, as well as adjusted periodically for asset management, waste fees, and refurbishments. For the upcoming RPP period, these revised contract terms have been applied for the output of Bruce A and B.
The IESO has a contract with OPG for the on-going operation of OPG’s Lennox Generating Station, a 2,140-MW peaking plant. The cost of this contract is included in the “G” variable.
The value of “G” in Equation 1 (i.e., net cost of Bruce nuclear, gas and Lennox generation plus CDM programs) is estimated to be $4.5 billion.
2.2.7 Estimate of the Global Adjustment
The total Global Adjustment is estimated to be $12.5 billion. The RPP share of this (i.e., α times the total cost) is estimated to be $6.1 billion, or $103.80/MWh (10.380 cents per kWh). This is the forecast of the average Global Adjustment cost per unit for RPP consumers over the period from May 1, 2018 to April 30, 2019.
The Global Adjustment represents the difference between the total contract cost of the various contracts it covers (for the prescribed generating assets, Bruce nuclear, gas plants, renewable
Facility, the Warden Energy Centre, the Algoma Energy Cogeneration Facility, the East Windsor Cogeneration Centre, and the Thorold Cogeneration Project. Other facilities from other procurement processes are included as well. 17 The NRR for the “early movers” was assumed to be the same. 18 In 2005, Bruce Power entered into an initial Bruce Power Refurbishment Implementation Agreement in relation to the operation of Bruce Units 1 and 2. In December 2015, the IESO and Bruce Power entered into an Amended and Restated Bruce Power Refurbishment Implementation Agreement.

Calculat ing the RPP Supply Cost 14
generation, CDM, etc.) and the market value of contracted generation. The Global Adjustment therefore changes for two reasons:
o changes (usually increases) in the number and aggregate capacity of contracts it covers, or
o fluctuations in the market revenues earned by contracted and prescribed generation.
This is illustrated in Figure 2, which shows how the Global Adjustment is expected to change over the next 12 months.
Figure 2: Components of the RPP Supply Cost
Source: Power Advisory
Overall, RPP supply costs have increased by 10.0% between this forecast period and the supply costs which were forecast for the May 2017 RPP price-setting as set out in the OEB’s April 20, 2017 Regulated Price Plan Price Report: May 1, 2017 to April 30, 2018. A number of factors have contributed to this change:
o Changes in the payment amounts for Ontario Power Generation’s (OPG) prescribed generation facilities. On March 29, 2018, the OEB issued a Payment Amounts Order setting payment amounts for OPG’s prescribed nuclear and hydro generation for the January 1, 2017 through December 31, 2021 period. Although the previous supply cost forecast took into account 50% of the impact of OPG’s “as applied for” payment amounts, including 100% of the approved amounts increases supply cost during this forecast period.
o New generation coming into service, and in particular the gas-fired Napanee Generating Station, which will put upward pressure on the Global Adjustment.
o Market prices are expected to be lower than in the previous forecast period, primarily due to lower gas prices. Reductions in market prices are largely offset by increases in
$0
$20
$40
$60
$80
$100
$120
$140
$160
Cos
t to
Cla
ss B
Con
sum
ers
($/M
Wh)
Global AdjustmentMarket CostSupply Cost

Calculat ing the RPP Supply Cost 15
Global Adjustment costs. Class B consumers, including RPP customers, pay a higher proportion of Global Adjustment costs per MWh, so a reduction in market prices generally leads to a small increase in net (market prices plus Global Adjustment) costs per MWh.
o Changes in eligibility requirements for the Industrial Conservation Initiative have increased the number of customers participating in the program. This results in an increase to the proportion of Global Adjustment costs per MWh paid by Class B consumers, including RPP customers.
2.2.8 Cost Adjustment Term for IESO Variance Account
This section describes the calculation of the sixth term of Equation 1:
CRPP = M + α [(A – B) + (C – D) + (E – F) + G] + H
Previously, the calculation of RPP supply cost included variable H which represented the variance between RPP revenue and actual costs of RPP supply as reported by the IESO. Under the Fair Hydro Plan, the IESO no longer tracks this variance. Consequently, the OEB has adopted a value of $0.00 for variable H.
2.3 Correcting for the Bias Towards Unfavourable Variances
The supply costs discussed in section 2.2 are based on “most likely” forecasts of demand, HOEP, gas prices, generator operations, and other factors. However, none of these factors can be predicted with absolute certainty. Calculating the total RPP supply cost therefore needs to take into account the fact that volatility exists amongst the forecast parameters, and that there is a slightly greater likelihood of negative or unfavourable variances than favourable variances. For example, because nuclear generation plants tend to operate at capacity factors between 80% and 90%, these facilities are more likely to supply less energy than forecast (due to unscheduled outages) than to supply more than forecast (i.e., there is 10-20% upside versus 80-90% downside on the generator output). Similarly, during unexpectedly cold or hot weather, prices tend to be higher than expected as does RPP consumers’ demand for electricity. The net result is that it is more likely that RPP supply costs will exceed the forecast than fall below it, unless there is a minor adjustment to reflect the greater likelihood of unfavourable variances.
Based on OEB experience, the Adjustment to Address Bias Towards Unfavourable Variance is set at $1.00/MWh (0.100 cents per kWh). This amount is included in the RPP supply cost.
2.4 Total RPP Supply Cost
Table 2 shows the percentage of Ontario’s total electricity supply attributable to various generation sources, the percentage of forecasted Global Adjustment costs for each type of generation and the total unit costs. Total unit costs are based on contracted costs for each generation type, including Global Adjustment payments and market price payments, where applicable.

Calculat ing the RPP Supply Cost 16
Table 2: Total Electricity Supply Cost
% of Total % of Total Total Unit Cost
Supply GA (cents/kWh) Nuclear 57% 41% 7.7 Hydro 23% 12% 6.2 Gas 8% 14% 18.8 Wind 9% 15% 15.9 Solar 2% 15% 51.3 Bioenergy 1% 2% 23.6
Source: Power Advisory NB: Percentage (%) of Total GA excludes CDM costs.
The total RPP supply cost is estimated to be $7.4 billion.
The following table itemizes the various steps discussed above to arrive at an average RPP supply cost of $126.37/MWh. This average supply cost corresponds to an average RPP price, which is referred to as RPA, of 12.637 cents per kWh.
Table 3: Average RPP Supply Cost Summary
RPP Supply Cost Summary
for the period from May 1, 2018 through April 30, 2019 $/MWh Forecast Wholesale Electricity Price - Simple Average $19.64 Load-Weighted Costs for RPP Consumers Wholesale Electricity Cost - RPP-Weighted $21.57 Global Adjustment + $103.80 Adjustment to Address Bias Towards Unfavourable Variance + $1.00 Adjustment to Clear Existing Variance19 + $0.00 Average Supply Cost for RPP Consumers = $126.37
Source: Power Advisory
19 As discussed in Section 2.2.8, the OEB has adopted a value of $0.00 for the variance clearance adjustment.

Calculat ing the RPP Pr i ce 17
3. Calculating the RPP Price The previous chapter calculated a forecast of the total RPP supply cost. Given the forecast of total RPP demand, it also produced a computation of the average RPP supply cost and the average RPP supply price, known as the RPA. This chapter sets out the remaining steps in calculating the RPP TOU and tiered prices that would have been effective on May 1, 2018 if they had been determined under section 79.16 of the OEB Act without taking into account any forecasted impact of any provisions of the OFHP Act. As discussed in chapter 1, this calculation is being done for purposes other than setting the RPP prices that will be payable by RPP consumers in the May 1, 2018 to April 30, 2019 period. Those prices are set out in the OEB’s April 19, 2018 report Regulated Price Plan Prices and the Global Adjustment Modifier for the Period May 1, 2018 to April 30, 2019.
3.1 TOU Prices as Calculated under the OEB Act
For those consumers with eligible time-of-use (or “smart”) meters, prices are calculated for three separate price periods: On-peak (RPEMON), Mid-peak (RPEMMID), and Off-peak (RPEMOFF). The times when each of these periods applies is set out in the RPP Manual and also noted below. The load-weighted average price must be equal to the RPA.
As described in the RPP Manual, the three prices are calculated to recover the supply cost, given the load shape of TOU customers. The RPP Manual does not prescribe the order in which prices are calculated.
The first step in calculating the TOU prices for this forecast period was to set the Off-peak price, or RPEMOFF. This price reflects the forecast market price during that period, including the Global Adjustment. The Mid-peak price, RPEMMID, was similarly calculated. After these two prices were calculated, and given the forecast levels of consumption during each of the three periods, the calculation of the On-Peak price, RPEMON, is governed by the requirement for the load-weighted average of TOU prices to equal the RPA.
The various components of Global Adjustment costs are allocated to TOU consumption periods based on the type of cost. The costs associated with OPG’s rate-regulated facilities, Bruce Power’s nuclear plants, most renewable generation and CDM costs related to conservation programs are allocated uniformly across all consumption. The remaining portion of the CDM cost is allocated only to On-Peak consumption, because the purpose of the demand management portion of CDM is to ensure uninterrupted supply during peak times. Payments to Lennox are also allocated to the On-Peak period, for the same reason. Payments to natural gas generators have been allocated into the Mid-Peak and On-Peak periods. Though the gas generators operate in all three periods, costs for generation in Off-Peak times have been allocated to the On-Peak period, reflecting the system purpose for which many of the facilities were initially contracted: ensuring reliability of supply and being a dispatchable source of power at times of higher demand. The NUG component of the GA is allocated to both Mid-peak and On-Peak consumption because these generators serve non-Off-Peak consumption. As well, approximately one-quarter of the stochastic adjustment was allocated to the Mid-Peak price and three-quarters was allocated to the On-Peak price because the majority of risks covered by the adjustment are borne during these time periods.
The overall effect of this allocation is to set the differential between the On-Peak and Off-Peak prices to 2.0:1. This ratio strengthens the incentive for electricity consumers to shift their consumption away from On-Peak periods, when their electricity prices are highest.

Calculat ing the RPP Pr i ce 18
The OEB has calculated the RPP TOU prices that would have been effective on May 1, 2018 if determined under section 79.16 of the OEB Act as follows:
o RPEMOFF = 10.0 cents per kWh
o RPEMMID = 14.6 cents per kWh, and
o RPEMON = 20.3 cents per kWh.
These prices reflect the seasonal change in the TOU pricing periods which will take effect on May 1, 2018 and November 1, 2018. As defined in the RPP Manual, the time periods for TOU price application are as follows:
o Off-Peak period (priced at RPEMOFF):
Winter and summer weekdays: 7 p.m. to midnight and midnight to 7 a.m.
Winter and summer weekends and holidays: 24 hours (all day)
o Mid-Peak period (priced at RPEMMID)
Winter weekdays (November 1 to April 30): 11 a.m. to 5 p.m.
Summer weekdays (May 1 to October 31): 7 a.m. to 11 a.m. and 5 p.m. to 7 p.m.
o On-Peak period (priced at RPEMON)
Winter weekdays: 7 a.m. to 11 a.m. and 5 p.m. to 7p.m.
Summer weekdays: 11 a.m. to 5 p.m.
The above times are given in local time (i.e., the times given reflect daylight savings time in the summer).
The load profile assumed for TOU consumers is different from the load profile for non-TOU RPP consumers. RPP prices are calculated so that a TOU consumer with an average TOU load profile would pay the same average price as an RPP consumer that pays the tiered prices with a typical (non-TOU) load profile. This average price is equal to the RPA.
3.2 Tiered Prices as Calculated under the OEB Act
The final step is to calculate tiered prices. There is a two-tiered pricing structure: RPCMT1 (the price for consumption at or below the tier threshold) and RPCMT2 (the price for consumption above the tier threshold). The tier threshold is an amount of consumption per month.
The tiered prices are calculated so that the average per unit revenue would be equal to the RPA. This is achieved by maintaining the ratio between the original upper and lower tier prices (i.e., the ratio between 4.7 and 5.5 cents per kWh) and forecasting consumption above and below the threshold in each month of the forecast period.
RPP tiered prices are calculated such that the weighted average price will come as close as possible to the RPA, based on the forecast ratio of Tier 1 to Tier 2 consumption, and maintaining a 15-17% difference between Tier 1 and Tier 2 prices.
The OEB has calculated the RPP tiered prices that would have been effective on May 1, 2018 if determined under section 79.16 of the OEB Act as follows:
o RPCMT1 = 11.8 cents per kWh; and,
o RPCMT2 = 13.8 cents per kWh.
Calculat ing the RPP Pr i ce 19
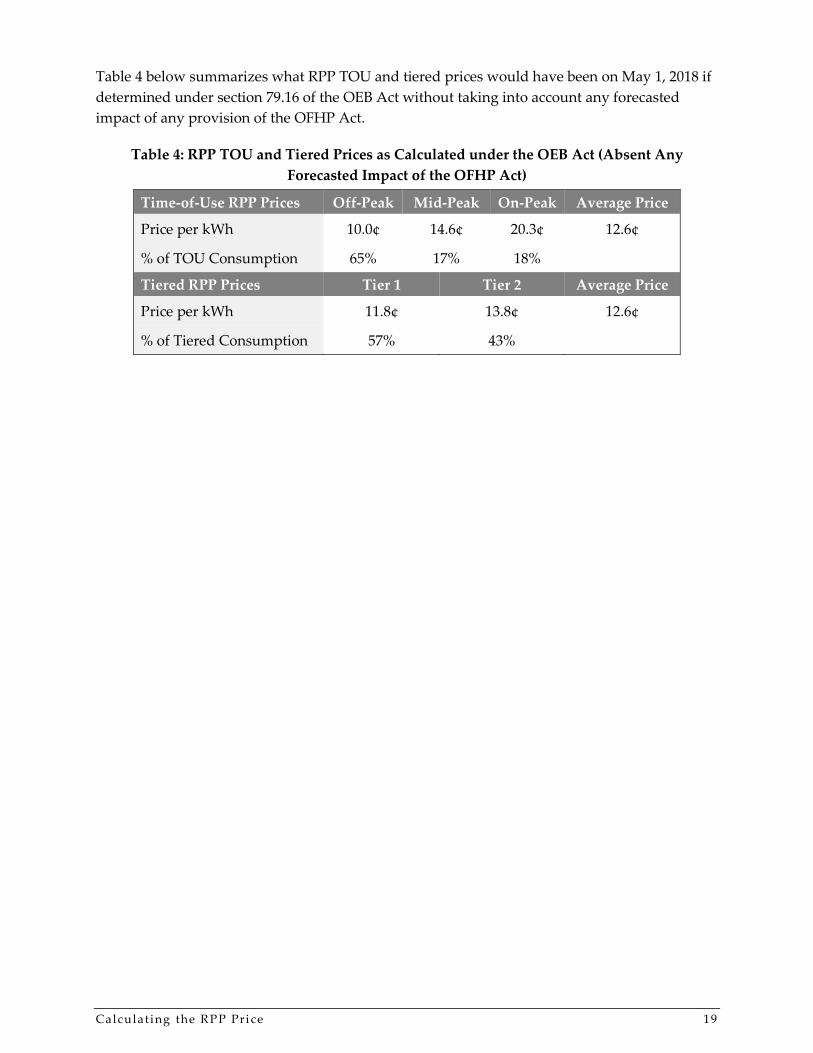
Table 4 below summarizes what RPP TOU and tiered prices would have been on May 1, 2018 if determined under section 79.16 of the OEB Act without taking into account any forecasted impact of any provision of the OFHP Act.
Table 4: RPP TOU and Tiered Prices as Calculated under the OEB Act (Absent Any Forecasted Impact of the OFHP Act)
Time-of-Use RPP Prices Off-Peak Mid-Peak On-Peak Average Price
Price per kWh 10.0¢ 14.6¢ 20.3¢ 12.6¢
% of TOU Consumption 65% 17% 18%
Tiered RPP Prices Tier 1 Tier 2 Average Price
Price per kWh 11.8¢ 13.8¢ 12.6¢
% of Tiered Consumption 57% 43%


