Regular report on alcohol-related harm indicators for...
36
Regular report on alcohol-related harm indicators for public hospitals Alcohol-attributable hospital admissions and alcohol-related emergency department presentations in the Northern Territory Health Gains Planning Department of Health, Northern Territory 24 February 2015
Transcript of Regular report on alcohol-related harm indicators for...

Regular report on alcohol-related harm indicators for public hospitals
Alcohol-attributable hospital admissions andalcohol-related emergency department presentations
in the Northern Territory
Health Gains PlanningDepartment of Health, Northern Territory
24 February 2015

Table of contents Section 1………………………………………………………………………………………… 2Northern Territory hospital alcohol-related harm indicators, definitions and limitations
Section 2………………………………………………………………………………………… 4Alcohol-attributable hospital admissions, Northern Territory hospitals, 2004-2014
Section 3………………………………………………………………………………………… 7Alcohol-related emergency department (ED) presentations, Northern Territory hospitals, 2005-2014
Appendices …………………………………………………………………………………… 11Appendix 1 Alcohol-attributable conditions for hospital admission………………………… 11
Appendix 2 Wholly and partially alcohol-related conditions as either a presenting problem or principal diagnosis for emergency department presentations……………………………. 13
Appendix 3 Numbers and rates of hospital admission, adjusted for attributable fractions, for specific alcohol-attributable conditions, Northern Territory hospitals, 2004-2014…….. 15
Appendix 4 Numbers of alcohol-related presentations, Northern Territory hospital emergency departments………………………………………………………………………… 19
List of figures …………………………………………………………………………………. 25List of tables…………………………………………………………………………………… 26
Regular report on alcohol-related harm indicators for public hospitals Page 1

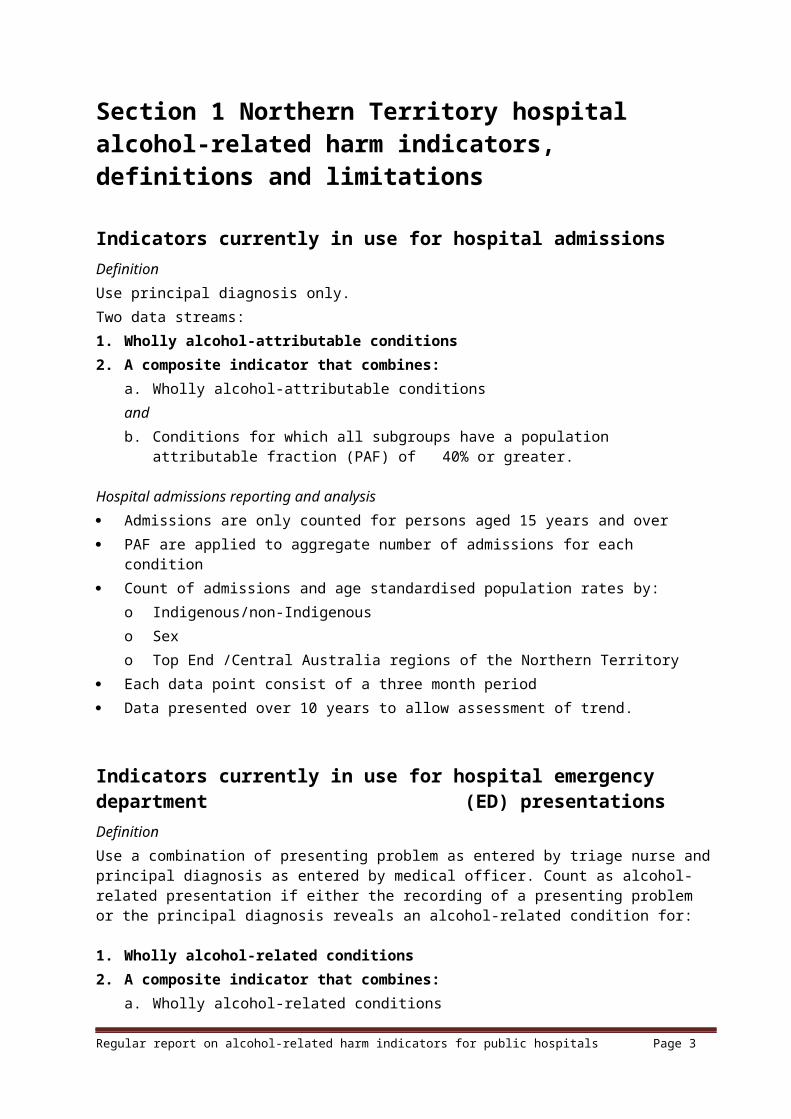
Section 1 Northern Territory hospital alcohol-related harm indicators, definitions and limitations
Indicators currently in use for hospital admissionsDefinitionUse principal diagnosis only. Two data streams:1. Wholly alcohol-attributable conditions2. A composite indicator that combines:
a. Wholly alcohol-attributable conditionsandb. Conditions for which all subgroups have a population attributable fraction (PAF) of
40% or greater.
Hospital admissions reporting and analysis Admissions are only counted for persons aged 15 years and over PAF are applied to aggregate number of admissions for each condition Count of admissions and age standardised population rates by:
o Indigenous/non-Indigenouso Sexo Top End /Central Australia regions of the Northern Territory
Each data point consist of a three month period Data presented over 10 years to allow assessment of trend.
Indicators currently in use for hospital emergency department (ED) presentationsDefinitionUse a combination of presenting problem as entered by triage nurse and principal diagnosis as entered by medical officer. Count as alcohol-related presentation if either the recording of a presenting problem or the principal diagnosis reveals an alcohol-related condition for:
1. Wholly alcohol-related conditions2. A composite indicator that combines:
a. Wholly alcohol-related conditionsandb. Conditions for which all subgroups have a population attributable fraction (PAF) of
40% or greater for corresponding hospital admissions codes.
Regular report on alcohol-related harm indicators for public hospitals Page 2

ED presentations reporting and analysis Presentations are only counted for persons aged 15 years and over All presentations are counted as one presentation. The PAF is not applied to adjust the
number of presentations Alcohol-related presentations and total number of all presentations by:
o Indigenous/non-Indigenouso Sexo All Northern Territory hospitals and all hospitals combined
Each data point consists of a three month period Data presented for all available data to allow assessment of trend.
Data limitations Alcohol-attributable hospital admissionsHospital admissions are coded using International Classification of Disease version 10 (ICD-10-AM) by professional coders, providing a reliable foundation for reporting. International studies have developed a series of attributable fractions for health conditions related to alcohol. These measures have not been validated specifically in the NT and there are likely to be some notable differences, however their use provides a picture of alcohol-attributable NT hospital admissions and a useful comparative measure with other jurisdictions.
Alcohol-related emergency department presentationsThere is no universal coding and classification system for emergency department (ED) presentations. A standardised subset of ICD-10-AM codes is used in the NT to allow consistent analysis of ED data for all hospitals. Comparison with other states and territories is not available.
A major advantage of ED presentation data is that it is available almost in real time. A major disadvantage is that ED coding is undertaken at the time of presentation and medical officers are only required to record the principal diagnosis - the major diagnosis for which the patient is treated. This may or may not reflect an alcohol-related contribution.
There is the capacity to record secondary diagnoses in the ED dataset, though in practice this is not a treatment priority and adherence to the practice varies between individuals and hospitals. Inconsistency in ED data collection means there is no national or international basis on which to develop the attributable fractions approach used for hospital admissions.
Regular report on alcohol-related harm indicators for public hospitals Page 3
Section 2 Alcohol-attributable hospital admissions, Northern Territory hospitals, 2004-2014
Time period: 2004 to the third quarter (Q3) of 2014.
Routine standard indicators reported:
Rates of hospital admission for 100% alcohol-attributable conditions, for the Northern Territory Top End region
Rates of hospital admission for 100% alcohol-attributable conditions, for the Northern Territory Central Australia region
Rates of hospital admission for 40% or greater alcohol-attributable conditions, for the Northern Territory Top End region
Rates of hospital admissions for 40% or greater alcohol-attributable conditions, for the Northern Territory Central Australia region.
Regular report on alcohol-related harm indicators for public hospitals Page 4

Figure 1 Rates of hospital admission, each quarter, for conditions that are 100% alcohol-attributable, by Indigenous status and sex, Northern Territory Top End region, 2004-2014*
Figure 2 Rates of hospital admission, each quarter, for conditions that are 100% alcohol-attributable, by Indigenous status and sex, Northern Territory Central Australia region, 2004-2014
*Note: scale on Y-axes vary between Fig.1 and Fig.2
Regular report on alcohol-related harm indicators for public hospitals Page 5

Figure 3 Rates of hospital admission, each quarter, for conditions that are 40% or greater alcohol-attributable, by Indigenous status and sex, Northern Territory Top End region, 2004-2014
Figure 4 Rates of hospital admission, each quarter, for conditions that are 40% or greater alcohol-attributable, by Indigenous status and sex, Northern Territory Central Australia region, 2004-2014
Regular report on alcohol-related harm indicators for public hospitals Page 6

Section 3 Alcohol-related emergency department (ED) presentations, Northern Territory hospitals, 2005-2014
Time period: 2005 to 2014.
Routine standard indicators reported:
All ED presentations
Composite (wholly and partially) alcohol-related ED presentations
Wholly alcohol-related ED presentations.
Regular report on alcohol-related harm indicators for public hospitals Page 7

Figure 5 Number of emergency department (ED) presentations, by quarter, for all presentations and alcohol-related presentations, using composite ED alcohol indicator, Northern Territory hospitals, 2005-2014*
**Note: scale on Y-axes vary between graphs
Regular report on alcohol-related harm indicators for public hospitals Page 8

Figure 6 Number of alcohol-related emergency department (ED) presentations, by quarter, using composite ED alcohol indicator, by Indigenous status, Northern Territory hospitals, 2005-2014*
**Note: scale on Y-axes vary between graphs
Regular report on alcohol-related harm indicators for public hospitals Page 9
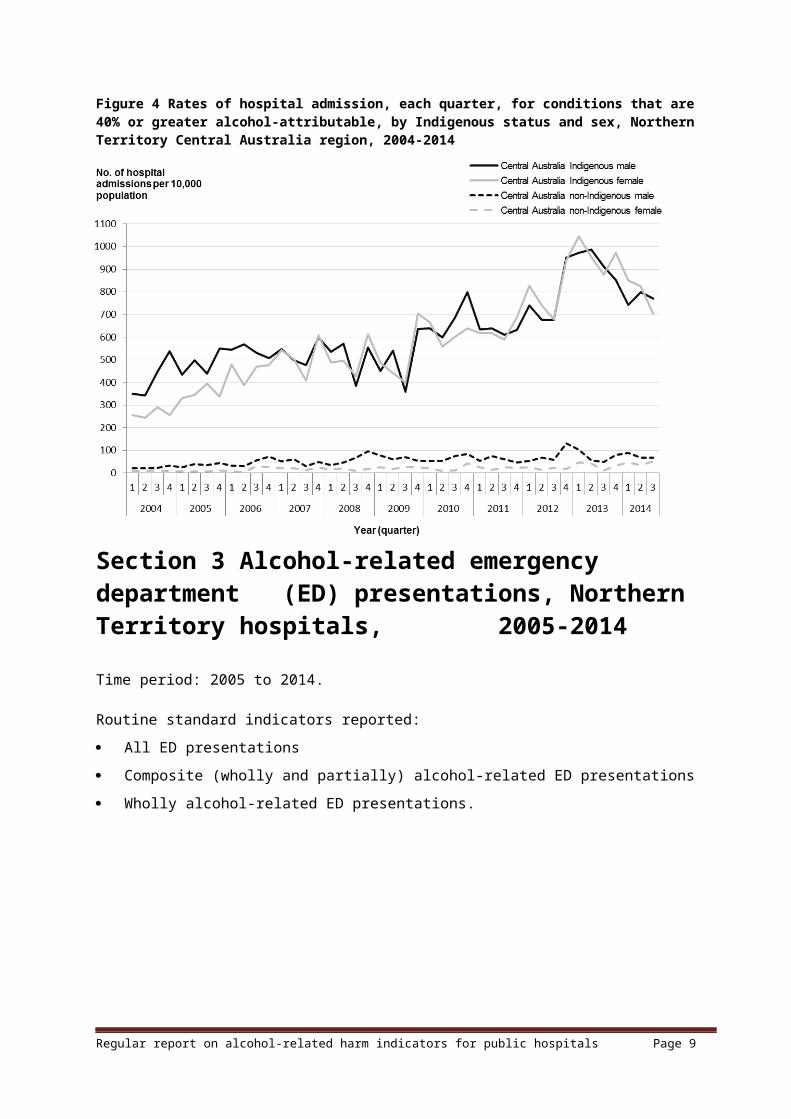
Figure 7 Number of alcohol-related emergency department presentations, by quarter, for wholly alcohol-related presentations, by Indigenous status, Northern Territory hospitals, 2005-2014*
**Note: scale on Y-axes vary between graphs
Regular report on alcohol-related harm indicators for public hospitals Page 10

Appendices
Appendix 1 Alcohol-attributable conditions for hospital admissionTable 1a Wholly alcohol-attributable conditions with an attributable fraction of 100% for hospital admission
ICD-10-AM code ICD-10-AM description1. F10.0- F10.9 Mental and behavioural disorders due to alcohol use
2. F10.0 Acute intoxication
3. F10.1 Harmful use
4. F10.2 Dependence syndrome
5. F10.3 Withdrawal state
6. F10.4 Withdrawal with delirium
7. F10.5 Psychotic disorder
8. F10.6 Amnesic
9. F10.7 Residual & late onset psychotic disorder
10. F10.8 Other mental/behavioural disorders
11. F10.9 Unspecified mental/behavioural disorders
12. I42.6 Alcoholic cardiomyopathy
13. G31.2 Degeneration of nervous system due to alcohol
14. G62.1 Alcoholic polyneuropathy
15. G72.0 Alcoholic myopathy
16. K29.2 Alcoholic gastritis
17. K70 Alcoholic liver disease
18. K85.2 Alcohol-induced acute pancreatitis
19. K86.0 Alcohol-induced chronic pancreatitis
20. T51.0 Toxic effects of alcohol - ethanol
21. T51.1 Toxic effects of alcohol - methanol
22. T51.9 Toxic effects of alcohol – alcohol unspecified
23. X45 Accidental poisoning by and exposure to alcohol
24. Y15 Poisoning by and exposure to alcohol, undetermined intent
25. X65 Intentional self-poisoning by and exposure to alcohol
Regular report on alcohol-related harm indicators for public hospitals Page 11

Table 1b Partially alcohol-attributable conditions with an attributable fraction of 40% or greater for hospital admission
ICD-10-AM code ICD-10-AM description1. C01-C06, C09- C10,
C12 - C14Oropharyngeal Cancer
2. C15 Oesophageal cancer
3. C22 Liver cancer
4. C32 Laryngeal cancer
5. G40, G41 Epilepsy & status epilepticus
6. I85, I98.2, 198.20, I98.21 Oesophageal varices
7. K22.6 Gastro oesophageal haemorrhage
8. K74.3 - K74.6, K76.0, K76.9 Unspecified liver cirrhosis
9. X85-Y09, Y87.1 Assault
10. K85.9, K86.0 & K85.2 Acute pancreatitis, unspecified (collectively)
Regular report on alcohol-related harm indicators for public hospitals Page 12

Appendix 2 Wholly and partially alcohol-related conditions as either a presenting problem or principal diagnosis for emergency department presentations
Table 2a Emergency department wholly and partially alcohol-related conditions as the principal diagnosis
Emergency department code
Emergency department description Whollyalcohol-related
1. C002C069/1C069/2C109C109/1
Malignant neoplasm lipMalignant neoplasm mouthMalignant neoplasm oral cavityMalignant neoplasm pharynxMalignant neoplasm oropharynx
2. C159 Malignant neoplasm oesophagus
3. C229 Malignant neoplasm liver
4. C329 Malignant neoplasm larynx
5. F100/1 Alcohol intoxication in alcoholic X6. F100/2 Alcohol intoxication X7. F101 Alcohol abuse disorder X8. F102 Alcohol addiction X9. F105/1 Alcohol hallucinosis X10. F105/2 Alcohol withdrawal syndrome X11. F105 Alcoholic psychosis X12. F104 Delirium tremens X13. E51.2 Wernicke’s encephalopathy
14. G405 Alcohol related seizure X15. G934 Encephalopathy
16. I850I859
Oesophageal varices with bleedingOesophageal varices without bleeding
17. K292 Alcoholic gastritis X18. K701 Alcoholic hepatitis X19. K703 Cirrhosis with alcoholism X20. K729/1
K729/2K729/3
Hepatic comaHepatic decompensationHepatic encephalopathy
21. K746/1 Hepatic cirrhosis
22. K766 Cirrhosis with portal hypertension
23. K85K86.1
Acute pancreatitisOther chronic pancreatitis
24. K920/1K920/2
Blood in vomitusHaematemesis
25. R780 Blood alcohol level elevated X26. S02.60 Fracture, mandible
27. T51.0 Ethyl alcohol poisoning X28. T51.8 Other alcohol poisoning X
Regular report on alcohol-related harm indicators for public hospitals Page 13

29. T749/2T749/3T749/4
Domestic assaultAssault, not domesticDomestic violence
30. X990X991X999
Stabbing by domestic partnerStabbing, Domestic, except partnerStabbing, Other, not domestic
31. Z032/2 Violent behaviour
32. Z032/1 Antisocial behaviour
33. Z032/4 Behavioural problems – adult
34. Z04.4 Examination & observation following alleged rape & seduction
35. Z045/1Z045/3
Observation following criminal assaultObservation of child or wife battering victim
36. Z048/2 Police request for drug screen only
37. Z048/1 Blood alcohol level only X
Table 2b Emergency department wholly and partially alcohol-related conditions as a presenting problem
ED presenting problem code
ED presenting problem description
Whollyalcohol-related
ALCO Alcohol intoxication XALWD Alcohol withdrawal XASLT Assault
BAL Blood alcohol level XBPR Blood police request
HAEM Haematemesis
STAB Stab wound
VIOL Violent behaviour
Regular report on alcohol-related harm indicators for public hospitals Page 14

Appendix 3 Numbers and rates of hospital admission, adjusted for attributable fractions, for specific alcohol-attributable conditions, Northern Territory hospitals, 2004-2014Table 3 Hospital admission numbers and rates, for 100% alcohol-attributable conditions, by Indigenous status and sex, Northern Territory Top End region, 2004-2014
Top End regionIndigenous male Indigenous
femaleNon-Indigenous male
Non-Indigenous female
Total
Year (quarter)
No. Rate No. Rate No. Rate No. Rate No.
2004_1 19 49.4 15 35.3 19 12.3 7 5.4 602004_2 23 80.0 16 43.1 24 15.4 5 6.3 682004_3 20 54.0 23 62.2 17 11.2 5 3.9 652004_4 36 96.1 19 50.3 26 17.1 7 7.5 882005_1 31 79.4 16 37.1 26 19.8 8 6.7 812005_2 17 41.9 19 42.4 26 16.9 5 3.7 672005_3 31 92.1 14 31.6 18 14.5 8 6.2 712005_4 39 102.8 16 47.5 40 30.2 8 6.4 1032006_1 19 45.2 16 34.2 28 20.0 14 11.7 772006_2 20 55.3 21 51.4 41 30.3 6 4.3 882006_3 33 86.4 25 48.4 34 23.5 11 8.0 1032006_4 31 84.0 14 31.1 29 22.2 16 12.8 902007_1 32 75.4 3 4.3 27 18.6 15 10.7 772007_2 33 88.5 15 37.4 14 10.3 7 4.9 692007_3 30 74.3 17 44.0 23 14.3 16 11.8 862007_4 43 119.6 19 41.9 36 23.2 21 15.2 1192008_1 35 93.7 11 26.7 42 24.9 12 8.4 1002008_2 31 84.5 18 44.6 47 28.6 15 11.3 1112008_3 39 95.6 26 73.6 25 15.9 9 8.4 992008_4 35 98.0 20 50.0 31 21.0 13 9.4 992009_1 25 66.2 24 59.6 25 14.6 5 4.4 792009_2 38 103.8 25 59.7 21 13.0 11 7.9 952009_3 39 115.5 16 42.5 29 19.3 14 9.9 982009_4 25 64.7 25 63.7 25 16.1 15 12.2 902010_1 31 85.4 20 46.4 29 18.7 10 7.9 902010_2 33 81.2 17 42.3 36 24.0 20 13.6 1062010_3 36 110.7 28 72.6 28 17.8 26 17.7 1182010_4 37 89.2 19 43.5 23 15.4 16 11.9 952011_1 58 138.1 20 53.4 27 15.3 10 9.5 1152011_2 51 132.2 21 55.4 31 18.2 3 2.0 1062011_3 38 97.4 26 73.3 28 16.0 9 6.1 1012011_4 41 98.4 27 68.1 34 19.8 8 8.4 1102012_1 37 101.7 32 78.4 30 17.0 9 5.9 1082012_2 38 94.7 34 78.2 18 10.0 13 9.6 1032012_3 36 103.9 24 55.0 27 15.2 5 3.2 922012_4 43 107.1 31 77.5 37 21.5 12 8.5 1232013_1 44 114.3 25 64.6 32 17.9 15 9.7 1162013_2 49 129.1 21 48.1 33 19.0 14 9.8 1172013_3 32 79.1 20 49.6 27 16.1 7 6.5 862013_4 41 120.7 32 82.8 30 17.2 10 6.5 1132014_1 29 84.0 23 52.9 26 14.2 9 6.1 872014_2 37 90.4 26 66.1 22 12.3 7 4.6 92
Regular report on alcohol-related harm indicators for public hospitals Page 15

2014_3 51 141.3 20 61.8 22 12.0 5 4.7 98Table 4 Hospital admission numbers and rates for 100% alcohol-attributable conditions, by Indigenous status and sex, Northern Territory Central Australia region, 2004-2014
Central Australia regionIndigenous male Indigenous
femaleNon-Indigenous male
Non-Indigenous female
Total
Year (quarter) No. Rate No. Rate No. Rate No. Rate No.
2004_1 38 204.7 20 113.7 2 6.1 2 6.2 622004_2 34 204.3 13 76.2 4 12.6 3 9.6 542004_3 31 190.9 18 89.3 4 11.7 2 7.3 552004_4 59 336.6 17 89.3 6 19.3 3 9.3 852005_1 42 250.8 17 85.0 5 15.6 1 3.1 652005_2 50 279.9 18 104.8 2 6.4 0 0.0 702005_3 52 288.0 15 88.1 4 11.8 1 3.1 722005_4 31 187.8 15 79.5 7 23.8 2 7.1 552006_1 47 293.1 16 78.2 4 12.5 1 3.3 682006_2 51 329.8 19 100.9 6 20.0 1 4.0 772006_3 47 268.2 21 108.0 11 36.2 8 28.3 872006_4 48 316.0 24 124.7 19 59.0 4 12.5 952007_1 43 244.9 22 104.9 9 28.4 3 17.0 772007_2 45 262.5 27 124.9 8 38.5 4 12.8 842007_3 39 223.4 28 136.4 5 16.4 1 2.9 732007_4 55 324.7 37 187.0 8 26.1 7 21.6 1072008_1 42 265.1 38 188.7 8 24.1 2 12.7 902008_2 51 288.3 37 180.0 4 11.5 6 18.4 982008_3 36 202.0 44 215.4 12 56.5 3 9.1 952008_4 54 279.5 40 174.9 18 66.3 5 15.9 1172009_1 43 205.0 35 172.6 18 56.1 6 16.7 1022009_2 47 270.8 39 193.9 12 35.9 4 18.2 1022009_3 30 160.9 39 189.1 13 50.6 5 14.6 872009_4 51 302.9 61 337.1 10 29.6 3 9.1 1252010_1 55 322.0 60 295.3 11 33.1 5 17.3 1312010_2 53 293.6 49 227.1 9 24.1 2 5.8 1132010_3 69 375.2 57 280.4 19 53.2 3 9.4 1482010_4 68 408.0 57 289.8 23 64.6 9 27.1 1572011_1 53 326.3 53 258.6 13 35.0 7 19.7 1262011_2 59 378.4 48 242.4 20 57.5 3 9.5 1302011_3 62 395.4 52 262.2 11 37.6 6 16.7 1312011_4 57 338.0 57 290.2 10 32.2 5 14.6 1292012_1 71 411.8 77 395.8 15 44.3 4 11.3 1672012_2 78 442.1 61 302.3 15 42.7 1 3.0 1552012_3 71 447.3 68 344.4 14 38.9 6 18.4 1592012_4 111 678.4 90 452.1 25 69.9 4 13.3 2302013_1 112 671.9 115 568.5 24 65.8 10 31.9 2612013_2 109 679.4 124 616.6 17 44.5 11 30.7 2612013_3 98 614.1 101 500.9 10 30.6 3 7.6 2122013_4 98 581.1 117 563.3 16 43.1 7 21.8 2382014_1 76 460.1 105 485.5 23 62.6 11 36.7 2152014_2 81 524.2 95 483.4 18 47.7 6 17.5 2002014_3 73 495.1 77 380.3 20 52.4 10 30.9 180
Regular report on alcohol-related harm indicators for public hospitals Page 16

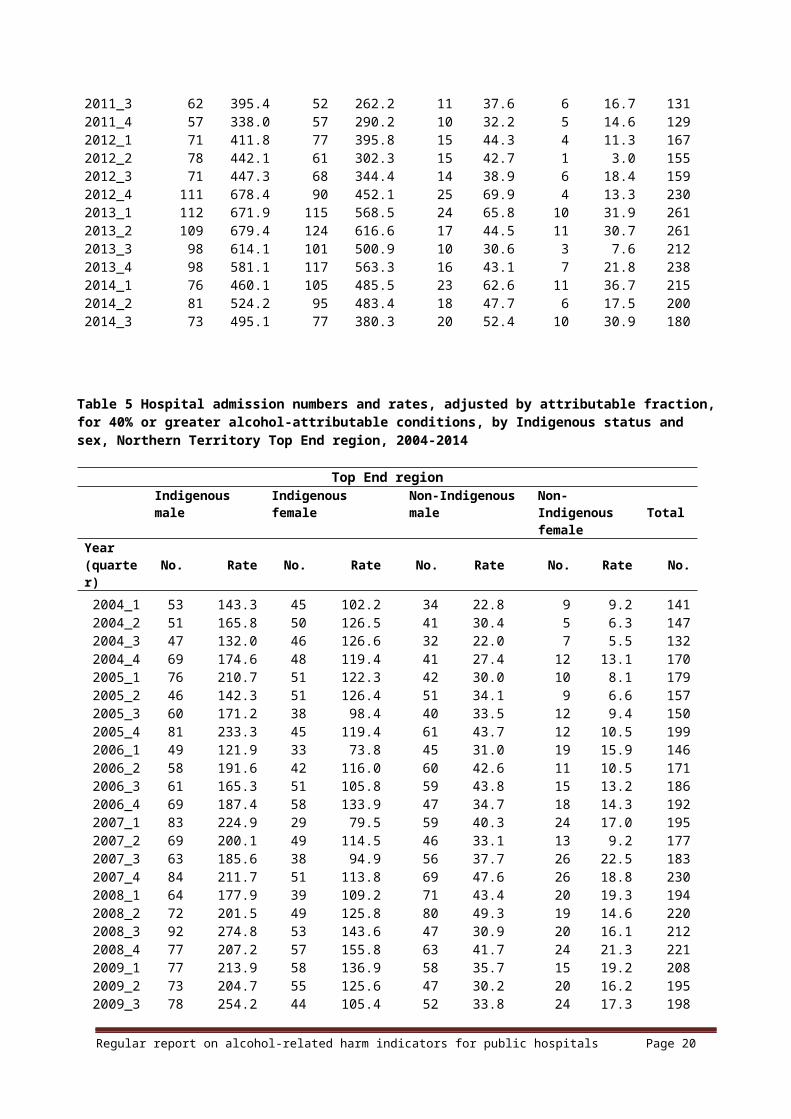
Table 5 Hospital admission numbers and rates, adjusted by attributable fraction, for 40% or greater alcohol-attributable conditions, by Indigenous status and sex, Northern Territory Top End region, 2004-2014
Top End regionIndigenous male Indigenous
femaleNon-Indigenous male
Non-Indigenous female
Total
Year (quarter) No. Rate No. Rate No. Rate No. Rate No.
2004_1 53 143.3 45 102.2 34 22.8 9 9.2 1412004_2 51 165.8 50 126.5 41 30.4 5 6.3 1472004_3 47 132.0 46 126.6 32 22.0 7 5.5 1322004_4 69 174.6 48 119.4 41 27.4 12 13.1 1702005_1 76 210.7 51 122.3 42 30.0 10 8.1 1792005_2 46 142.3 51 126.4 51 34.1 9 6.6 1572005_3 60 171.2 38 98.4 40 33.5 12 9.4 1502005_4 81 233.3 45 119.4 61 43.7 12 10.5 1992006_1 49 121.9 33 73.8 45 31.0 19 15.9 1462006_2 58 191.6 42 116.0 60 42.6 11 10.5 1712006_3 61 165.3 51 105.8 59 43.8 15 13.2 1862006_4 69 187.4 58 133.9 47 34.7 18 14.3 1922007_1 83 224.9 29 79.5 59 40.3 24 17.0 1952007_2 69 200.1 49 114.5 46 33.1 13 9.2 1772007_3 63 185.6 38 94.9 56 37.7 26 22.5 1832007_4 84 211.7 51 113.8 69 47.6 26 18.8 2302008_1 64 177.9 39 109.2 71 43.4 20 19.3 1942008_2 72 201.5 49 125.8 80 49.3 19 14.6 2202008_3 92 274.8 53 143.6 47 30.9 20 16.1 2122008_4 77 207.2 57 155.8 63 41.7 24 21.3 2212009_1 77 213.9 58 136.9 58 35.7 15 19.2 2082009_2 73 204.7 55 125.6 47 30.2 20 16.2 1952009_3 78 254.2 44 105.4 52 33.8 24 17.3 1982009_4 69 184.8 71 169.7 54 33.8 24 19.8 2182010_1 71 199.2 50 124.2 59 37.1 16 13.8 1962010_2 70 187.0 45 102.4 61 38.4 27 18.5 2032010_3 80 235.5 66 162.2 57 37.3 35 24.4 2382010_4 94 263.8 53 117.7 50 32.5 26 18.6 2232011_1 91 225.8 53 128.3 61 34.9 21 18.7 2262011_2 87 222.8 45 104.1 78 46.1 28 19.0 2382011_3 84 234.0 60 146.1 56 35.4 16 10.5 2162011_4 83 216.0 78 172.6 64 40.3 19 15.4 2442012_1 84 258.0 64 152.5 70 40.2 18 12.6 2362012_2 68 178.3 60 132.2 52 29.1 32 26.4 2122012_3 80 235.3 57 126.0 59 37.1 19 15.8 2152012_4 83 207.2 61 144.6 70 39.7 30 22.0 2442013_1 89 241.0 68 157.6 64 37.0 27 17.3 2482013_2 77 193.4 48 111.8 72 40.1 28 20.0 2252013_3 83 213.0 58 133.7 58 33.2 24 17.7 2232013_4 85 254.0 62 150.7 61 35.4 28 23.9 2362014_1 69 204.3 54 123.9 50 27.34 20 16.8 1932014_2 76 203.7 51 117.8 52 30.72 18 11.9 1972014_3 86 225.7 51 131.8 54 31.9 15 14.2 206
Regular report on alcohol-related harm indicators for public hospitals Page 17

Table 6 Hospital admission numbers and rates, adjusted by attributable fraction, for 40% or greater alcohol-attributable conditions, by Indigenous status and sex, Northern Territory Central Australia region, 2004-2014
Central Australia regionIndigenous male Indigenous female Non-Indigenous
maleNon-Indigenous female
Total
Year (quarter)
No. Rate No. Rate No. Rate No. Rate No.
2004_1 65 349.8 51 257.1 7 22.0 3 9.4 1262004_2 60 343.7 49 244.0 7 21.3 3 9.57 1192004_3 72 449.0 63 292.6 8 23.8 3 11.24 1462004_4 93 538.0 57 256.9 10 33.0 3 9.29 1632005_1 78 434.1 69 331.4 8 25.3 2 6.27 1572005_2 93 498.2 70 346.3 10 39.5 2 6.14 1752005_3 84 439.1 80 394.1 9 34.8 2 6.07 1752005_4 91 549.6 68 338.0 13 43.9 3 11.1 1752006_1 93 545.3 101 480.2 10 32.6 2 6.52 2062006_2 95 568.9 83 386.6 10 31.6 1 3.95 1892006_3 92 531.1 97 470.7 17 55.5 9 31.59 2152006_4 85 507.8 102 477.3 23 73.4 6 26.2 2162007_1 102 547.1 117 542.3 17 52.7 4 20.2 2402007_2 90 498.1 100 502.3 15 61.5 7 22.24 2122007_3 82 476.8 88 407.9 9 29.6 5 15.07 1842007_4 106 600.2 127 609.5 16 49.8 8 24.53 2572008_1 92 535.6 104 489.4 12 36.2 3 15.78 2112008_2 97 570.8 105 495.0 12 45.9 7 21.23 2212008_3 67 386.5 91 427.4 16 69.3 3 9.05 1772008_4 106 554.5 136 614.1 27 95.3 6 18.75 2752009_1 96 451.4 110 486.9 26 78.7 9 25.69 2412009_2 96 541.5 92 440.8 17 60.6 4 18.15 2092009_3 68 359.9 90 398.9 18 69.6 9 25.66 1852009_4 110 637.3 143 703.9 18 53.0 8 26.51 2792010_1 112 639.9 140 665.2 19 54.4 6 20.29 2772010_2 115 598.4 127 560.2 20 55.0 3 9.13 2652010_3 126 686.0 131 600.6 27 76.2 4 12.23 2882010_4 136 798.8 138 640.3 29 84.3 11 41.53 3142011_1 117 634.5 137 619.1 20 55.2 9 26.44 2832011_2 109 638.9 130 617.6 26 75.7 5 14.97 2702011_3 103 612.1 131 590.7 19 60.2 9 25.44 2622011_4 110 631.6 147 689.4 15 46.7 8 24.39 2802012_1 139 739.8 178 827.9 18 53.4 9 26.56 3442012_2 124 676.4 165 739.6 24 68.1 5 14.72 3182012_3 116 677.7 149 678.4 21 57.6 8 23.87 2942012_4 162 952.7 200 940.3 41 131.5 6 19.32 4092013_1 174 972.2 225 1045.0 38 102.4 16 47.7 4532013_2 170 986.6 205 955.0 21 56.0 15 41.6 4112013_3 149 912.4 190 876.0 17 49.0 5 12.7 3612013_4 151 853.2 210 972.2 29 80.3 11 33.8 4012014_1 125 743.1 189 850.6 33 88.6 15 47.6 3622014_2 132 798.8 168 825.5 26 69.1 12 35.0 3382014_3 119 771.7 150 701.5 26 67.8 17 50.9 312
Regular report on alcohol-related harm indicators for public hospitals Page 18

Regular report on alcohol-related harm indicators for public hospitals Page 19

Appendix 4 - Numbers of alcohol-related presentations, Northern Territory hospital emergency departments
Table 7 Number of emergency department (ED) presentations, by quarter, for all presentations and alcohol-related presentations, using composite ED alcohol indicator, by Indigenous status, Northern Territory hospitals, 2005-2014
RDH ASH KH GDH TCH TOTAL
Year(quarter)
Indigenous Non-Indigenous
Total Indigenous Non-Indigenous
Total Indigenous Non-Indigenous
Total Indigenous Non-Indigenous
Total Indigenous Non-Indigenous
Total
2005_3 2540 7614 10154 3337 2989 6326 1200 1742 2942 703 1317 2020 1022 1153 2175 23617
2005_4 3274 6871 10145 3365 2877 6242 1413 1552 2965 771 1377 2148 1355 1170 2525 24025
2006_1 3098 6780 9878 3582 2784 6366 1339 1197 2536 789 1375 2164 1371 903 2274 23218
2006_2 2901 7431 10332 3116 2845 5961 1049 1598 2647 669 1116 1785 1115 794 1909 22634
2006_3 2767 8181 10948 3341 3005 6346 1198 1764 2962 555 1150 1705 1192 797 1989 23950
2006_4 3233 7929 11162 3139 2871 6010 1418 1492 2910 677 1038 1715 1287 829 2116 23913
2007_1 3699 7701 11400 3748 2810 6558 1478 1322 2800 827 1151 1978 1517 797 2314 25050
2007_2 3131 7814 10945 3469 3165 6634 1212 1617 2829 620 934 1554 1454 801 2255 24217
2007_3 2960 8305 11265 3540 3365 6905 1405 1774 3179 541 911 1452 1437 940 2377 25178
2007_4 3626 7752 11378 3695 2998 6693 1476 1455 2931 576 964 1540 1493 852 2345 24887
2008_1 3697 7673 11370 3679 3045 6724 1316 1374 2690 552 857 1409 1670 799 2469 24662
2008_2 3106 7711 10817 3545 3061 6606 1179 1667 2846 385 1046 1431 1657 821 2478 24178
2008_3 3134 8511 11645 3471 3447 6918 1297 1722 3019 439 1110 1549 1651 1048 2699 25830
2008_4 3564 7590 11154 4103 3142 7245 1476 1384 2860 540 1033 1573 1716 979 2695 25527
2009_1 3654 7290 10944 4447 3088 7535 1494 1343 2837 559 966 1525 1752 875 2627 25468
2009_2 3000 8161 11161 3813 3699 7512 1201 1648 2849 425 918 1343 1418 821 2239 25104
2009_3 3047 9235 12282 4248 3922 8170 1248 2045 3293 497 861 1358 1504 962 2466 27569
2009_4 3379 7872 11251 4407 3401 7808 1253 1472 2725 564 910 1474 1319 1039 2358 25616
2010_1 3826 7782 11608 4677 3316 7993 1222 1287 2509 606 891 1497 1497 836 2333 25940
2010_2 3436 8434 11870 4366 3496 7862 1286 1634 2920 459 1208 1667 1511 1021 2532 26851
2010_3 3557 9018 12575 4243 3671 7914 1235 1977 3212 563 1173 1736 1459 997 2456 27893
2010_4 3963 8590 12553 4816 3568 8384 1371 1381 2752 594 1080 1674 1627 1017 2644 28007
2011_1 4066 8520 12586 5464 3546 9010 1388 1476 2864 534 941 1475 2234 986 3220 29155
Regular report on alcohol-related harm indicators for public hospitals Page 20
2011_2 3429 9019 12448 4729 3925 8654 1078 1652 2730 512 988 1500 1889 1121 3010 28342
2011_3 3582 9699 13281 4868 4068 8936 1236 1721 2957 677 1114 1791 1858 1152 3010 29975
2011_4 4013 9103 13116 4909 3457 8366 1458 1485 2943 595 1072 1667 1909 938 2847 28939
2012_1 4023 9005 13028 5064 3294 8358 1504 1518 3022 537 909 1446 1782 783 2565 28419
2012_2 3560 9377 12937 4656 3797 8453 1284 1671 2955 554 931 1485 1800 1003 2803 28633
2012_3 3645 9952 13597 4700 3662 8362 1398 2026 3424 515 937 1452 1698 1044 2742 29577
2012_4 4052 9571 13623 4829 3572 8401 1727 1642 3369 551 973 1524 1878 829 2707 29624
2013_1 4335 9181 13516 5302 3258 8560 1662 1348 3010 654 879 1533 1859 798 2657 29276
2013_2 3600 9820 13420 5099 3677 8776 1479 1795 3274 578 921 1499 1801 918 2719 29688
2013_3 3530 10104 13634 5447 4078 9525 1487 1989 3476 561 932 1493 1628 950 2578 30706
2013_4 3956 9546 13502 5013 3695 8708 1469 1691 3160 595 832 1427 1565 869 2434 29231
2014_1 4344 9280 13624 4864 3660 8524 1529 1407 2936 536 777 1313 1688 821 2509 28906
2014_2 3720 9232 12952 4458 4166 8624 1316 1854 3170 551 715 1266 1370 671 2041 28053
2014_3 3896 9477 13373 4700 4282 8982 1383 1914 3297 531 652 1183 1473 745 2218 29053
2014_4 4362 8936 13298 5000 3749 8749 1401 1584 2985 540 745 1285 1499 839 2338 28655
Regular report on alcohol-related harm indicators for public hospitals Page 21

Table 8 Number of emergency department (ED) presentations, by quarter, using composite ED alcohol indicator, by Indigenous status, Northern Territory hospitals, 2005-2014
RDH ASH KH GDH TCH TOTALYear(quarter)
Indigenous Non-Indigenous
Total Indigenous Non-Indigenous
Total Indigenous Non-Indigenous
Total
Indigenous Non-Indigenous
Total Indigenous
Non-Indigenous
Total
2005_3 270 232 502 555 42 597 117 19 136 46 8 54 68 8 76 1365
2005_4 370 258 628 609 88 697 176 32 208 56 10 66 89 20 109 1708
2006_1 362 242 604 742 75 817 160 23 183 53 7 60 125 16 141 1805
2006_2 293 221 514 508 60 568 128 33 161 44 9 53 146 9 155 1451
2006_3 282 275 557 525 67 592 134 22 156 31 6 37 97 11 108 1450
2006_4 335 259 594 549 88 637 175 17 192 52 9 61 121 14 135 1619
2007_1 392 221 613 700 95 795 183 29 212 78 16 94 156 13 169 1883
2007_2 368 272 640 527 58 585 146 19 165 48 6 54 177 18 195 1639
2007_3 326 252 578 552 62 614 158 36 194 46 8 54 181 11 192 1632
2007_4 435 268 703 725 89 814 215 25 240 42 11 53 214 19 233 2043
2008_1 370 275 645 663 72 735 135 19 154 53 9 62 182 21 203 1799
2008_2 399 247 646 597 68 665 133 21 154 31 6 37 137 7 144 1646
2008_3 347 266 613 513 73 586 140 25 165 40 8 48 122 10 132 1544
2008_4 404 297 701 789 103 892 164 19 183 55 15 70 165 17 182 2028
2009_1 461 254 715 847 105 952 173 35 208 33 10 43 126 13 139 2057
2009_2 367 270 637 615 76 691 124 26 150 28 7 35 120 16 136 1649
2009_3 297 284 581 585 58 643 132 27 159 40 11 51 136 12 148 1582
2009_4 441 278 719 784 67 851 129 24 153 41 3 44 156 16 172 1939
2010_1 480 251 731 834 92 926 138 20 158 50 7 57 158 6 164 2036
2010_2 430 245 675 723 49 772 126 28 154 26 5 31 198 14 212 1844
2010_3 444 304 748 742 77 819 158 44 202 51 11 62 168 12 180 2011
2010_4 471 300 771 906 93 999 193 27 220 41 13 54 195 6 201 2245
2011_1 528 268 796 926 102 1028 206 25 231 38 6 44 237 14 251 2350
2011_2 369 309 678 768 95 863 163 31 194 40 7 47 177 12 189 1971
2011_3 432 305 737 824 75 899 176 36 212 57 10 67 147 10 157 2072
Regular report on alcohol-related harm indicators for public hospitals Page 22

2011_4 486 291 777 1045 107 1152 195 21 216 52 6 58 180 7 187 2390
2012_1 454 275 729 1062 86 1148 208 31 239 36 7 43 210 18 228 2387
2012_2 401 316 717 956 71 1027 155 27 182 36 5 41 168 6 174 2141
2012_3 409 315 724 955 95 1050 210 35 245 36 3 39 157 13 170 2228
2012_4 529 384 913 1190 114 1304 252 41 293 31 5 36 243 11 254 2800
2013_1 537 286 823 1389 126 1515 290 36 326 46 10 56 288 11 299 3019
2013_2 477 322 799 1378 100 1478 272 30 302 41 13 54 309 23 332 2965
2013_3 411 315 726 1324 96 1420 221 29 250 39 4 43 264 15 279 2718
2013_4 471 311 782 1174 103 1277 219 27 246 58 5 63 260 7 267 2635
2014_1 518 269 787 1006 89 1095 248 30 278 28 9 37 189 13 202 2399
2014_2 521 307 828 879 108 987 218 37 255 29 4 33 141 11 152 2255
2014_3 478 273 751 708 75 783 240 27 267 48 6 54 132 7 139 1994
2014_4 625 325 950 845 91 936 290 33 323 38 7 45 148 6 154 2408
Regular report on alcohol-related harm indicators for public hospitals Page 23

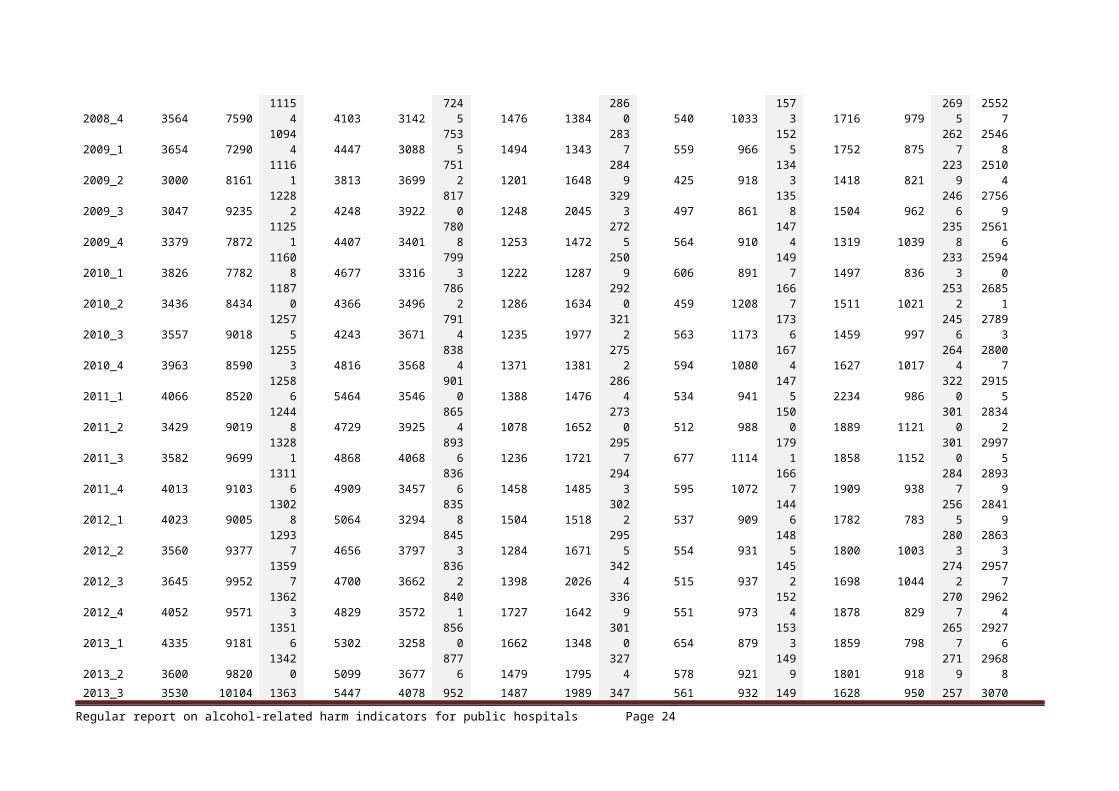
Table 9 Number of emergency department presentations by quarter, for wholly alcohol-related presentations, by Indigenous status, Northern Territory hospitals, 2005-2014
RDH ASH KH GDH TCH TOTALYear(quarter)
Indigenous Non-Indigenous
Total Indigenous Non-Indigenous
Total Indigenous Non-Indigenous
Total Indigenous Non-Indigenous
Total Indigenous Non-Indigenous
Total
2005_3 61 49 110 114 8 122 23 3 26 8 2 10 15 2 17 285
2005_4 58 55 113 132 21 153 39 5 44 9 2 11 26 2 28 349
2006_1 68 65 133 162 11 173 46 2 48 10 1 11 12 1 13 378
2006_2 46 46 92 127 11 138 49 14 63 11 0 11 16 1 17 321
2006_3 46 70 116 126 16 142 32 4 36 7 2 9 17 3 20 323
2006_4 86 69 155 106 27 133 47 1 48 16 1 17 33 4 37 390
2007_1 94 43 137 144 18 162 47 5 52 17 3 20 21 1 22 393
2007_2 73 71 144 141 16 157 44 3 47 8 1 9 29 3 32 389
2007_3 70 43 113 182 20 202 49 7 56 9 0 9 44 0 44 424
2007_4 109 58 167 228 28 256 72 2 74 7 1 8 35 3 38 543
2008_1 96 63 159 183 20 203 62 7 69 18 0 18 49 1 50 499
2008_2 117 50 167 195 20 215 33 3 36 7 0 7 37 1 38 463
2008_3 76 56 132 213 25 238 42 4 46 7 2 9 27 2 29 454
2008_4 93 59 152 206 31 237 71 5 76 14 6 20 30 5 35 520
2009_1 114 58 172 253 39 292 75 10 85 9 2 11 17 2 19 579
2009_2 77 66 143 242 31 273 42 5 47 3 1 4 27 2 29 496
2009_3 60 73 133 230 23 253 37 7 44 6 2 8 39 1 40 478
2009_4 106 67 173 266 35 301 32 7 39 3 2 5 31 0 31 549
2010_1 123 57 180 241 27 268 38 2 40 10 1 11 32 0 32 531
2010_2 132 60 192 236 19 255 30 8 38 8 1 9 35 1 36 530
2010_3 107 67 174 279 29 308 38 10 48 8 3 11 44 3 47 588
2010_4 109 73 182 343 47 390 55 10 65 11 1 12 41 0 41 690
2011_1 146 63 209 284 39 323 71 2 73 12 2 14 60 2 62 681
2011_2 100 69 169 260 40 300 55 6 61 8 3 11 40 3 43 584
2011_3 105 85 190 341 28 369 60 11 71 18 5 23 41 2 43 696
Regular report on alcohol-related harm indicators for public hospitals Page 24
2011_4 122 76 198 388 42 430 57 5 62 13 1 14 38 1 39 743
2012_1 140 74 214 453 34 487 82 6 88 7 2 9 55 8 63 861
2012_2 90 85 175 442 35 477 51 8 59 20 0 20 46 0 46 777
2012_3 111 91 202 464 50 514 104 10 114 13 1 14 44 4 48 892
2012_4 170 119 289 636 59 695 122 9 131 15 1 16 80 5 85 1216
2013_1 176 80 256 822 73 895 139 6 145 23 6 29 112 3 115 1440
2013_2 176 102 278 982 59 1041 139 11 150 18 7 25 117 10 127 1621
2013_3 140 114 254 834 48 882 99 5 104 15 4 19 116 4 120 1379
2013_4 167 80 247 735 53 788 104 5 109 27 3 30 141 4 145 1319
2014_1 185 76 261 621 54 675 130 10 140 14 2 16 86 3 89 1181
2014_2 185 87 272 534 61 595 111 10 121 11 3 14 67 1 68 1070
2014_3 173 78 251 389 36 425 118 8 126 14 2 16 63 2 65 883
2014_4 247 105 352 459 48 507 126 10 136 11 2 13 59 1 60 1068
Regular report on alcohol-related harm indicators for public hospitals Page 25

List of figures
Figure 1 Rates of hospital admission, each quarter, for conditions that are 100% alcohol-attributable, by Indigenous status and sex, Northern Territory Top End region, 2004-2014……………………………………………………………………………………………...5
Figure 2 Rates of hospital admission, each quarter, for conditions that are 100% alcohol-attributable, by Indigenous status and sex, Northern Territory Central Australia region, 2004-2014……………………………………………………………………………………..5
Figure 3 Rates of hospital admission, each quarter, for conditions that are 40% or greater alcohol-attributable, by Indigenous status and sex, Northern Territory Top End region, 2004-2014……………………………………………………………………………………………...6
Figure 4 Rates of hospital admission, each quarter, for conditions that are 40% or greater alcohol-attributable, by Indigenous status and sex, Northern Territory Central Australia region, 2004-2014………………………………………………………………………………… …..6
Figure 5 Number of emergency department (ED) presentations, by quarter, for all presentations and alcohol-related presentations, using composite ED alcohol indicator, Northern Territory hospitals, 2005-2014…………………………………………………………….8
Figure 6 Number of alcohol-related emergency department (ED) presentations, by quarter, using composite ED alcohol indicator, by Indigenous status, Northern Territory hospitals, 2005-2014…………………………………………………………………………………………......9
Figure 7 Number of alcohol-related emergency department presentations, by quarter, for wholly alcohol-related presentations, by Indigenous status, Northern Territory hospitals, 2005-2014…………………………………………………………………………………………….10

List of tables
Table 1a Wholly alcohol-attributable conditions with an attributable fraction of 100% for hospital admission………………………………………………………………………………... 11
Table 1b Partially alcohol-attributable conditions with an attributable fraction of 40% or greater for hospital admission…………………………………………………………………... 12
Table 2a Emergency department wholly and partially alcohol-related conditions as the principal diagnosis…………………………………………………………………………………13
Table 2b Emergency department wholly and partially alcohol-related conditions as a presenting problem………………………………………………………………………………. 14
Table 3 Hospital admission numbers and rates, for 100% alcohol-attributable conditions, by Indigenous status and sex, Northern Territory Top End region, 2004-2014…………… 15
Table 4 Hospital admission numbers and rates for 100% alcohol-attributable conditions, by Indigenous status and sex, Northern Territory Central Australia region, 2004-2014….. 16
Table 5 Hospital admission numbers and rates, adjusted by attributable fraction, for 40% or greater alcohol-attributable conditions, by Indigenous status and sex, Northern Territory Top End region, 2004-2014…………………………………………………………... 17
Table 6 Hospital admission numbers and rates, adjusted by attributable fraction, for 40% or greater alcohol-attributable conditions, by Indigenous status, Northern Territory Central Australia region, 2004-2014…………………………………………………………….18
Table 7 Number of emergency department (ED) presentations, by quarter, for all presentations and alcohol-related presentations, using composite ED alcohol indicator, by Indigenous status, Northern Territory hospitals, 2005-2014……………………………... 19
Table 8 Number of emergency department (ED) presentations, by quarter, using composite ED alcohol indicator, by Indigenous status, Northern Territory hospitals, 2005-2014………………………………………………………………………………………… 21
Table 9 Number of emergency department presentations by quarter, for wholly alcohol-related presentations, by Indigenous status, Northern Territory hospitals, 2005-2014………………………………………………………………………………………… 23
Regular report on alcohol-related harm indicators for public hospitals Page 27