Regression of renal disease by angiotensin antagonism … · Web viewTo validate the calculation of...
11
Appendix & Additional Material Manuscript: Experimental Evaluation of Kidney Regeneration by Organ Scaffold Recellularization Andrea Remuzzi, Marina Figliuzzi, Barbara Bonandrini, Sara Silvani, Nadia Azzollini, Roberta Nossa, Ariela Benigni and Giuseppe Remuzzi 1
Transcript of Regression of renal disease by angiotensin antagonism … · Web viewTo validate the calculation of...

Appendix & Additional Material
Manuscript:
Experimental Evaluation of Kidney Regeneration by Organ Scaffold Recellularization
Andrea Remuzzi, Marina Figliuzzi, Barbara Bonandrini, Sara Silvani, Nadia Azzollini, Roberta Nossa, Ariela Benigni and Giuseppe Remuzzi
1

APPENDIX
In order to estimate the distribution of perfusion fluid within the scaffold
during the cell seeding procedure, we developed a mathematical model based on
the geometrical parameters of kidney vasculature reported in literature by
Nordsletten and co-authors1. These Authors used detailed microCT acquisition
and 3D reconstruction of the kidney vascular (using a contrast media) then they
derived by digital image processing the topology and dimensions of the arterial
and venous vascular segments. According to the data set they provided, the rat
kidney vascular network is divided in different vessel orders (hierarchical levels)
for the arterial and venous tree. For each level, the number of elements, the
mean radius and mean length have been estimated. To obtain a complete
geometrical description of the vascular network, from the renal artery to the
renal vein, we assumed the number, length and radius of glomerular capillary
segments that have not been identified by Nordsletten et al. for not enough
resolution of the microCT images1. We estimated these later values according to
the 3D reconstruction of the rat glomerular capillary we reported previously2. The
final data set of the entire kidney vasculature we assumed is reported in Table
A1.
Using these geometrical parameters we calculated the pressure drop for a
given the flow rate in each vessel segment order, using Poiseuille equation
Pout , i=P¿ , i−8μ ∆ x i
π Ri4 ∙ Qi (1)
where, for each hierarchical level i, Pout,i is the output pressure, Pin,i the inlet
pressure, Qi the flow rate, μ the fluid viscosity, Δxi the average vessel length and
Ri the mean vessel radius. Initially, we also assumed that the vessel wall of the
arterial and venous segments is not permeable, i.e. no filtration across vessel
wall. The flow rate at the entrance of the vessel network was assumed equal to
2

the perfusion flow rate, then for each hierarchical level we calculated the flow
rate in each segment dividing the inlet flow by the number of vessel segments of
the level considered. This calculation was repeated up to the glomerular
capillary. In the venous tree, the flow rate was calculated similarly, increasing the
flow of individual vessel segment order according to the assumed number. For
the numerical procedure, we initially adopted an input value of the perfusion
pressure into the renal artery (Pin) and calculated the outflow pressure in the
renal vein (Pout) for the assumed flow rate (from experimental condition). We then
iterated this calculation until the outflow pressure was equal zero.
To validate the calculation of the pressure drop of the entire vasculature in
case of impermeable wall, and the relative flow distribution along the network,
we perfused native kidneys (n=3) harvested from rats of comparable age and
weight, as those used for kidney scaffold production. As shown in Figure A1 the
total pressure drop measured by us and that reported in literature for a similar
investigation, are comparable to that calculated by the present network model
for different flow rates perfused in the renal artery of native rat kidneys.
On the basis of this agreement, we extended the theoretical model to
simulate also the perfusion of permeable basement membranes with consequent
fluid filtration across the vessel wall. To this purpose we assumed that the flow
rate inside a vessel of a given hierarchical level is not constant along the vessel
axis, but it decreases gradually due to filtration, implementing in our network
model the analytical solution described by Gorji and co-authors3 for permeable
fluid flow in a permeable tube. We assumed that the flow is laminar along all
blood vessels of the scaffold and that the geometry of each hierarchical level is
equivalent to that of a straight tube with uniform radius, respectively the average
length (L) and radius (R). Assuming z as the position along the tube axis, the
velocity (V) and the pressure depend from local position
3

V=[V r (r , z ) , V z (r , z )] (2)
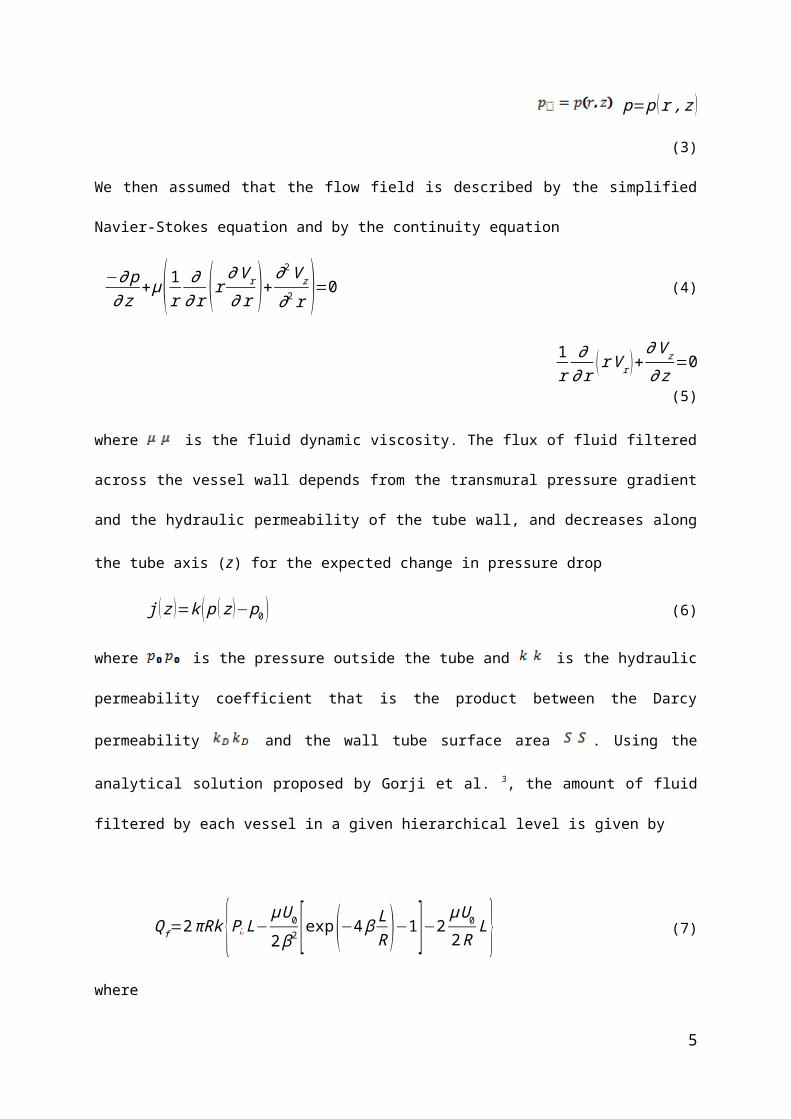
p=p (r , z ) (3)
We then assumed that the flow field is described by the simplified Navier-Stokes
equation and by the continuity equation
−∂ p∂ z
+μ( 1r ∂∂ r (r ∂V r
∂ r )+ ∂2V z
∂2 r )=0 (4)
1r
∂∂r (r V r )+
∂ V z
∂ z=0 (5)
where is the fluid dynamic viscosity. The flux of fluid filtered across the vessel
wall depends from the transmural pressure gradient and the hydraulic
permeability of the tube wall, and decreases along the tube axis (z) for the
expected change in pressure drop
j ( z )=k ( p ( z )−p0) (6)
where is the pressure outside the tube and is the hydraulic permeability
coefficient that is the product between the Darcy permeability and the wall
tube surface area . Using the analytical solution proposed by Gorji et al. 3, the
amount of fluid filtered by each vessel in a given hierarchical level is given by
Qf =2πRk {P¿ L−μU 0
2 β2 [exp(−4 β LR )−1]−2 μ U0
2 RL} (7)
where
β=( kμR )
0.5
(8)
and the flow rate and mean velocity, at the end-side of the tube of level i, are
given by
Qout , i=Q¿, i−Qf ,i (9)
and 4
V out , i=Q out ,i
π R i2 (10)
respectively. Since the permeability coefficient is unknown, we used an iterative
procedure starting from an input value of k and then we changed this value until
the calculated total filtered flow rate was equal to the average values determined
experimentally.
REFERENCE
1. Nordsletten, D.A., Blackett, S., Bentley, M.D., Ritman, E.L. & Smith, N.P. Structural morphology of renal vasculature. Am J Physiol Heart Circ Physiol 291, H296-309 (2006).
2. Antiga, L., Ene-Iordache, B., Remuzzi, G. & Remuzzi, A. Automatic generation of glomerular capillary topological organization. Microvasc Res 62, 346-354 (2001).
3. Gorji, M., Alipanah, M., Shateri, M. & Farnad, E. Analytical solution for laminar flow through leaky tube. Appl. Math. Mech. -Engl. Ed. 32, 69-74 (2011).
5

Table A1. Geometrical parameters of rat kidney vasculature.
Vessel Hierarchicallevel
Mean radius(µm)
Mean length(µm)
Number ofelements
0 216.1 3,000 11 191.4 11,440 32 139.8 8,975 63 86.1 2,516 244 53.9 1,031 90
Arteries 5 44.2 511 2476 39.3 1,001 5787 29.9 656 1,2458 20.1 404 4,3739 13.9 423 13,070
Afferent arterioles* 10 10.1 312 29,566Glomerular Capillary Segments*
11 5.0 150 591,320
Efferent arterioles* 12 6.1 300 29,56611 10.8 155 68,56410 14.7 248 30,6599 26.2 315 9,2588 40.1 625 2,9267 50.3 820 1,210
Veins 6 69.2 1,054 4185 114.1 1,147 1394 177.0 1,695 383 285.6 6,131 92 428.0 3,091 41 603.8 3,123 20 850.0 6,000 1
All values for vessel radius length and number for each level are adapted form Nordsletten et al. (1). * Values adapted from Antiga et al. (2).
6

Figure A1 - Total pressure drop of native rat kidneys at different perfusion rates (Q). Measured pressure drop ( ); data reported in literature for
native rat kidney ( o ) and values calculated with the theoretical model (_____).
7

Additional Material
To better understand the localization of the cells infused through the renal
vein, 60 serial sections of the cortical area of recellularized kidney (3 μm
thickness) were obtained and stained with hematoxylin and eosin. The middle
section of the series was labeled as “starting section”. In the starting section
tubular capillaries were randomly identified and images were digitally acquired at
light microscopy, above and below the starting section. Acquired images were
registered and resized using plugins of ImageJ software (NIH, USA -
imagej.nih.gov) and the image stack saved in .vtk format. For 3D visualization of
the cortical volume, we processed the image stack using the software ParaView
(KitWare Inc. New York USA, www.paraview.org) and generated a 3D view, and its
rotation. Low intensity values of tubular lumen were assumed to be transparent
for better identification of the spatial relation between seeded cells and tubular
membranes.
Figure A2 – (link to the movie.avi)
8