Registered Number: 2068222
49
Registered Number: 02068222 Registered Office: 25 Cabot Square Canary Wharf London E14 4QA Morgan Stanley & Co. International plc Half-yearly financial report 30 June 2021 DocuSign Envelope ID: 06B80A33-A7E0-49DA-BA03-5DCB7D499FC5
Transcript of Registered Number: 2068222

Registered Number: 02068222 Registered Office: 25 Cabot Square Canary Wharf London E14 4QA
Morgan Stanley & Co. International plc Half-yearly financial report
30 June 2021
DocuSign Envelope ID: 06B80A33-A7E0-49DA-BA03-5DCB7D499FC5
MORGAN STANLEY & CO. INTERNATIONAL plc
CONTENTS
Table of Contents INTERIM MANAGEMENT REPORT ..................................................................................................................3
Introduction .....................................................................................................................................................3
Group and Company overview ........................................................................................................................3
The Company, governance, supervision and regulation ........................................................................3
Supervision and Regulation ...................................................................................................................3
Risk factors and business environment ...........................................................................................................3
Risk factors .............................................................................................................................................3
Business environment ............................................................................................................................4
Overview of financial performance and condition ..........................................................................................5
Financial performance indicators ..........................................................................................................5
Overview of 2021 financial results .........................................................................................................6
Liquidity and capital resource management and regulation .................................................................7
Capital management ..............................................................................................................................7
Liquidity and funding management .......................................................................................................8
Regulatory developments ......................................................................................................................8
Risk management ............................................................................................................................................9
Market risk .............................................................................................................................................9
Credit risk ...............................................................................................................................................9
Liquidity and funding risk .....................................................................................................................11
Operational risk ....................................................................................................................................11
Climate risk ..........................................................................................................................................12
Going concern................................................................................................................................................13
DIRECTORS’ RESPONSIBILITY STATEMENT ...................................................................................................14
INDEPENDENT REVIEW REPORT ...................................................................................................................15
PRIMARY FINANCIAL STATEMENTS ..............................................................................................................16
NOTES TO THE CONDENSED CONSOLIDATED FINANCIAL STATEMENTS .....................................................21
DocuSign Envelope ID: 06B80A33-A7E0-49DA-BA03-5DCB7D499FC5
Table of contents
MORGAN STANLEY & CO. INTERNATIONAL plc
INTERIM MANAGEMENT REPORT
3
INTERIM MANAGEMENT REPORT Introduction
The Directors present their Interim Management Report and the condensed consolidated financial statements (“Interim Financial Statements”) of Morgan Stanley & Co. International plc (the “Company”) and all of its subsidiary undertakings (together the “Group”), for the six month period ended 30 June 2021.
These Interim Financial Statements should be read in conjunction with, and as an update to the Group’s 31 December 2020 Report and Financial Statements.
The Interim Management Report contains certain forward-looking statements. These statements are made by the Directors in good faith, based on the information available at the time of their approval of this report, and should be treated with caution due to the inherent uncertainties, including both economic and business risk factors, underlying any such forward-looking information. In particular, the effect on the Group of the Coronavirus disease (“COVID-19”) and the related global economic crisis continues to be a key area of principal risk and uncertainty.
Group and Company overview
The Company, governance, supervision and
regulation
The Company operates within the financial services industry and, as such, is subject to extensive supervision and regulation. In certain circumstances, this supervision may be applied to Morgan Stanley International Limited (“MSI”), an intermediate parent undertaking and the ultimate United Kingdom (“UK”) parent undertaking. The Company also shares elements of its Corporate Governance with MSI. Throughout the Interim Management Report, the Directors refer to policies, procedures and practices which the Company and/or the Group share with MSI and the “MSI Group” (MSI together with all of its subsidiary undertakings).
The ultimate parent undertaking and controlling entity is Morgan Stanley. Morgan Stanley, together with the Group and Morgan Stanley’s other subsidiary undertakings, form the “Morgan Stanley Group”.
Principal activity
The principal activity of the Group is the provision of financial services to a global client base consisting of corporations, governments and financial institutions. There have not been any changes in the Group’s principal activity during the period and no significant
change in the Group’s principal activity is expected.
The Company conducts business from its headquarters in London, UK and operates branches in the Dubai International Financial Centre, France, the Qatar Financial Centre, South Korea and Switzerland. The French branch was established in April 2021 as a “third country” branch in the European Union (“EU”).
Supervision and Regulation
As a UK-based financial services provider, the Company is authorised by the Prudential Regulation Authority (“PRA”) as an Investment Firm and is regulated by the PRA and the Financial Conduct Authority (“FCA”). In addition, the Company is a provisionally-registered swap dealer and is regulated by the United States Commodity Futures Trading Commission (“CFTC”) and expected to be registered as a security-based swap dealer (“SBSD”) with the Securities and Exchange Commission (“SEC”) when new SBSD rules become effective in October 2021. Risk factors and business environment
Risk factors and business environment Exposure to risk factors and the current business environment in which it operates may impact the results of the Group’s operations.
Risk factors
Risk is an inherent part of the Group’s business activity. The Group seeks to identify, assess, monitor and manage each of the various types of risk involved in its business activities, in accordance with defined policies and procedures.
The Group Risk Appetite Statement articulates the aggregate level and type of risk that the Group is willing to accept to execute its business strategy.
The Group has an established Risk Management Framework to support the identification, monitoring and management of risk.
The primary risk areas for the Group include Market, Credit, Operational, and Liquidity and Funding risks. A description of the principal risks and how these risks are managed within the Group is outlined in detail within the relevant risk’s section of ‘Risk management’.
The key risk factors impacting the Group are outlined in the 2020 Annual Report and Financial Statements, with the exception of the updates below.
DocuSign Envelope ID: 06B80A33-A7E0-49DA-BA03-5DCB7D499FC5

Table of contents
MORGAN STANLEY & CO. INTERNATIONAL plc
INTERIM MANAGEMENT REPORT
4
Business environment
During 2021, the Group has continued to be impacted by factors in the global environment in which it operates. In particular, the COVID-19 pandemic introduced risks and uncertainties that may adversely affect the results of operations of the Group. Another factor which the Group continues to monitor is the Group’s transition to alternative reference rates.
COVID-19
Since its onset, the COVID-19 pandemic has had a significant impact on global economic conditions and the environment in which the businesses operate, and it may continue to do so in the future. Though many employees have been working from home for some time, the Group is preparing for employees to return to work in the Group’s offices in certain locations. The Group continues to be fully operational, with the majority of employees working from home. Recognising that local conditions vary for offices around the world and that the trajectory of the virus continues to be uncertain, the Group may adjust its plans for employees returning to offices as deemed necessary.
Planned replacement of London Interbank Offered Rate and replacement or reform of other interest rate benchmarks (collectively, the “IBORs”)
The Morgan Stanley Group continues to implement its Morgan Stanley-wide transition plan for IBOR exposures. The Group’s primary IBOR exposures arise on its derivative contracts with clients and other counterparties. As at 30 June 2021, the substantial majority of the Group’s external derivative IBOR exposures are centrally cleared, have adhered to updated fallback provisions which are designed to facilitate the transition to alternative reference rates, or have already been transitioned to alternative reference rates. The Group’s IBOR exposures on external non-derivative financial assets and financial liabilities are not considered to be significant. See also ‘Planned replacement of LIBOR and replacement or reform of other interest rate benchmarks’, note 2.
DocuSign Envelope ID: 06B80A33-A7E0-49DA-BA03-5DCB7D499FC5
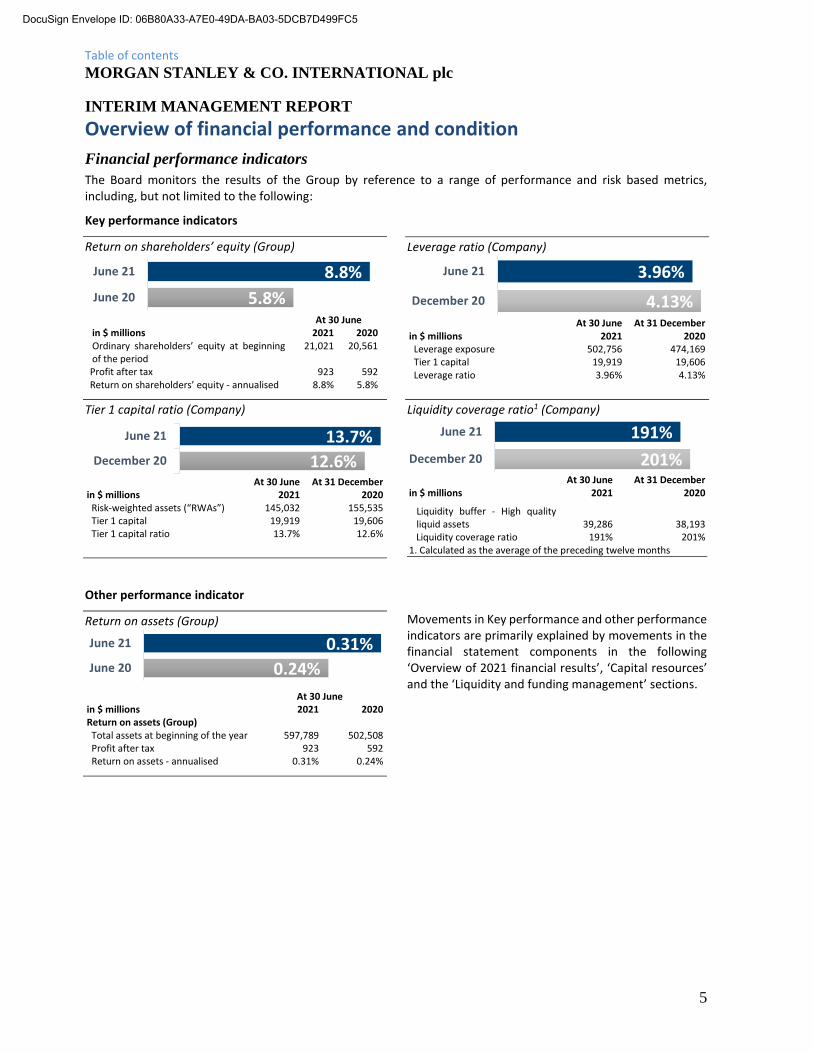
Table of contents
MORGAN STANLEY & CO. INTERNATIONAL plc
INTERIM MANAGEMENT REPORT
5
Overview of financial performance and condition
Financial performance indicators
The Board monitors the results of the Group by reference to a range of performance and risk based metrics, including, but not limited to the following:
Key performance indicators
Return on shareholders’ equity (Group)
At 30 June in $ millions 2021 2020
Ordinary shareholders’ equity at beginning of the period
21,021 20,561
Profit after tax 923 592 Return on shareholders’ equity - annualised 8.8% 5.8%
Tier 1 capital ratio (Company)
At 30 June At 31 December in $ millions 2021 2020 Risk-weighted assets (“RWAs”) 145,032 155,535 Tier 1 capital 19,919 19,606 Tier 1 capital ratio 13.7% 12.6%
Leverage ratio (Company)
At 30 June At 31 December in $ millions 2021 2020
Leverage exposure 502,756 474,169 Tier 1 capital 19,919 19,606 Leverage ratio 3.96% 4.13%
Liquidity coverage ratio1 (Company)
At 30 June At 31 December in $ millions 2021 2020
Liquidity buffer - High quality liquid assets 39,286 38,193
Liquidity coverage ratio 191% 201% 1. Calculated as the average of the preceding twelve months
Other performance indicator
Return on assets (Group)
At 30 June in $ millions 2021 2020
Return on assets (Group) Total assets at beginning of the year 597,789 502,508 Profit after tax 923 592 Return on assets - annualised 0.31% 0.24%
Movements in Key performance and other performance indicators are primarily explained by movements in the financial statement components in the following ‘Overview of 2021 financial results’, ‘Capital resources’ and the ‘Liquidity and funding management’ sections.
5.8%
8.8%
June 20
June 21
12.6%
13.7%December 20
June 21
4.13%
3.96%
December 20
June 21
201%
191%
December 20
June 21
0.24%
0.31%June 20
June 21
DocuSign Envelope ID: 06B80A33-A7E0-49DA-BA03-5DCB7D499FC5
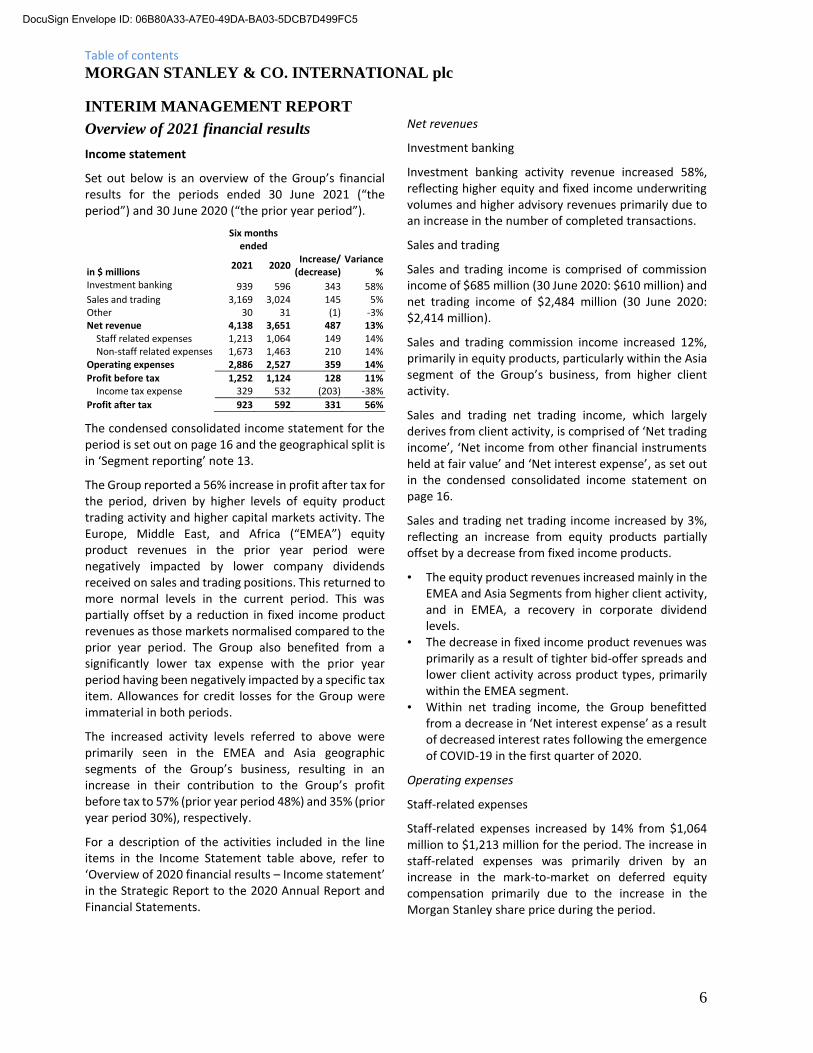
Table of contents
MORGAN STANLEY & CO. INTERNATIONAL plc
INTERIM MANAGEMENT REPORT
6
Overview of 2021 financial results
Income statement
Set out below is an overview of the Group’s financial results for the periods ended 30 June 2021 (“the period”) and 30 June 2020 (“the prior year period”).
Six months
ended
in $ millions 2021 2020
Increase/ (decrease)
Variance %
Investment banking 939 596 343 58% Sales and trading 3,169 3,024 145 5% Other 30 31 (1) -3% Net revenue 4,138 3,651 487 13% Staff related expenses 1,213 1,064 149 14% Non-staff related expenses 1,673 1,463 210 14% Operating expenses 2,886 2,527 359 14%
Profit before tax 1,252 1,124 128 11% Income tax expense 329 532 (203) -38%
Profit after tax 923 592 331 56%
The condensed consolidated income statement for the period is set out on page 16 and the geographical split is in ‘Segment reporting’ note 13.
The Group reported a 56% increase in profit after tax for the period, driven by higher levels of equity product trading activity and higher capital markets activity. The Europe, Middle East, and Africa (“EMEA”) equity product revenues in the prior year period were negatively impacted by lower company dividends received on sales and trading positions. This returned to more normal levels in the current period. This was partially offset by a reduction in fixed income product revenues as those markets normalised compared to the prior year period. The Group also benefited from a significantly lower tax expense with the prior year period having been negatively impacted by a specific tax item. Allowances for credit losses for the Group were immaterial in both periods.
The increased activity levels referred to above were primarily seen in the EMEA and Asia geographic segments of the Group’s business, resulting in an increase in their contribution to the Group’s profit before tax to 57% (prior year period 48%) and 35% (prior year period 30%), respectively.
For a description of the activities included in the line items in the Income Statement table above, refer to ‘Overview of 2020 financial results – Income statement’ in the Strategic Report to the 2020 Annual Report and Financial Statements.
Net revenues
Investment banking
Investment banking activity revenue increased 58%, reflecting higher equity and fixed income underwriting volumes and higher advisory revenues primarily due to an increase in the number of completed transactions.
Sales and trading
Sales and trading income is comprised of commission income of $685 million (30 June 2020: $610 million) and net trading income of $2,484 million (30 June 2020: $2,414 million).
Sales and trading commission income increased 12%, primarily in equity products, particularly within the Asia segment of the Group’s business, from higher client activity.
Sales and trading net trading income, which largely derives from client activity, is comprised of ‘Net trading income’, ‘Net income from other financial instruments held at fair value’ and ‘Net interest expense’, as set out in the condensed consolidated income statement on page 16.
Sales and trading net trading income increased by 3%, reflecting an increase from equity products partially offset by a decrease from fixed income products.
• The equity product revenues increased mainly in the EMEA and Asia Segments from higher client activity, and in EMEA, a recovery in corporate dividend levels.
• The decrease in fixed income product revenues was primarily as a result of tighter bid-offer spreads and lower client activity across product types, primarily within the EMEA segment.
• Within net trading income, the Group benefitted from a decrease in ‘Net interest expense’ as a result of decreased interest rates following the emergence of COVID-19 in the first quarter of 2020.
Operating expenses
Staff-related expenses
Staff-related expenses increased by 14% from $1,064 million to $1,213 million for the period. The increase in staff-related expenses was primarily driven by an increase in the mark-to-market on deferred equity compensation primarily due to the increase in the Morgan Stanley share price during the period.
DocuSign Envelope ID: 06B80A33-A7E0-49DA-BA03-5DCB7D499FC5
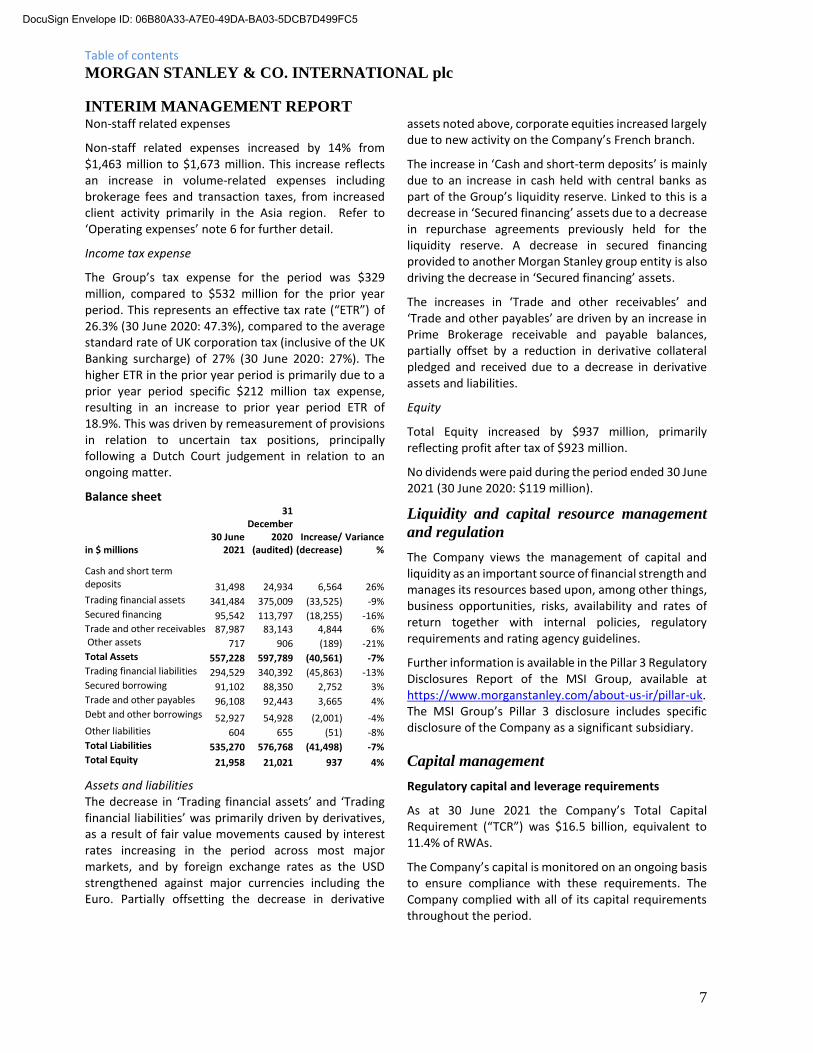
Table of contents
MORGAN STANLEY & CO. INTERNATIONAL plc
INTERIM MANAGEMENT REPORT
7
Non-staff related expenses
Non-staff related expenses increased by 14% from $1,463 million to $1,673 million. This increase reflects an increase in volume-related expenses including brokerage fees and transaction taxes, from increased client activity primarily in the Asia region. Refer to ‘Operating expenses’ note 6 for further detail.
Income tax expense
The Group’s tax expense for the period was $329 million, compared to $532 million for the prior year period. This represents an effective tax rate (“ETR”) of 26.3% (30 June 2020: 47.3%), compared to the average standard rate of UK corporation tax (inclusive of the UK Banking surcharge) of 27% (30 June 2020: 27%). The higher ETR in the prior year period is primarily due to a prior year period specific $212 million tax expense, resulting in an increase to prior year period ETR of 18.9%. This was driven by remeasurement of provisions in relation to uncertain tax positions, principally following a Dutch Court judgement in relation to an ongoing matter.
Balance sheet
in $ millions 30 June
2021
31 December
2020 (audited)
Increase/ (decrease)
Variance %
Cash and short term deposits 31,498 24,934 6,564 26% Trading financial assets 341,484 375,009 (33,525) -9% Secured financing 95,542 113,797 (18,255) -16% Trade and other receivables 87,987 83,143 4,844 6% Other assets 717 906 (189) -21% Total Assets 557,228 597,789 (40,561) -7% Trading financial liabilities 294,529 340,392 (45,863) -13% Secured borrowing 91,102 88,350 2,752 3% Trade and other payables 96,108 92,443 3,665 4% Debt and other borrowings 52,927 54,928 (2,001) -4% Other liabilities 604 655 (51) -8% Total Liabilities 535,270 576,768 (41,498) -7% Total Equity 21,958 21,021 937 4%
Assets and liabilities The decrease in ‘Trading financial assets’ and ‘Trading financial liabilities’ was primarily driven by derivatives, as a result of fair value movements caused by interest rates increasing in the period across most major markets, and by foreign exchange rates as the USD strengthened against major currencies including the Euro. Partially offsetting the decrease in derivative
assets noted above, corporate equities increased largely due to new activity on the Company’s French branch.
The increase in ‘Cash and short-term deposits’ is mainly due to an increase in cash held with central banks as part of the Group’s liquidity reserve. Linked to this is a decrease in ‘Secured financing’ assets due to a decrease in repurchase agreements previously held for the liquidity reserve. A decrease in secured financing provided to another Morgan Stanley group entity is also driving the decrease in ‘Secured financing’ assets.
The increases in ‘Trade and other receivables’ and ‘Trade and other payables’ are driven by an increase in Prime Brokerage receivable and payable balances, partially offset by a reduction in derivative collateral pledged and received due to a decrease in derivative assets and liabilities.
Equity
Total Equity increased by $937 million, primarily reflecting profit after tax of $923 million.
No dividends were paid during the period ended 30 June 2021 (30 June 2020: $119 million).
Liquidity and capital resource management
and regulation
The Company views the management of capital and liquidity as an important source of financial strength and manages its resources based upon, among other things, business opportunities, risks, availability and rates of return together with internal policies, regulatory requirements and rating agency guidelines.
Further information is available in the Pillar 3 Regulatory Disclosures Report of the MSI Group, available at https://www.morganstanley.com/about-us-ir/pillar-uk.
The MSI Group’s Pillar 3 disclosure includes specific disclosure of the Company as a significant subsidiary.
Capital management
Regulatory capital and leverage requirements
As at 30 June 2021 the Company’s Total Capital Requirement (“TCR”) was $16.5 billion, equivalent to 11.4% of RWAs.
The Company’s capital is monitored on an ongoing basis to ensure compliance with these requirements. The Company complied with all of its capital requirements throughout the period.
DocuSign Envelope ID: 06B80A33-A7E0-49DA-BA03-5DCB7D499FC5

Table of contents
MORGAN STANLEY & CO. INTERNATIONAL plc
INTERIM MANAGEMENT REPORT
8
Capital resources
Set out below are details of the Company’s Capital Resources, as at 30 June 2021 and 31 December 2020:
$ millions 30 June 2021 31 December 2020
Balance sheet equity 22,104 21,152 Regulatory adjustments (2,185) (1,546)
Tier 1 Capital 19,919 19,606
Of which Common Equity Tier 1 16,419 16,106 Additional Tier 1 3,500 3,500 Tier 2 Capital 4,480 4,975
Total Capital Resources 24,399 24,581
RWAs 145,032 155,535 CET1 Ratio 11.3% 10.4% Tier 1 Capital Ratio 13.7% 12.6% Total Capital Ratio 16.8% 15.8%
RWAs decreased by $10,503 million over the period, primarily reflecting lower market risk measures as prior year elevated market volatility moved out of the one year time series window, and to reduced equity risk. In addition, concentration risk RWA decreased, due to reduced affiliate exposures and an increase in eligible capital.
Leverage ratio
The Company’s leverage ratio is detailed in the table below.
in $ millions 30 June 2021
31 December 2020
Tier 1 Capital 19,919 19,606 Leverage Exposure 502,756 474,169 Leverage Ratio 3.96% 4.13%
Leverage exposure increased over the period, primarily due to higher client activity and balances. The Company will be subject to a binding leverage ratio of 3% from 1 January 2022 as part of the UK’s implementation of the outstanding prudential standards included in the EU’s amendment of the Capital Requirements Regulation (“CRR II”).
Liquidity and funding management
Regulatory liquidity requirements
The Company complied with all liquidity requirements during the period. $ millions 30 June
2021 31 December
2020 High quality liquid assets (“HQLA”) 39,286 38,193 Liquidity coverage ratio1 191% 201% 1. Calculated as the average of the preceding twelve months
The Company manages HQLA to exceed Pillar 1 and Pillar 2 requirements. HQLA increased during the period as the Pillar 1 requirement increased. As Pillar 2 is a fixed requirement, the minimum LCR % is variable.
Credit ratings
At 30 June 2021, the Company’s senior unsecured ratings are unchanged from 31 December 2020.
Collateral impact of a downgrade
As at 30 June 2021, the future potential collateral amounts and termination payments that could be called or required by counterparties or exchanges and clearing organisations in the event of one-notch or two-notch downgrade scenarios (from the lower of Moody’s or S&P ratings) based on the relevant contractual downgrade triggers, were $77 million and an incremental $127 million, respectively.
Regulatory developments
Regulatory developments are in line with those outlined in the ‘Regulatory developments’ section of the Strategic report to the 2020 Annual Report and Financial Statements’. An additional development of significant importance is:
Temporary Transitional Power (“TTP”)
Following the end of the transition period of the UK’s withdrawal from the EU on 31 December 2020, Her Majesty’s Treasury decided to retain the regulators’ TTP, which was introduced through the Financial Services and Markets Act 2000 (Amendment) (EU Exit) Regulations 2019.
The TTP will allow the Bank of England (“BOE”), the PRA and the FCA to phase-in changes to UK regulatory requirements so that firms can adjust to the UK’s post-Transition Period regime in an orderly way.
The TTP, effective from 1 January 2021, is expected to end by 31 March 2022. During this period prudential regulatory rules as implemented by the EU will largely continue to apply in the UK in the same way as prior to 31 December 2020.
DocuSign Envelope ID: 06B80A33-A7E0-49DA-BA03-5DCB7D499FC5
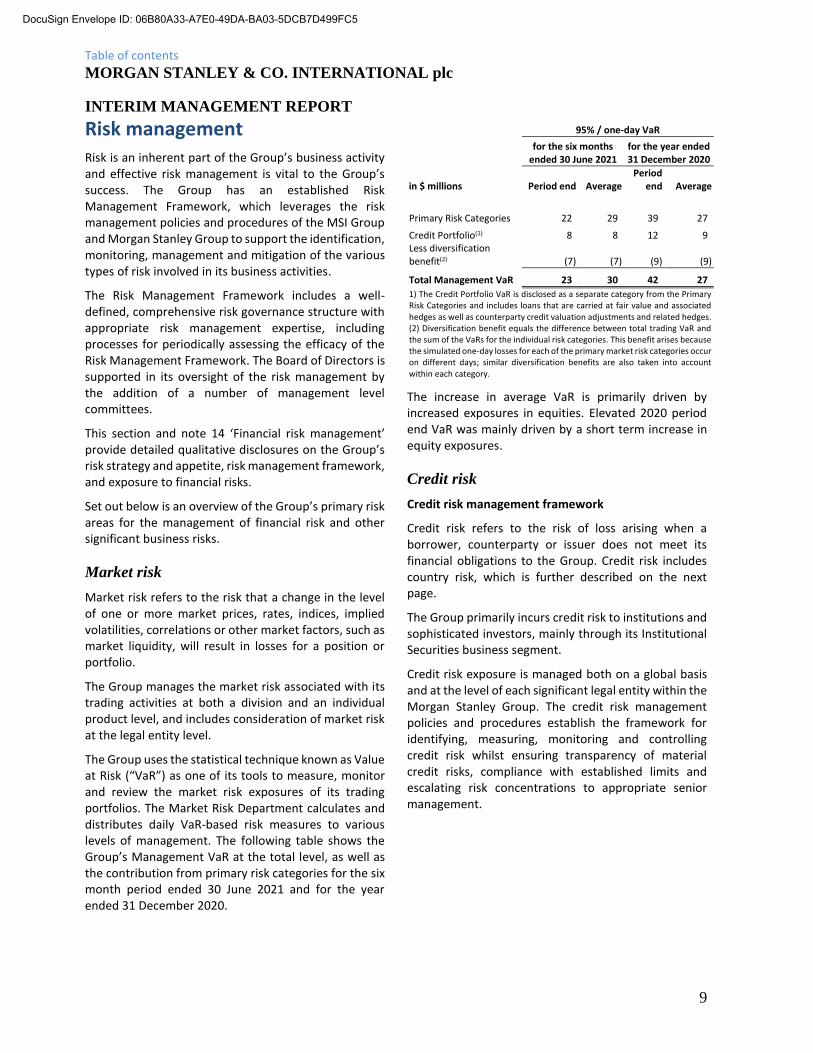
Table of contents
MORGAN STANLEY & CO. INTERNATIONAL plc
INTERIM MANAGEMENT REPORT
9
Risk management Risk is an inherent part of the Group’s business activity and effective risk management is vital to the Group’s success. The Group has an established Risk Management Framework, which leverages the risk management policies and procedures of the MSI Group and Morgan Stanley Group to support the identification, monitoring, management and mitigation of the various types of risk involved in its business activities.
The Risk Management Framework includes a well-defined, comprehensive risk governance structure with appropriate risk management expertise, including processes for periodically assessing the efficacy of the Risk Management Framework. The Board of Directors is supported in its oversight of the risk management by the addition of a number of management level committees.
This section and note 14 ‘Financial risk management’ provide detailed qualitative disclosures on the Group’s risk strategy and appetite, risk management framework, and exposure to financial risks.
Set out below is an overview of the Group’s primary risk areas for the management of financial risk and other significant business risks.
Market risk
Market risk refers to the risk that a change in the level of one or more market prices, rates, indices, implied volatilities, correlations or other market factors, such as market liquidity, will result in losses for a position or portfolio.
The Group manages the market risk associated with its trading activities at both a division and an individual product level, and includes consideration of market risk at the legal entity level.
The Group uses the statistical technique known as Value at Risk (“VaR”) as one of its tools to measure, monitor and review the market risk exposures of its trading portfolios. The Market Risk Department calculates and distributes daily VaR-based risk measures to various levels of management. The following table shows the Group’s Management VaR at the total level, as well as the contribution from primary risk categories for the six month period ended 30 June 2021 and for the year ended 31 December 2020.
95% / one-day VaR
for the six months
ended 30 June 2021 for the year ended 31 December 2020
in $ millions Period end Average Period
end Average
Primary Risk Categories 22 29 39 27
Credit Portfolio(1) 8 8 12 9 Less diversification benefit(2) (7) (7) (9) (9)
Total Management VaR 23 30 42 27
1) The Credit Portfolio VaR is disclosed as a separate category from the Primary Risk Categories and includes loans that are carried at fair value and associated hedges as well as counterparty credit valuation adjustments and related hedges. (2) Diversification benefit equals the difference between total trading VaR and the sum of the VaRs for the individual risk categories. This benefit arises because the simulated one-day losses for each of the primary market risk categories occur on different days; similar diversification benefits are also taken into account within each category.
The increase in average VaR is primarily driven by increased exposures in equities. Elevated 2020 period end VaR was mainly driven by a short term increase in equity exposures.
Credit risk
Credit risk management framework
Credit risk refers to the risk of loss arising when a borrower, counterparty or issuer does not meet its financial obligations to the Group. Credit risk includes country risk, which is further described on the next page.
The Group primarily incurs credit risk to institutions and sophisticated investors, mainly through its Institutional Securities business segment.
Credit risk exposure is managed both on a global basis and at the level of each significant legal entity within the Morgan Stanley Group. The credit risk management policies and procedures establish the framework for identifying, measuring, monitoring and controlling credit risk whilst ensuring transparency of material credit risks, compliance with established limits and escalating risk concentrations to appropriate senior management.
DocuSign Envelope ID: 06B80A33-A7E0-49DA-BA03-5DCB7D499FC5
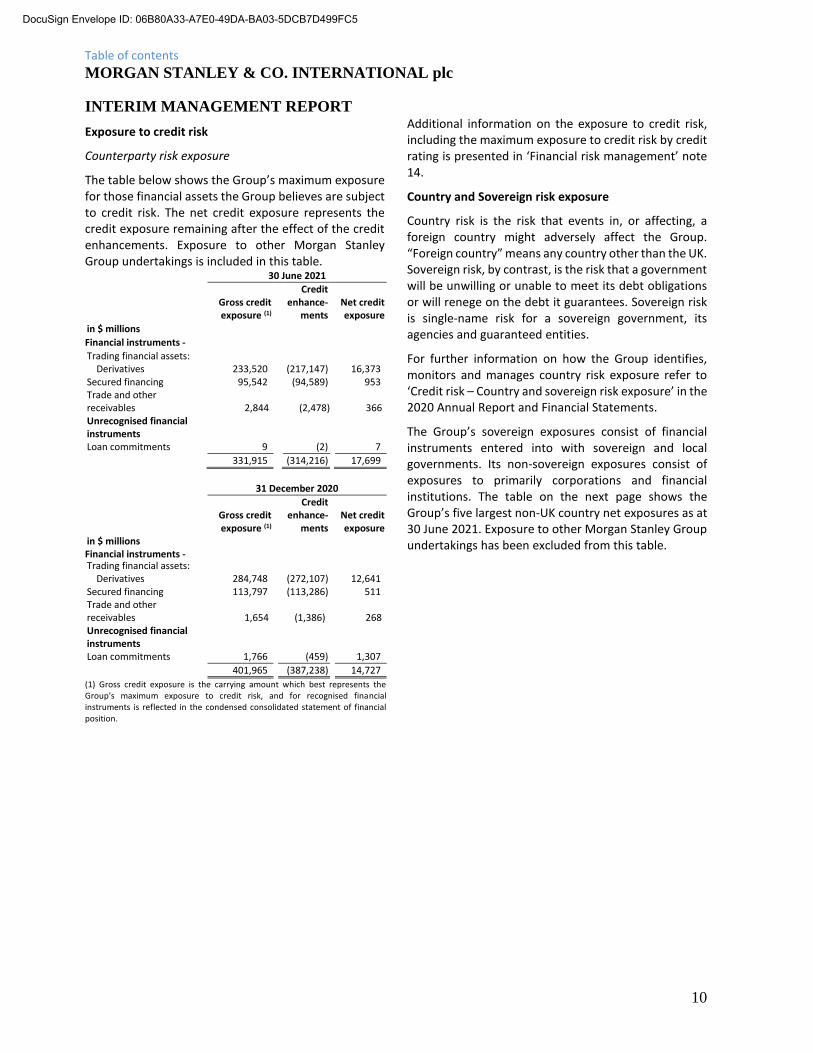
Table of contents
MORGAN STANLEY & CO. INTERNATIONAL plc
INTERIM MANAGEMENT REPORT
10
Exposure to credit risk
Counterparty risk exposure
The table below shows the Group’s maximum exposure for those financial assets the Group believes are subject to credit risk. The net credit exposure represents the credit exposure remaining after the effect of the credit enhancements. Exposure to other Morgan Stanley Group undertakings is included in this table. 30 June 2021
Gross credit exposure (1)
Credit enhance-
ments Net credit exposure
in $ millions
Financial instruments - FVPL
Trading financial assets: Derivatives 233,520 (217,147) 16,373 Secured financing 95,542 (94,589) 953 Trade and other receivables 2,844x (2,478) 366x Unrecognised financial instruments Loan commitments 9 (2) 7
331,915 (314,216) 17,699
31 December 2020
Gross credit exposure (1)
Credit enhance-
ments Net credit exposure
in $ millions Financial instruments - FVPL
Trading financial assets: Derivatives 284,748 (272,107) 12,641 Secured financing 113,797 (113,286) 511 Trade and other receivables 1,654ii (1,386)ii 268ii Unrecognised financial instruments Loan commitments 1,766 (459) 1,307
401,965 (387,238) 14,727
(1) Gross credit exposure is the carrying amount which best represents the Group's maximum exposure to credit risk, and for recognised financial instruments is reflected in the condensed consolidated statement of financial position.
Additional information on the exposure to credit risk, including the maximum exposure to credit risk by credit rating is presented in ‘Financial risk management’ note 14.
Country and Sovereign risk exposure
Country risk is the risk that events in, or affecting, a foreign country might adversely affect the Group. “Foreign country” means any country other than the UK. Sovereign risk, by contrast, is the risk that a government will be unwilling or unable to meet its debt obligations or will renege on the debt it guarantees. Sovereign risk is single-name risk for a sovereign government, its agencies and guaranteed entities.
For further information on how the Group identifies, monitors and manages country risk exposure refer to ‘Credit risk – Country and sovereign risk exposure’ in the 2020 Annual Report and Financial Statements.
The Group’s sovereign exposures consist of financial instruments entered into with sovereign and local governments. Its non-sovereign exposures consist of exposures to primarily corporations and financial institutions. The table on the next page shows the Group’s five largest non-UK country net exposures as at 30 June 2021. Exposure to other Morgan Stanley Group undertakings has been excluded from this table.
DocuSign Envelope ID: 06B80A33-A7E0-49DA-BA03-5DCB7D499FC5
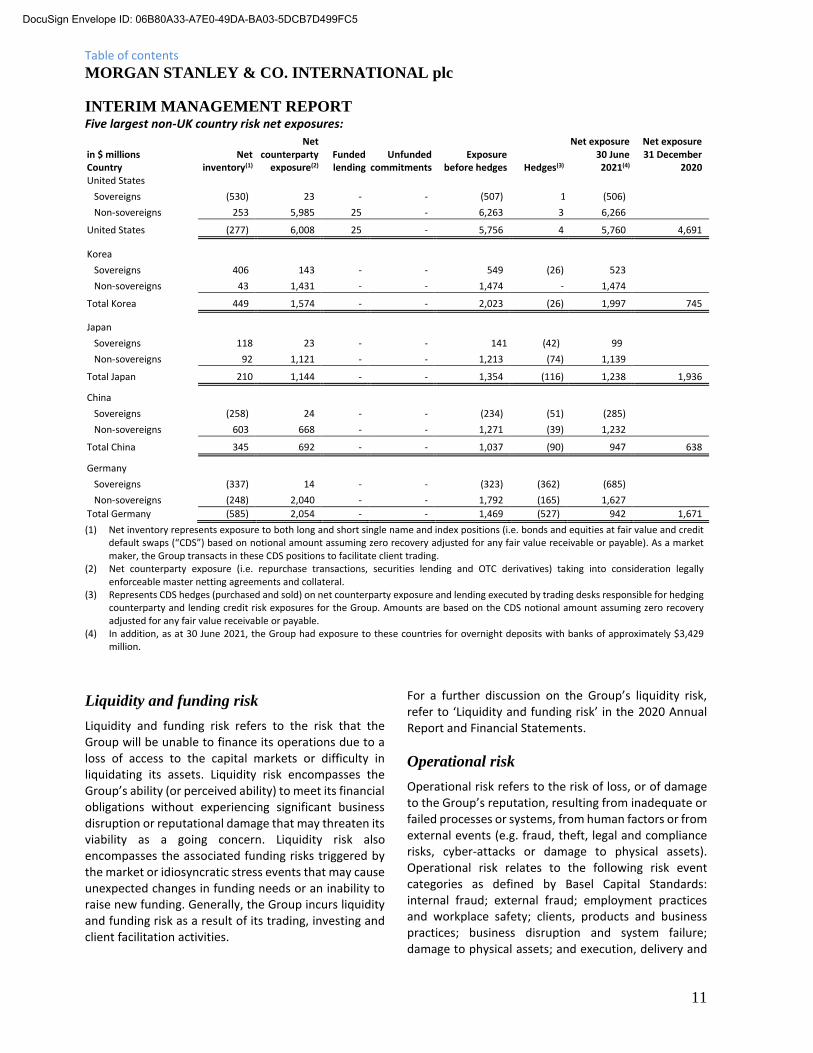
Table of contents
MORGAN STANLEY & CO. INTERNATIONAL plc
INTERIM MANAGEMENT REPORT
11
Five largest non-UK country risk net exposures:
in $ millions Country
Net inventory(1)
Net counterparty
exposure(2) Funded lending
Unfunded commitments
Exposure before hedges Hedges(3)
Net exposure 30 June 2021(4)
Net exposure 31 December
2020 United States
Sovereigns (530) 23 - - (507) 1 (506)
Non-sovereigns 253 5,985 25 - 6,263 3 6,266
United States (277) 6,008 25 - 5,756 4 5,760 4,691
Korea
Sovereigns 406 143 - - 549 (26) 523
Non-sovereigns 43 1,431 - - 1,474 - 1,474
Total Korea 449 1,574 - - 2,023 (26) 1,997 745
Japan
Sovereigns 118 23 - - 141 (42) 99
Non-sovereigns 92 1,121 - - 1,213 (74) 1,139
Total Japan 210 1,144 - - 1,354 (116) 1,238 1,936
China
Sovereigns (258) 24 - - (234) (51) (285)
Non-sovereigns 603 668 - - 1,271 (39) 1,232
Total China 345 692 - - 1,037 (90) 947 638
Germany
Sovereigns (337) 14 - - (323) (362) (685)
Non-sovereigns (248) 2,040 - - 1,792 (165) 1,627
Total Germany (585) 2,054 - - 1,469 (527) 942 1,671
(1) Net inventory represents exposure to both long and short single name and index positions (i.e. bonds and equities at fair value and credit default swaps (“CDS”) based on notional amount assuming zero recovery adjusted for any fair value receivable or payable). As a market maker, the Group transacts in these CDS positions to facilitate client trading.
(2) Net counterparty exposure (i.e. repurchase transactions, securities lending and OTC derivatives) taking into consideration legally enforceable master netting agreements and collateral.
(3) Represents CDS hedges (purchased and sold) on net counterparty exposure and lending executed by trading desks responsible for hedging counterparty and lending credit risk exposures for the Group. Amounts are based on the CDS notional amount assuming zero recovery adjusted for any fair value receivable or payable.
(4) In addition, as at 30 June 2021, the Group had exposure to these countries for overnight deposits with banks of approximately $3,429 million.
Liquidity and funding risk
Liquidity and funding risk refers to the risk that the Group will be unable to finance its operations due to a loss of access to the capital markets or difficulty in liquidating its assets. Liquidity risk encompasses the Group’s ability (or perceived ability) to meet its financial obligations without experiencing significant business disruption or reputational damage that may threaten its viability as a going concern. Liquidity risk also encompasses the associated funding risks triggered by the market or idiosyncratic stress events that may cause unexpected changes in funding needs or an inability to raise new funding. Generally, the Group incurs liquidity and funding risk as a result of its trading, investing and client facilitation activities.
For a further discussion on the Group’s liquidity risk, refer to ‘Liquidity and funding risk’ in the 2020 Annual Report and Financial Statements.
Operational risk
Operational risk refers to the risk of loss, or of damage to the Group’s reputation, resulting from inadequate or failed processes or systems, from human factors or from external events (e.g. fraud, theft, legal and compliance risks, cyber-attacks or damage to physical assets). Operational risk relates to the following risk event categories as defined by Basel Capital Standards: internal fraud; external fraud; employment practices and workplace safety; clients, products and business practices; business disruption and system failure; damage to physical assets; and execution, delivery and
DocuSign Envelope ID: 06B80A33-A7E0-49DA-BA03-5DCB7D499FC5

Table of contents
MORGAN STANLEY & CO. INTERNATIONAL plc
INTERIM MANAGEMENT REPORT
12
process management. The scope also includes oversight of technology risk, cybersecurity risk, information security risk, and third party risk management (supplier and affiliate risk).
For further information on the Group’s operational risk including conduct risk and legal, regulatory and compliance risk, refer to ‘Operational risk’ in the 2020 Annual Report and Financial Statements.
Climate risk
The integration of climate financial risk into Group risk management continued in the first half of 2021 across the areas of risk identification, scenario analysis, metrics and risk appetite. The Group is on track to materially embed its enhanced climate risk management framework by the end of 2021.
DocuSign Envelope ID: 06B80A33-A7E0-49DA-BA03-5DCB7D499FC5
Table of contents
MORGAN STANLEY & CO. INTERNATIONAL plc
INTERIM MANAGEMENT REPORT
13
Going concern Business risks associated with the uncertain market and economic conditions are being actively monitored and managed by the Group. Retaining sufficient capital and liquidity to withstand these market pressures remains central to the Group’s strategy. In particular, the Group’s capital and liquidity is deemed sufficient to exceed regulatory minimums under both a normal and in a stressed market environment, including the current and potential stresses of the COVID-19 pandemic for the foreseeable future. The existing and potential effects of COVID-19 on the business of the Group have been considered as part of the going concern analysis, including impact on operational capacity, access to liquidity and capital, contractual obligations, asset valuations and other critical accounting judgements and key sources of estimation uncertainty. Additionally, the specific impact of Brexit on the business of the Group
has been considered. The Group has access to further Morgan Stanley Group capital and liquidity as required.
Taking all of these factors into consideration, the Directors believe it is reasonable to assume that the Group will have access to adequate resources to continue in operational existence for the foreseeable future. Accordingly, they continue to adopt the going concern basis in preparing the Interim Financial Statements.
Approved by the Board and signed on its behalf by
K Lazaroo
Director
24 September 2021
DocuSign Envelope ID: 06B80A33-A7E0-49DA-BA03-5DCB7D499FC5

Table of contents
MORGAN STANLEY & CO. INTERNATIONAL plc
DIRECTORS’ RESPONSIBILITY STATEMENT
14
DIRECTORS’ RESPONSIBILITY STATEMENT
In accordance with Article 4(2)(c) of the Luxembourg Law of 11 January 2008, as amended, there are certain transparency requirements in relation to information about issuers whose securities are admitted to trading on a regulated market (the “Transparency Law”).
The Directors, the names of whom are set out below, confirm that to the best of their knowledge:
(a) the condensed set of interim financial statements, which has been prepared in accordance with International Accounting Standard (“IAS”) 34 ‘Interim Financial Reporting’ as adopted by the EU, gives a true and fair view of the assets, liabilities, financial position and result of the Group; and
(b) the interim management report includes a fair review of the information required by Article 4(4) of the Transparency Law, being an indication of the important events that have occurred during the period and their impact on the condensed consolidated interim financial statements, and a description of the principal risks and uncertainties for the remaining six months of the financial year.
By order of the Board on 24 September 2021
K Lazaroo
Director
Board of Directors:
S Ball (resigned 30 April 2021) J Bloomer (Chairman) D O Cannon T Duhon A Kohli K Lazaroo S Orlacchio M C Phibbs (resigned 31 March 2021) M Richards (appointed 8 July 2021) D A Russell A V Sekhar P D Taylor N P Whyte C Woodman
DocuSign Envelope ID: 06B80A33-A7E0-49DA-BA03-5DCB7D499FC5
INDEPENDENT REVIEW REPORT TO MORGAN STANLEY & CO.
INTERNATIONAL plc
15
INDEPENDENT REVIEW REPORT
We have been engaged by the Company to review the condensed set of financial statements in the half-yearly financial report for the six months ended 30 June 2021 which comprises the condensed consolidated income statement, the condensed consolidated statement of comprehensive income, the condensed consolidated statement of changes in equity, the condensed consolidated statement of financial position, the condensed consolidated statement of cash flows and related notes 1 to 19. We have read the other information contained in the half-yearly financial report and considered whether it contains any apparent misstatements or material inconsistencies with the information in the condensed set of financial statements.
Directors’ responsibilities
The half-yearly financial report is the responsibility of, and has been approved by, the directors. The directors are responsible for preparing the half-yearly financial report in accordance with the Article 4 of the Luxembourg Transparency Law.
As disclosed in note 1, the annual financial statements of the group will be prepared in accordance with International Financial Reporting Standards issued by the International Accounting Standards Board (“IASB”) as adopted by the EU. The condensed set of financial statements included in this half-yearly financial report has been prepared in accordance with the article 4 of the Luxembourg Transparency Law and in accordance with International Accounting Standard 34 ‘Interim Financial Reporting’, as adopted by the EU.
Our responsibility
Our responsibility is to express to the Company a conclusion on the condensed set of financial statements in the half-yearly financial report based on our review.
Scope of review
We conducted our review in accordance with International Standard on Review Engagements (UK and Ireland) 2410 “Review of Interim Financial Information Performed by the Independent Auditor of the Entity” issued by the Financial Reporting
Council for use in the United Kingdom. A review of interim financial information consists of making inquiries, primarily of persons responsible for financial and accounting matters, and applying analytical and other review procedures. A review is substantially less in scope than an audit conducted in accordance with International Standards on Auditing (UK) and consequently does not enable us to obtain assurance that we would become aware of all significant matters that might be identified in an audit. Accordingly, we do not express an audit opinion.
Conclusion
Based on our review, nothing has come to our attention that causes us to believe that the condensed set of financial statements in the half-yearly financial report for the six months ended 30 June 2021 is not prepared, in all material respects, in accordance with the article 4 of the Luxembourg Transparency Law and in accordance with International Accounting Standard 34 ‘Interim Financial Reporting’, as adopted by the EU.
Use of our report
This report is made solely to the company in accordance with International Standard on Review Engagements (UK and Ireland) 2410 “Review of Interim Financial Information Performed by the Independent Auditor of the Entity” issued by the Financial Reporting Council. Our work has been undertaken so that we might state to the company those matters we are required to state to it in an independent review report and for no other purpose. To the fullest extent permitted by law, we do not accept or assume responsibility to anyone other than the company, for our review work, for this report, or for the conclusions we have formed.
Deloitte LLP Statutory Auditor London 24 September 2021
DocuSign Envelope ID: 06B80A33-A7E0-49DA-BA03-5DCB7D499FC5

MORGAN STANLEY & CO. INTERNATIONAL plc
CONDENSED CONSOLIDATED INCOME STATEMENT
Six months ended 30 June 2021
16
PRIMARY FINANCIAL STATEMENTS
Six months Six months
ended ended
in $ millions 30 June 2021 30 June 2020
Note (unaudited) (unaudited)
Net trading income 2,708 2,540
Net income from other financial instruments held at fair value 3 (22) 233
Fee and commission income 4 1,654 1,237
Other revenue 6 1
Interest income 5 (199) 362
Interest expense 5 (9)x (722)
Net interest expense (208)x (360)
Net revenue 4,138 3,651
Non-interest expenses:
Operating expenses 6 (2,886) (2,527)
PROFIT BEFORE TAX 1,252 1,124
Income tax expense 7 (329) (532)
PROFIT FOR THE PERIOD 923 592
All operations were continuing in the current and prior periods.
The notes on pages 21 to 49 form an integral part of the Interim Financial Statements.
DocuSign Envelope ID: 06B80A33-A7E0-49DA-BA03-5DCB7D499FC5
MORGAN STANLEY & CO. INTERNATIONAL plc
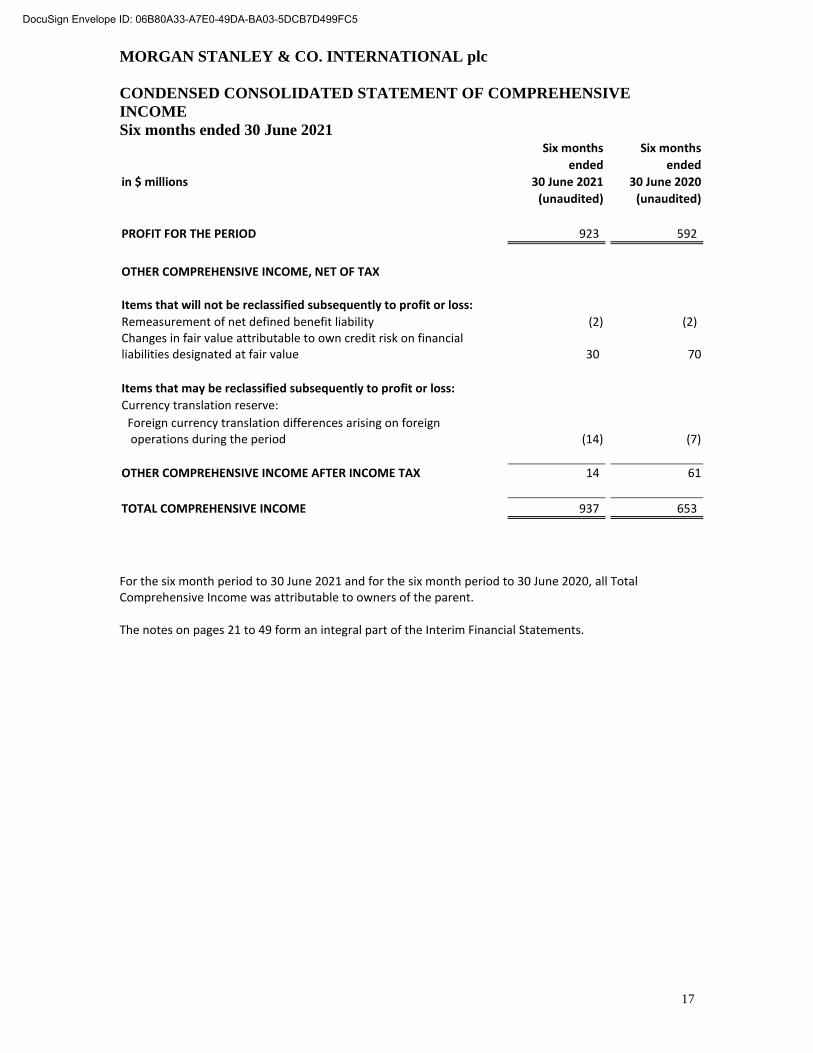
CONDENSED CONSOLIDATED STATEMENT OF COMPREHENSIVE
INCOME
Six months ended 30 June 2021
17
Six months Six months
ended ended
in $ millions 30 June 2021 30 June 2020
(unaudited) (unaudited)
PROFIT FOR THE PERIOD 923 592
OTHER COMPREHENSIVE INCOME, NET OF TAX
Items that will not be reclassified subsequently to profit or loss:
Remeasurement of net defined benefit liability (2) (2) Changes in fair value attributable to own credit risk on financial liabilities designated at fair value 30 70
Items that may be reclassified subsequently to profit or loss:
Currency translation reserve:
Foreign currency translation differences arising on foreign operations during the period (14) (7)
OTHER COMPREHENSIVE INCOME AFTER INCOME TAX 14 61
TOTAL COMPREHENSIVE INCOME 937 653
For the six month period to 30 June 2021 and for the six month period to 30 June 2020, all Total Comprehensive Income was attributable to owners of the parent. The notes on pages 21 to 49 form an integral part of the Interim Financial Statements.
DocuSign Envelope ID: 06B80A33-A7E0-49DA-BA03-5DCB7D499FC5
MORGAN STANLEY & CO. INTERNATIONAL plc
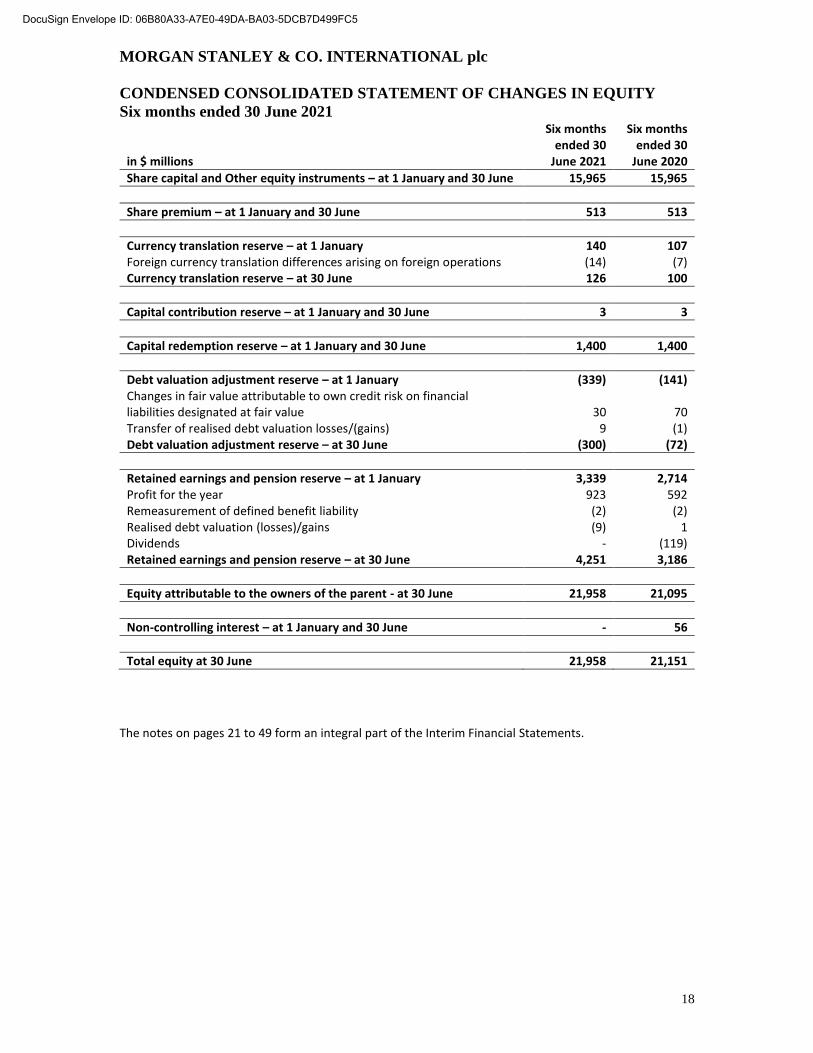
CONDENSED CONSOLIDATED STATEMENT OF CHANGES IN EQUITY
Six months ended 30 June 2021
18
in $ millions
Six months ended 30
June 2021
Six months ended 30
June 2020
Share capital and Other equity instruments – at 1 January and 30 June 15,965 15,965
Share premium – at 1 January and 30 June 513 513
Currency translation reserve – at 1 January 140 107 Foreign currency translation differences arising on foreign operations (14) (7) Currency translation reserve – at 30 June 126 100
Capital contribution reserve – at 1 January and 30 June 3 3
Capital redemption reserve – at 1 January and 30 June 1,400 1,400
Debt valuation adjustment reserve – at 1 January (339) (141) Changes in fair value attributable to own credit risk on financial liabilities designated at fair value 30 70 Transfer of realised debt valuation losses/(gains) 9 (1) Debt valuation adjustment reserve – at 30 June (300) (72)
Retained earnings and pension reserve – at 1 January 3,339 2,714 Profit for the year 923 592 Remeasurement of defined benefit liability (2) (2) Realised debt valuation (losses)/gains (9) 1 Dividends - (119) Retained earnings and pension reserve – at 30 June 4,251 3,186
Equity attributable to the owners of the parent - at 30 June 21,958 21,095
Non-controlling interest – at 1 January and 30 June - 56
Total equity at 30 June 21,958 21,151
The notes on pages 21 to 49 form an integral part of the Interim Financial Statements.
DocuSign Envelope ID: 06B80A33-A7E0-49DA-BA03-5DCB7D499FC5

MORGAN STANLEY & CO. INTERNATIONAL plc Registered Number: 02068222
CONDENSED CONSOLIDATED STATEMENT OF FINANCIAL POSITION
As at 30 June 2021
19
in $ millions 30 June 2021 31 December 2020 Note (unaudited) ASSETS Cash and short term deposits 31,498 24,934 Trading financial assets (of which $44,386 million (2020: $37,401 million) were pledged to various parties) 9 341,484 375,009 Secured financing 8 95,542 113,797 Loans and advances 68 116 Investment securities 150 151 Trade and other receivables 87,987 83,143 Current tax assets 219 404 Deferred tax assets 215 171 Property, plant and equipment 30 26 Other assets 35 38
TOTAL ASSETS 557,228 597,789
LIABILITIES AND EQUITY Bank loans and overdrafts 17 1 Trading financial liabilities 9 294,529 340,392 Secured borrowing 8 91,102 88,350 Trade and other payables 96,108 92,443 Debt and other borrowings 52,927 54,928 Provisions 22 10 Current tax liabilities 123 145 Accruals and deferred income 433 492
Post-employment benefit obligations 9 7
TOTAL LIABILITIES 535,270 576,768
EQUITY Share capital 12,465 12,465 Other equity instruments 3,500 3,500 Share premium account 513 513 Currency translation reserve 126 140 Capital contribution reserve 3 3 Capital redemption reserve 1,400 1,400 Pension reserve (4) (2) Debt valuation adjustment reserve (300) (339) Retained earnings 4,255 3,341
TOTAL EQUITY 21,958 21,021
TOTAL LIABILITIES AND EQUITY 557,228 597,789
The notes on pages 21 to 49 form an integral part of the Interim Financial Statements.
DocuSign Envelope ID: 06B80A33-A7E0-49DA-BA03-5DCB7D499FC5
MORGAN STANLEY & CO. INTERNATIONAL plc
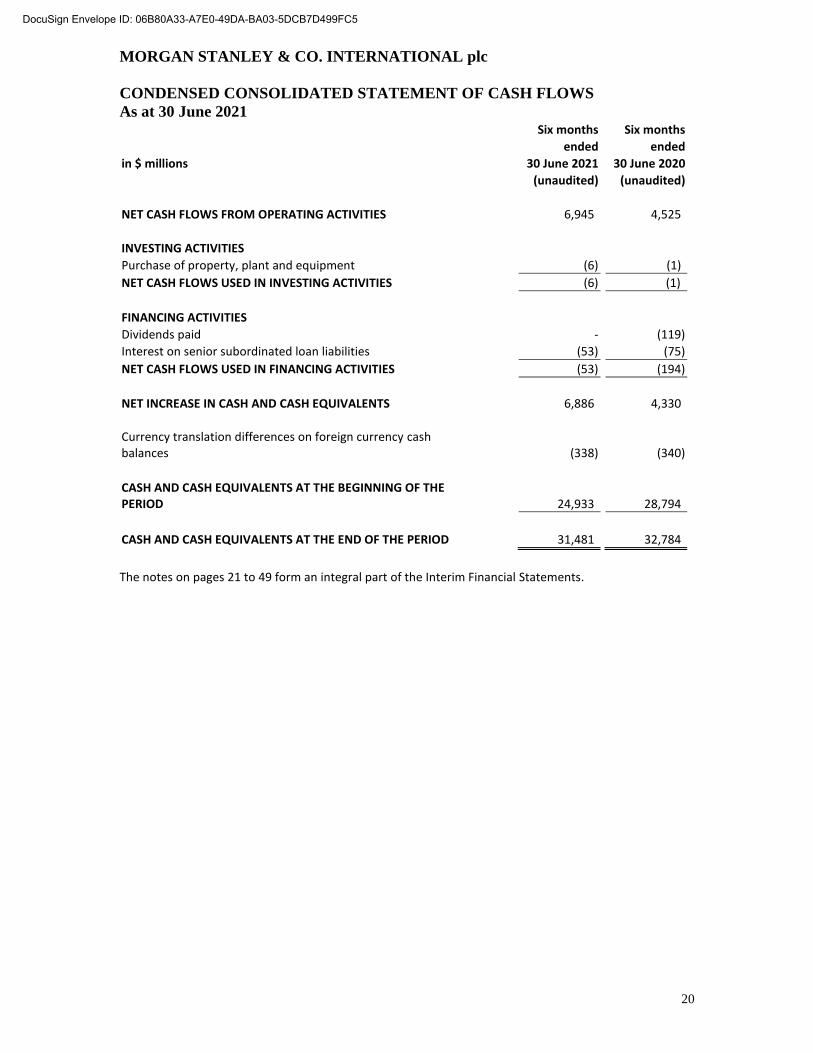
CONDENSED CONSOLIDATED STATEMENT OF CASH FLOWS
As at 30 June 2021
20
Six months Six months
ended ended
in $ millions 30 June 2021 30 June 2020
(unaudited) (unaudited)
NET CASH FLOWS FROM OPERATING ACTIVITIES 6,945 4,525
INVESTING ACTIVITIES
Purchase of property, plant and equipment (6) (1)
NET CASH FLOWS USED IN INVESTING ACTIVITIES (6) (1)x
FINANCING ACTIVITIES
Dividends paid - (119)
Interest on senior subordinated loan liabilities (53) (75)
NET CASH FLOWS USED IN FINANCING ACTIVITIES (53) (194)
NET INCREASE IN CASH AND CASH EQUIVALENTS 6,886 4,330
Currency translation differences on foreign currency cash balances (338) (340)
CASH AND CASH EQUIVALENTS AT THE BEGINNING OF THE PERIOD 24,933 28,794
CASH AND CASH EQUIVALENTS AT THE END OF THE PERIOD 31,481 32,784
The notes on pages 21 to 49 form an integral part of the Interim Financial Statements.
DocuSign Envelope ID: 06B80A33-A7E0-49DA-BA03-5DCB7D499FC5

Table of contents
MORGAN STANLEY & CO. INTERNATIONAL plc
NOTES TO THE CONDENSED CONSOLIDATED FINANCIAL STATEMENTS
Six months ended 30 June 2021
21
NOTES TO THE CONDENSED CONSOLIDATED FINANCIAL STATEMENTS
1. BASIS OF PREPARATION
a. General information
These Interim Financial Statements do not constitute statutory accounts within the meaning of Section 435 of the United Kingdom Companies Act 2006 (“Companies Act”).
Statutory accounts for the year ended 31 December 2020 were approved by the Board of Directors on 21 April 2021 and delivered to the Registrar of Companies. The auditor’s report on those accounts was not qualified, did not include a reference to any matters to which the auditors drew attention by way of emphasis without qualifying the report and did not contain statements under section 498(2) or (3) of the Companies Act 2016. Other comparative information for the six months ended 30 June 2020 is included in certain instances.
b. Accounting policies
The Group has prepared its annual consolidated financial statements in accordance with IFRSs issued by the International Accounting Standards Board (“IASB”) as adopted by the EU, Interpretations issued by the IFRS Interpretations Committee (“IFRIC”) and the Companies Act. The Interim Financial Statements have been prepared in accordance with Article (4)(2)(c) of the Luxembourg Transparency Law and in accordance with IAS 34 ‘Interim Financial Reporting’, as adopted by the EU.
In preparing these Interim Financial Statements the Group has applied consistently the accounting policies and methods of computation used in the Group’s Annual Report and Financial Statements.
c. New standards and interpretations adopted during the period
The following amendments to standards relevant to the Group’s operations were adopted during the period and did not have a material impact on the Group’s condensed consolidated financial statements.
Interest Rate Benchmark Reform Phase 2 amendments to IFRS 9 ‘Financial Instruments’, IAS 39 ‘Financial Instruments: Recognition and Measurement’, IFRS 7 ‘Financial Instruments: Disclosures’, IFRS 4 ‘Insurance Contracts’ and IFRS 16 ‘Leases’ were issued by the IASB in August 2020.
The amendments outline the accounting and disclosure requirements for the financial instruments which are transitioned to alternative benchmark rates. The amendments are applicable retrospectively and are effective from, and applied for periods beginning on or after 1 January 2021. The amendments were adopted by the UK and endorsed by the EU in January 2021.
There were no other standards, amendments to standards or interpretations relevant to the Group’s operations adopted during the period.
d. New standards and interpretations not yet adopted
At the date of authorisation of these condensed consolidated financial statements, the following amendments to standards relevant to the Group’s operations had been issued by the IASB but were not mandatory for accounting periods beginning 1 January 2021. The Group does not expect that the adoption of the following amendments to standards will have a material impact on the Group’s condensed consolidated financial statements.
Amendments to IAS 37 ‘Provisions, Contingent Liabilities and Contingent Assets’: Onerous Contracts – Cost of Fulfilling a Contract were issued by the IASB in May 2020, for modified retrospective application in accounting periods beginning on or after 1 January 2022. Early application is permitted.
As part of the 2018-2020 Annual Improvements Cycle published in May 2020, the IASB made an amendment to IFRS 9 ‘Financial Instruments’, relating to the treatment of fees in the assessment of whether financial liabilities are modified or exchanged, where such transactions occur on or after 1 January 2022. Early application is permitted.
Amendments to IAS 8 ‘Accounting Policies, Changes in Accounting Estimates and Errors’: Definition of Accounting Estimates were issued by the IASB in February 2021, for prospective application in accounting periods beginning on or after 1 January 2023. Early application is permitted.
Amendments to IAS 1 ‘Presentation of Financial Statements’: Disclosure of Accounting Policies were issued by the IASB in February 2021, for prospective application in accounting periods beginning on or after 1 January 2023. Early application is permitted.
DocuSign Envelope ID: 06B80A33-A7E0-49DA-BA03-5DCB7D499FC5

Table of contents
MORGAN STANLEY & CO. INTERNATIONAL plc
NOTES TO THE CONDENSED CONSOLIDATED FINANCIAL STATEMENTS
Six months ended 30 June 2021
22
e. Critical accounting judgements and sources of estimation uncertainty
In preparing these condensed consolidated financial statements, the critical judgements made in applying the Group’s accounting policies and the Group’s critical sources of estimation uncertainty are consistent with those applied to the consolidated financial year ended 31 December 2020. The Group evaluates the critical accounting judgements and accounting estimates on an ongoing basis and believes that these are reasonable.
2. PLANNED REPLACEMENT OF LIBOR AND
REPLACEMENT OR REFORM OF OTHER INTEREST RATE BENCHMARKS
Central banks around the world, including the Bank of England, have commissioned committees and working groups of market participants and official sector representatives to replace LIBOR and replace or reform other interest rate benchmarks (collectively, the “IBORs”). On 5 March 2021, ICE Benchmark Administration, which administers LIBOR publication, announced that it will cease the publication of most LIBOR rates as of the end of December 2021, except for the publication until 30 June 2023 of the most widely used US dollar LIBOR tenors, and the UK FCA, which regulates LIBOR publication, announced that it would not compel panel banks to submit to LIBOR beyond those dates.
Subsequently, the International Swaps and Derivatives Association (“ISDA”) confirmed that the FCA announcement constituted an “Index Cessation Event” as defined in the ISDA IBOR Fallbacks Supplement, which amended ISDA's interest rate definitions to include robust fallbacks for derivatives linked to the IBORs, by automatically incorporating the fallbacks into legacy non-cleared derivatives entered into between adherents with matching transactions under the ISDA IBOR Fallbacks Protocol (the “ISDA Protocol”).
The FCA has stated that LIBOR in all its currencies (USD, GBP, EUR, JPY and CHF) will either cease or become non-representative and that new transactions linked to LIBOR should cease as soon as possible (other than for hedging or risk management purposes). The first major milestone in the UK
market occurred on 31 March 2021 with the target of no new GBP LIBOR-linked loans, bonds, securitisations and linear derivatives that expire after the end of 2021.
To support the phase-out of LIBOR, the FCA may, under powers introduced to the Financial Services Act 2021 which supplements existing powers under the UK Benchmarks Regulation (“BMR”), take action to procure the continued publication of certain LIBOR currencies and/or tenors deemed critical benchmarks after the end of 2021 with a substantially revised methodology (sometimes referred to as “synthetic LIBOR”), solely for use in “tough legacy” contracts (i.e., contracts that cannot realistically be amended before the end of 2021, which may be defined in more detail by the FCA). The FCA has also, in the second quarter of 2021, begun consultations on using these legislative powers to create a synthetic LIBOR for certain settings of GBP and JPY LIBOR, whilst also continuing to monitor USD LIBOR and its transition progress in conjunction with US authorities and stakeholders. The FCA had published market consultations in November 2020 with respect to the proposed methodology for synthetic LIBOR, and it is not yet known whether there will be any product or other restrictions to its potential use among legacy contracts. In addition, the impact of a synthetic LIBOR on contracts, particularly those not governed by English law and/or where one or more parties are not regulated entities in the UK, may require an analysis of the governing law and applicable regulatory obligations of the parties.
The Morgan Stanley Group IBOR transition plan is overseen by a global steering committee, with senior management oversight. Our transition plan is designed to identify, assess and monitor risks associated with the expected discontinuation or unavailability of one or more of the IBORs, and includes continued engagement with central bank and industry working groups and regulators (including participation and leadership on key committees), active client engagement, internal operational readiness, and risk management, among other things.
The market transition away from IBORs to
alternative reference rates is complex and could
have a range of adverse impacts on our business,
DocuSign Envelope ID: 06B80A33-A7E0-49DA-BA03-5DCB7D499FC5
Table of contents
MORGAN STANLEY & CO. INTERNATIONAL plc
NOTES TO THE CONDENSED CONSOLIDATED FINANCIAL STATEMENTS
Six months ended 30 June 2021
23
financial condition and results of operations. In
particular, such transition or reform could:
• Adversely impact the pricing, liquidity, value of, return on and trading for a broad array of financial products, including any IBOR-linked securities, loans and derivatives that are included in the financial assets and liabilities;
• Require extensive changes to documentation that governs or references IBOR or IBOR-based products, including, for example, pursuant to time-consuming renegotiations of existing documentation to modify the terms of outstanding securities and related hedging transactions;
• Result in a population of products with documentation that governs or references IBOR or IBOR-based products but that cannot be amended due to an inability to obtain sufficient consent from counterparties or product owners;
• Result in inquiries or other actions from regulators in respect of the Group’s (or the market’s) preparation and readiness for the replacement of an IBOR with one or more alternative reference rates;
• Result in disputes, litigation or other actions with clients, counterparties and investors, in various scenarios, such as regarding the interpretation and enforceability of provisions in IBOR-based products such as fallback language or other related provisions, including in the case of fallbacks to the alternative reference rates, any economic, legal, operational or other impact resulting from the fundamental differences between the IBORs and the various alternative reference rates;
• Require the transition and/or development of appropriate systems and analytics to effectively transition risk management processes from IBORs to those based on one or more alternative reference rates in a timely manner, including by quantifying value and risk for various alternative reference rates, which may prove challenging given the limited history of the proposed alternative reference rates; and
• Cause the Group to incur additional costs in relation to any of the above factors.
Other factors include the pace of the transition to the alternative reference rates, timing mismatches between cash and derivative markets, the specific terms and parameters for and market acceptance of any alternative reference rate, market conventions for the use of any alternative reference rate in connection with a particular product (including the timing and market adoption of any conventions proposed or recommended by any industry or other group), prices of and the liquidity of trading markets for products based on alternative reference rates, and the Group’s ability to transition and develop appropriate systems and analytics for one or more alternative reference rates.
The Group remains party to a number of LIBOR-linked contracts, many of which extend beyond 2021 and, in the case of US dollar LIBOR, 30 June 2023, composed of derivatives, floating rate notes and loans, and the Group continues to execute against the Morgan Stanley Group IBOR transition plan to promote the transition to alternative reference rates in accordance with industry transition timelines. The Group’s review of these LIBOR-linked contracts includes assessing the impact of applicable fallbacks and any amendments that may be warranted or appropriate. Morgan Stanley is also taking steps to update operational processes (including to support alternative reference rates), models, and associated infrastructure, as well as conducting certain client outreach to amend fallbacks, including by utilisation of the ISDA Protocol or through bilaterally-negotiated voluntary conversions of outstanding LIBOR products where practicable. Intra group exposures which reference IBORs are not reliant on third party consent.
The Group’s primary IBOR exposures arise on its derivative contracts. Key Morgan Stanley Group entities, including the Company, have adhered to the ISDA Protocol. As of 30 June 2021, 63% of the Company’s external bilateral IBOR-referencing derivative counterparties have adhered to the ISDA Protocol, representing 93% of the Company’s nominal exposure to IBOR-referencing bilateral derivative contracts.
DocuSign Envelope ID: 06B80A33-A7E0-49DA-BA03-5DCB7D499FC5
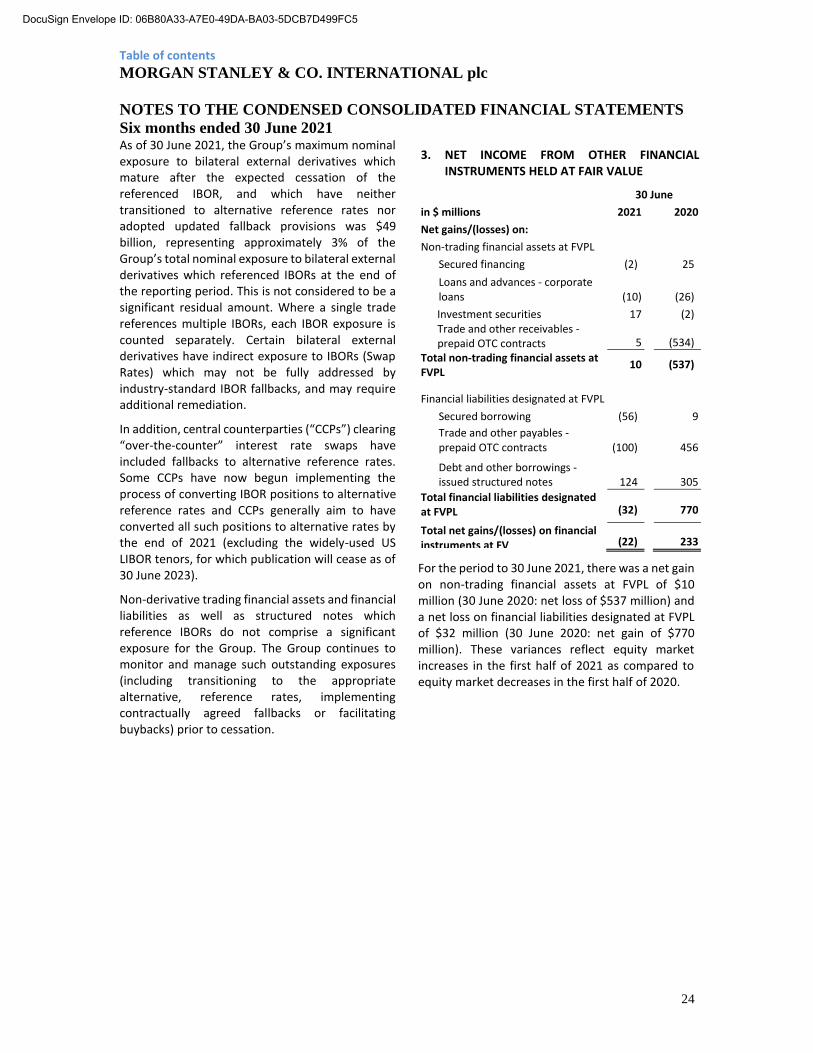
Table of contents
MORGAN STANLEY & CO. INTERNATIONAL plc
NOTES TO THE CONDENSED CONSOLIDATED FINANCIAL STATEMENTS
Six months ended 30 June 2021
24
As of 30 June 2021, the Group’s maximum nominal exposure to bilateral external derivatives which mature after the expected cessation of the referenced IBOR, and which have neither transitioned to alternative reference rates nor adopted updated fallback provisions was $49 billion, representing approximately 3% of the Group’s total nominal exposure to bilateral external derivatives which referenced IBORs at the end of the reporting period. This is not considered to be a significant residual amount. Where a single trade references multiple IBORs, each IBOR exposure is counted separately. Certain bilateral external derivatives have indirect exposure to IBORs (Swap Rates) which may not be fully addressed by industry-standard IBOR fallbacks, and may require additional remediation.
In addition, central counterparties (“CCPs”) clearing “over-the-counter” interest rate swaps have included fallbacks to alternative reference rates. Some CCPs have now begun implementing the process of converting IBOR positions to alternative reference rates and CCPs generally aim to have converted all such positions to alternative rates by the end of 2021 (excluding the widely-used US LIBOR tenors, for which publication will cease as of 30 June 2023).
Non-derivative trading financial assets and financial liabilities as well as structured notes which reference IBORs do not comprise a significant exposure for the Group. The Group continues to monitor and manage such outstanding exposures (including transitioning to the appropriate alternative, reference rates, implementing contractually agreed fallbacks or facilitating buybacks) prior to cessation.
3. NET INCOME FROM OTHER FINANCIAL INSTRUMENTS HELD AT FAIR VALUE
30 June
in $ millions 2021 2020
Net gains/(losses) on:
Non-trading financial assets at FVPL
Secured financing (2) 25
Loans and advances - corporate loans (10) (26)
Investment securities 17 (2) Trade and other receivables - prepaid OTC contracts 5 (534)
Total non-trading financial assets at FVPL
10 (537)
Financial liabilities designated at FVPL
Secured borrowing (56) 9
Trade and other payables - prepaid OTC contracts (100) 456
Debt and other borrowings - issued structured notes 124 305
Total financial liabilities designated at FVPL (32) 770
Total net gains/(losses) on financial instruments at FV (22) 233
For the period to 30 June 2021, there was a net gain on non-trading financial assets at FVPL of $10 million (30 June 2020: net loss of $537 million) and a net loss on financial liabilities designated at FVPL of $32 million (30 June 2020: net gain of $770 million). These variances reflect equity market increases in the first half of 2021 as compared to equity market decreases in the first half of 2020.
DocuSign Envelope ID: 06B80A33-A7E0-49DA-BA03-5DCB7D499FC5
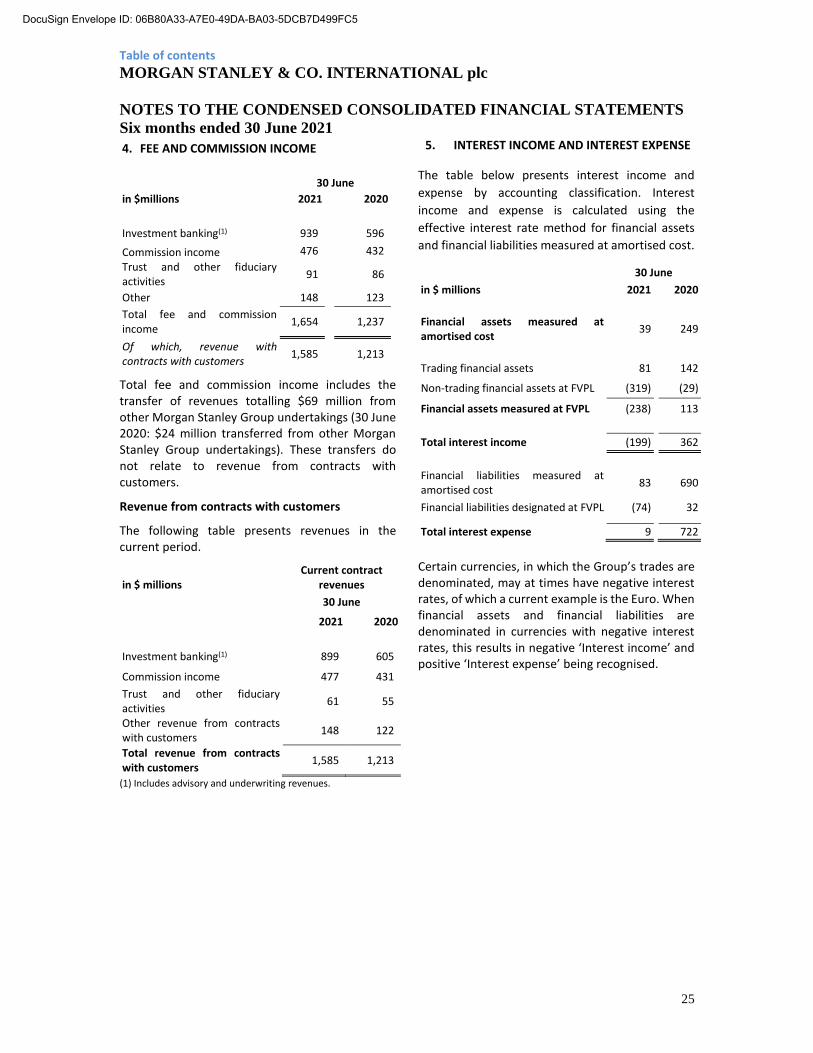
Table of contents
MORGAN STANLEY & CO. INTERNATIONAL plc
NOTES TO THE CONDENSED CONSOLIDATED FINANCIAL STATEMENTS
Six months ended 30 June 2021
25
4. FEE AND COMMISSION INCOME
30 June
in $millions 2021 2020
Investment banking(1) 939 596
Commission income 476 432
Trust and other fiduciary activities
91 86
Other 148 123
Total fee and commission income
1,654 1,237
Of which, revenue with contracts with customers
1,585 1,213
Total fee and commission income includes the transfer of revenues totalling $69 million from other Morgan Stanley Group undertakings (30 June 2020: $24 million transferred from other Morgan Stanley Group undertakings). These transfers do not relate to revenue from contracts with customers.
Revenue from contracts with customers
The following table presents revenues in the current period.
in $ millions Current contract
revenues
30 June
2021 2020
Investment banking(1) 899 605
Commission income 477 431
Trust and other fiduciary activities
61 55
Other revenue from contracts with customers
148 122
Total revenue from contracts with customers
1,585 1,213
(1) Includes advisory and underwriting revenues.
5. .
INTEREST INCOME AND INTEREST EXPENSE
The table below presents interest income and
expense by accounting classification. Interest
income and expense is calculated using the
effective interest rate method for financial assets
and financial liabilities measured at amortised cost.
30 June
in $ millions 2021
2020
Financial assets measured at amortised cost
39 249
Trading financial assets 81 142
Non-trading financial assets at FVPL (319) (29)
Financial assets measured at FVPL (238) 113
Total interest income (199) 362
Financial liabilities measured at amortised cost
83 690
Financial liabilities designated at FVPL (74) 32
Total interest expense 9 722
Certain currencies, in which the Group’s trades are denominated, may at times have negative interest rates, of which a current example is the Euro. When financial assets and financial liabilities are denominated in currencies with negative interest rates, this results in negative ‘Interest income’ and positive ‘Interest expense’ being recognised.
DocuSign Envelope ID: 06B80A33-A7E0-49DA-BA03-5DCB7D499FC5

Table of contents
MORGAN STANLEY & CO. INTERNATIONAL plc
NOTES TO THE CONDENSED CONSOLIDATED FINANCIAL STATEMENTS
Six months ended 30 June 2021
26
6. OPERATING EXPENSES
30 June in $millions 2021 2020
Direct staff costs 886 804 Management charges from other Morgan Stanley Group undertakings relating to staff costs 327 260
Staff related expenses 1,213 1,064
Management charges from other Morgan Stanley Group undertakings relating to other services 745 700 Brokerage fees 314 282 Administration and corporate services 42 36 Professional services 82 57 Other taxes 428 330 Net impairment (gain)/loss on financial assets (2) 4 Other 64 54
Non staff related expenses 1,673 1,463
Total operating expenses 2,886 2,527
The Group employs staff directly and also utilises the services of staff who are employed by other Morgan Stanley Group undertakings.
Staff-related expenses increased by 14% from $1,064 million to $1,213 million for the period. The increase in staff-related expenses was primarily driven by an increase in the fair value on deferred equity compensation, primarily due to the increase in the Morgan Stanley share price during the period.
Non-staff related expenses increased by 14% from $1,463 million to $1,673 million for the period. This increase was primarily driven by higher volume-related expenses including brokerage fees and transaction taxes, from increased client activity.
7. INCOME TAX EXPENSE
The Group’s tax expense has been accrued based on the expected tax rate that takes into account current expectations concerning the allocation of group relief within the Morgan Stanley UK tax group and prevailing tax rates in the jurisdictions in which the Group operates.
The UK Bank Levy (the “Levy”) is an annual charge on a bank’s balance sheet. Under IFRIC 21, ‘Levies’, the Levy is not recognised in the Interim Financial Statements, since the Levy’s obligating event has not yet arisen. However, for the purposes of calculating the ETR, an adjustment has been made for the forecast Levy (since it is non-deductible for UK corporation tax purposes). As such, the Levy impacts the annual ETR and the tax expense for the six months ended 30 June 2021.
The Group’s forecast ETR is sensitive to the geographic mix of profits and tax rates in non-UK jurisdictions (including the net effect of foreign withholding taxes suffered by the Group), the additional 8% UK banking surcharge, as well as the non-deductibility of certain expenses for tax purposes. Offsetting this is the income tax benefit of coupon payments on Additional Tier 1 capital instruments, which reduces the forecast tax rate for the year.
The Group’s forecast ETR for the period is 26.3% (six months ended 30 June 2020: 47.3%), which is lower than the standard rate of corporation tax (inclusive of the UK Banking Surcharge) in the UK of 27%. The higher ETR in the prior year period is primarily due to a prior year period specific $212 million tax expense, resulting in an increase to prior year period ETR of 18.9%. This was driven by remeasurement of provisions in relation to uncertain tax positions, principally following a Dutch Court judgement in relation to an ongoing matter.
DocuSign Envelope ID: 06B80A33-A7E0-49DA-BA03-5DCB7D499FC5
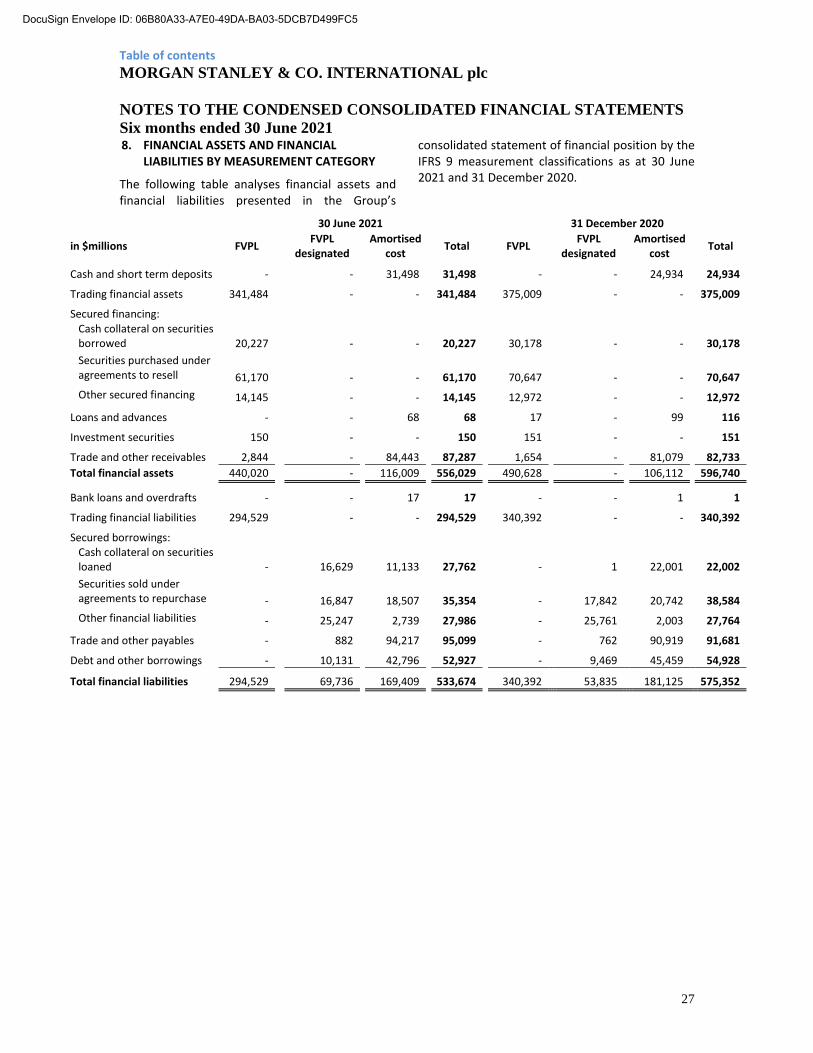
Table of contents
MORGAN STANLEY & CO. INTERNATIONAL plc
NOTES TO THE CONDENSED CONSOLIDATED FINANCIAL STATEMENTS
Six months ended 30 June 2021
27
8. FINANCIAL ASSETS AND FINANCIAL LIABILITIES BY MEASUREMENT CATEGORY
The following table analyses financial assets and financial liabilities presented in the Group’s
consolidated statement of financial position by the IFRS 9 measurement classifications as at 30 June 2021 and 31 December 2020.
30 June 2021 31 December 2020
in $millions FVPL FVPL
designated
Amortised cost
Total
FVPL FVPL
designated
Amortised cost
Total
Cash and short term deposits - - 31,498 31,498 - - 24,934 24,934
Trading financial assets 341,484 - - 341,484 375,009 - - 375,009
Secured financing: Cash collateral on securities borrowed 20,227 - - 20,227 30,178 - - 30,178
Securities purchased under agreements to resell 61,170 - - 61,170 70,647 - - 70,647
Other secured financing 14,145 - - 14,145 12,972 - - 12,972
Loans and advances - - 68 68 17 - 99 116
Investment securities 150 - - 150 151 - - 151
Trade and other receivables 2,844 - 84,443 87,287 1,654 - 81,079 82,733
Total financial assets 440,020 - 116,009 556,029 490,628 - 106,112 596,740
Bank loans and overdrafts - - 17 17 - - 1 1
Trading financial liabilities 294,529 - - 294,529 340,392 - - 340,392
Secured borrowings: Cash collateral on securities loaned - 16,629 11,133 27,762 - 1 22,001 22,002
Securities sold under agreements to repurchase - 16,847 18,507 35,354 - 17,842 20,742 38,584
Other financial liabilities - 25,247 2,739 27,986 - 25,761 2,003 27,764
Trade and other payables - 882 94,217 95,099 - 762 90,919 91,681
Debt and other borrowings - 10,131 42,796 52,927 - 9,469 45,459 54,928
Total financial liabilities 294,529 69,736 169,409 533,674 340,392 53,835 181,125 575,352
DocuSign Envelope ID: 06B80A33-A7E0-49DA-BA03-5DCB7D499FC5

Table of contents
MORGAN STANLEY & CO. INTERNATIONAL plc
NOTES TO THE CONDENSED CONSOLIDATED FINANCIAL STATEMENTS
Six months ended 30 June 2021
28
9. TRADING FINANCIAL ASSETS AND
LIABILITIES
in $ millions 30 June 2021 31 December 2020
Assets Liabilities Assets Liabilities Government debt securities 21,710 25,957 16,727 24,586 Corporate and other debt 14,278 5,301 11,169 4,039 Corporate equities 71,976 25,032 62,365 23,459 Derivatives (see note 10) 233,520 238,239 284,748 288,308
341,484 294,529 375,009 340,392
10. DERIVATIVES
30 June 2021
in $ millions Bilateral
OTC Cleared
OTC
Listed derivative contracts Total
Derivative assets:
Interest rate contracts 69,608 4,819 24 74,451
Credit contracts 8,082 394 - 8,476
Foreign exchange and gold contracts 67,402 1,445 2 68,849
Equity contracts 57,276 - 10,433 67,709
Commodity contracts 12,982 - 1,053 14,035
215,350 6,658 11,512 233,520
Derivative liabilities:
Interest rate contracts 67,749 3,636 16 71,401
Credit contracts 7,887 714 - 8,601
Foreign exchange and gold contracts 65,084 1,348 11 66,443
Equity contracts 67,831 - 9,971 77,802
Commodity contracts 13,285 - 707 13,992
221,836 5,698 10,705 238,239
31 December 2020
in $ millions Bilateral
OTC Cleared
OTC
Listed derivative contracts Total
Derivative assets:
Interest rate contracts 94,374 5,945 4 100,323
Credit contracts 7,256 258 - 7,514
Foreign exchange and gold contracts 103,982 1,641 - 105,623
Equity contracts 54,971 - 9,714 64,685
Commodity contracts 6,323 - 280 6,603
266,906 7,844 9,998 284,748
Derivative liabilities:
Interest rate contracts 91,074 4,398 3 95,475
Credit contracts 6,908 400 - 7,308
Foreign exchange and gold contracts 102,387 1,599 10 103,996
Equity contracts 65,543 - 9,440 74,983
Commodity contracts 6,355 - 191 6,546
272,267 6,397 9,644 288,308
11. INTEREST IN STRUCTURED ENTITIES
The Group’s involvement with structured entities, including those of which it considers itself the sponsor, is consistent with that described in the Group’s 2020 Annual Report and Financial Statements.
Consolidated structured entities
The table below shows information about the structured entities which the Group consolidates. Consolidated structured entity assets and liabilities are presented after intercompany eliminations and includes assets financed on a non-recourse basis.
30 June 2021 in $ millions
Client Intermediation
Mortgage and Asset-Backed
Securitisations (“MABS”) Total
Assets of structured entities 200
296 496
Liabilities of structured entities 195
44 239
DocuSign Envelope ID: 06B80A33-A7E0-49DA-BA03-5DCB7D499FC5
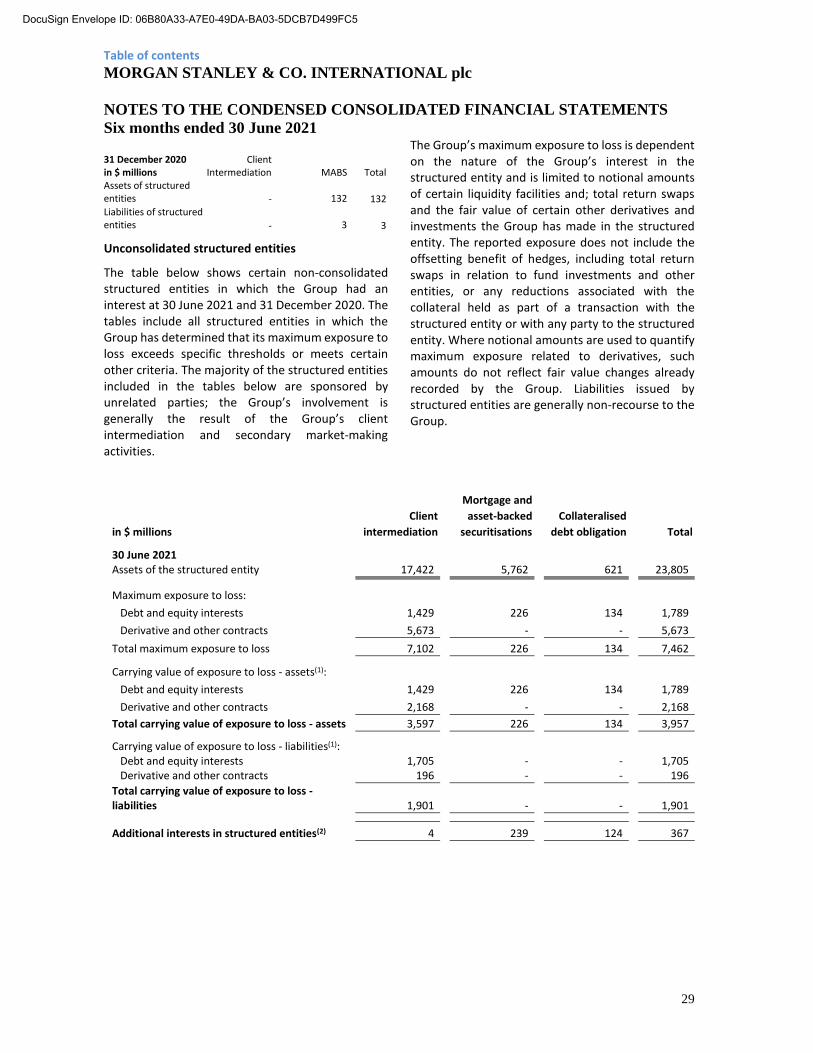
Table of contents
MORGAN STANLEY & CO. INTERNATIONAL plc
NOTES TO THE CONDENSED CONSOLIDATED FINANCIAL STATEMENTS
Six months ended 30 June 2021
29
31 December 2020 in $ millions
Client Intermediation MABS Total
Assets of structured entities -
132 132
Liabilities of structured entities -
3 3
Unconsolidated structured entities
The table below shows certain non-consolidated structured entities in which the Group had an interest at 30 June 2021 and 31 December 2020. The tables include all structured entities in which the Group has determined that its maximum exposure to loss exceeds specific thresholds or meets certain other criteria. The majority of the structured entities included in the tables below are sponsored by unrelated parties; the Group’s involvement is generally the result of the Group’s client intermediation and secondary market-making activities.
The Group’s maximum exposure to loss is dependent on the nature of the Group’s interest in the structured entity and is limited to notional amounts of certain liquidity facilities and; total return swaps and the fair value of certain other derivatives and investments the Group has made in the structured entity. The reported exposure does not include the offsetting benefit of hedges, including total return swaps in relation to fund investments and other entities, or any reductions associated with the collateral held as part of a transaction with the structured entity or with any party to the structured entity. Where notional amounts are used to quantify maximum exposure related to derivatives, such amounts do not reflect fair value changes already recorded by the Group. Liabilities issued by structured entities are generally non-recourse to the Group.
Mortgage and
Client asset-backed Collateralised
in $ millions intermediation securitisations debt obligation Total 30 June 2021 Assets of the structured entity 17,422 5,762 621 23,805
Maximum exposure to loss:
Debt and equity interests 1,429 226 134 1,789
Derivative and other contracts 5,673 - - 5,673
Total maximum exposure to loss 7,102 226 134 7,462
Carrying value of exposure to loss - assets(1):
Debt and equity interests 1,429 226 134 1,789
Derivative and other contracts 2,168 - - 2,168
Total carrying value of exposure to loss - assets 3,597 226 134 3,957
Carrying value of exposure to loss - liabilities(1): Debt and equity interests 1,705 - - 1,705 Derivative and other contracts 196 - - 196
Total carrying value of exposure to loss - liabilities 1,901 - - 1,901
Additional interests in structured entities(2) 4 239 124 367
DocuSign Envelope ID: 06B80A33-A7E0-49DA-BA03-5DCB7D499FC5
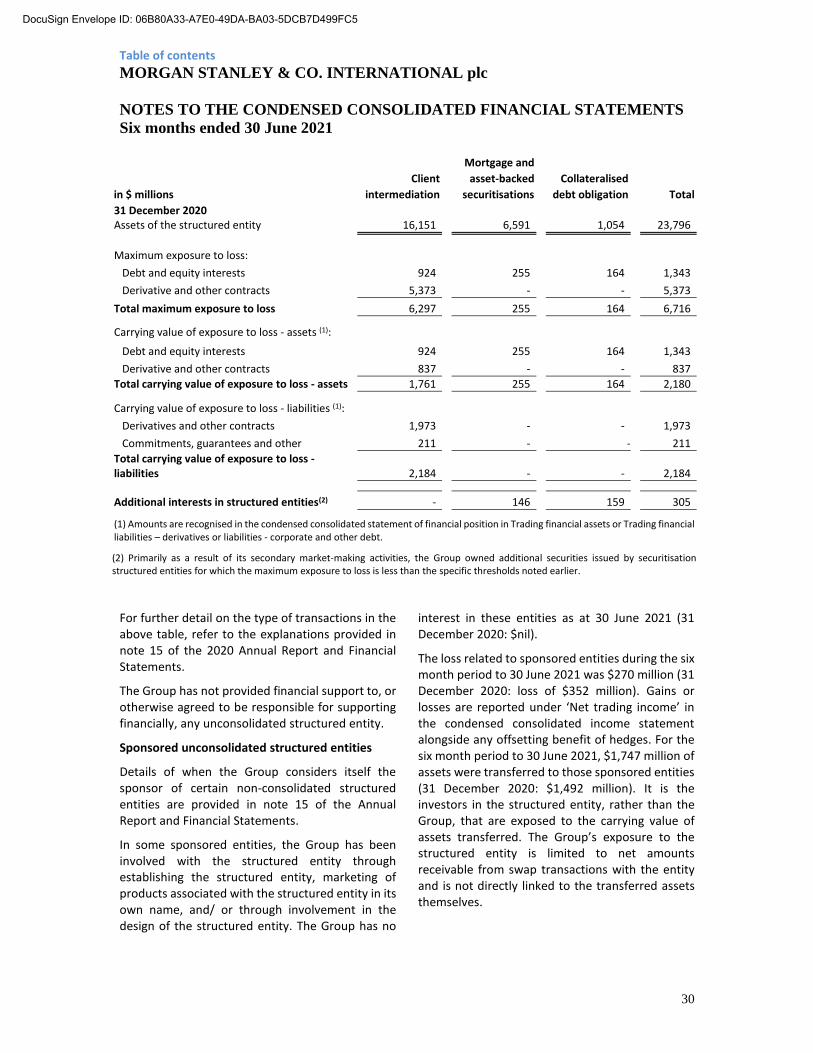
Table of contents
MORGAN STANLEY & CO. INTERNATIONAL plc
NOTES TO THE CONDENSED CONSOLIDATED FINANCIAL STATEMENTS
Six months ended 30 June 2021
30
Mortgage and
Client asset-backed Collateralised
in $ millions intermediation securitisations debt obligation Total
31 December 2020 Assets of the structured entity 16,151 6,591 1,054 23,796
Maximum exposure to loss:
Debt and equity interests 924 255 164 1,343
Derivative and other contracts 5,373 - - 5,373
Total maximum exposure to loss 6,297 255 164 6,716
Carrying value of exposure to loss - assets (1):
Debt and equity interests 924 255 164 1,343
Derivative and other contracts 837 - - 837
Total carrying value of exposure to loss - assets 1,761 255 164 2,180
Carrying value of exposure to loss - liabilities (1):
Derivatives and other contracts 1,973 - - 1,973
Commitments, guarantees and other 211 - - 211
Total carrying value of exposure to loss -liabilities 2,184 - - 2,184
Additional interests in structured entities(2) - 146 159 305
(1) Amounts are recognised in the condensed consolidated statement of financial position in Trading financial assets or Trading financial liabilities – derivatives or liabilities - corporate and other debt.
(2) Primarily as a result of its secondary market-making activities, the Group owned additional securities issued by securitisation structured entities for which the maximum exposure to loss is less than the specific thresholds noted earlier.
For further detail on the type of transactions in the above table, refer to the explanations provided in note 15 of the 2020 Annual Report and Financial Statements.
The Group has not provided financial support to, or otherwise agreed to be responsible for supporting financially, any unconsolidated structured entity.
Sponsored unconsolidated structured entities
Details of when the Group considers itself the sponsor of certain non-consolidated structured entities are provided in note 15 of the Annual Report and Financial Statements.
In some sponsored entities, the Group has been involved with the structured entity through establishing the structured entity, marketing of products associated with the structured entity in its own name, and/ or through involvement in the design of the structured entity. The Group has no
interest in these entities as at 30 June 2021 (31 December 2020: $nil).
The loss related to sponsored entities during the six month period to 30 June 2021 was $270 million (31 December 2020: loss of $352 million). Gains or losses are reported under ‘Net trading income’ in the condensed consolidated income statement alongside any offsetting benefit of hedges. For the six month period to 30 June 2021, $1,747 million of assets were transferred to those sponsored entities (31 December 2020: $1,492 million). It is the investors in the structured entity, rather than the Group, that are exposed to the carrying value of assets transferred. The Group’s exposure to the structured entity is limited to net amounts receivable from swap transactions with the entity and is not directly linked to the transferred assets themselves.
DocuSign Envelope ID: 06B80A33-A7E0-49DA-BA03-5DCB7D499FC5
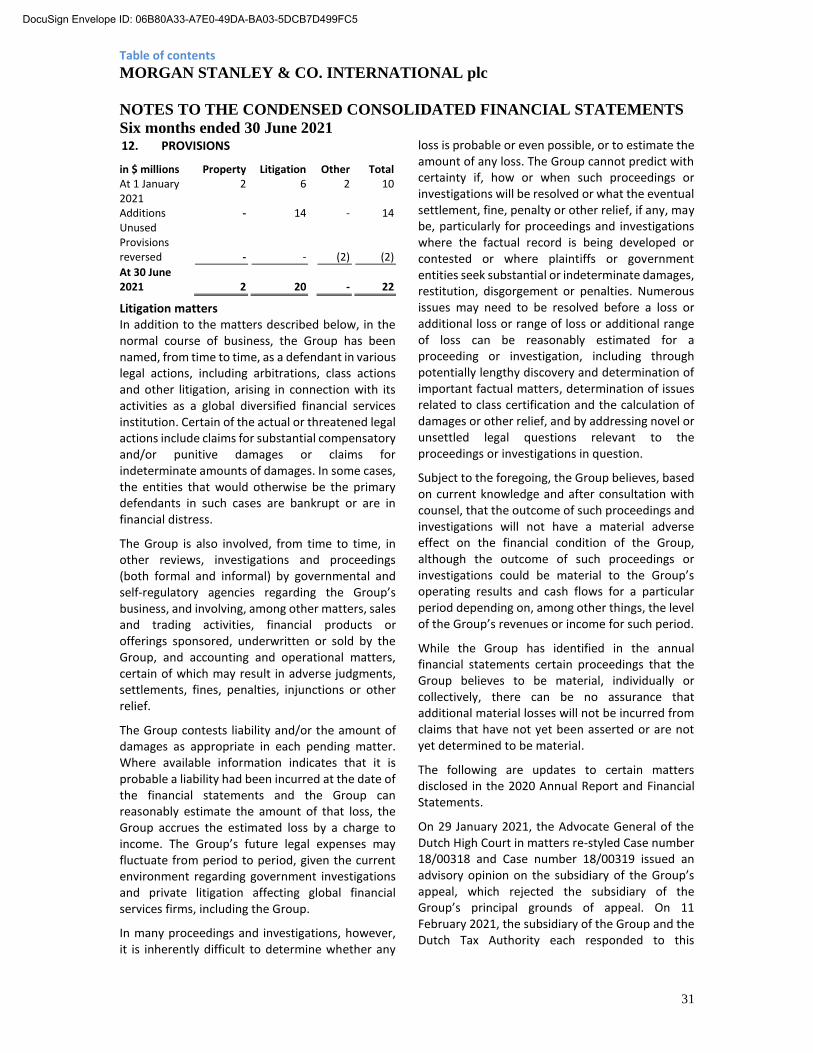
Table of contents
MORGAN STANLEY & CO. INTERNATIONAL plc
NOTES TO THE CONDENSED CONSOLIDATED FINANCIAL STATEMENTS
Six months ended 30 June 2021
31
12. PROVISIONS
in $ millions Property Litigation Other Total At 1 January 2021
2 6 2 10
Additions - 14 - 14 Unused Provisions reversed - - (2) (2)
At 30 June 2021 2 20 - 22
Litigation matters In addition to the matters described below, in the normal course of business, the Group has been named, from time to time, as a defendant in various legal actions, including arbitrations, class actions and other litigation, arising in connection with its activities as a global diversified financial services institution. Certain of the actual or threatened legal actions include claims for substantial compensatory and/or punitive damages or claims for indeterminate amounts of damages. In some cases, the entities that would otherwise be the primary defendants in such cases are bankrupt or are in financial distress.
The Group is also involved, from time to time, in other reviews, investigations and proceedings (both formal and informal) by governmental and self-regulatory agencies regarding the Group’s business, and involving, among other matters, sales and trading activities, financial products or offerings sponsored, underwritten or sold by the Group, and accounting and operational matters, certain of which may result in adverse judgments, settlements, fines, penalties, injunctions or other relief.
The Group contests liability and/or the amount of damages as appropriate in each pending matter. Where available information indicates that it is probable a liability had been incurred at the date of the financial statements and the Group can reasonably estimate the amount of that loss, the Group accrues the estimated loss by a charge to income. The Group’s future legal expenses may fluctuate from period to period, given the current environment regarding government investigations and private litigation affecting global financial services firms, including the Group.
In many proceedings and investigations, however, it is inherently difficult to determine whether any
loss is probable or even possible, or to estimate the amount of any loss. The Group cannot predict with certainty if, how or when such proceedings or investigations will be resolved or what the eventual settlement, fine, penalty or other relief, if any, may be, particularly for proceedings and investigations where the factual record is being developed or contested or where plaintiffs or government entities seek substantial or indeterminate damages, restitution, disgorgement or penalties. Numerous issues may need to be resolved before a loss or additional loss or range of loss or additional range of loss can be reasonably estimated for a proceeding or investigation, including through potentially lengthy discovery and determination of important factual matters, determination of issues related to class certification and the calculation of damages or other relief, and by addressing novel or unsettled legal questions relevant to the proceedings or investigations in question.
Subject to the foregoing, the Group believes, based on current knowledge and after consultation with counsel, that the outcome of such proceedings and investigations will not have a material adverse effect on the financial condition of the Group, although the outcome of such proceedings or investigations could be material to the Group’s operating results and cash flows for a particular period depending on, among other things, the level of the Group’s revenues or income for such period.
While the Group has identified in the annual financial statements certain proceedings that the Group believes to be material, individually or collectively, there can be no assurance that additional material losses will not be incurred from claims that have not yet been asserted or are not yet determined to be material.
The following are updates to certain matters disclosed in the 2020 Annual Report and Financial Statements.
On 29 January 2021, the Advocate General of the Dutch High Court in matters re-styled Case number 18/00318 and Case number 18/00319 issued an advisory opinion on the subsidiary of the Group’s appeal, which rejected the subsidiary of the Group’s principal grounds of appeal. On 11 February 2021, the subsidiary of the Group and the Dutch Tax Authority each responded to this
DocuSign Envelope ID: 06B80A33-A7E0-49DA-BA03-5DCB7D499FC5
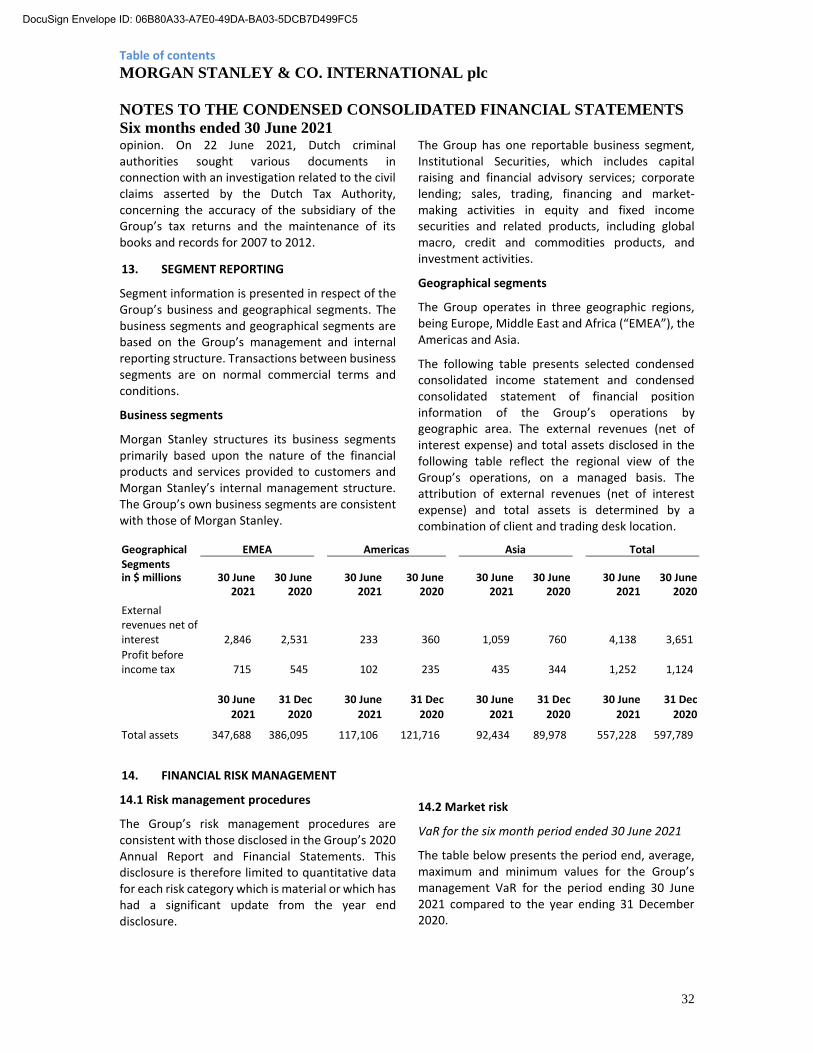
Table of contents
MORGAN STANLEY & CO. INTERNATIONAL plc
NOTES TO THE CONDENSED CONSOLIDATED FINANCIAL STATEMENTS
Six months ended 30 June 2021
32
opinion. On 22 June 2021, Dutch criminal authorities sought various documents in connection with an investigation related to the civil claims asserted by the Dutch Tax Authority, concerning the accuracy of the subsidiary of the Group’s tax returns and the maintenance of its books and records for 2007 to 2012.
13. SEGMENT REPORTING
Segment information is presented in respect of the Group’s business and geographical segments. The business segments and geographical segments are based on the Group’s management and internal reporting structure. Transactions between business segments are on normal commercial terms and conditions.
Business segments
Morgan Stanley structures its business segments primarily based upon the nature of the financial products and services provided to customers and Morgan Stanley’s internal management structure. The Group’s own business segments are consistent with those of Morgan Stanley.
The Group has one reportable business segment, Institutional Securities, which includes capital raising and financial advisory services; corporate lending; sales, trading, financing and market-making activities in equity and fixed income securities and related products, including global macro, credit and commodities products, and investment activities.
Geographical segments
The Group operates in three geographic regions, being Europe, Middle East and Africa (“EMEA”), the Americas and Asia.
The following table presents selected condensed consolidated income statement and condensed consolidated statement of financial position information of the Group’s operations by geographic area. The external revenues (net of interest expense) and total assets disclosed in the following table reflect the regional view of the Group’s operations, on a managed basis. The attribution of external revenues (net of interest expense) and total assets is determined by a combination of client and trading desk location.
Geographical EMEA Americas Asia Total Segments in $ millions 30 June 30 June 30 June 30 June 30 June 30 June 30 June 30 June 2021 2020 2021 2020 2021 2020 2021 2020 External revenues net of interest 2,846 2,531 233 360 1,059 760 4,138 3,651
Profit before income tax 715 545 102 235 435 344 1,252 1,124
30 June 31 Dec 30 June 31 Dec 30 June 31 Dec 30 June 31 Dec
2021 2020 2021 2020 2021 2020 2021 2020 Total assets 347,688 386,095 117,106 121,716 92,434 89,978 557,228 597,789
14. FINANCIAL RISK MANAGEMENT
14.1 Risk management procedures
The Group’s risk management procedures are consistent with those disclosed in the Group’s 2020 Annual Report and Financial Statements. This disclosure is therefore limited to quantitative data for each risk category which is material or which has had a significant update from the year end disclosure.
14.2 Market risk
VaR for the six month period ended 30 June 2021
The table below presents the period end, average, maximum and minimum values for the Group’s management VaR for the period ending 30 June 2021 compared to the year ending 31 December 2020.
DocuSign Envelope ID: 06B80A33-A7E0-49DA-BA03-5DCB7D499FC5

Table of contents
MORGAN STANLEY & CO. INTERNATIONAL plc
NOTES TO THE CONDENSED CONSOLIDATED FINANCIAL STATEMENTS
Six months ended 30 June 2021
33
in $ millions 95% / one-day VaR for the six months
ended 30 June 2021 95% / one-day VaR for the year ended 31
December 2020
Period end Average High Low Period end Average High Low Market Risk Category: Interest rate and credit spread 14 18 26 13 21 17 24 12 Equity price 18 23 31 18 26 20 32 7
Foreign exchange rate 5 6 13 3 9 5 12 2
Commodity price 2 3 7 2 6 5 9 1 Less: Diversification benefit(1)(2) (17) (21) N/A N/A (23) (20) N/A N/A
Primary Risk Categories 22 29 37 22 39 27 41 14
Credit Portfolio(3) 8 8 12 6 12 9 14 5
Less: Diversification benefit(1)(2) (7) (7) N/A N/A (9) (9) N/A N/A
Total Management VaR 23 30 41 23 42 27 42 15
(1) Diversification benefit equals the difference between total trading VaR and the sum of the VaRs for the four risk categories. This
benefit arises because the simulated one-day losses for each of the four primary market risk categories occur on different days;
similar diversification benefits are also taken into account within each category.
(2) N/A – Not applicable. The minimum and maximum VaR values for the total VaR and each of the component VaRs might have
occurred on different days during the period and therefore the diversification benefit is not an applicable measure.
(3) The Credit Portfolio VaR is disclosed as a separate category from the Primary Risk Categories and includes loans that are carried
at fair value and associated hedges as well as counterparty credit valuation adjustments and related hedges.
The Group’s average Total Management VaR for the six months ended 30 June 2021 was $30 million, compared to $27 million for the year ended 2020. The increase in average VaR is primarily driven by increased exposures in equities. The increased market volatility during COVID-19 stress period in 2020 is not part of the current one year historical window used for VaR in 2021.
Elevated 2020 period end VaR was mainly driven by equity exposure which was reduced the next day.
Non-trading risks for the six month period ended 30 June 2021
The Group believes that sensitivity analysis is an appropriate representation of the Group’s non-trading risks. Reflected below is this analysis, which covers substantially all of the non-trading risk in the Group’s portfolio, with the exception of counterparty credit valuation adjustments, which are covered in the previous section.
Interest rate risk
The Group’s VaR excludes certain funding liabilities and money market transactions. The application to these positions of a parallel shift in interest rates of
200 basis points would result in a net loss or gain, respectively, of approximately $12.8 million as at 30 June 2021, compared to a net loss or gain of $16.3 million as at 31 December 2020.
Funding liabilities
The credit spread risk sensitivity of the Group’s mark-to-market funding liabilities corresponds to an increase or decrease in value of approximately $5.8 million and $6.5 million for each 1 basis point shift in the Group’s credit spread level for 30 June 2021 and 31 December 2020, respectively.
14.3 Credit Risk
14.3.1 Credit risk management
Refer to pages 9 to 11 of the Interim Management Report and to pages 20 to 24 of the Annual Report and Financial Statements for details of the Group’s credit risk management processes.
14.3.2 Exposure to credit risk
The maximum exposure to credit risk (“gross credit exposure”) of the Group as at 30 June 2021 is disclosed below, based on the carrying amounts of the financial assets and the maximum amount that
DocuSign Envelope ID: 06B80A33-A7E0-49DA-BA03-5DCB7D499FC5
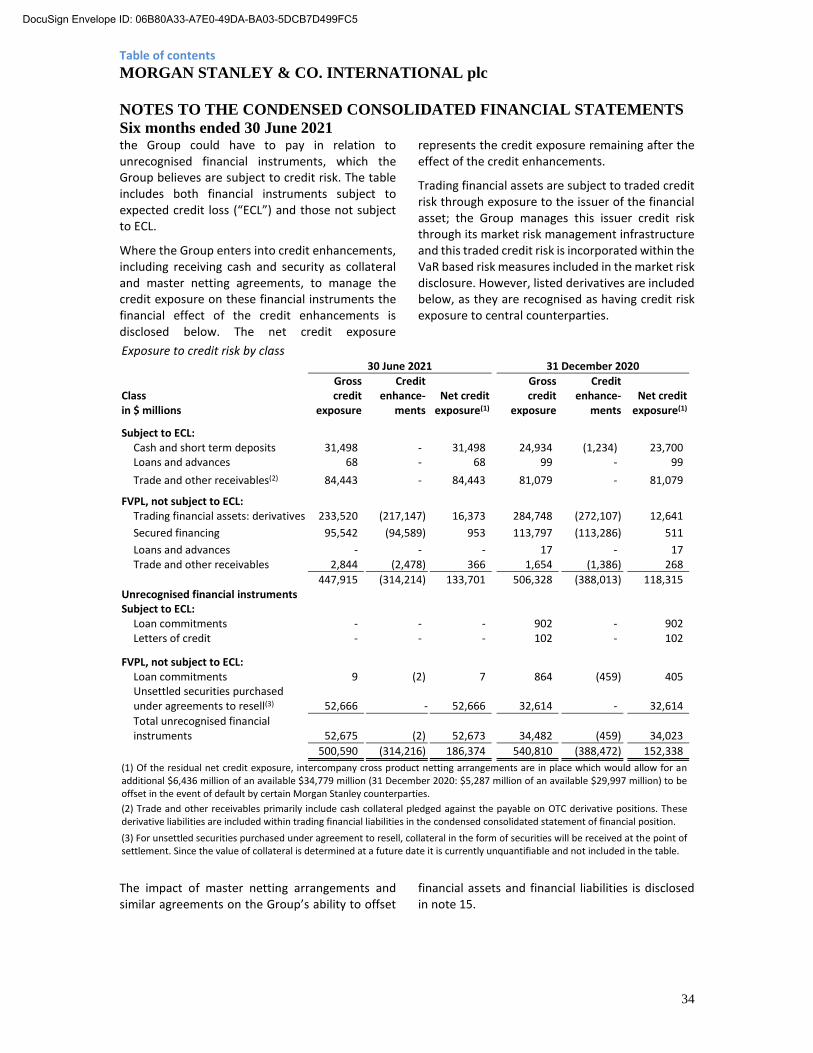
Table of contents
MORGAN STANLEY & CO. INTERNATIONAL plc
NOTES TO THE CONDENSED CONSOLIDATED FINANCIAL STATEMENTS
Six months ended 30 June 2021
34
the Group could have to pay in relation to unrecognised financial instruments, which the Group believes are subject to credit risk. The table includes both financial instruments subject to expected credit loss (“ECL”) and those not subject to ECL.
Where the Group enters into credit enhancements, including receiving cash and security as collateral and master netting agreements, to manage the credit exposure on these financial instruments the financial effect of the credit enhancements is disclosed below. The net credit exposure
represents the credit exposure remaining after the effect of the credit enhancements.
Trading financial assets are subject to traded credit risk through exposure to the issuer of the financial asset; the Group manages this issuer credit risk through its market risk management infrastructure and this traded credit risk is incorporated within the VaR based risk measures included in the market risk disclosure. However, listed derivatives are included below, as they are recognised as having credit risk exposure to central counterparties.
Exposure to credit risk by class 30 June 2021 31 December 2020
Class in $ millions
Gross credit
exposure
Credit enhance-
ments Net credit
exposure(1)
Gross credit
exposure
Credit enhance-
ments Net credit
exposure(1)
Subject to ECL: Cash and short term deposits 31,498 - 31,498 24,934 (1,234) 23,700 Loans and advances 68 - 68 99 - 99
Trade and other receivables(2) 84,443 - 84,443 81,079 - 81,079
FVPL, not subject to ECL: Trading financial assets: derivatives 233,520 (217,147) 16,373 284,748 (272,107) 12,641
Secured financing 95,542 (94,589) 953 113,797 (113,286) 511
Loans and advances - - - 17 - 17 Trade and other receivables 2,844 (2,478) 366 1,654 (1,386) 268
447,915 (314,214) 133,701 506,328 (388,013) 118,315 Unrecognised financial instruments Subject to ECL:
Loan commitments - - - 902 - 902 Letters of credit - - - 102 - 102
FVPL, not subject to ECL: Loan commitments 9 (2) 7 864 (459) 405 Unsettled securities purchased under agreements to resell(3) 52,666 - 52,666 32,614 - 32,614
Total unrecognised financial instruments 52,675 (2) 52,673 34,482 (459) 34,023
500,590 (314,216) 186,374 540,810 (388,472) 152,338
(1) Of the residual net credit exposure, intercompany cross product netting arrangements are in place which would allow for an additional $6,436 million of an available $34,779 million (31 December 2020: $5,287 million of an available $29,997 million) to be offset in the event of default by certain Morgan Stanley counterparties.
(2) Trade and other receivables primarily include cash collateral pledged against the payable on OTC derivative positions. These derivative liabilities are included within trading financial liabilities in the condensed consolidated statement of financial position.
(3) For unsettled securities purchased under agreement to resell, collateral in the form of securities will be received at the point of settlement. Since the value of collateral is determined at a future date it is currently unquantifiable and not included in the table.
The impact of master netting arrangements and similar agreements on the Group’s ability to offset
financial assets and financial liabilities is disclosed in note 15.
DocuSign Envelope ID: 06B80A33-A7E0-49DA-BA03-5DCB7D499FC5
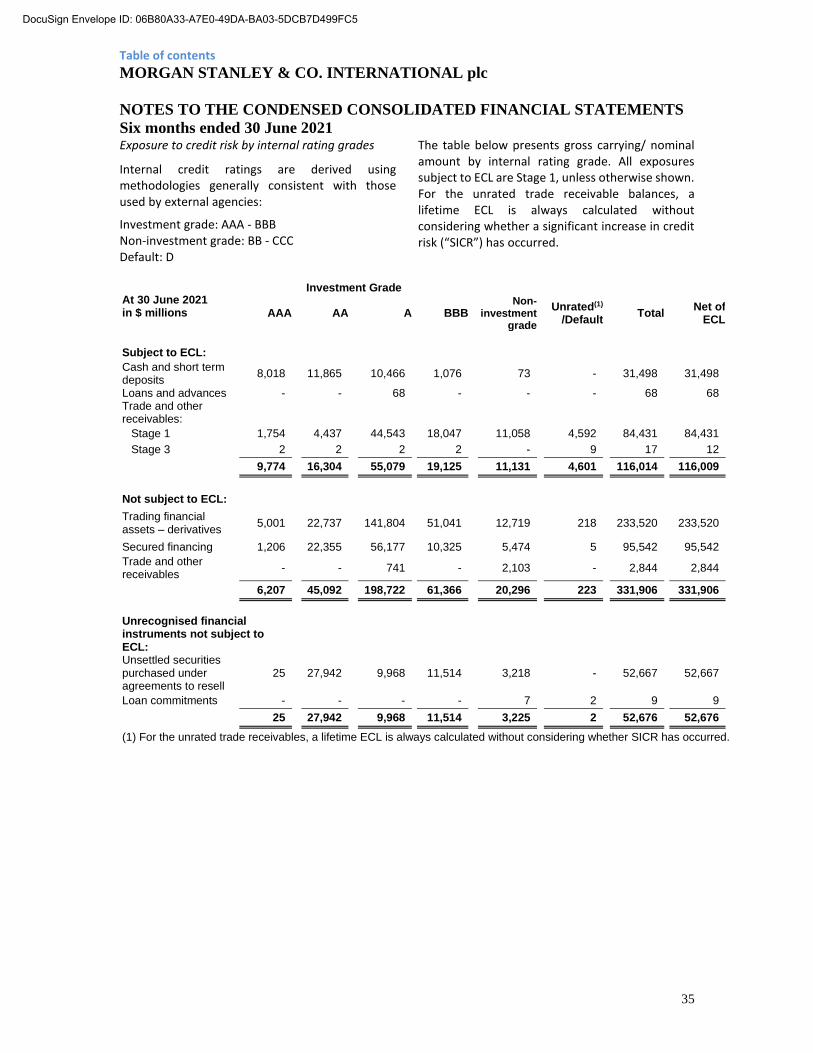
Table of contents
MORGAN STANLEY & CO. INTERNATIONAL plc
NOTES TO THE CONDENSED CONSOLIDATED FINANCIAL STATEMENTS
Six months ended 30 June 2021
35
Exposure to credit risk by internal rating grades
Internal credit ratings are derived using methodologies generally consistent with those used by external agencies:
Investment grade: AAA - BBB Non-investment grade: BB - CCC Default: D
The table below presents gross carrying/ nominal amount by internal rating grade. All exposures subject to ECL are Stage 1, unless otherwise shown. For the unrated trade receivable balances, a lifetime ECL is always calculated without considering whether a significant increase in credit risk (“SICR”) has occurred.
At 30 June 2021 in $ millions
Investment Grade
AAA AA A BBB Non-
investment grade
Unrated(1)
/Default Total
Net of ECL
Subject to ECL: Cash and short term deposits
8,018 11,865 10,466 1,076 73 - 31,498
31,498
Loans and advances - - 68 - - - 68 68 Trade and other receivables:
Stage 1 1,754 4,437 44,543 18,047 11,058 4,592 84,431 84,431
Stage 3 2 2 2 2 - 9 17 12
9,774 16,304 55,079 19,125 11,131 4,601 116,014 116,009
Not subject to ECL:
Trading financial assets – derivatives
5,001 22,737 141,804 51,041 12,719 218 233,520
233,520
Secured financing 1,206 22,355 56,177 10,325 5,474 5 95,542 95,542
Trade and other receivables
- - 741 - 2,103 - 2,844
2,844
6,207 45,092 198,722 61,366 20,296 223 331,906 331,906
Unrecognised financial instruments not subject to ECL:
Unsettled securities purchased under agreements to resell
25 27,942 9,968 11,514 3,218 - 52,667
52,667
Loan commitments - - - - 7 2 9 9
25 27,942 9,968 11,514 3,225 2 52,676 52,676
(1) For the unrated trade receivables, a lifetime ECL is always calculated without considering whether SICR has occurred.
DocuSign Envelope ID: 06B80A33-A7E0-49DA-BA03-5DCB7D499FC5

Table of contents
MORGAN STANLEY & CO. INTERNATIONAL plc
NOTES TO THE CONDENSED CONSOLIDATED FINANCIAL STATEMENTS
Six months ended 30 June 2021
36
At 31 December 2020 in $ millions
Investment Grade
AAA AA A BBB Non-
investment grade
Unrated(1)
/Default Total
Net of ECL
Subject to ECL:
Cash and short term deposits - 9,915 10,771 4,132 116 - 24,934 24,934
Loans and advances
Stage 1 - - 59 34 3 - 96 96
Stage 2 - - - - 4 - 4 3
Trade and other receivables:
Stage 1 3,293 4,424 41,879 14,866 12,205 4,396 81,063 81,063
Stage 3 2 2 2 4 3 8 21 16
3,295 14,341 52,711 19,036 12,331 4,404 106,118 106,112
Not subject to ECL:
Trading financial assets – derivatives
4,969 17,334 174,110 71,556 16,732 47 284,748
284,748
Secured financing 945 34,355 40,218 34,592 3,685 2 113,797 113,797
Loans and advances - - - - 9 8 17 17
Trade and other receivables - 38 525 - 1,091 - 1,654 1,654
5,914 51,727 214,853 106,148 21,517 57 400,216 400,216
Unrecognised financial instruments subject to ECL:
Loan commitments
Stage 1 - 226 319 243 42 - 830 830
Stage 2 - - - - 72 - 72 72
Letters of credit - - 102 - - - 102 102
- 226 421 243 114 - 1,004 1,004
Unrecognised financial instruments not subject to ECL:
Unsettled securities purchased under agreements to resell
- 25,566 1,529 5,365 154 - 32,614
32,614
Loan commitments - 147 377 170 163 7 864 864
- 25,713 1,906 5,535 317 7 33,478 33,478
(1) For the unrated trade receivables, a lifetime ECL is always calculated without considering whether SICR has occurred.
14.4 Liquidity and funding risk
Refer to page 11 of the interim management report and to pages 24 to 25 of the Annual Report and Financial Statements for further detail on the Group’s liquidity and funding risk.
Maturity analysis
In the following maturity analysis of financial liabilities, derivative contracts and other financial liabilities held as part of the Group’s trading
activities are presented at fair value, consistent with how these financial liabilities are managed, and disclosed as on demand. Derivatives not held as part of the Group’s trading activities and financial liabilities designated at FVPL which contain an embedded derivative are disclosed according to their earliest contractual maturity; all such amounts are presented at their fair value, consistent with how these financial liabilities are managed. All other amounts represent undiscounted cash flows
DocuSign Envelope ID: 06B80A33-A7E0-49DA-BA03-5DCB7D499FC5
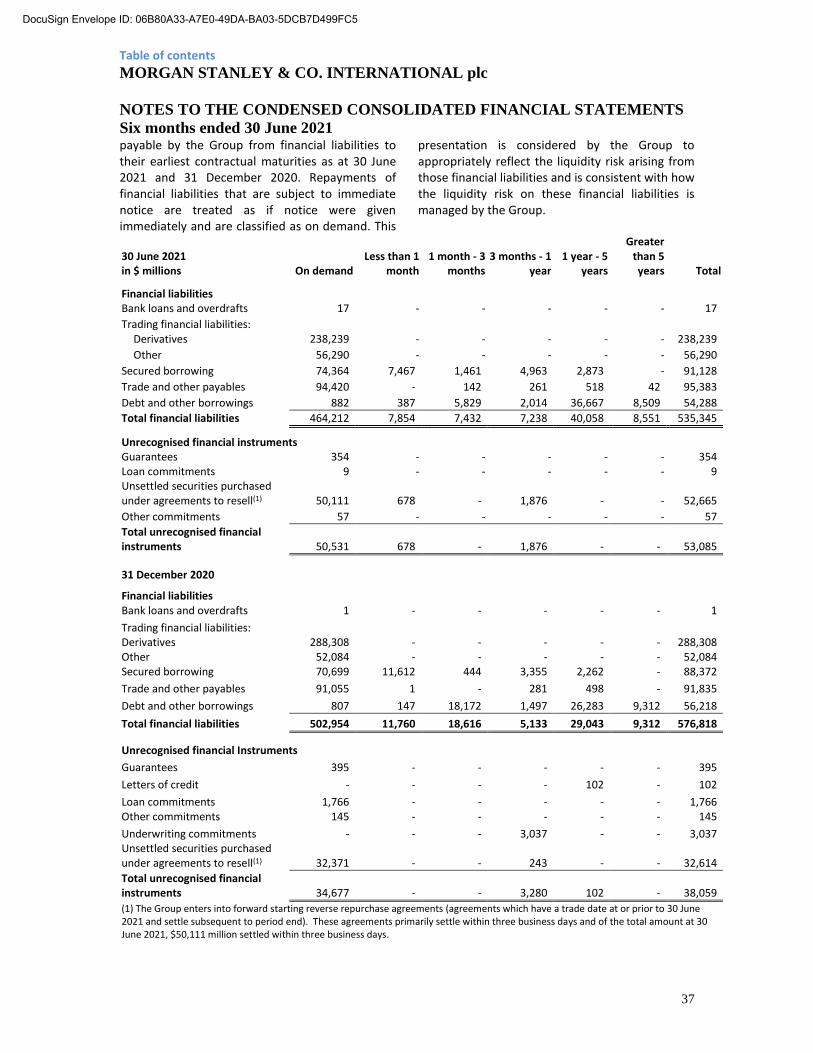
Table of contents
MORGAN STANLEY & CO. INTERNATIONAL plc
NOTES TO THE CONDENSED CONSOLIDATED FINANCIAL STATEMENTS
Six months ended 30 June 2021
37
payable by the Group from financial liabilities to their earliest contractual maturities as at 30 June 2021 and 31 December 2020. Repayments of financial liabilities that are subject to immediate notice are treated as if notice were given immediately and are classified as on demand. This
presentation is considered by the Group to appropriately reflect the liquidity risk arising from those financial liabilities and is consistent with how the liquidity risk on these financial liabilities is managed by the Group.
30 June 2021 in $ millions On demand
Less than 1 month
1 month - 3 months
3 months - 1 year
1 year - 5 years
Greater than 5 years Total
Financial liabilities Bank loans and overdrafts 17 - - - - - 17
Trading financial liabilities: Derivatives 238,239 - - - - - 238,239
Other 56,290 - - - - - 56,290
Secured borrowing 74,364 7,467 1,461 4,963 2,873 - 91,128
Trade and other payables 94,420 - 142 261 518 42 95,383
Debt and other borrowings 882 387 5,829 2,014 36,667 8,509 54,288
Total financial liabilities 464,212 7,854 7,432 7,238 40,058 8,551 535,345
Unrecognised financial instruments Guarantees 354 - - - - - 354 Loan commitments 9 - - - - - 9 Unsettled securities purchased under agreements to resell(1) 50,111 678 - 1,876 - - 52,665
Other commitments 57 - - - - - 57
Total unrecognised financial instruments 50,531 678 - 1,876 - - 53,085
31 December 2020
Financial liabilities Bank loans and overdrafts 1 - - - - - 1
Trading financial liabilities: Derivatives 288,308 - - - - - 288,308 Other 52,084 - - - - - 52,084 Secured borrowing 70,699 11,612 444 3,355 2,262 - 88,372
Trade and other payables 91,055 1 - 281 498 - 91,835
Debt and other borrowings 807 147 18,172 1,497 26,283 9,312 56,218
Total financial liabilities 502,954 11,760 18,616 5,133 29,043 9,312 576,818
Unrecognised financial Instruments
Guarantees 395 - - - - - 395
Letters of credit - - - - 102 - 102
Loan commitments 1,766 - - - - - 1,766 Other commitments 145 - - - - - 145
Underwriting commitments - - - 3,037 - - 3,037 Unsettled securities purchased under agreements to resell(1) 32,371 - - 243 - - 32,614
Total unrecognised financial instruments 34,677 - - 3,280 102 - 38,059
(1) The Group enters into forward starting reverse repurchase agreements (agreements which have a trade date at or prior to 30 June 2021 and settle subsequent to period end). These agreements primarily settle within three business days and of the total amount at 30 June 2021, $50,111 million settled within three business days.
DocuSign Envelope ID: 06B80A33-A7E0-49DA-BA03-5DCB7D499FC5

Table of contents
MORGAN STANLEY & CO. INTERNATIONAL plc
NOTES TO THE CONDENSED CONSOLIDATED FINANCIAL STATEMENTS
Six months ended 30 June 2021
38
15. FINANCIAL ASSETS AND FINANCIAL LIABILITIES SUBJECT TO OFFSETTING
In order to manage credit exposure arising from its business activities, the Group applies various credit management policies and procedures, see note 26 of the 2020 Annual Report and Financial Statements for further detail.
The following table presents information about the offsetting of financial instruments and related collateral amounts. The table does not include information about financial instruments that are subject only to a collateral agreement. The effect of master netting arrangements, collateral agreements and other credit enhancements, on the Group’s exposure to credit risk is disclosed in note 14.
Amounts offset(1)
Net amounts
Amounts not offset(3) Not subject to legally
enforceable master netting
agreement
Collateralised by:
Gross
amounts
Financial
instruments
Cash
collateral(2)
Net
exposure(4)
in $ millions
30 June 2021
Secured financing:
Cash collateral on securities borrowed 30,075 (9,848) 20,227 (19,872) - 355
165
Securities purchased under agreement to resell 122,957 (61,787) 61,170 (60,670) - 500
497
Trading financial assets - derivatives 307,852 (74,332) 233,520 (195,287) (21,860) 16,373 3,248
TOTAL ASSETS AS AT 30 JUNE 2021 460,884 (145,967) 314,917 (275,829) (21,860) 17,228 3,910
Secured borrowing:
Cash collateral on securities loaned 37,610 (9,848) 27,762 (27,762) - - --------- Securities sold under agreement to repurchase 97,141 (61,787) 35,354 (33,885) - 1,469
1,467
Trading financial liabilities - derivatives 315,773 (77,533) 238,240 (193,766) (28,935) 15,539 4,280
TOTAL LIABILITIES AS AT 30 JUNE 2021 450,524 (149,168) 301,356 (255,413) (28,935) 17,008 5,747
31 December 2020
Secured financing: Cash collateral on securities borrowed 37,837 (7,659) 30,178 (29,740) - 438
147
Securities purchased under agreement to resell 127,675 (57,028) 70,647 (70,574) - 73
73
Trading financial assets - derivatives 404,768 (120,020) 284,748 (239,647) (31,690) 13,411 2,411
TOTAL ASSETS AS AT 31 DECEMBER 2020 570,280 (184,707) 385,573 (333,961) (31,690) 13,922
2,631
Secured borrowing: Cash collateral on securities loaned 29,661 (7,659) 22,002 (21,991) - 11 - Securities sold under agreement to repurchase 95,612 (57,028) 38,584 (36,793) - 1,791
1,641
Trading financial liabilities - derivatives 408,785 (120,477) 288,308 (237,579) (36,585) 14,144 3,366
TOTAL LIABILITIES AS AT 31 DECEMBER 2020 534,058 (185,164) 348,894 (296,363) (36,585) 15,946
5,007
(1) Includes $3,487 million and $6,688 million (31 December 2020: $8,539 million and $8,997 million) of Trading financial assets – derivatives and Trading financial liabilities – derivatives, respectively, which have been offset against cash collateral received and cash collateral paid, respectively. (2) Cash collateral not offset is recognised within Trade and other receivables and Trade and other payables, respectively. (3) In addition to the balances disclosed in the table above, legally enforceable master netting agreements are in place for $1,309 million (31 December 2020: $1,492 million) of other secured financing and secured borrowing balances which are presented net in the condensed consolidated statement of financial position, and for $295 million (31 December 2020: $517 million) of certain trade and other receivables and trade and other payables which are not presented net. (4) Intercompany cross-product legally enforceable netting arrangements are in place which would allow for an additional $6,436 million (31 December 2020: $5,287 million) of the condensed consolidated statement of financial position, to be offset in the ordinary course of business and/ or in the event of default.
DocuSign Envelope ID: 06B80A33-A7E0-49DA-BA03-5DCB7D499FC5
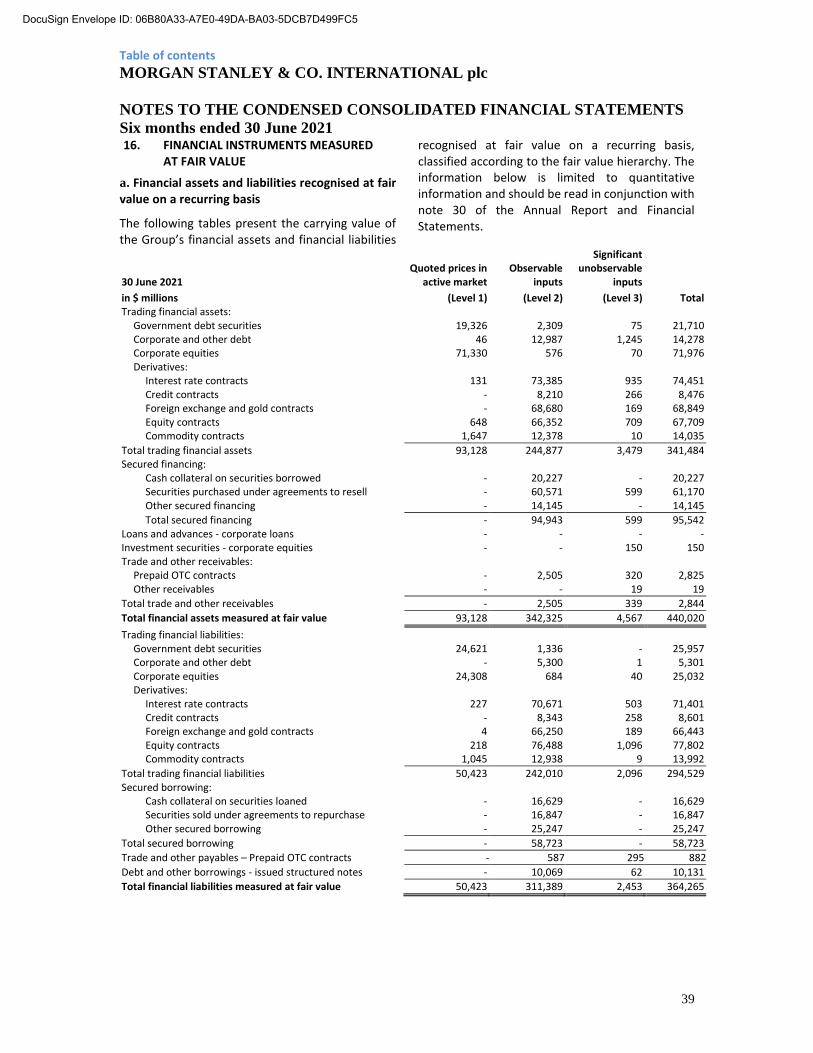
Table of contents
MORGAN STANLEY & CO. INTERNATIONAL plc
NOTES TO THE CONDENSED CONSOLIDATED FINANCIAL STATEMENTS
Six months ended 30 June 2021
39
16. FINANCIAL INSTRUMENTS MEASURED AT FAIR VALUE
a. Financial assets and liabilities recognised at fair value on a recurring basis
The following tables present the carrying value of the Group’s financial assets and financial liabilities
recognised at fair value on a recurring basis, classified according to the fair value hierarchy. The information below is limited to quantitative information and should be read in conjunction with note 30 of the Annual Report and Financial Statements.
30 June 2021 Quoted prices in
active market Observable
inputs
Significant unobservable
inputs
in $ millions (Level 1) (Level 2) (Level 3) Total Trading financial assets:
Government debt securities 19,326 2,309 75 21,710 Corporate and other debt 46 12,987 1,245 14,278 Corporate equities 71,330 576 70 71,976 Derivatives:
Interest rate contracts 131 73,385 935 74,451 Credit contracts - 8,210 266 8,476 Foreign exchange and gold contracts - 68,680 169 68,849 Equity contracts 648 66,352 709 67,709 Commodity contracts 1,647 12,378 10 14,035
Total trading financial assets 93,128 244,877 3,479 341,484 Secured financing:
Cash collateral on securities borrowed - 20,227 - 20,227 Securities purchased under agreements to resell - 60,571 599 61,170 Other secured financing - 14,145 - 14,145
Total secured financing - 94,943 599 95,542 Loans and advances - corporate loans - - - - Investment securities - corporate equities - - 150 150 Trade and other receivables:
Prepaid OTC contracts - 2,505 320 2,825 Other receivables - - 19 19
Total trade and other receivables - 2,505 339 2,844
Total financial assets measured at fair value 93,128 342,325 4,567 440,020
Trading financial liabilities: Government debt securities 24,621 1,336 - 25,957 Corporate and other debt - 5,300 1 5,301 Corporate equities 24,308 684 40 25,032 Derivatives:
Interest rate contracts 227 70,671 503 71,401 Credit contracts - 8,343 258 8,601 Foreign exchange and gold contracts 4 66,250 189 66,443 Equity contracts 218 76,488 1,096 77,802 Commodity contracts 1,045 12,938 9 13,992
Total trading financial liabilities 50,423 242,010 2,096 294,529 Secured borrowing:
Cash collateral on securities loaned - 16,629 - 16,629 Securities sold under agreements to repurchase - 16,847 - 16,847 Other secured borrowing - 25,247 - 25,247
Total secured borrowing - 58,723 - 58,723
Trade and other payables – Prepaid OTC contracts - 587 295 882
Debt and other borrowings - issued structured notes - 10,069 62 10,131
Total financial liabilities measured at fair value 50,423 311,389 2,453 364,265
DocuSign Envelope ID: 06B80A33-A7E0-49DA-BA03-5DCB7D499FC5

Table of contents
MORGAN STANLEY & CO. INTERNATIONAL plc
NOTES TO THE CONDENSED CONSOLIDATED FINANCIAL STATEMENTS
Six months ended 30 June 2021
40
31 December 2020 Quoted prices in
active market Observable inputs
Significant unobservable
inputs
in $ millions (Level 1) (Level 2) (Level 3) Total Trading financial assets:
Government debt securities 13,943 2,518 266 16,727 Corporate and other debt - 10,347 822 11,169 Corporate equities 61,511 846 8 62,365 Derivatives:
Interest rate contracts 61 99,151 1,111 100,323 Credit contracts - 7,026 488 7,514 Foreign exchange and gold contracts - 105,250 373 105,623 Equity contracts 554 62,612 1,519 64,685 Commodity contracts 212 6,383 8 6,603
Total trading financial assets 76,281 294,133 4,595 375,009 Secured financing:
Cash collateral on securities borrowed - 30,178 - 30,178
Securities purchased under agreements to resell - 69,869 778 70,647 Other secured financing - 12,972 - 12,972
Total secured financing - 113,019 778 113,797
Loans and advances - corporate loans - 10 7 17 Investment securities - corporate equities - - 151 151 Trade and other receivables:
Prepaid OTC contracts - 351 1,291 1,642 Other - - 12 12
Total trade and other receivables - 351 1,303 1,654
Total financial assets measured at fair value 76,281 407,513 6,834 490,628
Trading financial liabilities: Government debt securities 23,021 1,550 15 24,586 Corporate and other debt - 4,036 3 4,039 Corporate equities 23,246 212 1 23,459 Derivatives:
Interest rate contracts 126 94,878 471 95,475 Credit contracts - 6,940 368 7,308 Foreign exchange and gold contracts 4 103,806 186 103,996 Equity contracts 557 72,229 2,197 74,983 Commodity contracts 134 6,404 8 6,546
Total trading financial liabilities 47,088 290,055 3,249 340,392 Secured borrowing:
Cash collateral on securities loaned - 1 - 1
Securities sold under agreements to repurchase - 17,842 - 17,842 Other secured borrowing - 25,761 - 25,761
Total secured borrowing - 43,604 - 43,604 Trade and other payables:
Prepaid OTC contracts - 518 241 759 Unfunded loan commitments - 3 - 3
Total trade and other payables - 521 241 762 Debt and other borrowings - issued structured notes - 9,135 334 9,469
Total financial liabilities measured at fair value 47,088 343,315 3,824 394,227
DocuSign Envelope ID: 06B80A33-A7E0-49DA-BA03-5DCB7D499FC5

Table of contents
MORGAN STANLEY & CO. INTERNATIONAL plc
NOTES TO THE CONDENSED CONSOLIDATED FINANCIAL STATEMENTS
Six months ended 30 June 2021
41
b. Changes in Level 3 financial assets and liabilities recognised at fair value on a recurring basis
In the following tables:
• ‘Sales and Issuances’ amounts are reported together. For net derivatives, prepaid OTC liability contracts and issued structured notes these amounts represent issuances, whereas for other line items amounts represent sales.
• For financial assets and financial liabilities that were transferred into and out of Level 3 during the period, gains or (losses) are presented as if the assets or liabilities had been transferred into or out of Level 3 as at the beginning of the period.
• Net derivative contracts represent trading financial liabilities – derivative contracts net of trading financial assets – derivative contracts.
$in millions 30 June
2021 31 December
2020 TRADINGFINANCIAL ASSETS: Government debt securities
Beginning balance 266 3 Total gains/(losses) recognised in the condensed consolidated income statement(1)
- 1
Purchases 74 264
Sales & Issuances(2) (259) (2) Net transfers in and/or (out) of Level 3(3)
(6) -
Ending balance 75 266
Unrealised gains/(losses ) - 1
Corporate and other debt Beginning balance 822 481 Total gains/(losses) recognised in the condensed consolidated income statement(1)
(66) (15)
Purchases 794 457 Sales & Issuances(2) (333) (139) Net transfers in and/or (out) of Level 3(3)
28 38
Ending balance 1,245 822
Unrealised gains/(losses) 14 (4)
$in millions 30 June
2021 31 December
2020 Corporate equities Beginning balance 8 28 Total gains/(losses) recognised in the condensed consolidated income statement(1)
17 (9)
Purchases 62 1 Sales & Issuances(2) - (15) Net transfers in and/or (out) of Level 3(3)
(17) 3
Ending balance 70 8
Unrealised gains/(losses) 17 (2) Net derivative contracts(5) Beginning balance 269 (81) Total gains/(losses) recognised in the condensed consolidated income statement(1)
(132) 942
Purchases 255 768 Sales & Issuances(2) (567) (843) Settlements 67 (439) Net transfers in and/or (out) of Level 3(3)
142 (78)
Ending balance 34 269
Unrealised gains/(losses)(4) (395) 500
SECURED FINANCING
Securities purchased under agreements to resell
Beginning balance 778 257
Purchases 599 778
Sales & Issuances(2) (778) (257)
Ending balance 599 778
LOANS AND ADVANCES
Corporate loans
Beginning balance 7 9
Sales & Issuances(2) (7) -
Settlements - (2)
Net transfers in and/or (out) of Level 3(3) - -
Ending balance - 7
INVESTMENT SECURITIES
Corporate equities
Beginning balance 151 122
Total gains/(losses) recognised in the consolidated income statement(1)
1 12
Purchases 3 27
Sales & Issuances(2) (5) (10)
Ending balance 150 151
Unrealised gains/(losses)(4)
1 12
DocuSign Envelope ID: 06B80A33-A7E0-49DA-BA03-5DCB7D499FC5
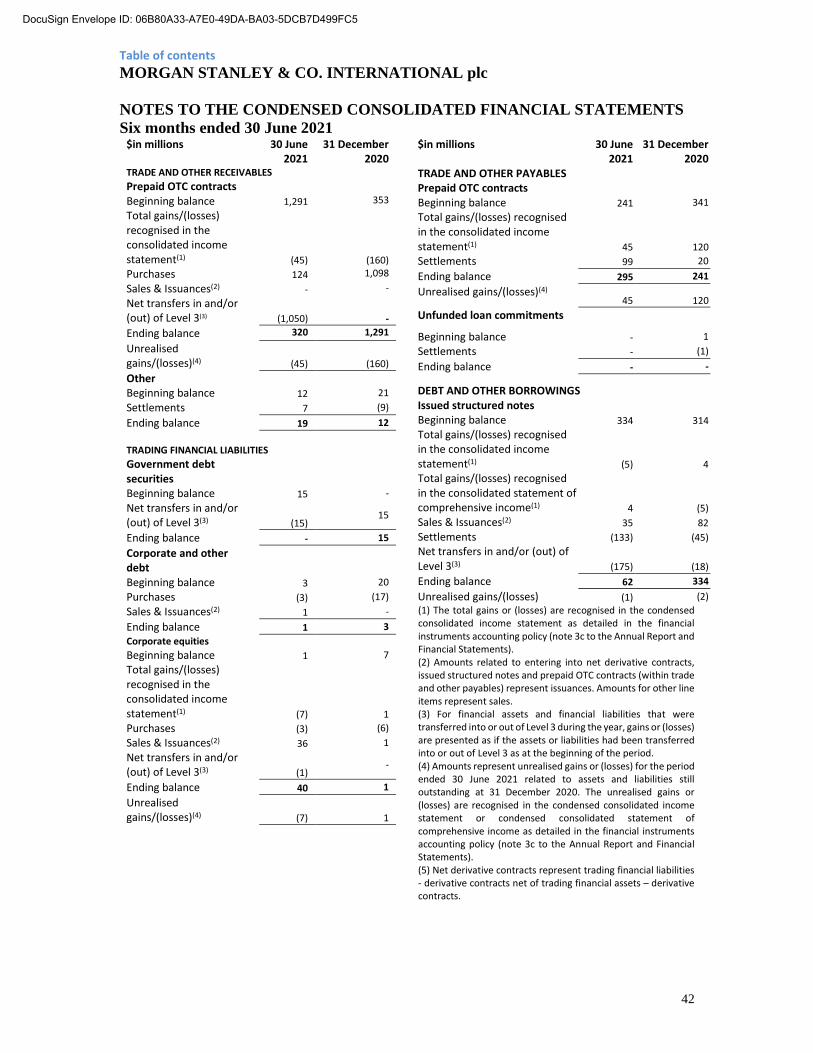
Table of contents
MORGAN STANLEY & CO. INTERNATIONAL plc
NOTES TO THE CONDENSED CONSOLIDATED FINANCIAL STATEMENTS
Six months ended 30 June 2021
42
$in millions 30 June 2021
31 December 2020
TRADE AND OTHER RECEIVABLES
Prepaid OTC contracts
Beginning balance 1,291 353
Total gains/(losses) recognised in the consolidated income statement(1) (45) (160)
Purchases 124 1,098
Sales & Issuances(2) - -
Net transfers in and/or (out) of Level 3(3) (1,050) -
Ending balance 320 1,291
Unrealised gains/(losses)(4) (45) (160)
Other
Beginning balance 12 21
Settlements 7 (9)
Ending balance 19 12
TRADING FINANCIAL LIABILITIES
Government debt securities
Beginning balance 15 -
Net transfers in and/or (out) of Level 3(3) (15)
15
Ending balance - 15
Corporate and other debt
Beginning balance 3 20
Purchases (3) (17)
Sales & Issuances(2) 1 -
Ending balance 1 3
Corporate equities
Beginning balance 1 7
Total gains/(losses) recognised in the consolidated income statement(1) (7) 1
Purchases (3) (6)
Sales & Issuances(2) 36 1
Net transfers in and/or (out) of Level 3(3) (1)
-
Ending balance 40 1
Unrealised gains/(losses)(4) (7) 1
$in millions 30 June 2021
31 December 2020
TRADE AND OTHER PAYABLES
Prepaid OTC contracts
Beginning balance 241 341
Total gains/(losses) recognised in the consolidated income statement(1) 45 120
Settlements 99 20
Ending balance 295 241
Unrealised gains/(losses)(4) 45 120
Unfunded loan commitments
Beginning balance - 1
Settlements - (1)
Ending balance - -
DEBT AND OTHER BORROWINGS
Issued structured notes
Beginning balance 334 314
Total gains/(losses) recognised in the consolidated income statement(1) (5) 4
Total gains/(losses) recognised in the consolidated statement of comprehensive income(1) 4 (5)
Sales & Issuances(2) 35 82
Settlements (133) (45)
Net transfers in and/or (out) of Level 3(3) (175) (18)
Ending balance 62 334
Unrealised gains/(losses) (1) (2)
(1) The total gains or (losses) are recognised in the condensed consolidated income statement as detailed in the financial instruments accounting policy (note 3c to the Annual Report and Financial Statements). (2) Amounts related to entering into net derivative contracts, issued structured notes and prepaid OTC contracts (within trade and other payables) represent issuances. Amounts for other line items represent sales. (3) For financial assets and financial liabilities that were transferred into or out of Level 3 during the year, gains or (losses) are presented as if the assets or liabilities had been transferred into or out of Level 3 as at the beginning of the period. (4) Amounts represent unrealised gains or (losses) for the period ended 30 June 2021 related to assets and liabilities still outstanding at 31 December 2020. The unrealised gains or (losses) are recognised in the condensed consolidated income statement or condensed consolidated statement of comprehensive income as detailed in the financial instruments accounting policy (note 3c to the Annual Report and Financial Statements). (5) Net derivative contracts represent trading financial liabilities - derivative contracts net of trading financial assets – derivative contracts.
DocuSign Envelope ID: 06B80A33-A7E0-49DA-BA03-5DCB7D499FC5
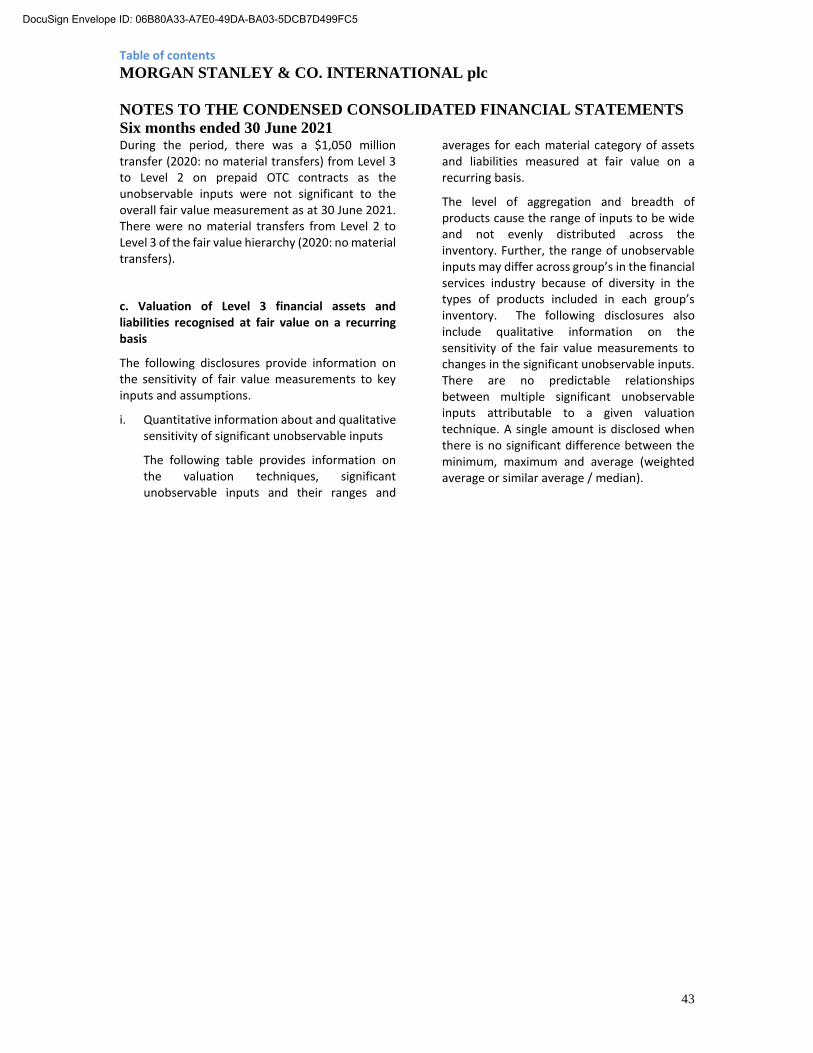
Table of contents
MORGAN STANLEY & CO. INTERNATIONAL plc
NOTES TO THE CONDENSED CONSOLIDATED FINANCIAL STATEMENTS
Six months ended 30 June 2021
43
During the period, there was a $1,050 million transfer (2020: no material transfers) from Level 3 to Level 2 on prepaid OTC contracts as the unobservable inputs were not significant to the overall fair value measurement as at 30 June 2021. There were no material transfers from Level 2 to Level 3 of the fair value hierarchy (2020: no material transfers).
c. Valuation of Level 3 financial assets and liabilities recognised at fair value on a recurring basis
The following disclosures provide information on the sensitivity of fair value measurements to key inputs and assumptions.
i. Quantitative information about and qualitative sensitivity of significant unobservable inputs
The following table provides information on the valuation techniques, significant unobservable inputs and their ranges and
averages for each material category of assets and liabilities measured at fair value on a recurring basis.
The level of aggregation and breadth of products cause the range of inputs to be wide and not evenly distributed across the inventory. Further, the range of unobservable inputs may differ across group’s in the financial services industry because of diversity in the types of products included in each group’s inventory. The following disclosures also include qualitative information on the sensitivity of the fair value measurements to changes in the significant unobservable inputs. There are no predictable relationships between multiple significant unobservable inputs attributable to a given valuation technique. A single amount is disclosed when there is no significant difference between the minimum, maximum and average (weighted average or similar average / median).
DocuSign Envelope ID: 06B80A33-A7E0-49DA-BA03-5DCB7D499FC5

Table of contents
MORGAN STANLEY & CO. INTERNATIONAL plc
NOTES TO THE CONDENSED CONSOLIDATED FINANCIAL STATEMENTS
Six months ended 30 June 2021
44
30 June 2021 Fair
value
$millions
Predominant valuation techniques/
Significant unobservable inputs Range (Average)(1)
ASSETS
Trading financial assets:
- Corporate and other debt:
- Mortgage- and asset backed
securities
300 Comparable pricing
Comparable bond price
41 to 100 pts (70 pts)
- Corporate bonds 704 Comparable pricing
Comparable bond price
91.4 to 119 pts (97.69 pts)
- Loans and lending commitments 241 Comparable pricing
Comparable loan pricing
25.5 to 100.06 pts (94.73 pts)
- Corporate equities 70 Comparable pricing
Comparable equity price
100% (100%)
- Government debt securities 75 Comparable pricing
Comparable bond price
132 to 153 pts (143 pts)
- Net derivatives contracts:(2)
- Interest rate 432 Option model
Inflation volatility
Interest rate-foreign
exchange correlation
Interest rate curve
correlation
Inflation curve
Interest rate volatility
skew
Foreign exchange volatility
skew
Interest rate – inflation
correlation
Deal Execution probability
Bond volatility
25% to 66% (45%/43%)
53% to 57% (55%/55%)
61% to 98% (61%/87%)
1.4% to 1.5% (1.5%/1.5%)
25% to 98% (61%/59%)
-0.4% to 0.0% (-0.1%/-0.1%)
-80% to -5% (-42%/-48%)
90% to 90% (90%/90%)
4% to 25% (10%/6%)
- Credit 8 Credit default swap model
Credit spread
Comparable bond price
Funding spread
2 to 360 bps (75.01 bps)
8 to 96 pts (45 pts)
42.05 to 90.91bps (66.48bps)
- Foreign exchange and gold3) (20) Option model
Interest rate-foreign
exchange correlation
Interest rate volatility
skew
Deal execution probability
Foreign exchange volatility
skew
Currency basis
30% to 57% (46%/46%)
25% to 98% (61%/59%)
95% to 95% (95%/95%)
0.3% to 0.4% (0.4%/0.4%)
6% to 7% (6%/6%)
- Equity(3) (387) Option model
At the money volatility
Volatility skew
Equity-equity correlation
Equity-foreign exchange correlation
13% to 67% (20%)
-4% to 0% (-1%)
35% to 98% (73%)
-72% to -5% (-37%)
DocuSign Envelope ID: 06B80A33-A7E0-49DA-BA03-5DCB7D499FC5
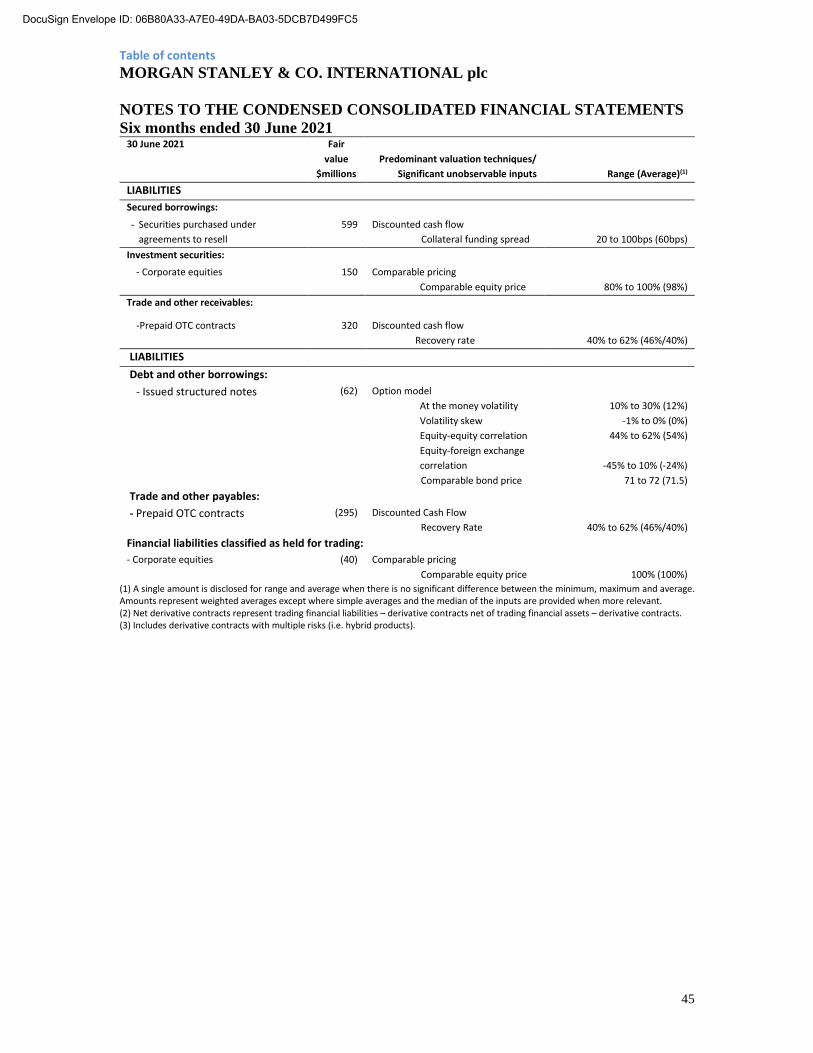
Table of contents
MORGAN STANLEY & CO. INTERNATIONAL plc
NOTES TO THE CONDENSED CONSOLIDATED FINANCIAL STATEMENTS
Six months ended 30 June 2021
45
30 June 2021 Fair
value
$millions
Predominant valuation techniques/
Significant unobservable inputs Range (Average)(1)
LIABILITIES
Secured borrowings:
- Securities purchased under
agreements to resell
599 Discounted cash flow
Collateral funding spread
20 to 100bps (60bps)
Investment securities:
- Corporate equities 150 Comparable pricing
Comparable equity price
80% to 100% (98%)
Trade and other receivables:
-Prepaid OTC contracts
320 Discounted cash flow
Recovery rate
40% to 62% (46%/40%)
LIABILITIES
Debt and other borrowings:
- Issued structured notes (62) Option model
At the money volatility
Volatility skew
Equity-equity correlation
Equity-foreign exchange
correlation
Comparable bond price
10% to 30% (12%)
-1% to 0% (0%)
44% to 62% (54%)
-45% to 10% (-24%)
71 to 72 (71.5)
Trade and other payables:
- Prepaid OTC contracts (295) Discounted Cash Flow
Recovery Rate
40% to 62% (46%/40%)
Financial liabilities classified as held for trading:
- Corporate equities (40) Comparable pricing
Comparable equity price
100% (100%)
(1) A single amount is disclosed for range and average when there is no significant difference between the minimum, maximum and average. Amounts represent weighted averages except where simple averages and the median of the inputs are provided when more relevant. (2) Net derivative contracts represent trading financial liabilities – derivative contracts net of trading financial assets – derivative contracts. (3) Includes derivative contracts with multiple risks (i.e. hybrid products).
DocuSign Envelope ID: 06B80A33-A7E0-49DA-BA03-5DCB7D499FC5

Table of contents
MORGAN STANLEY & CO. INTERNATIONAL plc
NOTES TO THE CONDENSED CONSOLIDATED FINANCIAL STATEMENTS
Six months ended 30 June 2021
46
31 December 2020 Fair value
$millions
Predominant valuation techniques/
Significant unobservable inputs
Range
(Average)(1)
ASSETS
Trading financial assets:
- Government debt securities 266 Comparable pricing
Comparable bond pricing
91.3 to 106.18 pts (105.54 pts)
- Corporate and other debt:
- Mortgage and asset-backed
securities
184 Comparable pricing
Comparable bond price
32 to 100 pts (73 pts)
- Corporate bonds 487 Comparable pricing
Comparable bond price
59 to 133 pts (107 pts)
- Loans and lending
commitments
151 Comparable pricing
Comparable loan price
25.5 to 101.97 pts (94.67 pts)
- Net derivatives contracts:(2)
- Interest rate 640 Option Model
Inflation Volatility
Interest rate - Foreign exchange
correlation
Interest rate curve correlation
Inflation curve
Interest rate volatility skew
Foreign exchange volatility skew
Interest rate – inflation correlation
Bond volatility
25% to 66% (45%/43%)
55% to 59% (56%/56%)
46% to 91% (70%/72%)
0.94% to 0.95% (0.95%/0.95%)
0% to 349% (62%/59%)
0.0% to 0.4% (0%/0%)
-80% to -0.5% (-42%/-48%)
6% to 24% (13%/13%)
- Credit 120 Credit default swap model
Credit spread
Comparable bond price
Funding spread
Funding spread
Comparable bond price
Credit spread
4 to 360 bps (73.07)
8 to 85 pts (48 pts)
64.84 to 118.03 bps (83.57 bps)
64.84 to 118.03 bps (89.34 bps)
8 to 85 pts (48 pts)
4 to 360 bps (68.47 bps)
- Foreign exchange and gold(3) 187 Option model
Interest rate foreign exchange
correlation
Interest rate volatility skew
Deal execution probability
Foreign exchange volatility skew
Currency basis
18% to 59% (44%/44%)
0% to 349% (62%/59%)
50% to 95% (83%/93%)
-21.7% to 28.3% (3.2%/0.9%)
6% to 8% (7.2%/7.5%)
- Equity (678) Option model
Equity volatility
Equity volatility skew
Equity equity correlation
Equity FX correlation
15% to 68% (26%)
-3% to 0% (-1%)
37% to 95% (70%)
-80% to 60% (-25%)
- Corporate equities 28 Comparable pricing
Comparable equity price
100% (100%)
Investment securities:
- Corporate equities 151 Comparable pricing
Comparable equity price
80% to 100% (99%)
Trade and other receivables
- Prepaid OTC contracts 1,291 Option model
Equity volatility
21% (21%)
DocuSign Envelope ID: 06B80A33-A7E0-49DA-BA03-5DCB7D499FC5
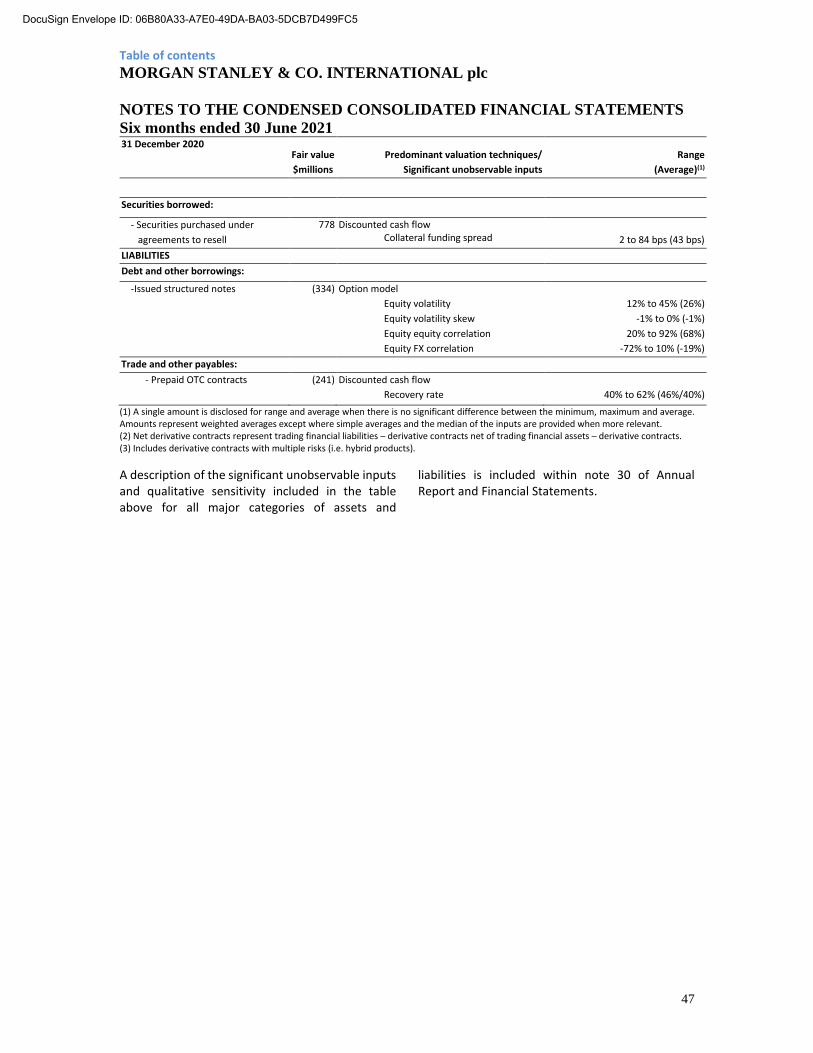
Table of contents
MORGAN STANLEY & CO. INTERNATIONAL plc
NOTES TO THE CONDENSED CONSOLIDATED FINANCIAL STATEMENTS
Six months ended 30 June 2021
47
31 December 2020 Fair value
$millions
Predominant valuation techniques/
Significant unobservable inputs
Range
(Average)(1)
Securities borrowed:
- Securities purchased under
agreements to resell
778 Discounted cash flow Collateral funding spread
2 to 84 bps (43 bps)
LIABILITIES
Debt and other borrowings:
-Issued structured notes (334) Option model
Equity volatility
Equity volatility skew
Equity equity correlation
Equity FX correlation
12% to 45% (26%)
-1% to 0% (-1%)
20% to 92% (68%)
-72% to 10% (-19%)
Trade and other payables:
- Prepaid OTC contracts (241) Discounted cash flow
Recovery rate
40% to 62% (46%/40%)
(1) A single amount is disclosed for range and average when there is no significant difference between the minimum, maximum and average. Amounts represent weighted averages except where simple averages and the median of the inputs are provided when more relevant. (2) Net derivative contracts represent trading financial liabilities – derivative contracts net of trading financial assets – derivative contracts. (3) Includes derivative contracts with multiple risks (i.e. hybrid products).
A description of the significant unobservable inputs and qualitative sensitivity included in the table above for all major categories of assets and
liabilities is included within note 30 of Annual Report and Financial Statements.
DocuSign Envelope ID: 06B80A33-A7E0-49DA-BA03-5DCB7D499FC5

Table of contents
MORGAN STANLEY & CO. INTERNATIONAL plc
NOTES TO THE CONDENSED CONSOLIDATED FINANCIAL STATEMENTS
Six months ended 30 June 2021
48
ii. Sensitivity of fair values to changing significant assumptions to reasonably possible alternatives The following tables present the potential impact of both favourable and unfavourable
changes, both of which would be reflected in the condensed consolidated income statement. The information below is limited to quantitative information and should be read in conjunction with note 30 of the Annual Report and Financial Statements.
June 30, 2021 December 31, 2020
in $ millions Favourable
changes Unfavourable
changes Favourable
changes Unfavourable
changes Trading financial assets:
Government debt securities - - 17 (7)
Corporate and other debt 21 (16) 16 (14)
Corporate equities 5 (19) - -
Net derivative contracts(1)(2) 52 (34) 76 (32)
Investment securities:
Corporate equities 19 (12) 17 (23)
Trading financial liabilities:
Corporate equities 12 (3) - -
Debt and other borrowings:
Issued structured notes 2 (6) 3 (2)
111 (90) 129 (78)
(1) Net derivative contracts represent financial liabilities classified as held for trading – derivative contracts net of financial assets classified as held for trading – derivative contracts. (2) CVA and FVA are included in the fair value, but excluded from the effect of reasonably possible alternative assumptions in the table above. CVA is deemed to be a level 3 input when the underlying counterparty credit curve is unobservable. FVA is deemed to be a Level 3 input in its entirety given the lack of observability of funding spreads in the principal market.
d. Financial instruments valued using unobservable market data
The amounts not recognised in the condensed consolidated income statement relating to the difference between the fair value at initial recognition (the transaction price) and the amounts determined at initial recognition using valuation techniques are as follows:
in $millions 30 June
2021 31 December
2020 At 1 January 409 342
New transactions 87 167 Amounts recognised in the condensed consolidated income statement during the period/year (72) (100)
At 30 June 2021 / 31 December 2020 424 409
The balance above predominately relates to derivatives.
e. Assets and liabilities measured at fair value on a non-recurring basis
Non-recurring fair value measurements of assets and liabilities are those which are required or permitted in the condensed consolidated statement of financial position in particular circumstances. There were no assets or liabilities measured at fair value on a non-recurring basis during the current or prior period.
DocuSign Envelope ID: 06B80A33-A7E0-49DA-BA03-5DCB7D499FC5

Table of contents
MORGAN STANLEY & CO. INTERNATIONAL plc
NOTES TO THE CONDENSED CONSOLIDATED FINANCIAL STATEMENTS
Six months ended 30 June 2021
49
17. ASSETS AND LIABILITIES NOT MEASURED AT FAIR VALUE
For all financial instruments not carried at fair value, the carrying value is a reasonable approximation of fair value as at 30 June 2021 owing to their short-term nature, with the exception of $5,000 million of subordinated loan liabilities for which the Level 2 fair value is $5,425 million (31 December 2020: $5,000 million of subordinated loan liabilities for which the Level 2 fair value was $5,414 million). The fair value of subordinated loans has been determined based on the assumption that all subordinated loans are held to maturity.
18. RELATED PARTY DISCLOSURES
The management and execution of business strategies on a global basis results in many Morgan Stanley transactions impacting a number of Morgan Stanley Group entities. The Morgan Stanley Group operates a number of intra-group policies to ensure arm’s length pricing.
The Group receives and incurs management charges to and from other Morgan Stanley Group undertakings for infrastructure services, including the provision of staff and office facilities. For the six month period ended 30 June 2021 ‘management charges from other Morgan Stanley Group undertakings relating to staff costs’ were $327 million (30 June 2020: $260 million) and ‘management charges from other Morgan Stanley Group undertakings relating to other services’ were $745 million (30 June 2020: $700 million). See note 6 for further details.
19. EVENTS AFTER THE REPORTING PERIOD On 11 August 2021, the Company issued $1,400 million of subordinated debt to Morgan Stanley Investments (UK), its immediate parent undertaking.
DocuSign Envelope ID: 06B80A33-A7E0-49DA-BA03-5DCB7D499FC5