
REGIONS IN THE KNOWLEDGE ECONOMY: HOW THE CHANGING … · ‘economic geography’, ‘regional...
20
Regions in the Knowledge Economy, Basak Demires Ozkul . Regional Studies Association European Conference May 2012 p. 1 REGIONS IN THE KNOWLEDGE ECONOMY: HOW THE CHANGING PATTERN OF JOURNEY-TO-WORK FLOWS IS CREATING A MORE FRAGMENTED REGIONAL IDENTITY IN ENGLAND AND WALES INTRODUCTION This paper examines the effects of socio-economic change on the evolution of functional regions in England and Wales between 1981 and 2001 through the rapid shift towards the knowledge economy by looking at how it has affected the clustering of industries and the interaction of labour markets. This research is one of the first to shed light on this important historical juncture via a dataset that has only been recently released. This economic transition has had a strong impact on the ground as the knowledge intensive industries have created interlinked global networks of management, production, distribution and sales functions; connected within each global company and with other businesses within similar networks (Castells 1996; Castells and Hall 1994). National boundaries have become more permeable as economies have begun to blend into the global economy (Coyle 1997). This has enabled a smoother and swifter global movement of information and capital. Local and regional settlement structures have become support elements in the enhancement and conservation of ‘global cities’. In certain global cities links with the global economy provided more gains than links to national networks. As a result national businesses became supportive functions to the global city creating a new hierarchy of settlements. Cities within the global network have expanded beyond their traditional geographic boundaries and have either merged or connected more closely with their surrounding settlements. The demise of heavy industries and the collapse of the traditional industrial settlement networks have had a negative effect on traditional industrial towns in the UK (ODPM 2006; Wong 2006). The sturdy settlement structure dictated by large factories, their supporting functions and their large workforce housing has been broken down. Many northern towns in England, the economic core of the country during the industrial period; have failed to regain their economic footing after the factories have closed down. Only a few major cities have been able to expand some activities in the post-industrial sectors; however these have been limited in scope. As a result the traditional industrial towns have not been able to fully integrate into the newly forming economic networks that were created in the post- industrial economy. Starting in the mid 1960’s the dismantling of the industrial economy affected settlements in profound ways. Economic changes led to a different settlement identity and pattern (Goddard and Champion 1983) leaving large patches of industrial landscape functionless. Housing location preferences have swayed as demand for space increased. There was a significant shift in population in England and Wales with population shifting from the centre of metropolitan cities to smaller settlements and the countryside leading to an overall dispersal of the population (Champion 1994; Champion et al. 1998; Cherry 1988). This has been strengthened by the creation of larger housing markets thanks to improvements in transportation networks (Barker 2004). Large increases of income realized by the upper income groups have put more pressure on the development of low density housing in the urban periphery (Cheshire and Sheppard 1998). Suburban development continued extending to more distant locations thanks to improving transportation, the advance in telecommunications and the adaptation of flexible working patterns. These forces have had an impact on the commute to work. Commuting lengths in the UK have increased by a third between 1985 and 1999 from 9.8 km to 13.0 km (Department of Energy and
Transcript of REGIONS IN THE KNOWLEDGE ECONOMY: HOW THE CHANGING … · ‘economic geography’, ‘regional...

Regions in the Knowledge Economy, Basak Demires Ozkul . Regional Studies Association European Conference May 2012
p. 1
REGIONS IN THE KNOWLEDGE ECONOMY: HOW THE CHANGING PATTERN OF JOURNEY-TO-WORK FLOWS IS CREATING A MORE FRAGMENTED REGIONAL IDENTITY IN ENGLAND AND WALES INTRODUCTION
This paper examines the effects of socio-economic change on the evolution of functional regions in England and Wales between 1981 and 2001 through the rapid shift towards the knowledge economy by looking at how it has affected the clustering of industries and the interaction of labour markets. This research is one of the first to shed light on this important historical juncture via a dataset that has only been recently released. This economic transition has had a strong impact on the ground as the knowledge intensive industries have created interlinked global networks of management, production, distribution and sales functions; connected within each global company and with other businesses within similar networks (Castells 1996; Castells and Hall 1994). National boundaries have become more permeable as economies have begun to blend into the global economy (Coyle 1997). This has enabled a smoother and swifter global movement of information and capital. Local and regional settlement structures have become support elements in the enhancement and conservation of ‘global cities’. In certain global cities links with the global economy provided more gains than links to national networks. As a result national businesses became supportive functions to the global city creating a new hierarchy of settlements. Cities within the global network have expanded beyond their traditional geographic boundaries and have either merged or connected more closely with their surrounding settlements. The demise of heavy industries and the collapse of the traditional industrial settlement networks have had a negative effect on traditional industrial towns in the UK (ODPM 2006; Wong 2006). The sturdy settlement structure dictated by large factories, their supporting functions and their large workforce housing has been broken down. Many northern towns in England, the economic core of the country during the industrial period; have failed to regain their economic footing after the factories have closed down. Only a few major cities have been able to expand some activities in the post-industrial sectors; however these have been limited in scope. As a result the traditional industrial towns have not been able to fully integrate into the newly forming economic networks that were created in the post- industrial economy. Starting in the mid 1960’s the dismantling of the industrial economy affected settlements in profound ways. Economic changes led to a different settlement identity and pattern (Goddard and Champion 1983) leaving large patches of industrial landscape functionless. Housing location preferences have swayed as demand for space increased. There was a significant shift in population in England and Wales with population shifting from the centre of metropolitan cities to smaller settlements and the countryside leading to an overall dispersal of the population (Champion 1994; Champion et al. 1998; Cherry 1988). This has been strengthened by the creation of larger housing markets thanks to improvements in transportation networks (Barker 2004). Large increases of income realized by the upper income groups have put more pressure on the development of low density housing in the urban periphery (Cheshire and Sheppard 1998). Suburban development continued extending to more distant locations thanks to improving transportation, the advance in telecommunications and the adaptation of flexible working patterns. These forces have had an impact on the commute to work. Commuting lengths in the UK have increased by a third between 1985 and 1999 from 9.8 km to 13.0 km (Department of Energy and

Regions in the Knowledge Economy, Basak Demires Ozkul . Regional Studies Association European Conference May 2012
p. 2
Transport 2000). And analysis of the censuses 1991 and 2001 showed that between the two years the commuting distances increased to include more of the rural areas. (Nielsen and Hovgesen 2008) The aim of my research is to provide an analytical approach for determining the shifts in employment and labour location and their interaction through this time period. The basis of the analysis will be to look at changing geographical patterns for work and home locations across the census years and analyse the daily journey to work patterns. THE REPRESENTATION OF SETTLEMENT STRUCTURE AND EMPLOYMENT AND LABOUR PATTERNS Agglomeration Preferences for Manufacturing and Services The investigation of spatial patterns of economic activity has been a long-term and large scope endeavour. It’s been at the juncture of economic and geographic research. This has created a broad theoretical base that has been under the influence of shifts in both research fields and has covered a large spectrum of paradigms. Economic theories have been loosely collected under ‘economic geography’, ‘regional economics’ and ‘urban economics’. The relationship between location and employment has been the cornerstone of both economics and geography tying the two fields together. Approaching employment location from a spatial perspective, geographers have looked at the spatial distribution of economic activities. They have incorporated various methods ranging from large-scale mathematical models that included economic theories to in depth case studies. Quantitative methods have mainly relied on large-scale investigations based on mathematical or statistical models to determine patterns for economic location, whereas qualitative methods have sought to determine the causes of economic location preferences through in-depth case studies. A key distinction amongst geography and economic geography has been the preference for quantitative versus qualitative research with economists following a quantitative route while geography has adopted both approaches. Economic geography started out with the investigation of industrial production during the industrial period. These first studies were highly theoretical mathematical models that were seeking to find universal location patterns across space. This first generation of models focusing on industrial location were defined by Alfred Weber (Weber and Friedrich 1929) who formulated his theory on the location of industry by including transport and labour costs and forces of agglomeration and deglomeration. Weber’s ideas were later elaborated by Losch. This framework was based on to include a static geographic framework to incorporate a uniformly distributed production geography (Losch and Stolper 1954). Losch’s framework was very similar to the retail model developed by Walter Christaller (Christaller and Baskin 1966). Both models incorporated settlements and market areas around them. Losch’s theory has been reworked into a functional model through spatial analysis techniques by Haggett (Haggett 1965), Greenhut (Greenhut 1967) and D.M. Smith. (Smith 1971) Walter Isard contributed to industrial location theory through his pioneering work in regional science. Isard’s efforts in establishing the field of regional science brought together a large group of researchers from diverging backgrounds who have expanded his original theoretical underpinnings and has evolved into a multidisciplinary field that continues through to today (Isard 1956). Although these early models had defining traits that distinguished each from the rest, they all relied on static and defined locations of production. The push towards defining the economic forces that were leading to agglomeration led to the generation of economic models of the New Economic Geography which has begun to pick up pace after the 1990’s spearheaded by Paul Krugman’s work who provided an economic model to

Regions in the Knowledge Economy, Basak Demires Ozkul . Regional Studies Association European Conference May 2012
p. 3
explain agglomeration. (Krugman 1991) Research in the area of spatial externalities advanced thanks to more readily available data at more detailed geographic scales, the spread and adaptation of spatial analysis software and advances in computation technology (Goodchild and Janelle 2004). Empirical research demonstrating the effect of location in economic competitiveness (Porter 1990) was also a motivation for a deeper understanding of the dynamics of industrial location and clustering. This line of work has mainly remained theoretical with limited empirical scope (Fujita and Thisse 2002). The rigid settlement structure formed by large production complexes in the industrial economy favoured large-scale analytical models that were developed within the field of economic geography and regional science. However the transition into the post-industrial economy brought with it a wider understanding of economic functions, which brought to the forefront the idea of regional variation in economy. Mapping labour onto housing The spatial distribution of housing within settlements has been a key research topic in economics as it is a means of determining the price of housing and is instrumental in determining the spatial distribution of labour. Due to its dual nature our choice of home location has provided a link between two very broad economic fields: housing and labour. Within the housing and labour research areas there has been a complementary role between theoretical representation and empirical research.
The pioneer in laying out the groundwork for the first models of residential location was Johann Heinrich von Thunen. He proposed a comprehensive settlement framework that included location choices for different types of agricultural products. Thunen conceived his economic model in an isolated plain, which he used as a canvas to determine the optimum location for the different agricultural produce of his region in relation to a central market town. The main theme in deciding the best location was the balancing of the requirement for being close to the market versus the cost of land. This information was translated into simple concentric rings where the different product groups were located William Alonso (Alonso 1964) used this basic mathematical model to determine housing location around a city centre He developed an equilibrium for individuals and the housing market that maximized a continuous utility function through location choices, which were represented by distance from the city centre. A more general model developed by Richard Muth makes household commuting costs and the distance to work a function of household income. (Muth 1969) The model developed by Alonso has become to be widely known as the Alonso-Muth-Mills model subsequent to the contributions of Edwin Mills. (Mills 1972) This model has become the cornerstone of economic research on settlements both in field of economic geography and urban economics. The spatial representation of the Alsonso-Muth-Mills model was further elaborated by researchers on ‘wasteful commuting’ (Hamilton 1989; Hamilton and Roell 1982; Small and Song 1992; White 1988b). The research in this area is quite extensive (Frost et al. 1998) and focuses on how the actual spatial configuration of residences and workplaces define the urban form of a particular settlement. This approach suggests defining a minimum average commute derived through a linear optimisation method that minimises the travel costs between origins and destinations. However there seems to be little agreement as to how best represent settlement structure; are jobs located at the centre of the city? (Alonso 1964; Mills 1972; Straszheim 1987)? Uniformly distributed across space (Hamilton and Roell 1982)? Are they clustered in smaller nodes around the city (Griffith 1981; White 1988a)? Or are they located in zones (White 1988a)? Within this framework it is not surprising that evidence has suggested that only a mixture of models can represent a particular city. This research has had to face the challenge of the modifiable areal unit problem. The unit of analysis plays a role in how employment can be

Regions in the Knowledge Economy, Basak Demires Ozkul . Regional Studies Association European Conference May 2012
p. 4
characterised in a city, with bigger areal units, the city becomes more monocentric and with smaller units more decentralised, a typical example of the modifiable areal unit problem (Horner and Murray 2002; Small and Song 1992). Creating these units of analysis becomes even more problematic when we consider different occupation classifications that lead to varying commuting patterns (Giuliano and Small 1993). Empirical researchers have focused on the difficulties of relaying the complex attributes of settlements in their critique of the ‘bid-rent’ models (Brueckner 1987; Straszheim 1987; Yinger 1992) in the Alonso tradition. The bid-rent models, although theoretically sound were seen to include “strong and unrealistic assumptions in order to generate clear-cut predictions about investment and spatial patterns” thus limiting their empirical relevance. (Whitehead 1999) Although theoretically powerful concepts, bid-rent models have not been fully adapted to empirical research. Empirical research on settlement form has also been developed in the area of urban labour markets which concentrated on the location of labour. The location of labour has constituted an important element of the housing distribution patterns. One of the drivers in this field has been the growing inequalities between different segments of the labour markets where ‘employment and income disparities have intensified markedly, and localised problems of labour market disadvantage and associated social exclusion have become much more entrenched’ (Martin and Morrison 2003a). This inequality was compounded by the housing market dynamics. It has been portrayed as a major factor in distinguishing the privileged from the under-privileged (Cheshire et al. 2000; Meen et al.) Labour markets were represented as ‘labour sheds’ or ‘labour catchments’ on the demand side, areas where workers are recruited from (Vance) and ‘employment fields’ or job search areas for workers on the supply side (Smart 1974). As labour sheds and employment fields concur they become more ‘self- contained’, the identification of such areas lies behind a majority of research in determining functional urban regions and travel to work areas. Identifying labour market areas has not been straightforward task as labour markets were prone to overlap and were very difficult to separate from each other especially when gender and occupational differences were taken into account. Furthermore labour markets were ‘highly endogenous in nature, being actively and continuously constructed and reconstructed through the very processes that take place within and between them’ which makes their conceptualisation, theorisation and analysis quite complex (Martin and Morrison 2003b). Within the field of economics the diverging experiences of various labour groups in the post-industrial economy have led some researchers to question a unified labour market. This view was most pronounced in political economy research that looked at the ‘dual labour market’s that concentrated on the consistency of poverty in inner urban areas and defined a separate social class which they named the ‘underclass’. (Jencks and Peterson 1991; Lash and Urry 1994; Saunders 1990; Westergaard 1992; Wilson 1987). Researchers have pointed out that the arguments laid out by this area of research has been contested since a relatively high degree of mobility into and away from the ‘underclass’ positions has been established (Gallie 1988; Morris 1994). The starting point for occupation based labour market research was the proposal that various occupational groups had differing labour market areas. (Goldner 1955). Commuting has been a crucial element of labour market research, both in forming the backbone of the most prevalent market area definitions but also as means for providing a means of market adjust-ment between local labour markets alongside migration. Migration provides a more flexible adjustment mechanism but requires investment whereas commuting provides ‘a more rapid adjustment at an intra-regional scale’ (Gordon 2003) .However the importance of geographical diversification on

Regions in the Knowledge Economy, Basak Demires Ozkul . Regional Studies Association European Conference May 2012
p. 5
the establishment of wages and the spatial dynamics of labour markets has not been fully picked up by the economic research community (Combes et al. 2008). METHODOLOGY Creating Consistent Objects of Analysis
The unit of analysis is the statistical ward. Since the research covers both home and work location each ward will have two sets of identity: the first one as a location for employment, the second one as home. This will allow geographic changes of each function to be analysed independently and allow for overlaps in functions. To define better the transformation in employment, ward clusters constituting employment centres will be analysed over time to observe changes in their composition. Wards will also form building blocks for the varying labour market areas allowing for a flexible representation of market boundaries. The UK census is an important resource in analysing historic demographic trends. The census methodology changes every year so it is important to relay some key issues that we can encounter when we begin to compare the 1981 and 2001 census. The main issues stem from the use of 10 percent samples for the 1981 census which was a necessity at the time due to the technology available. One of the major problems in census research covering the 2001 census has been undercounting. The Office for National Statistics (ONS) filled in these missing items using information that was on the same form and on other similar forms. ONS corrected the biases that would have occurred by a redesigned post-enumeration survey, called the Census Coverage Survey (CCS), which was much larger in scope to ones that were conducted earlier. By matching the CCS results with the 2001 census results the ONS identified areas that were missed by either the Census, the CCS or both and adjusted the totals (Office for National Statistics 2004; Simpson 2003). Although error margins were calculated for the 2001 census (Office for National Statistics 2004) research looking in more detail at the results of the census was still critical of the final estimates (Simpson and Dorling 1994). The effects of these changes on the comparability of the different censuses have not been quantified. As the aim of the research is to analyse trends over a long period of time over large areas, it relies mainly on averages and normalised results so it is implicitly assumed that the effects of the errors would be negligible. The data used is held by the Centre for Interaction Data Estimation and Research (CIDER). For 2001 each matrix contains 8800 rows and 8800 columns creating a table that contains 77,440,000 records. One of the key challenges of the UK Census is the determination of census boundaries during census year. Until 2001 these boundaries have matched administrative boundaries that were determined by the political system. Electoral ward boundaries have been regularly adjusted in response to population change to ensure that each local authority has similar councillor/elector ratios (Office for National Statistics 2000a) and the UK local government structure was substantially revised in the late 1990s with the creation of new unitary authorities in some areas. (Wilson and Rees 1999) This has resulted in more administrative boundary changes in the UK than the rest of Europe (Office for National Statistics 2000a) creating uneven and differing boundaries through the census years. The analysis is conducted using 2001 census statistical wards. The Standard Table wards are those that were created for the release of the 1981 and 2001 censuses. The standard wards form the backbone of the data that is collected for this research because they are the smallest geography that offer continuity throughout the census years. Fortunately it is possible today to obtain data for 1981 with consistent 2001 ward boundaries thanks to the Special Workplace Statistics (SWS) dataset that is now held by CIDER. There is no workplace interaction dataset available split by industry for 2001 since this information was

Regions in the Knowledge Economy, Basak Demires Ozkul . Regional Studies Association European Conference May 2012
p. 6
suppressed by the Office of National Statistic. It was necessary to obtain ward level information from the Annual Business Inquiry (ABI) that is also run by the Office of National Statistics (http://www.statis- tics.gov.uk/abi/background_info.asp accessed 12/03/2010). Creating a time series with consistent attributes is the second important challenge of this research. There have been major changes in definition of occupational class between 1981 and 2001. These changes are difficult to overcome because there has been a major shift in the determination and classification methodology for occupations. The employment variables will be split into industries over the 1981-2001 period. It is not possible to achieve time consistent occupation categories since there have been major changes in both the definition and composition of categories (http:// www.camsis.stir.ac.uk/occunits/distribution.html#UK). Table 1 depicts the changes between divisions of industry for the 1980 and 2001/03 data. It is possible to match the two datasets if the data that is analysed has been divided into the subdivisions in brackets. However for the commuting dataset the divisions for 1980 only contain the main divisions. Thus it was necessary in the analysis to pick representative divisions for each census year. These are highlighted in red and blue. Table 1 Industrial Sector Divisions 2001/2003 Sections 1980 Divisions (Brackets denote part of a division) A Agriculture, Hunting and Forestry 0 (Agriculture and Forestry) B Fishing 0 (Fishing)
1 (Extraction of fuels) C Mining And Quarrying
2 (Extraction of minerals and ores) 1 (Fuel processing and production) 2 (Manufacture of chemicals and man-‐made fibres) 3 Metal goods, engineering and vehicles industries D Manufacturing
4 Other manufacturing industries
E Electricity, Gas and Water Supply 1 (Production and distribution of electricity, gas; Water supply)
F Construction 5 Construction
G Wholesale and Retail Trade; Repair of MotorVehicles, Motorcycles and Personal and Household Goods
6 (Wholesale and retail distribution; Commission agents; Repairs)
H Hotels and Restaurants 6 (Hotels and catering) 7 Transport and communication
I Transport, Storage and Communication 9 (Tourist offices; Radio and TV transmission)
J Financial Intermediation 8 (Banking, finance and insurance) 8 (Business services; Dealing in real estate)
K Real Estate, Renting and Business Activities 9 (Research & development; Other services)
L Public Administration and Defence;Compulsory Social Security
9 (Public administration, national defence and compulsory social security)
M Education 9 (Education)
N Health and Social Work 9 (Health and veterinary services; Other general services to the public)
O Other Community, Social and Personal Service Activities 9 (Sanitary, recreational and personal services)
P Private Households Employing Domestic Staff and Undifferentiated Production Activities of Households for Own Use
9 (Domestic services)
Q Extra – Territorial Organisations and Bodies 9 (Diplomatic representation, international organisations, allied armed forces)
The occupational classifications have changed from 1981 to 2001 This has created difficulties in associating the groups with each other. In the analysis they have been left within their groups for each census year. Occupation is most often determined by reference to a person’s main job at the reference time, but for persons not currently employed may be determined by reference to the

Regions in the Knowledge Economy, Basak Demires Ozkul . Regional Studies Association European Conference May 2012
p. 7
most recent, or most recent main job. Industry refers to the economic sector to which the work done in a particular job contributes. It is usually defined by reference to the main product made or service performed at the workplace at or from which a job is carried on (Office for National Statistics 2000b). Most occupational groups include jobs located in many different industrial sector, but there are some cases of occupations, which in practice are associated almost entirely with one particular industry. Knowledge workers, who are considered the cornerstone of the post-industrial economy, are not identified under a separate heading. The OECD/Eurostat classification system defines knowledge-based industries as high to medium technology manufacturing, high technology services, business services, financial services, health and education services plus cultural and recreational services and international transport services (http://epp.eurostat.ec.europa.eu/statistics_explained/index.php/Labour_market_sector_specialisation_at_regional_level). Knowledge workers are defined by proxy measures as either the top three standard statistical occupational codes (‘Managers’, ‘Professionals’ and ‘Associate Professionals and Technical’) or workers with graduate or higher level education. (Brinkley 2008). Table 2 2001 Occupational Groups % 1 Managers and Senior Officials 15% 2 Professional occupations 11% 3 Associate professional and technical occupations 14% 4 Administrative and secretarial occupations 13% 5 Skilled trades occupations 12% 6 Personal service occupations 7% 7 Sales and customer service occupations 8% 8 Process, plant and machine operatives 8% 9 Elementary occupations 12%
Table 3 1981 Occupational Groups % 1 Professional and related supporting management 4% 2 Professional and related in education, welfare, and health 14% Literary,artistic, and sports Professional, engineering, technology, and similar fields 3 Managerial Clerical and related 28% 4 Selling 6% 5 Security and protective service 13% Catering,cleaning,hair-dressing, and personal service 6 Farming, fishing and related 1% 7 Materials processing: making and repairing 23% Processing, making, repairing (metal and electrical) Painting, assembling, product inspecting, packaging 8 Construction,mining and related 2% 9 Transport operating, materials moving and storing 6% 10 Miscellaneous 2%
Regions in the Knowledge Economy, Basak Demires Ozkul . Regional Studies Association European Conference May 2012
p. 8
Employment Clustering Distance Cluster analysis techniques have been widely used in determining employment locations and evaluating their function. Since clustering measures point-patterns spatially random distribution patterns have been used to measure the extent of clustering and dispersion. Some of the more common means of measurement have been the K Function (Besag 1977; Ripley 1977), the D Function (Diggle and Chetwynd 1991) and the G Function (Getis and Ord 1992). Another strand of research has looked at these distributions with reference to a determined distribution pattern such as the Coefficient of localisation (COL) (Duncan 1957; Duncan and Duncan 1955) and γ .These methods are used within current research to measure spatial externalities in business location within the field of New Economic Geography (Sweeney and Feser 2004). The main aspect of clustering I was interested in was distance; by determining if certain industries were clustering at different distances from each other I could interpret the overall distribution of employment throughout England and Wales and determine if there were any significant changes in employment scale and clustering. The method that I have sought to use for this calculation was the calculation of the K-function, also referred to as Ripley’s K function (Ripley 1977), which determines at what distance point locations tend to cluster. The K-function is used as a spatial analytical tool in forestry and ecology (Dixon 2002). K refers to the circular bands that are established around every point with distances at specific intervals (Mitchell 2005). It is a standard analysis in GIS packages. The standard formula for the function is:
where K(d) is the value of the K statistic at distance d. The K-function offers an opportunity to clearly measure clustering in large areas to determine if there is a propensity for the points to cluster at a range of distances. Although the K-function offers a good measurement for point patterns, it cannot be directly applied to the industry distribution datasets for the 1981 and 2001 censuses. The values that are in the dataset correspond to the number of workers rather than firms. Thus the original function needs to measure weights at fixed locations and interpret clustering by the weights rather than point distributions. It would also have to be applicable to different classifications since I am seeking to find the difference in clustering between different industries. The dataset used requires that the K-function be re-interpreted to match the data. The measure that will be used to replace the K-function was developed by Eric Marcon and Florence Puech and is named the M-function (Marcon and Puech 2010). The M function is a cumulative function that counts neighbouring points up to a chosen distance for a specific sector. The formula is as follows:
where Ti /N is the average of the ratio of target neighbours (Ti) normalised by all the neighbours in the area ( Ni ) around the point i at distance r. This value is compared to the global ratio of the target sector (T/N). If Ti /N is greater than T/N we can conclude that more plants of the target type are observed within a distance r around the reference points type than on average, within a circle of radius r drawn anywhere. For this formula points can be weighted so rather than plants the number of employees can be used. (Marcon and Puech 2010)
Regions in the Knowledge Economy, Basak Demires Ozkul . Regional Studies Association European Conference May 2012
p. 9
Table 4 Distribution of Industry 2003
D Manufacturing J Financial Intermediation
K Real Estate, Rentng and Business Activities
England and Wales 12.83% 19.95% Employment Wards 11.04% 23.51% Birmingham 18.26% 17.59% London 6.48% 30.05% Manchester 15.39% 19.07%
Table 4 Distribution of Industry 2003
D Manufacturing J Financial Intermediation
K Real Estate, Rentng and Business Activities
England and Wales 12.83% 19.95% Employment Wards 11.04% 23.51% Birmingham 18.26% 17.59% London 6.48% 30.05% Manchester 15.39% 19.07%
By assigning the values to points at ward centroids it is possible to calculate the concentration of specific sectors within a particular distance r to that ward when compared to the whole area A. The total sample area from which the data is drawn was chosen as 70 km. There is one cautionary note that needs to be considered in the application of this formula for England and Wales. The wards that were analysed had an employment density that was above the 75 percentile for employment density for all wards for 2001 which was 9.71 employees/hectare. Due to the size of the sample, it was not possible to represent the full extent of wards for this analysis. Distance Profiles by Occupation To analyse if similar processes are influencing employment fields, as they are influencing labour sheds, it is possible to break down the average commutes by occupation groups. The focus of the occupational analysis is the knowledge worker, who is portrayed in current socio-economic literature as a major player in creating local and regional networks. This part of the analysis assesses the function of the knowledge worker as an agent for local and regional connectivity through an original visualisation of its commuting profile which is then compared to other occupational groups for 1981 and 2001 Multivariate analyses have been used in labour market modelling to analyse the class differences in the formation of labour markets. Studies in this area have included the investigation on how skill levels affect the choice of housing and employment location through job search behaviour (Simpson 1980; Simpson and Veen 1992) and to determine the relationship between wage rates and commuting (Madden 1985). Recent studies have also shown that highly skilled workers who require a large pool of jobs have preferred to locate in areas that offer them the widest and highest level of career development, with a reluctance to move away from these areas. (Institute for Political and Economic Governance et al. 2008). Commuting distance will provide a deeper look into the relationship between the shifts in the economy and the functional setup of settlements giving clues as to how settlements are changing. The discussion on functional change will revolve around commuting between home and work.
Regions in the Knowledge Economy, Basak Demires Ozkul . Regional Studies Association European Conference May 2012
p. 10
The spatial identity of commuting and its change over the twenty-year period are captured in the probability density graph for average commuting distance by destination ward for 1981 and 2001. The area that sends out commuters to a destination ward will be named as its ‘labour shed’, the areas that are connected to the origin of the commute are called ‘employment field’. The probability density graph for average commuting indicates how people are spread around the cores of settlements. It is a summary of all the different commuting journeys that are occurring across the 8800 wards that constitute England and Wales from the most rural to the inner wards of metropolitan cities. It indicates preference, opportunity and value: our preference as to where we would like to live, the opportunities that we seek for employment and the value we place on these two decisions. In terms of economic theory, the analysis of wards as origins shifts the focus from housing towards labour theory. In housing theory the objective is to find an equilibrium point with respect to a fixed place of work. In the study of employment fields in labour theory this is reversed as the objective becomes finding an optimum location for work within the framework of a fixed location for housing. By incorporating these two theories together it is possible to model the full forces at work within a changing settlement system. The average commuting distance by ward of origin is considered the equilibrium distance for commuters living within that ward. This is plotted along with the average distance by destination ward. The simultaneous plotting of average distance by ward of origin and destination will determine the relationship amongst these two values. By combining the information on employment fields and labour sheds I can bring together two different theoretical models under one visual representation. RESULTS
Diverging footprints for industries
The main analysis consisted of 40 km centred on Birmingham, London and Manchester and for employment wards throughout England and Wales. The graphs that are generated show at what distances the data points are clustered and to what degree, thus a graph with a value of 1.5 at 20 km indicates that at 20km wide radius circles the density for that particular data point is 1.5 times the average for the whole area. As the calculations are based on total employment in the areas they do not compare the level of activities within each square so any differences between levels of economic activity would not appear in the graphs. This signifies that although there appear to be higher density clusters in Manchester versus London, these cannot be compared with each other since each of the clustering functions has a different set of densities to draw from and are relative to the area that they are in. Thus London may have larger densities overall and its clusters may appear lower in density than Manchester which has lower densities on average. The population functions are provided as a reference point to indicate the different settlement patterns found throughout the country and to determine if they have any effect on the distribution of industries.
Regions in the Knowledge Economy, Basak Demires Ozkul . Regional Studies Association European Conference May 2012
p. 11
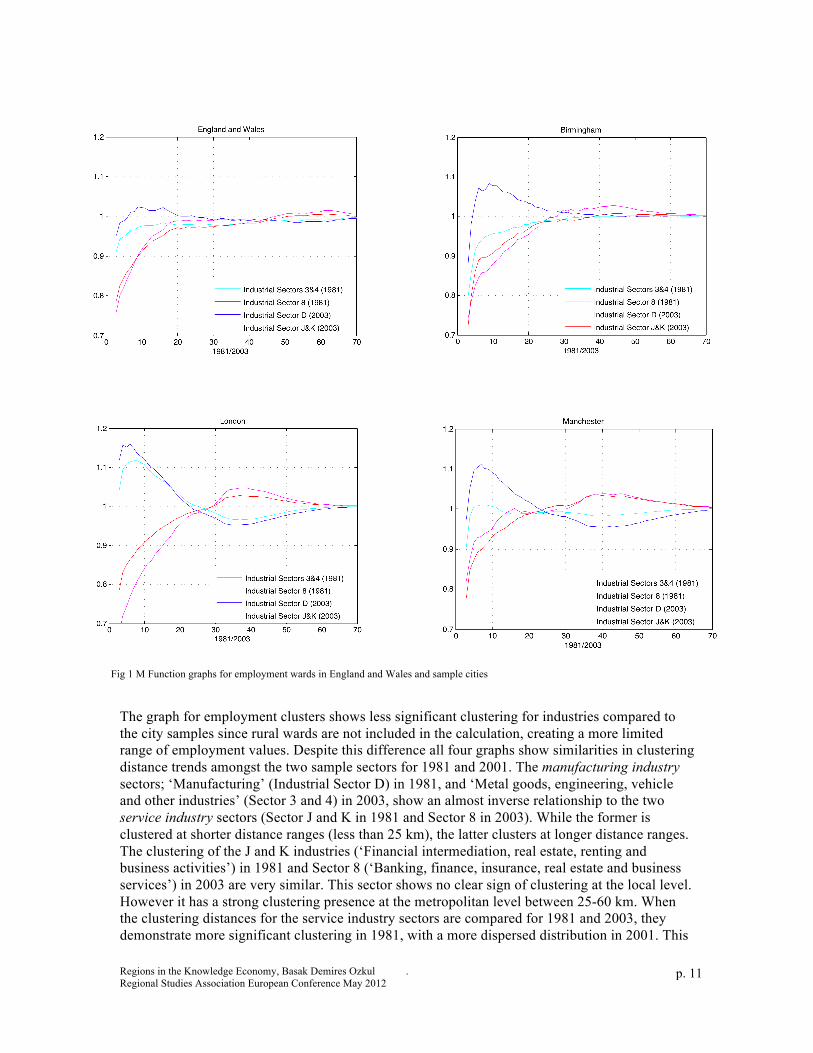
The graph for employment clusters shows less significant clustering for industries compared to the city samples since rural wards are not included in the calculation, creating a more limited range of employment values. Despite this difference all four graphs show similarities in clustering distance trends amongst the two sample sectors for 1981 and 2001. The manufacturing industry sectors; ‘Manufacturing’ (Industrial Sector D) in 1981, and ‘Metal goods, engineering, vehicle and other industries’ (Sector 3 and 4) in 2003, show an almost inverse relationship to the two service industry sectors (Sector J and K in 1981 and Sector 8 in 2003). While the former is clustered at shorter distance ranges (less than 25 km), the latter clusters at longer distance ranges. The clustering of the J and K industries (‘Financial intermediation, real estate, renting and business activities’) in 1981 and Sector 8 (‘Banking, finance, insurance, real estate and business services’) in 2003 are very similar. This sector shows no clear sign of clustering at the local level. However it has a strong clustering presence at the metropolitan level between 25-60 km. When the clustering distances for the service industry sectors are compared for 1981 and 2003, they demonstrate more significant clustering in 1981, with a more dispersed distribution in 2001. This
Fig 1 M Function graphs for employment wards in England and Wales and sample cities

Regions in the Knowledge Economy, Basak Demires Ozkul . Regional Studies Association European Conference May 2012
p. 12
trend is reversed for the manufacturing industry sectors, where clusters at the local level are more pronounced. The four samples of employment location for 1981 and 2003 demonstrate that there is a major divide among manufacturing and service industry sectors for both years, with manufacturing employment strongly concentrated in smaller clusters. Whereas the service industry is more distributed across space with much larger clusters, which become apparent at the metropolitan scale. This division is more pronounced in 2003, with manufacturing employment concentrating more in local clusters and service employment becoming more distributed across space. Varying access to work by occupation
Fig 2 Probability Density Graphs for Average Commuting Distance
Fig 3 Probability Density Graphs for Occupations 1981 and 2001
Regions in the Knowledge Economy, Basak Demires Ozkul . Regional Studies Association European Conference May 2012
p. 13
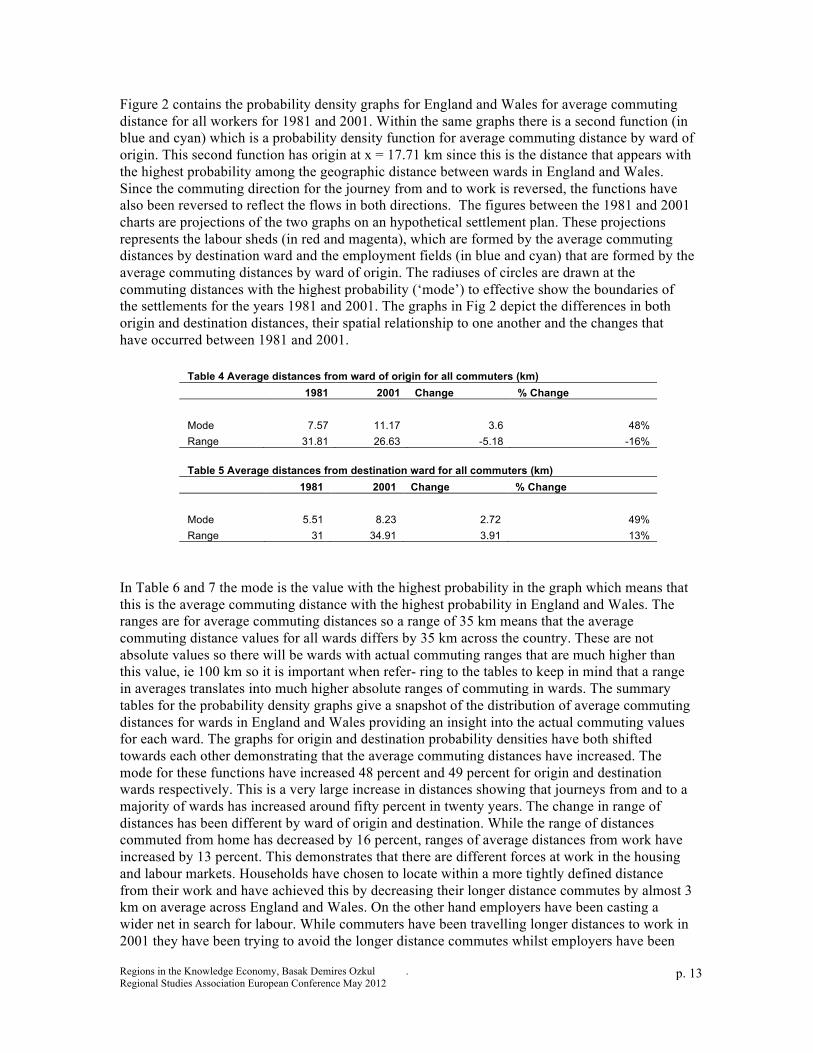
Figure 2 contains the probability density graphs for England and Wales for average commuting distance for all workers for 1981 and 2001. Within the same graphs there is a second function (in blue and cyan) which is a probability density function for average commuting distance by ward of origin. This second function has origin at x = 17.71 km since this is the distance that appears with the highest probability among the geographic distance between wards in England and Wales. Since the commuting direction for the journey from and to work is reversed, the functions have also been reversed to reflect the flows in both directions. The figures between the 1981 and 2001 charts are projections of the two graphs on an hypothetical settlement plan. These projections represents the labour sheds (in red and magenta), which are formed by the average commuting distances by destination ward and the employment fields (in blue and cyan) that are formed by the average commuting distances by ward of origin. The radiuses of circles are drawn at the commuting distances with the highest probability (‘mode’) to effective show the boundaries of the settlements for the years 1981 and 2001. The graphs in Fig 2 depict the differences in both origin and destination distances, their spatial relationship to one another and the changes that have occurred between 1981 and 2001.
Table 4 Average distances from ward of origin for all commuters (km) 1981 2001 Change % Change Mode 7.57 11.17 3.6 48% Range 31.81 26.63 -5.18 -16%
Table 5 Average distances from destination ward for all commuters (km) 1981 2001 Change % Change Mode 5.51 8.23 2.72 49% Range 31 34.91 3.91 13%
In Table 6 and 7 the mode is the value with the highest probability in the graph which means that this is the average commuting distance with the highest probability in England and Wales. The ranges are for average commuting distances so a range of 35 km means that the average commuting distance values for all wards differs by 35 km across the country. These are not absolute values so there will be wards with actual commuting ranges that are much higher than this value, ie 100 km so it is important when refer- ring to the tables to keep in mind that a range in averages translates into much higher absolute ranges of commuting in wards. The summary tables for the probability density graphs give a snapshot of the distribution of average commuting distances for wards in England and Wales providing an insight into the actual commuting values for each ward. The graphs for origin and destination probability densities have both shifted towards each other demonstrating that the average commuting distances have increased. The mode for these functions have increased 48 percent and 49 percent for origin and destination wards respectively. This is a very large increase in distances showing that journeys from and to a majority of wards has increased around fifty percent in twenty years. The change in range of distances has been different by ward of origin and destination. While the range of distances commuted from home has decreased by 16 percent, ranges of average distances from work have increased by 13 percent. This demonstrates that there are different forces at work in the housing and labour markets. Households have chosen to locate within a more tightly defined distance from their work and have achieved this by decreasing their longer distance commutes by almost 3 km on average across England and Wales. On the other hand employers have been casting a wider net in search for labour. While commuters have been travelling longer distances to work in 2001 they have been trying to avoid the longer distance commutes whilst employers have been

Regions in the Knowledge Economy, Basak Demires Ozkul . Regional Studies Association European Conference May 2012
p. 14
locating in areas with higher labour catchment areas Functional regions for all commuters is a composite of different functional regions divided by a number of labour variables. Commuting ranges and averages have been shown to differ amongst gender, income, occupation and socio-economic group thus it is beneficial for the analysis to disaggregate the regions into different subregions. By looking at the disaggregate regions it is possible to identify different dynamics at work
Table 6 1981 average commuting distance distribution by ward of origin (km)
median min max range difference from
total range
Management 13.18 0.42 45.01 44.59 23.33 Professionals 10.75 0.59 28.8 28.21 6.95 Clerical 8.4 0.65 21.18 20.53 -0.73 Selling 8.01 0.37 31.28 30.91 9.65 Processing 7.73 0.92 18.45 17.53 -3.73 Construction 7.35 0.42 12.09 11.67 -9.59 Transport 6.87 0.25 18.27 18.02 -3.24 Personal Services 5.57 0.47 16.19 15.72 -5.54 Miscellaneous 4.69 0.45 13.76 13.31 -7.95 Farming 4.41 0.34 12.47 12.13 -9.13 Average range: 21.26
Table 7 2001 average commuting distance distribution by ward of origin (km)
median min max range difference from
total range
Managers 17.18 0.9 34.86 33.96 11.59 Professionals 15.79 1.57 31.7 30.13 7.76 Associate professionals 15.27 1.9 31.56 29.66 7.29 Plant operatives 10.44 0.58 22.46 21.88 -0.49 Administrators 10.07 1.77 22.02 20.25 -2.12 Skilled trades 9.27 1.34 17.92 16.58 -5.79 Sales 8.16 0.89 18.78 17.89 -4.48 Personal services 7.68 1.16 17.82 16.66 -5.71 Elementary 7.99 1.84 16.13 14.29 -8.08 Average range: 22.37
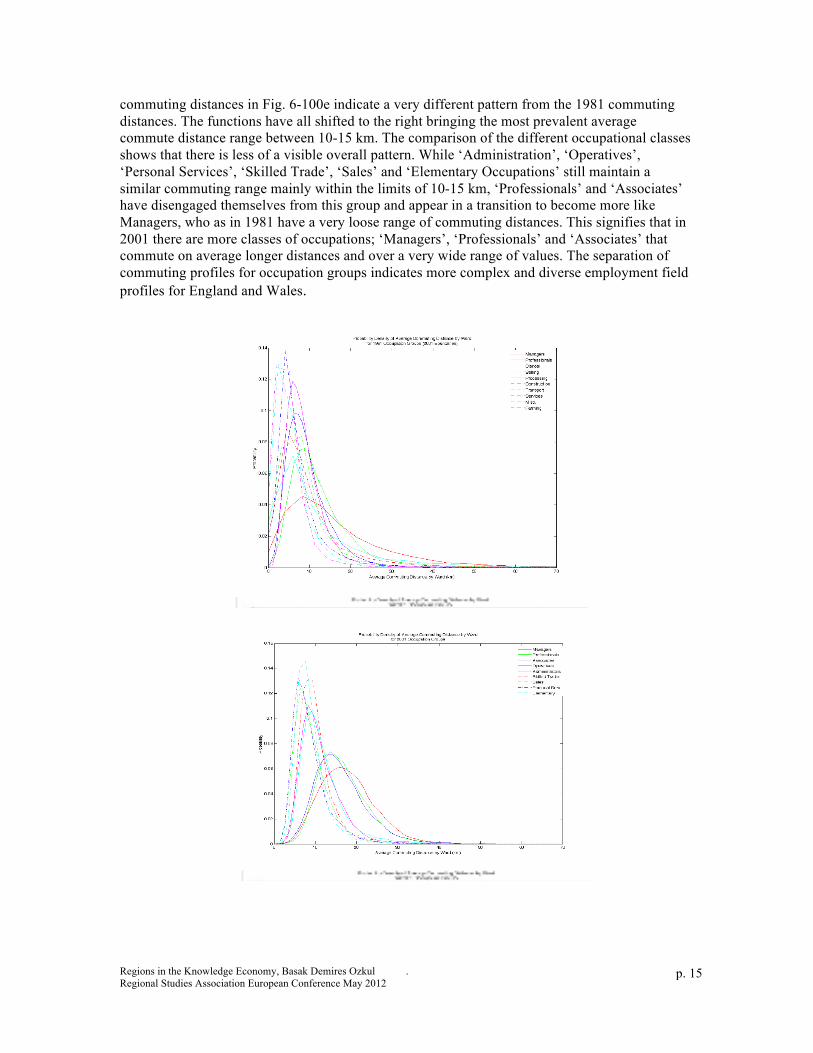
The probability density functions in Fig.3 show how these distributions translate into spatial forms. The distributions in the 1981 graph appear very similar to each other. The distributions for the different occupation groups are mainly concentrated within the 0-10 km distance range. The distribution starts to lose its rigid form after this value and begins to spread for all functions. This signifies that most of the occupations commute within the 0-10 km range. However when the average commute exceeds 0-10 km these occupations begin to commute within a wider range of distances. All the distributions tend to disperse as we go up the hierarchy however this dispersion is quite small and not very defined. The biggest exception to this pattern are Managers which appear to not have a distinct range of commute and tend to commute on average longer distances than all the other classes. Except for the ‘Managers’ all occupations in 1981 commute within a fixed distance range, which is around 0-10 km, with longer distance, commutes appearing to be more widely spread for wards of origin. The probability densities for the 2001 average
Regions in the Knowledge Economy, Basak Demires Ozkul . Regional Studies Association European Conference May 2012
p. 15
commuting distances in Fig. 6-100e indicate a very different pattern from the 1981 commuting distances. The functions have all shifted to the right bringing the most prevalent average commute distance range between 10-15 km. The comparison of the different occupational classes shows that there is less of a visible overall pattern. While ‘Administration’, ‘Operatives’, ‘Personal Services’, ‘Skilled Trade’, ‘Sales’ and ‘Elementary Occupations’ still maintain a similar commuting range mainly within the limits of 10-15 km, ‘Professionals’ and ‘Associates’ have disengaged themselves from this group and appear in a transition to become more like Managers, who as in 1981 have a very loose range of commuting distances. This signifies that in 2001 there are more classes of occupations; ‘Managers’, ‘Professionals’ and ‘Associates’ that commute on average longer distances and over a very wide range of values. The separation of commuting profiles for occupation groups indicates more complex and diverse employment field profiles for England and Wales.

Regions in the Knowledge Economy, Basak Demires Ozkul . Regional Studies Association European Conference May 2012
p. 16
The disparate functional region There is a large volume of theoretical and empirical work on the economy, the social environment and the physical construct of cities. These works provide very important clues to the differing settlement structures in England and Wales during the industrial and post-industrial periods. However a large portion of these works are confined to their own respective fields which limits the cross-fertilisation across disciplines. Spatial analysis provides an opportunity to bring these theoretical ideas together under a single representation. These spatial representations also contribute to a nascent interest in incorporating space within social science research. The combination of the two analyses on production and worker location variables yield insight on supply and demand factors in labour flow change across city regions. The two parts of the analysis provide an overview of how recent socio-economic changes have affected the nature and size of economic clusters and the intensity of flows within and between their functional regions. Although manufacturing and lower ranking jobs have maintained the same “bounded” spatial footprint in 2001/03 compared to 1981, the more distributed pattern of service industries is coupled with a versatile occupational group creating a flexible functional region. Whereas knowledge workers such as “professionals”, who appear at the top of the social hierarchy, have had access to jobs over a wider range of distances, thus expanding local and regional linkages; workers in the manufacturing industry were employed at a restricted range of distances within close proximity to their homes. This spatial reality has created separate labour markets within the same city region. DISCUSSION AND CONCLUSION
The results provide a step forward in disentangling the socio-economic forces behind the growing interdependence between cities and their regions in the knowledge economy. Representing employment clustering distance and the distance between these clusters and housing location for labour provides a summary for the diverging spatial identities for different sectors of the economy and the labour market. The analysis has demonstrated major changes in the physical and functional structure of settlements between 1981 and 2001. The shift in the economy from Manufacturing to Services has affected the composition and distribution of employment across England and Wales. The changes that the Services industry brought changed the functional profile of settlements by expanding the economic regions of service industries, shifting the commuting preferences over a wider spread of distances with longer distance commutes becoming more prevalent. As manufacturing activities contracted their spatial footprint has shrunk. The distinction between the higher and lower occupational orders became more dramatic as the opportunities of employment increased for higher order occupations as a result of their commuting profiles. The workers in the Manufacturing field suffered a double blow by the loss of half of their jobs and by the limited commuting profile for their particular occupation..
As the share of manufacturing activity and its labour market have decreased within the economy, the “fuzzy” boundaries of service jobs and higher tier occupations have created a more interconnected and flexible functional region; leaving the former locked within its own boundaries. These results are especially relevant in laying out how the knowledge economy in England and Wales has been creating exclusive spatial realities for different segments of the population.

Regions in the Knowledge Economy, Basak Demires Ozkul . Regional Studies Association European Conference May 2012
p. 17
Bibliography
Alonso, W. (1964) Location and land use; toward a general theory of land rent. Cambridge,: Harvard University Press
Barker, K. (2004) Review of housing supply : delivering stability : securing our future housing needs : final report : recommendations. [London]: [HM Treasury]
Besag, J. (1977) 'Comment on Ripley's modelling spatial patterns'. Journal of the Royal Statistical Society. Series B (Methodological), vol 39, pp. 172-212
Brinkley, I. (2008) The knowledge economy: how knowledge is reshaping the economic life of nations. London: The Work Foundation
Brueckner, J. K. (1987) 'The structure of urban equilibria, a unified treatment of the Muth-Mills model', in E. S. Mills (ed), Handbook of Regional and Urban Economics. Amsterdam: North-Holland, pp. 821-45
Castells, M. (1996) The rise of the network society. Cambridge, Mass. ; Oxford: Blackwell Publishers
Castells, M. and P. Hall. (1994) Technopoles of the world : the making of twenty-first-century industrial complexes. London: Routledge
Champion, A. G. (1994) 'Population change and migration in Britain since 1981: evidence for continuing deconcentration'. Environment and Planning A, vol 26, pp. 1501-1520
Champion, T., D. Atkins and M. Coombes. (1998) Urban exodus: Council for the Protection of Rural England
Cherry, G. E. (1988) Cities and plans : the shaping of urban Britain in the nineteenth and twentieth centuries. London: Edward Arnold
Cheshire, P., V. Monastiriotis and S. Sheppard. (2000) 'Transforming societal inequality into residential segregation and social exclusion: the role of housing and labour markets' in Neighbourhoods Colloquium. Liverpool
Cheshire, P. and S. Sheppard. (1998) 'Estimating the demand for housing, land, and neighbourhood characteristics'. Oxford Bulletin of Economics and Statistics, vol 60, pp. 357-382
Christaller, W. and C. W. Baskin. (1966) [Die zentralen Orte in Suddeutschland.] Central places in Southern Germany; translated by Carlisle W. Baskin: Englewood Cliffs (N. J.): Prentice-Hall
Combes, P.-P., T. Mayer and J. F. o. Thisse. (2008) Economic geography : the integration of regions and nations. Princeton, N.J. ; Oxford: Princeton University Press
Coyle, D. (1997) 'The Weightless World: Strategies for managing the digital economy'. Oxford: Capston Publishing Limited
Department of Energy and Transport. (2000) 'National travel survey 1997/1999 (update)' in Transport statistics bullettin, (ed) D. o. E. a. Transport. London: Department of the Environment, Transport and Regions
Diggle, P. and A. Chetwynd. (1991) 'Second-order analysis of spatial clustering for inhomogeneous populations'. Biometrics, vol 47, pp. 1155-1163
Dixon, P. M. (2002) 'Ripley's K function', in, Encyclopedia of environmetrics. Chichester: Wiley, pp. 1796-1803
Regions in the Knowledge Economy, Basak Demires Ozkul . Regional Studies Association European Conference May 2012
p. 18
Duncan, O. D. (1957) 'The measurement of population distribution'. Population Studies, vol 11, pp. 27-45
Duncan, O. D. and B. Duncan. (1955) 'A methodological analysis of segregation indices'. American Sociological Review, vol 20, pp. 210-217
Frost, M., B. Linneker and N. Spence. (1998) 'Excess or wasteful commuting in a selection of British cities'. Transportation Research A, vol 32, pp. 529-538
Fujita, M. and J. F. o. Thisse. (2002) Economics of agglomeration : cities, industrial location, and regional growth. Cambridge: Cambridge University Press
Gallie, D. (1988) Employment in Britain. Oxford: Blackwell
Getis, A. and J. K. Ord. (1992) 'The analysis of spatial association by use of distance statistics'. Geographical Analysis, vol 243, pp. 189-206
Giuliano, G. and K. Small. (1993) 'Is the journey to work explained by urban structure'. Urban Studies, vol 30,
Goddard, J. B. and A. G. Champion. (1983) The Urban and regional transformation of Britain. London: Methuen
Goldner, W. (1955) 'Spatial and locational aspects of metropolitan labor markets'. The American Economic Review, vol 45, pp. 113-128
Goodchild, M. F. and D. G. Janelle. (2004) Spatially integrated social science. Oxford: Oxford University Press
Gordon, I. (2003) 'Unemployment and spatial labour markets: strong adjustment and persistent concentration', in R. Martin and P. S. Morrison (eds), Geographies of labour market inequality. London: Routledge, pp. 55-82
Greenhut, M. L. (1967) Plant location in theory and in practise : the economics of space. Chapel Hill: University of North Carolina Press, c1956
Griffith, D. A. (1981) 'Modelling urban population density in a multi-centred city'. Journal of Urban Economics, vol, pp. 298-310
Haggett, P. (1965) Locational analysis in human geography: pp. xii. 339. Edward Arnold: London
Hamilton, B. W. (1989) 'Wasteful Commuting Again'. The Journal of Political Economy, vol 97, pp. 1497-1504
Hamilton, B. W. and A. Roell. (1982) 'Wasteful Commuting'. The Journal of Political Economy, vol 90, pp. 1035-1053
Horner, M. W. and A. T. Murray. (2002) 'Excess commuting and the modifiable areal unit problem'. Urban Studies, vol 39, pp. 131-139
Institute for Political and Economic Governance, University of Manchester Centre for Urban Policy Studies and University of Manchester with David Coates. (2008) The Northern Connection: assessing the comparative economic performance and prospects of northern England. Newcastle Upon Tyne: The Northern Way Secreteriat
Isard, W. (1956) Location and space-economy : a general theory relating to industrial location, market areas, land use, trade and urban structure. Cambridge Mass: MIT Press
Jencks, C. and P. E. Peterson. (1991) The Urban underclass. Washington, D.C.: Brookings Institution

Regions in the Knowledge Economy, Basak Demires Ozkul . Regional Studies Association European Conference May 2012
p. 19
Krugman, P. R. (1991) Geography and trade. Leuven: Leuven University Press
Lash, S. and J. Urry. (1994) Economies of signs and space. London: Sage
Losch, A. and W. F. Stolper. (1954) The economics of location. translated from the 2nd revised edition / by W.H. Woglom with the assistance of W.F.Stolper. Edition. New Haven: Yale U.P.
Madden, J. F. (1985) 'Urban wage gradients: empirical evidence'. Journal of Urban Economics, vol 18, pp. 291-301
Marcon, E. and F. Puech. (2010) 'Measures of the geographic concentration of industries: improving distance-based methods'. Journal of Economic Geography, vol 10, pp. 745-762
Martin, R. and P. S. Morrison. (2003a) Geographies of labour market inequality. London: Routledge
Martin, R. and P. S. Morrison. (2003b) 'Thinking about the geographies of labour', in R. Martin and P. S. Morrison (eds), Geographies of labour market inequality. London: Routledge, pp. 3-20
Meen, G., J. Meen and C. Nygaard. (2007) 'A tale of two victorian cities in the 21st century'. International Centre for Housing and Urban Economics (ICHUE), vol 7,
Mills, E. S. (1972) Studies in the structure of the Urban Economy. Baltimore: The John Hopkins Press
Mitchell, A. (2005) The ESRI guide to GIS analysis: Redlands
Morris, L. (1994) Dangerous classes : the underclass and social citizenship. London ; New York: Routledge
Muth, R. F. (1969) Cities and housing. The spatial pattern of urban residential land use: Chicago & London: University of Chicago Press
Nielsen, T. A. S. and H. H. Hovgesen. (2008) 'Expoloratory mapping of commuter flows in England and Wales'. Journal of Transport Geography, vol 16, pp. 90-99
ODPM. (2006) State of the English cities. London: Office of the Deputy Prime Minister
Office for National Statistics. (2000a) 'Geography in National Statistics'
Office for National Statistics. (2000b) 'Standard Occupational Classification 2000
Volume 1
Structure and descriptions of unit groups', (ed) O. f. N. Statistics. London: The Stationary Office
Office for National Statistics. (2004) 'Census 2001: definitions', (ed) O. f. N. Statistics. Newport: National Statistics
Porter, M. E. (1990) The competitive advantage of nations. New York: Free Press
Ripley, B. D. (1977) 'Modelling Spatial Patterns'. Journal of the Royal Statistical Society. Series B (Methodological), vol 29, pp. 172-212
Saunders, P. A. (1990) A nation of home owners. London: Unwin Hyman
Simpson, L. (2003) 'Are the census outputs fit for purpose' in Royal Statistical Society/Office for National Statistics Census Conference. University of Manchester
Simpson, S. and D. Dorling. (1994) 'Those missing millions: implications for social statistics of non-response to the 1991 census'. Journal of Social Policy, vol 23, pp. 543-567

Regions in the Knowledge Economy, Basak Demires Ozkul . Regional Studies Association European Conference May 2012
p. 20
Simpson, W. (1980) 'A simultaneous model of workplace and residential location incorporating job search.'. Journal of Urban Economics, vol 8, pp. 330-349
Simpson, W. and A. v. d. Veen. (1992) 'The economics of commuting and the urban labour market'. Journal of Economic Surveys, vol 6, pp. 45-62
Small, K. A. and S. Song. (1992) '"Wasteful" commuting: a resolution'. The Journal of Political Economy, vol 100, pp. 888-898
Smart, M. W. o. t. D. o. E. (1974) Labour market areas: uses and definition. Oxford: Department of Employment
Smith, D. M. (1971) Industrial location : an economic geographical analysis. New York ; Chichester: Wiley
Straszheim, M. R. (1987) 'The theory of residential structure', in E. S. Mills (ed), Handbook of Regional and Urban Economics. Amsterdam: North-Holland, pp. 821-45
Sweeney, S. H. and E. J. Feser. (2004) 'Business location and spatial externalities: tying concepts to measures', in M. F. Goodchild and D. G. Janelle (eds), Spatially integrated social science. Oxford: Oxford University Press, pp. xxiv, 456 p.
Vance, J. E., Jr. (1960) 'Labor-Shed, Employment Field, and Dynamic Analysis in Urban Geography'. Economic Geography, vol 36, pp. 189-220
Weber, A. and C. J. Friedrich. (1929) Theory of the location of industries. Eng. ed. / with intro. and notes by C. J. Friedrich. Edition. Illinois: Chicago Univ. Press
Westergaard, J. (1992) 'About and beyond the underclass: some notes on the infuence of social climate on British sociology today'. Sociology, vol 26, pp. 575-88
White, M. J. (1988a) 'Location choice and commuting behavior in cities with decentralized employment '. Journal of Urban Economics, vol 24, pp. 129-152
White, M. J. (1988b) 'Urban commuting journeys are not 'wasteful''. The Journal of Political Economy, vol 96, pp. 1097-1110
Whitehead, C. M. E. (1999) 'Urban Housing Markets: Theory and Policy', in P. C. Cheshire and E. S. Mills (eds), Handbook of Regional and Urban Economics. Oxford: Elsevier,
Wilson, T. and P. Rees. (1999) 'Linking 1991 population statistics to the 1998 local government geography of the United Kingdom'. Population Trends, vol 97, pp. 37-45
Wilson, W. J. (1987) The truly disadvantaged : the inner city, the underclass, and public policy. Chicago ; London: University of Chicago Press
Wong, C. (2006) 'Uniting Britain: The Evidence Base- Spatial Structure and Key Drivers '. London: Royal Town Planning Institute
Yinger, J. (1992) 'City and suburb: urban models with more than one employment center'. Journal of Urban Economics, vol 31, pp. 181-205


![Geography, Economics and Economic Geography [2nd Edition] - Part 2](https://static.fdocuments.in/doc/165x107/5526ff0e550346e1358b465b/geography-economics-and-economic-geography-2nd-edition-part-2.jpg)


![Geography, Economics and Economic Geography [2nd Edition] - Part 3](https://static.fdocuments.in/doc/165x107/5526fee7550346c8358b4647/geography-economics-and-economic-geography-2nd-edition-part-3.jpg)
