Regional Public Research, Higher Education, and Innovative...
38
JENA ECONOMIC RESEARCH PAPERS # 2013 – 026 Regional Public Research, Higher Education, and Innovative Start-ups – An Empirical Investigation by Michael Fritsch Ronney Aamoucke www.jenecon.de ISSN 1864-7057 The JENA ECONOMIC RESEARCH PAPERS is a joint publication of the Friedrich Schiller University and the Max Planck Institute of Economics, Jena, Germany. For editorial correspondence please contact [email protected]. Impressum: Friedrich Schiller University Jena Max Planck Institute of Economics Carl-Zeiss-Str. 3 Kahlaische Str. 10 D-07743 Jena D-07745 Jena www.uni-jena.de www.econ.mpg.de © by the author.
Transcript of Regional Public Research, Higher Education, and Innovative...

JENA ECONOMIC RESEARCH PAPERS
# 2013 – 026
Regional Public Research, Higher Education, and Innovative Start-ups – An Empirical Investigation
by
Michael Fritsch Ronney Aamoucke
www.jenecon.de
ISSN 1864-7057
The JENA ECONOMIC RESEARCH PAPERS is a joint publication of the Friedrich Schiller University and the Max Planck Institute of Economics, Jena, Germany. For editorial correspondence please contact [email protected]. Impressum: Friedrich Schiller University Jena Max Planck Institute of Economics Carl-Zeiss-Str. 3 Kahlaische Str. 10 D-07743 Jena D-07745 Jena www.uni-jena.de www.econ.mpg.de © by the author.

Regional Public Research, Higher Education, and
Innovative Start-ups—An Empirical Investigation1
Michael Fritsch
Ronney Aamoucke
June 2013
Abstract
Based on detailed information about the regional knowledge base, particularly about universities, we find that regional public research and education have a strong positive impact on new business formation in innovative industries but not in industries classified as non-innovative. Measures for the presence and size of public academic institutions have more of an effect on the formation of innovative new businesses than indicators that reflect the quality of these institutions. We find relatively weak evidence for interregional spillovers of these effects. Our results clearly demonstrate the importance of localized knowledge and, especially, of public research for the emergence of innovative new businesses.
Keywords: New business formation, innovative start-ups, universities, regional knowledge
JEL-classification: L26, L60, L80, O18, R12, R30
Address for correspondence:
Friedrich Schiller University Jena School of Economics and Business Administration Carl-Zeiss-Str. 3 D-07743 Germany [email protected]; [email protected]
1 We have benefited from comments on earlier versions of this paper by participants of several
workshops and conferences. Special thanks for suggestions go to Guido Buenstorf, Donato Iacobucci, Haifeng Qian, Colin Wren, Michael Wyrwich, and an anonymous referee.
Jena Economic Research Papers 2013 - 026

1
1. Introduction
New businesses are an important source of economic growth (see Fritsch,
2013), especially those start-ups that pose a competitive threat to incumbent
firms by introducing a significant innovation. The available data suggest that
only a small fraction of all start-ups is of such quality and that their geographic
distribution is highly uneven (Fritsch, 2011). According to the knowledge
spillover theory of entrepreneurship (Acs, Audretsch, Braunerhjelm and
Carlsson, 2009), highly innovative new businesses can be especially expected
in regions with significant amounts of knowledge, private or public.
This paper analyzes the role played by regional knowledge, particularly
academic knowledge, in the emergence of innovative start-ups in Germany. Our
study makes several significant contributions to this field of study.2 First, we
include all start-ups in innovative and knowledge-intensive industries.3 Second,
our data comprise much more detailed information about higher education
institutes (HEIs), such as universities, which allows us to identify those parts
and features of a region’s academic knowledge base that are most relevant for
innovative start-ups.4 Third, while nearly all the earlier studies are based on
pure cross-sections, our analysis uses relatively long time series data that allow
us to employ panel estimation techniques. Fourth, our data include more recent
periods. Hence, given the changing nature of German universities, our results
and conclusions are not only more up to date but also more relevant than the
results of studies that investigate the start-ups of the early 1990s. Fifth, we
include Eastern Germany, the part of the country that was under a socialist
regime until 1989 and a region that is neglected in some of the earlier studies
(Harhoff, 1999; Bade and Nerlinger, 2000).
2 Earlier studies for Germany are Harhoff (1999), Bade and Nerlinger (2000), Audretsch and
Lehmann (2005), Audretsch, Lehmann and Warning (2005), and Hülsbeck and Pickavé (2012).
3 Harhoff’s (1999) analysis is limited to start-ups in electrical machinery and the mechanical
engineering industry. Audretsch and Lehmann (2005) and Audretsch, Lehmann and Warning (2005) focus on 281 firms that made an initial public offering (IPO) in Germany between March 1997 and March 2002. Since these firms may have been set up considerably in advance of making an IPO, their founding date is only vaguely defined.
4 We also include information about the non-university research institutions in the region, which
are neglected in Audretsch and Lehmann (2005), Audretsch, Lehmann and Warning (2005), and Hülsbeck and Pickavé (2012).
Jena Economic Research Papers 2013 - 026

2
The following section (Section 2) highlights the theoretical relationship
between the three cornerstones of our analysis—innovative start-ups,
geography, and knowledge, beginning with a review of previous research on the
spatial determinants of innovative new business formation. Section 3 discusses
the data and provides an overview of the geographic distribution of innovative
start-ups in Germany. Section 4 introduces the estimation approach; the results
of the multivariate analysis are presented in Section 5. Section 6 concludes.
2. Innovative start-ups, knowledge, and geography
2.1 Theory: Innovative start-ups as knowledge spillovers
The knowledge spillover theory of entrepreneurship (Acs, Braunerhjelm,
Audretsch and Carlsson, 2009) is based on the assumption that starting an
innovative venture requires a combination of knowledge and entrepreneurial
talent. Since a large part of the necessary knowledge resides in incumbent
firms, universities, and non-university public research organizations, this
approach regards innovative start-ups as a form of knowledge spillover, that is,
the institutional knowledge spills over into the newly founded business. A key
assumption of the theory is that the knowledge commercialized by the
innovative start-up would not be exploited if left in the incumbent organization.5
In the process of entrepreneurial knowledge spillover, there are at least
two reasons why the regional dimension, in terms of geographic proximity,
should be relevant. First, new knowledge does not flow freely across space but
tends to be regionally bound (Anselin, Varga and Acs, 1997; Asheim and
Gertler, 2005; Boschma, 2005). Second, founders show a pronounced tendency
to locate their firm in close spatial proximity to their former workplace or to the
place where they reside (Figueiredo, Guimaraes and Woodward, 2002; Dahl
and Sorenson, 2009). Hence, innovative entrepreneurship is a “regional event”
5 A main reason for the knowledge remaining unexploited by the incumbent organization is that
the economic value of new knowledge is highly uncertain and the expected value of any new idea will vary across economic agents. Hence, if an employee in a firm assigns a much higher economic value to a new idea than does the firm’s management, the employee may be motivated to start an own business based on this knowledge. For the researcher, starting an own business is often the only way to have an idea realized. For a more detailed discussion of this point, see Audretsch, Keilbach and Lehmann (2006) and Acs, Braunerhjelm, Audretsch and Carlsson (2009).
Jena Economic Research Papers 2013 - 026

3
(Feldman, 2001; Sternberg, 2009), meaning that the regional knowledge stock,
the regional workforce, and the regional conditions for entrepreneurship are
important influences in the emergence of innovative new businesses.
2.2 Empirical research
2.2.1 Determinants of regional new business formation
Although innovative start-ups may be a special breed, they are not a totally
different species than other kinds of new businesses. Hence, some of the
results from empirical research into the determinants of regional new business
formation should apply to innovative start-ups. According to empirical studies on
the regional factors that determine the emergence of new businesses,
employment share in small firms, regional industry structure, qualification of the
regional workforce, level of innovation activity, and population density play
especially important roles (Fritsch and Falck, 2007; Reynolds, Storey and
Westhead, 1994; Sternberg, 2009). Other factors that may be important are the
presence of entrepreneurial role models, regional “mentalities” such as fear of
failure (Wagner and Sternberg, 2004), and a regional “culture” of
entrepreneurship (Fritsch and Wyrwich, 2014).
As people with a high level of formal education tend to have a relatively
high propensity to become entrepreneurs (Parker, 2009), a large share of well-
educated people in a regional population should be conducive to new business
formation. This may be particularly true for innovative start-ups that require high
levels of knowledge and human capital. Since innovation activity is a main
source of knowledge and entrepreneurial opportunities, a high level of research
and development (R&D) activity in a region should have a positive effect on the
emergence of new firms, particularly for innovative start-ups. To the extent that
founders of innovative firms worked in R&D before starting their venture, and
due to the strong tendency to locate a new business close to the founder’s
residence, there should be a pronounced correspondence between the spatial
distribution of innovative start-ups and that of R&D activity. Because founders
are likely to set up their business in the industry in which they previously
worked, there should also be a positive relationship between the number of
Jena Economic Research Papers 2013 - 026
4
regional employees in innovative industries and the number of innovative start-
ups.
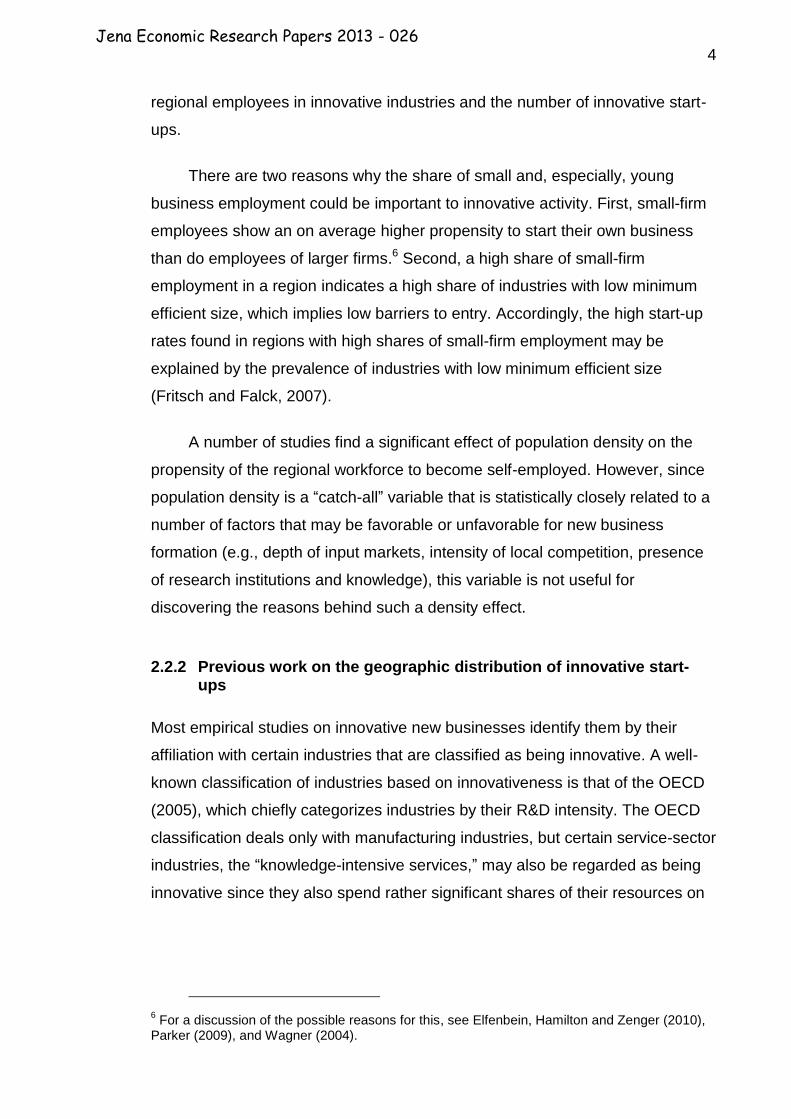
There are two reasons why the share of small and, especially, young
business employment could be important to innovative activity. First, small-firm
employees show an on average higher propensity to start their own business
than do employees of larger firms.6 Second, a high share of small-firm
employment in a region indicates a high share of industries with low minimum
efficient size, which implies low barriers to entry. Accordingly, the high start-up
rates found in regions with high shares of small-firm employment may be
explained by the prevalence of industries with low minimum efficient size
(Fritsch and Falck, 2007).
A number of studies find a significant effect of population density on the
propensity of the regional workforce to become self-employed. However, since
population density is a “catch-all” variable that is statistically closely related to a
number of factors that may be favorable or unfavorable for new business
formation (e.g., depth of input markets, intensity of local competition, presence
of research institutions and knowledge), this variable is not useful for
discovering the reasons behind such a density effect.
2.2.2 Previous work on the geographic distribution of innovative start-ups
Most empirical studies on innovative new businesses identify them by their
affiliation with certain industries that are classified as being innovative. A well-
known classification of industries based on innovativeness is that of the OECD
(2005), which chiefly categorizes industries by their R&D intensity. The OECD
classification deals only with manufacturing industries, but certain service-sector
industries, the “knowledge-intensive services,” may also be regarded as being
innovative since they also spend rather significant shares of their resources on
6 For a discussion of the possible reasons for this, see Elfenbein, Hamilton and Zenger (2010),
Parker (2009), and Wagner (2004).
Jena Economic Research Papers 2013 - 026

5
R&D.7 In the following, we view knowledge-intensive services as a sub-group of
the innovative industries.
Innovative industries tend to be highly concentrated in space (Markusen,
Hall and Glasmeier, 1986; Bade and Nerlinger, 2000; Storey and Tether, 1998).
A number of previous analyses of the regional distribution of innovative start-
ups in Germany have shown a high concentration in larger cities and
agglomerations.8 Bade and Nerlinger (2000) as well as Harhoff (1999)
compared the results of multivariate analyses for start-ups in innovative
industries with models for new businesses in sectors that are not regarded as
being particularly innovative. Both studies find that universities, non-university
public research institutes as well as private sector R&D has a statistically
significant positive effect only for start-ups in innovative industries, not for new
businesses in industries that are not classified as being innovative. Harhoff
(1999) also finds a significantly positive relationship between a high qualification
of the regional workforce and the emergence of innovative new businesses.
Audretsch and Lehmann (2005) and Audretsch, Lehmann and Warning (2005)
showed that there is a significantly positive relationship between the number of
start-ups in innovative manufacturing and the presence of a university in a
region as well as the number of students.
When analyzing the determinants of the regional number of start-ups in
high technology and technologically advanced manufacturing industries,
Hülsbeck and Pickavé (2012) identify a positive effect of several variables that
reflect the activities of universities. According to their results, the number of
university patents and the number of Ph.D. students per professor seem to be
conducive to new business formation in high-technology industries; other
7 Since many service firms do not have a standardized product program but provide customer-
specific services, they are not innovative in the same sense as manufacturing firms. Hence, service industries that may be relevant for innovation are defined as such based on the knowledge intensity of their inputs. These knowledge-intensive service industries include, for example, “computer services,” “research and development in natural sciences and engineering,” and “business consultancy.” For definitions of these groups of industries, see Grupp and Legler (2000) and OECD (2005). For a review of different methods of identifying innovative businesses, see Fritsch (2011).
8 Audretsch and Lehmann (2005), Bade and Nerlinger (2000), Harhoff (1999), Hülsbeck and
Pickavé (2011), Lasch, Robert and Le Roy (2013).
Jena Economic Research Papers 2013 - 026

6
university-related variables, however, have unexpected and statistically
significant negative signs.9
Baptista and Mendonça (2010) investigate the geographic distribution and
determinants of start-ups in innovative industries in Portugal. According to their
analysis, the number of students, as well as the number of university graduates,
has a significantly positive effect on the number of regional start-ups in all
innovative industries, whereas the overall education level of the regional
workforce is statistically significant only for the start-ups in knowledge-intensive
services. Another significantly positive influence was found for the number of
firms in innovative industries per 1,000 inhabitants, which can be regarded as a
measure of relevant private-sector knowledge. Distinguishing between students
and graduates in different academic fields, Baptista and Mendonça (2010)
identify a statistically significant effect for students and graduates in
engineering. The number of students and graduates in social sciences has an
effect only for new business in knowledge-intensive services, not for start-ups in
innovative manufacturing.
In another analysis of Portuguese regions, Baptista, Lima and Mendonça
(2011) study the effect the establishment of a university has on the level of new
business formation in the region. They find a positive effect on new business
formation in innovative industries taken as a whole, but not for subsamples of
innovative manufacturing and or knowledge-intensive services, which may be
due to there being very few start-ups of these types. They conclude that setting
up a university in a region contributes to that region becoming more of a
knowledge-based economy.
In a study of Italian provinces, Piva, Grilli and Rossi-Lamastra (2011) find
a significantly positive effect of the number of patents per capita as well as a
weakly significant effect of the share of people with a tertiary degree in the
region on the emergence of start-ups in innovative manufacturing. For new
businesses in knowledge-intensive services, the number of patents per capita
continued to be statistically significant, but the share of persons with a tertiary
9 The reason for these mixed results may be high correlation between the different indicators
(see Section 4).
Jena Economic Research Papers 2013 - 026

7
degree was not. Remarkably, the share of researchers in the resident
population had no effect. Bonaccorsi et al. (2013) specifically investigate the
effect of different types of knowledge and channels of knowledge transfer on the
emergence of knowledge-intensive new businesses in Italy. The results of their
analysis suggest that universities play a significant role, particularly if the
university specializes in engineering or the medical sciences. Including
alternative indicators for universities and regional innovation activity, the authors
find positive effects for the presence of a university in the region, for the number
of university graduates and university staff, for the number of publications that
are listed in the ISI Web of Science, and for the number of patents. It is
interesting that among these alternative indicators, the dummy variable for the
mere presence of at least one university in the region leads to the highest
coefficient. Other variables that have a statistically significant positive effect are
the share of firms that belong to innovative industries in the regional firm
population, population density, the share of unemployed persons in the regional
workforce, value added per population, and the presence of a business
incubator center in the region. Bonaccorsi et al. (2013) interact the different
university-related indicators with dummy variables for location in either South
Italy or North Italy. The results indicate that universities have an effect on the
formation of innovative new businesses only in the southern part of the country,
not in the economically more developed regions of northern Italy.
Summarizing the empirical evidence on the emergence of innovative new
businesses in geographic space, there is strong indication for a very important
positive effect of regional knowledge, especially of HEIs. The strength and
significance of this positive effect, however, varies between subsectors of
innovative industries10 as well as across regions and the reasons behind these
variations are far from clear. Moreover, it is also less than clear what specific
characteristics of universities and other public research institutions are most
important for the emergence of innovative start-ups. Is it their mere presence in
the region, their size in terms of the number of students and professors and the
amount of R&D activity, or is it the quality of research that is important for the
10
A study of the United States by Bania, Eberts and Fogerty (1993) shows that there may also be considerable differences in the effect of different regional knowledge sources between four-digit industries that are classified as highly innovative.
Jena Economic Research Papers 2013 - 026

8
emergence of innovative start-ups?11 This lack of knowledge is chiefly due to
data limitations, especially since what information there is usually covers only
some selected aspects of what universities do. Since our data provide richer
information on different types of university activities, we will attempt to identify
which types of activity have the strongest effect on the regional formation of
innovative new businesses.
3. Data and descriptive statistics
3.1 Data
Our data on start-ups are from the Founder Panel of the Center for European
Economic Research (ZEW-Mannheim) and include nearly every newly founded
independent firm during the period 1995–2008. These data are based on
information from the largest German credit rating agency (Creditreform). It
covers all private sectors in Germany and identifies innovative new businesses
based on their affiliation with certain industries. We use the common
classification of industries according to their presumed innovativeness and
distinguish between (1) high-technology manufacturing industries that devote
more than 8.5 percent of their input to R&D activity, (2) technologically
advanced manufacturing industries with an R&D intensity between 3.5 and 8.5
percent, and (3) technology-oriented services, which cover some selected
service industries closely related to innovation and new technology (Grupp and
Legler 2000; OECD 2005; Gehrke et al. 2010). The technology-oriented
services are a subgroup of knowledge-intensive services and include industries
that are particularly related to innovation activity, such as “architectural and
engineering activities,” “technical consultancy,” and “technical testing and
analysis.” In addition, we run all models for those industries not classified as
innovative or knowledge intensive. A main problem of such a classification is
that industry affiliation can be “fuzzy,” seeing as there are innovative and not so
innovative firms in all industries. Given the limited availability of data on
11
An indication for different effects of size and quality-related university indicators is provided by Fritsch and Slavtchev (2007), who find that only the volume of external funds has a positive effect on regional innovation activity; no such positive effect can be found for indicators that are related to size, such as the number of professors and academic personnel or the number of students and of graduates.
Jena Economic Research Papers 2013 - 026

9
innovation, however, this is often the only feasible way to identify new
businesses as being innovative.12
Most of the information on the independent variables comes from one of
two sources. Data on regional private-sector employment and R&D employment
come from the German Employment Statistics, which covers all employees
subject to compulsory social insurance contributions (Spengler, 2008). The
second data source is the University Statistics of the German Federal Statistical
Office, which provides detailed information about every university in Germany
(Statistisches Bundesamt, various volumes). Data on unemployment are from
the German Employment Agency (Bundesagentur für Arbeit). The spatial
framework of the analysis is based on the 439 German districts (Kreise). To
attain functional regions, we merged those districts that only encompass cities
(kreisfreie Stadt) with the surrounding territorial districts, resulting in 325
regions.
The available data from the German University Statistics aid identification
of five types of higher education institutions (HEI): regular universities
(Universitäten), medical schools (Universitätskliniken), Fachhochschulen, which
are also called universities of applied sciences, universities of public
administration (Verwaltungshochschulen), and art colleges (Kunsthochschulen).
Distinguishing between these types is important due to significant differences in
both their research as well as their educational profiles. Medical schools at
universities also have hospitals and are another type of specialized tertiary
education. Due to their special characteristics, we count a medical school at a
university as a separate university. The German Fachhochschulen are mainly
intended to provide undergraduate education, while research is predominantly
the domain of the regular universities. Moreover, Fachhochschulen offer
predominantly engineering and management courses, while the regular
universities usually cover a very broad range of academic disciplines, including
a number of non-technical departments, the research results of which are rarely
commercialized by private-sector innovators. The main mission of the
universities of public administration is to educate civil servants for higher
12
See Fritsch (2011) for the classification of German industries as “innovative,” “technologically advanced,” or “technology-intensive services.”
Jena Economic Research Papers 2013 - 026

10
positions in public service, with a clear focus on law and management. Art
colleges engage in very little research at all, according to the conventional
understanding of the term, and are characterized by quite special forms of
education. The more symbolic type of knowledge that these institutions
generate and possess, however, could be important for the emergence of
innovative new businesses. We categorize the arts colleges and the universities
of public administration under “other” HEIs. Due to their rather special
character, these two types of HEIs are, however, excluded in the calculation of
all other university indicators such as number of professors, students, finance,
etc.
No detailed regional data are available for the extra-university public
research institutions. However, we know how many of such institutes there are
in each region.13 Information about the number of patents is from the Patent
Statistics. Patents are assigned to the region where the inventor has his or her
residence.14 Tables A1 and A3 in the Appendix provide descriptive statistics for
the variables used in the empirical analysis.
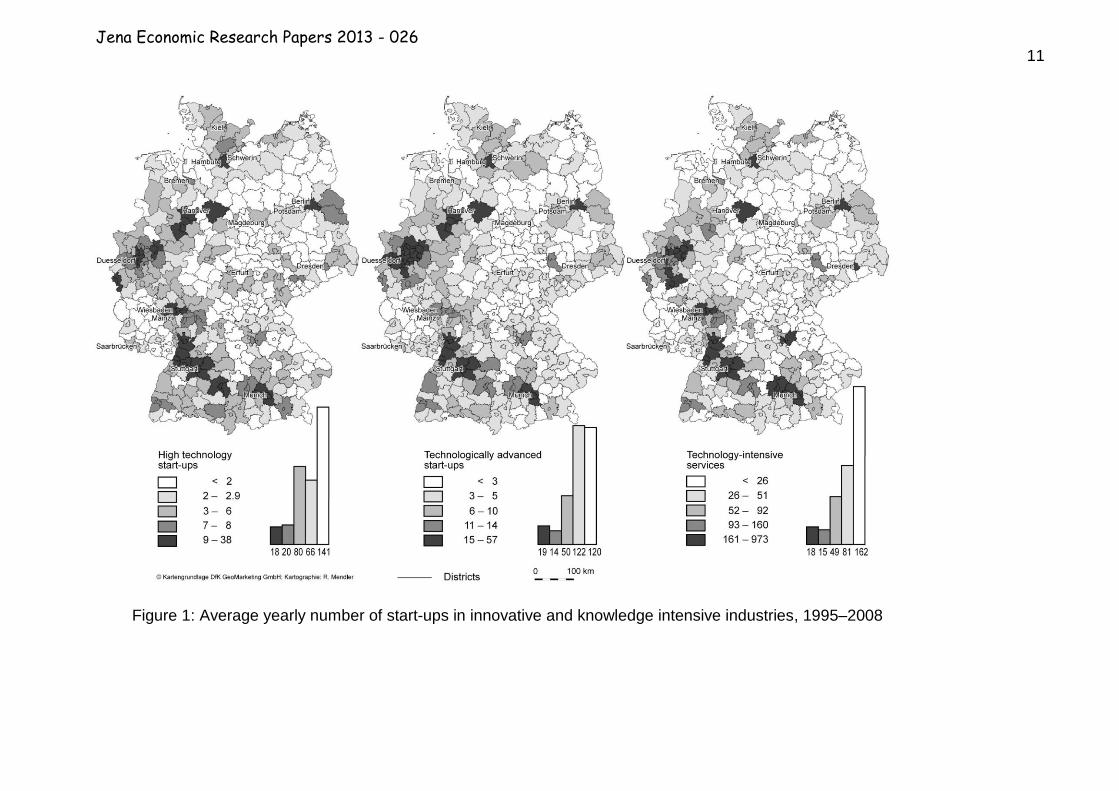
3.2 The spatial distribution of innovative start-ups in Germany
Figure 1 shows the geographic distribution of start-ups in high technology and
technologically advanced manufacturing, as well as those in technology-
intensive services. As seen in the figure, the emergence of an innovative new
business in manufacturing is a rare event: 141 out of the 325 (42.4 percent per
year and 120 regions (36.9 percent) have less than three start-ups in
technologically advanced industries. The median value for the yearly number of
high-technology start-ups is one and it is three for technologically advanced
industries. On average, regions have less than two start-ups in high-technology
13
We account for all institutes of the four large public research organizations in Germany, i.e., the Fraunhofer, the Helmholtz, the Leibnitz, and the Max Planck Society. Data have been collected from different sources, mainly from publications of these organizations and the Federal Ministry of Education and Research. Since a number of these institutes have several locations, the publicly available information about their budgets and number of personnel cannot be meaningfully assigned to regions.
14 If a patent has more than one inventor, the count is divided by the number of the inventors
involved and each inventor is registered with his or her share of that patent.
Jena Economic Research Papers 2013 - 026
11
Figure 1: Average yearly number of start-ups in innovative and knowledge intensive industries, 1995–2008
Jena Economic Research Papers 2013 - 026
12
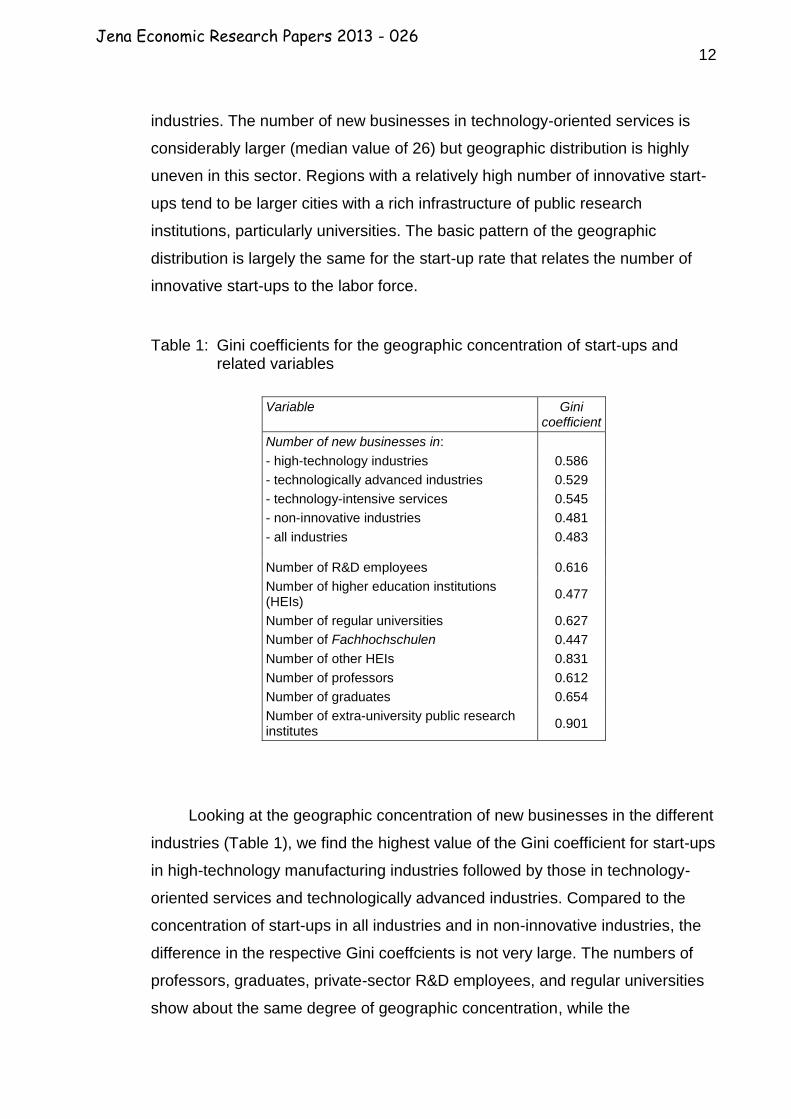
industries. The number of new businesses in technology-oriented services is
considerably larger (median value of 26) but geographic distribution is highly
uneven in this sector. Regions with a relatively high number of innovative start-
ups tend to be larger cities with a rich infrastructure of public research
institutions, particularly universities. The basic pattern of the geographic
distribution is largely the same for the start-up rate that relates the number of
innovative start-ups to the labor force.
Table 1: Gini coefficients for the geographic concentration of start-ups and related variables
Variable Gini coefficient
Number of new businesses in:
- high-technology industries 0.586
- technologically advanced industries 0.529
- technology-intensive services 0.545
- non-innovative industries 0.481
- all industries 0.483
Number of R&D employees 0.616
Number of higher education institutions (HEIs)
0.477
Number of regular universities 0.627
Number of Fachhochschulen 0.447
Number of other HEIs 0.831
Number of professors 0.612
Number of graduates 0.654
Number of extra-university public research institutes
0.901
Looking at the geographic concentration of new businesses in the different
industries (Table 1), we find the highest value of the Gini coefficient for start-ups
in high-technology manufacturing industries followed by those in technology-
oriented services and technologically advanced industries. Compared to the
concentration of start-ups in all industries and in non-innovative industries, the
difference in the respective Gini coeffcients is not very large. The numbers of
professors, graduates, private-sector R&D employees, and regular universities
show about the same degree of geographic concentration, while the
Jena Economic Research Papers 2013 - 026

13
concentration of the Fachhochschulen is much less pronounced. Remarkably,
geographic concentration of extra-university institutes for public research as
well as other HEIs (arts colleges and universities of public administration) is
much higher than concentration of the regular universities and the
Fachhochschulen. Most of the HEIs (56 percent) and non-university research
institutes (69.5 percent) are located in regions commonly classified as
agglomerations:15 79 of the 272 extra-university public research institutes (29
percent) are in moderately congested regions and only four of these institutes
(1.5 percent) are located in areas that can be regarded as “rural.” The share of
HEIs in moderately congested and rural regions is 35.7 percent and 8.4
percent, respectively.16
4. Empirical approach
4.1 Estimation strategy
As dependent variables, we use the number of start-ups in high-technology
manufacturing industries, in technologically advanced manufacturing industries,
in technology-oriented services, and in those industries that are not classified as
innovative or knowledge intensive. Due to the count character of these
variables, we employ a negative binomial estimation technique to analyze the
impact of different variables on the formation of innovative start-ups. Because
we find a relatively high share of observations with no regional start-up in high-
technology manufacturing in a year (27.78 percent), we could be facing the “too
many zero values” problem. A possible solution to this problem is to apply the
zero-inflated version of the negative binomial method, which includes only a
selection of “true” zero values in the estimation. In such a procedure, regions
where one can never expect the event of interest, that is, the formation of an
innovative start-up, are excluded from the estimation. The zero-inflated negative
binomial method requires an assumption for identifying and selecting the “true”
zero values. Since our data show that all regions in Germany have at least one
15
This common classification of German regions by the Federal Office for Building and Regional Planning is based on a region’s population density and settlement structure. For details, see Federal Office for Building and Regional Planning (2003).
16 The highest number of HEIs can be found in Berlin (34 HEIs), followed by Munich (19),
Hamburg (17), and Stuttgart (10). The regions with the highest number of non-university institutions for public research are Berlin (26), Munich (20), and Dresden (17).
Jena Economic Research Papers 2013 - 026

14
start-up in high-technology industries from time to time, all the zero values in
our data have to be regarded as “true” and thus the zero-inflated negative
binomial estimation method is inappropriate here.17 For the technologically
advanced start-ups, the share of observations without a new business in a year
is 13.54 percent and for technology-intensive services it is 0.07 percent,
suggesting that there is no “too many” zero values problem.
We have a time series of yearly observations for a period of 14 years and
thus we can apply panel estimation techniques. Since many of the potential
explanatory variables (e.g., number of universities in the region) show no or not
much of variation over time, a fixed effects estimator that would account for
unobserved regional characteristics is not appropriate because a considerable
part of the influence of such variables is captured by the fixed effects. For this
reason, we use a random effects estimator but also present some examples of
fixed effects estimations in the Appendix. Since the standard statistical software
packages do not provide spatial lag and spatial error corrections for negative
binomial panel models, we include dummy variables for the German Federal
States (Laender) in order to control for effects of the wider regional
environment. Since the German Federal States are an important policy-making
level, this variable may also indicate the effect of policy measures at this level.18
Year dummies are included as controls for time-specific effects. All independent
variables are lagged by one year.
A severe problem of the empirical analysis is the high correlation among
most of the indicators for the universities (see Table A4 in the Appendix). These
pronounced correlations are to a considerable extent caused by a variation of
these variables with size due to complementarity, for example, having a large
number of students means a larger teaching staff and a greater amount of
17
A plausible assumption for the selection of “true” zero values could be that the emergence of an innovative start-up in a region requires the presence of at least one university or of a non-university public research institute. This assumption, however, is not unproblematic because it already implies the general hypothesis that innovative start-ups emerge from public research. Running a zero-inflated negative binomial model with the variable “presence of a university or non-university public research institute in the region” for the selection of the “true” zero values, we find that a Vuong test suggests that doing so is not a significant improvement over a standard negative binomial model.
18 A great deal of the financing and legal framework for universities and non-university public
research institutes is the responsibility of the Federal States in Germany. Most of the Federal States also operate their own programs for promoting entrepreneurship.
Jena Economic Research Papers 2013 - 026

15
resources. We deal with this problem as follows. In a first step, we estimate a
baseline model without the indicators for universities and non-university public
research institutes. In a second step, we add only one of these indicators at a
time to this model. Our measure for the impact of these indicators is change in
the AIC (Akaike Information Criterion)19 (see Greene, 2008) compared to the
baseline model. A decrease in the AIC value due to the inclusion of an
additional variable indicates a better fit of the model in terms reducing the
remaining “unexplained” variance. An increase in the remaining variance leads
to a higher AIC value. In a final step, we perform a factor analysis for the
variables that represent public research in order to aggregate this information
and add a factor that represents the regional HEIs to the variables of the
baseline model. Since the dependent as well as the independent variables are
logged, the values of the estimated coefficients can be interpreted as elasticities
that indicate the relative importance of the respective effect.
4.2 Independent variables and expected results
In our empirical analyses of the factors that determine the emergence of
innovative start-ups we expect significant effects for all those variables that can
be supposed to be generally conducive to new business formation (see Section
2.2.1). We include the number of regional workforce, which represents the pool
of potential entrepreneurs and also reflects economies of size and
agglomeration effects. The regional workforce is divided into the number of
private-sector R&D employees, the number of employed persons excluding
R&D employees, and the number of persons registered as being unemployed.
The number of R&D employees is an important part of the knowledge pool in
the region. Since the number of R&D employees is highly correlated with the
number of people with a tertiary degree, we do not include an indicator for the
share of the workforce holding a tertiary degree. We expect a positive effect on
the emergence of innovative start-ups for the number of employed people,
particularly the number of R&D employees, but the impact of the number of
unemployed people is a priori unclear. On the one hand, innovative start-ups
19
The AIC is a measure of the relative goodness of fit of a statistical model that accounts for the number of independent variables included in the model. For details, see Akaike (1974) and Greene (2008).
Jena Economic Research Papers 2013 - 026

16
can, of course, be set up by the unemployed. On the other hand, unemployed
people have a relatively low propensity for starting their own business (Fritsch
and Falck, 2007), and this may be particularly true when it comes to innovative
ventures that primarily represent opportunity, rather than necessity,
entrepreneurship and require a relatively high level of qualification. Moreover, a
high number of unemployed people in a region can be viewed as an indication
of bad economic conditions and, therefore, poor prospects for success, which
may prevent potential founders from setting up a firm in the region (Reynolds et
al. 1994; Carree 2002; Sutaria and Hicks, 2004).
We expect that founders have a strong tendency to start a business in the
industry with which they were previously affiliated (Fritsch and Falck, 2007) and,
in turn, this should result in a positive effect for the employment share of these
industries. Hence, we include the employment share in the respective group of
industries (high-technology, technologically advanced, technology-oriented
services, non-innovative industries). This variable also reflects regional
specialization in the respective group of industries as well as the available
industry-specific knowledge. The share of employees in small establishments
(those with fewer than 50 employees) should have a positive effect due to a
generally higher propensity of small-firm employees to engage in start-up.20 A
positive effect can also be expected for the number of private R&D employees
in adjacent districts, as these represent spatial knowledge spillovers over
relatively short distances (Anselin, Varga and Acs, 1997; Asheim and Gertler,
2005). We also expect a positive effect in the number of patents per 1,000
employees, which is a general measure for regional knowledge and R&D
activity.21
20
Employment in industry groups and small-firm employment are entered in the regressions as shares in overall regional employment because including these numbers would lead to double counting with the overall number of employees and cause multicollinearity.
21 We do not distinguish between patents registered by HEIs, non-university public research
institutes, or the private sector for several reasons. One reason is that universities and other public research institutes in Germany are to different degrees selective with respect to patenting inventions so the number of patents is not a meaningful indicator of innovative output. A second reason is a change in the legal framework for university patenting that led to considerable change in patenting behavior during the period of analysis (for details, see Proff, Buenstorf and Hummel, 2012).
Jena Economic Research Papers 2013 - 026

17
Since the presence of universities and other kinds of public research
institutes in the region may be an important source of knowledge for innovative
start-ups, we expect a positive effect. Regional proximity to these institutions
may be important because a great deal of their knowledge is of a tacit nature
and tends to be “sticky,” that is, it is regionally bound. This stickiness of regional
knowledge is reflected in the pronounced tendency of spin-offs from universities
and other public research institutions to locate close to their incubator
organization. The positive effect of universities and other public research
institutions should be stronger for new businesses in high-technology
manufacturing industries than for start-ups in technologically advanced
manufacturing or in technology-oriented services because many parts of high
technology manufacturing can be regarded as science based. Along these
lines, HEI presence may be insignificant for new businesses in non-innovative
industries. To account for the possibility of spatial knowledge spillovers, we
include indicators for public research and tertiary education in adjacent regions.
If these indicators are statistically significant, their effect should be positive but
less pronounced than for HEI and other public research institutes actually
located within the respective region due to the sticky character of the
knowledge.
Indicators that reflect the universities and non-university public research
institutes are:
- The presence of at least one HEI (yes = 1; no = 0), as well as the number of
HEIs in the region and in adjacent regions. To the extent that HEIs are
specialized in certain academic disciplines, the number of HEIs can be
viewed as an indication of the variety of academic knowledge present in a
region.
- The presence of at least one extra-university public research institute (yes =
1; no = 0) and the number of such institutes in the region and in adjacent
regions. As with the number of HEIs, the number of extra-university research
institutes may reflect the variety of research fields.
- The numbers of students, graduates, Ph.D. students, and professors. These
variables reflect different aspects of the HEI’s size. The number of students
and graduates indicates a contribution to workforce’s education (i.e., its
Jena Economic Research Papers 2013 - 026

18
qualifications); the number of professors and Ph.D. students primarily
signifies the volume of research being conducted.
- The amount of internal financing as well as the amount of third-party funds
(external funds). To the extent that third-party funds come from private firms,
they most likely reflect contract R&D and cooperation with these firms.
Because third-party funds are nearly always allocated via some kind of
competitive procedure, they can also be regarded as an indication of
research quality.
- The amount of internal funds and third-party funds per professor. These
indicators represent the resource endowment and the quality of research
largely independent of the HEI’s size.
If public and private research in a region is conducive to the emergence of
innovative start-ups, we may expect a concentration of this kind of new
business in larger cities and agglomerations because both public research
institutes as well as private-sector R&D tend to be concentrated in such high-
density areas. Other reasons for expecting a relatively high number of
innovative start-ups in larger cities include agglomeration economies, such as
large and diversified input markets and rich opportunities for direct face-to-face
contacts, which can be assumed conducive to the transfer of knowledge. We do
not include a measure for population density in our standard models because of
its close statistical relationship with other variables that would lead to severe
multicollinearity problems. Due to its close correlation with many other factors
that may be the “true” determinants of innovative start-ups, including population
density could obscure the effects that these other factors have on the
emergence of innovative start-ups. However, in order to analyze the influence of
agglomeration effects, we run our models for groups of regions having various
population density (see Section 5.2).
5. Results
We first report the results for the baseline model with and without indicators for
public research (Section 5.1). Given the close correlation between the different
measures for public research, we perform a factor analysis and include a factor
Jena Economic Research Papers 2013 - 026
19
that represents the overall activities of regional HEIs in the model (Section 5.2).
All models are estimated for four groups of industries: high-technology
manufacturing, technologically advanced manufacturing, technology-oriented
services, and non-innovative or knowledge-intensive industries. Section 5.3 sets
out the results of a number of extensions and robustness checks.
5.1 Results for the baseline model and indicators for regional public research
In our baseline model we find positive and statistically significant effects for the
number of employed persons, excluding R&D employees, as well as for the
employment share for the number of start-ups in all four industry groups (Table
2). Matching our expectations, the coefficient for the number of R&D employees
has the highest value for new businesses in high-technology manufacturing
industries followed by those in technologically advanced manufacturing and in
technology-oriented service; it is not statistically significant for start-ups in non-
innovative industries. The fact that the number of unemployed people has an
effect only on start-ups in non-innovative industries clearly indicates that new
businesses set up by unemployed people tend to occur in these industries. The
share of employees in establishments with fewer than 50 employees also has a
statistically significant positive effect except for start-ups in technologically
advanced manufacturing. This positive effect may be an indication that founders
of new businesses were previously employed in small firms or that the presence
of industries with low minimum efficient size is conducive to start-ups (Fritsch
and Falck, 2007).
The number of patents per 1,000 employees has a positive effect on start-
ups in high-technology manufacturing and in technology-oriented services but it
is not statistically significant for start-ups in technologically advanced
manufacturing (Table 2). The relationship with the number of start-ups in non-
innovative industries is statistically significant but with a negative sign. This
clearly indicates the importance of regional knowledge for the formation of
innovative new businesses. We find no significantly positive effect for the
number of R&D employees in surrounding regions, suggesting that interregional
Jena Economic Research Papers 2013 - 026

20
Table 2: Baseline model for explaining number of start-ups in different groups of industries
High-technology
manufacturing
Technologically advanced
manufacturing
Technology-oriented services
Non-innovative industries
Number of employed persons, excluding R&D employees (ln)
.0347*** (3.26)
.0311*** (3.56)
.0304*** (7.12)
.5467*** (19.76)
Number of R&D employees (ln) .00002*** (4.11)
7.97e-06*** (2.45)
3.54e-06** (1.92)
6.89e-07 (0.88)
Number of unemployed (ln) .0110 (0.55)
.0095 (0.59)
.0042 (1.00)
.0067*** (7.14)
Share of employees in high-technology manufacturing industries (ln)
.0971*** (7.02)
– – –
Share of employees in technologically advanced manufacturing industries (ln)
– .0199** (2.09)
– –
Share of employees in technology-oriented service industries (ln)
– – .0198*** (2.76)
–
Share of employees in non-innovative industries
– – – .0724*** (2.50)
Share of employees in establishments with fewer than 50 employees (ln)
.2427** (1.99)
.0625 (1.57)
.2322*** (2.92)
.2665*** (11.05)
Number of R&D employees in adjacent regions
.0194 (0.84)
-.0102 (0.56)
-.0214*** (3.69)
-.0040* (1.64)
Number of patents per 1,000 employees (ln)
51.3587*** (3.38)
-.3425 (0.03)
17.5053*** (3.34)
-2.4442*** (0.94)
Constant .7197*** (10.26)
1.3684*** (13.82)
2.6735*** (29.67)
-1.4930*** (39.38)
Wald chi2 573.25*** 479.07*** 899.48*** 2756.17***
Dummies for Federal States Yes*** Yes*** Yes*** Yes***
Dummies for years Yes*** Yes*** Yes*** Yes***
Number of observations (number of zeros)
4,550 (1,264)
4,550 (616)
4,550 (3)
4,550 (0)
Log likelihood -8,489.2698 -10,252.936 -16,669.051 -20695.383
AIC 17,042.54 20,563.87 33,402.1 41,455.08
Pseudo R2 .6342 .5545 .7431 .6518
McFadden’s R2 .105 .106 .109 .178
Notes: The dependent variable is the number of start-ups per year in the respective group of industries. Negative binomial panel regression with random effects. Z-values in parentheses. ***: statistically significant at the 1% level; **: statistically significant at the 5% level; *: statistically significant at the 10% level.
spillovers from R&D employment are irrelevant for the emergence of new
businesses, even in our rather narrowly defined regions. Including measures for
the concentration of the regional industry structure that would indicate an effect
of spatial clustering does not lead to any plausible or statistically significant
results.
Jena Economic Research Papers 2013 - 026
21
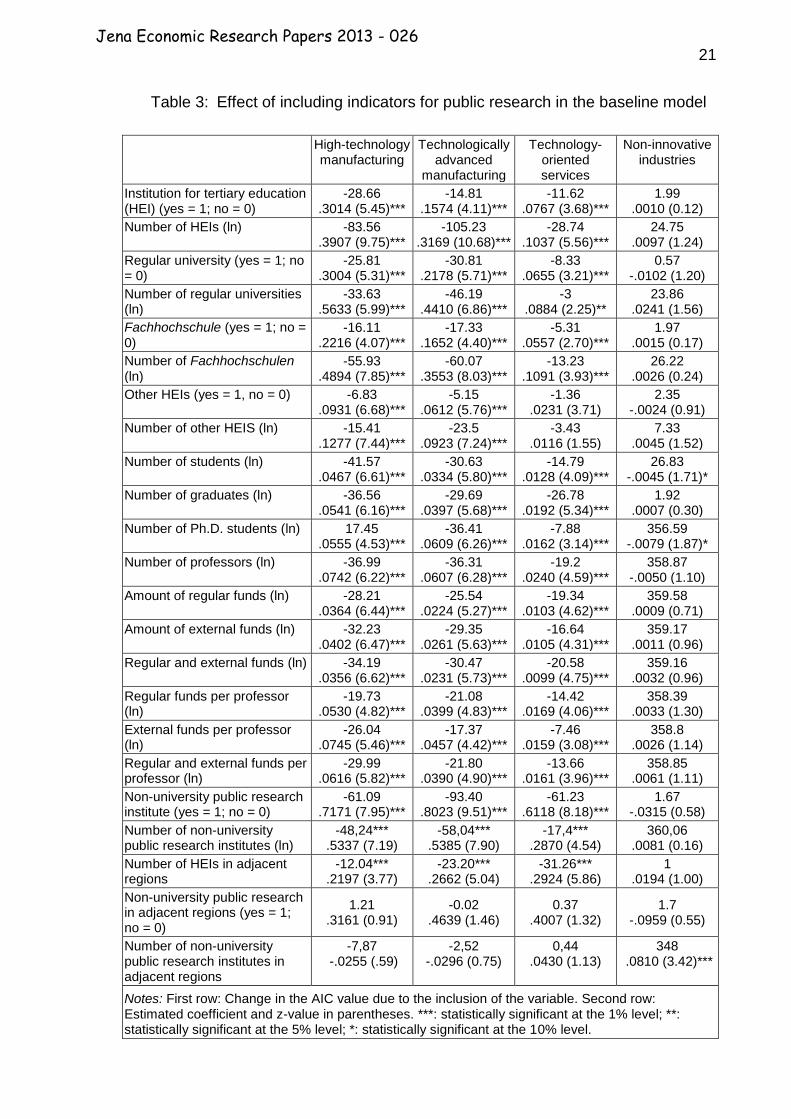
Table 3: Effect of including indicators for public research in the baseline model
High-technology manufacturing
Technologically advanced
manufacturing
Technology-oriented services
Non-innovative industries
Institution for tertiary education (HEI) (yes = 1; no = 0)
-28.66 .3014 (5.45)***
-14.81 .1574 (4.11)***
-11.62 .0767 (3.68)***
1.99 .0010 (0.12)
Number of HEIs (ln) -83.56 .3907 (9.75)***
-105.23 .3169 (10.68)***
-28.74 .1037 (5.56)***
24.75 .0097 (1.24)
Regular university (yes = 1; no = 0)
-25.81 .3004 (5.31)***
-30.81 .2178 (5.71)***
-8.33 .0655 (3.21)***
0.57 -.0102 (1.20)
Number of regular universities (ln)
-33.63 .5633 (5.99)***
-46.19 .4410 (6.86)***
-3 .0884 (2.25)**
23.86 .0241 (1.56)
Fachhochschule (yes = 1; no = 0)
-16.11 .2216 (4.07)***
-17.33 .1652 (4.40)***
-5.31 .0557 (2.70)***
1.97 .0015 (0.17)
Number of Fachhochschulen (ln)
-55.93 .4894 (7.85)***
-60.07 .3553 (8.03)***
-13.23 .1091 (3.93)***
26.22 .0026 (0.24)
Other HEIs (yes = 1, no = 0) -6.83 .0931 (6.68)***
-5.15 .0612 (5.76)***
-1.36 .0231 (3.71)
2.35 -.0024 (0.91)
Number of other HEIS (ln) -15.41 .1277 (7.44)***
-23.5 .0923 (7.24)***
-3.43 .0116 (1.55)
7.33 .0045 (1.52)
Number of students (ln) -41.57 .0467 (6.61)***
-30.63 .0334 (5.80)***
-14.79 .0128 (4.09)***
26.83 -.0045 (1.71)*
Number of graduates (ln) -36.56 .0541 (6.16)***
-29.69 .0397 (5.68)***
-26.78 .0192 (5.34)***
1.92 .0007 (0.30)
Number of Ph.D. students (ln) 17.45 .0555 (4.53)***
-36.41 .0609 (6.26)***
-7.88 .0162 (3.14)***
356.59 -.0079 (1.87)*
Number of professors (ln) -36.99 .0742 (6.22)***
-36.31 .0607 (6.28)***
-19.2 .0240 (4.59)***
358.87 -.0050 (1.10)
Amount of regular funds (ln) -28.21 .0364 (6.44)***
-25.54 .0224 (5.27)***
-19.34 .0103 (4.62)***
359.58 .0009 (0.71)
Amount of external funds (ln) -32.23 .0402 (6.47)***
-29.35 .0261 (5.63)***
-16.64 .0105 (4.31)***
359.17 .0011 (0.96)
Regular and external funds (ln) -34.19 .0356 (6.62)***
-30.47 .0231 (5.73)***
-20.58 .0099 (4.75)***
359.16 .0032 (0.96)
Regular funds per professor (ln)
-19.73 .0530 (4.82)***
-21.08 .0399 (4.83)***
-14.42 .0169 (4.06)***
358.39 .0033 (1.30)
External funds per professor (ln)
-26.04 .0745 (5.46)***
-17.37 .0457 (4.42)***
-7.46 .0159 (3.08)***
358.8 .0026 (1.14)
Regular and external funds per professor (ln)
-29.99 .0616 (5.82)***
-21.80 .0390 (4.90)***
-13.66 .0161 (3.96)***
358.85 .0061 (1.11)
Non-university public research institute (yes = 1; no = 0)
-61.09 .7171 (7.95)***
-93.40 .8023 (9.51)***
-61.23 .6118 (8.18)***
1.67 -.0315 (0.58)
Number of non-university public research institutes (ln)
-48,24*** .5337 (7.19)
-58,04*** .5385 (7.90)
-17,4*** .2870 (4.54)
360,06 .0081 (0.16)
Number of HEIs in adjacent regions
-12.04*** .2197 (3.77)
-23.20*** .2662 (5.04)
-31.26*** .2924 (5.86)
1 .0194 (1.00)
Non-university public research in adjacent regions (yes = 1; no = 0)
1.21 .3161 (0.91)
-0.02 .4639 (1.46)
0.37 .4007 (1.32)
1.7 -.0959 (0.55)
Number of non-university public research institutes in adjacent regions
-7,87 -.0255 (.59)
-2,52 -.0296 (0.75)
0,44 .0430 (1.13)
348 .0810 (3.42)***
Notes: First row: Change in the AIC value due to the inclusion of the variable. Second row: Estimated coefficient and z-value in parentheses. ***: statistically significant at the 1% level; **: statistically significant at the 5% level; *: statistically significant at the 10% level.
Jena Economic Research Papers 2013 - 026
22
When we include indicators for public research in these models, we find
the highest increases of explained variance, as indicated by reduction of the
AIC values, for the number of such institutions in a region, i.e., the number of
HEIs, and the number of non-university public research institutes (Table 3) The
effect of the “other” HEIs (arts colleges and universities of public administration)
is considerably weaker than the effect of regular universities and
Fachhochschulen. Surprisingly, indicators for the number of professors and the
number of graduates, as well as for the amount and type of available financial
resources, have a much smaller impact. The number of HEIs, and of non-
university public research institutes in adjacent regions, is intended to indicate
spatial spillover effects. The results for the HEIs in adjacent regions suggest
that there are such spillover effects, but that their importance for new business
formation is considerably weaker than the effect of HEIs located in the same
region. There is no statistically significant effect of the presence and number of
non-university research institutes in adjacent regions on start-ups in innovative
industries. It is remarkable that adding measures for public research institutes to
the baseline model for start-ups in non-innovative industries degrades model fit.
This clearly indicates that public research is rather unimportant for new
business formation in these sectors.
Since all independent variables are logged, the estimated coefficients can
be interpreted as elasticities and used as indicators for the relative importance
of the different variables. Comparing the estimated coefficients of the diverse
measures for public research with the coefficients for private-sector R&D, such
as the number of R&D employees, we find that many of the public research
indicators are much more important. In most cases, the effect of the indicators
for public research institutions is strongest for start-ups in high-technology
manufacturing and weakest for new businesses in technology-oriented services.
5.2 Aggregation of indicators for regional public research
We conducted factor analyses to aggregate the information provided by the
diverse indicators for HEIs. The factor analyses showed that different types of
HEI activity, such as education and research, could not be meaningfully
Jena Economic Research Papers 2013 - 026
23
separated into different factors. Hence, we generated only one factor to
represent regional HEIs, which is based on the number of graduates, the
number of Ph.D. students, the number of professors, the amount of regular
funds, and the amount of external funds (see Table A5 in the Appendix). This
factor for HEI activity in the region and in adjacent regions was then included in
the baseline model. Since our information about the non-university public
research institutes is limited, we included the number of such institutes in the
region and in the adjacent regions in order to represent this part of public
research.
The results of the baseline model with the aggregate indicators for public
research included are displayed in Table 4. A main difference between these
results and those from the baseline model without indicators for public research
(Table 2) is that the number of regional private-sector R&D employees loses
statistical significance, whereas both indicators for public research in the region
are highly significant with the expected sign in the models for innovative and
knowledge-intensive industries, but not in the estimate for non-innovative
industries. However, it is problematic to conclude from this result that public
R&D is more important for innovative start-ups than private-sector R&D due to
the considerable correlation between the indicators for the two types of
activities.22 Presumably, the main source of these correlations is that there are
pronounced spatially concentrated knowledge spillovers between these two
types of R&D (Fritsch and Slavtchev, 2007). Such spatially bounded knowledge
spillovers are one reason for the co-location of public and private-sector R&D
facilities. Moreover, both types of R&D prefer the same kind of region, mainly
larger cities. The relationship between public and private R&D is complex.
Public institutions of education and research may provide important inputs for
private-sector R&D, and R&D in both sectors may be interrelated, particularly at
the regional level.
22
The correlation coefficient between the aggregate indicator for the regional HEIs (the number of non-university public research institutes) and the number of private-sector R&D employees is 0.465 (0.596); see Table A2 in the Appendix. The correlation between the regional number of private-sector R&D employees and the aggregate indicator for HEIs (the number of non-university public research institutes) in adjacent regions is 0.323 (-0,021).
Jena Economic Research Papers 2013 - 026

24
Table 4: Baseline model with aggregate indicators for public research
High-technology
manufacturing
Technologically advanced
manufacturing
Technology-oriented services
Non-innovative industries
Number of employed persons, excluding R&D employees (ln)
.0251** (2.39)
.0229*** (2.66)
.0277*** (6.43)
.5262*** (18.93)
Number of R&D employees (ln) -9.86e-08 (0.03)
-2.83e-06 (1.01)
1.15e-07 (0.07)
4.33e-07 (0.87)
Number of unemployed (ln) -.0189 (0.99)
-.0088 (0.59)
-.0056 (1.28)
.0061*** (6.20)
Share of employees in high-technology manufacturing industries (ln)
.0945*** (6.97)
– – –
Share of employees in technologically advanced manufacturing industries (ln)
– .0200** (2.14)
– –
Share of employees in technology-oriented service industries (ln)
– – .0186*** (2.58)
–
Share of employees in non-innovative industries
– – – .0727*** (2.46)
Share of employees in establishments with fewer than 50 employees (ln)
.3860*** (3.15)
.0694* (1.80)
.4036*** (4.83)
.2902*** (11.44)
Number of R&D employees in surrounding regions
.0321 (1.48)
.0021 (0.13)
-.0131** (2.26)
-.0034* (1.73)
Number of patents per 1,000 employees (ln)
48.9386*** (3.30)
.8756 (0.09)
19.999*** (3.82)
-3.6376 (1.19)
Aggregate indicator of HEIs in the region
.1917*** (6.44)
.1481*** (6.21)
.0696*** (5.16)
.0031 (0.25)
Number of non-university research Institutes (ln)
.4834*** (6.74)
.4796*** (7.30)
.2777*** (4.39)
-.0011 (0.02)
Aggregate indicator of HEIs in adjacent regions
.0425 (1.22)
.0439 (1.59)
-.0140 (1.04)
.0285*** (3.02)
Number of non-university research institutes in adjacent regions (ln)
.0017 (0.04)
-.0102 (0.29)
.0665* (1.84)
.0873*** (3.77)
Constant .7922*** (10.33)
1.4283*** (14.43)
2.5437*** (29.93)
-1.2388*** (39.06)
Wald chi 2 737.74*** 646.67*** 969.70*** 2835.25***
Dummies for Federal States Yes*** Yes*** Yes*** Yes***
Dummies for years Yes*** Yes*** Yes*** Yes***
Number of observations (number of zeros)
4,550 (1,264)
4,550 (616)
4,550 (3)
4,550 (0)
Log likelihood -8,442.796 -10,201.906 -16,644.181 -20,684.196
AIC (change in AIC compared to the baseline model in Table 3)
16,957.59 (-84.95)
20,469.81 (-94.06)
33,360.36 (-41.74)
41,412.86 (-42.22)
Pseudo R2 .6218 .5787 .4956 .7060
McFadden’s R2 .124 .125 .139 .180
Notes: The dependent variable is the number of start-ups per year in the respective group of industries. Negative binomial panel regression with random effects. Z-values in parentheses. ***: statistically significant at the 1% level; **: statistically significant at the 5% level; *: statistically significant at the 10% level.
Jena Economic Research Papers 2013 - 026

25
It is remarkable that the number of non-university public research institutes has
a considerably stronger effect than the aggregate indicator for the regional
HEIs. The relatively high coefficients for the number of non-university public
research institutions in the region may, to a degree, reflect the concentration of
this type of public research in high-density areas, which are also the areas
where most of the innovative start-ups occur, and therefore could be an
overestimation of their effect. Measures for public research in adjacent regions
are not statistically significant for high-technology manufacturing or for
technologically advanced industries. We find a weak significant effect of the
number of non-university public research institutes in adjacent regions for start-
ups in technology-oriented services. Surprisingly, the estimates for start-ups in
non-innovative industries indicate a pronounced effect of HEIs and of the
number of non-university research institutes in adjacent regions, but not for
public research in the same region; however, this finding could be a statistical
artifact caused by correlation among explanatory variables. The inclusion of the
indicators for public research leads to large reductions in the AIC value in all
four models, particularly in the estimates for new businesses in high-technology
manufacturing and in technologically advanced manufacturing industries. All in
all, these results confirm the very important role of public research identified in
Section 5.1.
5.3 Extensions and robustness checks
We performed a number of robustness checks in order to test the stability of the
results.23 First, we ran the models with fixed effects. As expected, a fixed effects
panel estimator does not lead to meaningful results. In these models, many of
the indicators for public research are not statistically significant, which is
obviously due to low levels of variation over time. Second, given the strong
effect that we found for the presence of at least one HEI or non-university public
research institute, we ran the regressions for only those regions that have at
least one such institute (about 62 percent of all regions). Considerable
differences in the estimates from the models for all regions could indicate that
the coefficients for the number of institutes mainly reflect the presence of at
23
The results are available from the authors upon request.
Jena Economic Research Papers 2013 - 026

26
least one such institute. We find, however, that the results are similar. Excluding
regions with a relatively high number of HEIs and extra-university public
research institutes, such as Berlin and Munich, did not produce any significantly
different results either. Third, the models were run separately for East and West
Germany, and again there was not much difference in the results, indicating that
the commercialization of knowledge through the formation of innovative new
businesses follows the same pattern in both parts of the country.
Finally, in order to further analyze the influence of agglomeration effects,
we sorted the regions based on population density into three groups of equal
size and ran the regressions separately for regions with relatively low, medium,
and high level of population density. We found that the coefficient for the
aggregate effect of HEIs is highest in regions with low population density,
somewhat lower in regions with medium density, and relatively low in high
density areas. These results suggest that HEIs may have a particularly
pronounced effect in low-density regions and that their effect in high-density
areas is somewhat obscured by other factors, making it difficult to identify their
precise role using this type of analysis. We also find that the number of non-
university public research institutes has a statistically significant effect only in
regions with relatively high population density. One main reason for this result
may be the rather high concentration of these institutions in agglomerations and
that there are nearly no non-university public research institutions in rural areas.
Another reason could be relatively high correlation between the aggregate
indicator for HEIs and the number of non-university research institutes.24
6. Summary and conclusions
We analyzed a rich dataset containing particularly detailed information about
institutes of tertiary education in German regions. According to our empirical
analysis, there is a strong relationship between the mere presence of
universities and other types of public research institutes and the emergence of
new businesses in industries commonly classified as innovative. Other
indicators that reflect the size of these institutions or the quality of research are
24
The coefficient of correlation between these two indicators in the overall sample is 0.488 (see Table A2 in the Appendix).
Jena Economic Research Papers 2013 - 026

27
also statistically significant, but have a considerably smaller impact. We also
find some positive effects for public research institutes in adjacent regions, thus
indicating interregional spillovers, but these effects are modest and often not
statistically significant. The impact of public research is particularly pronounced
for start-ups in high-technology and technologically advanced manufacturing
industries and tends to be considerably less important for new business
formation in technology-oriented services. Our results suggest that public
research has hardly any impact on new business formation in industries that are
not particularly innovative.
Due to the pronounced correlations between many of the various
indicators for public research, however, we were not able to exactly determine
which characteristics of public research institutions are the most important with
regard to the emergence of innovative new businesses. In particular, even
factor analysis did not reveal separate factors representing different aspects of
public education and research. Moreover, we do not think that even more
sophisticated econometric methods applied to aggregate data for whole regions
can overcome the problem of strong interrelation between the variables for
public research. Further insights that may provide more detailed policy guidance
are mainly to be expected from analyzing micro data and by means of
qualitative analysis on a case-study basis. Despite such limitations, however,
the main conclusion from our analysis is crystal clear: public research in a
region is a main source of innovative start-ups and the regional distribution of
innovative new businesses is highly influenced by the regional distribution of
public research institutions. Hence, policy aimed at increasing and/or improving
public research may be crucial for long-term regional development (Carree,
Della Malva and Santarelli, forthcoming). However, this in no way means that
other aspects of regional conditions are unimportant. On the contrary, there are
strong indications that the effect of public research on regional development
may vary considerably across regions. Whether this is due to characteristics of
the research institutes or to other region-specific factors (e.g., Astebro and
Bazzazian, 2011; Bonaccorsi, et al., 2013; Piva, Grilli and Rossi-Lamastra,
2011) is an important avenue for further research.
Jena Economic Research Papers 2013 - 026

28
References
Acs, Zoltan J., Pontus Braunerhjelm, David B. Audretsch, and Bo Carlsson (2009): The knowledge spillover theory of entrepreneurship. Small Business Economics, 32, 15-30.
Akaike, Hirotugu (1974): A new look at the statistical model identification. IEEE Transactions on Automatic Control, 19, 716–723.
Anselin, Luc, Attila Varga and Zoltan J. Acs (1997): Local geographic spillovers between university research and high technology innovations. Journal of Urban Economics, 42, 422-448.
Asheim, Björn T. and Meric S. Gertler (2005): The geography of innovation: Regional innovation systems. In: Jan Fagerberg, D. C. Mowery, and Richard R. Nelson (eds.): The Oxford Handbook of Innovation. Oxford: Oxford University Press, 291–317.
Astebro, Thomas and Navid Bazzazian (2011): Universities, entrepreneurship and local economic development. In: Michael Fritsch (ed.): Handbook of Research on Entrepreneurship and Regional Development, Cheltenham: Elgar, 252-333.
Audretsch, David B. and Erik E. Lehmann (2005): Does the Knowledge Spillover Theory of Entrepreneurship hold for regions. Research Policy, 34, 1191-1202.
Audretsch, David B., Erik E. Lehmann and Susanne Warning (2005): University spillovers and new firm location. Research Policy, 34, 1113-1122.
Audretsch, David B., Max Keilbach and Erik Lehmann (2006): Entrepreneurship and Economic Growth. Oxford: Oxford University Press.
Bade, Franz-Josef and Eric A. Nerlinger (2000): The spatial distribution of new technology-based firms: Empirical results for West-Germany. Papers in Regional Science, 79, 155-176.
Bania, Neil, Randall W. Eberts and Michael S. Fogerty (1993): Universities and the Startup of New Companies Can we Generalize from Route 128 and Silicon Valley? Review of Economics and Statistics, 75, 761-766.
Baptista, Rui and Joana Mendonça (2010): Proximity to knowledge sources and the location of knowledge-based start-ups. Annals of Regional Science, 45, 5-29.
Baptista, Rui, Francisco Lima and Joanna Mendonça (2011): Establishment of higher education institutions and new firm entry. Research Policy, 40, 751-760.
Bonaccorsi, Andrea, et al. (2013): How universities contribute to the creation of knowledge intensive firms: Detailed evidence on the Italian case. In: Andrea Bonaccorsi (ed.): The European higher education landscape—Diversity and performance, Cheltenham, Edward Elgar (forthcoming).
Jena Economic Research Papers 2013 - 026

29
Boschma, Ron (2005): Proximity and innovation: A critical assessment. Regional Studies, 39, 61–74.
Carree, Martin A. (2002): Does unemployment affect the number of establishments? A regional analysis for US states. Regional Studies, 36, 389-398.
Carree, Martin A., Antonio Della Malva and Enrico Santarelli (forthcoming): The Contribution of Universities to Growth: Empirical Evidence for Italy. Journal of Technology Transfer.
Dahl, Michael S. and Olav Sorenson (2009): The Embedded Entrepreneur. European Management Review, 6, 172–181.
Elfenbein, Daniel W., Barton H. Hamilton and Todd R. Zenger (2010): The Small Firm Effect and the Entrepreneurial Spawning of Scientists and Engineers. Management Science, 56, 659–681.
Federal Office for Building and Regional Planning (Bundesamt für Bauwesen und Raumordnung) (2003): Aktuelle Daten zur Entwicklung der Städte, Kreise und Gemeinden. Vol. 17, Bonn: Federal Office for Building and Regional Planning.
Feldman, Maryann P. (2001): The entrepreneurial event revisited: Firm formation in a regional context. Industrial and Corporate Change, 10, 861–891.
Figueiredo, Octávio, Paulo Guimaraes and Douglas Woodward (2002): Home-Field Advantage: Location Decisions of Portuguese Entrepreneurs. Journal of Urban Economics, 52, 341–361.
Fritsch, Michael and Oliver Falck (2007): New Business Formation by Industry over Space and Time: A Multi-Dimensional Analysis. Regional Studies, 41, 157-172.
Fritsch, Michael and Viktor Slavtchev (2007): Universities and Innovation in Space. Industry and Innovation, 14, 201-218.
Fritsch, Michael (2011): Start-ups in Innovative Industries—Causes and Effects. In: David B. Audretsch, Oliver Falck, Stephan Heblich and Adam Lederer (eds.): Handbook of Innovation and Entrepreneurship, Cheltenham: Elgar, 365-381.
Fritsch, Michael (2013): New Business Formation and Regional Development—A Survey and Assessment of the Evidence. Foundations and Trends in Entrepreneurship, 9, 249–364.
Fritsch, Michael and Michael Wyrwich (2014): The Long Persistence of Regional Levels of Entrepreneurship: Germany 1925 to 2005. Regional Studies, 48 (forthcoming).
Gehrke Birgit, Ulrich Schasse, C. Rammer, R. Frietsch, P. Neuhäusler and M. Leidmann (2010): Listen wissens- und technologieintensiver Güter und Wirtschaftszweige. Studien zum deutschen Innovationssystem, 19-2010, Frauenhofer ISI, NIW, ZEW.
Jena Economic Research Papers 2013 - 026

30
Greene, William (2008): Econometric Analysis. 6th edition, Upper Saddle River: Pearson Prentice Hall.
Grupp, Hariolf and Harald Legler (2000): Hochtechnologie 2000: Neudefinition der Hochtechnologie für die Berichterstattung zur technologischen Leistungsfähigkeit Deutschlands, Karlsruhe and Hannover: FhG, ISI, NIW.
Harhoff, Dietmar (1999): Firm Formation and Regional Spillovers - Evidence from Germany. Economics of Innovation and New Technology, 8, 27-55.
Hülsbeck, Marcel and Elena N. Pickavé (2012): Regional knowledge production as determinant of high-technology entrepreneurship: empirical evidence for Germany. International Entrepreneurship Management Journal, DOI
10.1007/s11365-011-0217-9.
Kirchhoff, Bruce A., Scott L. Newbert, Iftekhar Hasan, and Catherine Armington (2007): The Influence of University R & D Expenditures on New Business Formations and Employment Growth. Entrepreneurship in Theory and Practice, 31, 543-559.
Lasch, Frank, Frank Robert and Frederic Le Roy (2013): Regional determinants of ICT new firm formation. Small Business Economics, 40, 671–686.
Markusen, Ann, Amy Glasmeier and Peter Hall (1986): High Tech in America—The what, how, where, and why of the sunrise industries. Boston: Allen & Unwin.
Organization for Economic Co- operation and Development (OECD) (2005): OECD Handbook on Economic Globalization Indicators. Paris: OECD.
Parker, Simon C. (2009): Why do small firms produce the entrepreneurs? Journal of Socio-Economics, 38, 484-494.
Piva, Evila, Luca Grilli, and Cristina Rossi-Lamastra (2011): The Creation of High-Tech Entrepreneurial Ventures at the Local Level: The Role of Local Competences and Communication Infrastructures. Industry and Innovation, 18, 563-580.
Proff, Sidonia von, Guido Buenstorf and Martin Hummel (2012): University patenting in Germany before and after 2002: what role did the professors’ privilege play? Industry and Innovation, 19, 23-44.
Reynolds, Paul D., David J. Storey and Paul Westhead (1994): Cross-national Comparisons of the Variation in New Firm Formation Rates. Regional Studies, 28, 443–456.
Spengler, Anja (2008): The Establishment History Panel. Schmollers Jahrbuch/Journal of Applied Social Science Studies, 128, 501–509.
Statistisches Bundesamt (various volumes): Fachserie 11 – Bildung und Kultur. Wiesbaden: Statistisches Bundesamt.
Sternberg, Rolf (2009): Regional Dimensions of Entrepreneurship. Foundations and Trends in Entrepreneurship, 5(4), 211–340.
Jena Economic Research Papers 2013 - 026

31
Storey, David J. and Bruce S. Tether (1998): New technology-based firms in the European Union: an introduction. Research Policy, 26, 933–946.
Sutaria, Vinod and Donald A. Hicks (2004): New firm formation: dynamics and determinants. Annals of Regional Science, 38, 241–262.
Wagner, Joachim (2004): Are Young and Small Firms Hothouses for Nascent Entrepreneurs? Evidence from German Micro Data. Applied Economics Quarterly, 50, 379-39.
Wagner, Joachim and Rolf Sternberg (2004): Start- up activities, individual characteristics, and the regional milieu: lessons for entrepreneurship support policies from German micro data. Annals of Regional Science, 38, 219–240.
Zentrum für Europäische Wirtschaftsforschung (ZEW) (2011): Die Bereitstellung von Standardauswertungen zum Gründungsgeschehen in Deutschland für externe Datennutzer. Mannheim: ZEW.
Jena Economic Research Papers 2013 - 026
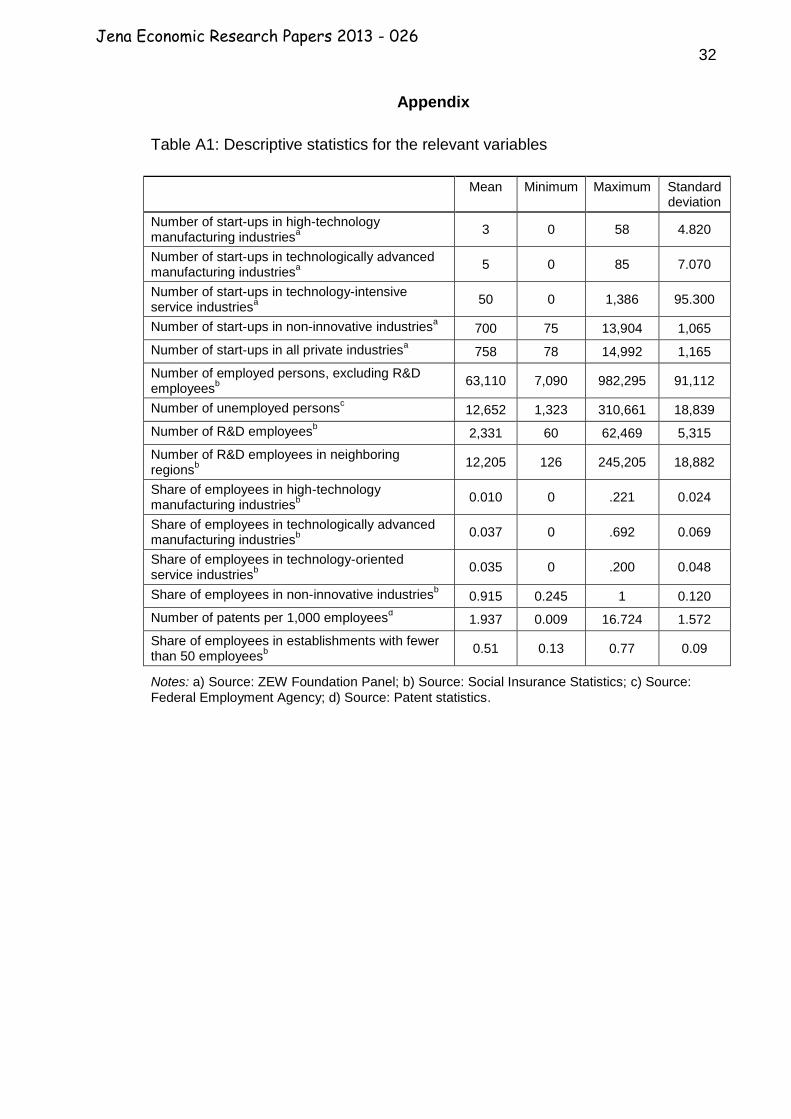
32
Appendix
Table A1: Descriptive statistics for the relevant variables
Mean Minimum Maximum Standard deviation
Number of start-ups in high-technology manufacturing industries
a
3 0 58 4.820
Number of start-ups in technologically advanced manufacturing industries
a
5 0 85 7.070
Number of start-ups in technology-intensive service industries
a
50 0 1,386 95.300
Number of start-ups in non-innovative industriesa 700 75 13,904 1,065
Number of start-ups in all private industriesa 758 78 14,992 1,165
Number of employed persons, excluding R&D employees
b
63,110 7,090 982,295 91,112
Number of unemployed personsc 12,652 1,323 310,661 18,839
Number of R&D employeesb 2,331 60 62,469 5,315
Number of R&D employees in neighboring regions
b
12,205 126 245,205 18,882
Share of employees in high-technology manufacturing industries
b
0.010 0 .221 0.024
Share of employees in technologically advanced manufacturing industries
b
0.037 0 .692 0.069
Share of employees in technology-oriented service industries
b
0.035 0 .200 0.048
Share of employees in non-innovative industriesb 0.915 0.245 1 0.120
Number of patents per 1,000 employeesd 1.937 0.009 16.724 1.572
Share of employees in establishments with fewer than 50 employees
b
0.51 0.13 0.77 0.09
Notes: a) Source: ZEW Foundation Panel; b) Source: Social Insurance Statistics; c) Source:
Federal Employment Agency; d) Source: Patent statistics.
Jena Economic Research Papers 2013 - 026
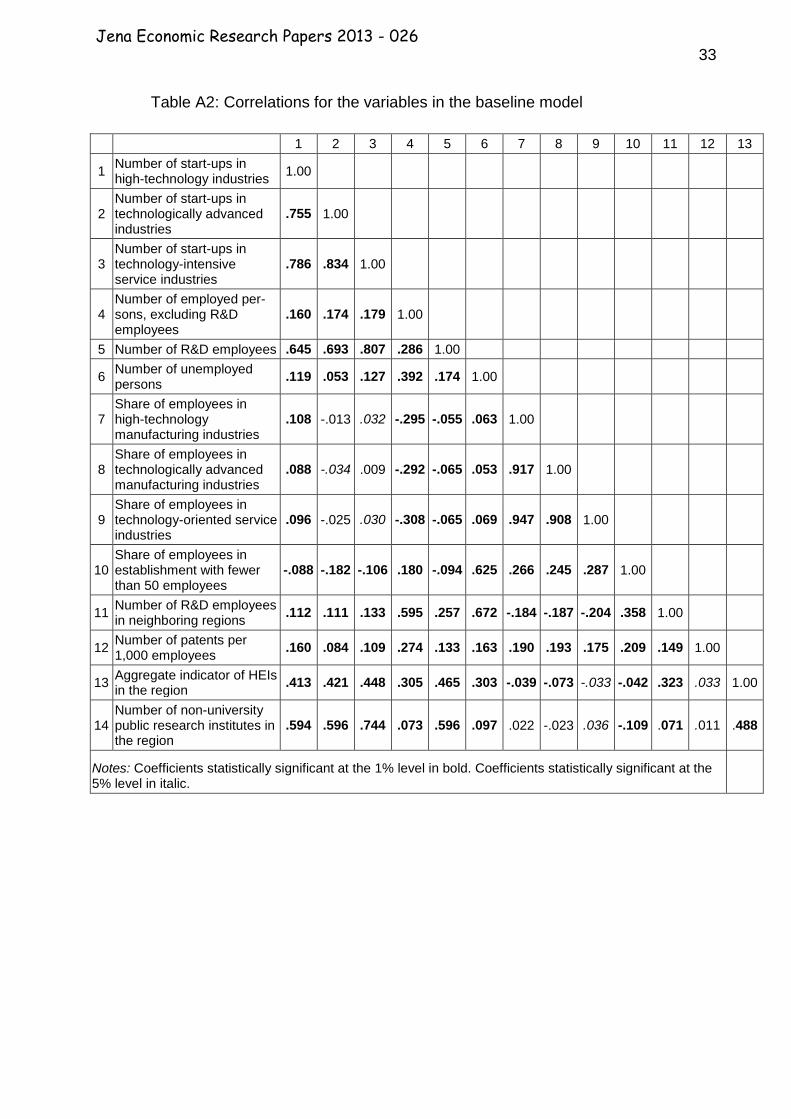
33
Table A2: Correlations for the variables in the baseline model
1 2 3 4 5 6 7 8 9 10 11 12 13
1 Number of start-ups in high-technology industries
1.00
2 Number of start-ups in technologically advanced industries
.755 1.00
3 Number of start-ups in technology-intensive service industries
.786 .834 1.00
4 Number of employed per-sons, excluding R&D employees
.160 .174 .179 1.00
5 Number of R&D employees .645 .693 .807 .286 1.00
6 Number of unemployed persons
.119 .053 .127 .392 .174 1.00
7 Share of employees in high-technology manufacturing industries
.108 -.013 .032 -.295 -.055 .063 1.00
8 Share of employees in technologically advanced manufacturing industries
.088 -.034 .009 -.292 -.065 .053 .917 1.00
9 Share of employees in technology-oriented service industries
.096 -.025 .030 -.308 -.065 .069 .947 .908 1.00
10 Share of employees in establishment with fewer than 50 employees
-.088 -.182 -.106 .180 -.094 .625 .266 .245 .287 1.00
11 Number of R&D employees in neighboring regions
.112 .111 .133 .595 .257 .672 -.184 -.187 -.204 .358 1.00
12 Number of patents per 1,000 employees
.160 .084 .109 .274 .133 .163 .190 .193 .175 .209 .149 1.00
13 Aggregate indicator of HEIs in the region
.413 .421 .448 .305 .465 .303 -.039 -.073 -.033 -.042 .323 .033 1.00
14 Number of non-university public research institutes in the region
.594 .596 .744 .073 .596 .097 .022 -.023 .036 -.109 .071 .011 .488
Notes: Coefficients statistically significant at the 1% level in bold. Coefficients statistically significant at the 5% level in italic.
Jena Economic Research Papers 2013 - 026

34
Table A3: Descriptive statistics for the indicators for universities and other public research institutes
Mean Minimum Maximum Standard deviation
Number of (HEIs) 1.811 0 34 3.285
Number of regular universities 0.425 0 7 .907
Number of Fachhochschulen
0.856 0 27 1.599
Number of other HEIs .422 0 6 .927
Number of students
10,512 9 143,540 18,088
Number of graduates
1,331 1 20,562 2,189
Number of Ph.D. students
305 1 3,038 368.432
Number of professors
222.851 1 2975 333.115
Amount of regular funds (1,000 €) 90,738 1 1,146,295 172,158
Amount of regular funds per professor (1,000 €) 200.73 .091 3782.73 293.53
Amount of external funds (1,000 €) 24,701 3.07 314,651 40883
Amount of external funds per professor (1,000 €)
57.08 0.111 980.49 61.13
Number of non-university public research institutes
0.837 0 26 2.6746
Number of HEIs in adjacent regions 48.96 2 15 24.372
Number of non-university public research institutes in adjacent regions
20.923 0 92 13.010
Source: German University Statistics.
Jena Economic Research Papers 2013 - 026

35
Table A4: Correlations between different indicators for universities and other pubic research institutes in the region
1 2 3 4 5 6 7 8 9 10 11 12 13 14 15 16 17 18 19
1 University (yes=1; no=0) 1.00
2 Number of HEIs (ln) .490 1.00
3 Regular university (yes=1; no=0) .553 .629 1.00
4 Number of regular universities (ln) .216 .699 .391 1.00
5 Fachhochschule (yes=1; no=0) .817 .514 .431 .236 1.00
6 Number of Fachhochschulen (ln) .327 .813 .391 .648 .401 1.00
7 Number of other HEIs .252 .731 .361 .707 .221 .625 1.00
8 Number of students (ln) .728 .621 .542 .347 .638 .439 .366 1.00
9 Number of graduates (ln) .687 .656 .557 .377 .605 .462 .393 .973 1.00
10 Number of Ph.D. students (ln) .351 .710 .671 .546 .288 .505 .511 .667 .705 1.00
11 Number of professors (ln) .652 .673 .586 .409 .613 .486 .403 .956 .954 .741 1.00
12 Amount of regular funds (ln) .579 .745 .632 .446 .467 .502 .455 .776 .792 .759 .817 1.00
13 Amount of external funds (ln) .527 .744 .657 .467 .459 .513 .464 .766 .783 .793 .832 .946 1.00
14 Amount of regular and of external funds (ln)
.532 .743 .646 .459 .461 .512 .461 .764 .780 .782 .828 .954 .994 1.00
15 Amount of regular funds per professor (ln)
.540 .709 .618 .420 .426 .465 .436 .741 .751 .759 .781 .961 .908 .913 1.00
16 Amount of external funds per professor (ln)
.494 .700 .656 .440 .408 .468 .436 .725 .739 .808 .785 .916 .975 .960 .911 1.00
17 Amount of regular and of external funds per professor (ln)
.514 .723 .647 .438 .436 .484 .444 .745 .758 .793 .804 .940 .981 .983 .936 .913 1.00
18 Number of non-university public research institutes (ln)
.079 .395 .171 .474 .125 .451 .451 .181 .196 .325 .222 .207 .228 .221 .206 .211 .216 1.00
19 Number of HEIs in adjacent regions
.142 .232 .010 .172 .159 .220 .191 .187 .183 .147 .181 .103 .093 .092 .108 .081 .090 .042 1.00
20 Number of non-university public research institutes in adjacent regions (ln)
.021 - .001 -.015 -.026 - .001 -.003 .025 -.003 -.008 -.074 -.029 -.043 -.055 -.054 -0.036 -.054 -.053 -0.059 .609
Notes: Coefficients statistically significant at the 1% level in bold. Coefficients statistically significant at the 5% level in italic.
Jena Economic Research Papers 2013 - 026

36
Table A5: The factor representing regional universities—factor loadings and unique variances after varimax rotation
Variable Factor loading
Uniqueness
Number of professors 0.9611 0.0762
Number of students 0.9358 0.1242
Number of graduates 0.9465 0.1041
Number of Ph.D. students 0.7909 0.3745
Amount of regular funds (1,000 €) 0.9116 0.1689
Amount of external funds (1,000 €) 0.9190 0.1554
Variance 0.9330
Cronbach’s alpha 0.9436
Note: All variables are logged.
Jena Economic Research Papers 2013 - 026