Regional petrophysical properties of Mesaverde low ... · Regional petrophysical properties of...
20
Regional petrophysical properties of Mesaverde low-permeability sandstones Regional petrophysical properties of Mesaverde low-permeability sandstones Alan P. Byrnes, KGS John C. Webb, Discovery Robert M. Cluff, Discovery Alan P. Byrnes, KGS John C. Webb, Discovery Robert M. Cluff, Discovery US DOE # DE-FC26-05NT42660 US DOE # DE-FC26-05NT42660 http://www.kgs.ku.edu/mesaverde http://www.kgs.ku.edu/mesaverde
Transcript of Regional petrophysical properties of Mesaverde low ... · Regional petrophysical properties of...

Regional petrophysical properties of Mesaverde low-permeability
sandstones
Regional petrophysical properties of Mesaverde low-permeability
sandstones
Alan P. Byrnes, KGS
John C. Webb, Discovery
Robert M. Cluff, Discovery
Alan P. Byrnes, KGS
John C. Webb, Discovery
Robert M. Cluff, Discovery
US DOE # DE-FC26-05NT42660US DOE # DE-FC26-05NT42660http://www.kgs.ku.edu/mesaverdehttp://www.kgs.ku.edu/mesaverde

US DOE Project Summary• Solicitation DE-PS26-04NT42072-0
– subtopic area 1: Understanding Tight Gas Resources– Award Date: October 1, 2005– Completion Date: June 30, 2008– Contract # DE-FC26-05NT42660
• Organization: University of Kansas, Kansas Geological Survey
• Principal Investigator: Alan P. Byrnes, KGS• KGS-Discovery Group, Inc. co-participants• DOE share $411,030 (80%)• Industry share $102,804 (20%)
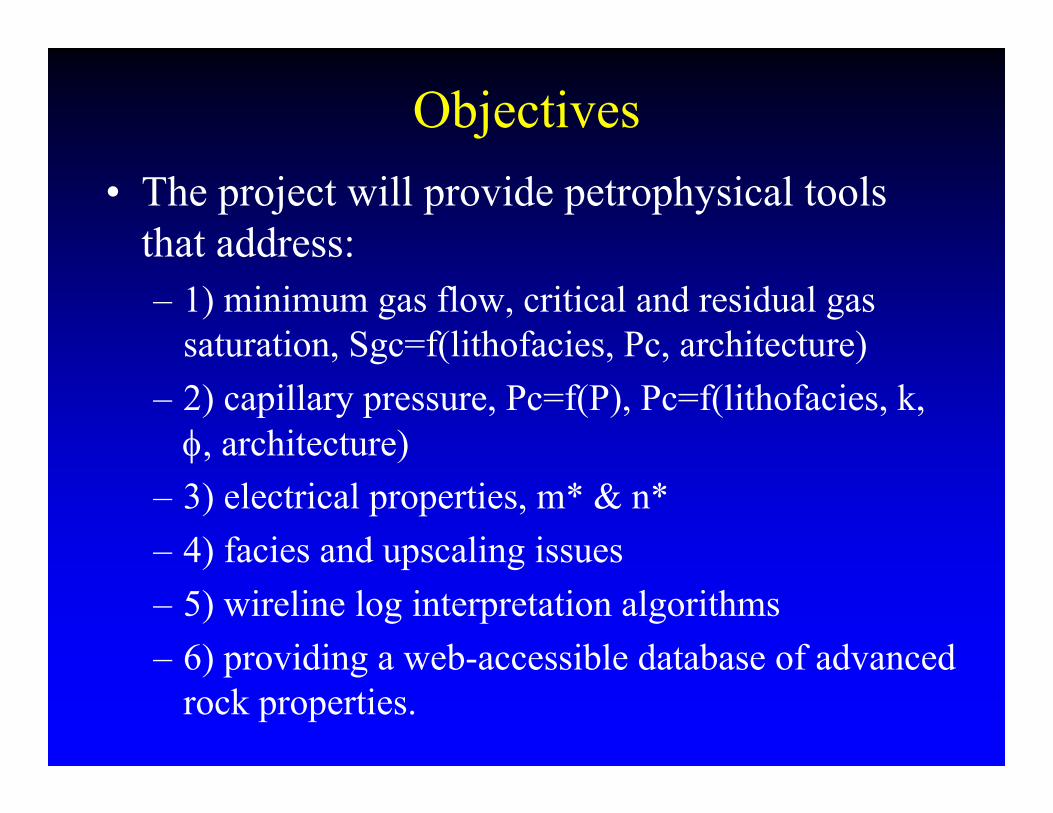
Objectives• The project will provide petrophysical tools
that address: – 1) minimum gas flow, critical and residual gas
saturation, Sgc=f(lithofacies, Pc, architecture)– 2) capillary pressure, Pc=f(P), Pc=f(lithofacies, k,
φ, architecture)– 3) electrical properties, m* & n*– 4) facies and upscaling issues– 5) wireline log interpretation algorithms– 6) providing a web-accessible database of advanced
rock properties.
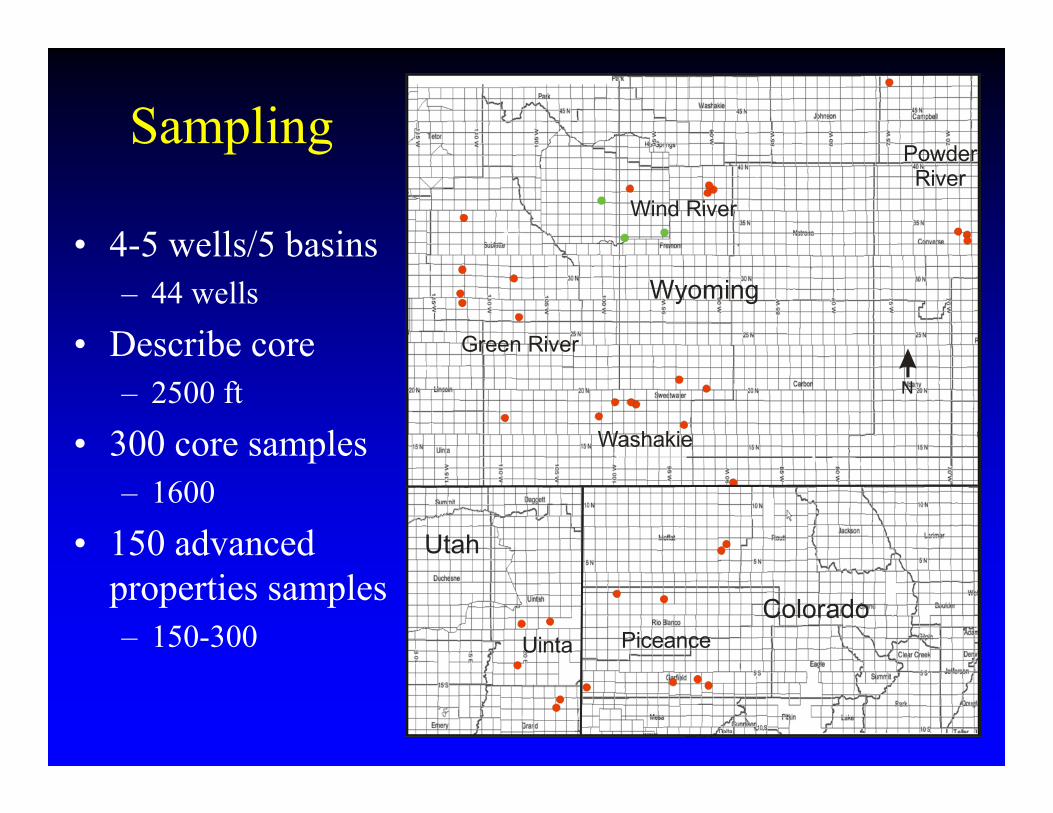
Sampling
• 4-5 wells/5 basins– 44 wells
• Describe core– 2500 ft
• 300 core samples– 1600
• 150 advanced properties samples– 150-300
Green River
Wind River
Washakie
Piceance
PowderRiver
Uinta
Wyoming
Colorado
Utah
N

Digital Core Description
• Sampling designed to sample across all lithofacies
• 5 digit system– basic type (Ss, Ls, coal)– grain size/sorting/texture– consolidation– sedimentary structure– cement mineralogy
• Property continuum not mnemonic
• Provides litholgy log traces and quantitative variables for multivariate analysis

Basic Properties Distributions
• Sampling QA• Distribution is sampling dependent but
interesting• Distribution = f(basin, Lith, M/NM, GRI, etc.)
0
10
20
30
40
50
60
2.58-2.60
2.60-2.62
2.62-2.64
2.64-2.66
2.66-2.68
2.68-2.70
2.70-2.72
2.72-2.74
Grain Density (g/cc)
Perc
ent o
f Bas
in P
opul
atio
n
Green RiverPiceancePowder RiverUintahWind RiverWashakieSand Wash
0
5
10
15
20
25
30
35
40
45
50
1E-7
- 1E
-6
1E-6
- 1E
-5
1E-5
- 1E
-4
0.00
01-0
.001
0.00
1-0.
01
0.01
-0.1
0.1-
1
1-10
10-1
00
100-
1,00
0
In situ Klinkenberg Permeability (mD)
Perc
ent o
f Pop
ulat
ion
(%)
AllGreen RiverPiceancePowder RiverSand WashUintahWind RiverWashakie
mean median stdev ∆φ - 2.65All 2.654 2.652 0.033 0.2Green River 2.645 2.641 0.028 -0.2Piceance 2.663 2.662 0.035 0.7Powder River 2.679 2.674 0.026 1.5Sand Wash 2.633 2.639 0.020 -0.9Uintah 2.646 2.648 0.031 -0.2Washakie 2.662 2.661 0.034 0.6Wind River 2.672 2.673 0.029 1.1
0
5
10
15
20
25
30
35
40
45
0-2
2-4
4-6
6-8
8-10
10-1
2
12-1
4
14-1
6
16-1
8
18-2
0
20-2
2
22-2
4
In situ Porosity (%)
Perc
ent o
f Pop
ulat
ion
(%)
AllGreen RiverPiceancePowder RiverSand WashUintahWind RiverWashakie

1
10
100
1000
100 1000 10000Net Effective Stress (psi)
Pore
Vol
ume
Com
pres
sibi
lity
(10^
6/ps
i)
φ = 24%φ = 21%φ = 18%φ = 15%φ = 12%φ = 8%φ = 6%φ = 4%φ = 2%
Pore Volume Compressibility
0.70
0.75
0.80
0.85
0.90
0.95
1.00
100 1000 10000
Confining Pressure (psi)
Frac
tion
ofPo
rosi
tyat
200
psi
y = 0.013x + 1.08R2 = 0.51
1.0
1.1
1.2
1.3
1.4
1.5
0 2 4 6 8 10 12 14 16 18 20 22 24
Routine Helium Porosity (%)
Pore
Vol
ume
Cha
nge
Inte
rcep
t (1
/psi
)
y = 0.0060x + 0.03R2 = 0.59
0.00
0.05
0.10
0.15
0.20
0.25
0 2 4 6 8 10 12 14 16 18 20 22 24
Routine Helium Porosity (%)
Por
eVo
lum
eC
hang
eSl
ope
(-1/p
si)
• 113 Samples• Log-linear pore volume change
characteristic of fractures/sheet-pores• Slope and intercept change with porosity
β =10^[(0.000031φ2+0.00275φ-1.016)*logP+(0.000034φ3-0.00223φ2+0.056φ+4.238)]
• 113 Samples• Log-linear pore volume change
characteristic of fractures/sheet-pores• Slope and intercept change with porosity
β =10^[(0.000031φ2+0.00275φ-1.016)*logP+(0.000034φ3-0.00223φ2+0.056φ+4.238)]

In situ Klinkenberg Permeability
• b = 0.851 kik-0.34 (atm, Present Study)
• b = 0.867 kliq-0.33 (Jones & Owens)
• b = 0.777 kliq-0.39 (Heid)
0.1
1
10
100
1000
1E-08 1E-07 1E-06 1E-05 0.0001 0.001 0.01 0.1 1 10 100 1000
In situ Klinkenberg Permeability (mD)
Klin
kenb
erg
b fa
ctor
(atm
)
y = -0.0088x3 - 0.0716x2 + 1.3661x - 0.4574R2 = 0.9262
-7
-6
-5
-4
-3
-2
-1
0
1
2
3
-7 -6 -5 -4 -3 -2 -1 0 1 2 3log Routine Air Permeability Ppore = 100 psi (mD)
log
In s
itu K
linke
nber
g Pe
rmea
bilit
y (m
D)
kgas = kliq (1+4c /r) = kliq (1+b/P)
• Generalized = f(Ppore, Lith)• kik = 10^[0.0088 (logkair)3 - 0.072
(logkair)2+ 1.37 logkair +0.46]• kik = 10^[1.34 (logkair) - 0.6] (Byrnes, 1997)
• Statistically similar except for k > 1 mD
Gas
Liquid

Permeability vs Porosity• Generalized trend kik = 10[0.333φi-5] with 10X error• Different k-φ trends among basins due to lithologic variation• Beyond common k↑ with grain size↑, lithologic influence changes with porosity - nonlinear
0.000001
0.00001
0.0001
0.001
0.01
0.1
1
10
100
1000
0 2 4 6 8 10 12 14 16 18 20 22 24Calculated In situ Porosity (%)
In s
itu K
linke
nber
g Pe
rmea
bilit
y (m
D)
Green RiverPiceancePowder RiverUintaWind RiverWashakie

Permeability vs Porosity• logkik = 0.282φi + 0.18RC2- 5.13
(+4.5X MLRA)• logkik = 0.034φi
2-0.00109φi3 +
0.0032RC2 - 4.13 (+4.1X MNLRA)
• Neural Network +3.3X
0.00001
0.0001
0.001
0.01
0.1
1
10
100
1000
0.00001 0.0001 0.001 0.01 0.1 1 10 100 1000
Measured in situ Klinkenberg Permeability (mD)
Pred
icte
d in
situ
Klin
kenb
erg
Perm
eabi
lity
(mD
)
hidden layer: 1Hidden layer nodes: 10
Mean> 8.239 4.280 6.294 hidden layer-Std Dev> 5.260 1.335 2.527 to-output
weightsNode Constant Phii RC2 RC4Constant -0.388
1 -0.760 2.946 -2.027 -6.438 -0.8852 -2.155 4.637 1.279 0.895 2.3233 -4.999 7.901 0.957 3.167 -2.5834 -1.484 -0.307 -1.695 6.175 -0.1545 -4.597 4.582 1.568 0.730 4.0226 -2.609 0.320 -2.201 -2.257 -2.4957 -1.765 -1.843 -1.122 0.145 -3.8598 2.839 -3.146 -9.237 0.264 0.7899 -1.566 1.029 -1.588 -3.390 2.400
10 2.951 0.778 3.316 0.179 -2.136
Input-to-hidden layer weights
0.0000001
0.000001
0.00001
0.0001
0.001
0.01
0.1
1
10
100
1000
0 2 4 6 8 10 12 14 16 18 20 22 24Calculated in situ Porosity (%)
in s
itu K
linke
nber
g Pe
rmea
bilit
y (m
D)
1XX9X1XX8X1XX7X1XX6X1XX5X1XX4X1XX3X1XX2X1XX1X1XX0X
0.0000001
0.000001
0.00001
0.0001
0.001
0.01
0.1
1
10
100
1000
0 2 4 6 8 10 12 14 16 18 20 22 24Calculated In situ Porosity (%)
in s
itu K
linke
nber
g Pe
rmea
bilit
y (m
D)
19XXX18XXX17XXX16XXX15XXX14XXX13XXX12XXX11XXX

Capillary Pressure under Pressure
1
10
100
1000
10000
0 10 20 30 40 50 60 70 80 90 100Wetting Phase Saturation (%)
Air
-Hg
Cap
illar
yPr
essu
re(p
sia)
R091255.9 ftk = 113 mD
= 24.5%φ
1
10
100
1000
10000
0 10 20 30 40 50 60 70 80 90 100Wetting Phase Saturation (%)
Air-
Hg
Cap
illar
yPr
essu
re(p
sia)
LD43C4013.25 ftk = 0.190 mD
= 12.9%φ
1
10
100
1000
10000
0 10 20 30 40 50 60 70 80 90 100Wetting Phase Saturation (%)
Air
-Hg
Capi
llary
Pres
sure
(psi
a)
PA4244606.5 ftk = 0.00107 mD
= 12.7%φ
1
10
100
1000
10000
0 10 20 30 40 50 60 70 80 90 100Wetting Phase Saturation (%)
Air-
Hg
Cap
illar
yP
ress
ure
(psi
a)R7802729.9 ftk = 7.96 mD
= 19.2%φ
1
10
100
1000
10000
0 10 20 30 40 50 60 70 80 90 100Wetting Phase Saturation (%)
Air
-Hg
Capi
llary
Pres
sure
(psi
a)
B02913672.5 ftk = 0.000065 mD
= 2.6%φ
1
10
100
1000
10000
0 10 20 30 40 50 60 70 80 90 100Wetting Phase Saturation (%)
Air
-Hg
Cap
illar
yPr
essu
re(p
sia)
B02911460.6 ftk = 0.0255 mD
= 4.4%φ
1
10
100
1000
10000
0 10 20 30 40 50 60 70 80 90 100Wetting Phase Saturation (%)
Air-
Hg
Cap
illar
yP
ress
ure
(psi
a)
E9466530.3 ftk = 0.0416 mD
= 9.5%φ
1
10
100
1000
10000
0 10 20 30 40 50 60 70 80 90 100Wetting Phase Saturation (%)
Air
-Hg
Cap
illar
yPr
essu
re(p
sia)
E9466486.4 ftk = 0.637 mD
= 12.2%φ
y = 11.77x0.50
R2 = 0.77
y = 11.28x0.50
R2 = 0.93
0.01
0.1
1
10
100
1E-06 0.00001 0.0001 0.001 0.01 0.1 1 10 100
Klinkenberg Permeability/Porosity (mD/%)
Thre
shol
dEn
tryPo
reDi
amet
er( µ
m)
y = 18.19x-0.50
R2 = 0.77
y = 18.94x-0.50
R2 = 0.93
1
10
100
1000
10000
1E-06 0.00001 0.0001 0.001 0.01 0.1 1 10 100
Klinkenberg Permeability/Porosity (mD/%)
Air-
Mer
cury
Thre
shol
dE
ntry
Pre
ssur
e(p
si)
y = 6.48x-0.50
R2 = 0.77
y = 6.75x-0.50
R2 = 0.93
1
10
100
1000
10000
1E-06 1E-05 0.0001 0.001 0.01 0.1 1 10 100
Klinkenberg Permeability/Porosity (mD/%)
Thre
shol
dEn
tryG
asCo
lum
nHe
ight
(ft)
A
B
C
113 mD 8 mD
0.6 mD 0.2 mD
0.04 mD 0.02 mD
0.001 mD 0.00007 mD

Capillary PressurePore Size Distribution (PSD)
• PSD expressed by Pcslope• Pcslope = f(k)• Pcslope ↑ with P ↑
0
1
2
3
4
5
6
7
8
9
0 10 20 30 40 50 60 70 80 90 100
Wetting Phase Saturation (%)
Leve
rett
J Fu
nctio
n
0.00025md0.00049md0.0012md0.0017md0.0018md0.0030md0.0040md0.0057md0.0085md0.012md0.013md0.032md0.046md0.085md0.25md0.41md0.56md0.84md2.24md
0
1
2
3
4
5
1E-06 0.00001 0.0001 0.001 0.01 0.1 1 10 100 1000
In situ Klinkenberg Permeability (mD)
Bro
oks-
Cor
ey C
apill
ary
Pres
sure
Slo
pe
unconfinedin situ
Leverett J(Sw) = Pc (k/φ)0.5/τcosθ
Poor fit becausePcslope ≠ C = f(k)

Residual Gas Saturation
0.0
0.1
0.2
0.3
0.4
0.5
0.6
0.7
0.8
0.9
1.0
0.0 0.1 0.2 0.3 0.4 0.5 0.6 0.7 0.8 0.9 1.0Initial Nonwetting Phase Saturation (Snwi)
Res
idua
l Non
wet
ting
Phas
e Sa
tura
tion
(Snw
r) unconfinedconfinedLand C=0.66, Swi=0
Land C =0.54, Swi=0
1
10
100
1000
10000
0 10 20 30 40 50 60 70 80 90 100
Wetting Phase Saturation (%)
Air-
Hg
Cap
illar
yP
ress
ure
(psi
a)Primary DrainageFirst ImbibitionSecondary DrainageSecond ImbibitionTertiary DrainageThird Imbibition
E393 7001.1ft = 17.4% = 28.9 mD
φ
kik
1
10
100
1000
10000
0 10 20 30 40 50 60 70 80 90 100Wetting Phase Saturation (%)
Air-
Hg
Cap
illar
yP
ress
ure
(psi
a)
Primary DrainagePrimary ImbibitionSecond DrainageSecond ImbibitionThird DrainageThird Imbibition
B049 9072.1 ft (A) = 12.3% = 6.74 mD
φ
kik
1
10
100
1000
10000
0 10 20 30 40 50 60 70 80 90 100Wetting Phase Saturation (%)
Air-
Hg
Cap
illar
yPr
essu
re(p
sia)
Primary DrainagePrimary ImbibitionSecond DrainageSecond ImbibitionThird DrainageThird Imbibition
E393 7027.2 ft = 15.0% = 1.93 mD
φ
kik
1
10
100
1000
10000
0 10 20 30 40 50 60 70 80 90 100Wetting Phase Saturation (%)
Air
-Hg
Cap
illar
yP
ress
ure
(psi
a)
Primary DrainagePrimary ImbibitionSecond DrainageSecond ImbibitionThird DrainageThird Imbibition
R829 5618.3 ft (B) = 9.2% = 0.287 mD
φ
kik
1
10
100
1000
10000
0 10 20 30 40 50 60 70 80 90 100Wetting Phase Saturation (%)
Air
-Hg
Cap
illar
yP
ress
ure
(psi
a)
Primary DrainagePrimary ImbibitionSecond DrainageSecond ImbibitionThird DrainageThird Imbibition
B646 8294.4 ft (B) = 7.6% = 0.022 mD
φ
kik
1
10
100
1000
10000
0 10 20 30 40 50 60 70 80 90 100Wetting Phase Saturation (%)
Air
-Hg
Cap
illar
yP
ress
ure
(psi
a)
Primary DrainagePrimary ImbibitionSecond DrainageSecond ImbibitionThird DrainageThird Imbibition
S685 6991.2 ft (B) = 8.6% = 0.0063 mD
φ
kik
1
10
100
1000
10000
0 10 20 30 40 50 60 70 80 90 100Wetting Phase Saturation (%)
Air-
Hg
Cap
illar
yPr
essu
re(p
sia)
Primary DrainagePrimary ImbibitionSecond DrainageSecond ImbibitionThird DrainageThird Imbibition
E458 6404.8 ft (A) = 9.5% = 0.0019 mD
φ
kik
1
10
100
1000
10000
0 10 20 30 40 50 60 70 80 90 100Wetting Phase Saturation (%)
Air
-Hg
Cap
illar
yPr
essu
re(p
sia)
Primary DrainagePrimary ImbibitionSecond DrainageSecond ImbibitionThird DrainageThird Imbibition
KM360 8185.7 ft (B) = 5.9% = 0.00070 mD
φ
kik
C = 1/Snwr-1/SnwiSnwr = 1/[C + 1/Snwi]C = 0.55 (min ε)
C = 1/Snwr-1/SnwiSnwr = 1/[C + 1/Snwi]C = 0.55 (min ε)

Critical Gas Saturation
• Experimental work indicates Sgc < 10% often < 5% but krgcurves extrapolate to 35% < Sgc < 0%
• Issues– little krg data at Sw >
65%– Does p vary or Sgc vary
or both?
Sgc?
0.0001
0.001
0.01
0.1
1
0.0 0.1 0.2 0.3 0.4 0.5 0.6 0.7 0.8 0.9 1.0
Water Saturation (fraction)
Rel
ativ
e Pe
rmea
bilit
y (f
ract
ion)
g-10 mdw -10 mdg-1 mdw -1 mdg-0.1 mdw -0.1 mdg-0.01 mdw -0.01 mdg-0.001 mdw -0.001 md
0.00001
0.0001
0.001
0.01
0.1
1
0 10 20 30 40 50 60 70 80 90 100Water Saturation
Gas
Rel
ativ
e Pe
rmea
bilit
y

Critical NonwettingPhase Saturation
• Electrical conductivity and Pc inflection indicate 0% < Sgc < 22%
• Higher Sgc in complex bedding lithofacies
0.00
0.02
0.04
0.06
0.08
0.10
0.12
0.14
0.16
0.18
0.20
0.22
0.00001 0.0001 0.001 0.01 0.1 1 10 100 1000
In situ Klinkenberg Permeability (mD)
Crit
ical
Non
-wet
ting
Phas
e Sa
tura
tion
MICP-inflectionElectrical Resistance High Pressure Vessel
Oil Hgpositive
displacementpump
Hg
Highpressure
oilpump
Core
316 SSend caps
Rubbersleeve
VoltmeterV∆
Vacuum

Sgc and Percolation
• Experimental results can be explained using four pore network architecture models
1) Percolation Network N ( ) - Macroscopically homogeneous, random distribution of bond sizes, e.g., Simple Cubic Network (z=6)
p
2) Parallel Network N
N
( ) preferential orientation of pore sizes or beds of different
networks parallel to the invasion direction.
II
p
Invasion direction
3) Series network N
N
( ) - preferential sample-spanning orientation of pore sizes or beds of different networks perpendicular to the invasion direction.
p
4) Discontinuous series network N
Np
N N
( ) - preferential non-sample-spanning orientation of pore sizes or beds of different networks perpendicular to the invasion direction. Represents continuum between and
d
p.
0
100
200
300
400
500
600
700
800
900
1000
0.0 0.1 0.2 0.3 0.4 0.5 0.6 0.7 0.8 0.9 1.0Water Saturation
Gas
-Wat
erC
apill
ary
Pres
sure
(kPa
)
0.001 md0.1 md
AB
• Sgc (L) = A LD−E (Wilkinson and Willemsen, 1983)
– L is network dimension– A is a numerical constant (for simple cubic network A
= 0.65)– D is the mass fractal dimension of the percolation
cluster (D = 1.89 for 2-D, D = 2.52 for 3-D)– E is the Euclidean dimension (E = 2 for 2-D and E = 3
for 3-D)• As L → ∞ Sgc → 0
– Sgc = 21.5% for L = 10– Sgc = 2.4% for L = 1000– Sgc = 0.8% for L = 10000)

Archie Cementation Exponent
1.0
1.11.21.3
1.41.5
1.61.7
1.81.92.02.1
2.22.32.4
0 0.02 0.04 0.06 0.08 0.1 0.12 0.14 0.16 0.18 0.2 0.22 0.24Porosity (fraction)
Arc
hie
Cem
enta
tion
Expo
nent
(m,A
=1)
• Empirical: m = 0.95 - 9.2φ + 6.35φ0.5
• Dual porosity: m = log[(φ-φ2)mm + φ2m2]/logφ
• φ = bulk porosity• φ2 = fracture or
touching vugporosity
• mm = matrix cementation exponent
• m2 = fracture or touching vugcementation exponent
High: mm = 2.1, φ2 = 0.0005Int: mm = 2.0, φ2 = 0.001Low: mm = 1.8, φ2 = 0.002
m2 = 1
High: mm = 2.1, φ2 = 0.0005Int: mm = 2.0, φ2 = 0.001Low: mm = 1.8, φ2 = 0.002
m2 = 1

Conclusions• Grain density for 2200 samples averages 2.654+0.033 g/cc (+1sd)
with grain density distributions differing slightly among basins. • Klinkenberg b(atm) = 0.851 kik-0.34• log kik = 0.282 φi + 0.18 RC2 - 5.13 (+4.5X,1 sd)• ANN analysis provides prediction within +3.3X• Capillary pressure (Pc) exhibits an log-log linear threshold entry
pressure (Pte) versus kik and kik/φi trend and variable Brooks-Corey slopes.
• Snwr ↑ with Snwi ↑consistent with the Land-type relation: 1/Snwr-1/Snwi = 0.55.
• Critical nonwetting-phase (e.g., gas) saturation is low (Sgc < 0.05) in massive and parallel bedded lithologies but may increase in rocks with more complex bedding Percolation theory provides a tool forpredicting limits..
• Archie cementation exponent (m) decreases with decreasing porosity (?) below approximately 6% and can be generally described by empirical or by a dual- porosity model
• These relationships are still being investigated. • Mesaverde Project website is http://www.kgs.ku.edu/mesaverde