Regional petroleum systems modelling in the Dutch offshore
19
Date Venue/Event A “hot” topic of conversation Presentation courtesy of: Regional petroleum systems modelling in the Dutch offshore Wednesday 20 th November 2019 Dutch Exploration Day David Gardiner 1 , Linda Janssen 2 , Tiago Cunha 1 & Kees van Ojik 2 1 IGI Ltd. 2 EBN B.V.
Transcript of Regional petroleum systems modelling in the Dutch offshore

Date
Venue/Event
A “hot” topic of conversation
Presentation courtesy of:
Regional petroleum systems modelling in the Dutch offshore
Wednesday 20th November2019 Dutch Exploration Day
David Gardiner1, Linda Janssen2,
Tiago Cunha1 & Kees van Ojik21IGI Ltd.
2EBN B.V.
OverviewWhat will we cover?
▪ Overview of petroleum
systems
▪ Source rock richness &
kerogen type
▪ Maturity calibration – getting
an eye into the past
▪ Integrated 3-D petroleum
systems model
▪ Summary
The 57,000 km2 AOI of
the entire Dutch
offshore. Note: the
distribution of gas fields
(source: EBN)N
Petroleum SystemSummary of existing knowledge
Kimmeridge/
Coervorden
shales
PosidoniaAalburg Fm.Sleen Fm.
ZechsteinBundandstein Sst.
Namurian
Visean coals
Shale
Pri
mar
y
Seco
ndar
y
Coal
Carbonate
Source Rocks Reservoir Rocks
Tubbergen Sst.
Zechstein (Z3)
Westphalian
Lwr. & Upr. Graben Fms.
Vlieland Sst.
Miocene-Pleistocene
unconsolidated sst.
Sandstone
CarbonateMain
Secondary
Charge
origin
Westphalian
Posidonia
Tectonic phase
Sudetian
Asturian
Saalian
Hardegsen
E.Cimmerian
M.Cimmerian
L.Cimmerian
Austrian
Subhercynian
Laramide
Pyrenean
Savian
Alp
ine
Var
isca
n
Major/Regional
Minor/Localised
Rotliegend
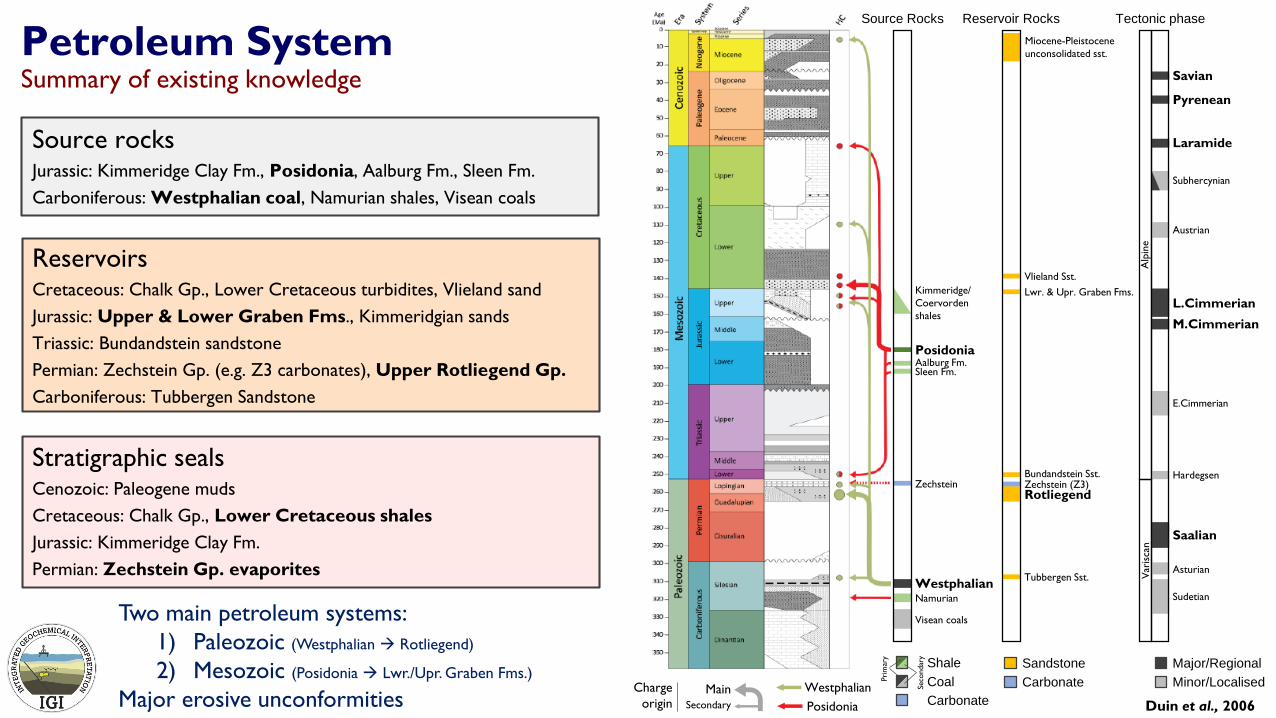
Source rocksJurassic: Kimmeridge Clay Fm., Posidonia, Aalburg Fm., Sleen Fm.
Carboniferous: Westphalian coal, Namurian shales, Visean coals
ReservoirsCretaceous: Chalk Gp., Lower Cretaceous turbidites, Vlieland sand
Jurassic: Upper & Lower Graben Fms., Kimmeridgian sands
Triassic: Bundandstein sandstone
Permian: Zechstein Gp. (e.g. Z3 carbonates), Upper Rotliegend Gp.
Carboniferous: Tubbergen Sandstone
Stratigraphic sealsCenozoic: Paleogene muds
Cretaceous: Chalk Gp., Lower Cretaceous shales
Jurassic: Kimmeridge Clay Fm.
Permian: Zechstein Gp. evaporites
Two main petroleum systems:
1) Paleozoic (Westphalian → Rotliegend)
2) Mesozoic (Posidonia → Lwr./Upr. Graben Fms.)
Major erosive unconformities Duin et al., 2006

Posidonia ShaleSource rock summary
25
25
25
25
25
25 25
2525
50
50
50
500 550 600 650 700
5700
5800
5900
6000
6100
6° 5° 4° 3°
55°
54°
53°
52°
A11-01
A16-01 B18-02
D12-03-S1
E12-02
E18-02
F04-03
F14-01
G17-01
K03-02
K04-03
K13-06
L02-02
L10-06 L11-12
L16-01
M03-01
M08-01
N04-01
P05-01
P10-01
P15-01
P16-01
Q08-01
S05-01
Gross Posidonia Isopach (m) (nlog)
0 20 40 60 80 100
80 km
Gross thickness
Posidonia
absent
Posidonia
absent
Posidonia
absent
0 20 40 60 80 100 120
Gross Posidonia Isopach (m) (nlog)
02
46
810
Fre
quency (
1000)
Mean=29.6339
N=79917
Std=10.933
1-D models
0 1 2 3 4 5 6 7 8 9 10 11 12
TOC (Wt%)
0
5
10
15
20
Fre
qu
en
cy
TOC (wt.%)
Fre
quency
Poor source
Fair source
Good source
Very good source
Location of Posidonia
samples with TOC &
Rock-Eval pyrolysis data
n 124
min 0.4
max 13.9
mean 5.6
TOC
(wt.%)
0 100 200 300 400 500 600 700 800 900 1000
HI (mg/gTOC)
400
410
420
430
440
450
460
470
480
490
500
510
520
T-m
ax (
°C)
Type I kerogen
Type II kerogen
Type III kerogen
Hydrogen Index (HI) (mg/gTOC)
Rock
Eva
l Tm
ax(°
C)
Bi-modal distribution,
relative homogeneity and
mean TOC of 5.6 wt.%
typical of world-class
source rock
Type I kerogen
Type II kerogen
Type III kerogen
TOC (wt.%)
0.0 - 1.0
1.0 - 2.0
2.0 - 4.0
4.0 - 6.0
6.0 - 10.0
10.0 - 15.0
15.0 - 20.0
20.0 - 40.0
40.0 - 100.0
The Posidonia shale
is thin and only
locally present, but
highly organic-rich
and oil-prone
Type II (marine) kerogen
componentType III/IV (terrestrial) kerogen
component

0 100 200 300 400 500 600 700 800 900 1000
HI (mg/gTOC)
400
410
420
430
440
450
460
470
480
490
500
510
520
T-m
ax (
°C)
Type I kerogen
Type II kerogen
Type III kerogen 500 550 600 650 700
5700
5800
5900
6000
6100
6° 5° 4° 3°
55°
54°
53°
52°
A11-01
A16-01 B18-02
D12-03-S1
E12-02
E18-02
F04-03
F14-01
G17-01
K03-02
K04-03
K13-06
L02-02
L10-06 L11-12
L16-01
M03-01
M08-01
N04-01
P05-01
P10-01
P15-01
P16-01
Q08-01
S05-01
Westphalian (10%) isopach (m)
0 50 100 150 200 250
80 km
0 10 20 30 40 50 60 70 80 90
TOC (Wt%)
0
25
50
75
100
125
150
175
200
Fre
qu
en
cy
Westphalian coals (Limburg Gp)Source rock summary
Net thickness
(10% N:G assumed)
1-D models
TOC (wt.%)
Fre
quency
Poor source
Rich shales
Oil shales
Coals
Location of Limburg Gp
samples with TOC &
Rock-Eval pyrolysis data
n 476
min 0.0
max 82.8
mean 8.2
TOC
(wt.%)
Hydrogen Index (HI) (mg/gTOC)
Rock
Eva
l Tm
ax(°
C)
Highly heterogeneous
clastic system with coals
(regionally) and organic-
rich shales (locally in ADB
& CBH)
Type I kerogen
Type II kerogen
Type III kerogen
TOC (wt.%)
0.0 - 1.0
1.0 - 2.0
2.0 - 4.0
4.0 - 6.0
6.0 - 10.0
10.0 - 15.0
15.0 - 20.0
20.0 - 40.0
40.0 - 100.0
The Westphalian is
thick and regionally
extensive, with
mainly gas-prone,
terrestrial kerogen
Some higher HI
samples in ADB & CBH(local oil-prone, marine
shales?)
Type III/IV (terrestrial) kerogen
component
Westphalian absent
0 100 200 300 400 500 600
Westphalian (20%) isopach (m)
040
80
120
160
200
240
Fre
quency (
1000)
Mean=208.724
N=901912
Std=150.34

Summary of source rocks offshoreTornado plot
0 2 4 6 8 10 12 14
U.North Sea Gp.
M.North Sea Gp.
L.North Sea Gp.
North Sea Gp. (all)
Chalk Gp.
Rijnland Gp.
Schieland Gp.
Scruff Gp.
Altena Gp.*
*not including Aalburg & Posidonia samples
Posidonia Fm.
Aalburg Fm.
U.Germanic Gp.
L.Germanic Gp.
Zechstein Gp.
U.Rotliegend Gp.
Limburg Gp.
Farne Gp.
Carb. Limestone Gp.
Banjaard Gp.
Hydrogen Index (HI) (mg/gTOC) Total Organic Carbon (TOC) (wt.%)
1.9 (σ = 3.0)
1.5 (σ = 0.5)
0.7 (σ = 0.1)
1.3 (σ = 2.1)
0.9 (σ = 1.8)
0.8 (σ = 1.2)
1.8 (σ = 3.2)
1.8 (σ = 0.9)
0.9 (σ = 0.7)
0.9 (σ = 2.1)
2.2 (σ = 5.6)
0.6 (σ = 1.0)
1.3 (σ = 1.1)
0.6 (σ = 0.4)
0.6 (σ = 0.3)
7.0 (σ = 12.1)
5.6 (σ = 3.4)
1.7 (σ = 0.9)
8.2 (σ = 13.4)
Poor source
Fair source
Good sourceVery good source
Oil shale
Inert
Gas-prone
Oil/Gas-proneOil-prone
0 4 8 12 16 20 22
Rock-Eval S2 (kg/t)(“Pyrolysate yield”)
0100200300400500600
121 (σ = 116)
124 (σ = 38)
100 (σ = 38)
118 (σ = 85)
284 (σ = 334)
173 (σ = 206)
129 (σ = 70)
167 (σ = 134)
113 (σ = 80)
376 (σ = 210)
164 (σ = 86)
127 (σ = 68)
206 (σ = 165)
268 (σ = 197)
312 (σ = 252)
130 (σ = 151)
60 (σ = 29)
63 (σ = 36)
22 (σ = 12)Values represent mean values,
ranges reflect the addition of 1SD
The Toarcian Posidonia shales and Pennsylvanian Limburg Gp. coals represent the best source rocks in the Dutch offshore,
although localized potential exists in other units (e.g. Zechstein, Kupferschiefer & Lwr. Cretaceous shales of the Schieland Gp.)

1.0
Vitrinite Reflectance (%Ro)
0
1000
2000
3000
4000
5000
Base-D
ep
th (
m)
Surface intercept at 0.18%Ro
MaturityVitrinite reflectance vs. depth trends
1.0
Vitrinite Reflectance (%Ro)
0
1000
2000
3000
4000
5000
Base-D
ep
th (
m)
Surface intercept at 0.18%RoK03-02
1.0
Vitrinite Reflectance (%Ro)
0
1000
2000
3000
4000
5000
Base-D
ep
th (
m)
Surface intercept at 0.18%RoA16-01 P16-01
500 550 600 650 700
5700
5800
5900
6000
6100
6° 5° 4° 3°
55°
54°
53°
52°
T.Westphalian (m)2000 4000 6000 8000 10000
P16-01
K03-02
A16-01Early oil
Mid oil
Mid gas
Late gas
Immature Late oil/Early gas
Maturity equivalences (background)
CGMW Chronostrat
Cenozoic
Pleistocene
Pliocene
Miocene
Oligocene
Eocene
Paleocene
Upper Cretaceous
Lower Cretaceous
Jurassic
Upper Jurassic
Middle Jurassic
Lower Jurassic
Upper Triassic
Middle Triassic
Lower Triassic
Lopingian
Cisuralian
Pennsylvanian
Mississippian
Devonian
<Un-named item>
CGMW Chronostrat
Cenozoic
Pleistocene
Pliocene
Miocene
Oligocene
Eocene
Paleocene
Upper Cretaceous
Lower Cretaceous
Jurassic
Upper Jurassic
Middle Jurassic
Lower Jurassic
Upper Triassic
Middle Triassic
Lower Triassic
Lopingian
Cisuralian
Pennsylvanian
Mississippian
Devonian
<Un-named item>
CGMW Chronostrat
Cenozoic
Pleistocene
Pliocene
Miocene
Oligocene
Eocene
Paleocene
Upper Cretaceous
Lower Cretaceous
Jurassic
Upper Jurassic
Middle Jurassic
Lower Jurassic
Upper Triassic
Middle Triassic
Lower Triassic
Lopingian
Cisuralian
Pennsylvanian
Mississippian
Devonian
<Un-named item>
Vitrinite reflectance (%Ro)
Depth
(T
VD
SS)
Vitrinite reflectance (%Ro)
VR provenance
Indigenous
Non-indigenous
Saalian U/C (Variscan)
Cimmerian U/C
Saalian U/C (Variscan)
Cimmerian U/C
Laramide U/C
Pyrenean/Savian U/C Pyrenean/Savian U/C
Laramide U/C
Saalian U/C (Variscan)
Implied
Carboniferous
geothermal
gradient of 120
°C/km
Implied
Carboniferous
geothermal
gradient of 60
°C/km
Implied
Carboniferous
geothermal
gradient of 80
°C/km
Present day geothermal
gradients average 34.5 °C/km
in the Dutch offshore

MaturityVitrinite reflectance vs. depth trends
Scenario 1: Constant Basal HF through time, no Saalian/Cimmerian erosion
Present geothermal gradient: 33.0 °C/km
Present day surface heat flow: 56.0 mW/m2
Peak palaeo basal heat flow: 56.0 mW/m2 (constant)
Good calibration to temperature, poor to vitrinite reflectance
Geologically unrealistic (no erosion at unconformities and constant HF)
Paleozoic maturity gradient not captured
Vitrinite reflectance (%Ro)
Depth
(T
VD
SS)
Temperature (°C) Time (Ma)
Depth
(T
VD
SS)
Bas
al h
eat
flo
w (
mW
/m2)

MaturityVitrinite reflectance vs. depth trends
Scenario 2: Constant Basal HF through time with 2,500 m Saalian erosion
Present geothermal gradient: 33.0 °C/km
Present day surface heat flow: 56.0 mW/m2
Peak palaeo basal heat flow: 56.0 mW/m2 (constant)
Good calibration to temperature, mod. to vitrinite reflectance
Geologically unrealistic, Saalian U/C erosion too large
Paleozoic maturity gradient not captured
Vitrinite reflectance (%Ro)
Depth
(T
VD
SS)
Temperature (°C) Time (Ma)
Depth
(T
VD
SS)
Bas
al h
eat
flo
w (
mW
/m2)

MaturityVitrinite reflectance vs. depth trends
Scenario 3: Constant Basal HF through time with 3,100 m Cimmerian erosion
Present geothermal gradient: 33.0 °C/km
Present day surface heat flow: 56.0 mW/m2
Peak palaeo basal heat flow: 56.0 mW/m2 (constant)
Good calibration to temperature, mod. to vitrinite reflectance
Geologically unrealistic, Cimmerian U/C erosion too large
Paleozoic maturity gradient not captured
Vitrinite reflectance (%Ro)
Depth
(T
VD
SS)
Temperature (°C) Time (Ma)
Depth
(T
VD
SS)
Bas
al h
eat
flo
w (
mW
/m2)

MaturityVitrinite reflectance vs. depth trends
Scenario 4: High Permo-Carboniferous heat flow and moderate erosion
Good calibration to temperature and vitrinite reflectance
Includes erosion at both Cimmerian (500 m) and Saalian (900 m) U/C
Only moderate erosion magnitudes required
High palaeo-heat flow required (mantle plume?)
Present geothermal gradient: 32.8 °C/km
Present day surface heat flow: 55.8 mW/m2
Peak palaeo basal heat flow: 111 mW/m2 (295 Ma)
Vitrinite reflectance (%Ro)
Depth
(T
VD
SS)
Temperature (°C) Time (Ma)
Depth
(T
VD
SS)
Bas
al h
eat
flo
w (
mW
/m2)

Palaeozoic Heat “Pulse”Mantle plume, adiabatic melting or rift development?
AOI
Although a mantle plume has been inferred in some
studies (e.g. Bonté et al., 2019), several aspects are not
fully consistent:
▪ The lack of a clear, age-progressive
volcanic track
▪ Pre-magmatic subsidence and not uplift
▪ The absence of a large igneous province
▪ Low to moderate values of 3He/4He
Overview of the distribution of late Carboniferous to early Permian
igneous material in the North Sea from Heeremans et al. (2004)
Between the uppermost Carboniferous and early
Permian, widespread igneous activity is observed
throughout the southern North Sea, including the
Dutch offshore and southern Norway. Calc-alkaline to
tholeiitic intrusions have been radiometrically dated to
ca.300 – 280 Ma (Wilson et al., 2004).
Melting was probably induced by local decompression
and thinning of lithosphere in response to regional
stretching north of the Variscan front, although the
PREMA affinity implies that involvement of a mantle
plume cannot be discarded (van Bergen & Sissingh,
2007).

Grid-based 3-D ModelStructural construction in Trinity T3
Distance along strike (km)
Depth
(km
)
0 50 100 150 200 250 300
Distance in meters (1000)
0
2
4
6
8
10
12
Depth
in m
ete
rs (
1000)
A11-01 A16-01 F04-03 F14-01 L02-02 N04-01
Bathymetry Offshore (m)
Base Upper North Sea
Base North Sea Super Gp
Base Chalk Gp
Base Rijnland Gp
Base Schieland Gp
Base Posidonia Fm/Top Aalburg
Base Altena Gp
Base Upper Germanic Trias Gp
Base Low er Germanic Trias Gp_2
Base Zechstein Gp
Saalian U/C (Top Westphalian)
T.Westphalian (m)
Base Westphalian (T.Namurian) (m)
Base Namurian
Base Elleboog Fm
Base Dinantian
B(North west)
B’(East)
Vertical exaggeration: 5 x
0 50 100 150 200 250 300 350 400
Distance in meters (1000)
0
2
4
6
8
10
12
14
Depth
in m
ete
rs (
1000)
B18-02E12-02E18-02 F04-03K03-02L10-06L16-01P05-01P10-01P16-01S05-01
Bathymetry Offshore (m)
Base Upper North Sea
Base North Sea Super Gp
Base Chalk Gp
Base Rijnland Gp
Base Schieland Gp
Base Posidonia Fm/Top Aalburg
Base Altena Gp
Base Upper Germanic Trias Gp
Base Low er Germanic Trias Gp_2
Base Zechstein Gp
Saalian U/C (Top Westphalian)
T.Westphalian (m)
Base Westphalian (T.Namurian) (m)
Base Namurian
Base Elleboog Fm
Base Dinantian
Depth
(km
)
A(South)
Colored by simplified chronostratigraphy Vertical exaggeration: 6.5 x
A’(North)
500 550 600 650 700
5700
5800
5900
6000
6100
6° 5° 4° 3°
55°
54°
53°
52°
A11-01
A16-01 B18-02
D12-03-S1
E12-02
E18-02
F04-03
F14-01
G17-01
K03-02
K04-03
K13-06
L02-02
L10-06 L11-12
L16-01
M03-01
M08-01
N04-01
P05-01
P10-01
P15-01
P16-01
Q08-01
S05-01
T.Westphalian (m)2000 4000 6000 8000 10000
80 km
A
A’
B
B’
0 50 100 150 200 250 300
Distance in meters (1000)
0
2
4
6
8
10
12
Depth
in m
ete
rs (
1000)
A11-01 A16-01 F04-03 F14-01 L02-02 N04-01
Bathymetry Offshore (m)
Base Upper North Sea
Base North Sea Super Gp
Base Chalk Gp
Base Rijnland Gp
Base Schieland Gp
Base Posidonia Fm/Top Aalburg
Base Altena Gp
Base Upper Germanic Trias Gp
Base Low er Germanic Trias Gp
Base Zechstein Gp
Saalian U/C (Top Westphalian)
T.Westphalian (m)
Base Westphalian (T.Namurian) (m)
Base Namurian
Base Elleboog Fm
Base Dinantian
3-D basin model constructed using 19 depth maps (mainly sourced from DGM-deep V3 Offshore, from nlog) across the AOI and
thermally-calibrated to 25 1-D models. No halokinesis has been included on this regional-scale but should be included on the local
1-D models

500 550 600 650 700
5700
5800
5900
6000
6100
6° 5° 4° 3°
55°
54°
53°
52°
A11-01
A16-01 B18-02
D12-03-S1
E12-02
E18-02
F04-03
F14-01
G17-01
K03-02
K04-03
K13-06
L02-02
L10-06 L11-12
L16-01
M03-01
M08-01
N04-01
P05-01
P10-01
P15-01
P16-01
Q08-01
S05-01
Present day Posidonia VR (LLNL) (%Ro)
0.1 0.2 0.5 1 2 4
80 km
Immature (<0.5 %Ro)Early-oil (0.5 – 0.7 %Ro)Mid-oil (0.7 – 1.0 %Ro)Late-oil/Early-gas (1.0 – 1.3 %Ro)Mid-gas (1.3 – 2.2 %Ro)Dry-gas (2.2 – 3.0 %Ro)Over-mature (>3.0 %Ro)
1-D models
500 550 600 650 700
5700
5800
5900
6000
6100
6° 5° 4° 3°
55°
54°
53°
52°
A11-01
A16-01 B18-02
D12-03-S1
E12-02
E18-02
F04-03
F14-01
G17-01
K03-02
K04-03
K13-06
L02-02
L10-06 L11-12
L16-01
M03-01
M08-01
N04-01
P05-01
P10-01
P15-01
P16-01
Q08-01
S05-01
Oil f ields/discoveries
Present day Posidonia TR (Type II kerogen) (%)
0 20 40 60 80 100
80 km
Immature (<5%)Oil generation begins (5 – 10%)Oil generation (10 – 25%)Main oil expulsion (25 – 70%)Oil cracking, gas generation (70 – 85%)Dry gas generation (85 – 95%)Over-mature (>95%)
F03-FB field(small gas kitchen
to the south)
Based on Type II kerogen
1-D models
Posidonia ShaleMaturity (VR & Transformation Ratio)
The Posidonia shale, where present/preserved,
is predicted to be mature for hydrocarbon
generation at present.
There is an excellent agreement between the
known oil fields/discoveries and the oil-mature
Posidonia, strongly suggesting a Lower Jurassic
marine shale is the predominant source of most
of these oil accumulations.
Exploration targeting oil should focus on charge
originating from the identified kitchen fairway,
unless an alternative oil-prone source rock is
present. This may be possible on a local scale,
e.g. Zechstein carbonates or Lower Cretaceous
shales (where mature).

500 550 600 650 700
5700
5800
5900
6000
6100
6° 5° 4° 3°
55°
54°
53°
52°
A11-01
A16-01 B18-02
D12-03-S1
E12-02
E18-02
F04-03
F14-01
G17-01
K03-02
K04-03
K13-06
L02-02
L10-06 L11-12
L16-01
M03-01
M08-01
N04-01
P05-01
P10-01
P15-01
P16-01
Q08-01
S05-01
Gas fields/discoveries
Present day Top Westphalian TR (%)
0 20 40 60 80 100
80 km
500 550 600 650 700
5700
5800
5900
6000
6100
6° 5° 4° 3°
55°
54°
53°
52°
Top Westphalian VR (LLNL) (%Ro)
0.1 0.2 0.5 1 2 4
80 km
Immature (<0.5 %Ro)Early-oil (0.5 – 0.7 %Ro)Mid-oil (0.7 – 1.0 %Ro)Late-oil/Early-gas (1.0 – 1.3 %Ro)Mid-gas (1.3 – 2.2 %Ro)Dry-gas (2.2 – 3.0 %Ro)Over-mature (>3.0 %Ro)
1-D models
Immature (<5%)Oil generation begins (5 – 10%)Oil generation (10 – 25%)Main oil expulsion (25 – 70%)Oil cracking, gas generation (70 – 85%)Dry gas generation (85 – 95%)Over-mature (>95%)
Based on Type III kerogen
1-D models
Top WestphalianMaturity (VR & Transformation Ratio)
The maturity of the upper Westphalian is not
consistent with the distribution of the known
gas fields in large areas of the Dutch offshore,,
namely the Anglo-Dutch Basin, Cleaver Bank
High and Central Offshore Platform, as well as
onshore.
The exceptions are the gas-mature kitchens
areas in the Dutch Central Graben, Broad
Fourteens Basin and West Netherlands Basin,
based on the Transformation Ratio.
However, the Westphalian is very thick in some
areas, notably in the east of the AOI (e.g.
Ameland Block & Terschilling Basin), and so it is
likely that a significantly higher maturity is found
near its base.
Alternatively, much higher amounts of Alpine
erosion could be envisaged, to explain the
widespread generation of dry-gas.
Westphalian absent

500 550 600 650 700
5700
5800
5900
6000
6100
6° 5° 4° 3°
55°
54°
53°
52°
A11-01
A16-01 B18-02
D12-03-S1
E12-02
E18-02
F04-03
F14-01
G17-01
K03-02
K04-03
K13-06
L02-02
L10-06 L11-12
L16-01
M03-01
M08-01
N04-01
P05-01
P10-01
P15-01
P16-01
Q08-01
S05-01
Gas fields/discoveries
Present day Base Westphalian TR (%)
0 20 40 60 80 100
80 km
500 550 600 650 700
5700
5800
5900
6000
6100
6° 5° 4° 3°
55°
54°
53°
52°
Base Westphalian VR (LLNL) (%Ro)
0.1 0.2 0.5 1 2 4
80 km
Immature (<0.5 %Ro)Early-oil (0.5 – 0.7 %Ro)Mid-oil (0.7 – 1.0 %Ro)Late-oil/Early-gas (1.0 – 1.3 %Ro)Mid-gas (1.3 – 2.2 %Ro)Dry-gas (2.2 – 3.0 %Ro)Over-mature (>3.0 %Ro)
1-D models
Immature (<5%)Oil generation begins (5 – 10%)Oil generation (10 – 25%)Main oil expulsion (25 – 70%)Oil cracking, gas generation (70 – 85%)Dry gas generation (85 – 95%)Over-mature (>95%)
Based on Type III kerogen
1-D models
Base WestphalianMaturity (VR & Transformation Ratio)
The Base Westphalian represents the highest
maturity while also providing a proxy for the
maturity of the underlying top Namurian source
rock section.
The maps show a good correlation between the
dry-gas generation window (and above) with
the distribution of gas fields/discoveries.
Westphalian absent

500 550 600 650 700
5700
5800
5900
6000
6100
6° 5° 4° 3°
55°
54°
53°
52°
Gas fields/discoveries
Westphalian Gas Expelled (23-0 Ma) (bcf/km2)
0 100 200 300 400 500 600 700
80 km
1-D models
500 550 600 650 700
5700
5800
5900
6000
6100
6° 5° 4° 3°
55°
54°
53°
52°
Westphalian Gas Expelled (Total) (bcf/km2)
0 200 400 600
80 km
TOC: 35.0 wt.% (uniform)
HI: 150 mg/gTOC (uniform)
Kerogen type: P&C Type D/E (terrestrial wax/resin (coal))
Thickness: Variable, 10% net:gross (isopach, Slide 5)
DCG
BFB
WNB
1-D models1-D models
Based on Type III kerogen
1-D models
Base WestphalianGas ExpulsionGas expulsion is a function of source quality(TOC & kerogen type), thickness (assumed 10%N:G) and maturity.
Here we demonstrate that most gas expulsionhas occurred in the BFB, DCG, COP & WNB,with a strong correlation to known gas fieldsand discoveries.
Geologically-recent gas expulsion, since theMiocene, also correlates to most fields andpredicts gas expulsion in the Ameland Block &Terschilling Basin areas.
Westphalian absent
Total expulsion
TOC: 35.0 wt.% (uniform)
HI: 150 mg/gTOC (uniform)
Kerogen type: P&C Type D/E (terrestrial wax/resin (coal))
Thickness: Variable, 10% net:gross (isopach, Slide 5)
Expulsion since 23 Ma
World-class source rock comparison
High-case
Low-case
Mill
ion b
arre
ls o
il equiv
alent
per
km
2
Eastern
Venezuela
0
50
100
150
200
Alberta Gulf of
Mexico
(Tithonian)
Maracaibo KCF NW
Australia
Westphalian
in AOI
High-case = maximum value predicted
Low-case = mean of predicted dataFrom Zhiyong He
TB
AP
DCG
COP

ConclusionsRegional petroleum systems modelling in the Dutch offshore
A geochemical database containing >10,000 samples has been constructed, containing high-level Rock-Eval and vitrinite
reflectance data. Our interpretation suggests the primary source rocks are the Toarcian Posidonia shales & Pennsylvanian
Westphalian coals.
Multiple erosion events across the Dutch offshore makes interpretation difficult, as VR (and AFTA) data are often
overprinted by subsequent burial. Our best-fit model is broadly consistent with previous authors which suggest Saalian
erosion was limited to 2,000 m (most likely ca. 500 – 1,000 m), while erosion at the Cimmerian unconformities is also
limited to < 1,000 m of erosion.
Mantle upwelling (plume emplacement), associated with magma underplating and/or igneous intrusions contemporaneous
of a transitional tectonic regime (compressive-to-wrenching) resulted in very high palaeo-heat flow (up to 140 mW/m2)
during the uppermost Carboniferous to lower Permian (300 – 280 Ma).
The predicted regions of Posidonia source rock maturity and oil expulsion correlate well with known oil fields/discoveries.
Westphalian source rock maturity, in particular in its lower section, also correlates well with the distribution of known gas
fields/discoveries, and abundant gas expulsion is predicted, continuing into the Miocene and possibly to the present day.
The model presented here also predicts significant gas expulsion in the Ameland Block & Terschilling Basin, where
relatively few discoveries have been made to date.This may be of consideration for future exploration.

Presentation courtesy of:
Regional petroleum systems modelling in the Dutch offshore
Thank you for listening