Regional Mining and Infrastructure Planning project ... · Regional Mining and Infrastructure...
112
Regional Mining and Infrastructure Planning project - Yorke and Mid- North/Braemar Interim report for public consultation Prepared for the South Australian Department of Planning, Transport and Infrastructure and the Commonwealth Department of Infrastructure and Transport
Transcript of Regional Mining and Infrastructure Planning project ... · Regional Mining and Infrastructure...

Regional Mining and
Infrastructure Planning
project - Yorke and Mid-
North/Braemar
Interim report for public consultation
Prepared for the South Australian Department of Planning,
Transport and Infrastructure and the Commonwealth
Department of Infrastructure and Transport


Contents
Glossary 1
Foreword 2
1. Purpose and intent 3
2. Approach 5
3. Regional background 8
4. Regional mining profile 16
5. Existing infrastructure profile 27
6. Future mining demand 38
7. Future infrastructure demands 45
8. Potential infrastructure solutions 50
9. Next steps 79
10. How you can provide feedback 85
References 86
Appendix A -Approach 89
Appendix B – Yorke and Mid-North/Braemar environmental assets 96
Appendix C – Alignment of mines to DMITRE Pipeline 98
Appendix D – Infrastructure assessment benchmarks 100
Appendix E – Commodity price scenarios 102
This interim report is one of three prepared for the Regional Mining and Infrastructure Planning project. As each interim report is intended to be a ‘stand-alone’ document there is some duplication between the three reports, particularly in chapters 1, 2, 9 and 10. If you are planning to read each of the reports, please note that feedback provided on these chapters in one document will be taken to apply to all three.

Glossary 1
Glossary
Term Definition
ARTC Australian Rail Track Corporation
Axle load Weight felt by road or rail surface for all wheels connected to a given axle
Beneficiation Processing of raw ore to increase mineral concentration prior to export
Bulk commodities Commodities shipped unpackaged in large volumes
Concentrate Processed ore with increased mineral concentration
DIRN Defined Interstate Rail Network
DSO Direct Shipping Ore
Easement Right to use land for a specified purpose
GL Gigalitre
GWh Gigawatt Hours
IDS Infrastructure Demand Study
JORC Joint Ore Reserves Committee
kV Kilovolt
MAPS Moomba to Adelaide pipeline system
MCA Multi-Criteria Analysis
Mtpa Million Tonnes per annum
MW Megawatt
Ore A metal bearing mineral or rock
PACE Plan for accelerating exploration
Potable Water of quality to be safe for human consumption
Remnant vegetation Areas of native trees, shrubs and grasses which have not been altered
RESIC Resources and Energy Sector Infrastructure Council
RMIP Regional Mining and Infrastructure Planning
TJ Terajoules
Transmission network Network of high voltage electricity lines and transformer assets

Foreword 2
Foreword
The South Australian Government has invested
heavily to promote mining exploration and
development over the past ten years. This investment
is paying dividends in the form of an increase in
minerals exploration and the number of mines in
production.
The expansion in the mining industry presents a
tremendous opportunity to further economic and
social objectives in South Australia particularly in
regional centres.
The South Australian Government, miners and regional communities are becoming increasingly concerned
about the ability of existing infrastructure to service the future needs of the mining industry.
The South Australian Government commissioned the Regional Mining and Infrastructure Planning (RMIP)
project to consider the infrastructure which is best able to facilitate the development of the mining sector and
articulate the means of delivering this infrastructure. Three plans will be developed, one for each of the
regions in which existing and potential mining operations are concentrated – Eyre & Western, Far North and
Yorke and Mid-North/Braemar. Each of the plans are intended be standalone documents, but will recognise
the interdependencies between the regions.
Funding for the RMIP project has been provided by the Commonwealth Government through the Regional
Infrastructure Fund.
This interim report presents the findings of the RMIP project to date and invites feedback from interested
stakeholders. Feedback from stakeholders on this document will inform a detailed assessment process will be
undertaken to develop a list of priority infrastructure projects. This process will prioritise projects based on:
Efficiency of delivery (strategic importance to multiple mines)
Ability to facilitate growth in the mining and minerals processing industries
Contribution to economic prosperity
Regional and community impact (positive and negative)
Environmental benefits/costs
All those with an interest in the RMIP project are invited to review the findings of this interim report and
provide feedback to inform the development of the three final plans. In particular, feedback from communities
and groups with interests in the regions on the ‘grass roots’ environmental and social implications of growth in
the mining sector and the infrastructure proposals identified in this report is critical and will provide an
important input to the prioritisation of solutions in the final plan.

Purpose and intent 3
1. Purpose and intent
Purpose and intent of the Regional Mining and Infrastructure Planning project
The Regional Mining and Infrastructure Planning (RMIP) project has been tasked with articulating a plan for
the delivery of infrastructure to support the development of mining in South Australia.
The objective of the RMIP project is to identify infrastructure solutions that maximise the net benefits to South
Australia by improving connectivity from existing mines and reducing infrastructure related risks for new
mines.
The RMIP project will deliver a roadmap, including the respective role of governments and the private sector
in facilitating the delivery of long-term infrastructure solutions which are sensitive to the diverse economic,
social and environmental requirements of all stakeholders in each of the regions.
This interim report identifies the infrastructure requirements to support further development of existing mines
and new mines located within the Yorke and Mid-North/Braemar Region. This infrastructure is generally
located in the Yorke and Mid-North/Braemar or it may be located in one of the adjacent regions, where there
is better connectivity to support mine development. RMIP interim reports are being developed concurrently for
the Eyre and Western and Far North regions which provide an integrated approach to planning of mining
developments across the State.
Previous work undertaken
The Resources and Energy Sector Infrastructure Council (RESIC) commissioned the 2011 Infrastructure
Demand Study (IDS) which surveyed resource and energy project proponents in South Australia to develop a
dataset of mining proponents’ expectations for future infrastructure requirements for their projects.
The RESIC commissioned study collated proponents’ infrastructure requirements in the event projects
proceeded. The study assigned weights based on the likelihood projects would proceed, however this was not
based on forecast economic conditions. The RESIC study identified a project weighted outbound resource
task of 120 million tonnes per annum from 2017 and beyond.
Building upon the findings of the RESIC study, further information gathering from prospective miners and
infrastructure proponents, industry experts and economic forecasts, the RMIP project has assessed the future
infrastructure requirements of mining in South Australia. The assessment in this project considers the drivers
and impediments to mining project development to develop realistic mining infrastructure demand scenarios,
underpinned by key macroeconomic drivers.
The South Australian Government’s response to the RESIC IDS noted two actions which are to be included in
the RMIP project:
Consider the infrastructure requirements of the sector, including progressing the corridor and utility hub
concepts. This will help planners and the private sector to determine their location, purpose and function
Investigate the need for and location of capesize port capability.

Purpose and intent 4
Purpose and intent of this interim report
The purpose and intent of this interim report is to seek broad stakeholder feedback on the identified market
need and analysis, along with the identified possible solutions ahead of detailed prioritisation.
Meaningful consultation is critically important to the ability to deliver plans which are sensitive to the broadest
possible range of stakeholders’ concerns. In developing the interim report as presented in this paper, detailed
discussions have been held with:
Regional Development Australia
All tiers of government
Mining interests
Infrastructure and utilities owners, operators and proponents
Regulators
Implicated industries
Interest groups
Community.
However, for the final plans to meet the intent of the RMIP project they must meet community and industry
needs; this can only be achieved by consulting with regional communities to gain their feedback. This is
particularly important in identifying the practical social and environmental implications of the solutions
identified. This paper will therefore form the foundation on which this next stage of the consultation process
will take place. Feedback from the affected communities will inform the prioritisation of solutions when detailed
in the final RMIP plans.
This interim report presents the findings of our work to date with respect to:
The current state of mining and resultant infrastructure demand
The forecast future state of mining and resultant infrastructure demand
The state of current and committed infrastructure
The gap between forecast infrastructure demand and provision, and
The solutions which have been proposed to meet the forecast infrastructure gap.
Feedback is now sought in relation to four specific questions:
Are the future infrastructure gaps and/or issues adequately identified?
Have all feasible potential infrastructure solutions been identified?
When assessing potential solutions, what are the key issues which should be considered
(e.g. economic, environmental and social implications)?
Are barriers to the development of priority infrastructure solutions government may seek to address
adequately identified?
Are there any other issues in relation to the RMIP project you wish to raise?
Further details of our approach to consultation are provided in section 10 – “How you can provide feedback”.

Approach 5
2. Approach
Introduction
The approach adopted in the development of the RMIP project has been designed to ensure the
comprehensive assessment of current and future infrastructure needs of mining and related industries across
South Australia.
The RMIP project considers the requirements of three interrelated regions and therefore the plans must be
prepared with consideration to each other to avoid duplication of infrastructure solutions. The approach
adopted assessed the various infrastructure solutions and considered the feasibility, cost and delivery
requirements of the infrastructure required.
Mining considered in this plan
There is a significant range of mining
activity in South Australia including iron
ore, copper, uranium, heavy mineral
sands, silver, gold and zinc.
For the purposes of this project the mining
industry is taken to include the exploration
and extraction of minerals with a
significant or potentially significant
demand for freight, water, power and/or
gas infrastructure.
It is recognised that iron ore is the most infrastructure-intensive commodity, in terms of power, water, freight
and other infrastructure and is therefore the primary focus of this project.
Energy projects, including coal, coal to liquids, geothermal, conventional and gas projects, have not been
addressed in this study, however may be referenced from time to time where opportunities or impacts in
relation to mineral projects are identified.
Infrastructure considered in this plan
Infrastructure is a broad term, which refers to the basic physical and organisational structures required for
business and community functions to operate. This includes the network of roads, highways, railways and
ports that underpins the transportation into, out of and within a region, the water and sewage systems that
ensure an adequate supply of clean water as well as the disposal of waste, the power and gas grids that fuel
enterprise, the networks that support communication and commercial exchange between parties and the
structures and institutions that underpin the delivery of social services such as health, education and justice.

Approach 6
The infrastructure requirements of miners are considered from two dimensions; the extraction of the resources
and the transportation of the resources. Subsequently, the infrastructure considered in this plan includes:
Transport and logistics infrastructure, comprising:
− Port facilities for import of goods required by the mine and export of product produced by the mine. This
includes landside port facilities as well as marine facilities
− Freight route infrastructure between the mine site and the port. This comprises road, rail, conveyor
systems and slurry pipelines or a combination of these
Water infrastructure to collect, treat as necessary and transport water to mine sites
Energy infrastructure to produce and/or supply gas and/or electricity to support mine sites processes
as well as processes for transport and water infrastructure above.
Project governance
A Steering Committee comprising government agencies has been established due to the relevance of the
RMIP project
to a range of government functions. The Steering Committee is led by the Department of Planning, Transport
and Infrastructure and includes representatives from:
Department of Manufacturing, Innovation, Trade, Resources and Energy
Department of Primary Industries and Regions South Australia
Department of the Premier and Cabinet
Department of Treasury and Finance
Regional Development Australia
Commonwealth Department of Infrastructure and Transport.
The primary role of the Steering Committee is to ensure that the Government’s objectives on behalf of the
South Australian community are considered in the RMIP project.
Those who have contributed to the development of the interim report
The South Australian Government has established a team of deeply experienced contractors to support the
RMIP project. This team brings a broad range of skills and expertise including:
Minerals extraction and processing
Freight and logistics
Integrated infrastructure planning
Public policy analysis
Regional development
Electricity generation and transmission
Gas transmission
Land transport
Water supply and transmission
Ports and shipping

Approach 7
Cost estimation
Community planning
Economic impact assessment
Environmental assessment.
The contractor team, government, industry and peak bodies have all been involved in planning workshops,
one-on-one consultations and have reviewed detailed analysis of the market forecasts and possible solutions,
all of which inform this interim report.
Methodology
The methodology which will be applied in the development of the RMIP plan for the Yorke and Mid-
North/Braemar Region is summarised in the figure and detailed in Appendix A.
Figure 2.1: Methodology applied for the development of the RMIP plans

Regional background 8
3. Regional background
Mining has the ability to generate benefits for regional centres through its ability to create employment
opportunities and support towns which underpin vibrant communities. The ability of regional communities to
benefit from mining activity will in part be driven by the socio-demographic profile of the people in the region
and in part the ability of the region to attract and support skilled labour.
For context, this chapter provides an overview of the economic activity and demographic characteristics of the
Yorke and Mid-North/Braemar region. The data contained in this chapter will underpin social and economic
modelling undertaken as part of the prioritisation process.
The Yorke and Mid-North/Braemar region
The Yorke and Mid-North/Braemar region covers the Yorke Peninsula and part of the Braemar territory to the
border with New South Wales.
Figure 3.1: Map of South Australian regions

Regional background 9
The Yorke and Mid-North/Braemar region has a combined population of over 72,000. The major towns in the
region include Port Pirie (14,000 residents), Kadina (5,000), Jamestown (4,500) and Clare (3,900). The region
is also a major transportation route, particularly due to the plurality of ports in the region. The regional
economy has several key industries including tourism, agriculture and mining.
Table 3.1: Socio-demographic data for the Yorke and Mid-North region and South Australia
Units South Australia Yorke and Mid-North/ Braemar
Population no. 1,596,572 72,666
Population (0-15 years) % of pop. 18 18
Population (15-64 years) % of pop. 66 60
Population (65 years+) % of pop. 16 22
Population growth (2001-2011) % 9 4
Average wage/salary income* $ 41,896 35,587
Indigenous population % of pop. 2 2
Education and employment
Number of primary and secondary schools no. 785 95
School enrolment no. 258,991 9,320
Population with non-school qualification† % of working age pop. 42 32.5
Unemployment rate % labour force 5.7 5.4
Labour force participation rate % working age pop. 59.9 52.4
Major industries Manufacturing (15%), construction (12%),
retail trade (9%)
Agriculture, forestry and fishing (18%),
health care and social assistance (14%), retail trade (12%)
*RDA regional data. Regions approximately correspond to the study regions as discussed earlier in this report. † This variable describes the level of education of the highest completed non-school qualification (e.g. bachelor degree, diploma)
Sources: ABS Census 2011, SACES 2012, Social Health Atlas. http://www.sahealth.sa.gov.au/wps/wcm/connect/8b527f004ce0d7ba8d2e9da496684d9f/ED+Care+Aust+Health+Stats.pdf?MOD=AJPERES&CACHEID=8b527f004ce0d7ba8d2e9da496684d9f
http://www.education.net.au/browse_category_school.php?facility=school&state=SA&sort=name
Regional Demographics
The population distribution of the Yorke and Mid-North is largely similar to the state average. That said, there
is a larger proportion of people over 65 years in the region, at 22% compared to the state average of 16%.
Figure 3.2: Yorke and Mid-North/Braemar population profile, 2011
Source: ABS Census 2011
0 2000 4000 6000 8000
0-4 years
5-14 years
15-19 years
20-24 years
25-34 years
35-44 years
45-54 years
55-64 years
65-74 years
75-84 years
85 years and over
Females
Males

Regional background 10
Population projections
The table below presents forecasts of the population for the RDA Yorke and Mid-North region, compared to
South Australia. These forecasts refer to the RDA region, which, as described earlier, is a smaller than the
region considered in this study. The region considered in this study incorporates the Yorke and Mid North
RDA are and the Braemar are which extends from the north east of the RDA boundary to the New South
Wales border. Braemar is included in this region because the infrastructure solutions for mines in this area are
likely to impact the Yorke and Mid North RDA area.
It can be seen that population growth in the region over the coming decade is expected to be significantly
lower than in the state more broadly, experiencing only 5.4% growth in the coming decade. This could be due
to the relatively low proportion of 20-24 year olds in the region (4% compared to 7% state wide) and the
higher proportion of people aged over 65.
Table 3.2: RDA population projections
RDA region* 2016 2021 2026 % change 2011-2026
Yorke and Mid-North 77,852 79,179 80,430 5.4%
South Australia 1,770,644 1,856,435 1,935,161 16.1%
*NB these regions approximately correspond to the study regions as discussed earlier in this report.
Source: Department of Planning and Local Government, cited in SA Centre for Economic Studies 2012
Economy
Agriculture is the main industry of employment in the Yorke and Mid-North/Braemar region, accounting for
18% of employment, compared to 5% of employment in South Australia as a whole. Other major industries of
employment in the Yorke and Mid-North/Braemar region are tourism and mining.
In comparison, the major industry of employment in South Australia is manufacturing (15%), followed by
wholesale trade (12%).
The Yorke and Mid-North/Braemar region has a labour force profile that looks similar to South Australia more
broadly. In Yorke and Mid-North/Braemar, full time employment accounts for 55% of the labour force
(compared to 57% in SA) while part time employment accounts for 33% of the labour force (compared to 32%
in SA).
That said, the region has a lower labour force participation rate than the state average (52.4% compared to
59.9%), which may reflect limited employment opportunities in the region and hence the relatively lower
proportion of younger (20-24 years) workers in the area. This is also consistent with the broader trend of
young people leaving agricultural regions in search of other employment options.
A majority of the population of Yorke and Mid-North/Braemar earns $200-$799 per week. Compared to the
entirety of SA, Yorke and Mid-North/Braemar has a lower proportion of the population with weekly earnings in
all income brackets above $800. This reflects the generally lower reported incomes in the region when
compared to the State average.
The modal weekly income bracket is $200-299 compared to the SA modal income bracket of $400-599.

Regional background 11
Figure 3.3: Total personal weekly income, Yorke and Mid-North/Braemar, 2011
Source: ABS Census 2011
Income support for residents in the RDA region included 5.7% of the population recipients of unemployment
benefits, and a total of 35.3% of the region being Centrelink card holders. This reflects both the lowest
proportion of unemployment benefit recipients and the highest total proportion of card holders compared to
the other regions considered. This reflects the relatively low unemployment in the region but a higher number
of people receiving disability support and an older population receiving pensioner concessions.
Education
A significantly lower proportion of the Yorke and Mid-North/Braemar region’s working population (aged 15+)
has a non-school qualification1 (32.5%) when compared to SA (42.0%) or Australia (44.9%). As can be seen
in the following figure, a large portion of this disparity is driven by the lower level of Bachelor Degree holders
in the Yorke and Mid-North/Braemar region (5.7%) compared to SA (11.6%). Yorke and Mid-North/Braemar
also has a lower proportion of its working age population in each of the non-school qualification levels with the
exception of Certificate Level.
Similar to the Far North region, only 28% of the Yorke and Mid-North/Braemar region reported a field of study
in a non-school qualification.
Overall, the Yorke and Mid-North/Braemar region has a much lower proportion of the population with non-
school qualifications than in South Australia more broadly, where 83% of the population provided a field of
study for non-school qualifications.
Within the regional population, the three most reported qualifications were in engineering and related
technologies (7%), followed by 4% in health and another 4% management and commerce. These fields of
study were also the most common state-wide, with 17% of people reporting an engineering and related
technologies qualification followed by 16% in management and commerce.
1 This variable describes the level of education of the highest completed non-school qualification (e.g. bachelor degree, diploma).
0
2,000
4,000
6,000
8,000
10,000
12,000

Regional background 12
Figure 3.4: Non-school qualifications in the Yorke and Mid-North/Braemar region compared to working age population
Source: ABS Census 2011
There is a significantly lower proportion of adults in the Yorke and Mid-North/Braemar region that attend full
time education (1.2%) when compared to South Australia (19.3%). As for part-time education, there is a
somewhat smaller gap between Yorke and Mid-North/Braemar (2.4%) and the state (4.2%). The lower
numbers therefore account for the significantly higher proportion of adults not attending any educational
institution in Yorke and Mid-North/Braemar (91.2%) when compared to South Australia (71.3%).
Table 3.3: Percentage of population aged 18 and above studying in the Yorke and Mid-North/Braemar region
Education type Yorke and Mid-North/Braemar
South Australia
Not attending 91.2% 71.3%
Full-time student 1.2% 19.3%
Part-time student 2.4% 4.2%
Institution stated, full-time/part-time status not stated 0.1% 0.2%
Both institution and full-time/part-time status not stated 5.1% 5.0%
Source: ABS Census 2011
Social infrastructure
Health care in Yorke and Mid-North/Braemar is provided by 19 health services with the main hub being the
Port Pirie Regional Health Service. There are also 17 public hospitals and 3 private hospitals in the region.
Access to primary care is available through 27 GPs spread across 21 towns in the region. The distribution of
GPs is reported as being a concern as residents in towns without GPs often have to take a 20-30 minute drive
to reach the nearest GP.
There are 34 pre-schools in the region, as well as a variety of day care services for children of a pre-school
age. The region also contains 61 state schools, including 2 special education schools and an Aboriginal
school, and has a total enrolment of 9320 students. There are also two private primary schools and four
private secondary colleges, all of which are Christian schools. The region also has five Trade Training Centre
1% 1%
6% 5%
20%
0%
5%
10%
15%
20%
25%
PostgraduateDegree Level
GraduateDiploma and
GraduateCertificate
Level
BachelorDegree Level
AdvancedDiploma and
DiplomaLevel
CertificateLevel

Regional background 13
Consortiums that each comprise of at least 3 schools, providing students in High School access to technical
education.
TAFE SA Regional is active in the region with 6 campuses, including an outreach campus at Jamestown
Secondary School. There are several other institutions that operate within the region that provide skills
training in a variety of fields including Agriculture and Viticulture, Hair and Beauty services, Childcare services
and hospitality. State-wide Group Training Inc and Business SA also provide access to apprenticeship
programs across the region.
There are currently no university campuses operating in the region, although a joint initiative of University of
Adelaide and University of South Australia, the Spencer Regional Health School does provide opportunities
for external education.
There are currently 29 police stations in the region, with headquarters operating in Port Pirie. Policing in the
region has been trending towards organisation of police stations into clusters to realise efficiency gains.
Yorke and Mid-North/Braemar is developing some sporting facilities including cycling and walking trails. The
region is also home to a variety of arts events spread out throughout the year including the South Australian
Living Artists Festival, Flinders Ranges: A Brush With Art Festival and Peterborough Art Show. The area is
also home to several community and commercial art galleries.
Land use and the environment
Land use in this region is dominated by pastoral and agricultural uses. Remnant vegetation in the Yorke
Peninsula area is not widespread, and is largely associated with road and rail reserves. Remnant vegetation
in the eastern half of this region is more widespread, although its condition varies dependent on the extent of
degradation due to clearing, stocking and the impact of feral animals and weeds. There are a number of
significant conservation reserves in this region, such as Bush Heritage Australia’s Boolcoomatta reserve and
Bimbowrie Conservation Park near Olary, and the Innes National Park on Yorke Peninsula.
A list of key environmental assets in the Yorke and Mid-North/Braemar is in Appendix B and the figure
overleaf shows the location of key environmental assets across South Australia.

Regional background 14
Figure 3.4: Key South Australian environmental assets

Regional background 15
Implications of mining growth
Mining sector expansion is expected to have a significant impact on development and community dynamics of
the Yorke and Mid-North/Braemar Region. Along with the increased investment and commercial activity that
would be expected, the increased mining activity will also result in some influx of temporary and permanent
residents to the region.
The identified Yorke Peninsula operations are close to existing townships which are likely to be able to
provide workers to support mining activity. local towns will play a central role in providing access workers
access to key human services such health and education, social infrastructure such as housing, water and
sewerage and broader community and recreational services such as pools, gymnasiums, cafes and retail
facilities.
By contrast, the Frome South and Braemar operations are not in close proximity to existing townships and are
likely to rely heavily on labour sourced from outside the area. In this case it is likely the remoteness of the new
operations will promote the development of company built and operated towns to house the growing
workforces and provide basic social services. The requirement to accommodate workers from outside the
region may necessitate the investigation of new or expanded airports to service these clusters.
Identification of specific social infrastructure and community service needs (including airports) will be
undertaken during the prioritisation assessment process in Stage 5.

Regional mining profile 16
4. Regional mining profile
Mining in South Australia
Mining has played a key part in the development of South Australia from its foundation, providing not only an
economic mainstay but encouraging waves of immigration and exploration. Australia’s first metal mine was
established at Glen Osmond in 1841, and before 1850, virtually all of Australia’s metal mines were located in
South Australia which, for a period, produced about 10% of global copper supply. Many South Australian firms
supplied mining machinery to other Australian colonies, and the economic benefits derived from mining made
finance available for further mining developments around Australia.
The copper and gold rushes of the 1850s and 1860s, and the subsequent development of South Australia’s
mining industry through the early 20th century fostered the development of infrastructure across the state,
facilitating the exploration and settlement of the more remote areas of the state. Numerous towns were
founded along or near the infrastructure corridors established to service the state’s burgeoning minerals
exports. Through the 20th century, the impact of mining on the state economy was overtaken by agricultural
exports but, with the development of the Olympic Dam mine in the 1980s and a steady increase in minerals
exploration through the 1990s, the importance of the minerals sector in South Australia began to rise once
more.
The PACE (Plan for Accelerating Exploration) funding initiative was established by the South Australian
Government in 2004 to promote minerals exploration in the state. The PACE (Plan for Accelerating
Exploration) funding initiative was established by the South Australian Government in 2004 to promote
minerals exploration in the state. PACE seeks to provide a robust, transparent and timely process to
streamline the mining assessment and approval processes that are critical in determining the overall
economic, environmental and social impact of a project.2
Initially a 5 year program, PACE is now funded through to 2014 with total funds in excess of $40 million. Due
to the increased exploration over the last decade facilitated by the PACE program and encouraged by
increasing commodity prices, hundreds of
new deposits have been identified and
several new mines are now operating.
From four operating mines in 2000, South
Australia currently has 20 approved
mines, and over 130 developing projects
and prospects. In the 2012 Financial
Year, South Australia’s minerals exports
exceeded $4 billion per year, more than
one third of total State exports.
With this existing and the potential evident
from the number of significant mining
projects currently in advanced
2 DMITRE website http://www.pir.sa.gov.au/minerals/initiatives/pace2020/pacemining

Regional mining profile 17
development, the expansion of South Australia’s mining sector over the coming decades will place additional
demand on existing infrastructure networks, support services and systems. Therefore, the expansion of South
Australia’s power, water and transport infrastructure is a necessity in order to capitalise on the state’s mineral
prospects and supports the expansion of mineral production and exports.
Mining activity in the Yorke and Mid-North/Braemar region
The Yorke and Mid-North/Braemar area has a rich mining history, including the copper discoveries around
Moonta, Burra and Kapunda, gypsum at Inneston and uranium at Radium Hill. The region played a major part
in the development of the nation’s mining sector, as lead and zinc ore from Broken Hill was smelted at Port
Pirie, and the revenue from the area’s copper mines bolstered the colony’s economy and population.
The Yorke and Mid-North/Braemar region currently has two operating mines: White Dam (gold) and
Honeymoon (uranium).
Current development activity in the Braemar region is predominantly around iron ore and uranium, with
numerous magnetite projects at advanced stages of development within the area between Peterborough and
Broken Hill in New South Wales, and a number of uranium prospects around the existing Honeymoon mine
and northwards (into the Far North region). If all of the significant iron prospects located along the existing rail
corridor progress to production, this could result in the Braemar region providing over 50 million tonnes per
year. The Yorke Peninsula region has continued its history of providing rich copper deposits, with the Hillside
project nearing the construction phase, and a number of other exploration targets identified.
Mining activity in the Yorke and Mid-North/Braemar region is dominated by exploration and early stage
developments. Mining in the Yorke and Mid-North/Braemar is primarily focused on copper, while iron ore and
uranium deposits prevail in Braemar. Of the 20 major mines operating in South Australia, two (Honeymoon
and White Dam) are in the region3. A summary of the mining pipeline for the region is presented below.
It should be noted the economic contribution of mining is a function of production volumes and price paid for the commodity (i.e. uranium is produced in relatively high volumes, but has a relatively high price per tonne).
3 We have not assessed White Dam as part of this project as mining has ceased major production and at present they are only
processing the remaining leach heaps.

Regional mining profile 18
Figure 4.1: Mining pipeline for the Yorke and Mid-North/Braemar Region (as at April 2013)
In total there are 19 mining sites recognised by the Department for Manufacturing, Innovation, Trade,
Resources and Energy across the region that have been assessed as part of the RMIP project. Mining activity
in the Yorke and Mid-North/Braemar region has a focus on iron ore and uranium, but also includes gold and
copper prospects.

Regional mining profile 19
Table 4.1: Summary of Yorke and Mid-North/Braemar mining activity by resource type (as at April 2013)
Yorke and Mid-North/Braemar Total Iron Cu U (and associated) Other
Number of Operating mines 2 0 0 1 1 (Au)
Number of Developing Projects 9 4 2 2 1 (Au)
Number of Prospects 8 2 1 5 0
Total mining projects 19 6 3 8 2
Table 4.2: Indicative annual production values for the major operating mines in the region (2012-13)
Mine Proponent Mineral Annual Production volume
Mine/ resource life
Honeymoon Uranium One Uranium Oxide (ISL) 40,000 tonnes 7
Iron Projects
The defining characteristic of iron ore mining is whether the target ore body is haematite or magnetite; these
two types of iron oxide deposits have vastly different mineral characteristics which, in turn have considerable
impacts on the commercial considerations of mining.
Haematite
Haematite comprises the majority of Australia’s iron ore projects, including those in the Pilbara region of
Western Australia. Haematite deposits are usually found with other iron minerals such as goethite and
limonite, and contain high levels of iron (usually around 60%).
The higher proportion of iron in haematite deposits means mine production can be shipped to steelworks with
little or no processing at the mine site. This practice of shipping ore in the state in which it is extracted is
referred to as a direct shipping ore (DSO) operation.
The lack of processing required for DSO haematite operations means there is a significantly lower need for
capital equipment at the mine site than for magnetite mines. Less capital equipment results in a lower capital
cost of developing mines and lower operating cost as there is not as large a draw on power.
The relatively low capital and operating cost of haematite mines means they can be commercially viable at
significantly lower production levels (as low as 1-2 mta) than magnetite mines.
Magnetite
Magnetite is a magnetic iron oxide, and is often found in association with haematite deposits. Magnetite
deposits have a lower iron content when mined (usually 25% to 40%) when compared to haematite, which
means these deposits have lower overall yields.
The lower iron content found in magnetite deposits means the extracted ore needs to undergo more complex
processing at the mine site to produce a magnetite concentrate. This beneficiation requires capital equipment
such as grinding mills, crushing plants and magnetic separators, which significantly increase the capital and
operating cost of magnetite mines. The greater fixed and operating cost of magnetite means they must ship
ore in larger volumes (around 5 mta) to be commercially viable.

Regional mining profile 20
However, magnetite mines typically ship concentrate at 68% to 70% iron content. This higher quality product
attracts a premium price from steel making customers, which can potentially offset the greater costs
associated with processing.
Iron deposits in the Yorke and Mid-North/Braemar region
The geographic distribution of iron ore deposits in the Yorke and Mid-North/Braemar region is presented in the
figure below.
Figure 4.2: Map of the iron ore mining activity in the Yorke and Mid-North/Braemar region
There are no currently operating iron ore mines in the Yorke and Mid-North/Braemar region; however, the
region is regarded as highly prospective for magnetite, with a number of advanced projects in development.
The table below details the iron prospects assessed as part of the RMIP project. Note that the predominant
focus of the Hillside project is copper, although significant reserves of iron ore have also been identified (for
this reason, not included in figure above).
Table 4.3: Iron ore activity in the Yorke and Mid-North/Braemar region
Mine Operator DMITRE status Target Commodity
Maldorky Havilah Resources Developing Project Iron
Razorback Royal Resources Developing Project Iron
Muster Dam (Mutooroo) Minotaur Exploration Developing Project Iron
Hawsons (NSW) Carpentaria Exploration Developing Project Iron
Hillside Rex Minerals Developing Project Cu, Au, Fe
Grants (Maldorky North) Havilah Resources Prospect Iron
Lilydale Havilah Resources Prospect Iron

Regional mining profile 21
Copper Projects
Many of the known South Australian copper deposits occur near the margins of the Gawler Craton, including
several significant copper prospects within the Yorke and Mid-North/Braemar region.
The copper produced in South Australia is shipped either as a concentrate or as refined copper metal. The
processing of copper has a significant power and water requirement per tonne, particularly the production of
refined copper.
Copper deposits are often found in association with commercial reserves of iron ore, gold and uranium. Often
the more valuable metals are obtained as by-products of iron ore processing.
Copper deposits in the Yorke and Mid-North/Braemar region
The geographic distribution of copper deposits in the Yorke and Mid-North/Braemar region is presented in the
figure below.
Figure 4.3: Map of the copper mining activity in the Yorke and Mid-North/Braemar region
There are four prospects in the Yorke and Mid-North/Braemar region assessed as part of the RMIP project
that are targeting copper. Details of the Yorke and Mid-North/Braemar copper deposits assessed are provided
overleaf.
Note that the predominant focus of the Portia project is gold, although significant reserves of copper ore have
also been identified (for this reason, not included in figure above).

Regional mining profile 22
Table 4.4: Copper activity in the Yorke and Mid-North/Braemar region
Mine Operator DMITRE status Target Commodity
Hillside Rex Minerals Developing Project Cu, Fe, Au
Portia Havilah Resources Developing Project Au, Cu, Mo
Kalkaroo Havilah Resources Developing Project Cu, Au, Mo
Parara Rex Minerals Prospect Cu, Au, Fe
Uranium Projects
Uranium mines typically undertake a significant amount of beneficiation at the mine site to produce uranium
oxide concentrate suitable for shipping. Although the volumes of concentrate produced are generally not large
in comparison to bulk minerals such as iron ore, the processing requirements means uranium mines have a
relatively high power and water requirement per tonne of final product shipped.
Uranium deposits in South Australia are generally either hosted in breccia or sandstone geology.
Breccia hosted uranium
Breccia hosted uranium mines require the breccia in which the uranium is contained to be extracted by either
open cut or underground mining for processing. The hardness of breccia means it is technically challenging to
extract the material as well as costly to crush sufficiently to enable further processing. Breccia hosted uranium
deposits must normally be close to the surface if they are to be commercially viable.
Breccia hosted uranium is processed to derive uranium oxide above ground, with significant water and power
requirements. In addition, considerable safety measures are required due to its radioactivity.
Sandstone hosted uranium
Due to the porous nature of the surrounding rock, sandstone hosted uranium can be extracted the using in-
situ recovery (IRS) process. This process involves circulating local groundwater and chemical solutions
through a network of wells through the host rock, which dissolves the uranium. The solution is then pumped to
the surface and processed to produce uranium oxide concentrate suitable for shipping.
Because the ISR process is largely undertaken underground, this removing the need for much of the capital
expenditure associated with traditional open cut or underground mining operations, such as crushing plants
and smelters. Therefore, sandstone hosted uranium deposits require less power and water for extraction and
processing than breccia hosted uranium, and produce fewer tailings.

Regional mining profile 23
Uranium deposits in the Yorke and Mid-North/Braemar region
The geographic distribution of uranium deposits in the Yorke and Mid-North/Braemar region is presented in
the figure below.
Figure 4.4: Map of uranium mining activity in the Yorke and Mid-North/Braemar region
Honeymoon is the only currently operating uranium mine in the Yorke and Mid-North/Braemar region,
producing approximately 40 kta of uranium oxide using ISR processes.
Along with these existing operations, the RMIP project has assessed a further eight uranium deposits in the
Yorke and Mid-North/Braemar region, as summarised in the table below. Note that the predominant focus of
the Hillside and Parara projects is copper, although reserves of uranium ore have also been identified (for this
reason, not included in figure above).
Table 4.5: Uranium activity in the Yorke and Mid-North/Braemar region
Mine Operator DMITRE status Target Commodity
Honeymoon Uranium One Major Mine U
Crocker Original PepinNini Minerals Developing Project U
Junction Dam Marmota Energy Developing Project U
Hillside Rex Minerals Developing Project Cu, Fe, Au
Becaroo PepinNini Minerals Developing Project U
Goulds Dam [Billeroo] Uranium One Prospect U
Mount Victoria PepinNini Minerals Prospect U
Mulyungarie Marmota Energy Prospect U
Oban Curnamona Energy Prospect U
Parara Rex Minerals Prospect Cu, U, Au, Fe

Regional mining profile 24
Other Projects (Gold, Molybdenum)
In addition to the minerals discussed above, the Yorke and Mid-North/Braemar region includes several
prospects that target other commodities, including gold, silver and other metals.
Gold
As discussed above, gold is often found in association with copper, and also with uranium and iron ore. The
Portia prospect is targeting gold along with copper and molybdenum. Several of the prospects discussed
above are also targeting gold, including Hillside, Parara and Kalkaroo.
Molybdenum
Molybdenum is usually found as a co-product with or by-product of copper or uranium deposits. The Portia
(gold) and Kalkaroo (copper) projects are also targeting molybdenum.
Figure 4.5: Map of other mineral mining activity in the Yorke and Mid-North/Braemar region
There are no operating mines in the Yorke and Mid-North/Braemar region other than those discussed earlier
in this chapter. There are however two developing projects operated by Havilah Resources targeting gold and
Molybdenum (in addition to other minerals). The Portia project primarily targets gold and the Kalkaroo project
targets primarily copper (for this reason, not included in the figure above.
Regional mining profile 25
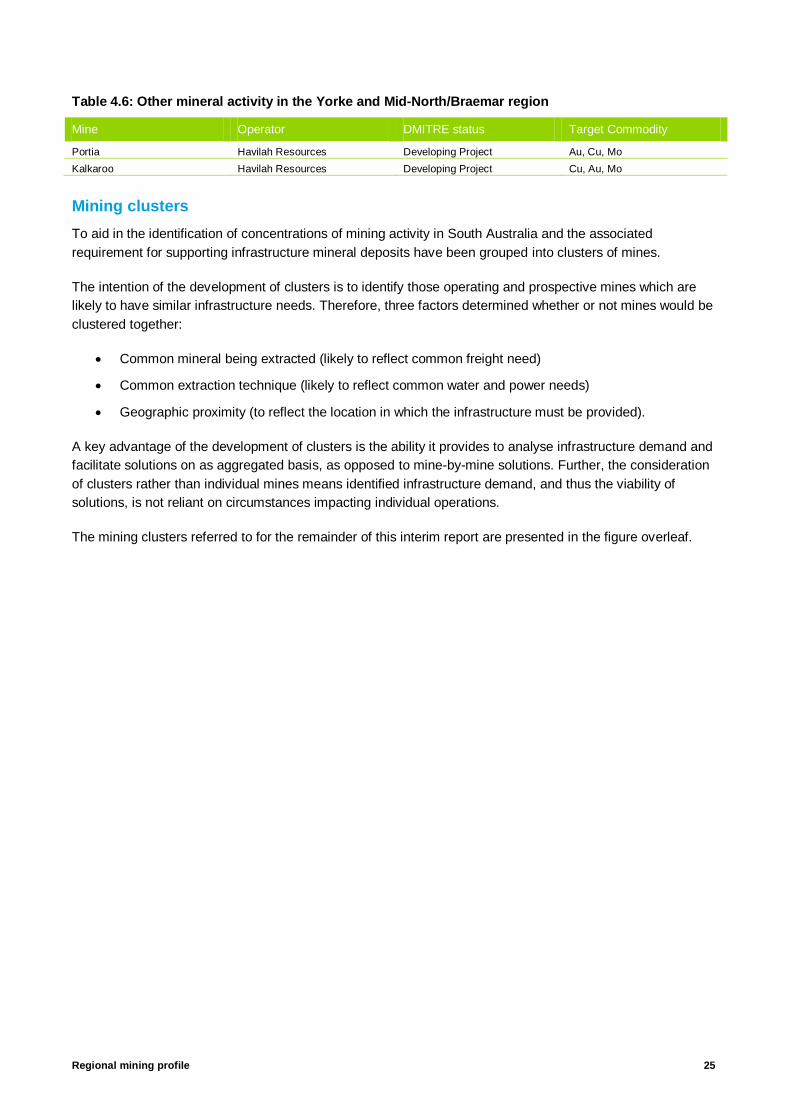
Table 4.6: Other mineral activity in the Yorke and Mid-North/Braemar region
Mine Operator DMITRE status Target Commodity
Portia Havilah Resources Developing Project Au, Cu, Mo
Kalkaroo Havilah Resources Developing Project Cu, Au, Mo
Mining clusters
To aid in the identification of concentrations of mining activity in South Australia and the associated
requirement for supporting infrastructure mineral deposits have been grouped into clusters of mines.
The intention of the development of clusters is to identify those operating and prospective mines which are
likely to have similar infrastructure needs. Therefore, three factors determined whether or not mines would be
clustered together:
Common mineral being extracted (likely to reflect common freight need)
Common extraction technique (likely to reflect common water and power needs)
Geographic proximity (to reflect the location in which the infrastructure must be provided).
A key advantage of the development of clusters is the ability it provides to analyse infrastructure demand and
facilitate solutions on as aggregated basis, as opposed to mine-by-mine solutions. Further, the consideration
of clusters rather than individual mines means identified infrastructure demand, and thus the viability of
solutions, is not reliant on circumstances impacting individual operations.
The mining clusters referred to for the remainder of this interim report are presented in the figure overleaf.

Regional mining profile 26
Figure 4.6: Mining clusters in the Yorke and Mid-North/Braemar region

Existing infrastructure profile 27
5. Existing infrastructure profile
Mining activity in the Yorke and Mid-North/Braemar region has been increasing over the last decade. To date
mining operators have fashioned composite bulk freight solutions utilising pre-existing infrastructure networks.
This chapter reviews the nature and extent of infrastructure currently in place to support mining activity in the
Yorke and Mid-North/Braemar region; its condition, capacity and capability to meet current infrastructure
needs and any current infrastructure deficiencies that need to be addressed.
This chapter is divided into three sections:
The first is a summary of the infrastructure solutions utilised by existing mines
The second is an examination of the technical characteristics of infrastructure in the Yorke and Mid-
North/Braemar Region across the categories necessary to support current and future mining activity
The third summarises the extent to which current infrastructure is supporting mining activity in the
Yorke and Mid-North/Braemar Region.
The information in this chapter is presented to give context and a point of comparison to the discussion of the
expected future infrastructure needs of mining in the Yorke and Mid-North/Braemar Region presented in
chapter 6.
Current infrastructure approach of major miners in the region
A summary of the major mines current output and infrastructure tasks is provided in the table below.
Table 5.1: Major mine infrastructure needs
Mine Annual Production volume (mtpa)
Transport to market Utilities Other
Honeymoon , Uranium
One
0.04 Road to Port Adelaide Power generated locally
from mains gas,
desalinated groundwater
Import of approx. 2,000
tpa of consumables
primary freight task
Source: SMEC
At present the output from the Honeymoon mine is quite low (40,000 tonnes per annum) and is transported by
road to Port Adelaide for shipment.
Existing infrastructure profile
Ports
Currently there are five ports in the Yorke and Mid-North/Braemar region.
Port Giles
Klein Point
Ardrossan
Wallaroo

Existing infrastructure profile 28
Port Pirie
Figure 5.1: Overview of existing port facilities in the Yorke and Mid-North/Braemar region
1. Port Giles
Port Giles is operated by Flinders Ports as an export only port predominantly handling grain. Export volumes
have reached in the order of 1 million tonnes per annum.
The Port has good access to deep water (approximately 13.5m) and is able to accommodate panamax
vessels. The Port is surrounded by farming land and is accessed by a road network (no rail) including a
gazetted road train route from the north.
2. Klein Point
Klein Point was established specifically to handle shipments of limestone for Adelaide Brighton Cement and is
operated by Flinders Ports. In 2011, approximately 1.7 million tonnes of product was moved to Adelaide.
Access to the Port is restricted and the operating channel depth is shallow at approximately 6.5 metres.
3. Ardrossan
Ardrossan port is operated by Viterra to export products such as dolomite and mineral sands from the region.
The port exists adjacent to the town of Ardrossan although there is a reasonable buffer between the port zone
and residential areas.
The port is relatively shallow at approximately 9.2 metres. The landside area of the port is approximately 209
hectares and currently includes a grain storage facility.

Existing infrastructure profile 29
4. Wallaroo
Wallaroo on the western side of Yorke Peninsula is operated by Flinders Ports and is used predominantly to
export grain and to import fertiliser. In 2010/11 the export volume was around 800,000 tonnes.
This port has an approach channel depth of 8.4 metres, capable of accommodating Handymax vessels. The
Port is adjacent to the town centre and although there is approximately 116 hectares of industrial land within
an adjacent industry (port) zone, this is separated from the port by residential development.
5. Port Pirie
Port Pirie is also operated by Flinders Ports to export in the order of 220,000 tonnes per annum of zinc
concentrate and lead from the Nyrstar smelters and to import concentrates, coal and other products to the
smelters.
Port Pirie is effectively located on a river with the overall shipping channel into the port being approximately 9
nautical miles in length and with a channel depth of 6.4 metres. The Port Pirie township is close to National
Highway road transport and the main interstate rail freight network, however there may be considerable
challenges moving product through the township to access the port.
The Port is in close proximity to the main street which would be a key consideration for any future use. The
Western Plains Group (WPG) has previously received development approval to use Port Pirie to export
approximately 3.3 million tonnes per annum of iron ore from its Peculiar Knob deposit. Following acquisition of
WPG by Arrium, this product is now being moved through Whyalla.
Rail
1. Operating corridors
The rail network in this region consists of the standard gauge rail links between Broken Hill and Crystal Brook,
on to Adelaide south of Crystal Brook and on to Port Augusta north of Crystal Brook (as a part of the Adelaide
– Perth rail line). These corridors form part of the defined interstate rail network (DIRN) and are owned and
operated by the Australian Rail Track Corporation (ARTC). These rail lines within this region are able to carry
1800m trains with 25 tonne axle loads and an 80km/h speed limit. Train control is via a verbal train order
system although ARTC are proposing to roll-out a new ‘in-cab’ train control system in the next decade which
will improve safety and operational efficiency on the line.
These sections of corridor do have some available capacity to carry additional loads, varying between an
estimated 8 million tonnes per annum north of Crystal Brook and 16 million tonnes per annum south of Crystal
Brook. The section between Broken Hill and Crystal Brook is estimated to have approximately 11 million
tonnes per annum available capacity for additional volumes. These available capacities are indicative only
and will vary according to a number of factors.
2. Disused or dormant corridors
In addition to the above there are a number of dis-used and/or dormant rail corridors through this region. The
majority of these corridors are owned by the State Government however it is understood that some sections
have been allocated to other uses over the years and it would therefore be necessary to validate current
availability if any sections were proposed for use. It is also recognised that many of these sections have
difficult topography and/or geometric arrangements that may not align with current standards for future use
without some adjustment.

Existing infrastructure profile 30
Figure 5.2: Overview of existing rail in the Yorke and Mid-North/Braemar region
Road
Roads through this region are a combination of National Highway (Adelaide to Port Augusta Road), State
Arterial Roads and local roads. The Adelaide to Port Wakefield Road carries over 5,000 vehicles per day in
some sections (approximately 20% freight). The Barrier Highway carries approximately 1,000 vehicles per day
(approximately 20% freight) and other arterial roads typically carry less than 1,000 vehicles per day.
Existing infrastructure profile 31
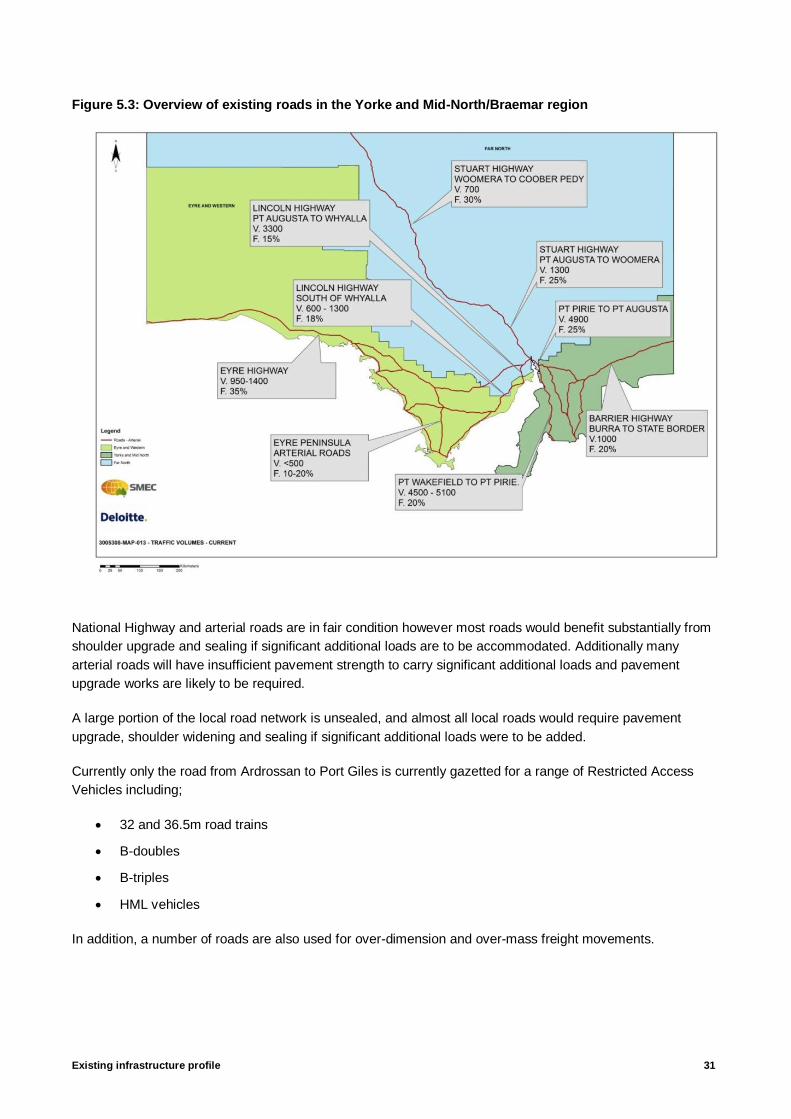
Figure 5.3: Overview of existing roads in the Yorke and Mid-North/Braemar region
National Highway and arterial roads are in fair condition however most roads would benefit substantially from
shoulder upgrade and sealing if significant additional loads are to be accommodated. Additionally many
arterial roads will have insufficient pavement strength to carry significant additional loads and pavement
upgrade works are likely to be required.
A large portion of the local road network is unsealed, and almost all local roads would require pavement
upgrade, shoulder widening and sealing if significant additional loads were to be added.
Currently only the road from Ardrossan to Port Giles is currently gazetted for a range of Restricted Access
Vehicles including;
32 and 36.5m road trains
B-doubles
B-triples
HML vehicles
In addition, a number of roads are also used for over-dimension and over-mass freight movements.
Existing infrastructure profile 32
In broad terms, there is spare capacity on most roads however the following would need to be considered as
a part of a risk assessment process prior to any material change in volumes or type/s of vehicles used in
individual roads or sections of road;
Pavement capacity,
Road geometry (including intersection layouts),
Safety, including interfaces with other users (e.g. rail) and crash history,
Impact on structures (culverts, bridges)
Community impact (e.g.; if a road passes through a town)
Service level impacts (e.g.; opportunities to overtake)
Road upgrade costs and responsibility
Road maintenance costs and responsibility
Funding for local road upgrades.
It should be noted ownership and responsibility for maintenance of national highways is with the
Commonwealth Government, state roads with the South Australian Government and local roads with local
councils.
The Bowmans Intermodal terminal north of Adelaide is a key link between road and rail transport across
South Australia. Use of intermodal terminals may be particularly important for in-bound freight to support
mining.
Electricity
Electricity for the Yorke and Mid-North/Braemar Region is provided from the South Australian Electricity -Grid
via the ElectraNet transmission network and the South Australian Power Networks (SAPN) Distribution
network.
The South Australian Electricity Grid receives power generated from coal fired power stations at Port Augusta
(approximately 16%), nine gas fired power stations (approx. 65%) and a number of wind (17%) and diesel
(2%) generation sites. In addition, the South Australian grid is connected to the National Electricity Market via
two interconnector systems.
The peak demand for South Australia is at approximately 3,400MW, which occurs for about 80 to 100 hrs per
year. For over 90% of the year, South Australia uses between 1,000 and 2,000 MW, which is well below peak
demand.
The generation capability for South Australia, without reliance on the interconnectors, is approximately
consistent with the current peak demand requirements.
For the Yorke and Mid-North/Braemar region of the state, transmission of electricity is via a 275kV network
through the mid-north areas and then via 132kV radial supplies to Yorke Peninsula and into the mid-north
regions. Refer diagram below.
A summary of the electricity network in the region is presented in the diagram overleaf.

Existing infrastructure profile 33
Figure 5.4: Overview of the existing electricity network in the Yorke and Mid-North/Braemar region
This system is currently able to supply capacity of approximately 100MW to the Yorke Peninsula region, which
is now used to near capacity. Accordingly, there is limited capacity for significant additional demand on this
section of the network. ElectraNet have considered options for future augmentation of the transmission supply
to Yorke Peninsula.
Similarly, there is very limited additional capacity into the Braemar region of the state which does currently
include transmission supply.
Across the border Broken Hill is connected to the New South Wales Transgrid system. This is a 220kV single
circuit which also has limited capacity (approximately 100MW) and is already constrained.
There is a proposal under consideration to install a high capacity (500kV) transmission link from Mt Piper,
New South Wales to Wilmington South Australia (near Port Augusta) which would run through the Braemar
cluster. This may create future options for the region if it proceeds.
The 275kV transmission through the mid-north region does give good opportunity for future connections to a
strong transmission network, although there are potentially significant distances involved.
Existing infrastructure profile 34
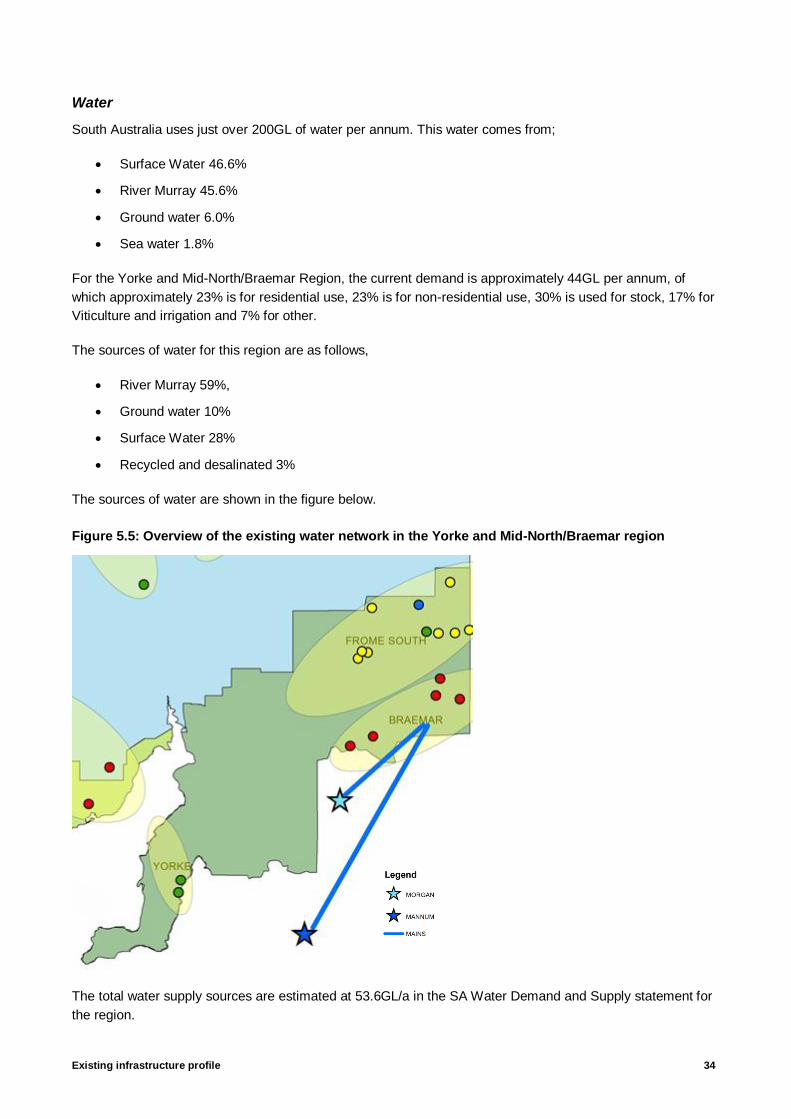
Water
South Australia uses just over 200GL of water per annum. This water comes from;
Surface Water 46.6%
River Murray 45.6%
Ground water 6.0%
Sea water 1.8%
For the Yorke and Mid-North/Braemar Region, the current demand is approximately 44GL per annum, of
which approximately 23% is for residential use, 23% is for non-residential use, 30% is used for stock, 17% for
Viticulture and irrigation and 7% for other.
The sources of water for this region are as follows,
River Murray 59%,
Ground water 10%
Surface Water 28%
Recycled and desalinated 3%
The sources of water are shown in the figure below.
Figure 5.5: Overview of the existing water network in the Yorke and Mid-North/Braemar region
The total water supply sources are estimated at 53.6GL/a in the SA Water Demand and Supply statement for
the region.

Existing infrastructure profile 35
This is approximately 25% above the current demand estimates showing there is some available capacity in
the region, however the demands of mining would place this under considerable strain. It is recognised
however that the large percentage of River Murray supply component can be variable as River Murray country
water allocations have varied over recent years.
Gas
South Australia’s gas is supplied from two sources;
The Moomba to Adelaide pipeline system (MAPS), which links to the South West Queensland
Pipeline System.
This system is owned by Epic Energy (which is owned by APA Group) and has a transmission capacity of
253Terra Joules (TJ) per day.
The Seagas pipeline system which links to the Victorian gas fields.
This system is owned by Seagas (which is 50% owned by APA Group) and has a transmission capacity of
303TJ/day.
These lines are shown on the diagram below.
Figure 5.6: Overview of existing gas pipelines impacting the Yorke and Mid-North/Braemar region
Gas supply to South Australia is dependent on overall demands from the eastern states. At current demand
rates it is forecast that the existing supply basins have capacity for a further 50 years.

Existing infrastructure profile 36
The current usage of the MAPS and Seagas transmission systems is generally well below the system
capabilities (although goes closer to capacity at times of peak demand), indicating that there is likely to be
capacity for additional gas supply if required.
Gas supply to the Yorke and Mid-North/Braemar Region is strong with the Moomba to Adelaide Pipeline
running through the middle of the region. This provides good potential opportunity for further connections in
the region.
Assessment of existing infrastructure
Existing Yorke and Mid-North/Braemar freight, power and water infrastructure were assessed to ascertain
their condition, capacity and capability to meet current mining demand. Current infrastructure demand refers
to the aggregate requirements of the major mines. The score scale used for this assessment is outlined in the
table overleaf.
Table 5.2: Infrastructure assessment scale
Symbol Rating Description
Good Infrastructure presents a low risk to mining operations/performance
Infrastructure considered adequate to meet current requirements
No immediate action required
Moderate Infrastructure presents a moderate risk to mining operations/performance
Moderate risk that emerging issues will impact infrastructures ability to meet current
requirement
Short to medium term action likely
Poor Infrastructure presents a high risk to operations, threatening overall performance
Significant risk that infrastructure will be unable to meet current demand requirements
Immediate action required
Not Applicable No infrastructure required, alternative infrastructure solution(s) are sufficient at this time
No current mining demand in area requiring infrastructure
No immediate action required
The results of this assessment are summarised in the table below. This assessment was guided by the
infrastructure benchmarks attached at Appendix C that outline the expected capacity, condition and capability
standard of the alternate infrastructure.
Table 5.3: Assessment of existing infrastructure to meet current demand
Mine Cluster
Ports Rail Roads Power Water
Con
ditio
n
Cap
acity
Cap
ab
ility
Con
ditio
n
Cap
acity
Cap
ab
ility
Con
ditio
n
Cap
acity
Cap
ab
ility
Con
ditio
n
Cap
acity
Cap
ab
ility
Con
ditio
n
Cap
acity
Cap
ab
ility
Braemar
Frome South
Yorke

Existing infrastructure profile 37
The assessment demonstrated there are no critical infrastructure issues in the Yorke and Mid-North/Braemar
region at present. This is largely a reflection of the relatively low output profile in the region and production of
high-value per tonne ore which makes disparate power and water solutions commercially viable.
Infrastructure in the Braemar and Yorke clusters is sufficient to meet the needs to current exploration
activities.

Future mining demand 38
6. Future mining demand
Analysis presented in chapter 5 demonstrates infrastructure in the Yorke and Mid-North/Braemar Region is
sufficient to support existing mining operations. This chapter presents forecasts of future mining activity, and
resultant infrastructure demand, under high, medium and low global economic growth scenarios.
Chapter 7 presents our analysis of the extent to which the existing infrastructure examined in chapter 5 is able
to accommodate the future demands discussed in this chapter. Investigating ways to address the gap
between the state of current infrastructure and demands of future mining is at the core of the RMIP project.
Future infrastructure needs will be driven by the mining production activity and freight and logistics task
expected to take place in the region. Separate from the availability of infrastructure, the progression of mines
from prospects to developments and developments to major mines will be based on the underlying profitability
of each mine. Establishing an objective, transparent and robust forecast for this future mining activity is central
to understanding what are and will be the pressing and emerging infrastructure needs for the region. This
chapter presents the results of this mining demand forecast.
Demand modelling
A four step approach was undertaken to model the future mining demand for the Yorke and Mid-North /
Braemar region. An overview of this approach is presented below. Data was collected on the nature and level
of mining activity in the region during the preliminary stages of the project. Sources for this data included
mining company annual reports, public statements by mining companies in relation to future mining plans,
government databases and outputs from the previous RESIC survey. This material was augmented by private
consultations with the leading mining companies, who assisted in validating and refining the information that
had been collected.

Future mining demand 39
This process underpinned the development of a mining project database which included the following detail:
Table 6.1: Project mine data collected
Project Resources Demand estimates
Operator Target metals Base Production Rate
Phase Total resource deposits Export Freight
DMITRE status Grade of deposits Import Freight
Region Beneficiation process Peak Power
Mine life Main product Electricity Consumption
Estimated lead time Ore Mining Rate Water Consumption
Logistics path(s) Concentrate Grade Potential Gas Use
Potable Water Requirement
In parallel to this exercise commodity price data was collected for iron ore, copper, uranium and gold along
with cost data for the respective mine operations and freight and logistics tasks.
Commodity price forecasts were drawn from Consensus Economics’ quarterly energy and metals forecasts,
published December 2012. Consensus Economics develops forecasts using predictions submitted by more
than 30 commodity forecasters (of which Deloitte Access Economics is one), including private sector
consultancies and leading investment and commercial banks. The median of these forecasts is taken to be
the most likely international economic scenario and the highest and lowest forecast are the high and low
growth scenarios respectively.4
Using this data cost and revenue per tonne estimates were calculated and the profitability of respective mines
determined for high, medium and low global economic growth scenarios. Based on the mines profitability, a
total resource output was determined and associated freight, power and water demand requirements forecast
for the relevant mining clusters and region. The results of this analysis are presented in the following tables5 6.
Following consultation and more detailed assessment of potential infrastructure projects, operating costs for
supporting infrastructure relevant to clusters of prospective mining projects will be refined. The impact on
individual mine viability will be assessed and regional infrastructure demand cases restated through an
iterative process to assess ideal regional common user infrastructure outcomes.
4 Refer to Appendix E for further details on these commodity price forecasts.
5 Mine to gate and gate to port operating costs are still to be finalised for each project. For the purposes of this interim report conservative
estimates have been used. The analysis presented will be refined as this updated cost data is available and reported in the final draft of the plan. 6 In assessing the path to market solutions for each region, we have included mining clusters from neighbouring regions where f or some
clusters appear multiple times (i.e. in more than one plan) and subsequently caution should be taken if aggregating the demand totals
from the three plans.

Future mining demand 40
Low case scenario
Demand and prices indicated under the low global growth scenario is expect to support some smaller scale, higher grade iron ore developments in the Braemar
region.
Whilst prices are expected to remain below pre-GFC highs, uranium prices are expected to be sufficient to support new and ongoing uranium operations in the
Frome South region.
Copper prices are expected to see significant falls under the low global growth scenario however new, low cost copper/gold production is expected to be feasible
at these price levels with higher gold prices offsetting falls in copper.
Table 6.2: Low case forecast infrastructure demand
Cluster Annual Mineral/ Concentrate Production
(Mt p.a.)
Bulk Freight Task (Mt p.a.)
Peak Power Demand (MW)
Energy Consumption (GWh p.a.)
Water Consumption (ML p.a.)
2013-2017
2018-2022
2023-2032
2013-2017
2018-2022
2023-2032
2013-2017
2018-2022
2023-2032
2013-2017
2018-2022
2023-2032
2013-2017
2018-2022
2023-2032
Braemar 0.00 6.02 10.00 0.00 6.62 11.00 0.0 23.2 74.8 0 401 734 0 2,224 7,000
Frome South 0.00 0.00 0.00 1.63 0.66 0.14 2.6 4.9 7.2 68 123 200 76 156 180
Yorke 0.48 1.20 1.20 0.96 2.40 2.40 23.2 58.1 58.1 139 348 348 798 1,996 1,996
Other 0.00 0.00 0.00 0.00 0.00 0.00 0.0 0.0 0.0 0 0 0 0 0 0
Total 0.48 7.22 11.20 2.59 9.68 13.54 25.8 86.2 140.1 207 873 1,282 874 4,376 9,176
Yorke copper/gold/iron
operation assumed to commence operations late in the first period and operate across all periods considered
Braemar magnetite mines
expected to become commercially viable in final two periods
Combination of Braemar
magnetite mines and Yorke
Peninsula copper mines drives power and water need
Relatively high freight task
for Yorke copper mines
reflection of iron ore by-product export
Relatively high infrastructure needs relative to production
volumes as need driven by in-situ recovery uranium projects

Future mining demand 41
Medium case scenario
Demand and prices indicated under the base case global growth scenario is expected to result in significant investment in new iron ore projects in the Braemar
region in the medium to long term.
Iron ore prices are expected to moderate as additional global supply comes on-line and growth in demand eases however prices are expected to remain
significantly above long term historic levels. Development of lower cost Braemar magnetite developments are anticipated.
Moderate growth in uranium prices is expected to support new uranium production and extensions of existing developments in the Frome South region.
Copper prices are expected to moderate under the base case growth scenario however new, low cost copper/gold production is expected to be feasible at these
price levels.
Table 6.3: Medium case forecast infrastructure demand
Cluster Annual Mineral/ Concentrate Production
(Mt p.a.)
Bulk Freight Task (Mt p.a.)
Peak Power Demand (MW)
Energy Consumption (GWh p.a.)
Water Consumption (ML p.a.)
2013-2017
2018-2022
2023-2032
2013-2017
2018-2022
2023-2032
2013-2017
2018-2022
2023-2032
2013-2017
2018-2022
2023-2032
2013-2017
2018-2022
2023-2032
Braemar 1.00 25.64 39.25 1.10 28.20 43.18 0.0 33.6 197.4 0 468 1,525 2,400 14,224 19,000
Frome South 0.00 0.00 0.00 0.00 0.01 0.01 2.4 4.3 7.2 67 120 200 60 108 180
Yorke 0.48 1.20 1.20 0.96 2.40 2.40 23.2 58.1 62. 8 139 348 381 798 1,996 2,996
Other 0.00 0.00 0.00 0.00 0.00 0.00 0.0 0.0 0.0 0 0 0 0 0 0
Total 1.48 26.84 40.46 2.06 30.61 45.59 25.6 96.0 267.4 206 936 2,106 3,258 16,328 22,176
Braemar iron mines
now expected to begin minimal
production in first period
Production at Braemar expected
to increase significantly on levels expected in low scenario
Being magnetite mines, Braemar
production is associated with considerable power and water needs for beneficiation
Yorke Peninsula freight
task likely to be largely met by ports close to the
mine site
Additional water and power needs
above those in the low growth scenario as a result of additional
copper production commencing operation

Future mining demand 42
High case scenario
Demand and prices indicated under the high growth global growth scenario is expected to result in substantial investment in new mining projects in the in the
medium and longer term.
Iron ore prices are expected to return to historic highs supporting significant developments in new large scale magnetite developments in the Braemar region.
Growth in uranium prices is expected to support new uranium production and extensions of existing developments.
Copper prices are expected to return to historic highs supporting new, low cost copper/gold/iron production in the Yorke Peninsula region.
Table 6.4: High case forecast infrastructure demand
Cluster Annual Mineral/ Concentrate Production
(Mt p.a.)
Bulk Freight Task (Mt p.a.)
Peak Power Demand (MW)
Energy Consumption (GWh p.a.)
Water Consumption (ML p.a.)
2013-2017
2018-2022
2023-2032
2013-2017
2018-2022
2023-2032
2013-2017
2018-2022
2023-2032
2013-2017
2018-2022
2023-2032
2013-2017
2018-2022
2023-2032
Braemar 3.00 41.64 59.25 3.30 45.80 65.18 51.0 312.4 492.2 234 2,321 3,835 4,800 42,424 58,000
Frome South 0.00 0.00 0.00 0.00 0.01 0.01 2.4 4.3 7.2 67 120 200 60 108 180
Yorke 0.48 1.20 1.20 0.96 2.40 2.40 23.2 58.1 62.8 139 348 381 798 1,996 2,996
Other 0.00 0.00 0.00 0.00 0.00 0.00 0.0 0.0 0.0 0 0 0 0 0 0
Total 3.48 42.84 60.46 4.26 48.21 67.59 76.6 374.8 562.2 440 2,789 4,416 5,658 44,528 61,176
Frome South expected production
levels and associated infrastructure needs unchanged across three scenarios
Yorke Peninsula copper mine
production and associated infrastructure needs unchanged across three scenarios
Further increase on medium case
production for braemar magnetite mines and resultant need for energy and water
Key freight task challenge in the
Yorke and Mid-North/Braemar region
created by Braemar iron mines

Future mining demand 43
The table below presents a consolidated regional demand profile for bulk freight, power and water across the high, medium and low global growth scenarios.
Figure 6.2: Consolidated regional demand profile
Estimated Project Infrastructure Demand - Low Case
Estimated Project Infrastructure Demand - Medium Case
Estimated Project Infrastructure Demand - High Case
0
10
20
30
40
50
60
70
80
201
3
201
4
201
5
201
6
201
7
201
8
201
9
202
0
202
1
202
2
202
3
202
4
202
5
202
6
202
7
202
8
202
9
203
0
203
1
203
2
Bulk Freight Task (mt)
0
100
200
300
400
500
600
700
201
32
01
42
01
52
01
62
01
72
01
82
019
202
02
021
202
22
02
32
02
42
02
52
02
62
02
72
028
202
92
03
02
03
12
03
2
Power Demand (MW)
0
10000
20000
30000
40000
50000
60000
70000
201
32
014
201
52
016
201
72
018
201
92
020
202
12
022
202
32
024
202
52
026
202
72
028
202
92
030
203
12
032
Water Demand (GL)
0
10
20
30
40
50
60
70
80
201
3
201
4
201
5
201
6
201
7
201
8
201
9
202
0
202
1
202
2
202
3
202
4
202
5
202
6
202
7
202
8
202
9
203
0
203
1
203
2
Bulk Freight Task (mt)
0
100
200
300
400
500
600
700
201
32
014
201
52
016
201
72
018
201
92
020
202
12
022
202
32
024
202
52
026
202
72
028
202
92
030
203
12
032
Power Demand (MW)
0
10000
20000
30000
40000
50000
60000
70000
201
32
01
42
01
52
01
62
017
201
82
019
202
02
02
12
02
22
02
32
02
42
02
52
02
62
02
72
028
202
92
03
02
03
12
03
2
Water Demand (GL)
0
500
1000
1500
2000
2500
3000
3500
4000
4500
5000
201
32
01
42
01
52
016
201
72
018
201
92
02
02
02
12
02
22
02
32
02
42
02
52
02
62
027
202
82
029
203
02
03
12
03
2
Power Consumption (GWh)
0
500
1000
1500
2000
2500
3000
3500
4000
4500
5000
201
32
014
201
52
016
201
72
018
201
92
020
202
12
022
202
32
024
202
52
026
202
72
028
202
92
030
203
12
032
Power Consumption (GWh)
0
500
1000
1500
2000
2500
3000
3500
4000
4500
50002
013
201
42
015
201
62
017
201
82
019
202
02
021
202
22
023
202
42
025
202
62
027
202
82
029
203
02
031
203
2
Power Consumption (GWh)

Future mining demand 44
In the low global growth scenario mining production reaches a plateau of approximately 10mt in 2018 after
which the level of production remains fairly stable. The increase in mining production is more dramatic in the
medium and high global economic growth scenarios. Two plateaus are expected in the medium global growth
scenario as mining production increases rapidly in the years leading to 2019 and another period of
concentrated growth is expected in 2022 to 2023. Mining production in the high growth scenario is expected to
grow steadily in the years 2017 to a peak of slightly less than 70mt in 2025. Mining production is expected to
remain relatively stable after reaching this peak in 2025. The needs for new infrastructure investment is most
acute in the lead up to the plateaus expected in each of the global growth scenarios, after these plateaus
have been reached the focus turns to operating and maintaining the infrastructure which has already been put
in place.
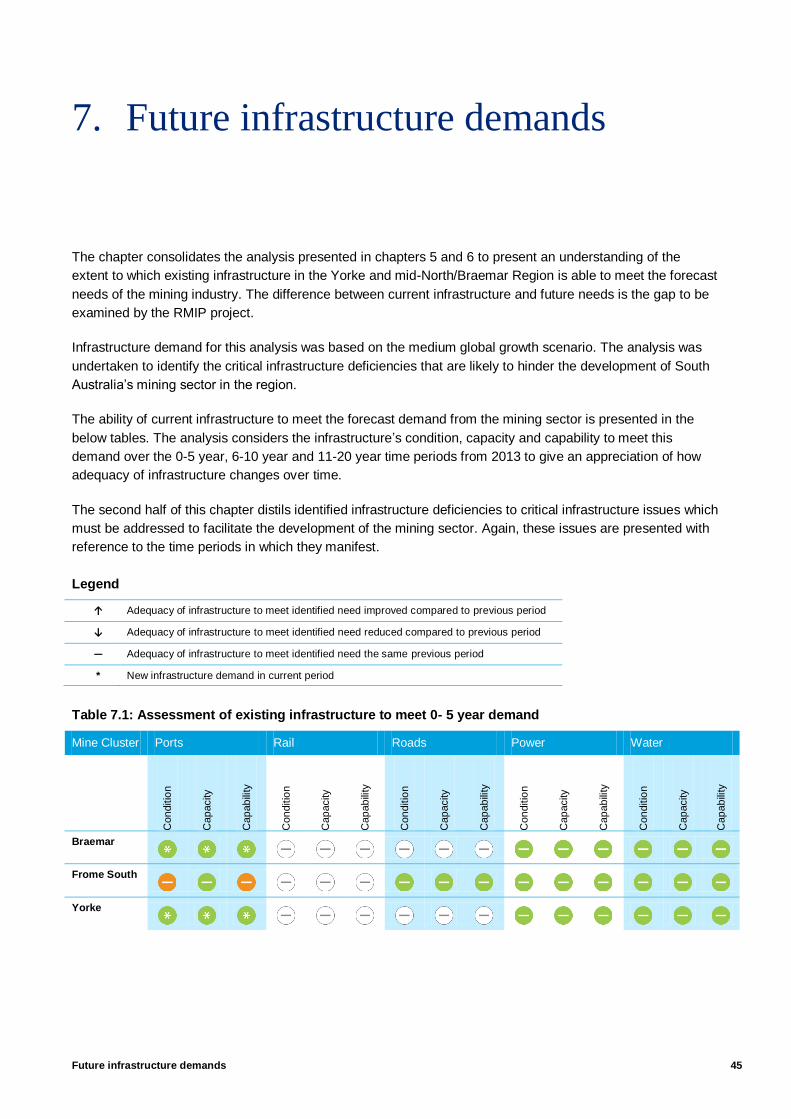
Future infrastructure demands 45
7. Future infrastructure demands
The chapter consolidates the analysis presented in chapters 5 and 6 to present an understanding of the
extent to which existing infrastructure in the Yorke and mid-North/Braemar Region is able to meet the forecast
needs of the mining industry. The difference between current infrastructure and future needs is the gap to be
examined by the RMIP project.
Infrastructure demand for this analysis was based on the medium global growth scenario. The analysis was
undertaken to identify the critical infrastructure deficiencies that are likely to hinder the development of South
Australia’s mining sector in the region.
The ability of current infrastructure to meet the forecast demand from the mining sector is presented in the
below tables. The analysis considers the infrastructure’s condition, capacity and capability to meet this
demand over the 0-5 year, 6-10 year and 11-20 year time periods from 2013 to give an appreciation of how
adequacy of infrastructure changes over time.
The second half of this chapter distils identified infrastructure deficiencies to critical infrastructure issues which
must be addressed to facilitate the development of the mining sector. Again, these issues are presented with
reference to the time periods in which they manifest.
Legend
↑ Adequacy of infrastructure to meet identified need improved compared to previous period
↓ Adequacy of infrastructure to meet identified need reduced compared to previous period
— Adequacy of infrastructure to meet identified need the same previous period
* New infrastructure demand in current period
Table 7.1: Assessment of existing infrastructure to meet 0- 5 year demand
Mine Cluster Ports Rail Roads Power Water
Con
ditio
n
Cap
acity
Cap
ab
ility
Con
ditio
n
Cap
acity
Cap
ab
ility
Con
ditio
n
Cap
acity
Cap
ab
ility
Con
ditio
n
Cap
acity
Cap
ab
ility
Con
ditio
n
Cap
acity
Cap
ab
ility
Braemar
Frome South
Yorke

Future infrastructure demands 46
Table 7.2: Assessment of existing infrastructure to meet 6- 10 year demand
Mine Cluster Ports Rail Roads Power Water
Con
ditio
n
Cap
acity
Cap
ab
ility
Con
ditio
n
Cap
acity
Cap
ab
ility
Con
ditio
n
Cap
acity
Cap
ab
ility
Con
ditio
n
Cap
acity
Cap
ab
ility
Con
ditio
n
Cap
acity
Cap
ab
ility
Braemar
Frome South
Yorke
Table 7.3: Assessment of existing infrastructure to meet 10 - 20 year demand
Mine Cluster
Ports Rail Roads Energy Water
Con
ditio
n
Cap
acity
Cap
ab
ility
Con
ditio
n
Cap
acity
Cap
ab
ility
Con
ditio
n
Cap
acity
Cap
ab
ility
Con
ditio
n
Cap
acity
Cap
ab
ility
Con
ditio
n
Cap
acity
Cap
ab
ility
Braemar
Frome South
Yorke
Key infrastructure issues
Discussed below are the key deficiencies in the current infrastructure which are an impediment to the
development of the mining industry.
Issue A: Lack of access to bulk commodity export port for Braemar mines
The volumes of ore assumed to be produced by mines in the Braemar cluster will require transportation to
markets by large bulk vessels to be commercially viable. This requires bulk commodities export facilities at
which these vessels can be loaded.
There are no operating bulk commodity export ports which can be readily accessed by the mines in the
Braemar region. None of the existing ports on the western side of the Yorke Peninsula or on Gulf St Vincent in
their current configuration will be suitable to load the volume of ore expected to be produced by mines in the
Braemar cluster.
Braemar cluster mines will have no commercially viable access to markets for their product in the absence of
access to a suitable bulk commodities export port.

Future infrastructure demands 47
Issue B: Lack of suitable mine to port bulk transport links to Braemar mines
The ability of miners to safely and efficiently transport bulk commodities to ports for export is critical to miners’
ability to reach their markets.
The existing standard gauge rail network in South Australia is well located to form the majority of a transport
link to port for Braemar cluster mines. There is some spare capacity on this line, however this is unlikely to be
sufficient the meet forecast demand. The rail line which links the Braemar cluster to the northern Yorke
Peninsula area does not link to any bulk commodity export ports as it is currently aligned.
Road freight is unlikely to provide a commercially viable bulk commodity freight transport solution given the
distance between the Braemar cluster and likely port options.
Issue C:Insufficient electricity transmission capacity to Braemar mines
Mining activity requires considerable electricity for the operation of extraction and processing activities. Much
of the infrastructure which may be necessary to support mining activities, such as ports and desalination
plants, have significant electricity demands.
There is no transmission network to the Braemar cluster adequate for the requirements of mining.
Many of the major mining projects in the Braemar cluster involve the mining and processing of magnetite ores
which is particularly electricity intensive. Provision of suitable access to electricity will be critical to the
development of these large scale mining projects.
Issue D: Insufficient electricity transmission to Yorke mines
The electricity needs of mining are discussed in issue C.
The Yorke Peninsula transmission line near capacity as required by service standards, therefore no adequate
capacity exists to service mining in the cluster.
Many of the mining projects in the Yorke cluster involve the mining and beneficiation of copper ores for
shipping as copper concentrate. Provision of adequate electricity will be important to the facilitation of these
energy intensive mining projects.
Issue E: No identified water source for Braemar mines
Mining projects have a range of water needs, including dust suppression, processing, slurry operation and
potable supply.
There is no water mains system in the Braemar region, groundwater is drawn to meet human needs and
watering stock. There will be insufficient groundwater supply to meet the needs of mining.
The table overleaf summarises the key deficiencies in current infrastructure which are an impediment to the
development of the mining industry in the Yorke and Mid-North/Braemar Region. Each of the identified issues
are geographically presented in map which follows.

Future infrastructure demands 48
Table 7.4: Key emerging mining infrastructure issues for the Yorke and Mid-North/Braemar region (2013 – 2032)
Issue 2013-2017 2018-2022 2023-2032
A Lack of access to bulk commodity
export port for Braemar mines Lack of access to bulk commodity export port for Braemar mines
B Lack of suitable mine to port bulk
transport links to Braemar mines Lack of suitable mine to port bulk transport links to Braemar mines
C Insufficient electricity transmission
capacity to Braemar mines Insufficient power transmission capacity to Braemar mines
D Insufficient electricity transmission to
Yorke mines Insufficient power transmission to Yorke mines
E No identified water source for Braemar
mines No identified water source for Braemar mines
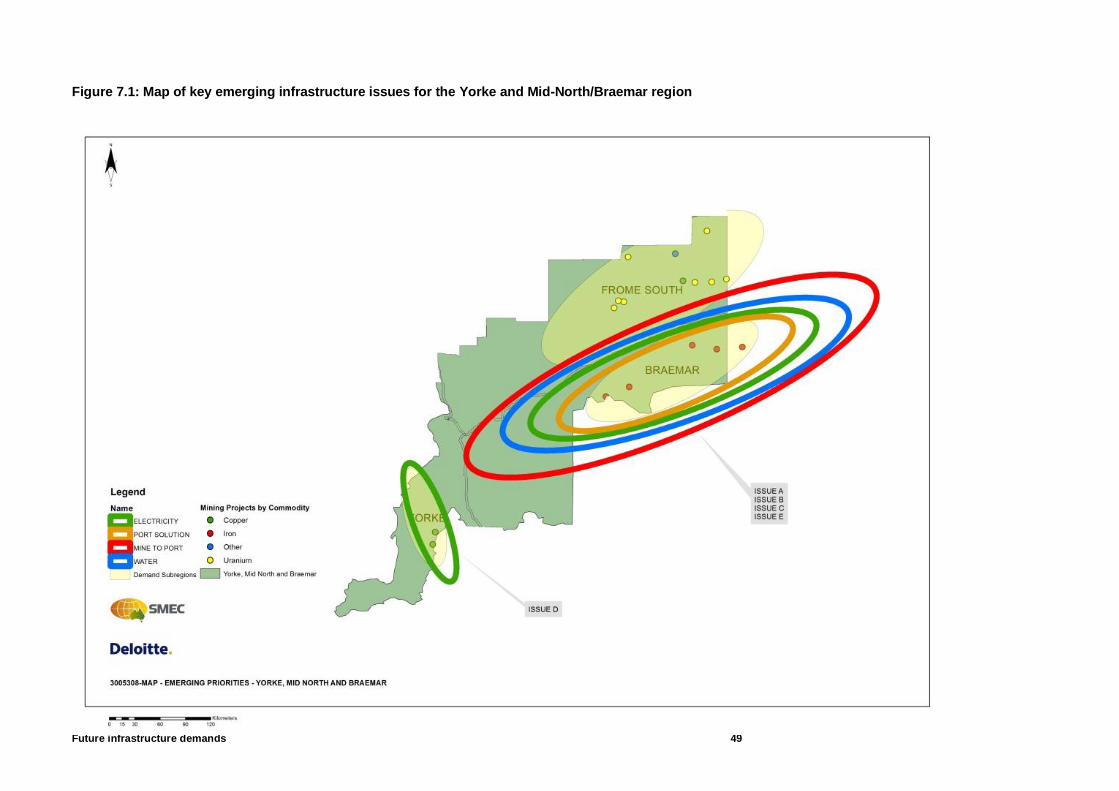
Future infrastructure demands 49
Figure 7.1: Map of key emerging infrastructure issues for the Yorke and Mid-North/Braemar region

Potential infrastructure solutions 50
8. Potential infrastructure solutions
This chapter presents the infrastructure projects, and their associated grouping, which have been identified as
having the potential to address the issues detailed in chapter 7. A summary of each of the projects is
presented to provide an understanding of their underlying technical attributes.
The relative merits of each of these projects are not discussed here. Identified potential projects will be
assessed as part of a detailed prioritisation process which will be informed by the feedback received on this
paper. The detailed prioritisation process will identify:
Groups of projects which have the ability to support mining in South Australia
Interdependencies between projects
Timing for how these projects may be staged
Potential role for government in supporting the delivery of these projects
An assessment of the implications of the implications of the identified projects for social infrastructure
The economic benefits of these projects.
The prioritisation process is discussed in greater detail in Chapter 9.
Projects identified
Projects with the potential to address the issues discussed in chapter 7 have been identified through
consultation with infrastructure proponents, mining proponents and peak bodies.
The table below summarises all the projects which were identified and considered. Through the course of our
investigations it was established one of the identified projects would not be likely meaningfully address issues
identified in chapter 7.
Project Issue
addressed
Considered
Path to market
Whyalla Port expansion No – current expansion to 12mtpa is significant and effective use
of this transhipment option for significant volumes beyond this is
considered unlikely.
Outer Harbour Port expansion No – current mining export is approx 1.8mtpa, with limited
opportunity to increase this with existing infrastructure. Sufficient
expansion to meet mining demand is not likely given port and
‘access to port’ constraints combined with competing priorities for
port use.
Northern Eyre Peninsula port base case + new slurry link from Braemar
A and B Yes
Northern Yorke Peninsula port and rail connection to Snowtown
A and B Yes

Potential infrastructure solutions 51
Northern Yorke Peninsula port and slurry pipeline from Braemar
A and B Yes
Port Pirie with overhead conveyor to transhipment port and associated rail upgrades
A and B Yes
Energy
Connection to possible future 500kV interconnector No – project status uncertain (currently at feasibility study) and
likely to be DC line, which is not suitable.
Link to NSW transmission network No – prohibitive technical challenges
Yorke Peninsula transmission upgrade D Yes
New transmission link from Port Augusta to Braemar
C Yes
On-site diesel generation C Yes
On-site power LPG storage to fuel generation at localised sites
C Yes
Renewable Generation to support Mining loads C and D Yes
Gas line to on-site generation from Moomba –
Adelaide pipeline
C Yes
Water
On-coast desalination plant and transmission main to Braemar cluster
E Yes
Transmission of raw seawater and on-site desalination
E Yes
Mains water from Mannum E Yes
Groundwater investigation E Yes

Potential infrastructure solutions 52
Regional solutions
The figure below is provided to give an understanding of the geographic alignment of the identified infrastructure projects relative to sensitive environmental
areas.

Potential infrastructure solutions 53
Path to market
Identified freight projects have been grouped into paths to market which integrate potential ports with land
transport infrastructure able to deliver product the port. It is necessary to group freight projects focused
around the port for export because of the dependency between the port and landside infrastructure.
The “base case” for the Northern Eyre Peninsula port described in this section includes the port option and
minimum land transport links necessary to provide sufficient throughput of bulk commodity for the port to be
commercially viable (none of which are in the Yorke and Mid-North/Braemar). Land transport links proposed in
addition to the base case for each port have the potential to service the port, but are not critical for commercial
viability.
The four paths to market which have been derived in response to issues identified in the Yorke and Mid-
North/Braemar are:
PTM1: Northern Eyre Peninsula port base case + new slurry link from Braemar
PTM2: Northern Yorke Peninsula port and rail connection to Snowtown
PTM3: Northern Yorke Peninsula port and slurry pipeline from Braemar
PTM4: Port Pirie with overhead conveyor to transhipment port and associated rail upgrades
Northern Eyre Peninsula Port Base case
Project description: A range of initiatives including rail connection to Whyalla, partial duplication and upgrade of rail to Wirrida, and road
upgrades from the Port to South Gawler. Use existing rail links from Braemar Region. Rail links for Far North mines listed because these would be necessary to secure sufficient volumes to justify port development.
Issues addressed:
A. Lack of access to bulk commodity export port for Braemar mines
B. Lack of suitable mine to port bulk transport links to Braemar mines
Capital cost: Port; $750m - $1b

Potential infrastructure solutions 54
Rail; $500m
Road; $120m
Capacity: 20 mta
Scalability of capacity and planned upgrades: Port and rail connection to existing freight corridor initially established for 20mtpa and
expandable for in excess of 50mtpa. Rail upgrades of existing corridors can be done in stages as demand requires. Road upgrades can be done in stages as demand requires.
Lead time to operation: 4 years
Clusters and industries serviced:
Clusters - Mount Woods, Tarcoola, Mount Christie, Braemar, South Gawler, Central Eyre
Supported Industries - Fuel, mining consumables, grain
Key technical construction and operational risks:
Two port locations in this region have previously been identified by others;
Port Bonython (adjacent to the existing Port Bonython jetty) has been identified due to its access to deep water and close proximity to road, rail and utility services. The Spencer Gulf Ports Link consortium has undertaken feasibility assessments and is currently conducting an Environmental Impact Study for the site.
Port Nonowie, south of Whyalla, has been identified by the Alternative Ports Working Party. Detailed feasibility assessments have not been undertaken for this site.
Key technical and operational considerations are;
Proximity to deep water. This will impact capital cost
How sheltered the deep water is, from both weather and tidal impacts. This will impact capital and operating costs.
Shipping channel depths and capacity. The shipping channel to a Northern Eyre Peninsula Port has high levels of available capacity
Proximity to road, rail and utility services – impacts capital cost.
Community impacts – during construction and operation
Environmental impacts
Rail
Geographic, hydrology and flooding – unknown levels
Geotechnical conditions – existing terrain not investigated
Signalling system upgrade likely to be required
Much of the corridor has sufficient width for duplication but some land acquisition would be required.
Port Augusta triangle required (to enable trains to bypass Port Augusta going to/from Whyalla).
Additional and busier level crossings (currently 3 No. excluding Port Augusta)
General comments: Irrespective of where a Northern Eyre Peninsula Port is located;
Advantages
Being centrally located, the Port could support the Far North, Eyre and Western and Braemar regions of the state
Good opportunity to connect to the main standard gauge freight rail network – maximises use of rail for freight
Well positioned for road access from South Gawler Cluster
Well positioned for power and water connections to the Port
Rail upgrades may benefit broader rail users
May be an efficient alternative port for grain export
Port is well positioned for the import of mining consumables
Disadvantages
A number of issues associated with increased rail use, particularly in relation to road level crossings
May not be the ‘most efficient’ option for Eyre and Western and Braemar Regions.
Large central port may require additional land transport
High capital cost

Potential infrastructure solutions 55
PTM1: Northern Eyre Port base case + new Slurry link from Braemar
Project description: As for Northern Eyre Peninsula port base case plus new slurry link from Braemar region.
Issues addressed:
A. Lack of access to bulk commodity export port for Braemar mines
B. Lack of suitable mine to port bulk transport links to Braemar mines
Capital cost: Slurry link from Braemar; $800m (excludes water supply and return water line)
Capacity: 20 mta
Scalability of capacity and planned upgrades: Pipe arrangement within the corridor can be structured to enable future expansion (i.e.;
install additional pipes). System can operate in ‘batch mode’ during lower capacity periods.
Lead time to operation: 2-3 years
Clusters and industries serviced:
Clusters – Braemar
Supported Industries – Nil
Key technical construction and operational risks:
Requires suitable water (unlikely that seawater is suitable although product specific assessment is needed to confirm this). For
20mtpa, estimated water requirements are 13GL per annum.
Requires suitable power source for pumping. For 20mtpa, estimated power demand is 11 MW.
Requires suitable method of disposal of de-watered product OR method of recycling water at higher cost.
Management of risk of leaks.
Requires easement corridor for installation.
Geotechnical issues associated with construction.
General comments:
Advantages
As a result of the underground installation of the Slurry Pipe system, community impacts are minimised. E.g.; no impact on road
crossings or ongoing use of farming land following installation.
Can service numerous mines and can consolidate impacts by using a common corridor

Potential infrastructure solutions 56
Is a long-life solution with limited maintenance requirement.
Disadvantages
Significant associated water and power supply requirements.
Limited opportunity for this infrastructure to benefit other sectors, other than possibly associated with water and power supply
solutions.

Potential infrastructure solutions 57
PTM2: Northern Yorke Peninsula port base case + rail connection to Snowtown
Project description: New Port facility in the Northern Yorke Peninsula area plus new rail connection to Snowtown. Use existing rail network to Snowtown.
Issues addressed:
A. Lack of access to bulk commodity export port for Braemar mines
B. Lack of suitable mine to port bulk transport links to Braemar mines
Capital cost: Port ; $200 - $750m (depending on transhipment v Deep Water Port)
Rail link from Snowtown to Port; $325m
Capacity: 20 mta
Scalability of capacity and planned upgrades: Port can be expandable to cater for higher volumes. Additional capacity can be made
available in the rail corridor providing sufficient corridor width is established initially.
Lead time to operation: 4 years
Clusters and industries serviced:
Clusters – Braemar
Supported Industries –mining consumables, grain, fertiliser
Key technical construction and operational risks:
Possible Port locations have been previously identified north and south of Wallaroo. Port could be established as a Deep Water
Port with Wharf (approx.. 4kms long) or as a Transhipment facility
Rock subgrade for Port infrastructure construction
New rail link can use existing dis-used corridor from Snowtown for approximately 30kms. Some grade improvement and curve
easing is likely to be required.
Additional level crossings
Approximately 35km will require the establishment of a new rail corridor – impact on land owners and adjacent land use.
Geotechnical and topography aspects may add to capital costs
Capacity of existing rail corridor between Crystal Brook and Broken Hill will need to be increased via additional passing loops to
cater for 20mtpa.
Environmental interfaces

Potential infrastructure solutions 58
General comments:
Advantages
Northern Yorke Peninsula Port is well positioned for efficient operating costs for Braemar Region
Also well positioned to support grain / agriculture in this sector
Good opportunity for large storage areas at Port
Possible use of partial existing rail corridor
Currently in excess of 10mtpa available capacity on existing rail freight corridor.
Disadvantages
A number of issues associated with new rail corridor, particularly in relation to road crossings and impacts on adjacent land use
High capital cost
May render existing Wallaroo Port redundant

Potential infrastructure solutions 59
PTM3: Northern Yorke Peninsula Port + Slurry pipeline from Braemar
Project description: As for project PTM2 but replace rail link from Braemar with Slurry Pipeline.
Issues addressed:
A. Lack of access to bulk commodity export port for Braemar mines
B. Lack of suitable mine to port bulk transport links to Braemar mines
Capital cost: Slurry Pipeline from Braemar; $700m (excludes water supply)
Capacity: 20 mta
Scalability of capacity and planned upgrades: Slurry pipe arrangement within the corridor can be structured to enable future expansion (i.e.; install additional pipes). System can operate in ‘batch mode’ during lower capacity periods.
Lead time to operation: 2-3 years
Clusters and industries serviced:
Clusters – Braemar
Supported Industries – Nil
Key technical construction and operational risks:
Requires suitable water (unlikely that seawater is suitable although product specific assessment is needed to confirm this). For
20mtpa, estimated water requirements are 13GL per annum.
Requires suitable power source for pumping. For 20mtpa, estimated power demand is 11 MW.
Requires suitable method of disposal of water from de-watered product OR method of recycling water at higher cost.
Management of risk of leaks.
Requires easement corridor for installation. May be an option to use existing rail corridor for sections.
Geotechnical issues associated with construction.
General comments:
Advantages
As a result of the underground installation of the Slurry Pipe system, community impacts are minimised. E.g.; no impact on road
crossings or ongoing use of farming land following installation. May be able to use existing rail corridor.
Is a long-life solution with limited maintenance requirement.

Potential infrastructure solutions 60
Disadvantages
Significant associated water and power supply requirements.
Limited opportunity for this infrastructure to benefit other sectors, other than possibly associated with water and power supply
solutions.

Potential infrastructure solutions 61
PTM4: Port Pirie with overhead conveyor to transhipment and associated rail upgrades
Project description: Rail upgrade into Port Pirie and Conveyor to transhipment port.
Issues addressed:
A. Lack of access to bulk commodity export port for Braemar mines
B. Lack of suitable mine to port bulk transport links to Braemar mines
Capital cost: Rail works: $75m
Port works: $50 - $150m
Capacity: 20 mta
Scalability of capacity and planned upgrades: Can be started at lower volumes and transhipment approach may possibly be expandable
beyond 20mtpa. Rail capacity upgrades would need to be designed in for future expansion. Rail capacity expansion between Broken Hill and Port Pirie likely to be required above 8mtpa.
Lead time to operation: 2-3 years
Clusters and industries serviced:
Clusters – Braemar
Supported Industries – Rail upgrade support general freight movement
Key technical construction and operational risks:
Location of balloon loops for rail access to be determined. Consideration will need to be given to community impacts and soil
conditions (geotechnical and environmental). It is anticipated approximately 6km of rail would need to be constructed.
In association with the above, conveyor system link between rail delivery and barge loading will need to consider community
impacts. Various options have previously been considered.
Road / Rail interface issues
The Port is constrained by a long channel (approximately 9 nautical miles) and is likely to require three transhipment points to
load Cape size vessels. It is anticipated that it will take 5-8 days to load a ship, depending on weather.
General comments:
Advantages
Good proximity to existing freight rail network
Freight rail network has some capacity to carry additional mining product without augmentation.
Relatively low capital cost

Potential infrastructure solutions 62
High flexibility / scalability
Disadvantages
Operating cost
Potential community impacts adjacent to main commercial area of town

Potential infrastructure solutions 63
Energy
The six energy projects have been derived in response to issues identified in the Yorke and Mid-
North/Braemar are:
E1: Yorke Peninsula transmission upgrade
E2: New transmission link from Port Augusta to Braemar
E3: On-site diesel generation
E4:On-site power LPG storage to fuel generation at localised sites
E5: Renewable Generation to support Mining loads
E6: Gas line to on-site generation from Moomba – Adelaide pipeline
E1: Yorke Peninsula Transmission upgrade
Project description: Create a new 275kV injection point at the top of Yorke Peninsula and establish a second 132kV line into Yorke
Peninsula.
Issue addressed:
D. Insufficient power transmission to Yorke mines
Capital cost: $170 million
Capacity: >70MW
Scalability of capacity and planned upgrades: Can be staged by installing one transformer only initially and establishing 132kV line only
when required.
Lead time to operation: 2-3 years
Clusters and industries serviced:
Clusters - Yorke
Supported Industries – renewable energy generation, support to residential, commercial and industrial loads through this region
Key technical construction and operational risks:
Requires acquisition of an easement.

Potential infrastructure solutions 64
Upstream transmission network capability would need to be considered in the context of other potential demand increases from
Far North and Eyre and Western Regions. There may be alternatives to link to an alternative transmission network (e.g.; Ceres
wind farm), however peaking supply will need to be considered.
General comments:
Advantages
Improves overall security of power supply to the Region
May facilitate additional renewable energy supply from these regions
Disadvantages
Easement procurement
Capital cost

Potential infrastructure solutions 65
E2:New transmission link from Port Augusta to Braemar
Project description: Single circuit 200MW 132kV line from Davenport to Braemar Region
Issue addressed:
C. Insufficient power transmission capacity to Braemar mines
Capital cost: $175 million
Capacity: 200MW
Scalability of capacity and planned upgrades: Low scalability as the line is required in the first stage of the project.
Lead time to operation: 3 years
Clusters and industries serviced:
Clusters - Braemar, Frome South
Supported Industries – renewable energy generation, support to residential, commercial and industrial loads through these regions
Key technical construction and operational risks:
This will not support the potential high demand case for the region. This would require a 275kV transmission at higher cost.
Requires acquisition of an easement.
Upstream transmission network capability would need to be considered in the context of other potential demand increases from
Far North and Eyre and Western Regions.
General comments:
Advantages
Improves overall security of power supply to the Region
May facilitate additional renewable energy supply from these regions
Disadvantages
Easement procurement
Capital cost
Transmission link to
Braemar Region

Potential infrastructure solutions 66
E3: On-site diesel generation
Project description: Provision of on-site diesel storage to fuel on-site power generation at localised site/s
Issue addressed:
C. Insufficient power transmission capacity to Braemar mines
Capital cost: $1.0 million per MW
Capacity: 2 – 300 MW
Scalability of capacity and planned upgrades: High flexibility - Capacity can be added or removed in line with demand.
Lead time to operation: < 1 year
Clusters and industries serviced:
Clusters - All
Supported Industries - Nil
Key technical construction and operational risks:
High operating cost for large demand
General comments:
Solution already adopted at a number of existing mine sites – generally with relatively low power demand
Advantages
High flexibility to ramp up or down with demand
Short lead time to operation
Low capital cost for low demands
Disadvantages
Cost of transporting diesel
Impact on road network of additional heavy vehicles
Environmental impact of diesel emissions
Reliability of supply – backup generation may be appropriate in some circumstances
High operating costs for larger demands

Potential infrastructure solutions 67
E4: On-site LPG Power Station to service individual sites
Project description: Provision of on-site LPG storage to fuel on-site power generation at localised site/s
Issue addressed:
C. Insufficient power transmission capacity to Braemar mines
Capital cost: $2.1 million per MW
Capacity: 2 – 300 MW
Scalability of capacity and planned upgrades: Capacity can be added or removed in line with demand.
Lead time to operation: 1 year
Clusters and industries serviced:
Clusters - All
Supported Industries - Nil
Key technical construction and operational risks:
Freight task for LPG
High Operating cost for larger demands
General comments:
Advantages
Short lead time to operation
High flexibility
Disadvantages
High operating cost for larger / longer term demands
Impact on road network of additional heavy vehicles
Reliability of supply may warrant backup system

Potential infrastructure solutions 68
E5: Renewable Generation to support Mining loads
Project description: Renewable generation plant/s as required to provide Electrical supply to mining loads. Generation could be via;
Solar, Wind, Wave, Geothermal or Hybrid technologies.
Issue addressed:
C. Insufficient power transmission capacity to Braemar mines
D. Insufficient power transmission to Yorke mines
Capital cost: Solar; $7m - $10m / MW
Wind; $2 - $3m / MW
Geothermal; $5 - $10m / MW
Capacity: As required
Scalability of capacity and planned upgrades: Plants can be established in a ‘modular’ approach as demand requires.
Lead time to operation: 1-3 years
Clusters and industries serviced:
Clusters - All
Supported Industries – community if connected to transmission network grid, renewable energy sector

Potential infrastructure solutions 69
Key technical construction and operational risks:
Often higher capital cost but lower operating cost
Solar and Wind are an intermittent source and will require ‘backup’ supply. Backup supply could be via alternative on-site
generation (such as diesel or gas generation), or via hybrid solutions (such as diesel / solar / batteries) or via connection to
the grid transmission network.
Geothermal is a potential ‘base load’ supply.
New or establishing technology in some areas. Wind and Solar are established commercial methods. Geothermal or Wave
are developing technologies. Large scale storage is a developing technology.
Proximity of suitable generation location may still require transmission to power demand point/s
General comments:
Advantages
Aligns with South Australian Renewable Energy plan and South Australian Strategic Plan
Does not necessarily rely on network transmission upgrade
Possible entitlement to ‘green energy funds’
Disadvantages
May be a higher up-front cost solution overall (depending on available options for funding support), particularly if two
generation sources are required (i.e.; backup supply) – although may be cost effective over a longer period of time due to low
operating costs
Proximity of available generation to demand – particularly for Geothermal
Potential community concerns; e.g.; wind farms in some locations
Possible requirements for land if facilities not able to be located on mine site
Limited broader community benefits unless integrated with the electricity grid
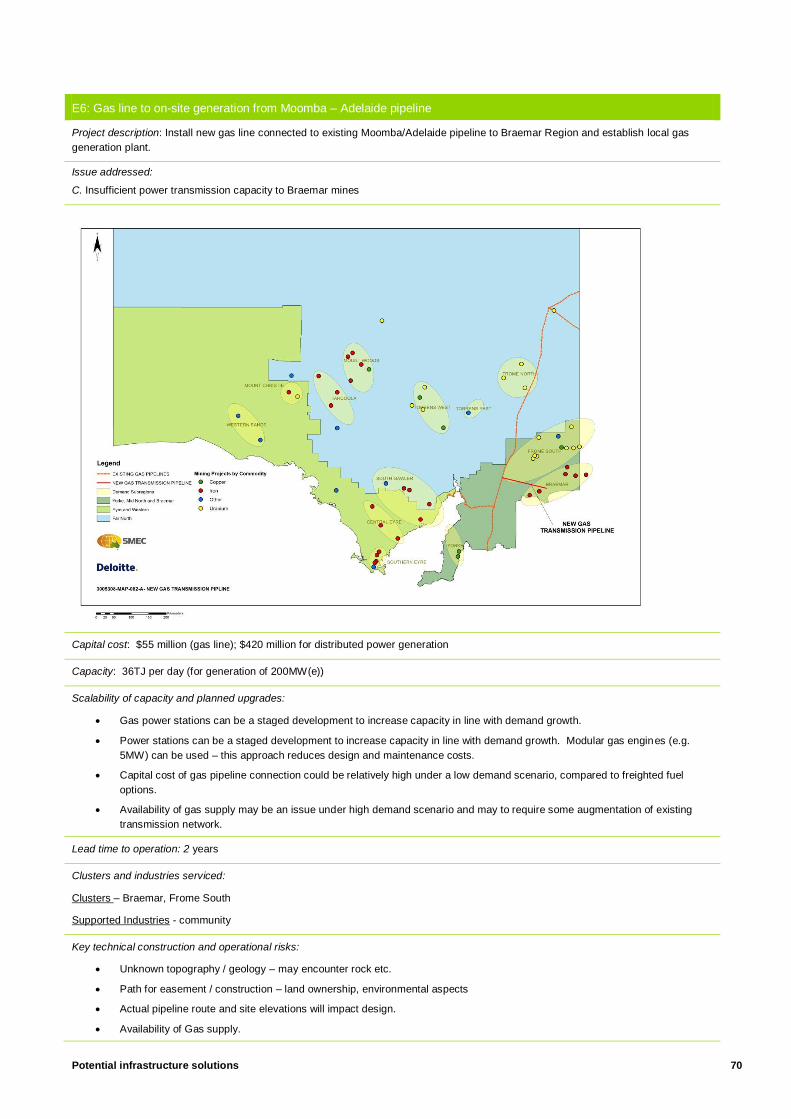
Potential infrastructure solutions 70
E6: Gas line to on-site generation from Moomba – Adelaide pipeline
Project description: Install new gas line connected to existing Moomba/Adelaide pipeline to Braemar Region and establish local gas
generation plant.
Issue addressed:
C. Insufficient power transmission capacity to Braemar mines
Capital cost: $55 million (gas line); $420 million for distributed power generation
Capacity: 36TJ per day (for generation of 200MW(e))
Scalability of capacity and planned upgrades:
Gas power stations can be a staged development to increase capacity in line with demand growth.
Power stations can be a staged development to increase capacity in line with demand growth. Modular gas engines (e.g.
5MW) can be used – this approach reduces design and maintenance costs.
Capital cost of gas pipeline connection could be relatively high under a low demand scenario, compared to freighted fuel
options.
Availability of gas supply may be an issue under high demand scenario and may to require some augmentation of existing
transmission network.
Lead time to operation: 2 years
Clusters and industries serviced:
Clusters – Braemar, Frome South
Supported Industries - community
Key technical construction and operational risks:
Unknown topography / geology – may encounter rock etc.
Path for easement / construction – land ownership, environmental aspects
Actual pipeline route and site elevations will impact design.
Availability of Gas supply.

Potential infrastructure solutions 71
General comments:
Advantages
Flexibility and mobility of generation
Miners build own and operate their own (modular generation plant)
Reduced cost and impact of above ground power transmission
Lower cost of generation for larger demands compared to diesel or LPG
Disadvantages
Capital cost

Potential infrastructure solutions 72
Water
The three water projects have been derived in response to issues identified in the Yorke and Mid-
North/Braemar are:
W1: On-coast desalination plant and transmission main to Braemar cluster
W2: Transmission of raw seawater and on-site desalination
W3: Mains water from Mannum
W4: Groundwater investigation
W1: On-coast Desalination plant and transmission main to Braemar cluster
Project description: On-coast desalination to potable water quality and transmission to Braemar region.
Issue addressed:
E. No identified water source for Braemar mines
Capital cost: $1b
Capacity: 12 GL/a
Scalability of capacity and planned upgrades: Limited scalability - initial intake / outlet sizing and transmission main should be sized for maximum forecast demand. Modular booster pumping can be incorporated.
Lead time to operation: 3-4 years
Clusters and industries serviced:
Clusters – Braemar, Frome South
Supported Industries – Agriculture, tourism, community
Key technical construction and operational risks:
Environmental method of reusing / disposal of desalination process waste brine
Transmission main route will require easement / construction disruption
Power requirement for desalination plant and pumping (approximately 3-4 MW

Potential infrastructure solutions 73
General comments:
The desalination plant can be designed to desalinate seawater to different salinities to suit different end-uses. This option
assumes desalination to the salinity level required for potable water but a re-mineralisation process is required to bring the
mineral content of the desalination water to normal levels.
If desalination is undertaken to a lesser extent (e.g. suitable for mine processing, dust suppressant etc.), the ability to use this
water for other sectors and the broader community is reduced without further subsequent desalination.
Advantages
Opportunities to supply other potential users from the transmission pipeline and increase water security for these users. Outlet
points could be provided at minimal additional cost. Outlet points could also be used of fire-fighting.
Disadvantages
A centralised desalination point cannot produce water of varying quality for different users.
Power supply availability
High capital cost

Potential infrastructure solutions 74
W2: Transmission of Raw seawater and on-site desalination
Project description: Seawater transported from the coast and desalinated as required at each site.
Issue addressed:
E. No identified water source for Braemar mines
Capital cost: $1.2b (allows for 6 individual desalination units)
Capacity: 13 GL/a
Scalability of capacity and planned upgrades: Limited scalability for raw seawater pump and transmission main - initial intake / outlet
sizing and transmission main should be sized for maximum forecast demand. Modular booster pumping arrangements can be incorporated. Individual desalination plants can be applied or removed as demand dictates.
Lead time to operation: 3-4 years
Clusters and industries serviced:
Clusters – Braemar, Frome South
Supported Industries – Agriculture, oil and gas, tourism, community
Key technical construction and operational risks:
Management of pipeline durability from saline water
Management of risks of brine spills or leaks during operation. May require detection system, ‘sleeving’ or regular detention
ponds
Treatment / reuse / disposal of waste brine at individual desalination sites.
Transmission main route will require easement / construction disruption
Power requirement for desalination at individual site
General comments:
Advantages
Product water quality can be tailored to suit each individual users' requirements. An individual user can use raw seawater or
desalinated water for different purposes.
Good flexibility for other users to use the pump and transmission pipeline system and apply their own desalination.

Potential infrastructure solutions 75
Disadvantages
Management of the risk of seawater leaks
Management / reuse / disposal of waste brine at individual sites
Provision of power at remote sites for desalination

Potential infrastructure solutions 76
W3: Mains water to Braemar / Frome South
Project description: Install new water main to pump mains water to Braemar / Frome South.
Issue addressed:
E. No identified water source for Braemar mines
Capital cost; $300 - $600 million
Capacity: 12 GL/a
Scalability of capacity and planned upgrades: Limited scalability for pump and transmission main - initial intake / outlet sizing and
transmission main should be sized for maximum forecast demand. Modular booster pumping arrangements can be incorporated.
Lead time to operation: 3 years
Clusters and industries serviced:
Clusters - Braemar, Frome South
Supported Industries – agriculture, community
Key technical construction and operational risks:
Location of pumping from the river would need review in the context of the whole water supply network. Potential pumping
locations could be Morgan, Swan Reach or Mannum.
Overall water security for SA would need to be assessed. Adelaide desalination plant may assist with providing additional
capacity to the network as a whole, although it is recognised that the primary role of this facility is to support the community
water supply needs in periods of low water availability. This needs to be maintained and therefore may impact reliability of
supply to the mining sector at these times.
Easement for transmission pipe installation – land owner impacts
General comments:
Advantages
Broadly consistent approach with the water supply approach for much of South Australia’s existing supply system
Good quality water
Supports water security for the Braemar and Frome South Region communities
Lower capital cost than drawing water from the coast

Potential infrastructure solutions 77
Disadvantages
May not be reliable in periods of low water supply, if the full capacity of the Adelaide desalination plant is required to support
existing community needs
Impacts on land owners associated with establishing transmission pipe easements and undertaking construction.

Potential infrastructure solutions 78
W4 – Groundwater Investigation
Project description: Undertake a high level overview analysis, building on existing knowledge bases, of the potential for further
groundwater use in the Mid-North / Braemar. Include consolidation of existing available data for easy and consistent access.
Capital cost: $2 - $5 million
Capacity: N/A
Scalability of capacity and planned upgrades: N/A
Lead time to operation: N/A
Clusters and industries serviced:
Clusters – Frome South, Braemar
Supported Industries – agriculture, community
Key technical construction and operational risks:
Undertake in partnership with DEWNR and NRM to ensure appropriate processes are followed and outcomes are maximised.
General comments:
Advantages
Improved early understanding of groundwater conditions will assist in early identification of environmentally sustainable
solutions for planning and development.
May improve overall levels of confidence of the understanding of environmental impacts of proposals
Consolidated database may assist mining, farming and other community water supply planning by minimising the extent of
investigation works required to establish confidence (or otherwise) in the feasibility of a water supply option.
May assist Government approval processes where water supply proposals can be demonstrated to be consistent with
improved knowledge of groundwater availability and conditions.
Disadvantages
Capital cost

Next steps 79
9. Next steps
Stakeholder consultations
The consultation process is open to all those who have an interest in the content of the final RMIP plans. The
release of the interim reports has been accompanied by a media release, advertisements in local media and
displays in regional councils.
The release of the plans with supporting documentation is accompanied by drop in information sessions open
to the general public and targeted group specific workshops. Additionally, roving interviews will be conducted
with parties which have specific knowledge critical to the effective development of the final plans.
Consultation is expected to include a diverse cross section of government, industry and the community,
including:
Regional Development Australia
Peak industry bodies
Councils
Mining interests
Environmental groups
Existing and potential infrastructure owners and developers
Regulators
Industries with an interest in mining
Other impacted industries
Community groups and individuals
Businesses.
Prioritisation
A process of detailed prioritisation of projects and solution clusters will follow the receipt of feedback from
interested parties.
Purpose
The prioritisation process will seek to identify those projects which have the greatest ability to deliver wide-
ranging benefits to South Australia and when they will ideally be delivered.
Clearly, the approach to the assessment and prioritisation of potential infrastructure projects is central to
determining the relative merits of each project. A prioritisation framework was developed for the RMIP project
which is based on the published strategic priorities of the South Australian and Commonwealth Governments.

Next steps 80
The prioritisation framework is a systematic and objectives-driven approach to prioritise and rank potential
infrastructure projects.
Approach to prioritisation
The prioritisation framework will be utilised is an objectives-driven approach to assessing the relative merits of
different infrastructure initiatives and solutions. Prioritisation based on this approach is an efficient means of
filtering and identifying solutions that are more likely to meet identified strategic priorities.
Alignment to the two objectives noted below will be measured using a multi-criteria assessment (MCA)
framework. The MCA framework will provide a useful means of summarising the performance of particular
infrastructure solutions against multiple metrics to arrive at an overall prioritisation score. The MCA framework
will permit sufficient flexibility to assess impacts that are either quantitative or qualitative in nature.
The development of the MCA framework for this project included the following steps:
1. Identify objectives: these are themes and statements relating to what seeks to be achieved
2. Identify criteria: criteria are defined to measure the achievement of each objective. One or more criteria
may be used to measure the achievement of identified objectives. In some instances, criteria may be
defined as ‘showstoppers’, in which case initiatives or solutions which do not meet these criteria will not be
considered further
3. Weight criteria: some criteria may be considered more important than others, this is reflected in the
analysis by weighting criteria in alignment with their relative importance in measuring alignment to
identified objectives
4. Develop a portfolio of initiatives and solutions: a discrete set of infrastructure initiatives or solutions
that may meet the defined objectives is selected
5. Scoring: for each infrastructure initiative or solution, a score is assigned against each criterion. Scores will
be based on available metrics and indicators, predicative models or professional judgment
6. Rank initiatives and solutions: using predefined weights, scores are combined to calculate the weighted
score for each option. The calculated score will be used for the initial ranking of infrastructure initiatives or
solutions.
The first four stages of this process have been undertaken and the final two will be completed after
consultation on this interim report has been finalised.
Prioritisation objectives
The prioritisation framework assesses each infrastructure project for alignment to against two objectives:
The strategic objective is a reflection of the extent to which the project aligns to the strategic
objectives of government
The deliverability objective is a reflection of the extent to which the project exhibits or lacks barriers to
implementation.
Assessment against each of the objectives above will be undertaken separately. While it is ultimately the hope
of the RMIP project to identify projects with strong strategic and deliverability merit, separate scoring permits
the identification of projects with strong strategic merit, but require further investigation and planning.

Next steps 81
Strategic objective
The prioritisation framework is based on the following published South Australian and Commonwealth
documents:
Regional Infrastructure Fund Guidelines
South Australia’s Seven Strategic Priorities
South Australia’s Strategic Plan
Strategic Infrastructure Plan for South Australia
30 Year Plans for Regional South Australia
Infrastructure Australia’s Principles for Regional Infrastructure Planning
RDA Roadmaps.
The strategic priorities in the documents listed above were distilled five assessment criteria:
Efficiency of delivery (strategic importance to multiple mines)
Facilitation of growth in the mining and minerals processing industries
Contribution to economic prosperity
Regional and community impact
Environmental benefit/costs.
Deliverability objective
It is likely many of identified projects will have strategic merit, the ability for them to be implemented will be
considered when assessing against the deliverability objective. The assessment of the deliverability of each
project will give consideration to:
Affordability
Legislative and political risks
Planning gaps (does an effective planning regime exist for the project?)
Constructability
Commercial feasibility
Ongoing commercial viability
Ability to leverage partner funding for government and the private sector.
Ranking of solutions
Rather than combining the strategic objective and deliverability object scores, the scores will be kept
separate. By keeping these two scores separate, it will be possible to identify solutions that score well against
both objectives or are relatively strong in one only. This granularity will highlight what needs to be addressed
in other to improve the overall desirability of solutions.
Scores for each initiative or solution will be mapped as demonstrated in Figure 9.1 overleaf.

Next steps 82
Figure 9.1: Conceptual Mapping of Scores
One of three classifications will be assigned to each potential solution based on its position in the chart. Table
9.1 provides a description of how categorisation of initiatives or solutions in each of the three classifications
may be interpreted.
Classifications are visually represented in Figure 9.2.
Table 9.1: Assigned Classifications
Assigned Classification Interpretation
Highest Priority High level of confidence that an initiative or solution is of high strategic value with a high level of confidence that there are limited barriers to its development.
Moderate Priority An initiative or solution may be of strategic value but require more planning, analysis and design to confirm.
Lowest Priority Given the long lead times for delivering infrastructure projects, this window will include many of
the most important major investments for South Australia that are still at a formative stage – these initiatives and solutions may still have a game changing impact on South Australian mining industry and economy.
0%
33%
67%
100%
0% 33% 67% 100%
Stra
tegi
c O
bje
ctiv
e S
core
Deliverability Objective Score

Next steps 83
Figure 9.2: Conceptual Mapping of MCA Scores
Outcomes of prioritisation
Solutions that demonstrate high strategic and deliverability alignment will be assigned the highest priority
development.
Solutions that demonstrate high strategic alignment but low deliverability shall be investigated for additional
planning and investment to remove or reduce barriers to investment or identify mitigations to key risks.
Solutions that demonstrate low strategic alignment but high deliverability will require consideration of possible
changes to the solution in order to deliver greater strategic benefit.
The role for government
Whether or not there is a role for government in facilitating the delivery of the preferred infrastructure solutions
will follow the identification of a suite of prioritised projects.
The potential role for government in the delivery of the prioritised projects will be classified into the categories
below:
Regulation reform to better facilitate private sector investment
Policy reform to better facilitate private sector investment
Intervention to reduce the level of risk borne by one or multiple private sector parties.
In addition to the environmental factors listed above, a role for government will also be identified where market
structures do not exist which will facilitate a desirable South Australia-wide investment.
Each prioritised project will be assessed to determine if it will proceed in the absence of government action,
and if it will not, the appropriate course of action to facilitate development.
0%
33%
67%
100%
0% 33% 67% 100%
Stra
tegi
c A
lign
me
nt
Sco
re
Deliverability Score
LOWEST PRIORITY
MODERATE PRIORITY
Address Deliverability
Ad
dre
ss S
trat
egic
Alig
nm
ent
HIGHEST PRIORITY

Next steps 84
At the completion of this process the preferred roles of government and the private sector will be clearly
articulated.
Economic modelling
Following the identification of prioritised infrastructure projects an assessment of the expected economic
implications of these projects will be undertaken. The economic assessment will be undertaken using the
Deloitte Access Economics-Regional General Equilibrium Model (DAE-RGEM). The model is sensitive to the
linkages between different industry sectors in the three regions considered in this study and the rest of South
Australia as well as the impact of potential royalties paid by miners. The DAE-RGEM is a practical way of
tracing the myriad of economic effects that follow the implementation of the projects which will be prioritised.
These effects will be aggregated to form and economy-wide understanding of the impact of the plan.
The outputs of the economic modelling will be a series of macroeconomic indicators which give a clear
understanding of the economic benefits of prioritised projects for the region, South Australia and Australia.
Outputs of the economic modelling will include forecasts of:
Gross state product (GSP)
Industry shares of GSP
Investment activity
Employment levels
Wage levels
Intrastate, interstate and international trade.
Social assessment
The economic modelling will be complemented by an assessment of the social implications of the
infrastructure prioritised and associated mining developments.
The starting point for the social assessment will be the regional profiles in chapter three of this document
which detail the prevailing socio-economic conditions in the region. The experience of similar communities
which have experienced considerable change as a result of mining development will inform the types of
impacts expected to manifest.

How you can provide feedback 85
10. How you can provide feedback
Feedback from stakeholders will be a critical to ensuring the final plan is sensitive to the interests of a wide
range of community members.
Feedback is sought in relation to the questions below for each of the three types of infrastructure (freight,
water and electricity):
Are the future infrastructure gaps and/or issues adequately identified?
Have all feasible potential infrastructure solutions been identified?
When assessing potential solutions, what are the key issues which should be considered
(e.g. economic, environmental and social implications)?
Are barriers to the development of priority infrastructure solutions government may seek to address
adequately identified?
Are there any other issues in relation to the RMIP project you wish to raise?
Interested stakeholders are invited to submit their responses electronically at the link below or make a hard
copy submission. If you wish to make a hard copy submission, please contact your RDA to receive a copy of
the feedback form.
Link to access submission portal: www.dpti.sa.gov.au/infrastructure/infrastructure_projects/regional_mining_and_infrastructure_planning_project

References 86
References
Alternative Port Working Party (2012) Whyalla Strategic Outlook – Mar 2012
Aurecon (2010) RESIC Infrastructure Demand Study - January 2010
Australian Bureau of Statistics, Census, 2011
Austroads (2005) Economic Evaluation of Road Investment Proposals: Overtaking lanes
Austroads (2009) Guide to Road Design Part 3
Bureau of Infrastructure Transport and Regional Economics (2009) National Road Network Intercity
Traffic Projection to 2030: Working paper 75
Department for Manufacturing, Innovation, trade, Resources and Energy (2012) PACE 2020 -
October 2012.
Department of Planning Transport and Infrastructure (2012) Future Directions – Optimising our
Transport Corridors – August 2012
Department of Planning Transport and Infrastructure (2012) Heavy Vehicle Access Framework – May
2012
Department of the Premier and Cabinet (2011) South Australia’s Strategic Plan (and Regional
Volumes)
Department of Transport and Regional Services (2007) Adelaide – Darwin Corridor Strategy - 2007
Department of Transport and Regional Services (2007) Perth – Adelaide Corridor Strategy - 2007
Department of Transport and Regional Services (2007) Sydney – Adelaide Corridor Strategy - 2007
Department of Transport, Energy and Infrastructure (2005) Strategic Infrastructure Plan for South
Australia 2005/6 – 2014/15 – April 2005
Department of Transport, Energy and Infrastructure (2005) Strategic Infrastructure Plan for South
Australia 2005/6 – 2014/15 – Regional Overview – May 2005
DMITRE (2012) RESIC Resources and Energy Infrastructure Demand Study – Consultation Paper
DMITRE (2012) South Australian Government response to the RESIC recommendations – Directions
Statement
DMITRE (2013) South Australia’s Mining Pipeline – January 2013.
DMITRE website http://www.pir.sa.gov.au/minerals/initiatives/pace2020/pacemining
Drew, G (2007) SA’s Mining Boom - Presentation to the 16th State History Conferenc August 2007
ElectraNet (2012) Lower Eyre Peninsula Reinforcement – Feb 2012
ElectraNet (2012) Network 2035 Vision – Apr 2012
ElectraNet (2012) South Australian Annual Planning report - 2012
Heithersay, P (2012) Commodities Outlook for South Australia - 6th Annual Mining in South Australia
Conference, Whyalla, November 2012.
References 87
Infrastructure Australia (2011) National Land Freight Strategy – Discussion paper – Feb 2011
Infrastructure Australia (2012) National Land Freight Strategy Update – June 2012
Invest in SA (2012) Draft Report, Copper in South Australia
Invest in SA (2012) Iron Ore in South Australia
Invest in SA (2012) Uranium in South Australia
Iron Knob Progress Association (2009) Iron Knob History – Preserving Our Past
Johns, RK (2002) Recognition of Mining Heritage in South Australia - Bulletin of the Australasian
Institute of Mining and Metallurgy (AusIMM), September/ October 2
Klaasen, N (1999) Early South Australian Mining Industry
Parsons Brinckerhoff (2011) RESIC Resources and Energy Infrastructure Demand Study – Volumes 1
- 4
Parsons Brinckerhoff(2008) Eyre Peninsula Ports Master Plan, Eyre Regional Development Board –
2008
Port Bonython Bulk Commodities Export Facility – Industry Presentation
Regional Development Australia Yorke and Mid North (2012) Yorke and Mid North Regional
Roadmap – August 2012
Regional Development Australia, Far North (2011) Regional Roadmap and Strategic Plan 2010-
2013, updated 2011
Regional Development Australia, Whyalla and Eyre Peninsula (2012) Regional Plan, Aug 2012
Renewables SA (2011) A Renewable Energy Plan for South Australia – Strategy paper Oct 2011
RESIC – Infrastructure Demand Study
Rural Solutions (2012) Resources and Energy Infrastructure Demand Study – Community
Consultations: Analysis and findings
SA Government’s response to the Infrastructure Demand Study
SA Water (2008) Meeting Future Demand – SA Water’s Long term plan for Eyre Region – Nov 2008
SA Water (2011) Eyre Peninsula Demand and Supply Statement – Apr 2011
SA Water (2011) Northern and Yorke Demand and Supply Statement – Nov 2011
SA Water (2011) SA Water’s long term Plan for Yorke Peninsula – Oct 2010
SA Water (2012) Drinking Water Quality Report – 2011/12
SA Water (2012) Long Term Plan - Upper Spencer Gulf – Apr 2012
SA Water (2012) South Australian Water Corporation Annual Report – June 2012
SA Water (2013) Regulatory Business Proposal 2013
SA Water Eyre Region Desalination Plant data sheet
South Australian Centre for Economic Studies, Social Health Atlas
South Australian Freight Council (2012) ‘Moving freight’, Version 3, November
Tumby Bay Museum (2013) Tumby Bay Museum
Various Development Approvals

References 88
Various publicly available data for mines

Appendix A -Approach 89
Appendix A -Approach
Stage 1 – Review of existing infrastructure
Stage 1 is focused on understanding the state of the infrastructure currently servicing regional mining activity
along with the expected future demand profile for freight, water and power that will be required to support
growth in the sector.
Task 1.1 – identify existing regional infrastructure
A detailed understanding of the mining sector in South Australia was gained through information gathering
from the following sources:
Mining company annual reports
Public statements by mining companies in relation to future mining plans
Private consultations with mining companies
Review of State Government databases
Outputs from RESIC’s IDS
Consultation and validation with the Department of Manufacturing, Innovation, Trade, Resources and
Energy
Published feasibility reports and environmental impact statements for mining projects
Technical mining and infrastructure assessment by a specialist mining consultancy.
To develop a holistic understanding of the existing infrastructure environment, additional insights were gained
through face to face consultations and workshops with industry bodies, government agencies, RDAs,
infrastructure operators and other interested parties.
Information was gathered on a mine by mine basis in relation to each mines respective infrastructure
requirements over the 20 year life of the plans. This included any planned or proposed infrastructure solutions
identified by the mine proponents.
Task 1.2 – assess existing regional infrastructure
The focus of this task was to establish a comprehensive understanding of existing infrastructure capabilities.
This assessment determines the condition, capacity and capability of existing infrastructure to meet current
and emerging mining infrastructure demands and highlights the likely infrastructure deficiencies across the
region.
The consultations discussed above included exploration of the extent to which existing infrastructure is likely
to be suitable to support the development of the South Australian mining industry. Information gathering was
tailored to reflect the unique nature of each type of infrastructure and is detailed in Appendix C.

Appendix A -Approach 90
Task 1.3 – forecast future mining infrastructure demand
Using the data collected and refined in tasks 1.1 and 1.2, mining infrastructure demand was forecast over the
period to 2037.
Mining industry data led to the development of clusters which grouped mines likely to have common
infrastructure needs. The clusters were developed by grouping mines in close proximity to each other with
relatively homogeneous mineral production profiles.
The likelihood of individual mines proceeding to production was modelled with reference to
Forecasts of commodity prices
Estimates of likely mine operating cost
Estimated mine and direct procured (by mine proponent) infrastructure capital cost
Estimated cost of feasible mine to port transport solutions
Allowance for minimum market benchmark return on invested capital.
Commodity price forecasts (i.e. for iron ore, copper, uranium and gold), were drawn from leading international
forecasters Consensus Economics. Consensus Economics develops forecasts using predictions submitted by
more than 30 commodity forecasters, including private sector consultancies and leading investment and
commercial banks. The forecasts of each contributor are aggregated using a proprietary Consensus
Economics’ moderation technique to develop a weighted forecast for each commodity.
Prospective mines whose fully burdened cost (including return on capital) are lower than the relevant long-run
forecast commodity price were included in the forecast mining activity for the cluster (and region). Demand
forecasts based on high, medium and low world economic growth scenarios were produced.
Using this forecast mining output, demand for freight, water and power infrastructure supply was established
for each individual mine, with results consolidated for reporting at the cluster level. In collecting the data to
enable this analysis, commercially sensitive information (not publicly available) was disclosed to the project
team by established and developing miners. As a result, key mine level data and operating assumptions have
not been disclosed in the regional mining infrastructure plans and forecasts have been presented at a mine
cluster level.
Stage 2 – Identify supply chain solutions
The objective of the second stage was the development of a list of infrastructure projects able to contribute to
meeting the needs of the South Australian mining industry. Both tasks 2.1 and 2.2 involved a preliminary
identification and a workshop refinement process.
Task 2.1 – identify potential infrastructure gaps and issues
Based on the assessment of existing infrastructure in task 1.2 and the future cluster demand profiles
established in task 1.3, the gaps and issues faced by existing infrastructure to service growing mining
infrastructure requirements were identified. The analysis drew on findings contained in previous studies
(including the 2011 Infrastructure Demand Study commissioned by RESIC), along with commentary from
mining proponents and interest groups to establish a base list of mining project inhibitors or challenges. This
list was then refined through targeted stakeholder workshops focused on freight and logistics, water and
power (electricity and gas).

Appendix A -Approach 91
Task 2.2 – identify potential infrastructure solutions
Following detailed technical research, industry consultation with key mining proponents and industry
stakeholders, the project team was able to articulate for each of the regions:
The current state of relevant infrastructure
The likely future infrastructure gaps
Key issues impeding existing infrastructure meeting future demand (i.e. prohibitive commercial or access
arrangements, reliability concerns, environmental or social issues)
Solutions which have been proposed by miners or infrastructure proponents.
This information was presented to targeted stakeholder workshops for consideration. Structured group
discussions among workshop participants were used to first test the issues identified and subsequently
augment the list of infrastructure solutions which could be capable of addressing the identified infrastructure
needs and issues. The ideas of the individual groups were consolidated to produce a complete list of potential
infrastructure projects (Refer to Chapter 8 for a complete list of these projects).
Following this workshop the list was refined and any approved or funded projects were removed from further
consideration by this project. Further projects determined to be unlikely to meaningful contribute to the
strategic delivery of infrastructure for mining in South Australia were removed from the list. This included
projects that addressed the requirements for a single mine only and projects so closely aligned it was not
meaningful to investigate the projects separately.
Stage 3 – Technical consideration
The objective of the third stage was to gather technical information for each of the identified infrastructure
projects, to identify potential path to market solutions (i.e. from mine clusters to port) that address the
identified infrastructure deficiencies. This involved grouping dependent and interconnected infrastructure
projects into solutions for the alternate mining clusters across the regions.
Task 3.1 – review technical merits of identified projects
This task involved gathering data to establish a deep understanding of the technical merits of each project. To
develop this understanding a comprehensive information gathering exercise was undertaken, including the
collection and review of the following key metrics:
Capital cost
Operating cost
Capacity
Mining clusters which would be serviced
Potential for scalability
Estimated life
Supporting infrastructure required
Key technical and operational risks
High level pro’s and con’s
General social, environmental and commercial commentary.

Appendix A -Approach 92
Workshop attendees were consulted where the key metrics identified in task 3.1 could not be sourced from
within our project team. This also gave the opportunity for issues to be discussed which could not be raised in
the workshops due to time constraints or commercial concerns of workshop participants.
Task 3.2 – identify alternate infrastructure solutions
Using the technical information gathered in task 3.1, the project list was consolidated into alternate path to
market solutions. The paths are designed to address the needs of regional clusters while reducing
unnecessary infrastructure duplication and enabling public benefits. The paths group interrelated, dependent
and optional infrastructure projects that would be involved in activating these paths over the twenty year life of
the plans. Specifically the freight and logistics projects are grouped by the exit port solution they potentially
service. Potential solutions were grouped into packages capable of servicing one or more of the mining
clusters
While energy and water are central to the operation of mines and their associated freight solutions, their
demands can be equally addressed (from a technical perspective) by distributed or onsite solutions.
Consequently the alternate water and energy solutions that have been identified are decoupled from the path
to market solutions and presented separately as standalone solution options.
Stage 4 - Undertake public consultations
Before the infrastructure projects are prioritised, an interim report outlining the key regional gaps and issues
and the list of infrastructure projects and potential path to market solutions is being released for public
consultation – this interim report. This process enables the key drivers of the RMIP project to be discussed
and validated with a broad range of community and industry stakeholders to ensure a robust foundation for
determining the priority activities for driving development and growth of regional mining activity and growth
and development.
Task 4.1 – release interim reports
All relevant information gathered over the course of the project to date has been compiled in interim reports
for the consideration of interested stakeholders.
The interim reports are not a detailed inventory of the full range of investigations undertaken and information
gathered over the course of the project to date. The interim reports present a consolidated summary of the
factual and material findings of the project to date which are able to inform submissions of interested
stakeholders.
It is intended the accuracy of the findings summarised in the interim reports will be improved or validated
during this consultation phase.
The analysis of the forecast mining infrastructure gaps and the infrastructure projects which may potentially
address these gaps are contained with the interim report released for public comment.
The interim report gives interested parties an understanding of:
The nature and level of mining activity in the region
Forecast nature and level of mining activity in the region
Key risks to the forecast level of mining activity being achieved
Forecast infrastructure gap
Our initial assessment of the proposed projects.
Appendix A -Approach 93
The insight of stakeholders, particularly in relation to the questions posed in chapter 1, will further enhance the
understanding of the relative merits of each of the infrastructure proposals under consideration.
Task 4.2 – stakeholder consultations
A range of consultation activities are being undertaken to give the greatest possible opportunity for interested
parties to provide comment on the interim reports. These consultation activities include:
Roving interviews
Drop in information sessions
Invitee workshops
Request for hard copy or electronic submissions.
Respondents to the consultation process are being asked to provide their thoughts on the interim reports with
respect to four specific questions:
Are the future infrastructure gaps and/or issues adequately identified?
Have all feasible potential infrastructure solutions been identified?
When assessing potential solutions, what are the key issues which should be considered?
Are barriers to the development of priority infrastructure solutions government may seek to address
adequately identified?
Are there any other issues in relation to the RMIP project you wish to raise?
The information gathered in the project to date (including the consultation processes) will be collated for each
of the potential infrastructure solutions. This information will be the basis of a detailed process of prioritisation
of which the ultimate intention is identifying viable path to market, energy and water infrastructure solutions.
Consideration of the timing of the delivery of infrastructure capacity will be critical to the development of
clusters.
Projects will be prioritised based on their alignment to the criteria below:
Efficiency of delivery (strategic importance to multiple mines)
Facilitation of growth in the mining and minerals processing industries
Contribution to economic prosperity
Regional and community impact
Environmental.
Further details of the prioritisation process developed are provided in chapter 9.
Task 4.3 – refine solution list
It is expected feedback from consultations will further the project team’s understanding of the implications of
each of the project clusters under consideration.
The feedback provided by interested stakeholders will be used by the project team to further refine the list of
potential solutions and their clustering. Shortlisting of the projects based on the outcomes of consultation will
further focus the deliberations of the project team.
Further details on stage 4 can be found in Chapter 9 – “Next Steps”.
Appendix A -Approach 94
Stage 5 - Infrastructure assessment
The objective of the fifth stage is to identify the priority paths to market solutions and infrastructure projects for
each region. The assessment applies a multi-criteria approach that considers a range of economic, financial,
strategic, environmental, and social and government criterion. The assessment considers the priority of
projects over the twenty year life of the plans based on the evolving demand from the regions.
Task 5.1 – assess strategic alignment
The prioritisation process will identify projects with the greatest strategic alignment to the intended outcomes
of this project. The prioritisation process will identify which projects are the most important to the development
of the South Australia mining industry and the time period in which the project needs to be delivered.
Task 5.2 – assess deliverability
In addition to assessing the strategic alignment, the deliverability of the identified solutions will be assessed.
The deliverability assessment will analyse the extent to which the identified solutions are able to be
implemented in South Australia.
Task 5.3 – prioritise infrastructure solutions
At the completion of the prioritisation process a priority ranking will be given to each of the infrastructure
projects. The priority ranking will also outline the expected relative timing for each of the projects.
Strategically important areas are those in which infrastructure delivery is able to support the development of
multiple mines and/or provide demonstrable community benefits.
Further details on this prioritisation process can be found in Chapter 9 – “Next Steps”.
Stage 6 - Identify actions required
The objective of the sixth stage is to identify the key actions that would facilitate the development of priority
infrastructure. This will particularly focus on how the State Government can assist in reducing the risk of
projects through policy and regulation reform, process improvement, capital investment, coordination and
strategic planning and commercial collaboration or facilitation7.
Task 6.1 - identify scope for government and private sector involvement in projects
Having identified the priority infrastructure projects, consideration will be given to the potential role for
government8 and the private sector in facilitating investment in the preferred infrastructure. The core principle
driving the identification of the role for government will be focusing on removing impediments to the private
sector delivering the necessary infrastructure.
Consideration of the potential role for government will focus on projects which are:
Likely to alleviate ‘blockages’ preventing further private sector investment
Market failures in which agents pursuing individual interests are not motivated to pursue outcomes which
are optimal from a state wide perspective.
7 Refer to the South Australian Government’s Economic Statement (released March 2013) for further discussion on the broad role that
government can play - http://www.premier.sa.gov.au/ecostat/ 8 This will involve the roles that all tiers of government (i.e. local, State and Commonwealth) can contribute to facilitating the delivery of
priority projects.
Appendix A -Approach 95
Examples of the identified role for government in facilitating the preferred infrastructure solution may include,
policy change, partnering and direct financing, among many others.
Task 6.2 - identify means and timing of government involvement
Having identified the role for government in facilitating the delivery of the prioritised infrastructure to support
the development of the mining sector in South Australia, consideration will be given to the most effective
means of intervention.
Consideration will be given to the most effective and efficient means of government intervention to address
the gaps identified in Subsection 6.1. The recommended role for government will be that which is most likely
to deliver the desired infrastructure with the fewest expected negative consequences.
Stage 7- Finalisation of plans
Task 7.1 – finalise regional mining infrastructure plans
The final task of the project will be the preparation and finalisation of the regional mining infrastructure plans.
The final plan will build on the technical assessments and demand modelling presented in this interim report
and include a summary of feedback (and refinements) from the community and stakeholder consultations, the
assessment of infrastructure priorities and discussion of the key activities required to facilitate development of
critical mining freight, water and power related infrastructure. This will also include the role of government and
identification of likely regional social infrastructure requirements.
Task 7.2 – policy and project proposals
The finalised plans will identify the priority mining infrastructure projects and supporting activities required to
enable the growth of the mining sector. These plans will be used over this period to guide the development of
policy and project proposals in support of the State Government’s involvement in facilitating these priorities.
As required, the policy and project proposals will present, to a preliminary or feasibility level of detail, the case
for project action, the required involvement of government (and the private sector), options for the projects
and governments involvement and affordability and delivery considerations. This proposal will be used to seek
endorsement from Cabinet for policy, regulatory and/or procedural changes to be pursued or alternatively for
a detailed business case to be developed seeking funding or commercial engagement (i.e. for joint ventures)
approval.

Appendix B – Yorke and Mid-North/Braemar environmental assets 96
Appendix B – Yorke and Mid-
North/Braemar environmental assets
Matters of National Environmental Significance protected under the Environment Protection and Biodiversity
Conservation Act 1999 for the Yorke and Mid-North/Braemar include:
Four nationally listed vegetation communities occur or potentially occur in this region:
o Iron-grass Natural Temperate Grassland of South Australia (Critically Endangered
Community) likely to occur within area
o Peppermint Box (Eucalyptus odorata) Grassy Woodland of South Australia (Critically
Endangered Community) likely to occur within area.
o Buloke Woodlands of the Riverina and Murray-Darling Depression Bioregions (Endangered
Community) may occur within area
o Grey Box (Eucalyptus microcarpa) Grassy Woodlands and Derived Native Grasslands of
South-eastern Australia (Endangered Community) likely to occur within area
Other significant ecological communities
o River Red Gum woodland
o Bullock bush tall shrubland
o Needle wattle woodland on sandplains
o Eucalyptus flindersii mallee
o Eucalyptus intertexta woodland
o Allocauarina verticellata woodland
o Triodia spp. grassland
Seven nationally important wetlands are listed in this region
Significant Species
o 83 Nationally threatened terrestrial species are listed as occurring or potentially occurring
within this region
o 107 Nationally listed marine species occur or potentially occurring within this region
o 12 Species of cetacean occur or potentially occurring within this region
o 64 Migratory species are listed as occurring or potentially occurring in this region
Example threatened species and habitats
o Plains-wanderer (Pedionomus torquatus) in grassland
o Murray Swainson-pea (Swainsona murrayana) in Bullock Bush tall shrubland

Appendix B – Yorke and Mid-North/Braemar environmental assets 97
o Thick-billed Grasswren (eastern) (Amytornis textilis modestus) and Slender-billed Thornbill
(western) (Acanthiza iredalei iredalei) in chenopod shrublands
o Yellow-footed Rock-wallaby (Petrogale xanthopus xanthopus), Balcanoona Wattle (Acacia
araneosa), Slender Bell-fruit (Codonocarpus pyramidalis), Small-leaved Xerothamnella
(Xerothamnella parvifolia) on ranges and hills.
Appendix C – Alignment of mines to DMITRE Pipeline 98
Appendix C – Alignment of mines to
DMITRE Pipeline
General points on the mines we have excluded:
Our list has been based primarily on the Department of Manufacturing, Innovation, Trade, Resources and
Energy (DMITRE) triangle and available information (e.g. information from the RESIC Infrastructure Demand
Study, Invest in SA commodity data, information from miners); anything not on the DMITRE triangle was only
included in our assessment if it would have a significant infrastructure demand (e.g. Hawsons project in NSW
- Braemar).
We have not included the north west corner of South Australia (Musgraves, Far North Region) because:
the timelines for development of resources in the region are uncertain
most of the projects in this region (except Metals X’s Wingellina project in Western Australia) are not
advanced
the commodities in this area are produced in low volumes (nickel, zinc, uranium).
Points on the mines we have included
Our assessment focuses on iron ore projects as it is an infrastructure intense commodity – it is a bulk product
with significantly greater freight, power and water demands than any other commodity due to the volumes
involved (i.e. Mtpa vs kta) – we have included almost every iron ore project on the DMITRE triangle except for
five (all of which are not very advanced).
Copper and uranium commodities are also assessed because:
copper and uranium are SA’s biggest mineral export earners
there is information available on the development of these commodities (e.g. Invest in SA).
We have also concentrated on the operations for which we have the most comprehensive and accurate data;
the less advanced a project is, the more uncertainty there is as to its potential infrastructure requirements.
Therefore, if we included all prospects in their initial exploration phases the resultant demand estimates would
have included a lot of variability which would have skewed the curves and provided little value to the planning
process
Summary of included and excluded projects
Some projects included in the DMITRE triangle were excluded from our assessment for the reasons below:
associated with other projects White Dam North, Olympic Dam Expansion, Beverley South, Four
Mile

Appendix C – Alignment of mines to DMITRE Pipeline 99
coal projects (not included in this project as they energy related, infrastructure supporting
Leigh Creek included in considerations of projects), Leigh Creek, Clinton, Arckaringa, Lock
out of the region, Kingston
focus on commodities outside scope this project, Beltana
sufficient information is not available to robustly assess the infrastructure needs to develop
these deposits, Jungle Dam, Parkinson Dam, Baggy Green, Barns, Black Hills, Golf Bore,
Mainwood, Monsoon, Tomahawk/Tunkillia area 191, Mongolata, Sheoak, Skye, Ultima Dam,
Yanyarrie, Mount Christie Siding, Willy Willy, Glenrae, Mount Woods, Stuart, Mount Cora, Mount
Brady, Jamieson Tank, Pollinga, Claude Hills, Mount Davies, Pindari, Kenmore II, Mount Caroline,
Telephone Dam, Menninnie Dam, Weednanna, Alvey, Kangaroo Dam, Taurus, Prospect Hill,
Samphire, Armchair, Yadglin, Yarramba, Radium Hill, Aristotle, Oakdale, Malache, Aroona 2,
Blinman, Emmie Bluff, Emmie North, Moorilyanna, Bagot Well, Burra, Miranda, Moonta, Netherleigh
Park, Princess Royal, Punt Hill, Titan, Toondulya, Torrens South JV, Wirrda, Eurinilla Dome, Melton,
North Kalkaroo, North Portia, Shylock, Willamulka, Blue Rose, Mount Gunson, Mutooroo, Netley Hill,
Zeus, Winjabbie East, Flinders Island, Eurelia, Barton West, Dromedary, Gullivers, Mojave, Notrab
mining largely complete, White Dam
outside the regions in the plans, Bird-in-Hand, Deloraine, Lady Jane, Kanmantoo, Mount Torrens,
Springfield, Mindarie, Angas, Wheal Ellen

Appendix D – Infrastructure assessment benchmarks 100
Appendix D – Infrastructure assessment
benchmarks
The assessment of the adequacy of infrastructure to meet the current and future infrastructure needs of the mining industry were undertaken with reference to the data sets below.
Roads
The heavy vehicle routes in each of the regions were assessed with reference to:
the current condition of roads
the capability of the roads to cater for heavy vehicles
the location and proximity of routes to possible mine sites
the traffic volumes on routes to determine if capacity exists
the proximity of routes to other freight (particularly rail) to determine if intermodal opportunities exist
current use patterns by mining and non-mining traffic.
Rail
Reference material was reviewed and infrastructure proponents interviewed to assess rail infrastructure in relation to:
the location and proximity of routes to possible mine sites
the traffic volumes on routes to determine if capacity exists
the proximity of routes to other freight (particularly roads) to determine if intermodal opportunities exist
rail gauge
ability to accommodate different commodities
current use patterns by mining and non-mining traffic
the current condition and compatibility with national rail network
ownership structure and access regime
capability of lines (i.e. to handle axle loads)
Ports
The review of ports infrastructure included the following key areas for assessment:
shipping channel and swing basin specifications and dimensions, including maximum vessel sizes
prevailing subsea geology, tide and current conditions and related maintenance dredging
towage and pilotage service capacity (equipment and labour force)
aids to navigation inventory
berth size and wharf conditions (including all mooring and fendering)
cargo handling equipment – both ship and stevedoring and terminal related
cargo storage capacity and operating constraints
other considerations such as covered loading requirements
encroachment of incompatible land uses
community or local government expectations and concerns

Appendix D – Infrastructure assessment benchmarks 101
ownership structure and access arrangements
environmental implications such as proximity to marine parks and recreational facilities
land transport access (road and rail).
Energy
Gas and electricity providers were identified in each of the regions and information gathered in relation to existing infrastructure affecting the region included:
location and extent of network
capacity
capability (pressure, interruptible etc.)
upgradability
current condition and remaining economic life
constraints and opportunities to optimise use of existing infrastructure
current and expected demand for commercial and industrial use
opportunities and challenges of connecting to renewable energy supply
regulatory and commercial environment
ownership of assets
security of supply.
Water
Key information in relation to water assets and potential constraints on supply was reviewed in each of the regions, including:
population growth forecasts
climate change and demand impacts
water allocation (River Murray, prescribed wells, Great Artesian Basin)
demand projections
yield capacity and water quality potential water sources, including:
prescribed and non-prescribed groundwater resources
surface water catchments
stormwater reuse
wastewater and effluent reuse
reservoir capacities
transfer pipeline capacities
water treatment plant capacities and water quality
desalination plant capacities and water quality
existing operating rules.
Appendix E – Commodity price scenarios 102
Appendix E – Commodity price
scenarios
Deloitte Access Economics (DAE) has developed three forecast scenarios for commodity prices over the next 10 years. DAE’s forecasts for commodity prices reflect three different set of assumptions in relation to international macroeconomic conditions; a base case, high growth and low growth scenario.
The commodity price forecasts are drawn from Consensus Economics’ quarterly energy and metals forecasts. Consensus Economics develops forecasts using predictions submitted by more than 30 commodity forecasters (of which DAE is one), including private sector consultancies and leading investment and commercial banks. The forecasts of each contributor are aggregated using Consensus Economics’ moderation process to develop a weighted forecast for each commodity. Drawing forecasts from a range of parties supports the consideration of the forward outlook from a broad range of international perspectives.
The weighted forecast for iron ore, copper, gold and uranium published in Consensus Economics’ December 2012 energy and metals forecast is the base case which has been adopted by DAE.
The outlook for Australian macroeconomic conditions is not considered in detail because forces impacting commodity prices are determined by international markets and minimally impacted by Australian economic conditions.
The following commentary for each scenario provides a background to the likely international economic conditions that would be expected to underpin each commodity price scenario. Charts of the forecast price paths are provided following the commentary.
Base case
This is the forecast most likely scenario for international economic conditions.
Scenario overview
Significant risk remains present in the global environment as a result of continuing sovereign debt problems in the Eurozone and uncertainty in China. However, these risks are lower than observed in recent years and global growth prospects are greater than they have been in recent times. Economic growth in the United States in the short-term in this scenario is supported by a turnaround in the housing market and cheap energy.
Supressed by potential downside risks from the Eurozone, United States debt issues, declining Chinese investment and possible disruptions to oil supplies, global economic growth in the short-term is lower than the long-term average. Developing nations, while not returning the rates of growth seen pre-GFC, would be expected to continue to outperform the developed nations and will be key to global growth over the next decade in this scenario.
Commodity prices continue on a relatively volatile path, particularly over the short-term as a result of the uncertainly detailed above. Base commodity prices trend downward over the next decade. Investment from developing countries cools, while new supply enters the market as investment in new export capacity gradually leads to increased levels of production.
Country expectations
This scenario is predicated upon improving conditions in the housing market, the addition of cheap energy and the willingness of the US Federal Reserve to persist with aggressive monetary policy easing being enough for the United States to start to deliver some much needed momentum to the global economy. Confidence in the business sector would be expected to improve and economic growth would be expected to provide a stronger employment outlook which would lead to the unemployment rate trending down. This scenario assumes the United States’ fiscal issues are negotiated without incident in 2013, but the need to consolidate debt over the long term ensures average economic growth over the next decade is lower than in the previous decade. After a period of adjustment the United States economy would be expected to make a

Appendix E – Commodity price scenarios 103
solid recovery with economic growth, unemployment and consumer spending all returning to more normal levels by the decade end.
This scenario assumes China’s willingness to support steel-intensive, investment driven activity will remain the key driver of China’s economic growth over 2013 and will keep global commodity prices elevated (albeit at lower peaks than seen in 2012). Credit growth in China has also been strong, however this may soon begin to drag on economic growth as interest repayments make up a greater share of spending. This scenario envisions the Chinese economy still being heavily reliant on manufacturing and export growth. The share of output from industry is expected to shrink at the same time as the services sector expands as incomes continue to rise over the long-term (a higher income population places additional demand on services). China’s export share of gross domestic product (GDP) is expected to shrink while imports increase as the share of output from industry decreases. These changes would be slow to manifest. Overall, this scenario assumes income growth in China is solid throughout the next decade and consumption slowly accounts for a greater share of the economy over time.
Europe is the major risk to the global economic outlook over the next decade – its banks are undercapitalised, making it hard for them to finance new growth and political divisions threaten the recovery process. In this scenario recession in Europe’s periphery creeps towards its core and economies on Europe’s southern fringe remain on the back foot for some years until wage costs are restrained (relative to those in Germany and France). Unemployment within the Eurozone is expected to remain at record rates for a few more years and with austerity measures on top it is unlikely Europe’s economy will return to positive economic growth in the short-term. The Eurozone is expected to drag on global economic growth for some years in this scenario with a long period of adjustment and austerity over the next decade.
Japan faces a unique mix of economic and demographic challenges to be addressed over the next decade. Government debt in Japan is a larger multiple of national income than in Greece and economic growth has been almost stagnant for the past decade. Japan’s population is shrinking and ageing rapidly. In this scenario Japan is expected to undergo a period of structural adjustment and debt consolidation over the next decade resulting in only modest rates of real economic growth.
India, Brazil and Turkey all slowed in 2012, meaning the outperformance of emerging economies over the past decade suffered some headwinds, while Asia’s Tigers (Korea, Taiwan, Hong Kong, Singapore, Thailand, Malaysia, Indonesia and the Philippines) are also seeing more modest growth prospects. This scenario assumes growth in these economies will trend above global averages, but be lower than has been recorded over the past decade.
Commodity price outlook
Iron ore prices bounced back from their lows in September 2012. Strong investment led growth in China is expected to ensure excess supplies accumulated over the latter half of 2012 are quickly used up and prices remain high over 2013. The massive surge in investment in iron ore projects across many countries earlier in the decade will result in a gradual ramping up of supply in this scenario. The increase in supply is expected to cause prices ease a little after 2014, but continuing strong growth from emerging economies would be expected to support prices for most of the next decade. As China moves from an investment-driven to a consumption-driven economy, global demand for iron ore is expected to ease somewhat and cause prices to cool toward the latter half of the next decade.
The high rates of investment expected to keep the iron ore price strong in 2013 are expected to do the same for copper. More positive business sentiment and stronger residential housing construction in developed countries over the short-term would be expected to help support the copper price at current highs in this scenario. After that, prices are expected to cool as new supply becomes available and Chinese economic growth slows over the next decade.
After good gains over 2012, a better global economic outlook for 2013 would drive the price of gold downward over the short-term as investors seek higher returns in riskier assets. The record prices seen at the end of 2011 do not return in this scenario and the end of monetary easing policies from many of the world’s major central banks would be expected to place further downward pressure on the gold price into the middle of the next decade. The gold price would be expected to settle as threats to the global economy subside over the latter half of the next decade and the world enters a phase of sustained growth.
Uranium demand would be expected to return to growth over time in this scenario as the memory of the Fukushima disaster in Japan fades. Additional energy demands from developing countries with rapidly urbanising populations and growing incomes make nuclear a more attractive energy source – this is particularly pronounced in response to the growing air pollution issues in many of Asia’s major cities. This scenario assumes uranium exporting countries invest heavily in new mine capacity to keep pace with demand over the next decade. Uranium prices rise, but remain below the levels seen in recent years.
High economic growth scenario

Appendix E – Commodity price scenarios 104
Below is a scenario for international macroeconomic conditions which is at the higher end of expectations.
Overview
This scenario assumes the global economy hits its straps in 2013 after stumbling throughout 2012. Sovereign debt issues in the Eurozone subside as unconventional monetary policy from the European Central Bank (ECB) has the desired effect, while government investment in infrastructure in China drives strong economic growth in the short-term. United States growth surprises in the short-term, as a resurgence in housing construction and consumer spending drives a sustained turnaround in economic activity.
This scenario assumes the global economy moves into full recovery mode, the major economies track well and global uncertainty retreats over 2013. Developing countries, led by China, will continue to make a substantial contribution to global economic growth and outpace the economic growth of developed countries. Developing country growth in this scenario continues to be driven primarily by engineering construction investment, supporting commodity prices over the short-term. This scenario is reliant upon political unrest in a number of oil exporting nations being negotiated without any disruption to oil supplies and the world economy being positioned to make a sustained recovery.
Base commodity prices continue to be buoyed by robust demand from developing nations in this scenario. Indeed, demand for base commodities would outpace supply even in light of the massive amount of new mine capacity which would push the global output of raw materials to record levels. Uranium prices would rise in this scenario as the world demand for energy drives upward. A better global economic outlook would cause the price of gold to fall sharply in the short-term as investors chase higher returns in riskier assets.
Country expectation
In the scenario the United States performs strongly over 2013. Low interest rates and continued monetary easing would drive a better than expected recovery in housing construction and prices. Banks would be provided greater liquidity facilitating increased access to capital for the private sector. Exports of gas would increase significantly to underpin this scenario. The unemployment rate would fall sharply over the short-term as a resurgent United States business sector provides a platform for robust jobs growth, while better business and consumer confidence drives a turnaround in retail spending. This scenario assumes United States Government debt issues will be resolved with Congress negotiating the approaching debt ceiling without issue, while also reaching its target of 2.5 per cent debt consolidation in 2013. Indeed, United States economic growth is strong enough over the next decade in this scenario to ensure the United States can consolidate its debts while not impeding economic growth.
In this scenario strong short-term growth in China is driven by engineering construction as the new government renews steel-intensive, investment driven growth. The immediate excess supplies of raw materials are expected to be quickly used up and base commodity prices rise as a result of the lift in demand. In the next five years the consumption share of output in China rises as a result of stronger income growth, particularly in China’s major cities. The rate of consumption growth overtakes growth in investment within a few years, but investment remains the most significant contributor to economic growth in the interim. As a result of increasing consumption growth, base commodity prices begin to fall after 2015 in this scenario. Over the long-term, China’s economic development follows the same pattern of the other developed nations in the region – such as Japan and Korea – with higher household income associated with a relative decline in the industrial sector and an expansion in the services sector.
Even under this scenario the outlook for the Eurozone is modest at best. The ECB’s commitment to aggressive and unconventional monetary easing ensures liquidity in the financial system. Banks begin to issue more loans resulting in some small gains in business investment and housing construction. Fiscal consolidation reduces government debt and provides some confidence in financial markets, but limits economic growth as the government sector contracts. The recessionary conditions in the periphery countries ease, though growth is slow.
Japan remains a key risk to global economic stability in this scenario, with few prospects for growth over the next decade. The Asian Tigers perform well, with economic growth riding high on an engineering construction boom which lasts well into the next decade. India negotiates its fiscal and monetary issues in this scenario – keeping inflation under control and beginning the process of reducing its fiscal deficit.
Commodity price outlook
Strong investment led growth in China in this scenario pushes iron ore prices higher over 2013. The massive surge in investment in iron ore projects across many countries earlier in the decade increases supply post 2013. Continuing strong growth from emerging economies ensures demand outpaces supply for at least the first half of the next decade – pushing prices up until around 2015. As China’s demand for iron ore eases toward the latter half of the next decade, prices retreat in this scenario.
Strong investment-led growth in China would also be good news for the copper price, ensuring it remains high over the short-term. New supply is expected to be significantly less than for other base metals and

Appendix E – Commodity price scenarios 105
demand is expected to continue to increase until at least 2015 as the global demand is driven up by rapidly urbanising populations in a number of developing countries in this scenario. Hence, demand for copper may outstrip supply over the medium-term. The copper price is therefore projected to rise – coming close to the historic highs seen in 2011 – but then cool in line with falling engineering construction in developing countries over the latter half of the next decade.
Strong growth in the global economy in 2013 in this scenario drives the price of gold downward over the short-term, as investors seek higher returns in riskier assets. Monetary policy easings from many of the world’s major central banks are stopped short in this scenario, placing further downward pressure on gold prices over 2013. Indeed, above average global economic growth over the next few years would ensure the gold price remains on a downward path until around 2015.
Additional energy demands from developing countries in this scenario will ensure the uranium price grows strongly over the short-term. As the memory of Fukushima disaster in Japan fades, and amid rapid growth in population and income in developing countries, nuclear energy is expected to become a more attractive energy source. Prices for other energy commodities would also be expected to increase; ensuring the uranium price remains well above historical averages over the next decade.
Low economic growth scenario
Below is a scenario for international macroeconomic conditions which is at the lower end of expectations.
Scenario overview
In this scenario the global economy continues to stumble for a number of years. Global economic growth is plagued by a series of small financial crises as high government debts, particularly in the Eurozone and the United States destabilises financial markets. Chinese growth shudders as falling demand from the Eurozone and the United States (China’s two largest export partners) cause export volumes to fall dramatically. The global output of base commodities increases significantly in this scenario over the next few years as investment in new mine capacity from years past pushes supply to record levels. Demand for these commodities does not keep pace and prices fall as a result.
Some years after the end of the GFC, the world economy may remain in a state of flux, with low growth and high debt in high-income countries a major concern. Global growth over the short-term grinds to a halt as downside risks from the Eurozone, United States debt issues and declining Chinese investment damage global growth prospects in this scenario.
Base commodity prices suffer as demand from developing nations, particularly from China, begins to moderate. Global demand for base commodities struggles to keep up with supply as a lift in new mine capacity pushes the global output of raw materials to record levels in this scenario. Uranium prices would remain stagnant, in line with global energy demand. The price of gold would be expected to make some strong gains as investors seek to secure their wealth from volatile movements in other asset prices, including equities.
Country expectation
The United States underperforms over the short-term in this scenario. The United States housing market is expected to remain flat, with little in the way of price growth or new construction, in spite of low interest rates and continued monetary easing. Unemployment in the United States remains above 7.5 per cent leading into middle of the next decade, while business and consumer confidence is plagued by uncertainty in the financial sector and insipid retail spending remains a drag on economic performance. This scenario assumes Congress manages to negotiate the approaching debt ceiling, but without a turnaround in economic performance, the United States is unable to consolidate any of its debts over 2013. The United States does not make any significant contribution to global economic growth over the next decade in this scenario.
In this scenario China’s economy feels the pinch of a slower global economy and financial market uncertainty. Investment spending is expected to begin to cool and domestic consumption remains subdued after the most recent government stimulus package has run its course. All efforts by China’s new government to encourage growth in consumption spending in the short-term fail. Household income growth would be expected to slow and ensure China’s reliance on export growth and investment to drive economic growth continues over the medium-term. However, China’s export volumes would be expected to fall significantly, particularly in the short-term, as instability in the Eurozone and the United States cause demand for Chinese manufactures to fall. China’s economic growth is projected to slow significantly over the next decade in this scenario and contribute to the general fall in commodity prices.
Monetary easing by the ECB in this scenario is not enough to pull the countries on the periphery of the Eurozone out of recession. The economic instability felt on the fringes of the Eurozone moves towards the core. Political divisions and the varying degree of competitiveness between member countries stifle the

Appendix E – Commodity price scenarios 106
Eurozone’s recovery. Unemployment within the Eurozone would be expected to remains at record levels over the medium-term as a result of uncertainty and austerity measures.
Political uncertainty and a lack of policies to reduce excessive government debt damages growth in Japan in the short-term and a need to consolidate debts and a rapidly ageing population damages prospects for economic growth in the long-term in this scenario. The Asian tigers would be expected to slow as a result of weaker growth in China, Europe and the United States. India is expected to continue to struggle with high inflation on the one hand and low growth on the other. The Indian Central Bank and the government in this scenario would be limited in their ability to encourage economic growth through monetary and fiscal policy. A period of low growth relative to years past would be expected to set in for the next decade.
Commodity price outlook
In this scenario the iron ore price would be expected to begin to fall over the first half of 2013 as China does not utilise excess supplies accumulated over the latter half of 2012. The surge in supply resulting from recent investment combined with slower growth from emerging economies would mean demand struggles to keep pace with supply for at least the first half of the next decade in this scenario. The iron ore price would be expected to fall significantly in the lead-up to 2015. After that, prices settle well below current levels towards the end of the next decade.
Copper prices fall sharply in the lead-up to 2015 primarily as a result of softening Chinese investment in this scenario. This would be expected to be compounded by falling global energy demand reducing copper demand from new electricity infrastructure. The addition of new supply would be expected to place further downward pressure on copper prices. In this scenario the price of copper is expected to level off over the long-term as stability returns to global markets, but at significantly lower prices as a result of a structural shift in supply.
Weak growth in the global economy drives the price of gold upward over the short term in this scenario, as investors seek to secure their wealth. Monetary easing policies by many of the world’s major central banks extend well into the middle of the next decade and would be expected to depress currency values and place further upward pressure on gold prices. Softer global economic growth in this scenario ensures gold prices remain on an upward path over the long-term.
Governments across the globe remain wary around the use of uranium for nuclear power as the memory of the Fukushima disaster in Japan remains vivid in this scenario. Some governments may seek to reduce their use of nuclear energy and others look to increase it in pursuit of a less carbon-intensive base load energy. Uranium production would be expected to keep pace with demand over the next decade. However, a weaker global economy reduces overall global energy demand and ensures uranium prices remain relatively flat over the next decade.

Appendix E – Commodity price scenarios 107
-
20
40
60
80
100
120
140
160
1990 1995 2000 2005 2010 2015 2020
Base case Indicative price under low global growth Indicative price under high global growth
Iron ore, $US / TAustralia-Japan contract, fines, 62% fe
Forecast
-
1,000
2,000
3,000
4,000
5,000
6,000
7,000
8,000
9,000
10,000
1990 1995 2000 2005 2010 2015 2020
Base case Indicative price under low global growth Indicative price under high global growth
Copper, $US / T
Forecast

Appendix E – Commodity price scenarios 108
-
20
40
60
80
100
120
1990 1995 2000 2005 2010 2015 2020
Base case Indicative price under low global growth Indicative price under high global growth
Uranium, $US / lb
Forecast
-
500
1,000
1,500
2,000
2,500
1990 1995 2000 2005 2010 2015 2020
Base case Indicative price under low global growth Indicative price under high global growth
Gold, $US / oz
Forecast

This publication contains general information only, and none of Deloitte Touche Tohmatsu Limited, its member firms, or their related entities (collectively the “Deloitte Network”) is, by means of this publication, rendering professional advice or services.
Before making any decision or taking any action that may affect your finances or your business, you should consult a qualified professional adviser. No entity in the Deloitte Network shall be responsible for any loss whatsoever sustained by any person who relies on this publication.
About Deloitte
Deloitte refers to one or more of Deloitte Touche Tohmatsu Limited, a UK private company limited by guarantee, and its network of member firms, each of which is a legally separate and independent entity. Please see www.deloitte.com/au/about for a detailed
description of the legal structure of Deloitte Touche Tohmatsu Limited and its member firms.
Deloitte provides audit, tax, consulting, and financial advisory services to public and private clients spanning multiple industries. With a globally connected network of member firms in more than 150 countries, Deloitte brings world-class capabilities and high-quality service to clients, delivering the insights they need to address their most complex business challenges. Deloitte’s approximately
200,000 professionals are committed to becoming the standard of excellence.
About Deloitte Australia
In Australia, the member firm is the Australian partnership of Deloitte Touche Tohmatsu. As one of Australia’s leading professional
services firms, Deloitte Touche Tohmatsu and its affiliates provide audit, tax, consulting, and financial advisory services through approximately 6,000 people across the country. Focused on the creation of value and growth, and known as an employer of choice for innovative human resources programs, we are dedicated to helping our clients and our people excel. For more information, please
visit Deloitte’s web site at www.deloitte.com.au.
Liability limited by a scheme approved under Professional Standards Legislation.
Member of Deloitte Touche Tohmatsu Limited
© 2013 Deloitte Touche Tohmatsu.