Regional Medical Center Community Health Needs Assessment 2013.pdf · 1 Regional Medical Center...
59
1 Regional Medical Center Community Health Needs Assessment Approved by Shelby County Health Care Corporation Board of Directors May 22, 2013
-
Upload
vuongxuyen -
Category
Documents
-
view
213 -
download
0
Transcript of Regional Medical Center Community Health Needs Assessment 2013.pdf · 1 Regional Medical Center...

1
Regional Medical Center
Community Health Needs Assessment
Approved by
Shelby County Health Care Corporation
Board of Directors
May 22, 2013

2
Community Health Needs Assessment
(CHNA)
2013 Written Report For Regional Medical Center at Memphis
("RMCM" or the "Facility")
Name and Address of Hospital Facility:
Regional Medical Center at Memphis
877 Jefferson Avenue
Memphis, Tennessee 38103
Tax Year: July 1, 2012 - June 30, 2013
I. General Information
Contact Person: Leticia Towns, Senior Vice President, External Affairs
Date of Written Report: April 15, 2013
Link to Web Site on Which Written Report Was Made Publicly Available: www.the-med.org
Date Written Report Made Publicly Available (per Notice 2011-52): June 30, 2013
Date of Prior Written Report (if applicable): N/A
Name and EIN of Hospital Organization Operating Hospital Facility: Shelby County Healthcare
Corporation d/b/a Regional Medical Center at Memphis. EIN # 62-1113169
Address of Hospital Organization: 877 Jefferson Avenue, Memphis, TN 38103
II. Purpose of CHNA Written Report
This Written Report is being conducted in order to comply with federal tax law requirements set forth in
Internal Revenue Code section 501(r) requiring hospital facilities owned and operated by an organization
described in Code section 501(c)(3) to conduct a community health needs assessment at least once every
three years. The required Written Plan Implementation, entitled the CHNA Implementation Strategy, is set
forth in a separate written document. This Written Report for the Regional Medical Center at Memphis (the
"Facility" or "RMCM") is intended to satisfy each of the applicable requirements set forth in IRS Notice
2011-52 regarding conducting the CHNA for the Facility.

3
Regional Medical Center at Memphis
Community Health Needs Assessment
Report
SECTION I - EXECUTIVE SUMMARY
The Regional Medical Center at Memphis ("RMCM") has conducted a comprehensive Community Health
Needs Assessment ("CHNA") in 2013, with a goal of providing a snapshot of the overall health of the
community it serves via health indicators and social determinants of health. The community assessed, for
the purposes of this CHNA, is defined as a 21-zip code region in the City of Memphis, which encompasses
RMCM's primary service area ("PSA"). In consideration of the findings of this assessment, implementation
priorities identified were with the overall goal of improving the health status of our community. Information
for this assessment was collected from multiple sources, including: 1) key stakeholder interviews; 2)
telephone-based community surveys; 3) a review and analysis of demographic and health statistics.
Based on the findings from the various sources noted above, the following health indicators were identified
as needs within the defined community.
Poverty
Teen Pregnancy
Infant Mortality
HIV/AIDS
Obesity/Overweight Prevalence
Heart Disease
Stroke
Education
Lung Health
Colorectal Cancer
Breast Cancer
Prostate Cancer
Violent Crime/Homicide/Firearm-related Deaths
Injury Deaths
Overall Health Status
Exercise/Fitness
Nutrition
Alcohol Consumption
Smoking Prevalence
High Cholesterol
High Blood Pressure (Hypertension)
Access to Primary Care
Access to Health Insurance
Appropriate Utilization of Health Services

4
SECTION II - DESCRIPTION OF METHODOLOGY
PURPOSE
Regional Medical Center at Memphis ("RMCM") has conducted this triennial Community Health Needs
Assessment ("CHNA") and the separately required implementation strategy, or CHNA Implementation
Strategy ("HIP"), in accordance with the requirements of Internal Revenue Service Notice 2011-52
regarding Internal Revenue Code Section 501(r). The Patient Protection and Affordable Care Act (PPACA)
of 2010 requires all not-for-profit hospitals and health systems to conduct community health needs
assessments at least once every three (3) years and develop supporting implementation plans to address the
identified needs. This assessment serves as a guide for planning and implementation of broad-based
initiatives that will allow RMCM and community partners to best serve the emerging health and
socioeconomic needs of the Memphis area. RMCM engaged PricewaterhouseCoopers, LLP ("PwC") to
conduct a CHNA of its defined service area.
METHODOLOGY AND PROCESS
Assessing the community's health needs was accomplished through the collection and review of primary
data (both quantitative and qualitative) and secondary data (quantitative) via various data sources.
Primary Data Collection
Primary data was obtained through key stakeholder interviews used to gather information and professional
opinions from persons who represent the broad interests of the community served by RMCM. Key
stakeholders were identified by RMCM officials and initially contacted by RMCM and asked to participate
in the CHNA. Thirty-four (34) interviews were conducted for the CHNA in October and November 2012;
specifically, 16 interviews were conducted with RMCM staff, internal key stakeholders, representing
various departments/functions, and 18 interviews, external key stakeholders, were conducted with local
healthcare professionals, partners, academia, community officials and religious leaders. The 16 internal key
stakeholder interviews were conducted to assess the current RMCM community health initiatives and
resources. The 18 external key stakeholder interviews were conducted to gain insight on the perceived
current health status, in addition to identifying the healthcare, social service and quality of life issues
affecting those who reside in the community.
External key stakeholder participants provided recommendations for health status improvement strategies
and implementable actions. The participants' collective areas of expertise include healthcare, human
services, public health, disparities in healthcare, social determinants of health and access to health services.
The interviewees were asked to provide their professional opinions and viewpoints on the following issues:
Description of the health status of the community
Factors that contribute to the described community health status
Unmet community health needs and/or gaps in health services
RMCM's role in meeting the health needs of the community
Any existing collaborations to address the health status needs of the community
Perceived access issues related to availability of health services
Opportunities for improving health status and quality of life
A detailed listing of key stakeholder interview participants and primary collection findings are located in
Appendix I.
5
Additionally, household surveys were conducted to ascertain insight on the community’s socioeconomic
factors that can impact health, access to healthcare, and their perception of their overall health status. The
survey also gathered basic demographic information from participants. Overall, 122 surveys were
conducted. Participants in the survey were able to discontinue participating at any point and could also
choose to not answer questions if they did not feel comfortable.
Secondary Quantitative Data Collection
Secondary quantitative data were collected from a myriad of local, county, state and national sources to
create a profile of the community including population demographics, access to health care, chronic
diseases, behavorial risk factors, and social indicators. The data sets utilized are for the City of Memphis;
Shelby County; and the State of Tennessee to frame the scope of an issue as it compares to the broader
community. Where data was available, analyses were conducted at the most local level possible for
RMCM’s community. A detailed listing of the secondary data sources analyzed in this CHNA is provided
in Appendix II.
Once the interviews and secondary quantitative information were complete, the information was reviewed
and assessed and the current health status of the community was defined. Through further analysis and
discussions the health needs of the community were identified. (See Section VII).
Data Limitations and Information Gaps
There is limited publically available data regarding health status indicators for the City of Memphis and the
21-zip code area comprising the community served by RMCM. This Written Report includes a measure of
the Community Needs Index (CNI) by zip code for RMCM's community served. (See Section IV)
However, much of the other data used to assess health needs is reported on a broader geographic basis,
specifically, for Shelby County. Based on the percentage of both the zip codes of RMCM's defined
community as a subset of Shelby County and the racial composition of the defined community as a ratio of
the City of Memphis to Shelby County, the use of Shelby County data as a proxy for the City of Memphis
and the 21-zip code defined service area is deemed reasonable.

6
SECTION III - DESCRIPTION OF REGIONAL MEDICAL CENTER AT MEMPHIS
Regional Medical Center at Memphis is a regional healthcare resource providing accessible, efficient,
quality health care for individuals in Memphis. Regional Medical Center is anchored by highly respected
Centers of Excellence including trauma, burn, neonatal intensive care, high-risk obstetrics, and sickle cell
care; providing services to patients and their families from throughout the Mid-South. Rounding out the
continuum of care is an array of primary and specialty care services through the Health Loop Primary Care
Network and Outpatient Center.
MISSION, VISION AND VALUES
Our Mission
To improve the health and well-being of the people we serve by providing compassionate care and
exceptional services.
Our Vision
In collaboration with our academic partners, we will be the premier healthcare system advancing the quality
of life in our communities.
Our Values
We value quality CARE.
Compassion
Accountability
Respect
Excellence
WHO WE ARE AND WHY WE EXIST
Regional Medical Center at Memphis, chartered in 1829, is the oldest hospital in the State of Tennessee.
Throughout its 180-year history, the hospital has evolved significantly, housing a children's hospital,
tuberculosis hospital, military hospital, maternity hospital and ultimately the Regional Medical Center it is
today with nationally recognized Centers of Excellence and a commitment to providing quality healthcare to
all residents of the community it serves, including the uninsured and underinsured residents of Shelby
County.
Regional Medical Center at Memphis is a 631-licensed bed, general acute care facility located in downtown
Memphis. The medical staff is comprised of approximately 471 physicians and our workforce includes
approximately 2,200 dedicated employees. In FY2012, Regional Medical Center experienced 12,928
inpatient discharges; 80,855 outpatient visits; 48,985 emergency room visits and 49,119 primary care visits.
Regional Medical Center at Memphis has numerous Centers of Excellence, most notably its trauma, burn
and high-risk obstetrics.

7
Elvis Presley Trauma Center
The Elvis Presley Trauma Center, established in 1983, is the only Level I Adult Trauma Center within 150
miles of Memphis, and is designated as a Level I Trauma Center in Tennessee, Mississippi and Arkansas.
The Elvis Presley Trauma Center's multidisciplinary team of highly trained surgeons, anesthesiologists,
certified registered nurse anesthetists, nurses, respiratory therapists, orderlies, x-ray and lab technicians, and
medical students have treated approximately 100,000 patients over the past two decades.
Firefighters Regional Burn Center
The Firefighters Regional Burn Center is the only full-service Burn Center within a 150-mile radius of
Memphis. The center is comprised of 14 beds, an outpatient clinic, surgical facilities, a rehabilitation center,
wound care, restorative medicine and a research division. More than 300 patients are treated in the Burn
Center annually.
Sheldon B. Korones Newborn Center
Regional Medical Center at Memphis has one of the oldest and largest neonatal intensive care units in the
United States, treating more than 1,300 premature and/or critically ill newborns annually.
Other Services
In addition to these Centers of Excellence, Regional Medical Center at Memphis provides a wide array of
inpatient services; medical imaging, specialty and sub-specialty care through our Outpatient Center, and
primary care services through our four (4) Health Loop Clinics. Further, Regional Medical Center provides
comprehensive care to HIV/AIDS patients through the Adult Special Care Center, and is home to one of the
oldest sickle cell centers; providing expert care to sickle cell patients from throughout the region.
Diggs-Kraus Sickle Cell Center
For more than 80 years, the Diggs-Krauss Sickle Cell Center has provided primary outpatient medical care
to sickle cell disease patients through medical procedures that have been developed at the Regional Medical
Center at Memphis and adopted nationwide.
Adult Special Care Center
Regional Medical Center at Memphis provides comprehensive, yet individualized treatment for HIV-
positive adults throughout the region. The Adult Special Care center provides the following services:
primary and specialty medical care; nephrology care; mental health care; clinical pharmacy consultation
services; medication adherence counseling; nutritional counseling and medical case management. Patients
also receive guidance regarding the latest HIV-related research, support groups and networking
opportunities.
OUR TEACHING MISSION
The training component and expertise shared at a health system affiliated with a medical school elevates the
expert care not only in that hospital, but also in that community. Regional Medical Center at Memphis
serves as one of the primary medical and surgical teaching sites for the University of Tennessee Health
Science Center (UTHSC). More than half the doctors in Tennessee receive all or a portion of their training
at the hospital through its affiliation with UTHSC. More than 565 residents and medical students from
UTHSC trained at Regional Medical Center at Memphis during FY2012.

8
Regional Medical Center at Memphis is also home to a pharmacy residency program accredited by the
American Society of Health System Pharmacists. The hospital serves as a primary teaching site for the
University of Tennessee College of Pharmacy. During FY2011, six (6) PGY1 and PGY2 (post graduate
year 1 and 2) pharmacists completed residencies at Regional Medical Center of Memphis.
ORGANIZATIONAL COMMITMENT TO THE COMMUNITY/COMMUNITY BENEFIT
As the region's safety net facility, Regional Medical Center at Memphis provides millions of dollars worth
of uncompensated care to the residents of Memphis, Shelby County, Northern Mississippi and Western
Arkansas. In FY2011, Regional Medical Center at Memphis provided $128,500,000 in uncompensated care
(inclusive of bad debt, charity care and uncompensated costs from governmental payors). In addition to the
vast amount of uncompensated care provided, Regional Medical Center of Memphis also reinvests into the
community through sponsorships, community partnerships and employee volunteerism, as detailed below.
At Regional Medical Center at Memphis, we fully integrate our commitment to community service into our
management structure as well as our strategic and operational plans, and we are dedicated in monitoring and
evaluating our progress to those plans. We strive to develop innovative solutions and implement responsive
programs and services. We continuously seek and foster relationships with a wide array of collaborative
partners to build community and organizational capacity to improve overall health status (See Figure 1).
Our organizational commitment to community service and benefit is evidenced through our development of
community benefit-focused strategic initiatives in the FY2011-FY2015 Strategic Plan. Specific initiatives
related to enhancing and expanding Regional Medical Center at Memphis' community visibility and
awareness include: 1) engaging and supporting community partners/organizations whose purpose is to
positively impact health status and focus on health improvement through wellness and prevention; 2)
increasing management participation on various civic, business and community organizations; and 3)
participating in community and civic initiatives that are aligned with the organization's mission and strategic
goals.
Strategic Community Partnerships and Sponsorships
As a tax-exempt organization, Regional Medical Center at Memphis strives to be a prudent steward of our
resources by reinvesting in our facilities, programs, and most importantly the community. We partner with
several community organizations whose mission and vision reflect improving the overall health status and
wellness of the communities we jointly serve. RMCM supported the March of Dimes in FY2011 as a
corporate sponsor with a $25,000 gift to lower infant mortality and to support families. Figure 1 illustrates
our commitment to organizations with whom we partner in shaping a healthier future in our community via
corporate sponsorships:

9
Figure 1: Organizational Partnerships
Organization Event
March of Dimes Signature Chef's
Dinner/Sponsorship
March for Babies
Facing History and Ourselves Benefit Dinner
Komen Race for the Cure Annual 5K Race for Breast Cancer
Research and Awareness
Memphis Urban League Young
Professional Agents of Change
Monthly Networking Event
Make-a-Wish Foundation of Mid-South Corporate Sponsorship
United Way of the Mid-South Live United Campaign
American Heart Association Heart Walk
Heart Ball
Go Red for Women
Fit Friendly Worksite
Corporate Donation
Grace Magazine Showcase and Health Exposition
Source: RMCM Internal Records
COMMUNITY EDUCATION AND OUTREACH
Regional Medical Center at Memphis strives to improve the health status of the community it serves through
promoting a safe and healthy City of Memphis and the Mid-South through various community education
and outreach programs. These programs extend the expertise of RMCM's staff and academic partners
beyond the walls of the institution and into the community through education and support.
Injury Prevention Education/Trauma and Burn Outreach
Regional Medical Center at Memphis is dedicated to preventing injuries that lead to hospitalization by
providing education designed to prevent injuries and trips to the Trauma Center through age-appropriate
education series, including Destructive Decisions for high school students, Fall Prevention Seminars for
senior citizens and burn prevention and fire safety classes for children and adults. In FY2012, 3,243
individuals attended these educational offerings.
Traumatic Brain Injury (TBI) Services
Regional Medical Center at Memphis provides support and education for survivors of traumatic brain injury,
in addition to their family members and caregivers. In FY2012, 1,357 TBI survivors and loved ones
participated in support group events hosted by the hospital.
Sunrise Program
Regional Medical Center at Memphis offers the Sunrise Program, a hands-on educational program that
encourages early prenatal care for pregnant teens with the goal of obtaining optimal health during pregnancy
and beyond. Additionally, the Sunrise Program emphasizes staying in school and educating adolescents
about pregnancy prevention. In FY2012, 364 expectant teen moms participated in this vital program.

10
Other Outreach Efforts
Healthcare professionals from Regional Medical Center at Memphis donate their time and talents to health
fairs throughout the community by providing health screenings to detect both chronic and possibly life-
threatening conditions and health information that is audience-specific at no costs to the partnering (host)
group or organization. In FY2012, RMCM participated in community health fairs reaching more than 3,000
individuals. Specifically, RMCM extended its reach into the community via the following health fairs:
Back to School Health Fair
Its a Family Affair Community Health Fair
Sisterhood Showcase
Public Health and Safety Expo
Medicare Sign-Up Fair
6th Annual Community and Family Health Awareness Day
Real Talk: Teen Health Fair
Grainger Health Fair
Temple of Deliverance Church Health Fair
RMCM Health Loop Spring Into Good Health Community Health Fair
Community Health Summit - World Overcomers
10th Annual Jewish Family Services Senior Resource Fair
Employees at Regional Medical Center at Memphis embrace the health system's mission "to improve the
health and well being of the people" through volunteerism efforts with partners across the community.
During FY2012, RMCM's employees provided approximately 1,200 hours of volunteered time to causes and
organizations with whom we collaborate to improve the quality of life of our citizenry. In addition to the
aforementioned health fairs, RMCM employees offered their expertise to the following, but not limited to,
events in the community:
March of Dimes for Babies
Komen-Mid South Race for the Cure
LeMoyne Owen Hank Aaron Celebrity Weekend
American Heart Association Heart Walk
Fresh Starts Community Baby Shower
Wear Red Week Health Cooking Demonstration
MED Pride
Sisterhood Showcase
In addition to staff volunteerism via health fairs, events and providing corporate sponsorships, Regional
Medical Center at Memphis extends its executive presence beyond its walls through participating and/or
serving as board members or board officers for numerous community partners within the community.
Figure 2 depicts Regional Medical Center at Memphis' community board memberships (as of October
2012).

11
Figure 2: Regional Medical Center at Memphis Community Board Memberships
RMCM Executives by Board or Community Membership
Executive Title Organization/Position
Reginald Coopwood, M.D. President & Chief Executive
Officer
March of Dimes/Chair, Annual
Walk
United Way of the Mid-
South/Corporate Executive Team
Memphis Rotary Club/Member
Memphis Tomorrow Leadership
Council
Healthy Shelby Board of Directors
Robert Sumter, Ph.D. Chief Operating Officer & Chief
Information Officer
American Heart Association/Heart
Walk Chair; Leadership Council
Tish Towns, FACHE Senior Vice President, External
Affairs
Make A Wish Foundation/Board
Secretary
Memphis Rotary Club, Member
American Lung Association of the
Mid-South/Board Member
Southern College of
Optometry/Board Member
Workforce Investment Network
(WIN) Board of Directors
Monica Wharton, Esq. Senior Vice President/Legal
Counsel
Facing History and
Ourselves/Board Member
Rick Wagers Executive Vice President/Chief
Financial Officer
Downtown Memphis
Commission/Parking Authority
Committee
Pam Castleman Chief Nursing Officer Lifeblood Board of Directors
Delta Region Trauma Council for
Mississippi
Nursing Institute of the Mid-South
Board of Directors
Tammie Ritchey Vice President/Executive Director,
MED Foundation
Memphis Rotary Club/Member
Lori Spicer Manager, Community Affairs and
Engagement
Community Building and
Education/President
Source: RMCM Internal Records

12
SECTION IV - DESCRIPTION OF THE SERVICE AREA
THE COMMUNITY WE SERVE
The Regional Medical Center at Memphis provides services to Shelby County residents as well as other
parts of the state of Tennessee, Arkansas, Alabama, Mississippi and Missouri. However, based on the
predominance of patients served and health services provided, RMCM regards a particular geographic area
comprised of 21 zip codes located within the City of Memphis as the community served by RMCM for
purposes of this Written Report. (See Figure 3) The population of this defined area accounts for 80% of the
population of the City of Memphis. The City of Memphis is approximately 70% of Shelby County (U.S.
Census Bureau). In 2011, of the 11,563 total inpatient discharges at Regional Medical Center at Memphis,
72.5% originated from the defined area.
Figure 3: Regional Medical Center at Memphis Service Area with 2011 Population Density
Source: Thomson Reuters
In order to understand and fully assess the healthcare status and needs of a community, one must begin with
an analysis of demographic characteristics. Major changes or shifts in population relative to its size, racial
and/or ethnic composition, and age stratification can impact what type of health care services and resources
are required for a population to maintain its health, in addition to projecting future health care needs. As
depicted in Figure 4 below, the overall population of Regional Medical Center at Memphis' service area is

13
projected to remain relatively flat; 522,056 residents in 2011 to 522,183 residents by 2016 (RMCM Internal
Data).
Figure 4: Population Breakdown of RMCM Service Area for 2011 and 2016 by Zip Code
Source: RMCM Internal Data, ESRI Business Information Solutions, October 10, 2012
* No population reported for zip code 38131
Both Shelby County and the State of Tennessee are also projected to have minimal population growth
during the same time period, 1.1% and 4.1% growth, respectively (Thomson Reuters).
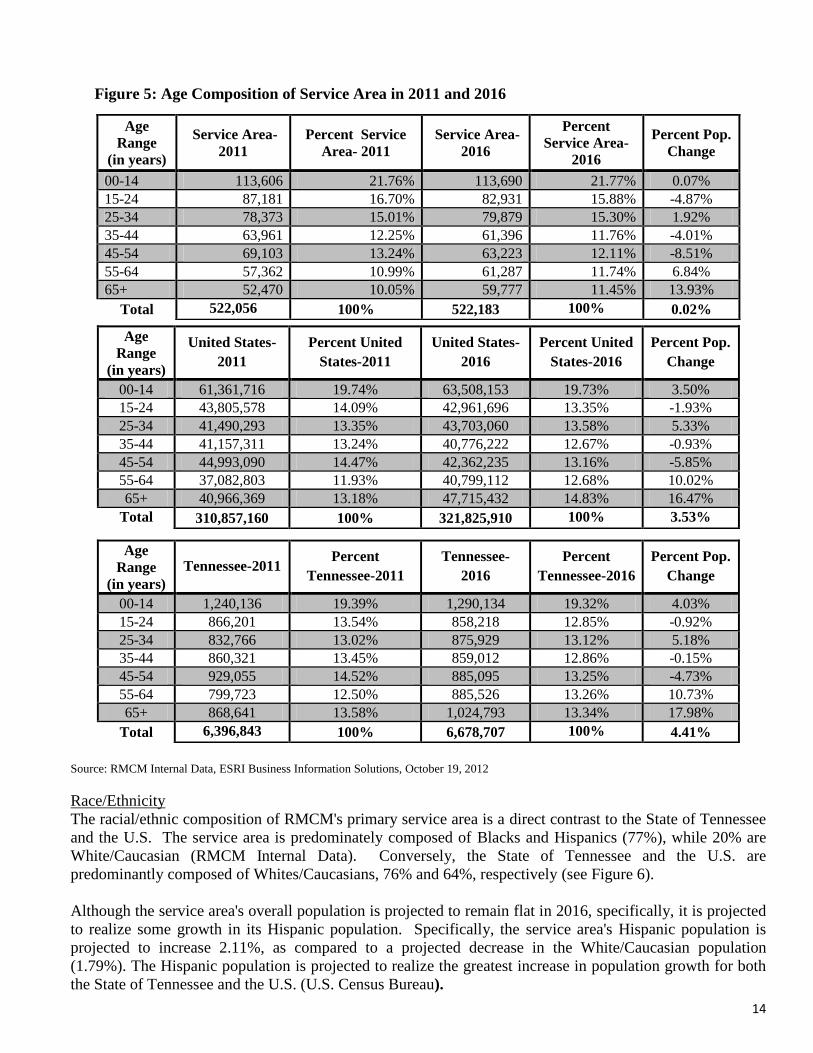
Age Composition
The median age of the primary service area is 34.6 years compared to 38.0 years in the State of Tennessee
and 35.2 years in the United States (U.S. Census Bureau). In the next five (5) years, the primary service
area's population is expected to realize considerable growth in the 65 and older age cohorts, as compared to
a decrease in population from ages 35-54 (see Figure 5). These age cohort demographic trends are mirrored
for both the State of Tennessee and the U.S. An increase in these age cohorts will have an impact on the
demand and supply of health resources as with increased age comes the increased consumption of healthcare
goods and services.
Population by Zip Code
Zip Code Population-
2011
Population-
2016
Percent
Change
Service Area
38103-Memphis 12,198 12,361 1.34%
38104-Memphis 22,504 22,212 -1.30%
38105-Memphis 6,394 6,563 2.64%
38106-Memphis 27,097 27,047 -0.18%
38107-Memphis 17,525 17,092 -2.47%
38108-Memphis 19,001 18,515 -2.56%
38109-Memphis 47,268 48,168 1.90%
38111-Memphis 42,488 43,398 2.14%
38112-Memphis 18,253 18,114 -0.76%
38114-Memphis 26,403 25,925 -1.81%
38115-Memphis 38,887 39,600 1.83%
38116-Memphis 39,839 39,801 -0.10%
38118-Memphis 41,059 41,544 1.18%
38122-Memphis 24,602 24,177 -1.73%
38126-Memphis 6,947 6,344 -8.68%
38127-Memphis 44,777 44,238 -1.20%
38128-Memphis 44,034 44,412 0.86%
38131-Memphis* 0 0 0
38132-Memphis 44 61 38.64%
38134-Memphis 42,170 42,186 0.04%
38152-Memphis 566 425 -24.91%
Total 522,056 522, 183 0.02%
14
Figure 5: Age Composition of Service Area in 2011 and 2016
Source: RMCM Internal Data, ESRI Business Information Solutions, October 19, 2012
Race/Ethnicity
The racial/ethnic composition of RMCM's primary service area is a direct contrast to the State of Tennessee
and the U.S. The service area is predominately composed of Blacks and Hispanics (77%), while 20% are
White/Caucasian (RMCM Internal Data). Conversely, the State of Tennessee and the U.S. are
predominantly composed of Whites/Caucasians, 76% and 64%, respectively (see Figure 6).
Although the service area's overall population is projected to remain flat in 2016, specifically, it is projected
to realize some growth in its Hispanic population. Specifically, the service area's Hispanic population is
projected to increase 2.11%, as compared to a projected decrease in the White/Caucasian population
(1.79%). The Hispanic population is projected to realize the greatest increase in population growth for both
the State of Tennessee and the U.S. (U.S. Census Bureau).
Age
Range
(in years)
Service Area-
2011
Percent Service
Area- 2011
Service Area-
2016
Percent
Service Area-
2016
Percent Pop.
Change
00-14 113,606 21.76% 113,690 21.77% 0.07%
15-24 87,181 16.70% 82,931 15.88% -4.87%
25-34 78,373 15.01% 79,879 15.30% 1.92%
35-44 63,961 12.25% 61,396 11.76% -4.01%
45-54 69,103 13.24% 63,223 12.11% -8.51%
55-64 57,362 10.99% 61,287 11.74% 6.84%
65+ 52,470 10.05% 59,777 11.45% 13.93%
Total 522,056 100% 522,183 100% 0.02%
Age
Range
(in years)
United States-
2011
Percent United
States-2011
United States-
2016
Percent United
States-2016
Percent Pop.
Change
00-14 61,361,716 19.74% 63,508,153 19.73% 3.50%
15-24 43,805,578 14.09% 42,961,696 13.35% -1.93%
25-34 41,490,293 13.35% 43,703,060 13.58% 5.33%
35-44 41,157,311 13.24% 40,776,222 12.67% -0.93%
45-54 44,993,090 14.47% 42,362,235 13.16% -5.85%
55-64 37,082,803 11.93% 40,799,112 12.68% 10.02%
65+ 40,966,369 13.18% 47,715,432 14.83% 16.47%
Total 310,857,160 100% 321,825,910 100% 3.53%
Age
Range
(in years)
Tennessee-2011 Percent
Tennessee-2011
Tennessee-
2016
Percent
Tennessee-2016
Percent Pop.
Change
00-14 1,240,136 19.39% 1,290,134 19.32% 4.03%
15-24 866,201 13.54% 858,218 12.85% -0.92%
25-34 832,766 13.02% 875,929 13.12% 5.18%
35-44 860,321 13.45% 859,012 12.86% -0.15%
45-54 929,055 14.52% 885,095 13.25% -4.73%
55-64 799,723 12.50% 885,526 13.26% 10.73%
65+ 868,641 13.58% 1,024,793 13.34% 17.98%
Total 6,396,843 100% 6,678,707 100% 4.41%

15
Figure 6: RMCM Community Demographic Breakdown for 2011 and 2016 as Compared To State
of Tennessee and the U.S.
Race Service Area-
2011
Percent Service
Area-2011
Service Area-
2016
Percent
Service Area-
2016
Percent
Service Area
Change
White 106,373 20.38% 97,059 18.59% -1.79%
Black 368,069 70.50% 366,132 70.12% -0.38%
Hispanic 34,746 6.66% 45,790 8.77% 2.11%
Asian 6,051 1.16% 6,246 1.20% 0.04%
American
Indian 957 0.18% 952 0.18% -0.00%
All Others 5,860 1.12% 6,004 1.15% 0.03%
Total 522,056 100% 522,183 100% 0.00%
Race Tennessee-2011 Percent
Tennessee-2011
Tennessee-
2016
Percent
Tennessee-
2016
Percent
Service Area
Change
White 4,835,652 75.59% 4,966,572 74.36% -1.23%
Black 1,053,989 16.48% 1,088,815 16.30% -0.18%
Hispanic 301,377 4.71% 392,636 5.88% 1.17%
Asian 93,095 1.46% 105,191 1.58% 0.12%
American
Indian 16,394 0.26% 17,335 0.26% 0.00%
All Others 96,336 1.51% 108,158 1.62% 0.11%
Total 6,396,843 100% 6,678,707 100% 0.00%
Race United States-
2011
Percent United
States-2011
United States-
2016
Percent United
States-2016
Percent
Service Area
Change
White 197,593,036 63.56% 198,040,786 61.54% -2.02%
Black 37,876,030 12.18% 38,948,537 12.10% -0.08%
Hispanic 51,596,810 16.60% 59,132,528 18.37% 1.77%
Asian 14,938,395 4.81% 16,298,261 5.06% 0.25%
American
Indian 2,254,024 0.73% 2,330,605 0.72% -0.01%
All Others 6,598,865 2.12% 7,075,193 2.20% 0.08%
Total 310,857,160 100% 321,825,910 100% 0.00%
Source: RMCM Internal Data, October 19, 2012; U.S. Census Bureau

16
$17,953
$24,661
$31,327
$47,809
$59,951
$17,770 $24,688 $30,663 $41,627 $54,857
$18,794 $26,699
$32,321 $48,309
$64,322
$36,473
$44,705
$43,314
$52,762
$0
$5,000
$10,000
$15,000
$20,000
$25,000
$30,000
$35,000
$40,000
$45,000
$50,000
$55,000
$60,000
$65,000
Less than high
school graduate
High School
Graduate
(includes GED)
Some college or
associate's degree
Bachelor's Degree Graduate or
professional
degree
Shelby County
Tennessee
United States
MHI-Memphis
MHI-Shelby County
MHI- Tennessee
MHI-United States
Education
Factors such as educational attainment, income, and employment have been associated with a community's
health status. Additionally, these factors can influence the health of a community (County Health
Rankings). Overall, low levels of education, lack of financial resources and low levels of social support are
linked to lower health status (World Health Organization). Educational attainment impacts the ability to
obtain employment, therefore increasing the likelihood of obtaining access to health care.
The High School graduation rate in the City of Memphis is 70.8%, lower than Shelby County, the State of
Tennessee and the United States (see Figure 7).
Figure 7: 2010 High School Graduation Rate Memphis, Shelby County, State of Tennessee and the
U.S.
Source: Tennessee Department of Education & National Center for Education Statistics
The level of education and median income level are positively correlated; as the level of education rises so
does the income level for an individual (see Figure 8). The earnings potential for residents with a high
school diploma or higher are greater in Shelby County than the State of Tennessee and also compares
favorably to the earnings potential of the U.S. (American Community Survey).
Figure 8: Median Household Income by Education Level in Shelby County, State of Tennessee and
the U.S.
Source: The Urban Child Institute, 2012 & U.S. Census Bureau, American Community Survey
Income
Memphis Shelby County Tennessee United States
High School Graduation Rate 70.8% 91.2% 86.1% 89.8%

17
2007 2008 2009 2010 2011
Shelby County 5.20% 6.80% 10.00% 10.10% 9.90%
Tennessee 4.90% 6.70% 10.50% 9.80% 9.20%
United States 4.60% 5.80% 9.30% 9.60% 8.90%
0.00%
2.00%
4.00%
6.00%
8.00%
10.00%
12.00%
The median household income for the City of Memphis is $36,473, compared to the state median of $43,314
(US Census Bureau, see Figure 8). In the service area, 36.8% percent of households have an income under
$25,000, as compared to 28.8% for the State of Tennessee and 23.7% for the U.S. (RMCM Internal Data,
ESRI Business Solutions, see Appendix III).
Employment
Shelby County experienced a high unemployment rate of 9.9% in 2011, compared to 9.2% in the State and
8.9% in the United States (Tennessee Department of Labor and U.S. Bureau of Labor Statistics). Since
2007, Shelby County has experienced a higher unemployment rate than both the State of Tennessee and the
United States except in 2009 when the state’s unemployment rate exceeded Shelby County’s unemployment
rate (see Figure 9).
Figure 9: Annual Unemployment Rates, 2007-2011
Source: U.S. Bureau of Labor Statistics; Tennessee Department of Labor
Poverty
As of August 2012, Shelby County’s Labor force totals 441,950 people, of which 39,590 people were
unemployed resulting in a high unemployment rate of 8.9% (Tennessee Department of Labor).
Unfortunately, the high unemployment rate greatly affects finances in the community. Approximately
11.7% of people in the U.S. live below the federal poverty limit (US Census Bureau); 55.3% of families in
Shelby County live below the federal poverty limit, over 5 times the State of Tennessee and national levels
(see Figure 10).
Figure 10: Percentage of Families Living in Poverty:
Source: The Urban Child Institute, 2012 and U.S. Census Bureau, American Community Survey, 2011
Poverty also can adversely affect a child's development; the effects of early poverty often persist into adult
hood (Urban Child Institute). Nearly 30% of children in Shelby County live in poverty compared to 25.7%
of children in Tennessee and 21.6% of children in the United States (U.S. Census Bureau, 2010).
The lack of financial resources weighs heavily on health status of the community; about 17% of the
population is uninsured with 18% of people reporting that they are underinsured (Shelby County Health
Shelby County Tennessee United States
Below Federal Poverty Level 55.3% 13.7% 11.7%

18
Department) whereas in 2009 15.7% of the state of Tennessee was uninsured (Tennessee Behavioral Risk
Factor Surveillance System). These factors greatly affect the population’s ability to receive healthcare and
consequently negatively affect their health status.
The lack of financial resources can affect the ability to provide healthy food, good education and quality
housing for individuals and their families. From 2007 to 2011, an average of 7,656 people were homeless in
Shelby County (U.S. Department of Housing and Urban Development).
Figure 11: Estimated Count of Homeless in Shelby County, 2007-2011
Source: 2007-2011 Annual Homeless Assessment Reports to Congress, U.S. Department of Housing and Urban Development
Of the people who are homeless in Shelby County, women are more likely to be homeless with families and
men are more likely to be homeless as individuals. African Americans are disproportionately affected by
homelessness, accounting for nearly 81% of the homeless population. Among people in emergency or
transitional shelters, about 56% are children under the age of 12 (2011 Annual Homeless Assessment Report
to Congress).
Crime The 2010 violent crime rate per 100,000 people in the City of Memphis was 1,006.5, lower than the rate for
Shelby County, but higher than the violent crime rate for the State of Tennessee, and over three time the
violent crime rate for the U.S. (see Figure 12).
Figure 12: Violent Crime Rate per 100,000
Source: Healthy People 2020 and Federal Bureau of Investigation (FBI)
According to the Federal Bureau of Investigation, violent crime is composed of four offenses: murder and
non-negligent manslaughter, forcible rape, robbery and aggravated assault.
Persons or
Families in
Emergency
Shelters
Persons or
Families in
Transitional
Housing
Individuals
in
Emergency
Shelters
Individuals in
Transitional
Housing
Persons or
Families in
Permanent
Supportive
Housing
Individuals
in
Permanent
Supportive
Housing
Total
Reporting
Across
Categories
2007 906 1,011 4,213 2,456 N/A N/A 8,586
2008 930 1,004 3,119 1,851 N/A N/A 6,904
2009 1,161 1,212 3,395 2,223 N/A N/A 7,991
2010 1,022 1,220 3,222 1,014 74 309 6,861
2011 862 1,356 3,734 1,348 134 508 7,942
Emergency shelters are places for people to live temporarily when they can't live in their previous residence
Transitional housing is longer-term housing for victims and survivors of domestic violence and their children
Permanent supportive housing is long-term, community-based housing that has supportive services for homeless
persons with disabilities, mental disorders and other health issues
Memphis Shelby County Tennessee United States
Violent Crime Rate 1,006.5 1,529.3 608.2 386.3

19
SECTION V - DESCRIPTION OF HEALTH CARE RESOURCES IN THE COMMUNITY
The residents in RMCM's community are served by a myriad of healthcare and health services providers
comprised of acute care hospitals and health systems, rehabilitation and sub-acute facilities, long-term care
facilities, behavioural health facilities and various community-based social services agencies.
Hospitals and Health Systems
Shelby County is served by 13 general, acute care hospitals, of which 11 are located in the City of Memphis.
In 2011, these hospitals accounted for 3,900 licensed inpatient beds and 130,212 inpatient discharges
(Tennessee Department of Health). The Memphis market is highly consolidated with three (3) health
systems (Baptist Memorial Health Care, Methodist Le Bonheur Healthcare and Tenet) accounting for 85%
of total hospital discharges in RMCM's service area (Tennessee Hospital Association, 2011). Additionally,
Regional Medical Center at Memphis, Delta Medical Center and other area hospitals account for the
remaining 15% percent of inpatient discharges in 2011. A detailed listing of the hospital and health system
providers is found in Figures 13-17 below.
Baptist Memorial Health Care
Baptist Memorial Health Care is the largest health system in Memphis, consisting of 14 total hospitals; of
which two (2) are located in the City of Memphis. Baptist Memorial Health Care (Memphis) is licensed for
876 beds, has over 4,000 physicians on staff (300 employed) and experienced approximately 33,173
discharges in 2011. Baptist also operates the Baptist College of Health Sciences (Health Leaders Interstudy,
Memphis Market Overview).
Figure 13: Baptist Memorial Health Care Hospitals - Memphis
Facility # of Beds
Acute Care Hospitals
Baptist Memorial Hospital- Memphis 706
Baptist Memorial Hospital for Women- Memphis 140
Total 846
Source: Tennessee Department of Health 2011 Joint Annual Reports; Health Leaders Interstudy Memphis Market Overview
Additionally, Baptist Memorial Health Care operates four (4) minor medical centers (urgent care), with one
(1) located in Memphis; and eight (8) home care/hospice centers, with four (4) locations in Memphis.
Methodist Le Bonheur Health Care
Methodist Le Bonheur is the second largest health system in Memphis, consisting of six (6) total hospitals,
of which four (4) are located in Memphis. Methodist Le Bonheur is licensed for 1,274 acute care beds, has
over 1,914 physicians on staff (170 employed) and experienced 45,239 discharges in 2011. Methodist/Le
Bonheur is also a teaching affiliate of the University of Tennessee Health Science Center and the University
of Memphis (Health Leaders Interstudy, Memphis Market Overview).

20
Figure 14: Methodist Le Bonheur Health Care Hospitals
Facility # of Beds
Acute Care Hospitals
Methodist University Hospital 617
Methodist North Hospital 246
Methodist South Hospital 156
Le Bonheur Children's Medical Center 255
Sub-total 1,274
Source: Tennessee Department of Health 2011 Joint Annual Reports; Health Leaders Interstudy Memphis Market Overview
Additionally, Methodist Le Bonheur operates LeBonheur Children's Medical Center, a regional referral
children's hospital that serves six (6) states. The hospital provides a Level I NICU and 45 pediatric
specialties, including open heart surgery and neurosurgery. Le Bonheur is the primary pediatric teaching
site for the University of Tennessee Health Science Center.
Methodist LeBonheur Healthcare operates four (4) minor medical centers; two (2) comprehensive wound
healing centers; five (5) surgery centers; seven (7) diagnostic imaging centers and two (2) sleep disorder
centers.
Tenet Healthcare Corporation (Saint Francis)
Tenet Healthcare operates two (2) hospitals in the Shelby County. Both facilities are named Saint Francis;
one is located in Memphis and the other is located in Bartlett. The hospitals are licensed for 724 beds, have
800 physicians on staff (29 employed) and experienced 20,736 discharges in 2011. (Health Leaders
Interstudy, Memphis Market Overview).
Figure 15: Tenet Healthcare Corporation Hospitals - Shelby County
Facility # of Beds
Saint Francis Hospital- Memphis 528
Saint Francis Hospital - Bartlett 196
Total 724
Source: Tennessee Department of Health 2011 Joint Annual Reports; Health Leaders Interstudy Memphis Market Overview
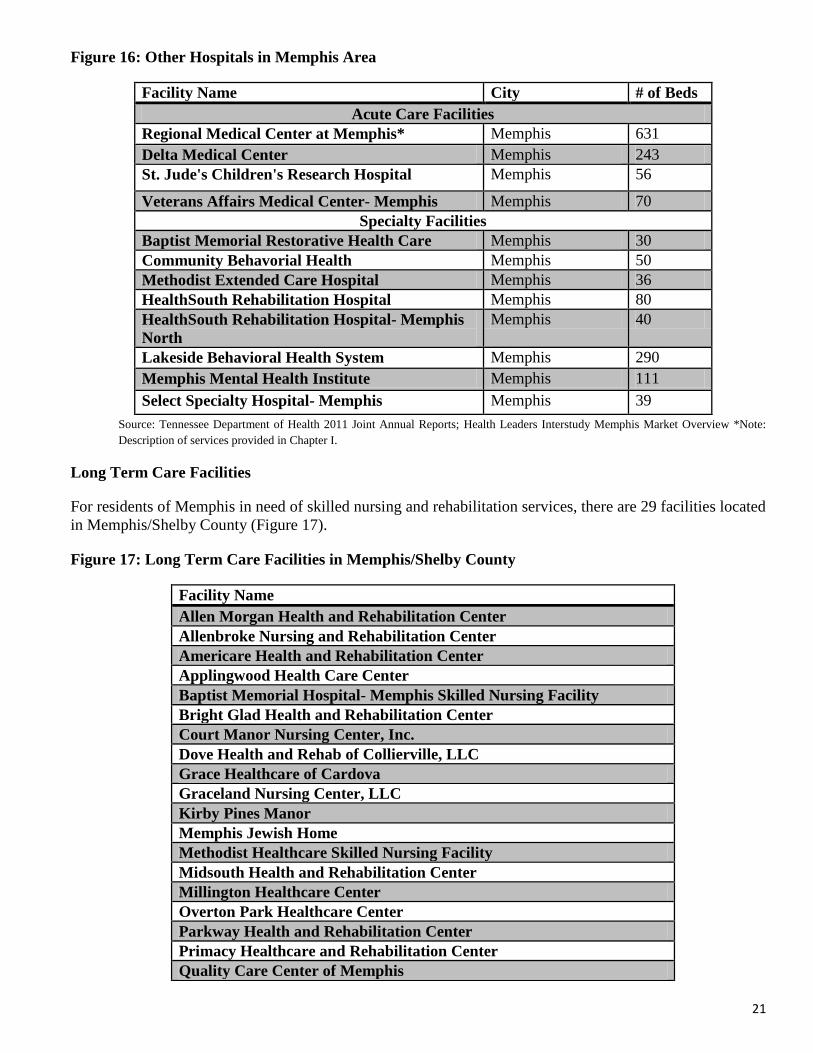
Other Hospital Facilities
In addition to acute care facilities, the residents of Memphis also have access to specialty hospitals,
including rehabilitation and mental health, in addition to the Veterans Affairs Hospital which provides
services to veterans and their families.
21
Figure 16: Other Hospitals in Memphis Area
Facility Name City # of Beds
Acute Care Facilities
Regional Medical Center at Memphis* Memphis 631
Delta Medical Center Memphis 243
St. Jude's Children's Research Hospital Memphis 56
Veterans Affairs Medical Center- Memphis Memphis 70
Specialty Facilities
Baptist Memorial Restorative Health Care Memphis 30
Community Behavorial Health Memphis 50
Methodist Extended Care Hospital Memphis 36
HealthSouth Rehabilitation Hospital Memphis 80
HealthSouth Rehabilitation Hospital- Memphis
North
Memphis 40
Lakeside Behavioral Health System Memphis 290
Memphis Mental Health Institute Memphis 111
Select Specialty Hospital- Memphis Memphis 39
Source: Tennessee Department of Health 2011 Joint Annual Reports; Health Leaders Interstudy Memphis Market Overview *Note:
Description of services provided in Chapter I.
Long Term Care Facilities
For residents of Memphis in need of skilled nursing and rehabilitation services, there are 29 facilities located
in Memphis/Shelby County (Figure 17).
Figure 17: Long Term Care Facilities in Memphis/Shelby County
Facility Name
Allen Morgan Health and Rehabilitation Center
Allenbroke Nursing and Rehabilitation Center
Americare Health and Rehabilitation Center
Applingwood Health Care Center
Baptist Memorial Hospital- Memphis Skilled Nursing Facility
Bright Glad Health and Rehabilitation Center
Court Manor Nursing Center, Inc.
Dove Health and Rehab of Collierville, LLC
Grace Healthcare of Cardova
Graceland Nursing Center, LLC
Kirby Pines Manor
Memphis Jewish Home
Methodist Healthcare Skilled Nursing Facility
Midsouth Health and Rehabilitation Center
Millington Healthcare Center
Overton Park Healthcare Center
Parkway Health and Rehabilitation Center
Primacy Healthcare and Rehabilitation Center
Quality Care Center of Memphis

22
Quince Nursing and Rehabilitation Center
Rainbow Health and Rehabilitation
Saint Francis Nursing Home
Signature Healthcare of Memphis
Spring Gate Rehabilitation and Healthcare Center
St. Peter Villa, Inc.
The King's Daughters and Sons Home
The Village at Germantown
Wesley Highland Manor
Whitehaven Community Living Center
Source: Tennessee Department of Health 2011 Joint Annual Reports
Other Service Providers
In addition to hospital-based providers, residents of Memphis have access to health services provided via
other non-for-profit providers, including Federally Qualified Health Centers ("FQHCs"), faith-based
organizations and disease-specific organizations, i.e. American Cancer Society. A detailed listing of these
organizations is provided in Appendix IV.

23
SECTION V - HEALTH STATUS INDICATORS
In order to measure and determine the overall health status of the community, an analysis of the public
health needs of the community was performed. This analysis included not only examining public health
indicators at the County level, but also an examination of all health and socioeconomic factors that
contribute to the community's health status at the more granular zip-code level. RMCM utilized this
bifurcated approach to determine the health status of its community.
Community Needs Index
Catholic Healthcare West, in partnership with Thomson Reuters, developed the country's first standardized
Community Needs Index (CNI). The CNI measures the severity of health disparity for every zip code in the
United States and demonstrates the link between community need, access to care, and preventable
hospitalizations. The ability to pinpoint neighborhoods with significant barriers to health care access is an
important advancement for health service providers and public health advocates (http://cni.chw-
interactive.org).
In addition to public health data, the CNI takes into account the underlying socioeconomic and structural
barriers that affect overall health. Using a combination of research, literature and experiential evidence, five
prominent barriers that make it possible to quantify health care access in communities across the nation were
identified:
Income barriers- Percentage of elderly, children and single parents living in poverty
Cultural/language barriers - Percentage Caucasian/non-Caucasian and percentage of adults
over the age of 25 with limited English proficiency
Educational barriers - Percentage without high school diplomas
Insurance barriers - Percentage uninsured and percentage unemployed
Housing barriers - Percentage renting homes
To determine the severity of barriers to health care access, the CNI gathers data about the community's
socio-economy i.e. what percentage of the population is elderly and living in poverty; what percentage of
the population is uninsured, etc. Using this data, scores are assigned to each barrier condition. The scores
are then aggregated and averaged for a final CNI score (each barrier receives equal weight in the average).
A score of 1.0 indicates a zip code with the lowest socioeconomic barriers, versus a score of 5.0 represents a
zip code with the most socioeconomic barriers.
The following map (Figure 18) illustrates the CNI scoring for the RMCM community. The CNI map is
color-coded, indicating need by zip code on a scale from blue (lowest need) to red (highest need).

24
Figure 18: Regional Medical Center at Memphis Community Needs Index Map
Source: http://cni.chw-interactive.org
As noted in the map above, only two (2) out of the 21 zip codes in RMCM's service area are scored as
having low health status improvement needs; the remaining 19 zip codes are all reflected as high health
status improvement need areas. Areas identified as high need have CNI score of 4.2-5.
County Health Rankings
County Health Rankings is a community health assessment model developed by the University of Wisconsin
Population Health Institute in conjunction with the Robert Wood Johnson Foundation, based on a conceptual
model of population health that includes by Health Outcomes (length and quality of life) and Health Factors
(determinants of health). The rankings are based on a summary composite score that is calculated from the
following individual measures:
Overall Health Outcomes 1. Health Outcomes - Mortality (premature death)
2. Health Outcomes - Morbidity (health-related quality of life; birth outcomes)
Overall Health Factors 3. Health Factors - Health behaviors (alcohol use; diet/exercise; sexual activity; tobacco use)
4. Health Factors - Clinical care (access to care; quality of care)
5. Health Factors - Social and economic factors (education; employment; income; community
safety; family and social support)
6. Health Factors - Physical environment (built environment; environmental quality)
The following table outlines Shelby County's relative rankings for the aforementioned individual measures
(Figure 19):

25
Figure 19: County Health Rankings - Shelby County
Type of Measure County Ranking
Overall Health Outcomes 59
Mortality 61
Morbidity 52
Overall Health Factors 66
Health Behaviors 55
Clinical Care* 12
Social and Economic Factors 85
Physical Environment 95 Source: www.CountyHealthRankings.org, 2012
*Defined as access to care (% <65 w/o insurance; population per primary care provider) and quality of care (preventable
hospitalizations; diabetes and mammography screenings)
As depicted in the table above, Shelby County is ranked 59th out of the total 95 counties in the State of
Tennessee for overall health outcomes, and 66th for overall health behaviors. Conversely, Shelby County is
ranked 12th for clinical care, which measures both the quality and access to care.
Below is an examination of the health status of the community through the assessment of a myriad of
indicators that measure health and socioeconomic factors, including but not limited to, chronic conditions,
leading causes of death and obesity.
Health Indicators
In 2008, the age adjusted mortality rate in Shelby County was 921.9 per 100,000 (Healthy People 2020).
This is much higher than the State and the Country and is one half times greater for Black people than White
people (see Figure 20).
Figure 20: Age Adjusted Mortality Rate by Race, 2008
Source: Healthy People 2020 & U.S. National Center for Health Statistics
In addition, the 2006 average life expectancy in Shelby County was 74.4 years, one year less than the State
and almost four years less than the United States (see Figure 21).
Figure 21: Average Life Expectancy
Source: Tennessee Department of Health & U.S. National Center for Health Statistics
Shelby County Tennessee United States
Total 921.9 888.8 759.0
White 786.7 871.3 751.0
Black 1108.6 1036.2 936.0
Shelby County Tennessee United States
Life Expectancy in Years 74.4 75.4 78.5

26
Heart
Disease Cancer Stroke Accidents
Chronic
Lower
Repiratory
Diseases
Alzheimer's
Disease
Diabetes
Mellitus Homicide
Influenza &
Pneumonia
Kidney
Diseases
Total 231.0 206.7 57.6 43.9 41.7 38.9 28.9 18 19.5 16.4
White 198.8 175.8 41.8 42.8 48.3 40.4 16.9 5.8 19 10.5
Black 276.6 252.4 80.8 43.1 30.1 36.4 47.9 29.3 18.8 26.2
Female 187.2 170.3 53.3 27.4 37.1 39.8 26.5 5.7 16.9 13.8
Male 298.6 271.4 64.2 64.6 50.8 36.2 32.6 31.2 24.7 21
0.0
50.0
100.0
150.0
200.0
250.0
300.0
Leading Causes of Death
From 2007 to 2009, the top ten age adjusted causes of death in Shelby County were: 1) Heart Disease, 2)
Cancer, 3) Stroke, 4) Accidents, 5) Chronic Lower Respiratory Diseases (CLRD), 6) Alzheimer’s Disease,
7) Diabetes Mellitus, 8) Homicide, 9) Influenza and Pneumonia, and 10) Kidney Disease (Death Statistical
System, Tennessee Department of Health). The death rates are greatest among African Americans and males
for all causes except CLRD, influenza and pneumonia and Alzheimer's disease, which are highest among
white individuals (see Figure 22).
Figure 22: Shelby County Leading Causes of Death by Race and Sex per 100,000, 2007-2009
Source: Death Statistical System, Tennessee Department of Health
Shelby County experiences a greater death rate per 100,000 people across all ages compared to the State of
Tennessee (see Figure 23).
Figure 23: Deaths per 100,000 (All Causes) 2003-2009
Source: Healthy People 2020
Contributing factors to the disparity in the death rate between Shelby County and Tennessee are the high
injury death rate, homicide death rate, and firearm related death rate for individuals under the age of 18
years per 100,000 people (Healthy People 2020). The homicide and firearm related death rate for individuals
under the age of 18 is double the State rates and double the national rates for homicide and firearm related
deaths (see Figure 24).
Shelby County Tennessee
<18 years 106.8 76.2
18-44 years 206.5 180.1
45-64 years 815.3 801.9
65+ years 5,300.0 5,099.5

27
20.2
5.7 4.4
19.2
2.8 2.3
14.8
2.6 2.0 0
5
10
15
20
25
Injury Death Homicide Death Firearm Related Death
Shelby County
Tennessee
United States
Figure 24: Injury, Homicide & Firearm Related Deaths per 100,000 for individuals <18 years, 2003- 2009
Source: Healthy People 2020
Infant Mortality
In 2010, the infant mortality rate per 1,000 live births was double the national infant mortality rate and
almost triple among African Americans (see Figure 25). The Healthy People 2020 goal is for an infant
mortality rate of 6.00 per 1,000 live births, 4.30 less than the 2010 infant mortality rate in Shelby County
(Healthy People 2020).
In 2011, Shelby County experienced a decline in its infant mortality rate - from 10.3 to 9.6. This decrease
represents the lowest infant mortality rate in the County's history (Shelby County Health Department;
Commercial Appeal, 2012).

28
12.30
4.70
17.60
8.00
6.60
13.00
5.00
18.50
8.00
6.40
10.30
5.50
13.40
7.90
6.10
6.00
0.00 2.00 4.00 6.00 8.00 10.00 12.00 14.00 16.00 18.00 20.00
Shelby County-Total
Shelby County-White
Shelby County-Black
Tenessee-Total
United States-Total
Healthy People 2020 Goal
2020
2010
2009
2008
Figure 25: Infant Mortality by Race, 2008-2010
Source: The Urban Child Institute, 2012 & Healthy People 2020
Prenatal care and prenatal screening for women in pregnancy helps to prevent maternal and child death and
complications during pregnancy and lower infant mortality rates (World Health Organization). In 2010,
7.4% of pregnant women in Shelby County did not receive prenatal care (The Urban Child Institute). This
amount is over 3 times greater than the State percentage and is higher among African American pregnant
women (see Figure 26).

29
8.60% 8.90%
7.40%
8.90%
8.70%
6.70%
8.80% 8.70% 8.00%
3.00% 2.50%
2.10%
0.00%
1.00%
2.00%
3.00%
4.00%
5.00%
6.00%
7.00%
8.00%
9.00%
10.00%
2008 2009 2010
Shelby County-
Total
Shelby County-
White
Shelby County-
Black
Tenessee-Total
11.00%
6.90%
13.80%
9.20%
8.20%
11.10%
6.20%
14.10%
9.20%
8.20%
11.10%
6.60%
14.00%
9.00%
8.20%
7.80%
0.00% 2.00% 4.00% 6.00% 8.00% 10.00% 12.00% 14.00% 16.00%
Shelby County-Total
Shelby County-White
Shelby County-Black
Tenessee-Total
United States-Total
Healthy People 2020 Goal
2020
2010
2009
2008
Figure 26: Prenatal Care Percentage by Race, 2010
Source: The Urban Child Institute, 2012
In Shelby County, 11% of babies are born with a low birth weight (The Urban Child Institute). The highest
rate of low birth weight births is experienced by children born to African American women; this value is
almost 5 percentage points higher than the national rate (see Figure 27).
Figure 27: Percent Low Birth Weight by Race, 2008-2010
Source: The Urban Child Institute, 2012 & Healthy People 2020
30
13.00%
10.70%
14.70%
11.40%
12.30%
13.00%
10.00%
15.00%
11.20%
12.20%
12.80%
10.30%
14.70%
11.30%
12.00%
11.40%
0.00% 4.00% 8.00% 12.00% 16.00%
Shelby County-Total
Shelby County-White
Shelby County-Black
Tenessee-Total
United States-Total
Healthy People 2020 Goal
2020
2010
2009
2008
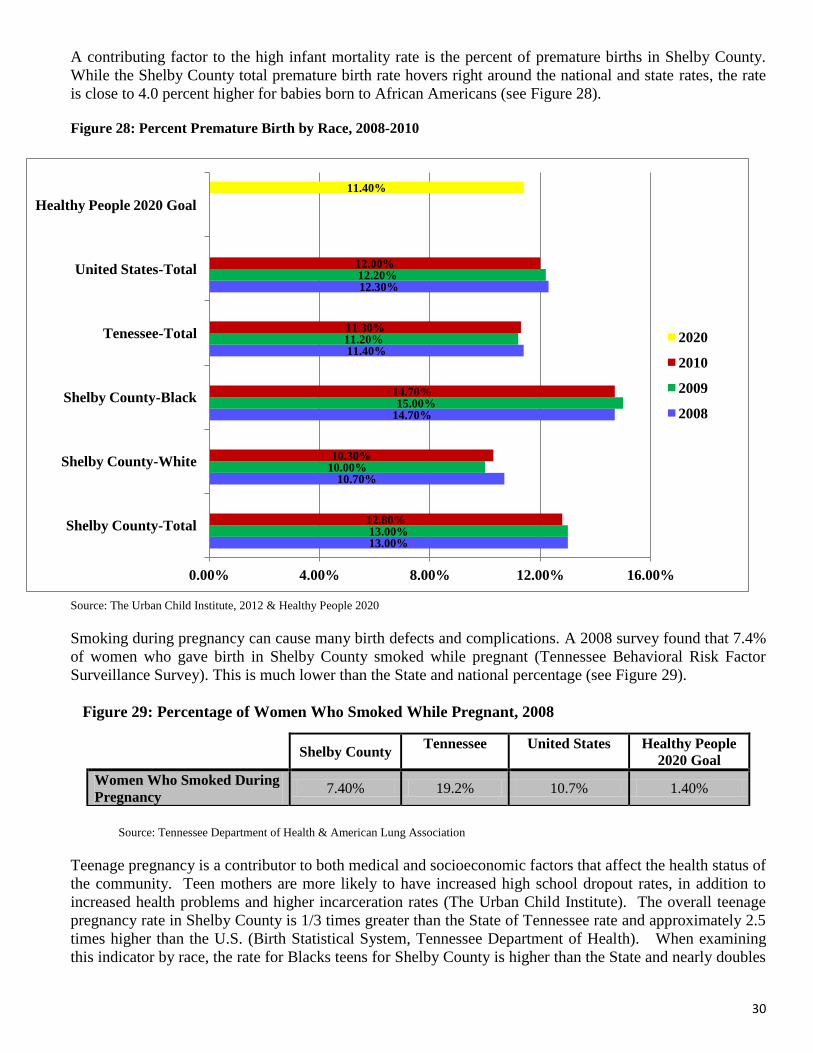
A contributing factor to the high infant mortality rate is the percent of premature births in Shelby County.
While the Shelby County total premature birth rate hovers right around the national and state rates, the rate
is close to 4.0 percent higher for babies born to African Americans (see Figure 28).
Figure 28: Percent Premature Birth by Race, 2008-2010
Source: The Urban Child Institute, 2012 & Healthy People 2020
Smoking during pregnancy can cause many birth defects and complications. A 2008 survey found that 7.4%
of women who gave birth in Shelby County smoked while pregnant (Tennessee Behavioral Risk Factor
Surveillance Survey). This is much lower than the State and national percentage (see Figure 29).
Figure 29: Percentage of Women Who Smoked While Pregnant, 2008
Source: Tennessee Department of Health & American Lung Association
Teenage pregnancy is a contributor to both medical and socioeconomic factors that affect the health status of
the community. Teen mothers are more likely to have increased high school dropout rates, in addition to
increased health problems and higher incarceration rates (The Urban Child Institute). The overall teenage
pregnancy rate in Shelby County is 1/3 times greater than the State of Tennessee rate and approximately 2.5
times higher than the U.S. (Birth Statistical System, Tennessee Department of Health). When examining
this indicator by race, the rate for Blacks teens for Shelby County is higher than the State and nearly doubles
Shelby County
Tennessee United States Healthy People
2020 Goal
Women Who Smoked During
Pregnancy 7.40% 19.2% 10.7% 1.40%

31
7.3 2.8
10.8 9.2
3.0
10.3 5.8
2.4
11.3
8.1
3.6
12.0 10.3
3.1
10.4
5.6
2.2
10.2
7.6
2.5
11.1
6.1
3.4
10.3
5.8
3.7
18.7
0.0
5.0
10.0
15.0
20.0
25.0
30.0
35.0
40.0
Prevalence-Black
Prevalence-White
Total Prevalence
the rate of the U.S. Conversely, the teen pregnancy rate for White teens in Shelby County is lower than the
State of Tennessee (see Figure 30).
Figure 30: Teenage Pregnancy Rate per 1,000 for Shelby County, Tennessee and the U.S.
Source: Tennessee Department of Health, Division of Health Statistics, Birth Statistical System, Fetal Death Statistical System, Induced
Abortion Statistical System & Healthy People 2020
Chronic Conditions
Shelby County experiences a high level of chronic diseases such as heart disease and diabetes. Both of these
diseases can cause strokes, a leading cause of death in Shelby County. The total prevalence for heart disease,
stroke and diabetes in Shelby County is 7.3%, 2.8%, and 10.8%, respectively (Tennessee Behavioral Risk
Factor Surveillance System). The prevalence rate is higher for white residents than black residents by nearly
1.0% in every category, and both heart disease and stroke prevalence in Shelby County is greater than the
national prevalence for these diseases but lower than the State (see Figure 31).
Figure 31: Chronic Disease Prevalence by Race (%), 2009
Source: Tennessee Behavioral Risk Factor Surveillance System, 2009, National Diabetes Information Clearinghouse & United States
Behavioral Risk Factor Surveillance System, 2009
Although heart disease, stroke, and diabetes are more prevalent among white residents in Shelby County, the
mortality rate for these diseases is much higher for Black individuals. The stroke mortality rate for African
Americans is nearly double the rate for White residents, and the mortality rate from diabetes is over double
Shelby County Tennessee United States
Teen Pregnancy Rate-Total 90.80 63.40 39.1
Teen Pregnancy Rate-White 43.80 52.40 35.7
Teen Pregnancy Rate-Black 118.20 103.30 59.5

32
Heart
Disease-
Shelby
County
Stroke-
Shelby
County
Diabetes-
Shelby
County
Heart
Disease-
Tennessee
Stroke-
Tennessee
Diabetes-
Tennessee
Heart
Disease-
United
States
Stroke-
United
States
Diabetes-
United
States
Healthy
People
2020 Goal
Heart
Disease
Healthy
People
2020 Goal
Stroke
Healthy
People
2020 Goal
Diabetes
Total Mortality 231.0 57.6 28.9 220.7 51.3 26.5 195.2 42.0 22.4 100.8 33.8 65.8
Mortality-White 198.8 41.8 16.9 214.7 48.3 23.3 177.0 37.4 19.1
Mortality-Black 276.6 80.8 47.9 272.4 73.0 52.7 234.6 54.5 39.5
0.0
50.0
100.0
150.0
200.0
250.0
300.0
the rate for Whites (Tennessee Behavioral Risk Factor Surveillance System). Further, the mortality rates for
heart disease and stroke are greater in Shelby County than the State and the United States (see Figure 32).
Figure 32: Chronic Disease Mortality Rate by Race per 100,000, 2009
Source: Tennessee Death Statistical System; National Vital Statistics Report, 2009 & Healthy People 2020
In 2010, the total number of deaths in Shelby County from heart disease and diabetes totaled 1,997 people,
of which 1,762 deaths were from heart disease (Tennessee Department of Health). While the number of
deaths from heart disease is higher among White people, the number of deaths from diabetes is still nearly
double for Black individuals than White individuals. This trend extends to the State of Tennessee; where
over five times the number of Black individuals die from diabetes than White individuals (see Figure 33).
Figure 33: Heart Disease and Diabetes Deaths for Shelby County and States of Tennessee
Source: Tennessee Department of Health, Vital Statistics Report
In Shelby County, women experience a greater prevalence of diabetes at 12.30% compared to men at
11.30% (CDC). The prevalence of diabetes for men in Shelby County is lower than the national prevalence,
but the prevalence for women is higher in Shelby County than the U.S. (see Figure 34). Tennessee data
could not be found.
Shelby
County-
Total
Shelby
County-
White
Shelby
County-
Black
Tennessee
-Total
Tennessee
-White
Tennessee
-Black
Heart
Disease 1,762 898 849
14,489 12,503 1,922
Diabetes 235 89 146 1,678 1,299 370
Total 1,997 987 995 16,167 13,802 2,292
33
30.20% 28.10%
35.50%
37.50%
34.40% 35.80%
30.50%
0.00%
5.00%
10.00%
15.00%
20.00%
25.00%
30.00%
35.00%
40.00%
Shelby County Tennessee United States Healthy People 2020
Goal
Male
Female
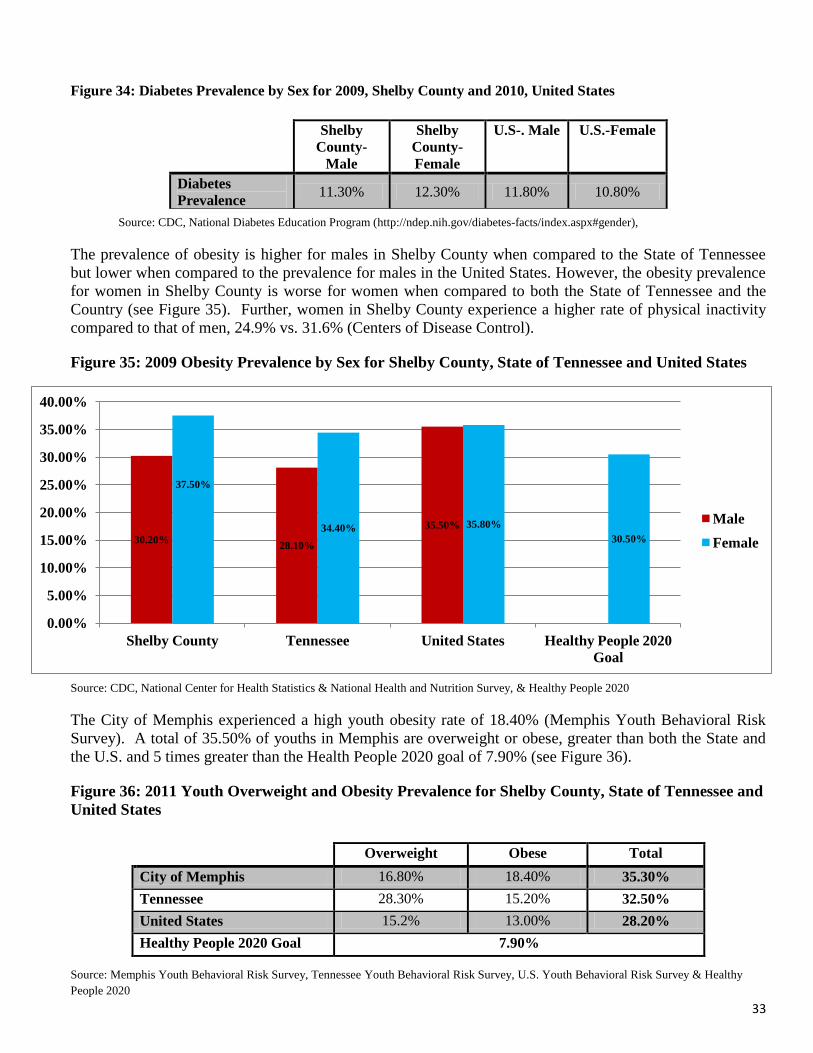
Figure 34: Diabetes Prevalence by Sex for 2009, Shelby County and 2010, United States
Source: CDC, National Diabetes Education Program (http://ndep.nih.gov/diabetes-facts/index.aspx#gender),
The prevalence of obesity is higher for males in Shelby County when compared to the State of Tennessee
but lower when compared to the prevalence for males in the United States. However, the obesity prevalence
for women in Shelby County is worse for women when compared to both the State of Tennessee and the
Country (see Figure 35). Further, women in Shelby County experience a higher rate of physical inactivity
compared to that of men, 24.9% vs. 31.6% (Centers of Disease Control).
Figure 35: 2009 Obesity Prevalence by Sex for Shelby County, State of Tennessee and United States
Source: CDC, National Center for Health Statistics & National Health and Nutrition Survey, & Healthy People 2020
The City of Memphis experienced a high youth obesity rate of 18.40% (Memphis Youth Behavioral Risk
Survey). A total of 35.50% of youths in Memphis are overweight or obese, greater than both the State and
the U.S. and 5 times greater than the Health People 2020 goal of 7.90% (see Figure 36).
Figure 36: 2011 Youth Overweight and Obesity Prevalence for Shelby County, State of Tennessee and
United States
Source: Memphis Youth Behavioral Risk Survey, Tennessee Youth Behavioral Risk Survey, U.S. Youth Behavioral Risk Survey & Healthy
People 2020
Shelby
County-
Male
Shelby
County-
Female
U.S-. Male U.S.-Female
Diabetes
Prevalence 11.30% 12.30% 11.80% 10.80%
Overweight Obese Total
City of Memphis 16.80% 18.40% 35.30%
Tennessee 28.30% 15.20% 32.50%
United States 15.2% 13.00% 28.20%
Healthy People 2020 Goal 7.90%

34
465.2 446.7 484.4
213.5 177.2
271.8
467.8 466.6 468.1
202.2 196.9
249.8
462.1 460.5
472.3
173.2 177.2 211.3
160.6
0
100
200
300
400
500
600
Total White Black
Prevalence-Shelby County
Mortality-Shelby County
Prevalence-Tennessee
Mortality-Tennessee
Prevalence-United States
Mortality-United States
Healthy People 2020 Cancer
Mortality Goal
High Blood Pressure
Another health outcome that is prevalent in Shelby County is high blood pressure. Between 2005 and 2009
36.0% of Shelby County residents were diagnosed with high blood pressure compared to 32.2% for the State
of Tennessee (Healthy People 2020).
About 9.52% of people in Shelby County have Asthma compared to 9.07% in the State (Tennessee
Behavioral Risk Factor Surveillance Survey). This is higher than the national prevalence for asthma.
Cancer Prevalence
Cancer is the second leading cause of death in Shelby County and has a prevalence of 465.7 per 100,000
people (Tennessee Department of Health, Cancer Registry). While the prevalence rates of cancer among
White and Black individuals in Shelby County are similar at 446.7 and 484.4 respectively, Black
individuals' mortality rates is greater than that of Whites (Tennessee Behavioral Risk Factor Surveillance
System). While cancer prevalence rates are similar between Shelby County, the State, and the U.S., cancer
mortality rates are much higher in Shelby County than the State and the U.S. (see Figure 37).
Figure 37: Cancer Prevalence and Mortality rate by Race per 100,000, 2009
Source: Tennessee Department of Health, Office of Cancer Surveillance, Cancer Registry, Kaiser Family Foundation & Healthy People 2020
In Shelby County, lung cancer and colorectal cancer have a prevalence rate of 67.0 and 55.8 with a mortality
rate of 59.6 and 22.4 per 100,000 people respectively (Tennessee Department of Health). The prevalence
and mortality rates for both of these cancers are higher among Black individuals than White people and in
the case of colorectal cancer, the mortality rate among Black individuals is more than double the rate among
White individuals (Tennessee Department of Health). Both lung cancer and colorectal cancer prevalence and
mortality rates are higher in Shelby County than compared to the total rates of the United States but lower
for lung cancer compared to Tennessee (see Figure 38).

35
67.0 61.4
74.5
59.6 52.8
70.2 81.0 81.7 77.8
66.5 66.5 66.5 64.3 59.2
72.4
48.5 49.2 52.2
45.5
0.0
10.0
20.0
30.0
40.0
50.0
60.0
70.0
80.0
90.0
Total White Black
Lung Cancer Prevalence and Mortality Rate, per 100,000 Prevalence-Shelby County
Mortality-Shelby County
Prevalence-Tennessee
Mortality-Tennessee
Prevalence-United States
Mortality-United States
Healthy People 2020 Lung
Cancer Mortality Goal
55.8
47.5
66.0
22.4
16.2
32.8
48.8 47.3
58.6
18.5 17.3
28.4
42.5 41.0
52.7
15.7 15.3
22.1
14.5
0.0
10.0
20.0
30.0
40.0
50.0
60.0
70.0
Total White Black
Colorectal Cancer Prevalence and Mortality per 100,000 Prevalence-Shelby County
Mortality-Shelby County
Prevalence-Tennessee
Mortality-Tennessee
Prevalence-United States
Mortality-United States
Healthy People 2020
Colorectal Cancer
Mortality Goal
Figure 38: Lung Cancer and Colorectal Cancer Prevalence and Mortality Rate per 100,000, 2009
Source: Tennessee Department of Health, National Cancer Institute, CDC, National Center for Health Statistics & Healthy People 2020
Sex-specific cancers such as breast cancer and prostate cancer also have high prevalence rates in Shelby
County. If detected early, these cancers can have a high survival rate. In 2010, approximately 17.49% of
women 40 years or older in Shelby County had not had a mammogram in two years compared to 22.51% in
the State (Tennessee Behavioral Risk Surveillance Survey). Both of these values are better than the national
percentage of women over 40 who had not had a mammogram in the last two years (see Figure 39).
Figure 39: Percent of Women who have not had a Mammogram in 2 Years, 2010
Source: Tennessee Behavioral Risk Factor Surveillance Survey & U.S. Behavioral Risk Factor Surveillance Survey
Shelby County Tennessee United States
No Mammogram in the Past
Two (2) Years 17.49% 22.51% 24.80%

36
123.3 124.4 118.7
31.1 24.0
43.1
117.3 116.9 116.7
24.3 22.4
36.6
122.9 132.1 127.4
22.2 21.6 30.5
20.6
0.0
20.0
40.0
60.0
80.0
100.0
120.0
140.0
Total White Black
Breast Cancer Prevalence and Mortality Rate, per 100,000 Prevalence-Shelby
County
Mortality-Shelby
County
Prevalence-Tennessee
Mortality-Tennessee
Prevalence-United States
Mortality-United States
Healthy People 2020
Breast Cancer Mortality
Goal
173.7 155.4
203.5
39.4 25.2
71.2
142.5 134.3
205.7
26.2 22.6
63.1
137.4 145.3
239.0
22.0 20.2 50.0
21.2
0
50
100
150
200
250
300
Total White Black
Prostate Cancer Prevalence and Mortality Rate, per 100,000
Prevalence-Shelby County
Mortality-Shelby County
Prevalence-Tennessee
Mortality-Tennessee
Prevalence-United States
Mortality-United States
Healthy People 2020 Prostate
Cancer Mortality Goal
Breast cancer has a prevalence of 123.3 per 100,000 and is more prevalent among white women, however,
almost double the number of black women die from breast cancer than white women (Tennessee
Department of Health). The prevalence of breast cancer in Shelby County is roughly the same as in the
State and the United States, but the mortality rates are much higher in Shelby County compared to these
areas (see Figure 40).
Figure 40: Breast Cancer Prevalence and Mortality Rate per 100,000, 2009
Source: Tennessee Department of Health, Cancer Registry, National Cancer Institute & Healthy People 2020
The prevalence of prostate cancer is 173.7 per 100,000 people, higher than lung cancer, colorectal cancer,
and breast cancer (Tennessee Department of Health). The prevalence rate for prostate cancer is highest
among black men and the mortality rate of prostate cancer for black men is three times greater than the rate
for white men (Tennessee Department of Health). The prevalence rate and mortality rate of prostate cancer
is higher in Shelby County than the State and the United States (see Figure 41).
Figure 41: Prostate Cancer Prevalence and Mortality Rate per 100,000, 2009
Source: Tennessee Department of Health, Cancer Registry, National Cancer Institute & Healthy People 2020

37
Infectious Disease
The 2008 HIV prevalence in Shelby County per 100,000 people was 791.8 compared to the state HIV
prevalence of 283.0 (Healthy People 2020). This rate is highest among African Americans and males (see
Figure 42).
Figure 42: HIV Prevalence per 100,000, 2008
Source: Healthy People 2020; Centers for Disease Control and Prevention
Between 2005 and 2009, the age adjusted HIV death rate in Shelby County was 13.6, over three times the
rate of the State which was 4.4 deaths and almost four times the national rate of 3.9 deaths (Healthy
People 2020).
In 2009, Hepatitis B and Syphilis were reported in Shelby County at higher than expected cases (CDC,
National Notifiable Diseases Surveillance System). See Figure 43
Figure 43: Reported Cases of Hepatitis B, Pertussis and Syphilis, 2009
Source: CDC, National Notifiable Diseases Surveillance System
1,150.50
433.2
297.3
473.6
142.9 86.5 0.00
200.00
400.00
600.00
800.00
1,000.00
1,200.00
1,400.00
Shelby County Tennessee United States
Male
Female
Shelby County
Expected
Cases
Shelby County
Reported
Cases
Tennessee
Reported
Cases
United States
Reported Cases
Hepatitis B 54 93 136 3,405
Pertussis 163 99 197 16,858
Syphilis 54 130 1,317 44,828

38
General Health Status Indicators
In a 2009 survey, 16.5% of adults 18 years and older reported that they had fair or poor health and an
average of 9 days a month of poor physical health (Tennessee Behavioral Risk Factor Surveillance System).
This was better than the State but worse than the United States (see Figure 44). In 2009, 4,046 people in
Shelby County died prior to the age of 75, the highest number in the state of Tennessee (Tennessee
Department of Health).
Figure 44: Fair or Poor Health and Average days of Poor Physical Health
Source: Tennessee Behavioral Risk Factor Surveillance System, 2009 & Healthy People 2020
Risk Behavior Factors
Nutrition and Exercise
Access and consumption of adequate amounts of fruits and vegetables correlates directly with income and
education; persons with higher incomes and educational attainment generally maintain healthier eating
habits. Similarly, persons with higher incomes engage more often in regular physical activity, as they are
more likely to afford health club memberships or the purchasing of home exercise equipment. In 2009,
77.1% of Shelby County residents reported that they consume less than the daily recommended allowance
of five (5) servings of fruits and vegetables a day (Figure 45). This percentage is greater than the State of
Tennessee and approximately three (3) times greater than the U.S. (Tennessee Behavioral Risk Factor
Surveillance System).
Figure 45: Nutrition and Physical Activity
Source: Tennessee Behavioral Risk Factor Surveillance System, 2009, & U.S. Behavioral Risk Factor Surveillance System, 2009
Smoking and Alcohol Consumption
Tobacco use is another health behavior that affects health status. Cigarette use can contribute to health
outcomes such as lung cancer, heart disease, and throat cancer. As of 2009 in Shelby County, 14.8% of the
population indicated that they were current smokers compared to 22.1% in the State of Tennessee and
19.3% in the United States (Tennessee Behavioral Risk Factor Surveillance System and CDC). The same
survey reported that of adults 18 years and older, 2.3% reported heavy drinking and 7.9% reported binge
drinking which is higher than the State prevalence of 1.9% and 6.8%, respectively but lower than the United
State’s prevalence of 4.7% and 15.6%, respectively(Tennessee Behavioral Risk Factor Surveillance System
and United States Behavioral Risk Factor Surveillance).
Binge drinking can lead to long term alcoholism, and heavy drinking can cause kidney disease and liver
cancer (World Health Organization). A higher prevalence of heavy drinking and binge drinking exists
among males while women experience higher prevalence of smoking in Shelby County (see Figure 46).
United States data by sex was not readily available.
Shelby County Tennessee United States
% Fair or Poor Health 16.5% 21.3% 9.5%
# Days with Poor Physical Health 9 12.4 3.6
Shelby County Tennessee United States
% Less than 5 servings of Fruits
and Vegetables a Day 77.1% 76.7% 23.4%
% Did Not Reach Daily Physical
Activity Recommendations 61.4% 64.1% 51.0%
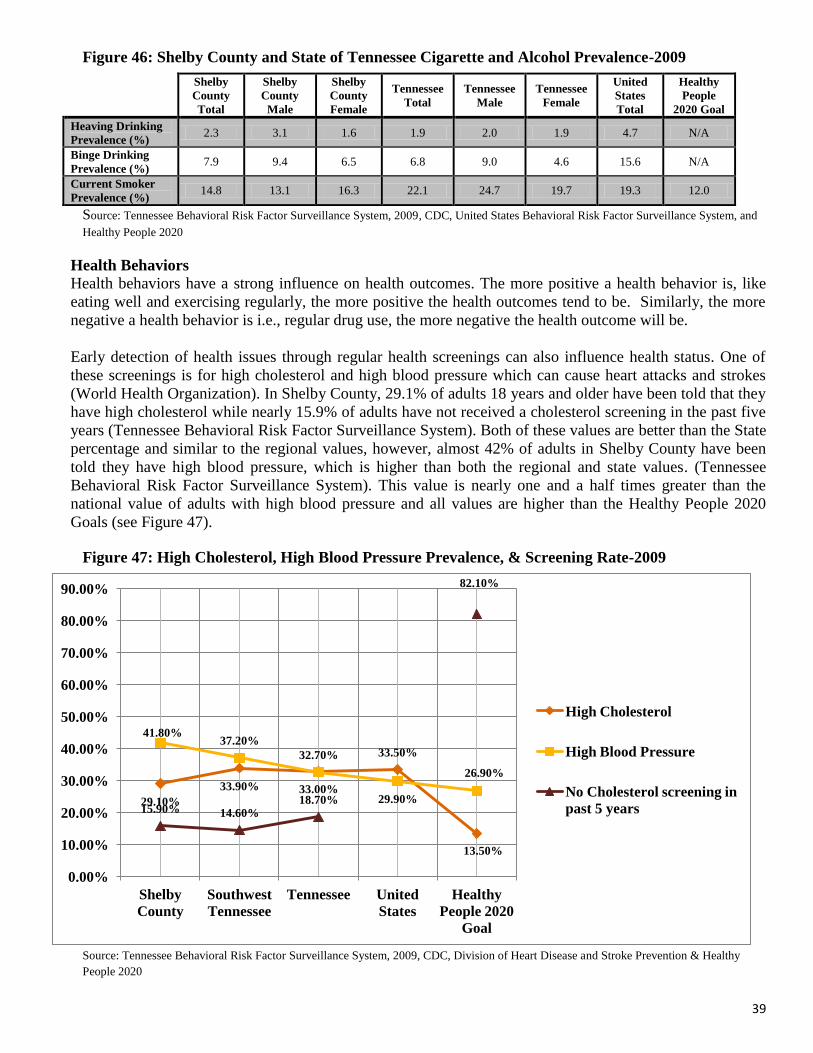
39
29.10%
33.90% 33.00%
33.50%
13.50%
41.80% 37.20%
32.70%
29.90%
26.90%
15.90% 14.60% 18.70%
82.10%
0.00%
10.00%
20.00%
30.00%
40.00%
50.00%
60.00%
70.00%
80.00%
90.00%
Shelby
County
Southwest
Tennessee
Tennessee United
States
Healthy
People 2020
Goal
High Cholesterol
High Blood Pressure
No Cholesterol screening in
past 5 years
Figure 46: Shelby County and State of Tennessee Cigarette and Alcohol Prevalence-2009
Source: Tennessee Behavioral Risk Factor Surveillance System, 2009, CDC, United States Behavioral Risk Factor Surveillance System, and
Healthy People 2020
Health Behaviors
Health behaviors have a strong influence on health outcomes. The more positive a health behavior is, like
eating well and exercising regularly, the more positive the health outcomes tend to be. Similarly, the more
negative a health behavior is i.e., regular drug use, the more negative the health outcome will be.
Early detection of health issues through regular health screenings can also influence health status. One of
these screenings is for high cholesterol and high blood pressure which can cause heart attacks and strokes
(World Health Organization). In Shelby County, 29.1% of adults 18 years and older have been told that they
have high cholesterol while nearly 15.9% of adults have not received a cholesterol screening in the past five
years (Tennessee Behavioral Risk Factor Surveillance System). Both of these values are better than the State
percentage and similar to the regional values, however, almost 42% of adults in Shelby County have been
told they have high blood pressure, which is higher than both the regional and state values. (Tennessee
Behavioral Risk Factor Surveillance System). This value is nearly one and a half times greater than the
national value of adults with high blood pressure and all values are higher than the Healthy People 2020
Goals (see Figure 47).
Figure 47: High Cholesterol, High Blood Pressure Prevalence, & Screening Rate-2009
Source: Tennessee Behavioral Risk Factor Surveillance System, 2009, CDC, Division of Heart Disease and Stroke Prevention & Healthy
People 2020
Shelby
County
Total
Shelby
County
Male
Shelby
County
Female
Tennessee
Total
Tennessee
Male
Tennessee
Female
United
States
Total
Healthy
People
2020 Goal
Heaving Drinking
Prevalence (%) 2.3 3.1 1.6 1.9 2.0 1.9 4.7 N/A
Binge Drinking
Prevalence (%) 7.9 9.4 6.5 6.8 9.0 4.6 15.6 N/A
Current Smoker
Prevalence (%) 14.8 13.1 16.3 22.1 24.7 19.7 19.3 12.0

40
Access to Health Care
Access to health care, including non-hospital-based providers, is a critical factor in determining the health
status of a community. Additional factors that contribute to access to health care are income, employment,
insurance, and availability of primary care providers. In 2009, Shelby County had a primary care physician
ratio of 719 residents to 1 provider (County Health Rankings). This is better than the State of Tennessee, but
lower than the national benchmark (see Figure 48).
Figure 48: Primary Care Provider Ratio, 2009
Source: County Health Rankings
Overall, most residents of Shelby County consider one person as their personal health care provider. In a
2010 survey, 91.47% of Shelby County residents responded yes to the question "Do you have one person
you think of as your personal doctor or health care provider?” (Tennessee Behavioral Risk Factor
Surveillance Survey). This amount is higher than the State percentage and exceeds the Healthy People 2020
goal of 83.9% (see Figure 49).
Figure 49: Percentage of People with Personal Doctor or Health Care Provider in Shelby County and
the State of Tennessee
Source: Tennessee Behavioral Risk Factor Surveillance Survey, 2010 & Healthy People 2020
Despite Shelby County residents reporting they consider one person as their health care provider, in a more
recent 2011 survey, 11.27% of Shelby County residents did not see a doctor when they needed to due to
costs (Tennessee Behavioral Risk Factor Surveillance Survey). This value is lower than the State and the
United States (see Figure 50).
Figure 50: Percentage of People Reporting Lack of Access to Doctor Due to Costs in Shelby County,
State of Tennessee and the U.S.
Source: Tennessee Behavioral Risk Factor Surveillance Survey, 2011 & Kaiser Family Foundation
A contributing factor to determining if there is adequate access to care is the availability of health insurance.
In 2011, approximately 16.8% of people were uninsured in Shelby County, compared to 14.6% in the State
of Tennessee and 15.1% in the U.S. (American Community Survey). The highest rate of uninsured
Shelby County 719:1
Tennessee 837:1
National Benchmark 631:1
Shelby County (%) Tennessee (%) Health People 2020
Goal
Do you have one person you
think of as your personal doctor
or health care provider?
91.47% 89.44% 83.90%
Shelby County Tennessee United States
Was there a time in the past 12
months when you needed to see a
doctor but could not
because of cost?
11.27% 15.21% 14.60%

41
individuals in Shelby County occurs among adults 18 to 64 years of age while the lowest is among adults 65
years and older (see Figure 51).
Figure 51: Percentage of Population Uninsured in Shelby County, State of Tennessee and the U.S.
Source: American Community Survey, 2011
As a possible consequence of the high rate of uninsured residents, Shelby County leads the State in most
inpatient admissions and outpatient discharges with emergency room services, accounting for 18.5% of
inpatient admissions and 13.1% of outpatient discharges; over 5.0 percentage points higher than the second
ranked county, Davidson (see Figure 52).
Figure 52: Inpatient Admissions and Outpatient Discharges w/Emergency Room Services
, 2010
Source: Tennessee Department of Health, Office of Health Statistics, Hospital Discharge Data System, 2010
In summary, the overall health status of the community and Shelby County has many opportunities for
improvement. Shelby County experiences high rates of infant mortality, chronic disease prevalence and
mortality; and health behavior risk factors such as obesity and high cholesterol. The cumulative effect of
these factors negatively impacts the future health and well being of the residents of Shelby County;
proactive and sustainable strategies are needed to reverse these trends and ensure a healthier community
going forward. Shelby County is making progress, and will continue to improve its efforts towards
achieving the Healthy People 2020 goals.
Shelby County Tennessee United States
Under 18 Years 6.30% 5.70% 7.50%
Adults 18-64 Years 23.80% 21.00% 21.00%
Over 65 years 0.80% 0.50% 1.00%
Total 16.80% 14.60% 15.10%
Inpatient Admissions with Emergency Services
Rank County Number
1 Shelby 80,086 (18.60%)
2 Davidson 58,846 (13.70%)
3 Knox 44,191 (10.30%)
4 Hamilton 32,077 (7.40%)
Tennessee Total 430,793
Outpatient Discharges with Emergency Services
Rank County Number
1 Shelby 373,608 (13.10%)
2 Davidson 314,284 (11.00%)
3 Knox 265,939 (9.30%)
4 Hamilton 198,455 (7.00%)
Tennessee Total 2,851,771

42
Figure 53: Healthy People 2020 Health Indicators Summary
Source: Healthy People 2020
Healthy People 2020 Health Indicators Summary Chart
Health Indicators Shelby County Value Healthy People 2020 Goal
Crime and Death Indicators
Violent Crime Rate (per 100,000) 1,529.36 399.60
Injury Deaths (per 100,000) 71.8 36.0
Homicide Deaths (per 100,000) 17.3 5.5
Firearm Related Deaths (per 100,000) 20.3 9.2
Pregnancy and Infant Health Indicators
Infant Mortality 10.30% 6.00%
Low Birth Weight 11.10% 7.80%
Premature Births 11.30% 11.40%
Women Who Smoked During Pregnancy 7.40% 1.40%
Teenage Pregnancy Rate (per 1,000) 90.80 32.6
Chronic Disease Indicators
Heart Disease Mortality (per 100,000) 231.00 100.80
Stroke Mortality (per 100,000) 57.60 33.80
Diabetes Mortality (per 100,000) 28.90 65.80
Adult Obesity Prevalence 33.60% 30.50%
Youth Obesity Prevalence 18.40% 7.90%
High Cholesterol Prevalence 29.10% 13.50%
High Blood Pressure Prevalence 41.80% 26.90%
No Cholesterol Screen in Past 5 Years 15.90% 17.90%
Infectious Disease Indicators
HIV Death Rate (per 100,000) 13.80 3.3
Cancer Indicators
Overall Cancer Mortality (per 100,000) 213.50 160.60
Lung Cancer Mortality 59.60 45.50
Colorectal Mortality 22.40 14.50
Breast Cancer Mortality 31.30 20.60
Prostate Cancer Mortality 39.40 21.20
Healthcare Access Indicators
One person as Health Care Provider 91.47% 83.90%
Uninsured Population 16.80% 0.00%
Primary Care Provider Ratio 719:1 631:1

43
SECTION VI - COMMUNITY SURVEYS
In an effort to gather information from the people who live within the community, a telephone survey was
conducted. The survey aimed to gain insight on the community’s socioeconomic factors of health, access to
healthcare, and their perception of overall health status. The survey also gathered basic demographic
information from participants. Overall, 122 surveys were conducted. Participants in the survey were able to
discontinue participating at any point and could also choose to not answer questions if they did not feel
comfortable doing so.
Sixty percent of respondents were female, with 53% over the age of 65. A majority of participants (69%)
were black compared to 24% who were white. A full breakdown of the demographic information collected
can be seen in Figure 54 below:
Figure 54: Demographic Breakdown
Gender
Male 40%
Female 60%
Age
18-24 3%
25-34 1%
35-44 7%
45-54 16%
55-64 20%
65-74 28%
75-84 19%
85+ 6%
Race
White 24%
Black 69%
Hispanic 3%
Other 3%
Marital Status
Single 31%
Married 28%
Separated 3%
Divorced 16%
Widowed 22%
Source: Community Surveys
Health Insurance Coverage
Eighty-four percent of participants indicated they have health insurance coverage. Of those covered, 38%
have commercial insurance and 50% have either TennCare/Medicaid or Medicare. For those participants
who indicated that they do not have health insurance, the most noted reasons were unemployment or
inability to pay for coverage.

44
Prescription Drugs
Ninety-two percent of participants indicated no difficulties in receiving needed prescriptions in the past 12
months. For those participants who indicated they were unable to receive needed prescriptions, the most
noted reasons were lack of acceptance of their prescription drug insurance or inability to afford co-pay (see
Figure 55).
Figure 55: Health Insurance Breakdown
Health Insurance
Yes 84%
No 16%
Type of Insurance
Commercial (BCBS, Aetna, Cigna, etc.) 38%
TennCare/Medicaid 37%
Medicare 10%
Other (Includes VA Insurance) 10%
Reason for Lack of Insurance
Unemployment 42%
Inability to pay 42%
No longer qualify for TennCare/Medicaid 8%
Other (No Explanation) 8%
Difficulty Getting Prescriptions in Past 12 Months 8%
Yes 8%
No 92%
Reason for Difficulty Getting Prescriptions
Lack of Prescription Drug Coverage 20%
Pharmacy doesn’t accept type of insurance 40%
Inability to Afford Co-Pay 40%
Problems Receiving Health Services Needed
Yes 7%
No 78%
N/A 14%
Source: Community Surveys
Health Status/Access
Seventy-one percent of participants noted that their overall heath either very good or fair. Regarding access
to services, 82% of participants indicated they have received a general health exam in the past 12 months,
with 86% receiving an exam in the past five (5) years. For those participants who noted they did not receive
a general exam in the past 12 months, the most common reasons were either lack of transportation or lack of
need for an exam due to good health status.
Physical Activity/BMI
Eighty-one percent of respondents have a body mass index (BMI) range of 25.0-30.0, which classifies them
as either overweight or obese. A healthy BMI range ranges from 21.4 to 24.9 (Centers for Disease Control
and Prevention).

45
Figure 56: General Health Status
Overall Health
Excellent 11%
Very Good 35%
Fair 36%
Poor 12%
Very Poor 6%
General Health Exam in Past 12 Months
Yes 82%
No 18%
General Health Exam in Past 5 Years
Yes 86%
No 14%
Days a week of Physical Activity
0 Days 34%
1-2 Days 23%
3-4 Days 20%
5+ Days 23%
BMI Range
Underweight ( <18.5 BMI) 1.45%
Normal (15.8-24.9 BMI) 17.39%
Overweight (25.0-29.9 BMI) 34.78%
Obese (>30.0 BMI) 46.38%
Source: Community Surveys
Neighborhood Safety
Ninety-one percent of participants noted they own their home or rent, with 1% having received housing
assistance in the past 12 months. Approximately 20% of survey participants indicated they did not feel safe
where they lived, primarily because of high crime rates and drug activity. The most common issues noted
regarding neighborhoods were the lack of sidewalks or sidewalks were not clean enough to use for physical
activity.
Social Services/Assistance
Twelve percent of respondents indicated having received help with rent, food or utilities in the past 12
months after a personal emergency, and 8% have received help with transportation, child care, or after
school care in the past 12 months.
Twenty-one percent of survey participants indicated they are the primary caregiver for another individual.
Twelve percent of caregivers noted not having adequate financial resources to cope with their caregiver
responsibilities. Additionally, 12% of caregivers noted not having adequate family support to cope with their
caregiver responsibilities. Eighteen percent of caregivers indicated not having adequate respite care services
available.

46
SECTION VI - KEY STAKEHOLDER INTERVIEWS
Key stakeholder interviews were conducted as part of the CHNA as a primary gathering tool. Per the IRS
Notice, RMCM took into account input from various individuals with special knowledge and/or expertise in
public health; persons representing agencies with data relevant to the healthcare needs of the community,
including an assessment of the overall health status in the community, access to healthcare services, health
disparities and the healthcare needs of vulnerable and medically underserved populations, including
specifically the aged, those with chronic diseases such as diabetes, and faith-based organizations
representing the poor and other demographic groups.
RMCM officials identified 22 external stakeholders (of which 18 were interviewed) as a part of this process.
Interview participants were asked to share their perspectives and professional opinions on the following
topics:
Description of the overall health status of the community
Contributing factors to the community's health status
Gaps or unmet needs in health services available to the community
Barriers to accessing health services in the community
Obstacles that exist to overcoming the identified barriers to access
RMCM's role, programs or services provided to improve the community's health status
Strength of services provided by RMCM
Collaborative opportunities for improving the community's health status
New or expanded programs and services aimed at improving overall health status
Health needs identified as priorities by the community input included the following, based on the incidence
of the diseases or health outcomes, their severity, and their overall impact on the community's health.
KEY STAKEHOLDER EXTERNAL INTERVIEW FINDINGS
Description of Community Health Status and Contributing Factors
The majority of key stakeholder interview participants described the health status of the community as poor.
There were several reasons or factors given as contributors to this view; both poverty and low economic
status were identified as the greatest contributors. Additionally, other factors noted that contributed to the
health status being deemed "poor' were the high prevalence of chronic diseases - specifically, diabetes,
hypertension, cardiovascular diseases and HIV/AIDS. Participants strongly noted that the aforementioned
chronic diseases' prevalence was a direct result of the high rates of obesity in the community.
Gaps and/or Unmet Needs
The most frequently mentioned health services gap or unmet need in the community is primary care
providers for the uninsured and underinsured. This gap is perceived to lead to a high and inappropriate use
of the area's emergency rooms. Also, the lack of transportation for the uninsured; mental health services and
chronic disease management for the uninsured were noted as great unmet health services needs.

47
Barriers to Accessing Health Care Services
The most frequently mentioned barrier for access to health care services was the lack of health insurance
coverage and/or funding for purchasing health services. This noted barrier was also mentioned as a
contributing factor to the community's health status description as "poor". An insufficient number of health
services providers who accept TennCare/Medicaid and the lack of transportation were also noted as major
barriers to accessing health services.
Opportunities for RMCM to Improve the Community's Health Status
An increased primary care presence at the neighborhood level was the most frequently mentioned
opportunity for RMCM. Participants acknowledged RMCM's current Health Loop Clinics, and felt that
these clinics needed to be expanded, both programmatically and in number of locations. Additionally, other
opportunities mentioned included an expanded community outreach presence, with a specific focus on
health education on chronic disease management.
Opportunities for Overall Improvement of the Community's Health Status
Overwhelmingly, the most frequently noted overall opportunity to improve the community's health status is
an increased collaboration between stakeholders - specifically health care providers, academia, businesses
and the faith community. Participants all noted that the responsibility of improving the community's health
status is not just that of hospitals; everyone has a stake in ensuring that the community is healthy, thriving
and growing.
Details regarding the findings of the key stakeholder interviews are located in Appendix V.

48
APPENDICES

49
APPENDIX I -KEY STAKEHOLDER INTERVIEW PARTICIPANTS
Name Organization Title Expertise
Internal (RMCM) Interview Participants
Teresa Bancroft Regional Medical Center at
Memphis
Manager, Decision Support Healthcare Finance
Marye Bernard Regional Medical Center at
Memphis
Director, Adult Special Care HIV/AIDS
Judy Briggs Regional Medical Center at
Memphis
Coordinator, Charity Care Healthcare Reimbursement
Susan Cooper Regional Medical Center at
Memphis
Population Health
Consultant/Former Health
Commissioner
Population Health
Management
Linda Dabaer Regional Medical Center at
Memphis
Coordinator, NICU Social
Services
Women's/Children's
Services
Patricia Adams-
Graves, M.D.
Regional Medical Center at
Memphis
Director, Sickle Cell
Services
Sickle Cell
Bettye Givens Regional Medical Center at
Memphis
Coordinator, NICU
Community Outreach
Women's/Children's
Services
Denise Headin Regional Medical Center at
Memphis
Coordinator, Trauma
Outreach and Injury
Prevention
Trauma and Burn
Patrick Malone,
M.D.
Regional Medical Center at
Memphis
Chief Health Officer, Health
Loop Clinics
Internal Medicine/
Health Administration
Keith Morrow Regional Medical Center at
Memphis
Director, Outpatient Center
Operations
Ambulatory Care
Administration
Bret Perisho Regional Medical Center at
Memphis
Vice President, Business
Development
Healthcare Finance
Johnnie Shipp Regional Medical Center at
Memphis
Director, Case Management Nursing/Case Management
Kelly Smith Regional Medical Center at
Memphis
Manager, NICU Women's/Children's
Services
Robert Sumter,
Ph.D.
Regional Medical Center at
Memphis
Chief Operating
Officer/Chief Information
Officer
Health Information
Technology/Administration
Susan Towler Regional Medical Center at
Memphis
Manager, Social Services Medical Social Services
Tish Towns Regional Medical Center at
Memphis
Senior Vice President,
External Affairs
Healthcare Administration

50
NAME ORGANIZATION TITLE EXPERTISE
External Interview Participants
Michael Allen Catholic Health Charities
of West Tennessee
President Faith-based Health
Initiatives
David Archer Saint Francis Health Care President and Chief
Executive Officer
Healthcare Administration
John Carroll American Diabetes
Association
Director Healthcare/Non Profit
Administration
Clarence Davis,
M.D.
Blue Cross/Blue Shield Vice President, Government
Business
Healthcare Reimbursement
Renee Frazier Healthy Memphis
Common Table
Chief Executive Officer Population Health
Management/Administration
Micah
Greenstein
Temple Israel Senior Rabbi Faith-based Initiatives
Peg Thorman-
Hartig, M.D.
University of Tennessee
Health Science Center
Chair, Department of
Primary Care
Primary Care
Willeen
Hastings
Memphis Health Center Chief Executive Officer Healthcare
Administration/FQHCs
Dora Ivey Aging Commission of the
Mid South
Director Geriatrics/Non Profit
Administration
Satish Kedia,
M.D.
University of Memphis
School of Public Health
Director Public Health
Melanie Keller Meritan, Inc. Executive Director Non Profit Administration
Lisa Klesges,
M.D.
University of Memphis
School of Public Health
Dean Public Health
Keith McGhee Saint Mark's Missionary
Baptist Church
Pastor Faith-based Initiatives
Steve Reynolds Baptist Memorial Health
Care
President and Chief
Executive Officer
Healthcare Administration
Kenneth
Robinson, M.D.
Shelby County Office of
Health
Advisor to Mayor Healthcare
Administration/Internal
Medicine
Craig Strickland Hope Presbyterian Church Senior Pastor Faith-based Initiatives
Eric Winston Mt. Zion Church Pastor Faith-based Initiatives
Jan Young Assisi Foundation Executive Director Healthcare
Administration/Non Profit

51
APPENDIX II - SECONDARY QUANTITATIVE DATA SOURCES
DATA TYPE SOURCE DATA
YEAR(s)
Population Estimates RMCM Internal Data (ERSI Business
Information Solutions)
2012
Educational Attainment U.S. Census Bureau, American Community
Survey
2009-2011
Household Income RMCM Internal Data (ERSI Business
Information Solutions)
2012
Median Household Income Change Thompson Reuters 2012
Shelby County Uninsured Population Shelby County Health Department 2011
Annual Unemployment Rates U.S. Bureau of Labor Statistics 2007-2012
Shelby County Total Labor Force Tennessee Department of Labor 2012
Families Living in Poverty U.S. Bureau of Census; The Urban Child Institute 2010; 2012
Percentage of Children Living in
Poverty
The Urban Child Institute; U.S. Census Bureau 2012; 2010
Percentage of Residents Underinsured Shelby County Health Department; Tennessee
Behavioral Risk Factor Surveillance System
2009
Estimated Count of Homeless in Shelby
County
Department of Housing and Urban Development 2008
Violent Crime Rate per 100,000 Federal Bureau of Investigation; Healthy People
2020
2011; 2010
Ranking in Health Factors, Health
Behaviors and Health Outcomes
County Health Rankings 2011
Emergency Room Inpatient and
Outpatient Admissions/Discharges
Tennessee Department of Health, Office of
Health Statistics, Hospital Discharge Data System
2010
Percent Less than 5 Servings of Fruits
and Vegetables a Day
Tennessee Behavioral Risk Factor Surveillance
System
2009
Percentage of Residents Reporting Fair
or Poor Health
Tennessee Behavioral Risk Factor Surveillance
System
2009
Number of Days with Poor Physical
Health
Tennessee Behavioral Risk Factor Surveillance
System
2009
Age-adjusted Adult Obesity Rates Healthy People 2020 2010
Obesity and Overweight Prevalence in
Shelby County, Southwest Tennessee
and State of Tennessee
Tennessee Behavioral Risk Factor Surveillance
System; Centers for Disease Control National
Health and Nutrition Survey
2009; 2009-
2010
Percentage of Adults 18+ Who Have
Been Told They Have High Cholesterol
Tennessee Behavioral Risk Factor Surveillance
System
2009
Percentage of Adults 18+ Without
Cholesterol Screening in Past 5 Years
Tennessee Behavioral Risk Factor Surveillance
System
2009
Percentage of Adults 18+ Who Have
Been Told They Have High Blood
Pressure
Tennessee Behavioral Risk Factor Surveillance
System; Healthy People 2020
2009; 2010
Percentage of Current Smokers in
Shelby County
Tennessee Behavioral Risk Factor Surveillance
System
2009
Percentage of Adults 18+ Who Are
Heavy Drinkers
Tennessee Behavioral Risk Factor Surveillance
System
2009
Percentage of Adults 18+ Who Are Tennessee Behavioral Risk Factor Surveillance 2009

52
Binge Drinkers System
Top 10 Age-Adjusted Leading Causes
of Death in Shelby County
Tennessee Department of Health, Death
Statistical System
2007-2009
Prevalence of Heart Disease Tennessee Department of Health, Death
Statistical System
2009
Prevalence of Stroke Tennessee Department of Health, Death
Statistical System
2009
Prevalence of Diabetes Tennessee Department of Health, Death
Statistical System
2009
Percentage of Adults 18+ With
Diabetes
Healthy People 2020 2010
Chronic Disease Mortality Rates by
Race
Tennessee Department of Health, Death
Statistical System
2009
Heart Disease Deaths by Race Tennessee Department of Health, Vital Statistics 2010
Diabetes Deaths by Race Tennessee Department of Health, Vital Statistics 2010
Cancer Prevalence and Mortality by
Race
Tennessee Department of Health, Cancer
Registry; Kaiser Family Foundation
2009
Lung Cancer Prevalence and Mortality
Rate
Tennessee Department of Health, Cancer
Registry;
2009
Colorectal Cancer Prevalence and
Mortality Rate
Tennessee Department of Health, Cancer
Registry;
2009
Breast Cancer Prevalence and Mortality
Rate
Tennessee Department of Health, Cancer
Registry;
2009
Prostate Cancer Prevalence and
Mortality Rate
Tennessee Department of Health, Cancer
Registry;
2009
Deaths Per 100,000 (All Causes) Healthy People 2020 2010
Injury, Homicide and Firearm Related
Deaths per 100,000 for Persons <18
Healthy People 2020 2010
Infant Mortality by Race The Urban Child Institute 2012
Prenatal Coverage Percentage by Race The Urban Child Institute 2012
Percent Low Birth Rate by Race The Urban Child Institute 2012
Percent Premature Birth Rate by Race The Urban Child Institute 2012
Teenage Pregnancy Rate by Race Tennessee Department of Health, Birth Statistical
System; Healthy People 2020
2009; 2010
HIV Prevalence per 100,000 Healthy People 2020 2010
Age-adjusted HIV Death Rate, Shelby
County
Healthy People 2020 2010

53
APPENDIX III - SERVICE AREA HOUSEHOLD INCOME
Household
Income
Service Area
Number of
Households-
2011
Service Area
Percent of
Total
Households-
2011
Service Area
Number of
Households-
2016
Service Areas
Percent of
Total
Households
2016
Percent
Change
$ 0 - $
14,999 43,992 22.03% 42,258 21.41% -3.94%
$ 15,000 - $
24,999 29,466 14.75% 22,798 11.55% -22.63%
$ 25,000 - $
34,999 26,830 13.43% 22,572 11.44% -15.87%
$ 35,000 - $
49,999 31,816 15.93% 29,922 15.16% -5.95%
$ 50,000 - $
74,999 32,433 16.24% 40,967 20.75% 26.31%
$ 75,000 - $
99,999 16,568 8.30% 20,842 10.56% 25.80%
$100,000 -
$149,999 10,824 5.42% 12,099 6.13% 11.78%
$150,000 -
$199,999 5,059 2.53% 3,027 1.53% -40.17%
$200,000 + 2,718 1.36% 2,908 1.47% 6.99%
Total 199,706 100% 197,393 100% -1.16%
Source: RMCM Internal Data, ESRI Business Solutions, October 19, 2012
Household
Income
Tennessee
Number of
Households-
2011
Tennessee
Percent of
Total
Households-
2011
Tennessee
Number of
Households-
2016
Tennessee
Percent of
Total
Households
2016
Percent
Change
$ 0 - $
14,999 405,463 15.98% 395,474 15.10% -2.46%
$ 15,000 - $
24,999 324,944 12.81% 262,845 10.03% -19.11%
$ 25,000 - $
34,999 304,644 12.01% 266,717 10.18% -12.45%
$ 35,000 - $
49,999 396,420 15.62% 384,191 14.67% -3.08%
$ 50,000 - $
74,999 470,939 18.56% 598,790 22.86% 27.15%
$ 75,000 - $
99,999 270,754 10.67% 325,163 12.41% 20.10%
$100,000 -
$149,999 200,348 7.90% 235,643 9.00% 17.62%
$150,000 -
$199,999 100,001 3.94% 78,995 3.02% -21.01%
$200,000 + 64,101 2.53% 71,505 2.73% 11.55%

54
Total 2,537,614 100% 2,619,323 100% 3.22%
Source: RMCM Internal Data, ESRI Business Solutions, October 19, 2012
Household
Income
U.S. Number
of
Households-
2011
U.S. Percent of
Total
Households-
2011
U.S. Number of
Households-
2016
U.S. Percent of
Total
Households
2016
Percent
Change
$ 0 - $
14,999 15,030,658 12.68% 14,593,581 12.03% -2.91%
$ 15,000 - $
24,999 13,016,406 10.98% 10,338,313 8.52% -20.57%
$ 25,000 - $
34,999 12,477,834 10.53% 10,148,856 8.37% -18.66%
$ 35,000 - $
49,999 17,014,425 14.36% 15,214,531 12.54% -10.58%
$ 50,000 - $
74,999 21,877,939 18.46% 24,945,487 20.56% 14.02%
$ 75,000 - $
99,999 14,298,288 12.06% 18,030,358 14.86% 26.10%
$100,000 -
$149,999 13,354,776 11.27% 16,051,881 13.23% 20.20%
$150,000 -
$199,999 6,523,650 5.50% 6,209,848 5.12% -4.81%
$200,000 + 4,917,827 4.15% 5,778,053 4.76% 17.49%
Total 118,511,803 100% 121,310,908 100% 2.36%
Source: RMCM Internal Data, ESRI Business Solutions, October 19, 2012

55
APPENDIX IV – COMMUNITY HEALTH ORGANIZATIONS IN MEMPHIS
Healthy
Memphis
Common Table
Help to improve the
quality of health care,
Fight obesity, empower
patients and caregivers,
reduce chronic diseases,
and reduce food deserts in
low income areas
Memphis
Area Memphis
6027 Walnut Grove
Plaza 2, Suite 215,
Memphis TN 38120
Memphis Health
Center
Primary/preventative care
medically and orally, On,
prenatal, immunizations,
pharmacy etc (20+
services)
Shelby
County and
Fayette
County, TN
Citizens of
Shelby and
Fayette County
360 East E H Crump
Boulevard
Memphis, TN 38126
Catholic Health
Charities of West
Tennessee
immigration services,
emergency services,
mobile food/clothes
pantry services, homeless
services
West
Tennessee
West
Tennessee
1325 Jefferson Avenue
Memphis, TN 38104
United Way of
the Mid-South Mid-South
Underserved,
uninsured,
underinsured
individuals in
need
6775 Lenox Center Court
Suite 200
Memphis, TN 38115
Aging
Commission of
the Mid-South
Adult day care, adult
sitter, caregiver
information, food
supplements, home
delivered meals, home
maker services, legal
assistance (15+ services)
Mid-South
Elderly and
aging (those
over 60 years
of age)
2670 Union Avenue
Extended
Memphis, TN 38112
Goodwill Homes
Community
Service
Nutrition services,
transportation services,
housing services,
educational services such
as head start, foster care
program (15+ services)
Memphis
Area
All residents in
Memphis
4590 Goodwill Road
Memphis, TN 38109
Porter-Leath
Residential services,
foster and adoptive care,
early childhood and parent
education, senior services
(10+ services)
Memphis
Area
Widows and
orphans in the
Memphis area
868 N. Manassas St.
Memphis, TN 38107
Assisi
Foundation of
Memphis
Health and human
services, education and
lifelong learning, social
justice and ethics, cultural
enrichment and the arts
Memphis
and the
Mid-South
N/A 515 Erin Drive
Memphis, TN 38117
American
Diabetes
Association
Advocacy, lobbying,
education, outreach,
funding
Global Global
5587 Murray Rd
Suite 105
Memphis, TN 38119

56
Memphis Area
Ryan White
Planning Council
Financial support for
individuals living with
HIV/AIDS for treatment
and care
Memphis
Area
Individuals
with HIV/AIDS
1075 Mullins Station Road
Room W-269
Memphis, TN 38134
Memphis Center
for Health
Equity, Research
and Promotion
Education and outreach Memphis
Area
Minorities in
Memphis
101 Wilder Tower
Memphis, TN 38152
Urban Child
Institute
Education, outreach and
research Memphis
Mothers and
children
between the
ages of 0-3
600 Jefferson Avenue
#200
Memphis, TN 38105
Homeless
Coalition Housing, financial support Tennessee
Homeless
individuals
2670 Union Ave. Extended,
Ste 818
Memphis, TN 38112
Meritan, Inc
Specialized foster care,
home health, activity
counseling, employment
programs
Memphis
Aging
population,
children facing
placement
issues
4700 Poplar Avenue,
Suite 400
Memphis, TN 38117
Educational Organizations
University of
Memphis School
of Public Health
Educational N/A N/A
University of Memphis
1010 Wilder Tower
Memphis, TN 38152
University of
Tennessee
Health Science
Center-Primary
Care
Department
Educational State of
Tennessee
Residents of
Tennessee
920 Madison Avenue
Memphis, TN 38103
University of
Memphis School
of Public Health-
Center for
Health Equity
and Research
Educational Mid-South Mid-south
University of Memphis
1010 Wilder Tower
Memphis, TN 38152
LeMoyne-Owen
College Educational Tennessee N/A
807 Walker Ave
Memphis TN 38126

57
APPENDIX V - KEY STAKEHOLDER INTERVIEWS SUMMARY AND THEMES
Key stakeholder interviews were conducted as part of the CHNA as a primary gathering tool. Per the IRS
Notice, RMCM took into account input from various individuals with special knowledge and/or expertise in
public health; persons representing agencies with data relevant to the healthcare needs of the community,
including assessment of the overall health status in the community, access to healthcare services, health
disparities and the healthcare needs of vulnerable and medically underserved populations, including
specifically the aged, those with chronic diseases such as diabetes, and faith-based organizations
representing the poor and other demographic groups.
RMCM officials identified 22 external stakeholders (of which 18 were interviewed) as a part of this process.
Interview participants were asked to share their perspectives and professional opinions on the following
topics:
Description of the overall health status of the community
Contributing factors to the community's health status
Gaps or unmet needs in health services available to the community
Barriers to accessing health services in the community
Obstacles that exist to overcoming the identified barriers to access
RMCM's role, programs or services provided to improve the community's health status
Strength of services provided by RMCM
Collaborative opportunities for improving the community's health status
New or expanded programs and services aimed at improving overall health status
Sixteen internal stakeholder interviews were conducted to validate the resources and current initiatives at
RMCM. The interviews conducted with internal stakeholders focused on the role, programs and services
provided by RMCM.
Below is the summary of external key stakeholder interview responses to the topics outlined above:
KEY STAKEHOLDER EXTERNAL INTERVIEW FINDINGS
Description of Community Health Status and Contributing Factors
The overwhelming majority of key stakeholder interview participants described the health status of the
RMCM community as poor. There were several reasons or factors given as contributors to this description,
with poverty and low economic status being the greatest contributors. Other contributing factors included:
High prevalence of chronic diseases (diabetes, hypertension, cardiovascular disease and HIV/AIDS)
High rates of obesity that contributes to the prevalence of chronic diseases
High rates of infant mortality due to late and/or lack of prenatal care; high teen pregnancy rate
Low educational attainment which contributes to high unemployment and underemployment
Lack of health insurance and funding to purchase health care services
Low literacy and health literacy impacting reading and comprehending discharge instructions
Lack of access to preventative care services
Other factors noted as contributing to poor community health status included:
Community/cultural behavior (going to physician not a priority)
Lack of access to nutritional foods and/or grocery stores - "food deserts"

58
Heavy provider focus on acute care, not primary care
High rate of violence in the community due to lack of mental health services and increased youth
violence
Increased number of undocumented residents without funding for care
Gaps and/or Unmet Needs The most frequently mentioned gap or unmet need in health services is primary care providers for the
uninsured and underinsured, which leads to high and inappropriate use of the emergency room. Other
commonly mentioned gaps and/or unmet needs noted included:
1. Transportation to health services providers for the uninsured
2. Mental health services, both hospital and community-based
3. Chronic disease management programs
4. Community-based wellness and preventative medicine programs
5. Nutritional/dietary education outreach programs targeted towards school-aged children
Additional gaps and/or unmet needs mentioned included:
6. Increased geriatric care services (only one geriatrician in the community)
8. Long term care facilities, specifically for ventilator patients
9. Dialysis providers that treat ventilator patients
10. Drug abuse rehabilitation providers who serve indigent patients
11. Dental providers for the uninsured
Barriers to Access Health Care Services
The most frequent barrier to accessing and/or obtaining health services noted by interview participants is the
lack of insurance and/or funding for purchasing health care services. Participants also described the
following barriers:
1. Lack of transportation, especially for the uninsured
2. Lack of a sufficient number of health services providers who will accept Medicaid (TennCare)
patients
3. Cultural constraints- generational attitudes regarding seeking physician access
4. Lack of coordination between providers to transition patients from one clinical setting to another
5. Lack of knowledge/understanding of how to navigate the health care delivery system
Opportunities for RMCM to Improve the Community's Health Status
The opportunity noted the most regarding opportunities for RMCM to improve the community's health
status is for increased primary care presence at the neighborhood level. Interviewees also mentioned the
following opportunities:
1. Expand outreach and education services
2. Enhance marketing regarding breadth and depth of services other than trauma, high risk OB and
burn
3. Consider providing mental health services
4. Lead initiatives/programs to improve health status at the neighborhood level
Other opportunities noted are:
5. Increased community collaboration with faith-based organizations
6. Extend hours at Health Loop clinics (after 5p.m. and weekends) to increase access for those with
non-traditional work hours

59
Opportunities for Overall Improvement of Community's Health Status The most frequently mentioned opportunity to improve the community's health status is increased
collaboration between health care providers, academia, businesses and the faith community. Other
opportunities noted include:
1. Increased communication between providers for continuity of patient care
2. Increased outreach and education regarding health maintenance (diet/exercise/wellness)
3. Develop strategies to increase access to healthier food choices in economically challenged
neighborhoods