Regional Information for Shared Excellence (RISE) Initiative · PidtR lldf ti lPresident Reagan...
38
Regional Information for Shared Excellence (RISE) Initiative Dashboard Overview Webinar Jerry Lassa, MS Statistics May 15 & May 17, 2012
Transcript of Regional Information for Shared Excellence (RISE) Initiative · PidtR lldf ti lPresident Reagan...

Regional Information for Shared Excellence (RISE) Initiative
Dashboard Overview Webinar
Jerry Lassa, MS Statistics
May 15 & May 17, 2012

Do You Ever…
• Spend a lot of time reviewing data trying to make sense out of it?• Wonder how you did last month, last quarter or last year as a reference
point?• Wonder how well you’re doing compared to your colleagues, y g p y g ,
competitors, the state or the country?• See a change in data from one month to the next and wonder whether
you should take action or not?you should take action or not?• Make a decision based on gut instinct or prior experience because you
don’t have data to support the decision?• See a relationship between clinical care and operational functioning of
your clinic but can’t quantify it?• Feel knowledgeable about performance data in your organization but g p y g
others don’t?• Wonder whether the priorities you have set should really be priorities?
CALIFORNIA HEALTHCARE FOUNDATIONwww.chcf.org

Agendag
RISE Background 1Baldrige Performance Excellence Framework2Dashboard Reporting & Use: Best Practices3Data Validation Basics
Beginner Dashboard Design
45 Beginner Dashboard Design5
CALIFORNIA HEALTHCARE FOUNDATIONwww.chcf.org

Big Changes in the Industryg g y
Vendor selection- Vendor selection - Workflow redesign - Hardware/software
N t k- Network- Training- Implementation
- Data-driven culture- Performance measures- Link to EHR fields
EHRCha
nge - Optimization - System use, data integrity
- Reports, dashboards- TrainingEHR
Implement Data Management
C Training- Optimization
Management& Analytics
TiCALIFORNIA HEALTHCARE FOUNDATION
www.chcf.org
Time
4

Then and NowThen and Now
Then:
Physician DOS Patient ID Avg A1c BP LDL Foot ExamSmith 4/12/2011 2949983 6 YES YES YESSmith 4/12/2011 9851498 4 YES YES NOSmith 4/10/2011 3134878 10 YES YES YES
Now:
Smith 4/10/2011 3134878 10 YES YES YESSmith 4/12/2011 8866369 6 NO NO YESSmith 4/12/2011 2007528 7 YES YES NOSmith 4/13/2011 9070925 6 YES YES NOSmith 4/13/2011 1438507 8 YES YES NOSmith 4/13/2011 4871361 8 YES YES YESSmith 4/10/2011 8549370 7 YES NO NOSmith 4/10/2011 2458352 4 YES YES YESJackson 4/13/2011 6187972 4 YES YES YESJackson 4/13/2011 305191 6 YES YES YESJackson 4/13/2011 554553 7 YES YES NOJackson 4/13/2011 554553 7 YES YES NOJackson 4/12/2011 4968186 5 YES YES YESJackson 4/12/2011 7947836 10 YES NO YESJackson 4/12/2011 8331051 10 YES YES NOJackson 4/13/2011 1320313 6 YES YES YESJackson 4/13/2011 7647899 6 YES YES NOJackson 4/10/2011 7724504 8 YES NO NOJackson 4/10/2011 5041785 7 YES YES YES
CALIFORNIA HEALTHCARE FOUNDATIONwww.chcf.org
5

Is Your Organization Ready f th T i f D t ?for the Tsunami of Data?
CALIFORNIA HEALTHCARE FOUNDATIONwww.chcf.org

RISE InitiativeBackground
Over the past decade, clinics have worked to enhance qualityOver the past decade, clinics have worked to enhance quality improvement efforts, transform culture, information systems, and care delivery Significant work in tracking and reporting key performance measures toSignificant work in tracking and reporting key performance measures to assess the quality of patient careSeveral statewide projects have supported this work
AQICC Tools for Quality other regional effortsAQICC, Tools for Quality, other regional effortsResults: definition of standardized clinical and operational measures, enhancement of quality improvement processes and implementation of HIT, including registries, to collect and report on quality dataincluding registries, to collect and report on quality data
RISE Initiative:Runs October 2011 to December 2012Continued data collection reporting and use work with a focus on DataContinued data collection, reporting and use work with a focus on Data Sharing Communities and accelerating improvement of clinical and operational performance by supporting data-driven management Added emphasis on enhancing the patient experience
CALIFORNIA HEALTHCARE FOUNDATIONwww.chcf.org
p g p p

RISE InitiativeProject Description
Data Sharing Communities (DSCs):Data Sharing Communities (DSCs):
Super Region Data Sharing Communities
North North Coast Clinic Network (Super Region Lead)Alliance for Rural Community HealthHealth Alliance of Northern California
Bay Area Redwood Community Health Coalition (Super Region Lead)y y ( p g )Community Health Center NetworkCommunity Health PartnershipSan Francisco Community Clinic Consortium
Central Valley Central Valley Health Network (Super Region Lead)DSCs organized by measure
South Community Clinics Health Network (Super Region Lead)Coalition of Orange County Community ClinicsCommunity Clinic Association of Los Angeles County
CALIFORNIA HEALTHCARE FOUNDATIONwww.chcf.org

RISE InitiativeProject Description cont.
1. Regional Learning Communities1. Regional Learning CommunitiesData analytics, including data validation, analysis, reporting and sharing data with providers through the use of dashboardsEnhancing the patient experienceg p pTeam approaches to care deliveryPatient panel managementStaff engagement/culture changeStaff engagement/culture changePatient self-management supportHealth coachingOperational changes to increase accessOperational changes to increase access
2. Data AnalyticsThe collection, review, and reporting of key metrics across project participants Quarterly sharing of data and using it to improve patient careparticipants. Quarterly sharing of data and using it to improve patient care with reporting to CHCF every six months Measures sets contain three to six measures with at least one measure in each of the clinical, operational and patient experience measure domains
CALIFORNIA HEALTHCARE FOUNDATIONwww.chcf.org
p p p

RISE InitiativeProject Description cont.
3. Dashboard Use3. Dashboard UseEach DSC will use a standardized dashboard in various forums to display data, and facilitate discussionsA standardized dashboard template is available but each DSC and Super p pRegion has the flexibility to customize the dashboard to suit their needs (e.g., different measure sets, display of blinded and unblinded data, variety of audiences) Need to ensure the dashboard is populated appropriately and accurately, and disseminated to various audiences in an effective and meaningful way
4. Plan for Improved OutcomesEach community or region has committed to improvement on at least one measure in the first year, and at least two measures in the second year of the grant
CALIFORNIA HEALTHCARE FOUNDATIONwww.chcf.org

RISE MeasuresClinical Measure Meaningful
useUDS North Super Region Bay Area Super Region Central
Valley SRSouth SR
ARCH HANC NCCN CHCN CHP RCHC SFCCCARCH HANC NCCN CHCN CHP RCHC SFCCCHypertension: BP Measurement
CORE T7 (control of HTN) ✔
Tobacco Use Assess & Tobacco Cessation Interv.
CORE Table 6B✔ ✔
Adult Weight Screening & Follow‐Up
CORE Table 6B✔
Childhood Immunization Status
Alternate CORE
Table 6B✔
Diabetes: Hemoglobin A1c Additional Table 7Diabetes: Hemoglobin A1c Poor Control
Additional Set
Table 7✔ ✔ ✔ ✔ ✔ ✔
Diabetes: Low Density Lipoprotein (LDL) Management and Control
Additional Set
Table 7✔ ✔ ✔
Controlling High Blood Pressure
Additional Set
Health Out/ Disparity ✔ ✔ ✔ ✔
Cervical Cancer Screening Additional Set
Table 6B✔ ✔
Percent of patients without a✔
Percent of patients without a PCP visit in last 12 months ✔
+ Operational: Third Next Available Appointment (TNAA), % No-Show Rate+ Patient Experience: TBD (RISE year two focus)
CALIFORNIA HEALTHCARE FOUNDATIONwww.chcf.org
+ Patient Experience: TBD (RISE year two focus)

RISE Linked with BSCF CCAP Initiative(Blue Shield California Foundation(Blue Shield California Foundation
California Comparative Analytics Project)
• Purpose:Purpose: • Support adaptation of i2i's PoplQ software to serve the data
collection and analytic needs of community clinics and other safety net providers who use BSCF’s self-assessment toolnet providers who use BSCF s self-assessment tool
• The adapted software will help community clinics and other safety net providers collect, compare, and share data related to clinical quality financial operational and patient experiencequality, financial, operational, and patient experienceperformance indicators generated by the tool.
• Finance measure focus: • Operating margin or net margin, Days cash on hand, Current ratio,
Revenue mix, Average cost of clinic visit, Average cost of clinic visit by payer, Net revenue or loss by payer or Net operating margin by payer, Collections ratio, by payer, Benefits as % of total salary or wages, Claims quality
CALIFORNIA HEALTHCARE FOUNDATIONwww.chcf.org

Importance of Smart Data Display p p y
Good
44% (Medicaid National Best)
51% (Commercial National Best)
35% (Medicaid National Average)
What’s the measure?What’s the measure? Time period? Which direction is good? Benchmark? Goal?
Is performance level a priority? If so, what do we do? Who’s responsible? What resources are allocated? Who and how to hold accountable for improvement?
CALIFORNIA HEALTHCARE FOUNDATIONwww.chcf.org

Importance of Balanced Measuresp
Measures from multiple “domains” (e.g., clinical, operational, financial)
CALIFORNIA HEALTHCARE FOUNDATIONwww.chcf.org
tell a much richer story than a single measure and better inform decisions.

So many more measures to manage…need to have efficient reportingneed to have efficient reporting
1. HTN blood pressure2. Tobacco use, cessation
24. Oncology breast cancer: hormone therapy25. Oncology colon cancer: chemo for stage III
All Clinical Measures:
3. Weight screening4. Flu vax for older adult5. Diabetes: HbA1c poor control6. Diabetes: LDL mgmt and control7 Diabetes: BP mgmt
26. Prostate cancer: avoidance of overuse of bone scan27. Smoking and tobacco cessation, medical assistance28. Diabetes: eye exam29. Diabetes: urine screening30 Diabetes: foot exam7. Diabetes: BP mgmt
8. HF: ACE/ARB for LVSD9. CAD: beta-blocker for prior MI10. Pneumo vax for older adult11. Breast cancer screening
30. Diabetes: foot exam31. CAD: drug therapy for lowering LDL32. HF: warfarin therapy for atrial fib33. IVD: BP mgmt34. IVD: use of aspirin or other antithrombotic
12. Colorectal cancer screening13. CAD: oral antiplatelet therapy14. HF: beta-blocker for LVSD15. Anti-depressant med mgmt16 POAG: optic nerve eval
35. Initiation and engagement of alcohol and other drug dependence tx
36. Prenatal care: screening for HIV37. Prenatal care: anti-D immune globulin38. Controlling high BP16. POAG: optic nerve eval
17. Diabetic Retinopathy: docum of macular edema18. Diabetic Retinopathy: communication with physician
managing diabetic care19. Asthma pharmacologic therapy20 A h
g g39. Cervical cancer screening40. Chlamydia screening for women41. Use of appropriate meds for asthma42. Low back pain: use of imaging studies43 IVD l li id l d LDL l20. Asthma assessment
21. Appropriate testing for children with pharyngitis43. IVD: complete lipid panel and LDL control44. Diabetes: HbA1c control (<8.0%)
+ Operational Measures + Finance Measures
CALIFORNIA HEALTHCARE FOUNDATIONwww.chcf.org
+ Operational Measures + Finance Measures

So Are You Ready? y
CALIFORNIA HEALTHCARE FOUNDATIONwww.chcf.org

Baldrige Can Helpg p
CALIFORNIA HEALTHCARE FOUNDATIONwww.chcf.org
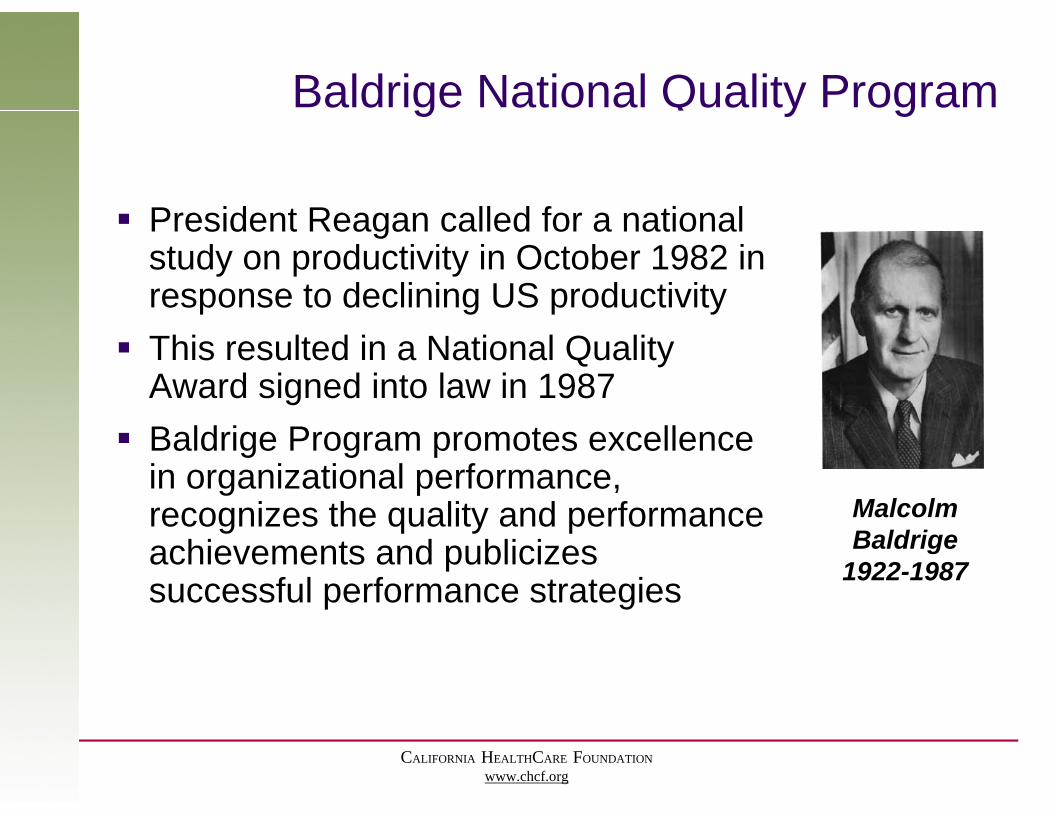
Baldrige National Quality Programg y g
P id t R ll d f ti lPresident Reagan called for a national study on productivity in October 1982 in response to declining US productivityp g p yThis resulted in a National Quality Award signed into law in 1987Baldrige Program promotes excellence in organizational performance,
i th lit d f Malcolmrecognizes the quality and performance achievements and publicizes successful performance strategies
Malcolm Baldrige
1922-1987 p g
CALIFORNIA HEALTHCARE FOUNDATIONwww.chcf.org

Baldrige National Quality Framework
H f t
How your key strategic objectives address your strategic challenges. How you ensure strategic and operational plans are achievable and adequately scoped. How you develop and deploy action plans throughout the organization to
H i How you foster an employee culture conducive to high performance. How
d
p y p g gachieve objectives.How your senior
leaders communicate with and engage th ti you manage and
develop your staff to utilize their full potential.
the entire workforce and encourage frank, two-way
i ticommunication throughout the organization Measurable
results you achievedachieved.
H
How you “Listen and Learn” from your key stakeholders How you manage
and improve your organizations’ key processes.
stakeholders including Customers, Community, Partners and
CALIFORNIA HEALTHCARE FOUNDATIONwww.chcf.org
How you turn data into information in your organization. How you use that information to improve performance.
Partners, and Payers.

Random Organizational Activityg y
CALIFORNIA HEALTHCARE FOUNDATIONwww.chcf.org

Activity vs. Organizational Directiony g
CALIFORNIA HEALTHCARE FOUNDATIONwww.chcf.org

Improving Random Activityp g y
CALIFORNIA HEALTHCARE FOUNDATIONwww.chcf.org

Aligned Organizational Activity & Direction
CALIFORNIA HEALTHCARE FOUNDATIONwww.chcf.org

How It All Fits Togetherg
CALIFORNIA HEALTHCARE FOUNDATIONwww.chcf.org
ASQ, 2004

Example Plan
Strategy Objective MeasurableStrategy“Pillars”
ObjectiveStatements
MeasurableIndicators
CALIFORNIA HEALTHCARE FOUNDATIONwww.chcf.org

Create a strategy that fits your organization—Don’t piece one togetherDon t piece one together
Accountable CareAccountable CareOrganization Organization
Meaningful Use Patient Centered Medical Home
CALIFORNIA HEALTHCARE FOUNDATIONwww.chcf.org

Baldrige as a Guide for Dashboard Designg g
• Provides balanced model for organization performance
• Used heavily in health sector • Since 2005, > 50% of Baldrige award applicants are health
carecare
• Provides context for data management• Measures should “align” with the industry• Measures should align with the industry
• e.g., NQF or P4P at local, state, national
• Dashboard measures should “align” with organization t tstrategy
• Dashboard measures should be “balanced”• e.g., clinical, operational, financial, patient experience measures
CALIFORNIA HEALTHCARE FOUNDATIONwww.chcf.org
g , , p , , p p

Dashboard Reportingp gBest Practices
Dashboard FormatsTrend/time charts with internal goals and external benchmarks or normsStoplights (red, yellow, green coloring to indicate measure status)Stoplights (red, yellow, green coloring to indicate measure status)
Dashboard DeploymentUse to track strategy and annual plan executionUse same dashboard format
HorizontalAcross sites, divisions, departments/specialties, , p pUse similar measures as relevant (e.g., TNAA applies to all clinical departments)
VerticalVerticalBOD, senior leadership, management, staffMeasures should “roll up” with selected “core” strategic
t t
CALIFORNIA HEALTHCARE FOUNDATIONwww.chcf.org
measures at top

Basic Dashboard Format
CALIFORNIA HEALTHCARE FOUNDATIONwww.chcf.org

Stoplight Dashboard for Individual Providerg
CALIFORNIA HEALTHCARE FOUNDATIONwww.chcf.org

Review of Dashboards in Meetingsg
Best PracticesReview dashboard results
R i iRecognize improvementsScan trends across all measures, look for potential issuesDiscuss and prioritize opportunities p pp
Develop a plan to address; establish goals for improvementAssign responsibility Allocate appropriate resources to achieve goal
CALIFORNIA HEALTHCARE FOUNDATIONwww.chcf.org

Accountability for Resultsy
A bl S i d O i Pl i h i• A measurable Strategic and Operating Plan is the main reference point for accountability in outcomes achievement
• Need alignment of goals between governance leadershipNeed alignment of goals between governance, leadership, management, and staff
• Assign responsibility for specific strategy objectives and goals to appropriate governance and management committees (e.g., clinical quality, finance, IT)
• Incorporate performance goals and incentives into board• Incorporate performance goals and incentives into board, leadership, and staff performance management plans and reviews; incorporate goals into provider contracts
CALIFORNIA HEALTHCARE FOUNDATIONwww.chcf.org

Public Accountability and Transparencyy p y“The good will earned by accountable and transparent nonprofits is
one of, if not the most important, of its assets.”p--National Council of Non-Profits
Health reform throughHealth reform, throughAccountable Care Organizations,will make accountability andwill make accountability and transparency a business imperative for communityhealth centershealth centers
CALIFORNIA HEALTHCARE FOUNDATIONwww.chcf.org

Data Validation BasicsUnderstand the measures (you and everyone else)
Numerator, denominator, exclusion criteriaHistorical data requirements for selected measures
Sample (paper charts) vs. Population data (EHR) Sample data requirementsSample data requirements
Ensure representative and random samplingEnsure appropriate sample size for achieving desired margin of errorUDS requirements: n=70UDS requirements: n=70
Population data requirementsAppropriate use of EHR queries and report writers when selecting data
follow inclusion/exclusion criteria in measure definitionsEnsure data are accurate and reliable
Run frequency tables to cross validate patient totals and system use Identify clinical content, screen flow issues to inform EHR optimization roadmapEnsure reliability of interfaces (e.g., lab, pharmacy)Address leadership/management issues (e.g., compliance with using EHR)
CALIFORNIA HEALTHCARE FOUNDATIONwww.chcf.org

Examples of System Use Measures
These types of ypmeasures help you monitor data validation issuesvalidation issues
CALIFORNIA HEALTHCARE FOUNDATIONwww.chcf.org

Beginner Dashboard Designg gExcel basics
Worksheet tabs and optimal use of the “real estate”Appropriate use of columns and rows with data for chartsCommon commands: formulas, cell formatting
Excel graphsExcel graphsRationale: Visual presentation of data improves user ability to interpretApproach: Various types of charts; use column or line charts with time across x axisx-axisApplication: Creating a column chart with a goal lines; formatting title and axis labels, column series color, data labels, y-axis
Dashboard report formattingRationale: Create an efficient layout of graphs for effective use in sharing data in various forums Approach: Alignment with organization strategy, use of internal goals and external benchmarksApplication: Arranging multiple graphs on a single page; formatting page setup including margins header/footer fitting to one page
CALIFORNIA HEALTHCARE FOUNDATIONwww.chcf.org
including margins, header/footer, fitting to one page

Be Sexy with Data
“I k i th t th j b i th t 10“I keep saying that the sexy job in the next 10 years will be statisticians,” said Hal Varian, chief economist at Google “And I’m not kidding ”economist at Google. And I m not kidding.
CALIFORNIA HEALTHCARE FOUNDATIONwww.chcf.org