REGIONAL HOUSING NEEDS ALLOCATION February 2021 DRAFT ...
111
REGIONAL HOUSING NEEDS ALLOCATION DRAFT METHODOLOGY: San Francisco Bay Area, 2023-2031 February 2021 © Bruce Damonte courtesy MidPen Housing. All rights reserved.
Transcript of REGIONAL HOUSING NEEDS ALLOCATION February 2021 DRAFT ...
REGIONAL HOUSING NEEDS ALLOCATION DRAFT METHODOLOGY:San Francisco Bay Area, 2023-2031
February 2021
© Bruce Damonte courtesy MidPen Housing. All rights reserved.
ABAG REGIONAL HOUSING NEEDS ALLOCATION DRAFT METHODOLOGY: SAN FRANCISCO BAY AREA, 2023-2031II
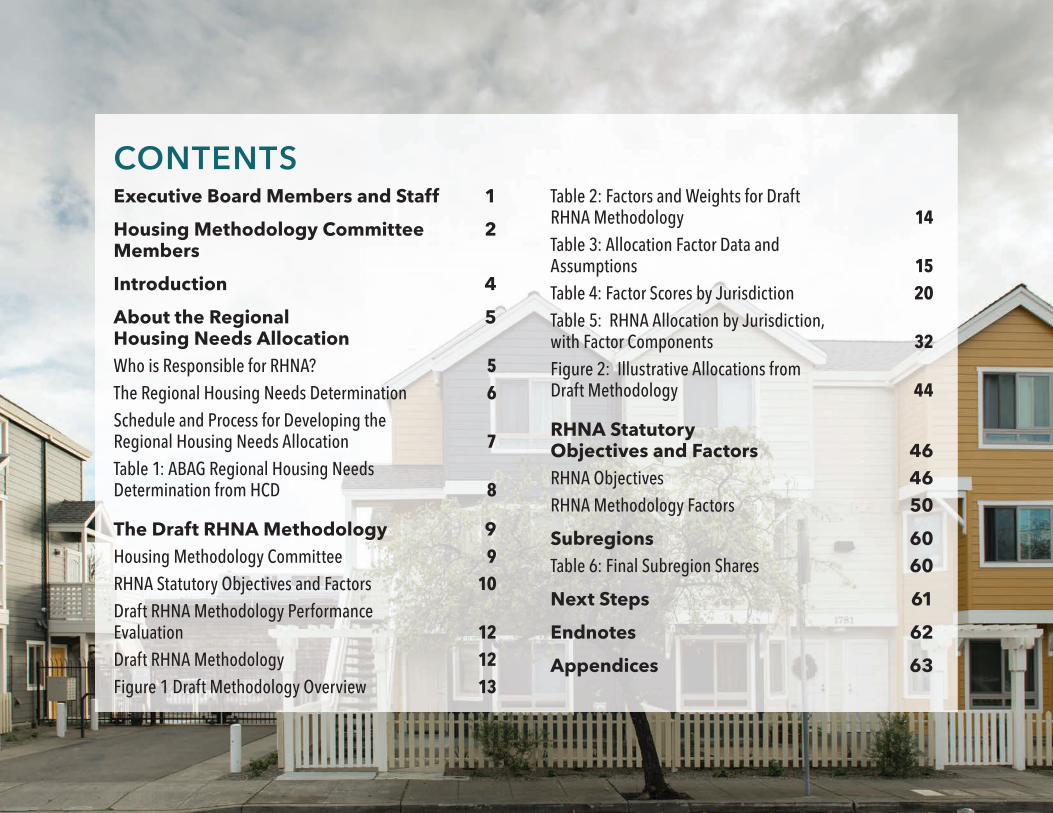
CONTENTSExecutive Board Members and Staff 1
Housing Methodology Committee 2Members
Introduction 4
About the Regional 5Housing Needs AllocationWho is Responsible for RHNA? 5The Regional Housing Needs Determination 6 Schedule and Process for Developing the Regional Housing Needs Allocation 7Table 1: ABAG Regional Housing Needs Determination from HCD 8
The Draft RHNA Methodology 9Housing Methodology Committee 9RHNA Statutory Objectives and Factors 10Draft RHNA Methodology Performance Evaluation 12Draft RHNA Methodology 12Figure 1 Draft Methodology Overview 13
Table 2: Factors and Weights for Draft RHNA Methodology 14Table 3: Allocation Factor Data and Assumptions 15Table 4: Factor Scores by Jurisdiction 20Table 5: RHNA Allocation by Jurisdiction, with Factor Components 32Figure 2: Illustrative Allocations from Draft Methodology 44
RHNA Statutory Objectives and Factors 46RHNA Objectives 46RHNA Methodology Factors 50
Subregions 60Table 6: Final Subregion Shares 60
Next Steps 61
Endnotes 62
Appendices 63
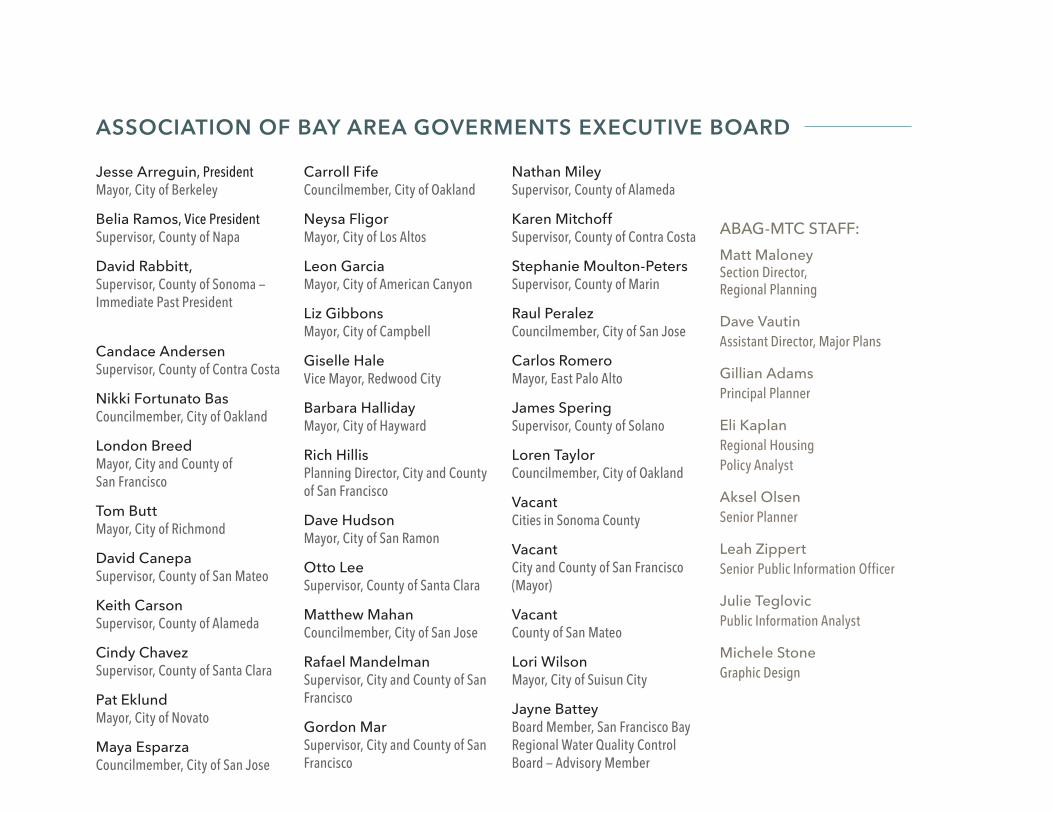
ASSOCIATION OF BAY AREA GOVERMENTS EXECUTIVE BOARD
Jesse Arreguin, PresidentMayor, City of Berkeley
Belia Ramos, Vice PresidentSupervisor, County of Napa
David Rabbitt, Supervisor, County of Sonoma —Immediate Past President
Candace AndersenSupervisor, County of Contra Costa
Nikki Fortunato BasCouncilmember, City of Oakland
London BreedMayor, City and County of San Francisco
Tom ButtMayor, City of Richmond
David CanepaSupervisor, County of San Mateo
Keith CarsonSupervisor, County of Alameda
Cindy ChavezSupervisor, County of Santa Clara
Pat EklundMayor, City of Novato
Maya EsparzaCouncilmember, City of San Jose
Carroll FifeCouncilmember, City of Oakland
Neysa FligorMayor, City of Los Altos
Leon GarciaMayor, City of American Canyon
Liz GibbonsMayor, City of Campbell
Giselle HaleVice Mayor, Redwood City
Barbara HallidayMayor, City of Hayward
Rich HillisPlanning Director, City and County of San Francisco
Dave HudsonMayor, City of San Ramon
Otto LeeSupervisor, County of Santa Clara
Matthew MahanCouncilmember, City of San Jose
Rafael MandelmanSupervisor, City and County of San Francisco
Gordon MarSupervisor, City and County of San Francisco
Nathan MileySupervisor, County of Alameda
Karen MitchoffSupervisor, County of Contra Costa
Stephanie Moulton-PetersSupervisor, County of Marin
Raul PeralezCouncilmember, City of San Jose
Carlos RomeroMayor, East Palo Alto
James SperingSupervisor, County of Solano
Loren TaylorCouncilmember, City of Oakland
VacantCities in Sonoma County
VacantCity and County of San Francisco (Mayor)
VacantCounty of San Mateo
Lori WilsonMayor, City of Suisun City
Jayne BatteyBoard Member, San Francisco Bay Regional Water Quality Control Board — Advisory Member
ABAG-MTC STAFF:Matt Maloney Section Director, Regional Planning
Dave Vautin Assistant Director, Major Plans
Gillian Adams Principal Planner
Eli Kaplan Regional Housing Policy Analyst
Aksel Olsen Senior Planner
Leah Zippert Senior Public Information Officer
Julie Teglovic Public Information Analyst
Michele Stone Graphic Design

ABAG REGIONAL HOUSING NEEDS ALLOCATION DRAFT METHODOLOGY: SAN FRANCISCO BAY AREA, 2023-20312
HOUSING METHODOLOGY COMMITTEE
LOCAL JURISDICTION ELECTED OFFICIALS*Jesse Arreguín, ChairMayor, City of Berkeley, Alameda County
Julie PierceMayor, City of Clayton, Contra Costa County
Pat EklundCouncilmember, City of Novato, Marin County
Diane DillonSupervisor, County of Napa
Rick BonillaCouncilmember, City of San Mateo, San Mateo County
Neysa FligorCouncilmember, City of Los Altos, Santa Clara County
Monica BrownSupervisor, Solano County
John VasquezSupervisor, Solano County (Alternate)
Susan AdamsCouncilmember, City of Rohnert Park, Sonoma County
LOCAL JURISDICTION STAFFAlameda CountyEllen ClarkPlanning Manager, City of Pleasanton
Darin RanellettiPolicy Director for Housing Security, City of Oakland
Contra Costa CountyForrest EbbsCommunity Development Director, City of Antioch
Mindy GentryPlanning Manager, City of Concord
Andrea OuseCommunity Development Director, City of Concord (Alternate)
Marin CountyElise SemonianPlanning Director, Town of San Anselmo
Ethan GuyPrincipal Analyst, City of San Rafael (Alternate)
Napa County Vin SmithCommunity Development Director, City of Napa
San Francisco CountyPaolo Ikezoe‡
Senior Planner, City and County of San Francisco
James Pappas‡
Senior Planner, City and County of San Francisco
San Mateo County Josh Abrams+
Baird + Driskell Community Planning, Staff to 21 Elements
Nell Selander+
Deputy Director, Economic & Community Development, City of South San Francisco
Santa Clara CountyMichael BrilliotDeputy Director for Citywide Planning, City of San Jose
Aarti ShrivastavaAssistant City Manager/Community Development Director, City of Mountain View
Jennifer CarmanDevelopment Services Director, City of Morgan Hill (Alternate)
Andrew CrabtreeCommunity Development Director, City of Santa Clara (Alternate)
Solano County Matt WalshPrincipal Planner, Solano County
David FeinsteinPrincipal Planner, City of Fairfield (Alternate)
Sonoma County Jane RileyComprehensive Planning Manager, Sonoma County
Milan NevajdaDeputy Planning Director, Sonoma County (Alternate)
Noah HoushCommunity Development Director, City of Cotati (Alternate)
REGIONAL STAKEHOLDERSSocial Equity Victoria FierceCalifornia Renter Legal Advocacy and Education Fund (CaRLA)
Jeffrey LevinEast Bay Housing Organizations (EBHO)
Fernando MartiCouncil of Community Housing Organizations
* The City and County of San Francisco did not appoint an elected official representative
+ Both served on HMC, Selander replaced Abrams‡ Both served on HMC, Pappas replaced Ikezoe
HMC ROSTER RHNA 3
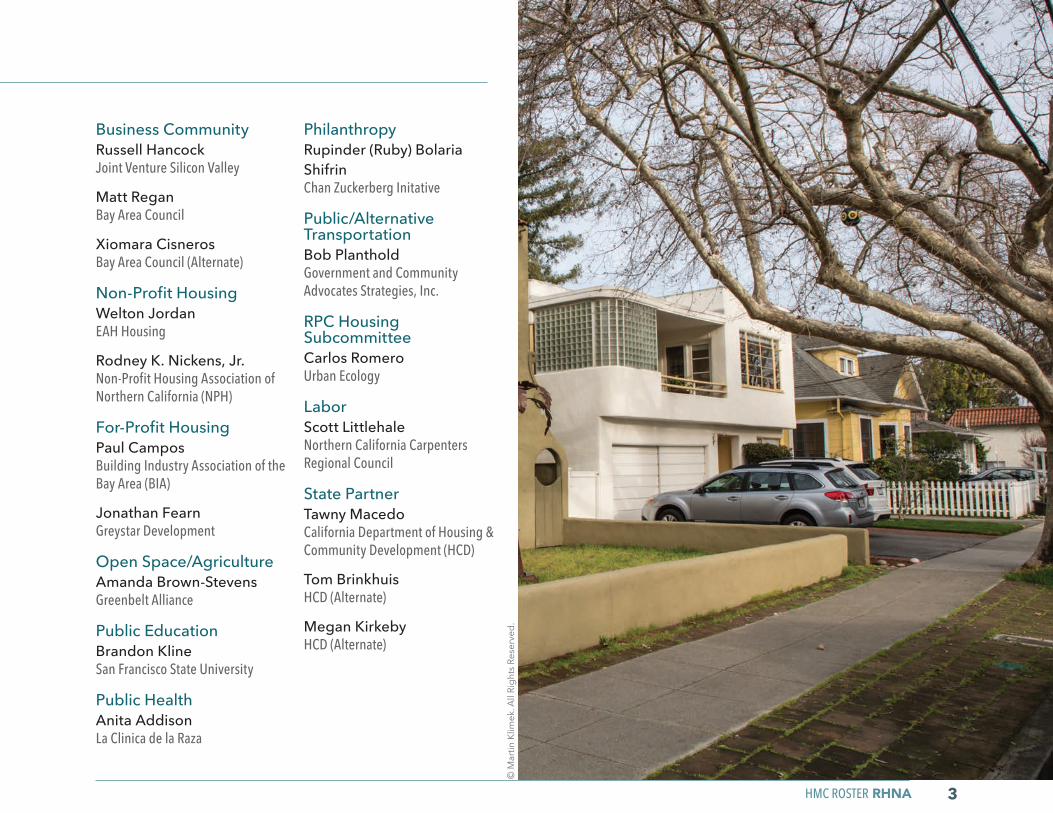
Business CommunityRussell HancockJoint Venture Silicon Valley
Matt ReganBay Area Council
Xiomara CisnerosBay Area Council (Alternate)
Non-Profit HousingWelton JordanEAH Housing
Rodney K. Nickens, Jr.Non-Profit Housing Association of Northern California (NPH)
For-Profit HousingPaul CamposBuilding Industry Association of the Bay Area (BIA)
Jonathan FearnGreystar Development
Open Space/AgricultureAmanda Brown-StevensGreenbelt Alliance
Public EducationBrandon KlineSan Francisco State University
Public Health Anita AddisonLa Clinica de la Raza
PhilanthropyRupinder (Ruby) Bolaria ShifrinChan Zuckerberg Initative
Public/Alternative TransportationBob PlantholdGovernment and Community Advocates Strategies, Inc.
RPC Housing SubcommitteeCarlos RomeroUrban Ecology
LaborScott LittlehaleNorthern California Carpenters Regional Council
State Partner Tawny MacedoCalifornia Department of Housing & Community Development (HCD)
Tom BrinkhuisHCD (Alternate)
Megan KirkebyHCD (Alternate)
© M
artin
Klim
ek. A
ll Ri
ghts
Res
erve
d.
ABAG REGIONAL HOUSING NEEDS ALLOCATION DRAFT METHODOLOGY: SAN FRANCISCO BAY AREA, 2023-20314
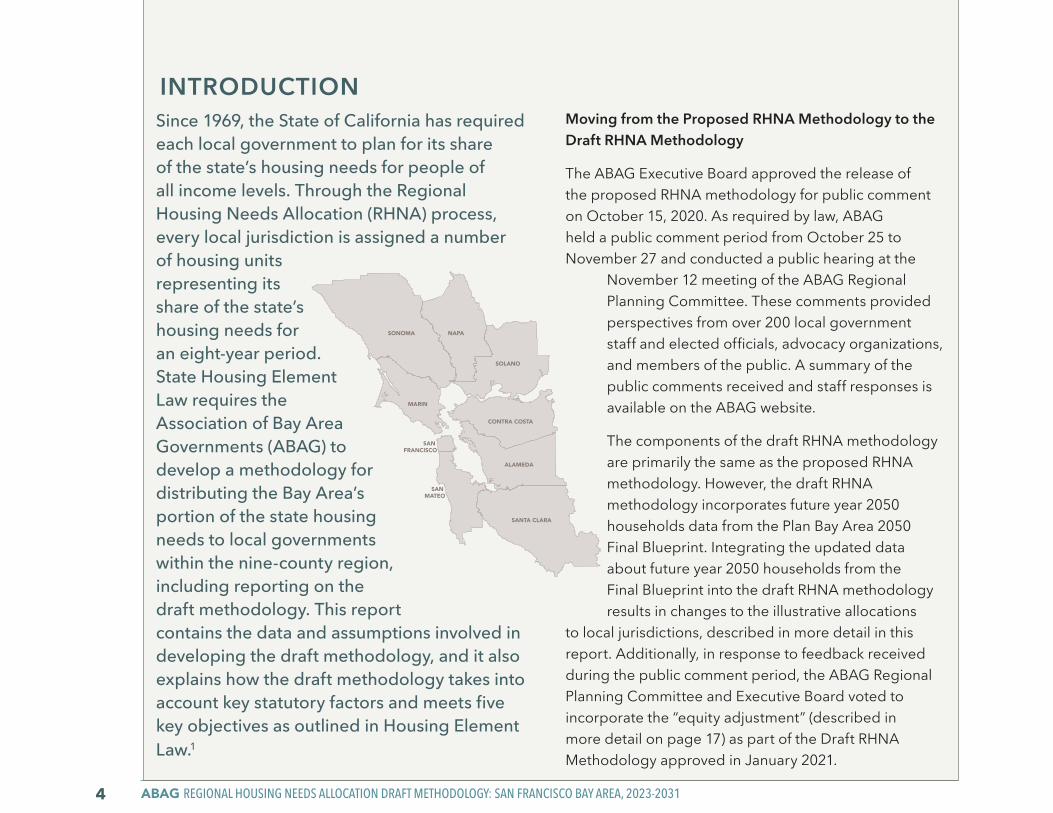
INTRODUCTIONSince 1969, the State of California has required each local government to plan for its share of the state’s housing needs for people of all income levels. Through the Regional Housing Needs Allocation (RHNA) process, every local jurisdiction is assigned a number of housing units representing its share of the state’s housing needs for an eight-year period. State Housing Element Law requires the Association of Bay Area Governments (ABAG) to develop a methodology for distributing the Bay Area’s portion of the state housing needs to local governments within the nine-county region, including reporting on the draft methodology. This report contains the data and assumptions involved in developing the draft methodology, and it also explains how the draft methodology takes into account key statutory factors and meets five key objectives as outlined in Housing Element Law.1
Moving from the Proposed RHNA Methodology to the Draft RHNA Methodology
The ABAG Executive Board approved the release of the proposed RHNA methodology for public comment on October 15, 2020. As required by law, ABAG held a public comment period from October 25 to November 27 and conducted a public hearing at the
November 12 meeting of the ABAG Regional Planning Committee. These comments provided perspectives from over 200 local government staff and elected officials, advocacy organizations, and members of the public. A summary of the public comments received and staff responses is available on the ABAG website.
The components of the draft RHNA methodology are primarily the same as the proposed RHNA methodology. However, the draft RHNA methodology incorporates future year 2050 households data from the Plan Bay Area 2050 Final Blueprint. Integrating the updated data about future year 2050 households from the Final Blueprint into the draft RHNA methodology results in changes to the illustrative allocations
to local jurisdictions, described in more detail in this report. Additionally, in response to feedback received during the public comment period, the ABAG Regional Planning Committee and Executive Board voted to incorporate the “equity adjustment” (described in more detail on page 17) as part of the Draft RHNA Methodology approved in January 2021.
MARIN
SONOMA NAPA
SOLANO
CONTRA COSTA
ALAMEDA
SAN MATEO
SAN FRANCISCO
SANTA CLARA
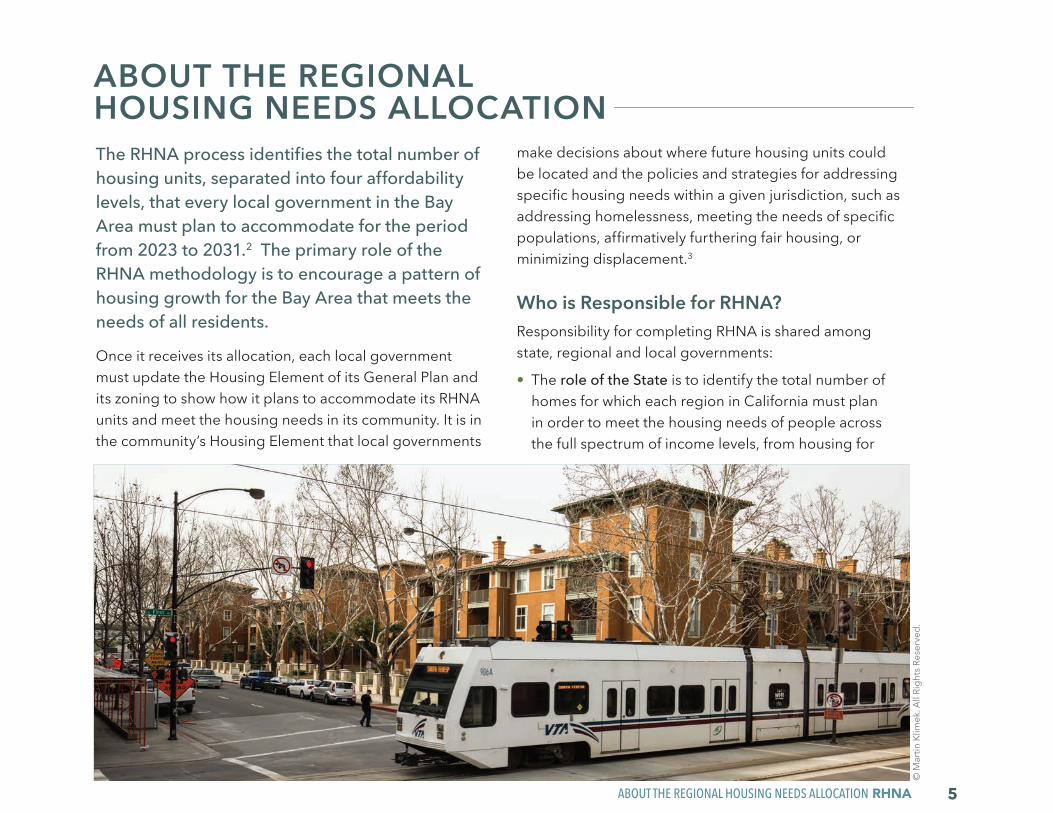
The RHNA process identifies the total number of housing units, separated into four affordability levels, that every local government in the Bay Area must plan to accommodate for the period from 2023 to 2031.2 The primary role of the RHNA methodology is to encourage a pattern of housing growth for the Bay Area that meets the needs of all residents.
Once it receives its allocation, each local government must update the Housing Element of its General Plan and its zoning to show how it plans to accommodate its RHNA units and meet the housing needs in its community. It is in the community’s Housing Element that local governments
make decisions about where future housing units could be located and the policies and strategies for addressing specific housing needs within a given jurisdiction, such as addressing homelessness, meeting the needs of specific populations, affirmatively furthering fair housing, or minimizing displacement.3
Who is Responsible for RHNA?Responsibility for completing RHNA is shared among state, regional and local governments:
• The role of the State is to identify the total number of homes for which each region in California must plan in order to meet the housing needs of people across the full spectrum of income levels, from housing for
ABOUT THE REGIONAL HOUSING NEEDS ALLOCATION RHNA 5
ABOUT THE REGIONAL HOUSING NEEDS ALLOCATION
© M
artin
Klim
ek. A
ll Ri
ghts
Res
erve
d.
ABAG REGIONAL HOUSING NEEDS ALLOCATION DRAFT METHODOLOGY: SAN FRANCISCO BAY AREA, 2023-20316
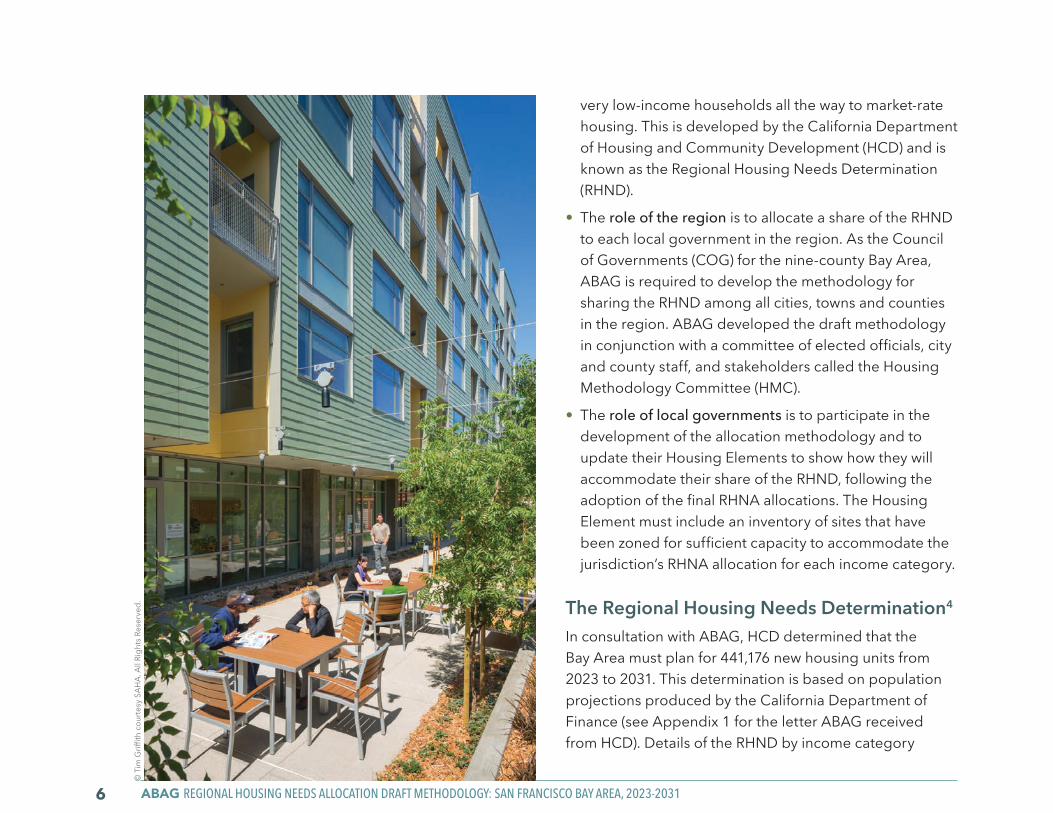
very low-income households all the way to market-rate housing. This is developed by the California Department of Housing and Community Development (HCD) and is known as the Regional Housing Needs Determination (RHND).
• The role of the region is to allocate a share of the RHND to each local government in the region. As the Council of Governments (COG) for the nine-county Bay Area, ABAG is required to develop the methodology for sharing the RHND among all cities, towns and counties in the region. ABAG developed the draft methodology in conjunction with a committee of elected officials, city and county staff, and stakeholders called the Housing Methodology Committee (HMC).
• The role of local governments is to participate in the development of the allocation methodology and to update their Housing Elements to show how they will accommodate their share of the RHND, following the adoption of the final RHNA allocations. The Housing Element must include an inventory of sites that have been zoned for sufficient capacity to accommodate the jurisdiction’s RHNA allocation for each income category.
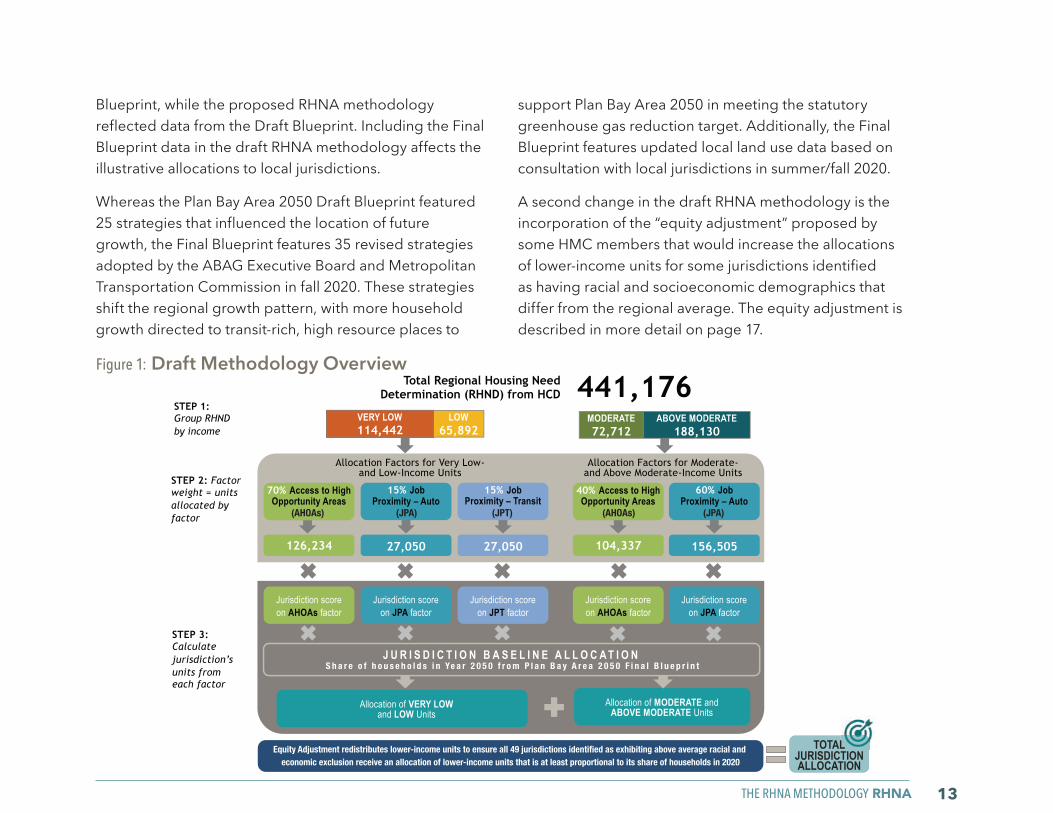
The Regional Housing Needs Determination4 In consultation with ABAG, HCD determined that the Bay Area must plan for 441,176 new housing units from 2023 to 2031. This determination is based on population projections produced by the California Department of Finance (see Appendix 1 for the letter ABAG received from HCD). Details of the RHND by income category
© T
im G
riffit
h co
urte
sy S
AHA.
All
Righ
ts R
eser
ved.
ABOUT THE REGIONAL HOUSING NEEDS ALLOCATION RHNA 7
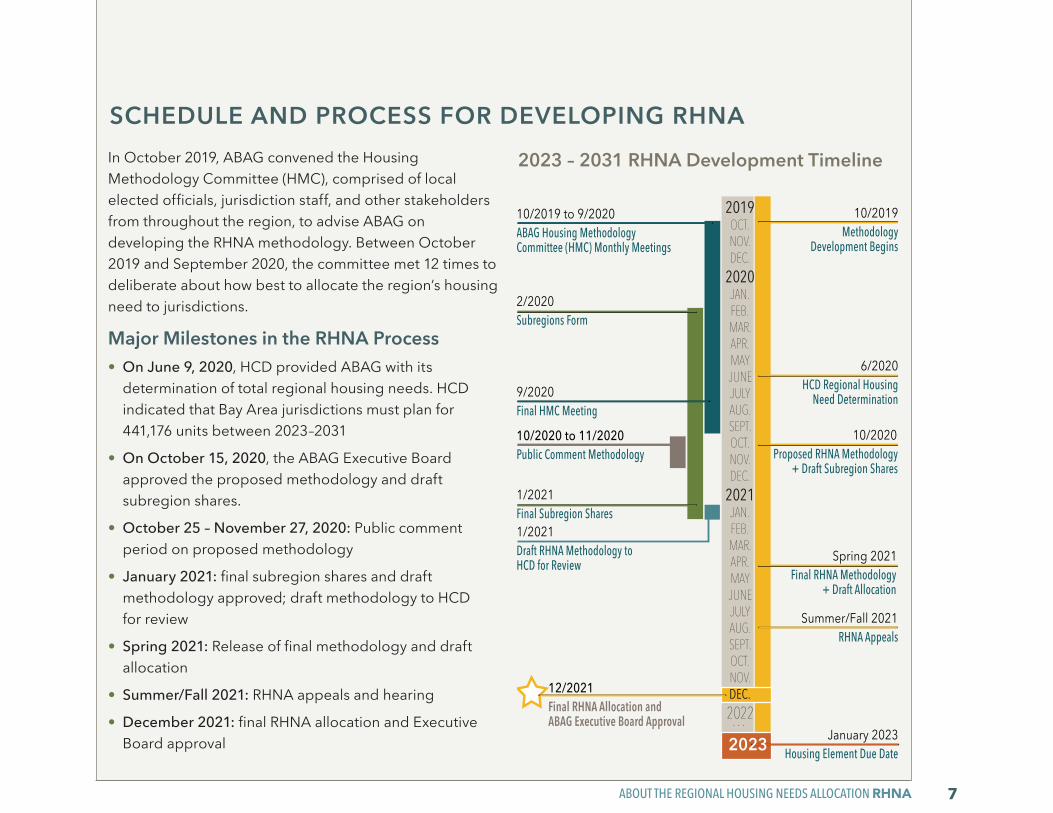
SCHEDULE AND PROCESS FOR DEVELOPING RHNA In October 2019, ABAG convened the Housing Methodology Committee (HMC), comprised of local elected officials, jurisdiction staff, and other stakeholders from throughout the region, to advise ABAG on developing the RHNA methodology. Between October 2019 and September 2020, the committee met 12 times to deliberate about how best to allocate the region’s housing need to jurisdictions.
Major Milestones in the RHNA Process • On June 9, 2020, HCD provided ABAG with its
determination of total regional housing needs. HCD indicated that Bay Area jurisdictions must plan for 441,176 units between 2023–2031
• On October 15, 2020, the ABAG Executive Board approved the proposed methodology and draft subregion shares.
• October 25 – November 27, 2020: Public comment period on proposed methodology
• January 2021: final subregion shares and draft methodology approved; draft methodology to HCD for review
• Spring 2021: Release of final methodology and draft allocation
• Summer/Fall 2021: RHNA appeals and hearing
• December 2021: final RHNA allocation and Executive Board approval
2023–2031 RHNA DEVELOPMENT TIMELINE2019
OCT.NOV.DEC.
2020JAN.FEB.MAR.APR.MAYJUNEJULYAUG.SEPT.OCT.NOV.DEC.
2021JAN.FEB.MAR.APR.MAYJUNEJULYAUG.SEPT.OCT.NOV.DEC.2022…
10/2019 to 9/2020ABAG Housing Methodology Committee (HMC) Monthly Meetings
9/2020Final HMC Meeting
10/2019Methodology
Development Begins
6/2020HCD Regional Housing
Need Determination
10/2020Proposed RHNA Methodology
+ Draft Subregion Shares
Spring 2021Final RHNA Methodology
+ Draft Allocation
Summer/Fall 2021RHNA Appeals
January 2023Housing Element Due Date
2/2020Subregions Form
1/2021Final Subregion Shares
12/2021Final RHNA Allocation and ABAG Executive Board Approval
1/2021Draft RHNA Methodology to HCD for Review
10/2020 to 11/2020 Public Comment Methodology
2023
2023 – 2031 RHNA Development Timeline
ABAG REGIONAL HOUSING NEEDS ALLOCATION DRAFT METHODOLOGY: SAN FRANCISCO BAY AREA, 2023-20318
© 2
012
Cla
rk M
ishle
r cou
rtesy
BRI
DG
E H
ousin
g. A
ll Ri
ghts
Res
erve
d.
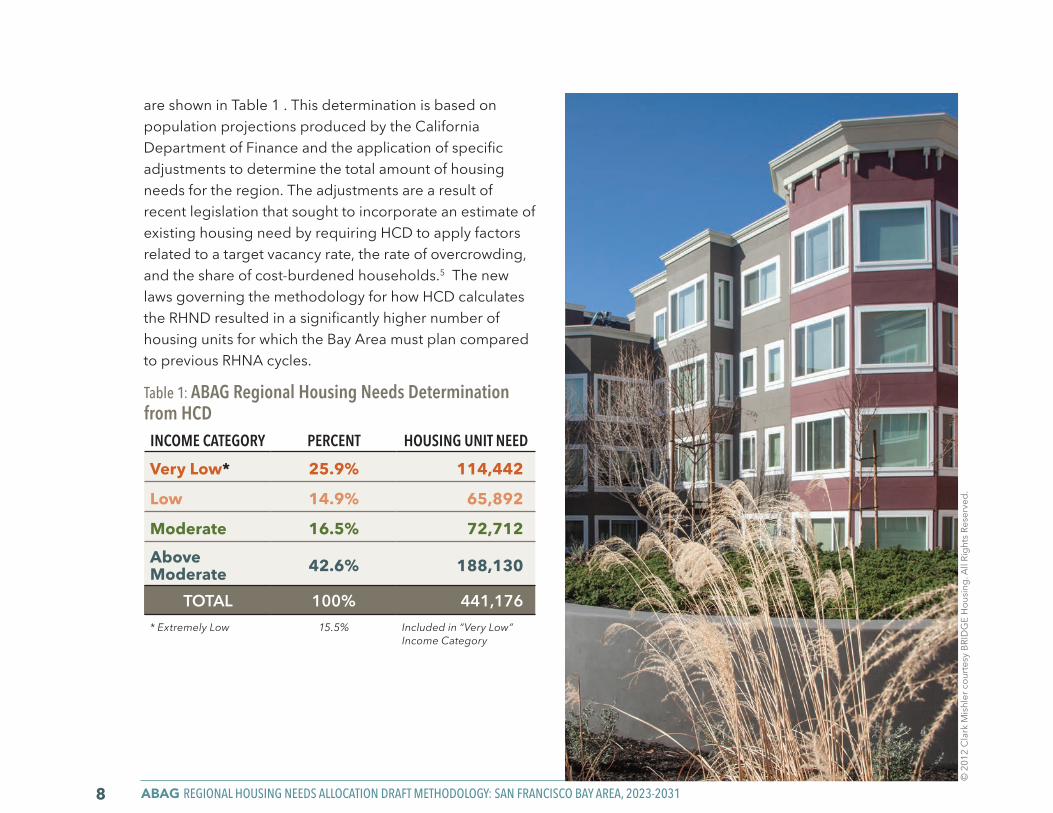
are shown in Table 1 . This determination is based on population projections produced by the California Department of Finance and the application of specific adjustments to determine the total amount of housing needs for the region. The adjustments are a result of recent legislation that sought to incorporate an estimate of existing housing need by requiring HCD to apply factors related to a target vacancy rate, the rate of overcrowding, and the share of cost-burdened households.5 The new laws governing the methodology for how HCD calculates the RHND resulted in a significantly higher number of housing units for which the Bay Area must plan compared to previous RHNA cycles.
Table 1: ABAG Regional Housing Needs Determination from HCD INCOME CATEGORY PERCENT HOUSING UNIT NEED
Very Low* 25.9% 114,442
Low 14.9% 65,892
Moderate 16.5% 72,712
Above Moderate 42.6% 188,130
TOTAL 100% 441,176* Extremely Low 15.5% Included in “Very Low”
Income Category
THE RHNA METHODOLOGY RHNA 9
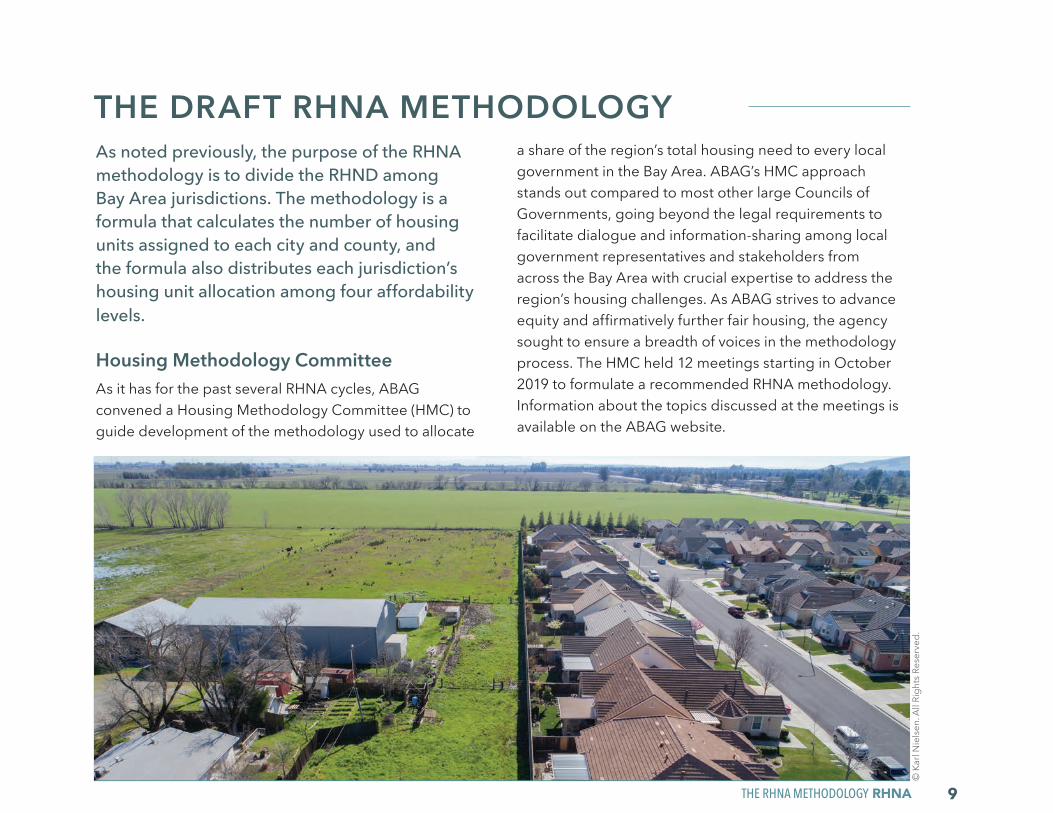
As noted previously, the purpose of the RHNA methodology is to divide the RHND among Bay Area jurisdictions. The methodology is a formula that calculates the number of housing units assigned to each city and county, and the formula also distributes each jurisdiction’s housing unit allocation among four affordability levels.
Housing Methodology Committee As it has for the past several RHNA cycles, ABAG convened a Housing Methodology Committee (HMC) to guide development of the methodology used to allocate
a share of the region’s total housing need to every local government in the Bay Area. ABAG’s HMC approach stands out compared to most other large Councils of Governments, going beyond the legal requirements to facilitate dialogue and information-sharing among local government representatives and stakeholders from across the Bay Area with crucial expertise to address the region’s housing challenges. As ABAG strives to advance equity and affirmatively further fair housing, the agency sought to ensure a breadth of voices in the methodology process. The HMC held 12 meetings starting in October 2019 to formulate a recommended RHNA methodology. Information about the topics discussed at the meetings is available on the ABAG website.
THE DRAFT RHNA METHODOLOGY
© K
arl N
ielse
n. A
ll Ri
ghts
Res
erve
d.
ABAG REGIONAL HOUSING NEEDS ALLOCATION DRAFT METHODOLOGY: SAN FRANCISCO BAY AREA, 2023-203110
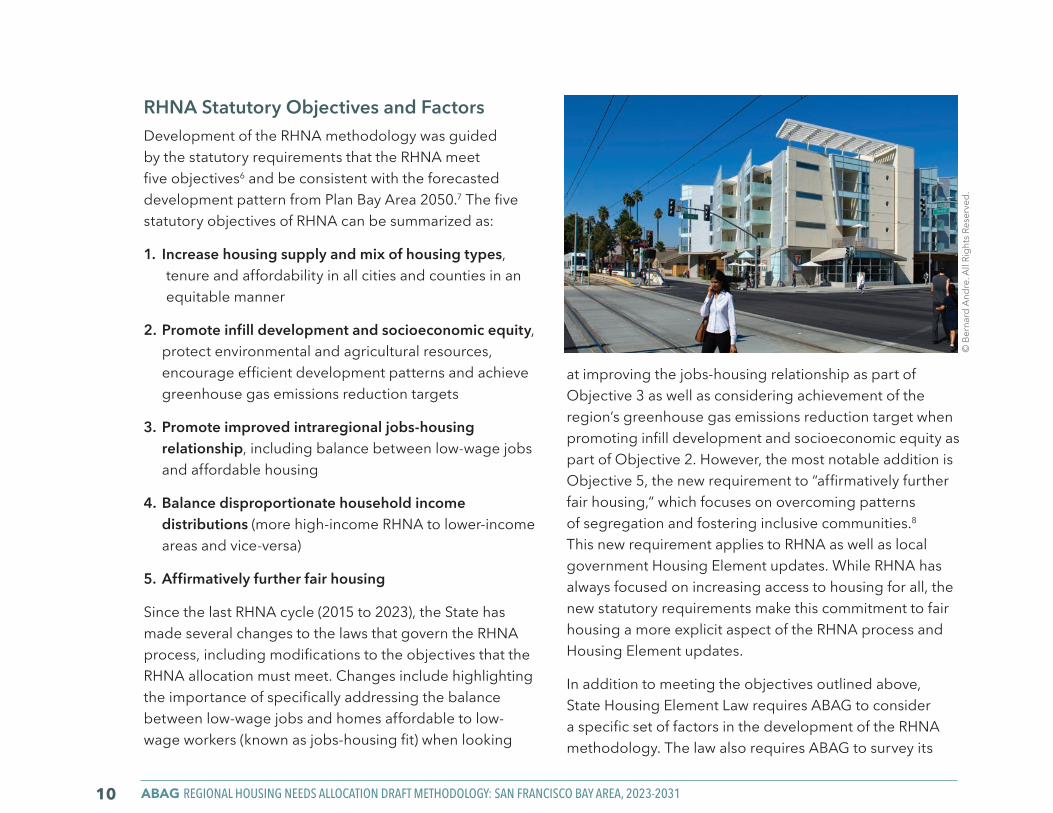
RHNA Statutory Objectives and FactorsDevelopment of the RHNA methodology was guided by the statutory requirements that the RHNA meet five objectives6 and be consistent with the forecasted development pattern from Plan Bay Area 2050.7 The five statutory objectives of RHNA can be summarized as:
1. I ncrease housing supply and mix of housing types, tenure and affordability in all cities and counties in an equitable manner
2. Promote infill development and socioeconomic equity, protect environmental and agricultural resources, encourage efficient development patterns and achieve greenhouse gas emissions reduction targets
3. Promote improved intraregional jobs-housing relationship, including balance between low-wage jobs and affordable housing
4. Balance disproportionate household income distributions (more high-income RHNA to lower-income areas and vice-versa)
5. Affirmatively further fair housing
Since the last RHNA cycle (2015 to 2023), the State has made several changes to the laws that govern the RHNA process, including modifications to the objectives that the RHNA allocation must meet. Changes include highlighting the importance of specifically addressing the balance between low-wage jobs and homes affordable to low-wage workers (known as jobs-housing fit) when looking
at improving the jobs-housing relationship as part of Objective 3 as well as considering achievement of the region’s greenhouse gas emissions reduction target when promoting infill development and socioeconomic equity as part of Objective 2. However, the most notable addition is Objective 5, the new requirement to “affirmatively further fair housing,” which focuses on overcoming patterns of segregation and fostering inclusive communities.8 This new requirement applies to RHNA as well as local government Housing Element updates. While RHNA has always focused on increasing access to housing for all, the new statutory requirements make this commitment to fair housing a more explicit aspect of the RHNA process and Housing Element updates.
In addition to meeting the objectives outlined above, State Housing Element Law requires ABAG to consider a specific set of factors in the development of the RHNA methodology. The law also requires ABAG to survey its
© B
erna
rd A
ndre
. All
Righ
ts R
eser
ved.
THE RHNA METHODOLOGY RHNA 11
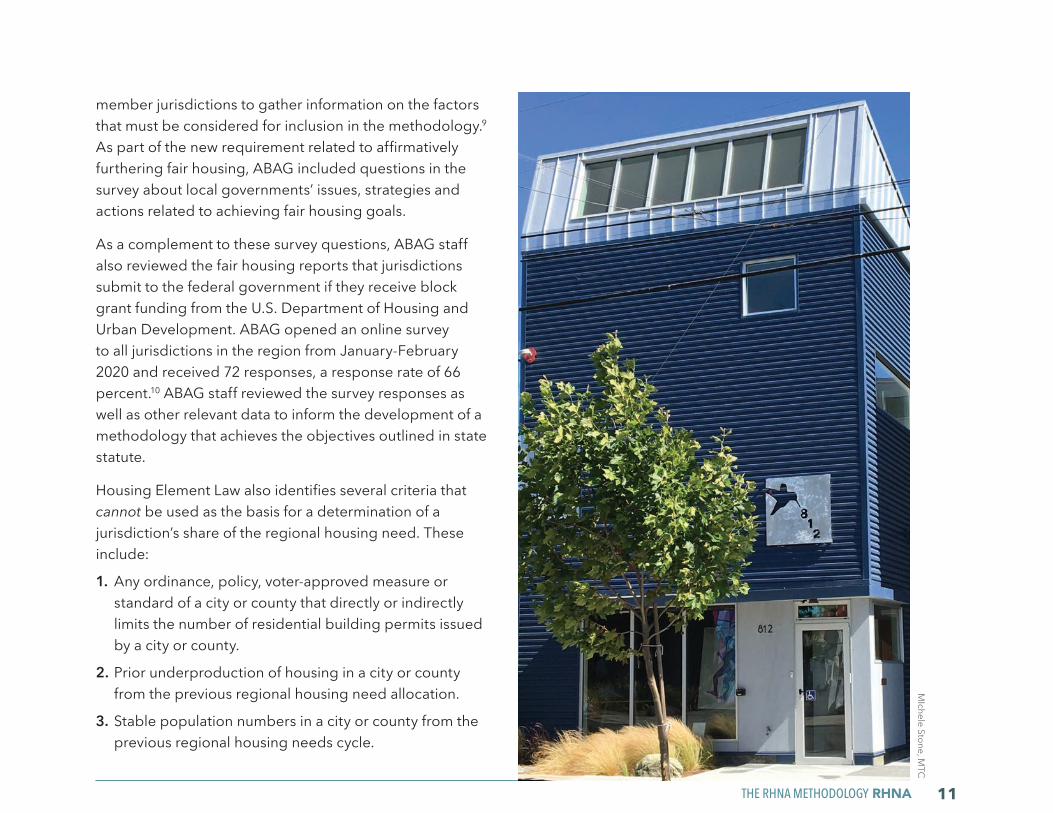
member jurisdictions to gather information on the factors that must be considered for inclusion in the methodology.9
As part of the new requirement related to affirmatively furthering fair housing, ABAG included questions in the survey about local governments’ issues, strategies and actions related to achieving fair housing goals.
As a complement to these survey questions, ABAG staff also reviewed the fair housing reports that jurisdictions submit to the federal government if they receive block grant funding from the U.S. Department of Housing and Urban Development. ABAG opened an online survey to all jurisdictions in the region from January-February 2020 and received 72 responses, a response rate of 66 percent.10 ABAG staff reviewed the survey responses as well as other relevant data to inform the development of a methodology that achieves the objectives outlined in state statute.
Housing Element Law also identifies several criteria that cannot be used as the basis for a determination of a jurisdiction’s share of the regional housing need. These include:
1. Any ordinance, policy, voter-approved measure or standard of a city or county that directly or indirectly limits the number of residential building permits issued by a city or county.
2. Prior underproduction of housing in a city or county from the previous regional housing need allocation.
3. Stable population numbers in a city or county from the previous regional housing needs cycle.
MIchele Stone, M
TC
ABAG REGIONAL HOUSING NEEDS ALLOCATION DRAFT METHODOLOGY: SAN FRANCISCO BAY AREA, 2023-203112
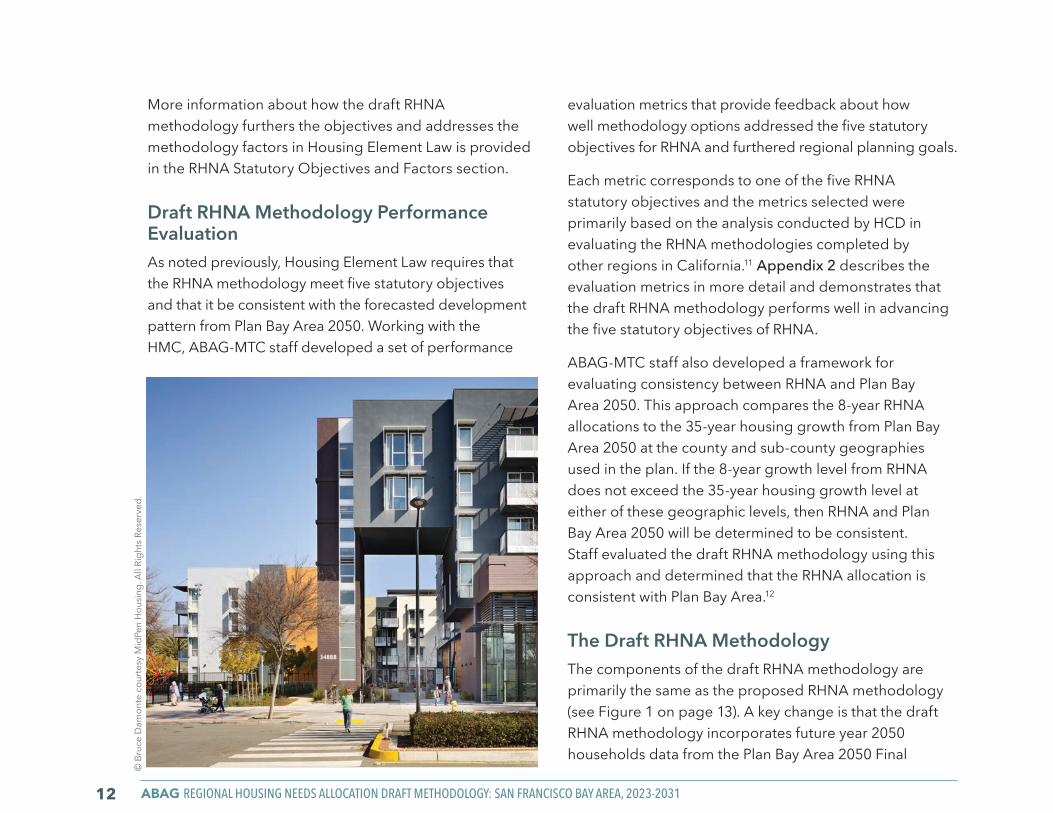
More information about how the draft RHNA methodology furthers the objectives and addresses the methodology factors in Housing Element Law is provided in the RHNA Statutory Objectives and Factors section.
Draft RHNA Methodology Performance Evaluation As noted previously, Housing Element Law requires that the RHNA methodology meet five statutory objectives and that it be consistent with the forecasted development pattern from Plan Bay Area 2050. Working with the HMC, ABAG-MTC staff developed a set of performance
evaluation metrics that provide feedback about how well methodology options addressed the five statutory objectives for RHNA and furthered regional planning goals.
Each metric corresponds to one of the five RHNA statutory objectives and the metrics selected were primarily based on the analysis conducted by HCD in evaluating the RHNA methodologies completed by other regions in California.11 Appendix 2 describes the evaluation metrics in more detail and demonstrates that the draft RHNA methodology performs well in advancing the five statutory objectives of RHNA.
ABAG-MTC staff also developed a framework for evaluating consistency between RHNA and Plan Bay Area 2050. This approach compares the 8-year RHNA allocations to the 35-year housing growth from Plan Bay Area 2050 at the county and sub-county geographies used in the plan. If the 8-year growth level from RHNA does not exceed the 35-year housing growth level at either of these geographic levels, then RHNA and Plan Bay Area 2050 will be determined to be consistent. Staff evaluated the draft RHNA methodology using this approach and determined that the RHNA allocation is consistent with Plan Bay Area.12
The Draft RHNA Methodology The components of the draft RHNA methodology are primarily the same as the proposed RHNA methodology (see Figure 1 on page 13). A key change is that the draft RHNA methodology incorporates future year 2050 households data from the Plan Bay Area 2050 Final
© B
ruce
Dam
onte
cou
rtesy
Mid
Pen
Hou
sing.
All
Righ
ts R
eser
ved.
THE RHNA METHODOLOGY RHNA 13
Blueprint, while the proposed RHNA methodology reflected data from the Draft Blueprint. Including the Final Blueprint data in the draft RHNA methodology affects the illustrative allocations to local jurisdictions.
Whereas the Plan Bay Area 2050 Draft Blueprint featured 25 strategies that influenced the location of future growth, the Final Blueprint features 35 revised strategies adopted by the ABAG Executive Board and Metropolitan Transportation Commission in fall 2020. These strategies shift the regional growth pattern, with more household growth directed to transit-rich, high resource places to
support Plan Bay Area 2050 in meeting the statutory greenhouse gas reduction target. Additionally, the Final Blueprint features updated local land use data based on consultation with local jurisdictions in summer/fall 2020.
A second change in the draft RHNA methodology is the incorporation of the “equity adjustment” proposed by some HMC members that would increase the allocations of lower-income units for some jurisdictions identified as having racial and socioeconomic demographics that differ from the regional average. The equity adjustment is described in more detail on page 17.
TOTAL JURISDICTION ALLOCATION
(AHOAs) (AHOAs)(JPA) (JPA)(JPT)
Equity Adjustment redistributes lower-income units to ensure all 49 jurisdictions identified as exhibiting above average racial and economic exclusion receive an allocation of lower-income units that is at least proportional to its share of households in 2020
S h a r e o f h o u s e h o l d s i n Ye a r 2 0 5 0 f r o m P l a n B a y A r e a 2 0 5 0 F i n a l B l u e p r i n t
Figure 1: Draft Methodology Overview
ABAG REGIONAL HOUSING NEEDS ALLOCATION DRAFT METHODOLOGY: SAN FRANCISCO BAY AREA, 2023-203114
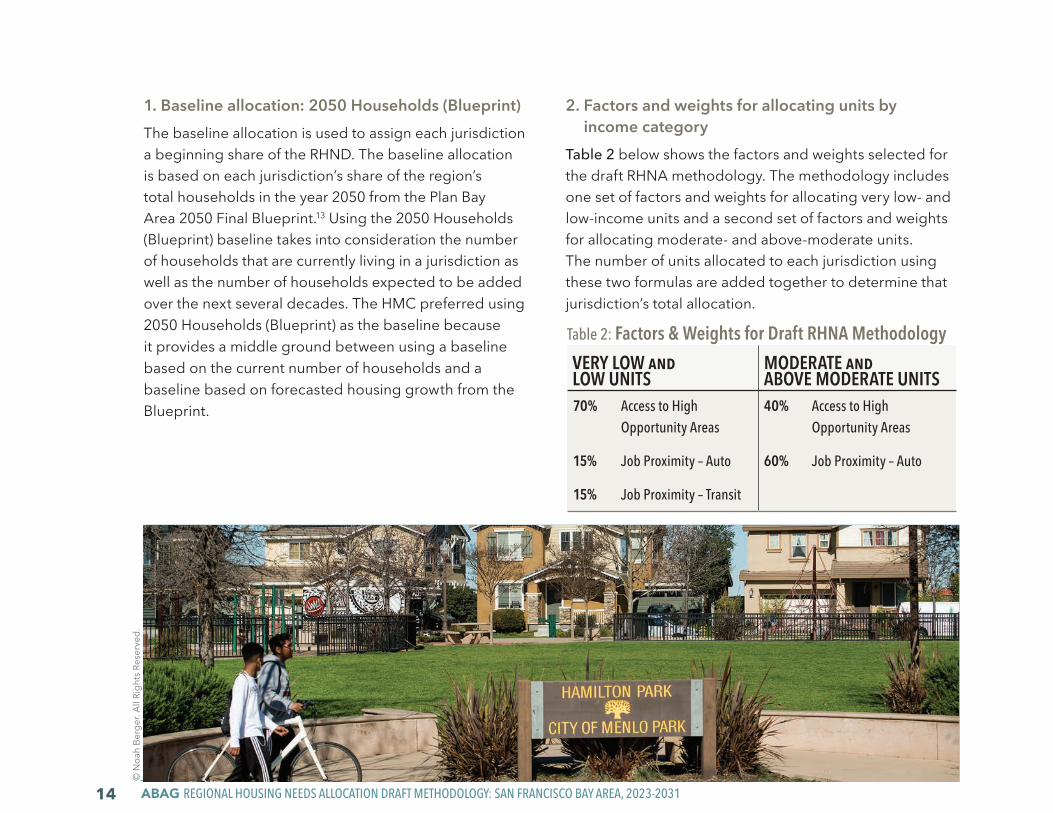
1. Baseline allocation: 2050 Households (Blueprint) The baseline allocation is used to assign each jurisdiction a beginning share of the RHND. The baseline allocation is based on each jurisdiction’s share of the region’s total households in the year 2050 from the Plan Bay Area 2050 Final Blueprint.13 Using the 2050 Households (Blueprint) baseline takes into consideration the number of households that are currently living in a jurisdiction as well as the number of households expected to be added over the next several decades. The HMC preferred using 2050 Households (Blueprint) as the baseline because it provides a middle ground between using a baseline based on the current number of households and a baseline based on forecasted housing growth from the Blueprint.
2. Factors and weights for allocating units by income category
Table 2 below shows the factors and weights selected for the draft RHNA methodology. The methodology includes one set of factors and weights for allocating very low- and low-income units and a second set of factors and weights for allocating moderate- and above-moderate units. The number of units allocated to each jurisdiction using these two formulas are added together to determine that jurisdiction’s total allocation.
Table 2: Factors & Weights for Draft RHNA Methodology VERY LOW and LOW UNITS
MODERATE and ABOVE MODERATE UNITS
70% Access to High Opportunity Areas
15% Job Proximity – Auto
15% Job Proximity – Transit
40% Access to High Opportunity Areas
60% Job Proximity – Auto
© N
oah
Berg
er. A
ll Ri
ghts
Res
erve
d.
THE RHNA METHODOLOGY RHNA 15
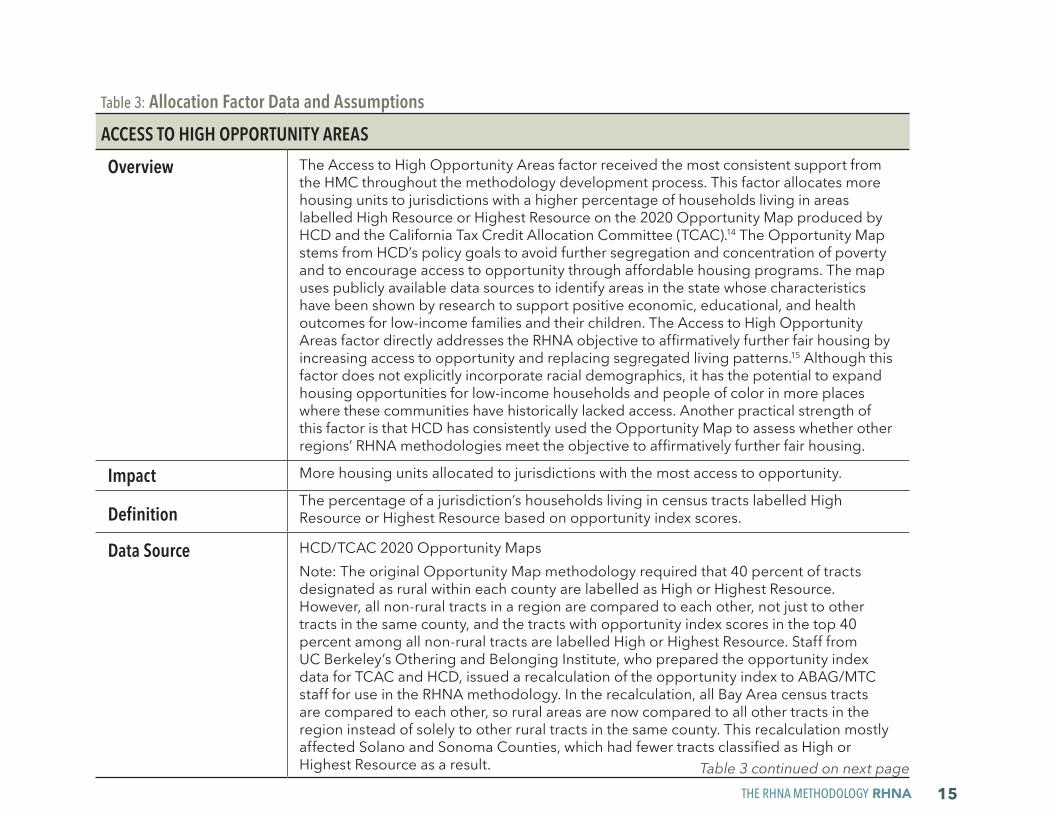
Table 3: Allocation Factor Data and AssumptionsACCESS TO HIGH OPPORTUNITY AREASOverview The Access to High Opportunity Areas factor received the most consistent support from
the HMC throughout the methodology development process. This factor allocates more housing units to jurisdictions with a higher percentage of households living in areas labelled High Resource or Highest Resource on the 2020 Opportunity Map produced by HCD and the California Tax Credit Allocation Committee (TCAC).14 The Opportunity Map stems from HCD’s policy goals to avoid further segregation and concentration of poverty and to encourage access to opportunity through affordable housing programs. The map uses publicly available data sources to identify areas in the state whose characteristics have been shown by research to support positive economic, educational, and health outcomes for low-income families and their children. The Access to High Opportunity Areas factor directly addresses the RHNA objective to affirmatively further fair housing by increasing access to opportunity and replacing segregated living patterns.15 Although this factor does not explicitly incorporate racial demographics, it has the potential to expand housing opportunities for low-income households and people of color in more places where these communities have historically lacked access. Another practical strength of this factor is that HCD has consistently used the Opportunity Map to assess whether other regions’ RHNA methodologies meet the objective to affirmatively further fair housing.
Impact More housing units allocated to jurisdictions with the most access to opportunity.
DefinitionThe percentage of a jurisdiction’s households living in census tracts labelled High Resource or Highest Resource based on opportunity index scores.
Data Source HCD/TCAC 2020 Opportunity MapsNote: The original Opportunity Map methodology required that 40 percent of tracts designated as rural within each county are labelled as High or Highest Resource. However, all non-rural tracts in a region are compared to each other, not just to other tracts in the same county, and the tracts with opportunity index scores in the top 40 percent among all non-rural tracts are labelled High or Highest Resource. Staff from UC Berkeley’s Othering and Belonging Institute, who prepared the opportunity index data for TCAC and HCD, issued a recalculation of the opportunity index to ABAG/MTC staff for use in the RHNA methodology. In the recalculation, all Bay Area census tracts are compared to each other, so rural areas are now compared to all other tracts in the region instead of solely to other rural tracts in the same county. This recalculation mostly affected Solano and Sonoma Counties, which had fewer tracts classified as High or Highest Resource as a result. Table 3 continued on next page
ABAG REGIONAL HOUSING NEEDS ALLOCATION DRAFT METHODOLOGY: SAN FRANCISCO BAY AREA, 2023-203116
Table 3: Allocation Factor Data and Assumptions (continued)
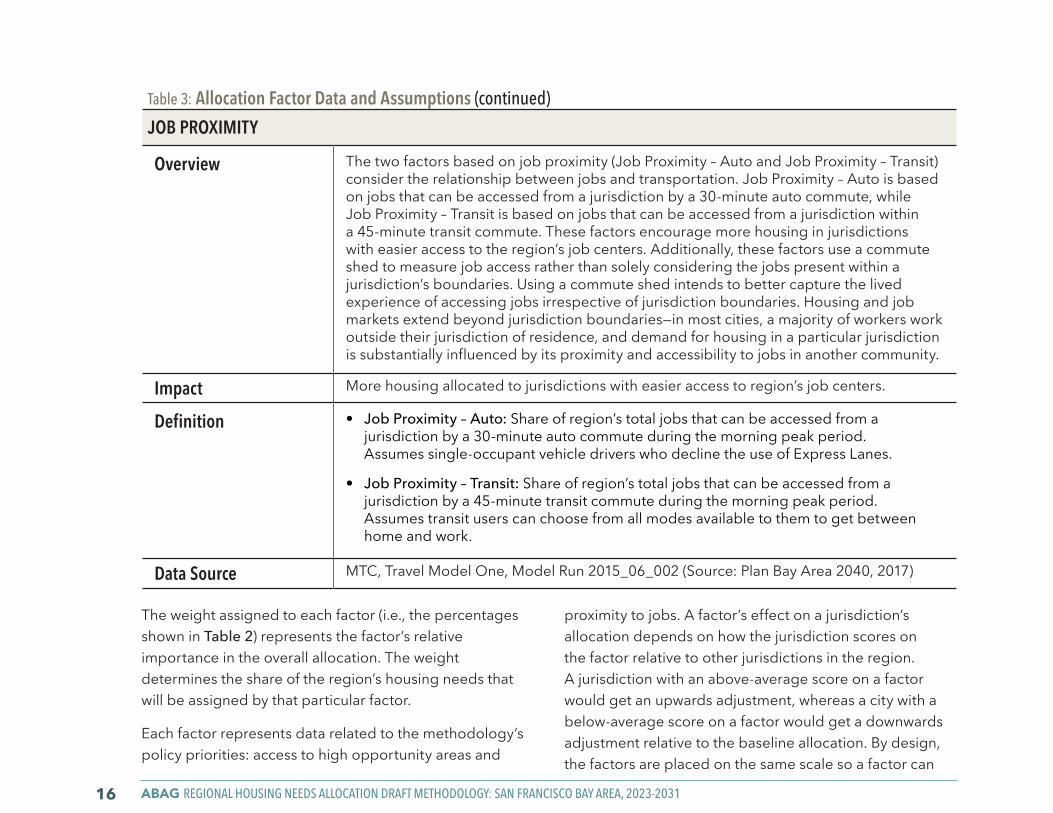
JOB PROXIMITY
Overview The two factors based on job proximity (Job Proximity – Auto and Job Proximity – Transit) consider the relationship between jobs and transportation. Job Proximity – Auto is based on jobs that can be accessed from a jurisdiction by a 30-minute auto commute, while Job Proximity – Transit is based on jobs that can be accessed from a jurisdiction within a 45-minute transit commute. These factors encourage more housing in jurisdictions with easier access to the region’s job centers. Additionally, these factors use a commute shed to measure job access rather than solely considering the jobs present within a jurisdiction’s boundaries. Using a commute shed intends to better capture the lived experience of accessing jobs irrespective of jurisdiction boundaries. Housing and job markets extend beyond jurisdiction boundaries—in most cities, a majority of workers work outside their jurisdiction of residence, and demand for housing in a particular jurisdiction is substantially influenced by its proximity and accessibility to jobs in another community.
Impact More housing allocated to jurisdictions with easier access to region’s job centers.
Definition • Job Proximity – Auto: Share of region’s total jobs that can be accessed from a jurisdiction by a 30-minute auto commute during the morning peak period. Assumes single-occupant vehicle drivers who decline the use of Express Lanes.
• Job Proximity – Transit: Share of region’s total jobs that can be accessed from a jurisdiction by a 45-minute transit commute during the morning peak period. Assumes transit users can choose from all modes available to them to get between home and work.
Data Source MTC, Travel Model One, Model Run 2015_06_002 (Source: Plan Bay Area 2040, 2017)
The weight assigned to each factor (i.e., the percentages shown in Table 2) represents the factor’s relative importance in the overall allocation. The weight determines the share of the region’s housing needs that will be assigned by that particular factor.
Each factor represents data related to the methodology’s policy priorities: access to high opportunity areas and
proximity to jobs. A factor’s effect on a jurisdiction’s allocation depends on how the jurisdiction scores on the factor relative to other jurisdictions in the region. A jurisdiction with an above-average score on a factor would get an upwards adjustment, whereas a city with a below-average score on a factor would get a downwards adjustment relative to the baseline allocation. By design, the factors are placed on the same scale so a factor can
17
modify the baseline in the range from 50 percent to 150 percent: Jurisdictions scoring at the top for the region will get baseline share times 1.5, while jurisdictions scoring at the bottom for the region will get baseline share times 0.5. This scaling approach helps distribute RHNA units throughout the region by ensuring that even a jurisdiction with a low score gets an allocation from each factor and placing a limit on how many units can be assigned to a jurisdiction with a high score. Table 3 (pages 15-16)provides more detail about the data and assumptions for each factor.
3. Equity AdjustmentThe equity adjustment identifies 49 jurisdictions that exhibit racial and socioeconomic demographics that differ from the regional average using a composite score
developed by several members of the HMC. The purpose of the equity adjustment is to ensure that each of these 49 jurisdictions receives an allocation of lower-income units that is at least proportional to its share of the region’s total households in 2020. For example, if a jurisdiction had two percent of existing households, it would receive at least two percent of the very low- and low-income RHNA units.
The composite score is calculated by adding together the jurisdiction’s divergence index score16 (which measures segregation by looking at how much local racial demographics differ from the region) and the percent of the jurisdiction’s households with household incomes above 120 percent of the area median income (AMI). Jurisdictions with a composite score greater than the median score for the region are included in the group of “exclusionary” jurisdictions. Accordingly, a jurisdiction
© B
ruce
Dam
onte
cou
rtesy
CH
P Al
l rig
hts r
eser
ved.
THE RHNA METHODOLOGY RHNA
ABAG REGIONAL HOUSING NEEDS ALLOCATION DRAFT METHODOLOGY: SAN FRANCISCO BAY AREA, 2023-203118
does not necessarily need to have an extremely high divergence score or percent of households above 120 percent AMI to be considered “exclusionary,” as a jurisdiction’s composite score only needed to be in the top half for all Bay Area jurisdictions.
The equity adjustment excludes five jurisdictions who have composite scores above the region's median, but median incomes in the bottom quartile for the region. These jurisdictions were excluded from the equity adjustment to avoid directing additional lower-income RHNA units to jurisdictions with racial demographics that are different
than the rest of the region but that already have a high share of lower-income households.
The equity adjustment is the last step in the allocation methodology, and is applied after the methodology's factors and weights are used to determine a jurisdiction's allocation by income category. If the allocation of lower-income RHNA units to one of the 49 jurisdictions identified by the equity adjustment's composite score does not meet the equity adjustment's proportionality threshold, then lower-income units are redistributed from the remaining 60 jurisdictions in the region to increase that jurisdiction’s
© K
arl N
ielse
n. A
ll Ri
ghts
Res
erve
d.
19
lower-income allocation until it is proportional. Each jurisdiction in this group has its allocation of lower-income units reduced in proportion to its share of the total lower-income units among the jurisdictions in the group of 60. The equity adjustment does not have any effect on moderate- and above moderate-income units.
Appendix 3 shows the calculations for the composite score used to identify the 49 jurisdictions that exhibit racial and socioeconomic demographics that differ from the regional average. It also shows the effects of the equity adjustment on each jurisdiction’s allocation of lower-income units. Of the 49 jurisdictions, 31 receive allocations that meet the equity adjustment’s proportionality threshold based on the draft methodology’s factors and weights that emphasize access to high opportunity areas. The allocations for these 31 jurisdictions do not change as a result of the equity adjustment. The other 60 jurisdictions in the region see reductions in their lower-income allocations (and thus their total allocations) as units are shifted to the 18 jurisdictions whose allocations are increased as a result of the equity adjustment.
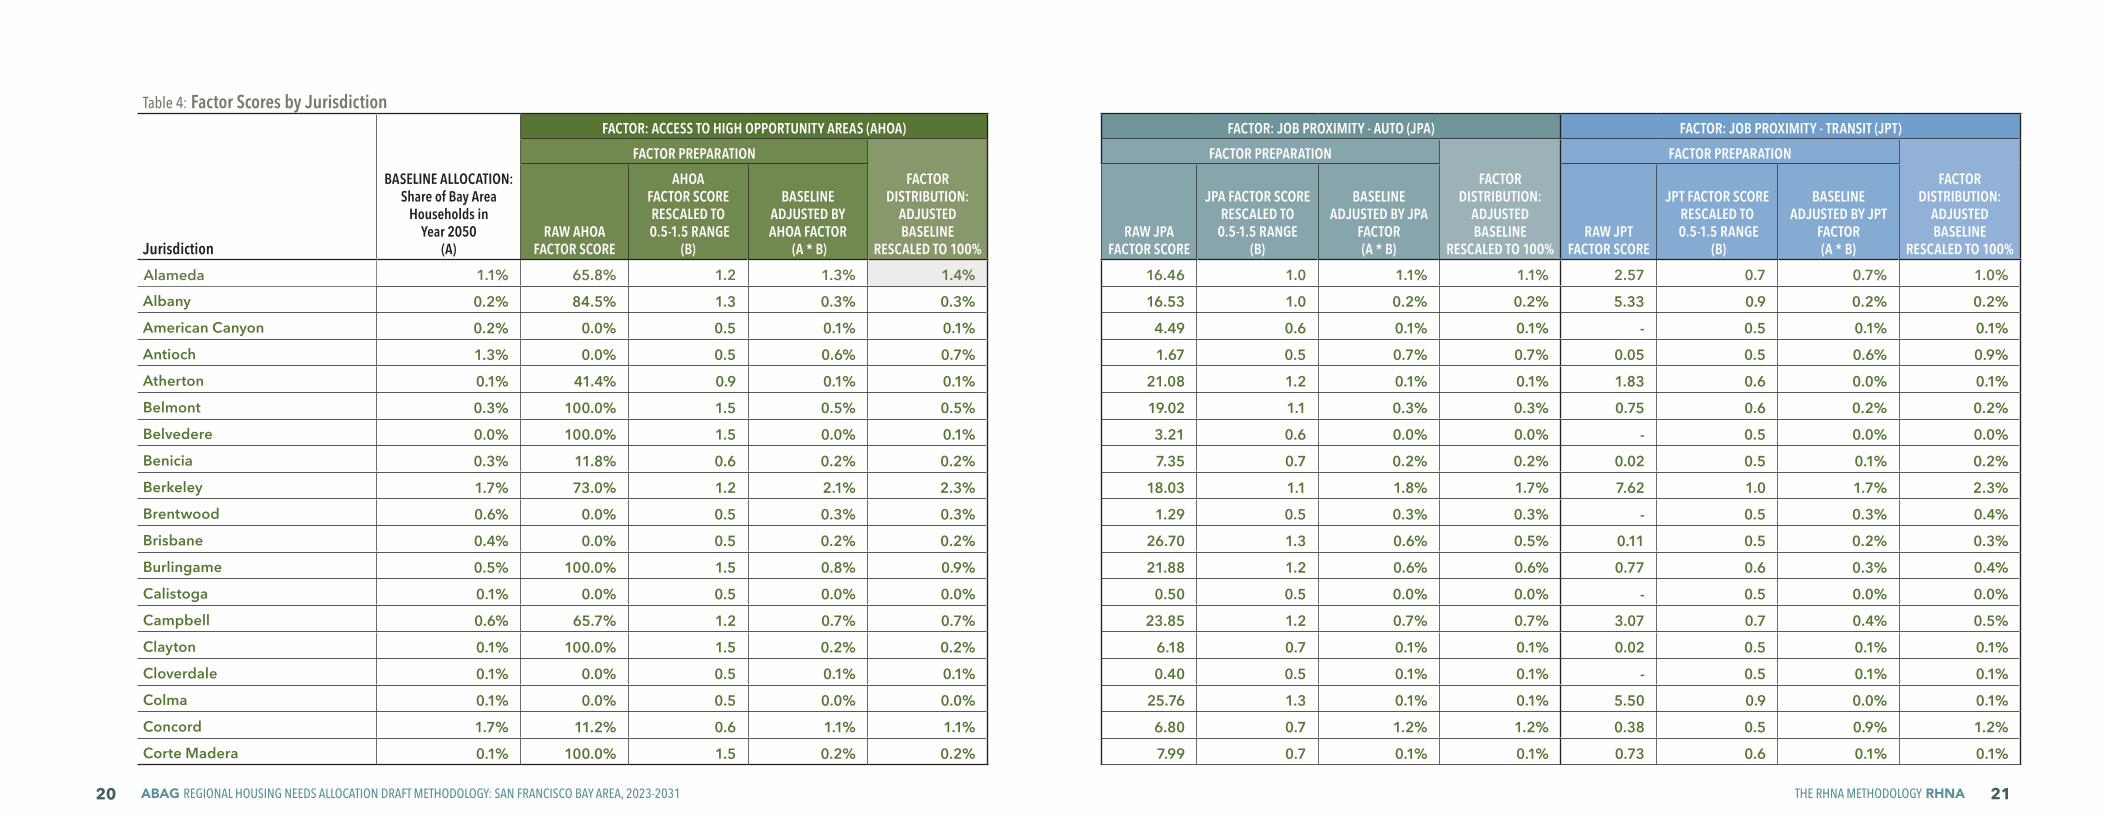
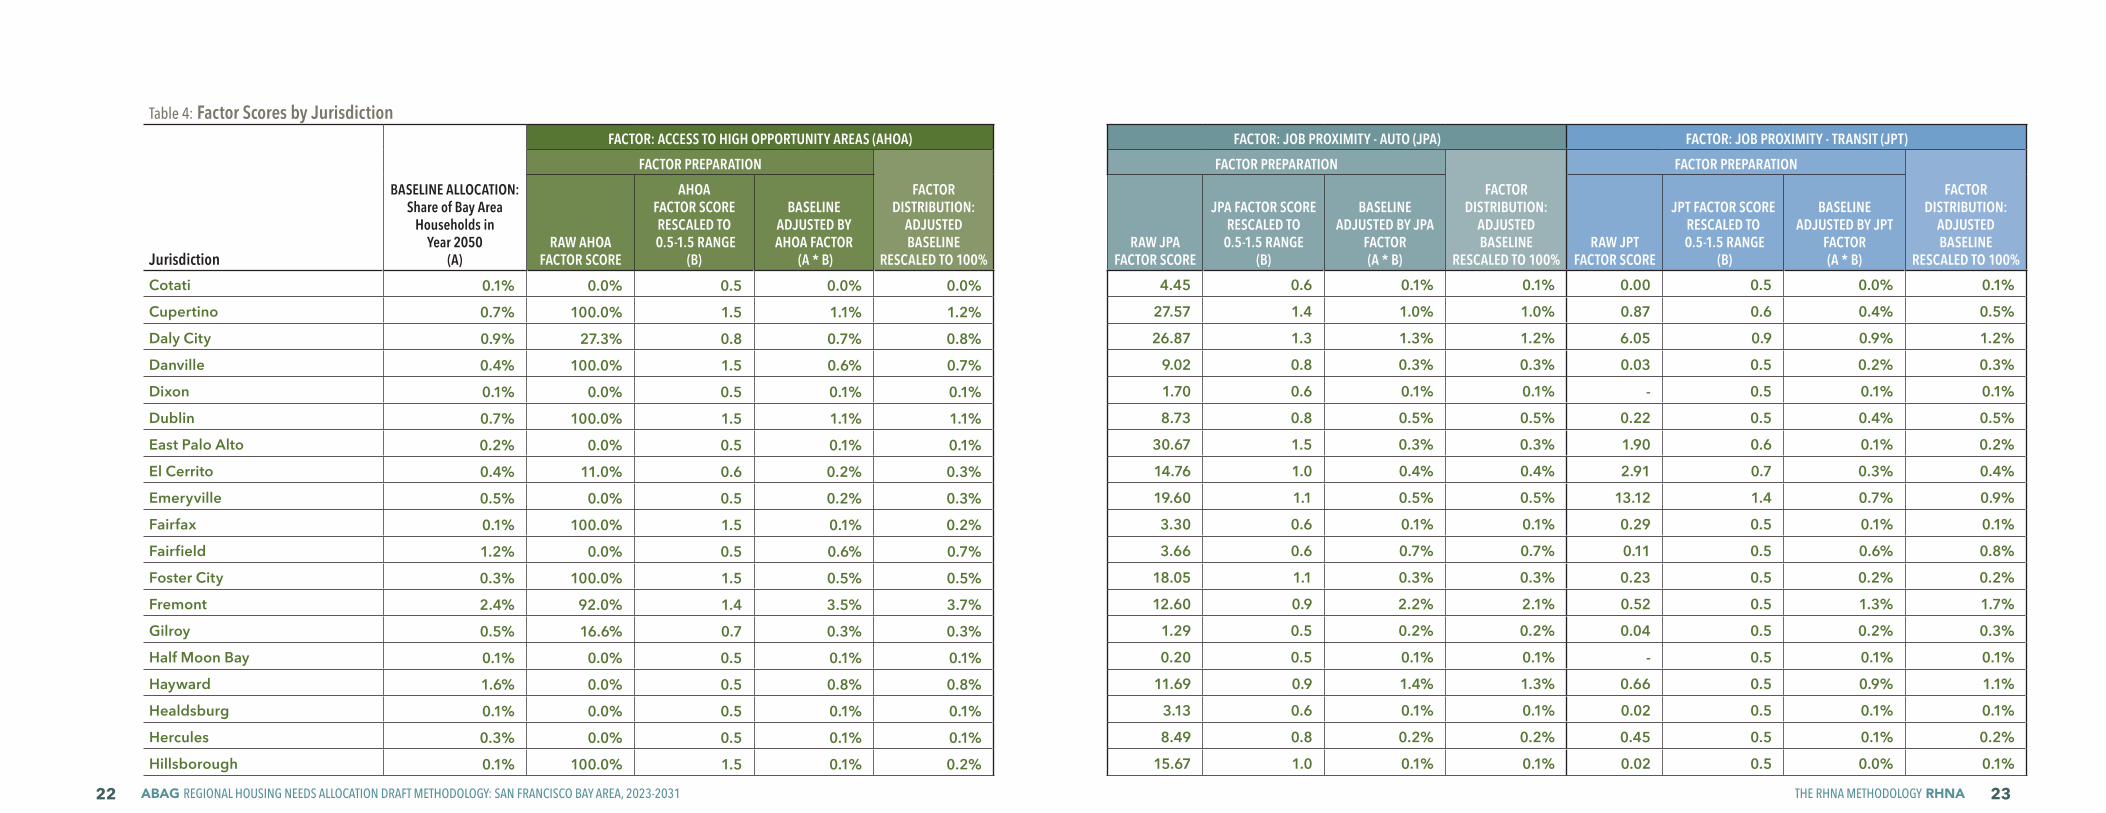
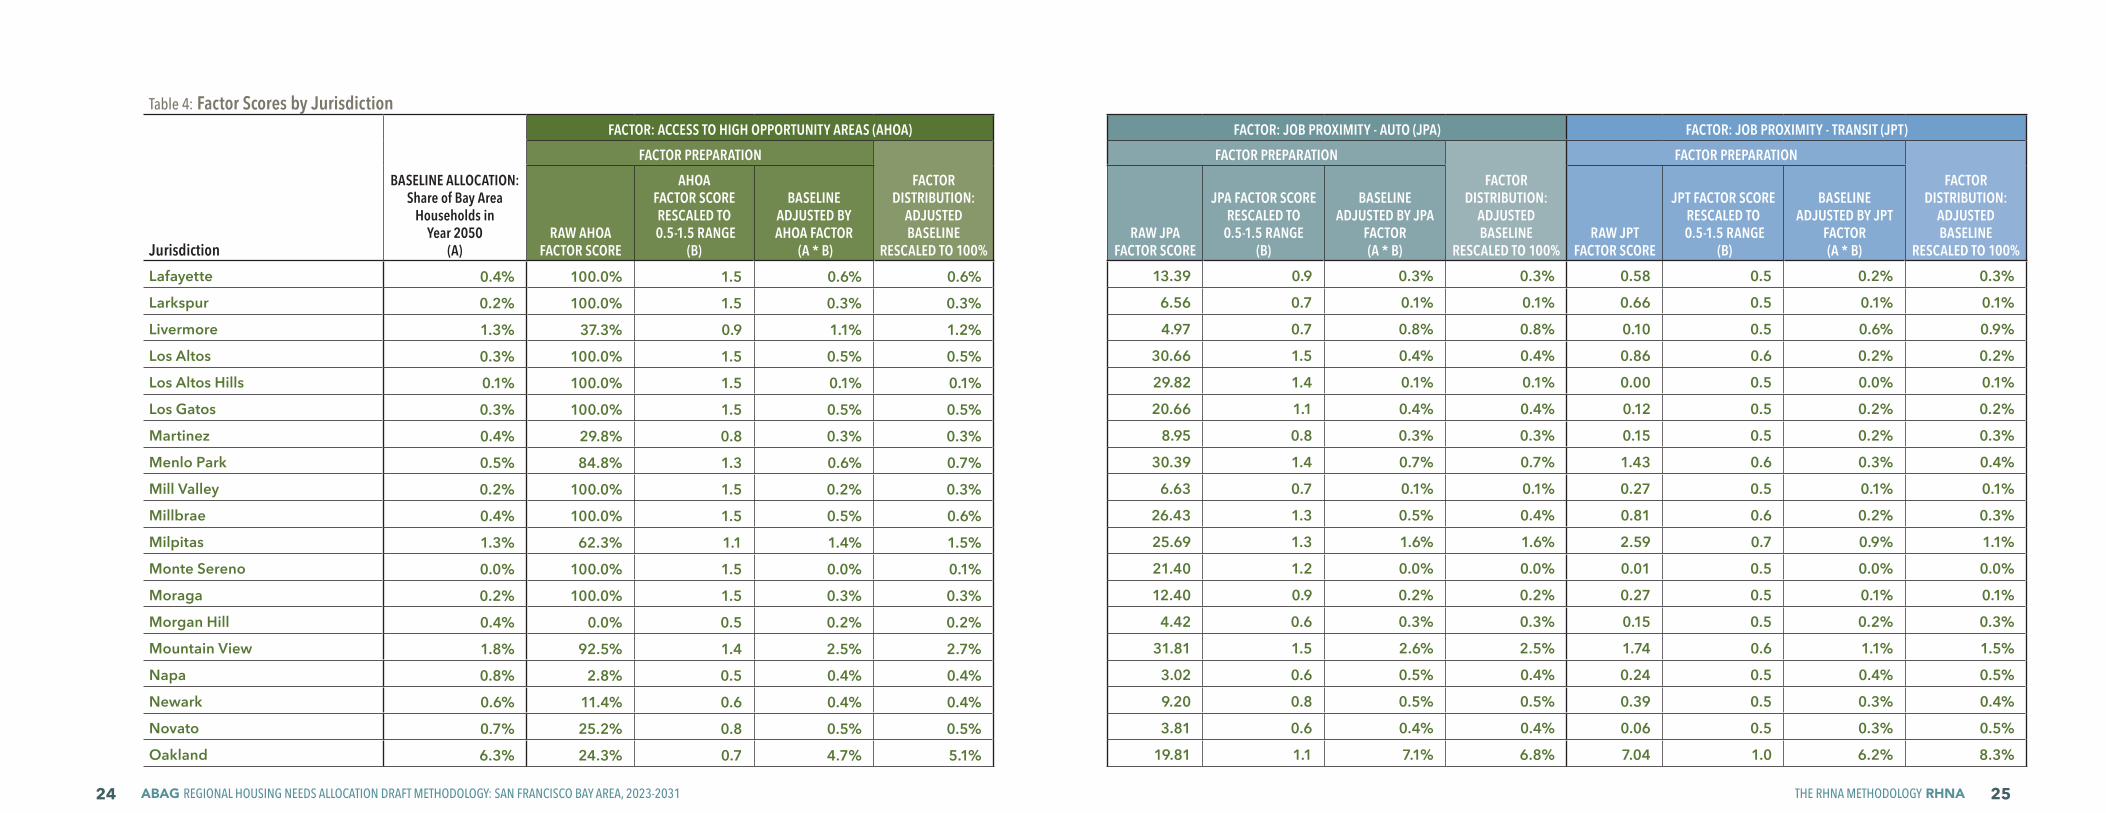
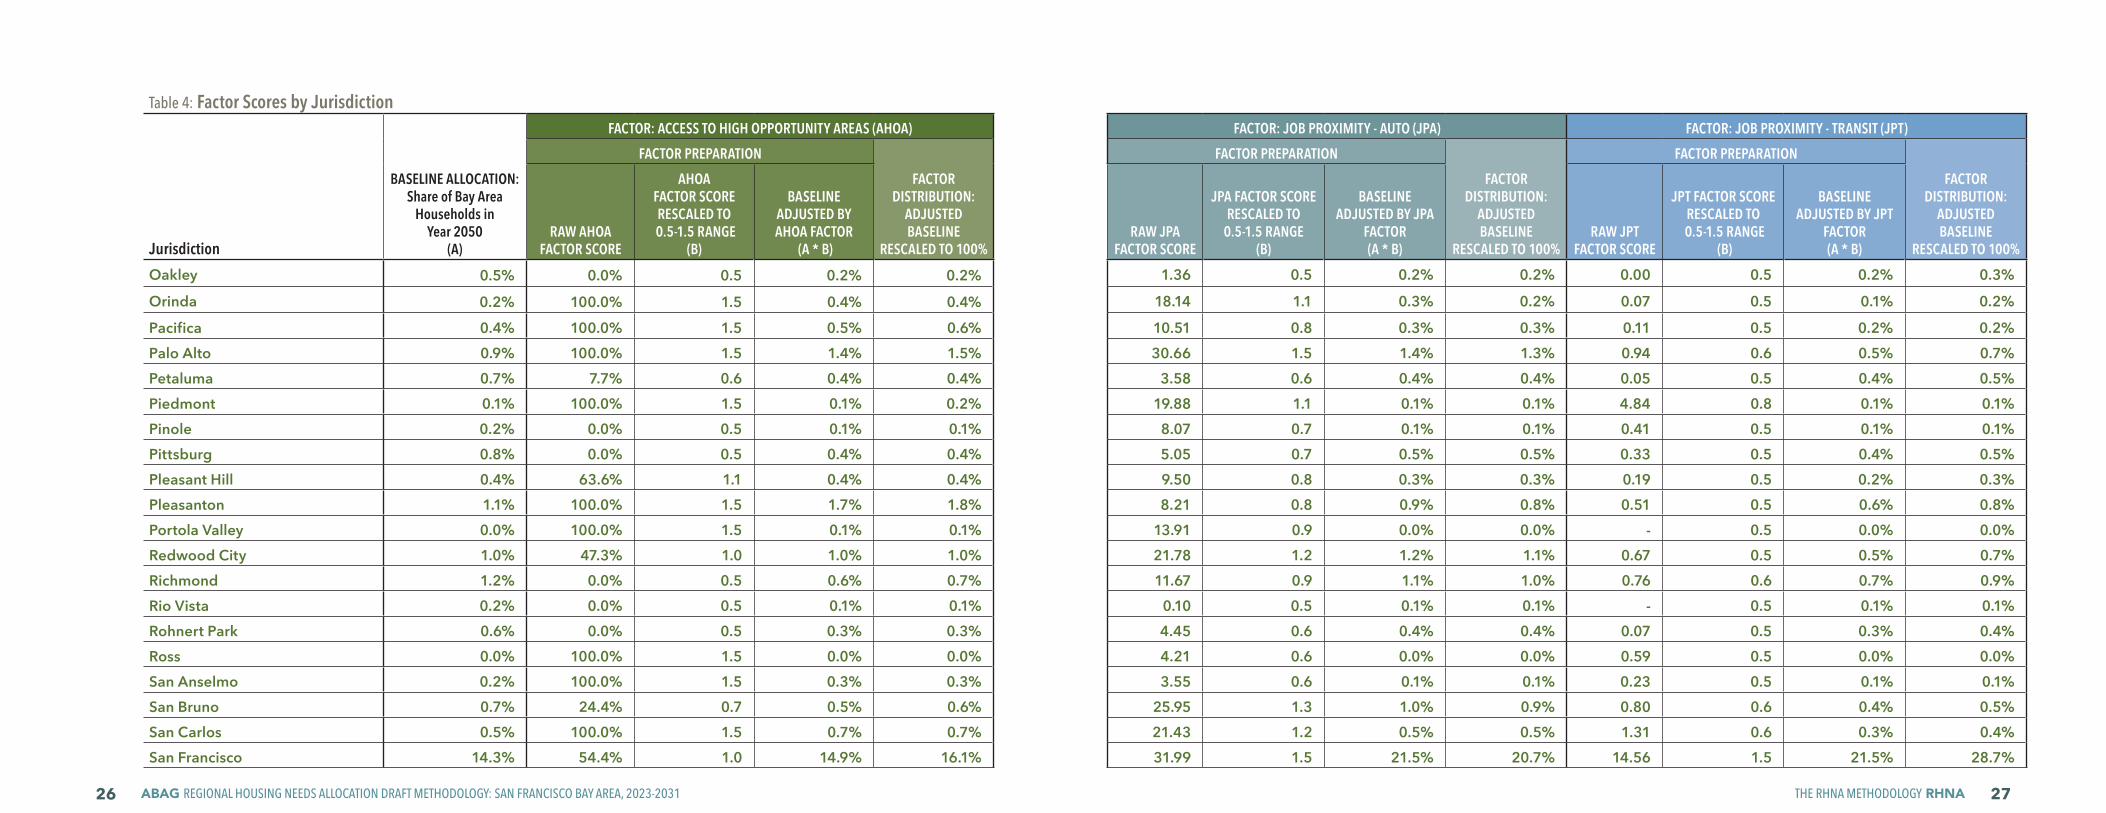
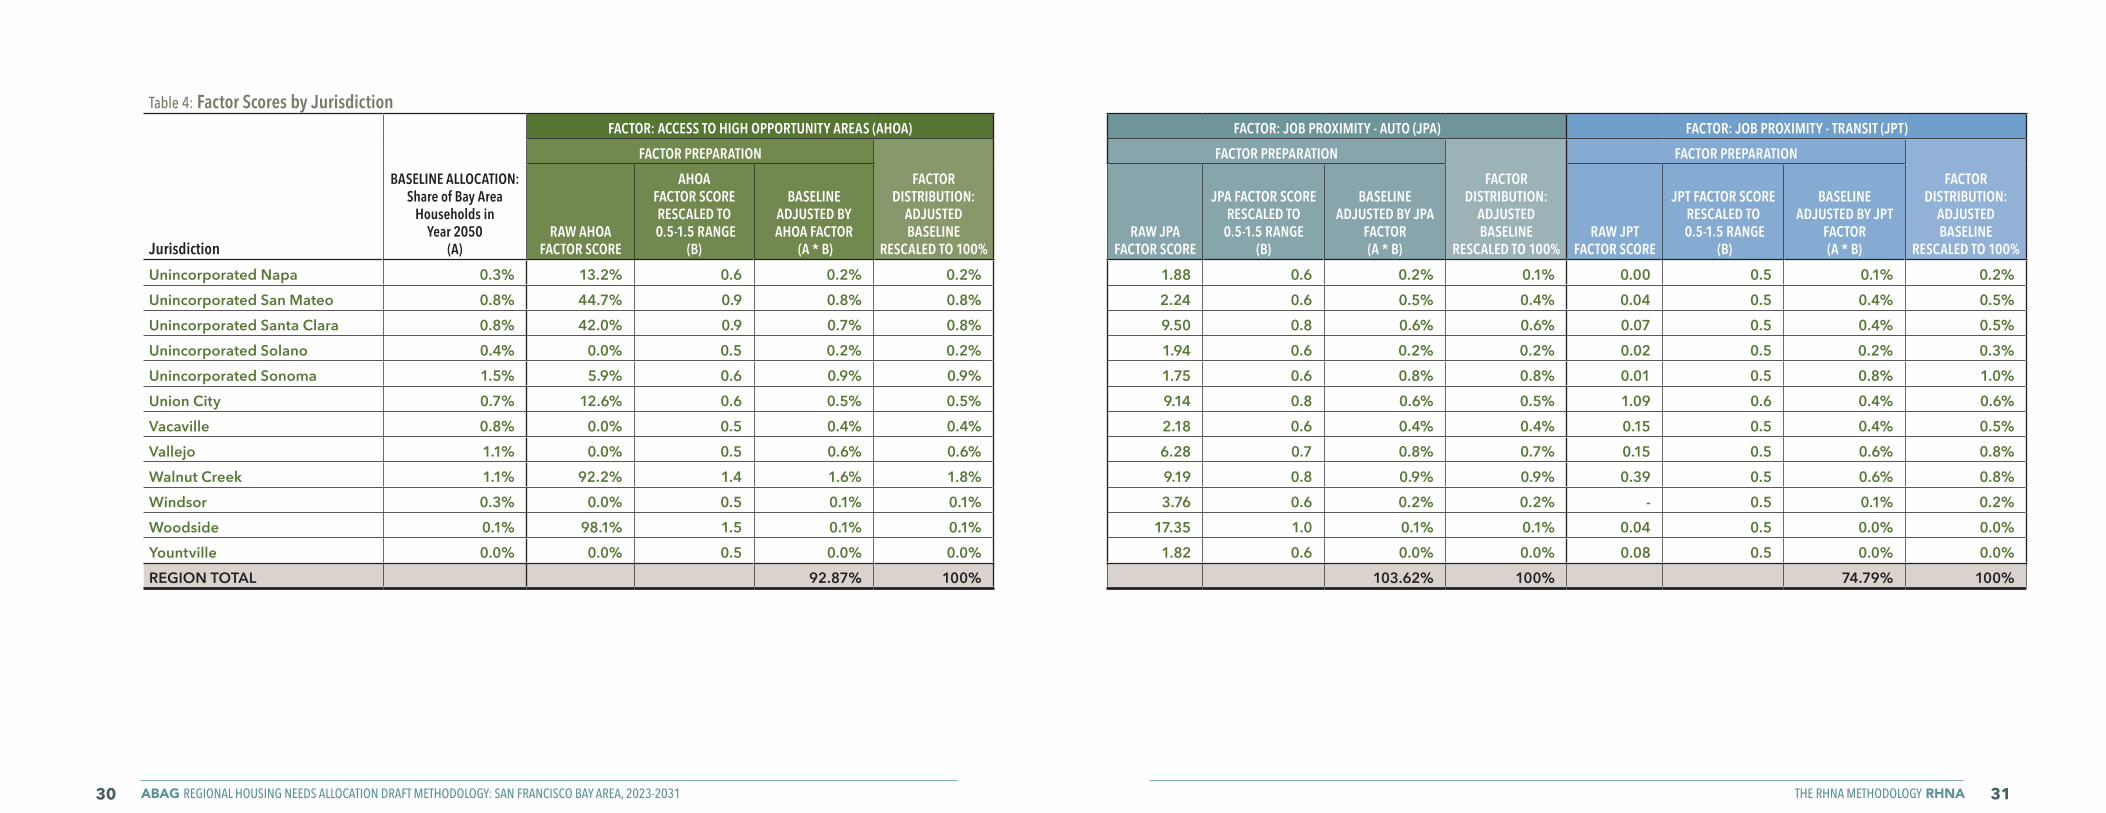
Table 4 (pages 20-31) shows the impact that each factor has on each jurisdiction’s baseline allocation from the Plan Bay Area 2050 Final Blueprint. Determining a factor’s impact starts with calculating the jurisdiction’s raw score for a factor. For Access to High Opportunity Areas, the raw score is the share of households in a jurisdiction in High or Highest Resource census tracts. The raw score for job proximity is the share of the region’s jobs that can be accessed from a jurisdiction in either a 30-minute auto or 45-minute transit commute. As noted previously,
a jurisdiction’s raw factor score is rescaled to a range of 0.5 to 1.5. Each jurisdiction’s baseline allocation is then multiplied by the scaled factor score. The final step is to adjust the scaled factor scores for all jurisdictions to ensure they sum to 100 percent.
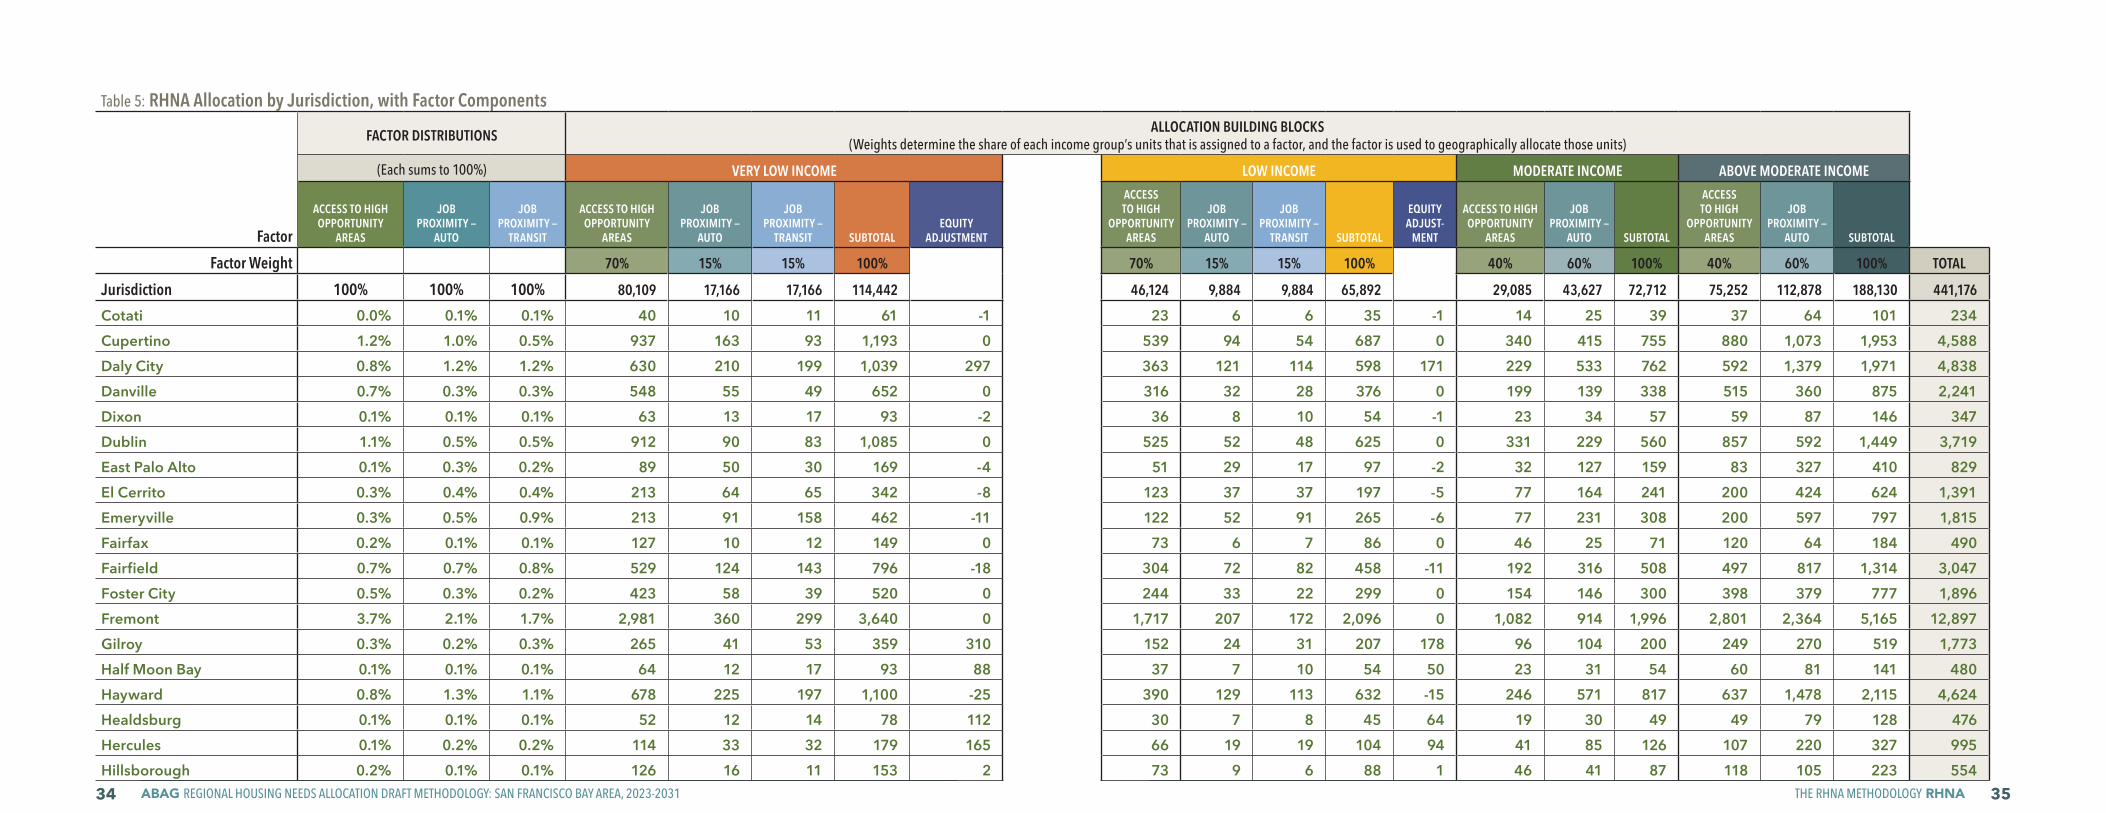
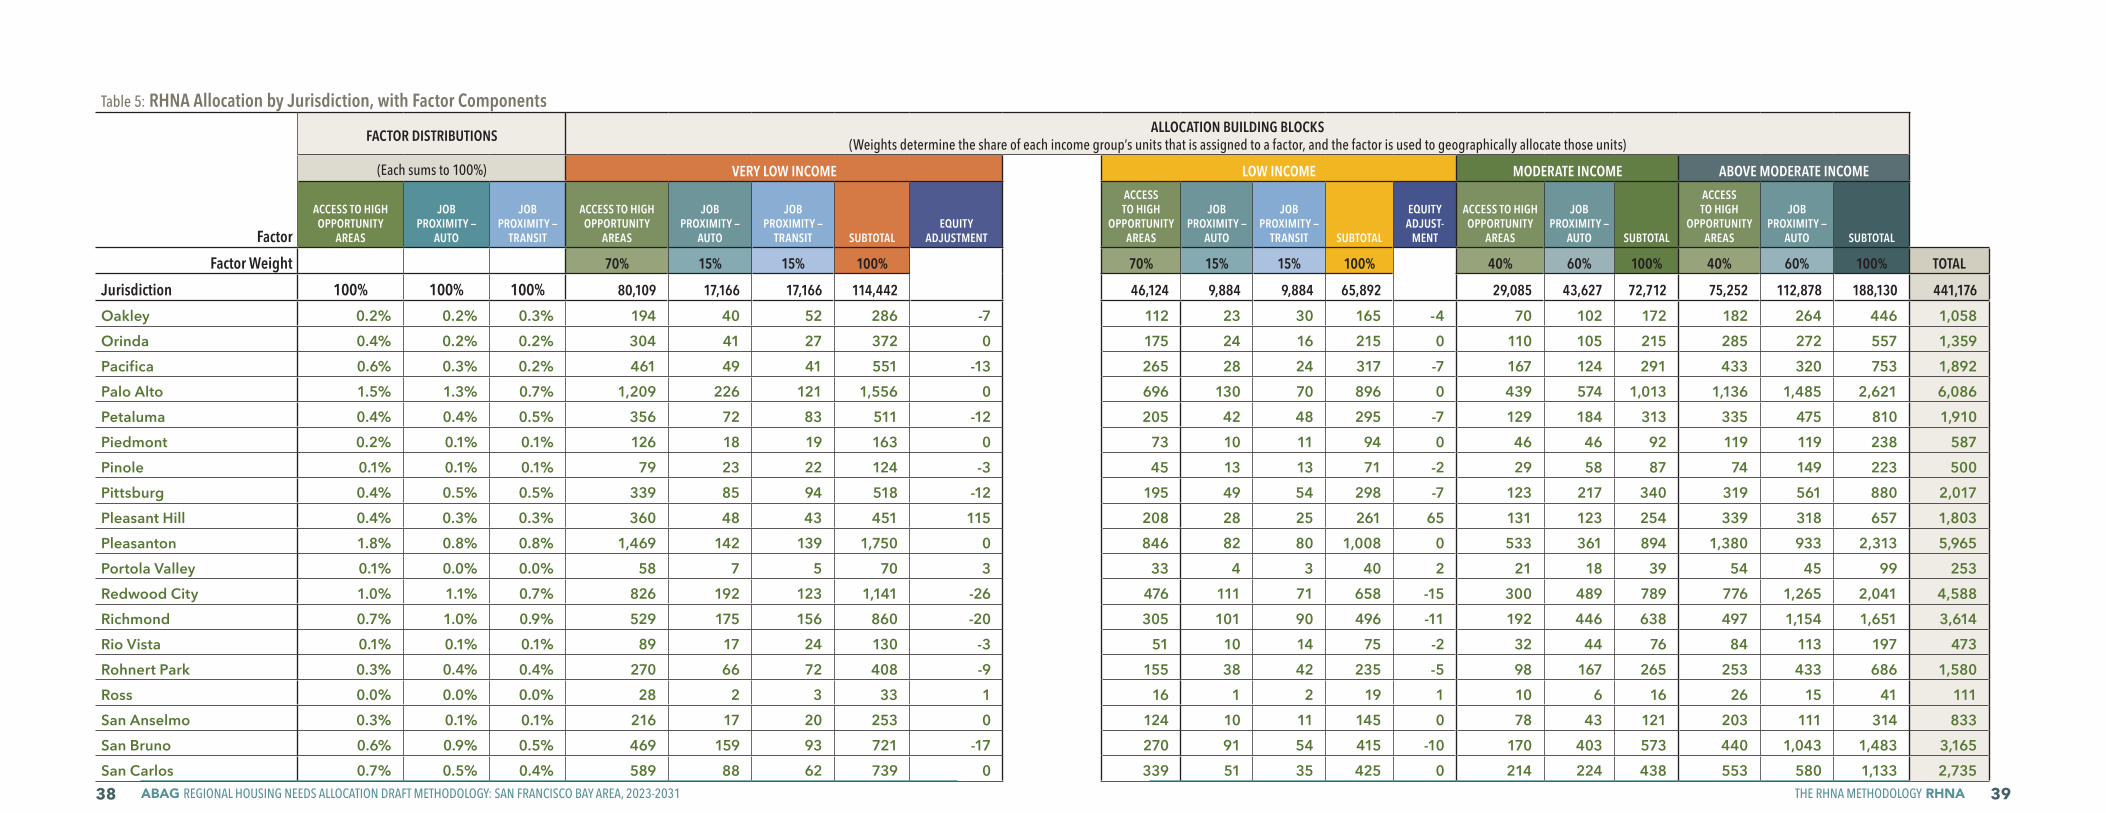
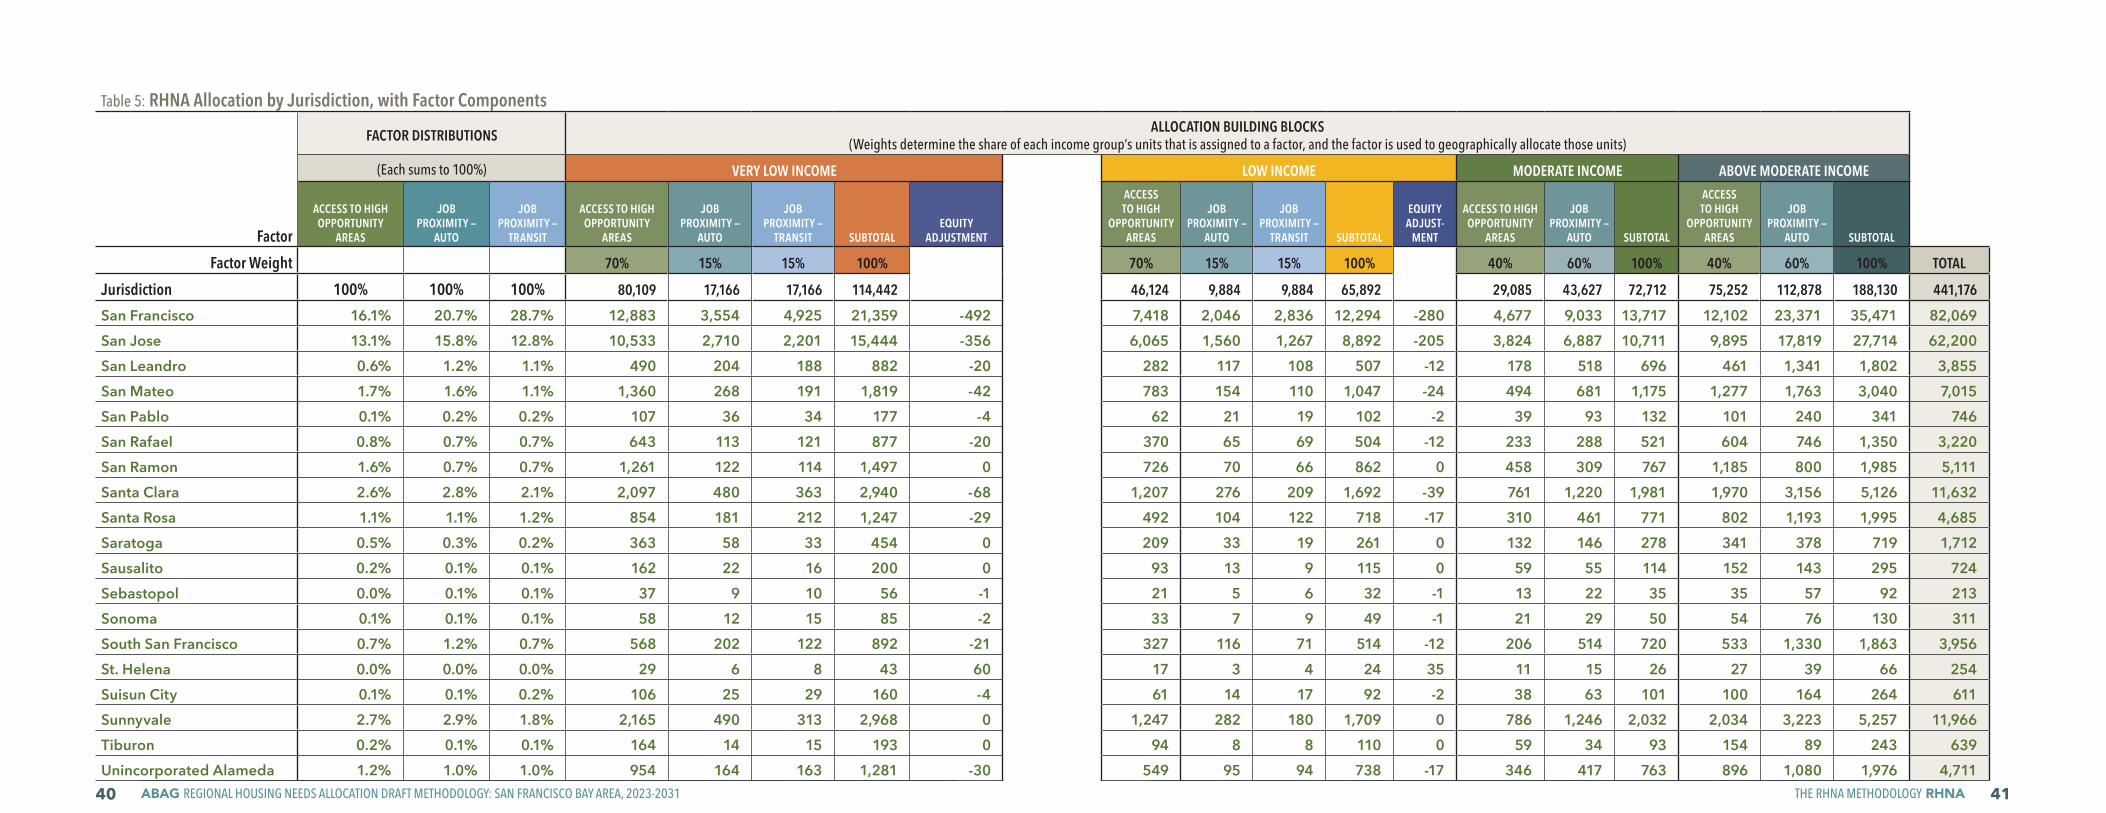
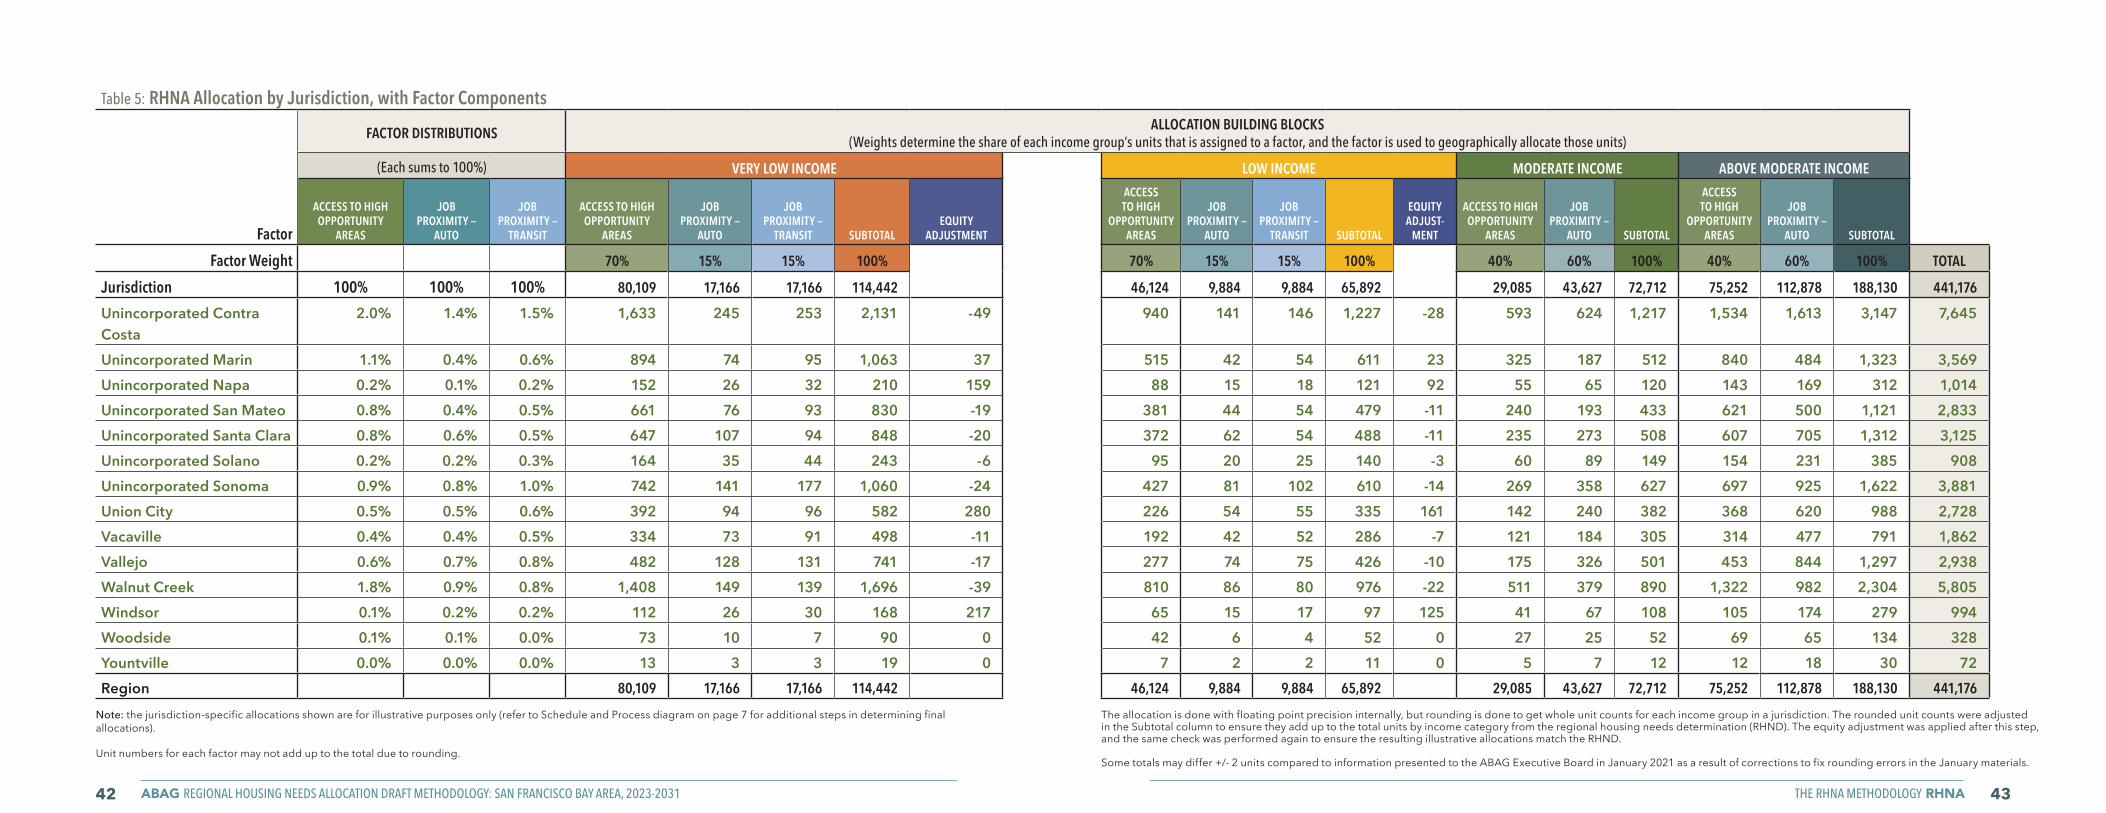
Table 5 (pages 32-43) shows the number of units, by income category, that each jurisdiction receives as a result of each factor in the methodology. This table also shows the impact of the equity adjustment on the very low- and low-income allocations for every jurisdiction.
Appendix 4 summarizes what each jurisdiction’s illustrative allocation would be by income category based on the draft RHNA methodology.
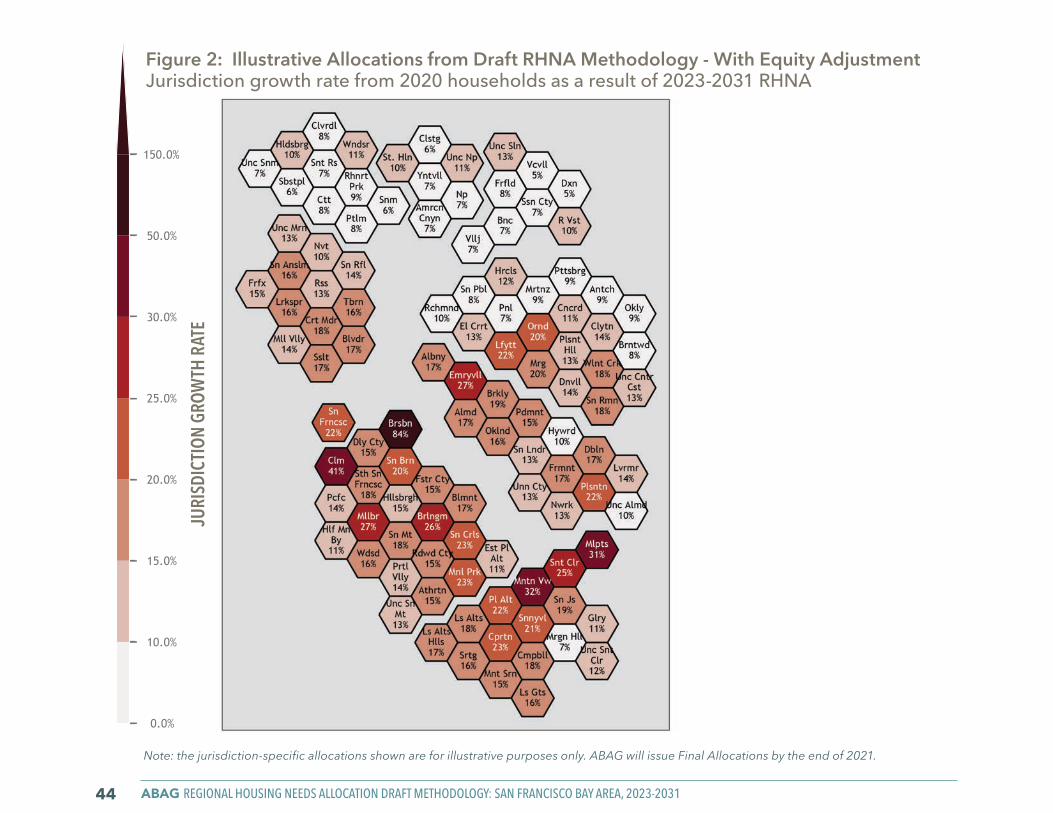
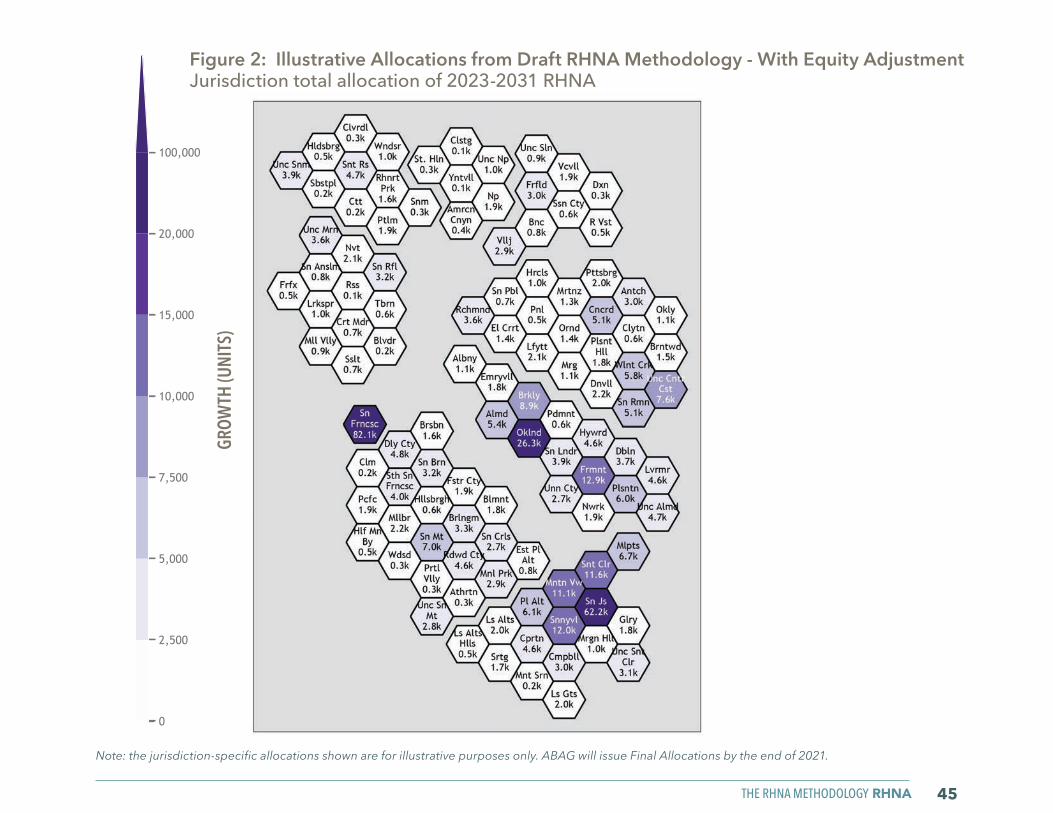
Figure 2 is maps (on pages 44-45) showing the distribution of RHNA units to Bay Area jurisdictions resulting from the draft RHNA methodology.
© Julio Cesar courtesy BRID
GE H
ousing. All Rights Reserved.
ABAG REGIONAL HOUSING NEEDS ALLOCATION DRAFT METHODOLOGY: SAN FRANCISCO BAY AREA, 2023-203120 THE RHNA METHODOLOGY RHNA 21
Table 4: Factor Scores by Jurisdiction
Jurisdiction
BASELINE ALLOCATION: Share of Bay Area
Households in Year 2050
(A)
FACTOR: ACCESS TO HIGH OPPORTUNITY AREAS (AHOA) FACTOR: JOB PROXIMITY - AUTO (JPA) FACTOR: JOB PROXIMITY - TRANSIT (JPT)FACTOR PREPARATION
FACTOR DISTRIBUTION:
ADJUSTED BASELINE
RESCALED TO 100%
FACTOR PREPARATIONFACTOR
DISTRIBUTION: ADJUSTED BASELINE
RESCALED TO 100%
FACTOR PREPARATIONFACTOR
DISTRIBUTION: ADJUSTED BASELINE
RESCALED TO 100%RAW AHOA
FACTOR SCORE
AHOAFACTOR SCORE RESCALED TO
0.5-1.5 RANGE(B)
BASELINE ADJUSTED BY AHOA FACTOR
(A * B)RAW JPA
FACTOR SCORE
JPA FACTOR SCORE RESCALED TO
0.5-1.5 RANGE(B)
BASELINE ADJUSTED BY JPA
FACTOR (A * B)
RAW JPT FACTOR SCORE
JPT FACTOR SCORE RESCALED TO
0.5-1.5 RANGE (B)
BASELINE ADJUSTED BY JPT
FACTOR (A * B)
Alameda 1.1% 65.8% 1.2 1.3% 1.4% 16.46 1.0 1.1% 1.1% 2.57 0.7 0.7% 1.0%
Albany 0.2% 84.5% 1.3 0.3% 0.3% 16.53 1.0 0.2% 0.2% 5.33 0.9 0.2% 0.2%
American Canyon 0.2% 0.0% 0.5 0.1% 0.1% 4.49 0.6 0.1% 0.1% - 0.5 0.1% 0.1%
Antioch 1.3% 0.0% 0.5 0.6% 0.7% 1.67 0.5 0.7% 0.7% 0.05 0.5 0.6% 0.9%
Atherton 0.1% 41.4% 0.9 0.1% 0.1% 21.08 1.2 0.1% 0.1% 1.83 0.6 0.0% 0.1%
Belmont 0.3% 100.0% 1.5 0.5% 0.5% 19.02 1.1 0.3% 0.3% 0.75 0.6 0.2% 0.2%
Belvedere 0.0% 100.0% 1.5 0.0% 0.1% 3.21 0.6 0.0% 0.0% - 0.5 0.0% 0.0%
Benicia 0.3% 11.8% 0.6 0.2% 0.2% 7.35 0.7 0.2% 0.2% 0.02 0.5 0.1% 0.2%
Berkeley 1.7% 73.0% 1.2 2.1% 2.3% 18.03 1.1 1.8% 1.7% 7.62 1.0 1.7% 2.3%
Brentwood 0.6% 0.0% 0.5 0.3% 0.3% 1.29 0.5 0.3% 0.3% - 0.5 0.3% 0.4%
Brisbane 0.4% 0.0% 0.5 0.2% 0.2% 26.70 1.3 0.6% 0.5% 0.11 0.5 0.2% 0.3%
Burlingame 0.5% 100.0% 1.5 0.8% 0.9% 21.88 1.2 0.6% 0.6% 0.77 0.6 0.3% 0.4%
Calistoga 0.1% 0.0% 0.5 0.0% 0.0% 0.50 0.5 0.0% 0.0% - 0.5 0.0% 0.0%
Campbell 0.6% 65.7% 1.2 0.7% 0.7% 23.85 1.2 0.7% 0.7% 3.07 0.7 0.4% 0.5%
Clayton 0.1% 100.0% 1.5 0.2% 0.2% 6.18 0.7 0.1% 0.1% 0.02 0.5 0.1% 0.1%
Cloverdale 0.1% 0.0% 0.5 0.1% 0.1% 0.40 0.5 0.1% 0.1% - 0.5 0.1% 0.1%
Colma 0.1% 0.0% 0.5 0.0% 0.0% 25.76 1.3 0.1% 0.1% 5.50 0.9 0.0% 0.1%
Concord 1.7% 11.2% 0.6 1.1% 1.1% 6.80 0.7 1.2% 1.2% 0.38 0.5 0.9% 1.2%
Corte Madera 0.1% 100.0% 1.5 0.2% 0.2% 7.99 0.7 0.1% 0.1% 0.73 0.6 0.1% 0.1%
ABAG REGIONAL HOUSING NEEDS ALLOCATION DRAFT METHODOLOGY: SAN FRANCISCO BAY AREA, 2023-203122 THE RHNA METHODOLOGY RHNA 23
Table 4: Factor Scores by Jurisdiction
Jurisdiction
BASELINE ALLOCATION: Share of Bay Area
Households in Year 2050
(A)
FACTOR: ACCESS TO HIGH OPPORTUNITY AREAS (AHOA) FACTOR: JOB PROXIMITY - AUTO (JPA) FACTOR: JOB PROXIMITY - TRANSIT (JPT)FACTOR PREPARATION
FACTOR DISTRIBUTION:
ADJUSTED BASELINE
RESCALED TO 100%
FACTOR PREPARATIONFACTOR
DISTRIBUTION: ADJUSTED BASELINE
RESCALED TO 100%
FACTOR PREPARATIONFACTOR
DISTRIBUTION: ADJUSTED BASELINE
RESCALED TO 100%RAW AHOA
FACTOR SCORE
AHOAFACTOR SCORE RESCALED TO
0.5-1.5 RANGE(B)
BASELINE ADJUSTED BY AHOA FACTOR
(A * B)RAW JPA
FACTOR SCORE
JPA FACTOR SCORE RESCALED TO
0.5-1.5 RANGE(B)
BASELINE ADJUSTED BY JPA
FACTOR (A * B)
RAW JPT FACTOR SCORE
JPT FACTOR SCORE RESCALED TO
0.5-1.5 RANGE (B)
BASELINE ADJUSTED BY JPT
FACTOR (A * B)
Cotati 0.1% 0.0% 0.5 0.0% 0.0% 4.45 0.6 0.1% 0.1% 0.00 0.5 0.0% 0.1%
Cupertino 0.7% 100.0% 1.5 1.1% 1.2% 27.57 1.4 1.0% 1.0% 0.87 0.6 0.4% 0.5%
Daly City 0.9% 27.3% 0.8 0.7% 0.8% 26.87 1.3 1.3% 1.2% 6.05 0.9 0.9% 1.2%
Danville 0.4% 100.0% 1.5 0.6% 0.7% 9.02 0.8 0.3% 0.3% 0.03 0.5 0.2% 0.3%
Dixon 0.1% 0.0% 0.5 0.1% 0.1% 1.70 0.6 0.1% 0.1% - 0.5 0.1% 0.1%
Dublin 0.7% 100.0% 1.5 1.1% 1.1% 8.73 0.8 0.5% 0.5% 0.22 0.5 0.4% 0.5%
East Palo Alto 0.2% 0.0% 0.5 0.1% 0.1% 30.67 1.5 0.3% 0.3% 1.90 0.6 0.1% 0.2%
El Cerrito 0.4% 11.0% 0.6 0.2% 0.3% 14.76 1.0 0.4% 0.4% 2.91 0.7 0.3% 0.4%
Emeryville 0.5% 0.0% 0.5 0.2% 0.3% 19.60 1.1 0.5% 0.5% 13.12 1.4 0.7% 0.9%
Fairfax 0.1% 100.0% 1.5 0.1% 0.2% 3.30 0.6 0.1% 0.1% 0.29 0.5 0.1% 0.1%
Fairfield 1.2% 0.0% 0.5 0.6% 0.7% 3.66 0.6 0.7% 0.7% 0.11 0.5 0.6% 0.8%
Foster City 0.3% 100.0% 1.5 0.5% 0.5% 18.05 1.1 0.3% 0.3% 0.23 0.5 0.2% 0.2%
Fremont 2.4% 92.0% 1.4 3.5% 3.7% 12.60 0.9 2.2% 2.1% 0.52 0.5 1.3% 1.7%
Gilroy 0.5% 16.6% 0.7 0.3% 0.3% 1.29 0.5 0.2% 0.2% 0.04 0.5 0.2% 0.3%
Half Moon Bay 0.1% 0.0% 0.5 0.1% 0.1% 0.20 0.5 0.1% 0.1% - 0.5 0.1% 0.1%
Hayward 1.6% 0.0% 0.5 0.8% 0.8% 11.69 0.9 1.4% 1.3% 0.66 0.5 0.9% 1.1%
Healdsburg 0.1% 0.0% 0.5 0.1% 0.1% 3.13 0.6 0.1% 0.1% 0.02 0.5 0.1% 0.1%
Hercules 0.3% 0.0% 0.5 0.1% 0.1% 8.49 0.8 0.2% 0.2% 0.45 0.5 0.1% 0.2%
Hillsborough 0.1% 100.0% 1.5 0.1% 0.2% 15.67 1.0 0.1% 0.1% 0.02 0.5 0.0% 0.1%
ABAG REGIONAL HOUSING NEEDS ALLOCATION DRAFT METHODOLOGY: SAN FRANCISCO BAY AREA, 2023-203124 THE RHNA METHODOLOGY RHNA 25
Table 4: Factor Scores by Jurisdiction
Jurisdiction
BASELINE ALLOCATION: Share of Bay Area
Households in Year 2050
(A)
FACTOR: ACCESS TO HIGH OPPORTUNITY AREAS (AHOA) FACTOR: JOB PROXIMITY - AUTO (JPA) FACTOR: JOB PROXIMITY - TRANSIT (JPT)FACTOR PREPARATION
FACTOR DISTRIBUTION:
ADJUSTED BASELINE
RESCALED TO 100%
FACTOR PREPARATIONFACTOR
DISTRIBUTION: ADJUSTED BASELINE
RESCALED TO 100%
FACTOR PREPARATIONFACTOR
DISTRIBUTION: ADJUSTED BASELINE
RESCALED TO 100%RAW AHOA
FACTOR SCORE
AHOAFACTOR SCORE RESCALED TO
0.5-1.5 RANGE(B)
BASELINE ADJUSTED BY AHOA FACTOR
(A * B)RAW JPA
FACTOR SCORE
JPA FACTOR SCORE RESCALED TO
0.5-1.5 RANGE(B)
BASELINE ADJUSTED BY JPA
FACTOR (A * B)
RAW JPT FACTOR SCORE
JPT FACTOR SCORE RESCALED TO
0.5-1.5 RANGE (B)
BASELINE ADJUSTED BY JPT
FACTOR (A * B)
Lafayette 0.4% 100.0% 1.5 0.6% 0.6% 13.39 0.9 0.3% 0.3% 0.58 0.5 0.2% 0.3%
Larkspur 0.2% 100.0% 1.5 0.3% 0.3% 6.56 0.7 0.1% 0.1% 0.66 0.5 0.1% 0.1%
Livermore 1.3% 37.3% 0.9 1.1% 1.2% 4.97 0.7 0.8% 0.8% 0.10 0.5 0.6% 0.9%
Los Altos 0.3% 100.0% 1.5 0.5% 0.5% 30.66 1.5 0.4% 0.4% 0.86 0.6 0.2% 0.2%
Los Altos Hills 0.1% 100.0% 1.5 0.1% 0.1% 29.82 1.4 0.1% 0.1% 0.00 0.5 0.0% 0.1%
Los Gatos 0.3% 100.0% 1.5 0.5% 0.5% 20.66 1.1 0.4% 0.4% 0.12 0.5 0.2% 0.2%
Martinez 0.4% 29.8% 0.8 0.3% 0.3% 8.95 0.8 0.3% 0.3% 0.15 0.5 0.2% 0.3%
Menlo Park 0.5% 84.8% 1.3 0.6% 0.7% 30.39 1.4 0.7% 0.7% 1.43 0.6 0.3% 0.4%
Mill Valley 0.2% 100.0% 1.5 0.2% 0.3% 6.63 0.7 0.1% 0.1% 0.27 0.5 0.1% 0.1%
Millbrae 0.4% 100.0% 1.5 0.5% 0.6% 26.43 1.3 0.5% 0.4% 0.81 0.6 0.2% 0.3%
Milpitas 1.3% 62.3% 1.1 1.4% 1.5% 25.69 1.3 1.6% 1.6% 2.59 0.7 0.9% 1.1%
Monte Sereno 0.0% 100.0% 1.5 0.0% 0.1% 21.40 1.2 0.0% 0.0% 0.01 0.5 0.0% 0.0%
Moraga 0.2% 100.0% 1.5 0.3% 0.3% 12.40 0.9 0.2% 0.2% 0.27 0.5 0.1% 0.1%
Morgan Hill 0.4% 0.0% 0.5 0.2% 0.2% 4.42 0.6 0.3% 0.3% 0.15 0.5 0.2% 0.3%
Mountain View 1.8% 92.5% 1.4 2.5% 2.7% 31.81 1.5 2.6% 2.5% 1.74 0.6 1.1% 1.5%
Napa 0.8% 2.8% 0.5 0.4% 0.4% 3.02 0.6 0.5% 0.4% 0.24 0.5 0.4% 0.5%
Newark 0.6% 11.4% 0.6 0.4% 0.4% 9.20 0.8 0.5% 0.5% 0.39 0.5 0.3% 0.4%
Novato 0.7% 25.2% 0.8 0.5% 0.5% 3.81 0.6 0.4% 0.4% 0.06 0.5 0.3% 0.5%
Oakland 6.3% 24.3% 0.7 4.7% 5.1% 19.81 1.1 7.1% 6.8% 7.04 1.0 6.2% 8.3%
ABAG REGIONAL HOUSING NEEDS ALLOCATION DRAFT METHODOLOGY: SAN FRANCISCO BAY AREA, 2023-203126 THE RHNA METHODOLOGY RHNA 27
Table 4: Factor Scores by Jurisdiction
Jurisdiction
BASELINE ALLOCATION: Share of Bay Area
Households in Year 2050
(A)
FACTOR: ACCESS TO HIGH OPPORTUNITY AREAS (AHOA) FACTOR: JOB PROXIMITY - AUTO (JPA) FACTOR: JOB PROXIMITY - TRANSIT (JPT)FACTOR PREPARATION
FACTOR DISTRIBUTION:
ADJUSTED BASELINE
RESCALED TO 100%
FACTOR PREPARATIONFACTOR
DISTRIBUTION: ADJUSTED BASELINE
RESCALED TO 100%
FACTOR PREPARATIONFACTOR
DISTRIBUTION: ADJUSTED BASELINE
RESCALED TO 100%RAW AHOA
FACTOR SCORE
AHOAFACTOR SCORE RESCALED TO
0.5-1.5 RANGE(B)
BASELINE ADJUSTED BY AHOA FACTOR
(A * B)RAW JPA
FACTOR SCORE
JPA FACTOR SCORE RESCALED TO
0.5-1.5 RANGE(B)
BASELINE ADJUSTED BY JPA
FACTOR (A * B)
RAW JPT FACTOR SCORE
JPT FACTOR SCORE RESCALED TO
0.5-1.5 RANGE (B)
BASELINE ADJUSTED BY JPT
FACTOR (A * B)
Oakley 0.5% 0.0% 0.5 0.2% 0.2% 1.36 0.5 0.2% 0.2% 0.00 0.5 0.2% 0.3%
Orinda 0.2% 100.0% 1.5 0.4% 0.4% 18.14 1.1 0.3% 0.2% 0.07 0.5 0.1% 0.2%
Pacifica 0.4% 100.0% 1.5 0.5% 0.6% 10.51 0.8 0.3% 0.3% 0.11 0.5 0.2% 0.2%Palo Alto 0.9% 100.0% 1.5 1.4% 1.5% 30.66 1.5 1.4% 1.3% 0.94 0.6 0.5% 0.7%Petaluma 0.7% 7.7% 0.6 0.4% 0.4% 3.58 0.6 0.4% 0.4% 0.05 0.5 0.4% 0.5%Piedmont 0.1% 100.0% 1.5 0.1% 0.2% 19.88 1.1 0.1% 0.1% 4.84 0.8 0.1% 0.1%Pinole 0.2% 0.0% 0.5 0.1% 0.1% 8.07 0.7 0.1% 0.1% 0.41 0.5 0.1% 0.1%Pittsburg 0.8% 0.0% 0.5 0.4% 0.4% 5.05 0.7 0.5% 0.5% 0.33 0.5 0.4% 0.5%Pleasant Hill 0.4% 63.6% 1.1 0.4% 0.4% 9.50 0.8 0.3% 0.3% 0.19 0.5 0.2% 0.3%Pleasanton 1.1% 100.0% 1.5 1.7% 1.8% 8.21 0.8 0.9% 0.8% 0.51 0.5 0.6% 0.8%Portola Valley 0.0% 100.0% 1.5 0.1% 0.1% 13.91 0.9 0.0% 0.0% - 0.5 0.0% 0.0%Redwood City 1.0% 47.3% 1.0 1.0% 1.0% 21.78 1.2 1.2% 1.1% 0.67 0.5 0.5% 0.7%Richmond 1.2% 0.0% 0.5 0.6% 0.7% 11.67 0.9 1.1% 1.0% 0.76 0.6 0.7% 0.9%Rio Vista 0.2% 0.0% 0.5 0.1% 0.1% 0.10 0.5 0.1% 0.1% - 0.5 0.1% 0.1%Rohnert Park 0.6% 0.0% 0.5 0.3% 0.3% 4.45 0.6 0.4% 0.4% 0.07 0.5 0.3% 0.4%Ross 0.0% 100.0% 1.5 0.0% 0.0% 4.21 0.6 0.0% 0.0% 0.59 0.5 0.0% 0.0%San Anselmo 0.2% 100.0% 1.5 0.3% 0.3% 3.55 0.6 0.1% 0.1% 0.23 0.5 0.1% 0.1%San Bruno 0.7% 24.4% 0.7 0.5% 0.6% 25.95 1.3 1.0% 0.9% 0.80 0.6 0.4% 0.5%San Carlos 0.5% 100.0% 1.5 0.7% 0.7% 21.43 1.2 0.5% 0.5% 1.31 0.6 0.3% 0.4%San Francisco 14.3% 54.4% 1.0 14.9% 16.1% 31.99 1.5 21.5% 20.7% 14.56 1.5 21.5% 28.7%

ABAG REGIONAL HOUSING NEEDS ALLOCATION DRAFT METHODOLOGY: SAN FRANCISCO BAY AREA, 2023-203128 THE RHNA METHODOLOGY RHNA 29
Table 4: Factor Scores by Jurisdiction
Jurisdiction
BASELINE ALLOCATION: Share of Bay Area
Households in Year 2050
(A)
FACTOR: ACCESS TO HIGH OPPORTUNITY AREAS (AHOA) FACTOR: JOB PROXIMITY - AUTO (JPA) FACTOR: JOB PROXIMITY - TRANSIT (JPT)FACTOR PREPARATION
FACTOR DISTRIBUTION:
ADJUSTED BASELINE
RESCALED TO 100%
FACTOR PREPARATIONFACTOR
DISTRIBUTION: ADJUSTED BASELINE
RESCALED TO 100%
FACTOR PREPARATIONFACTOR
DISTRIBUTION: ADJUSTED BASELINE
RESCALED TO 100%RAW AHOA
FACTOR SCORE
AHOAFACTOR SCORE RESCALED TO
0.5-1.5 RANGE(B)
BASELINE ADJUSTED BY AHOA FACTOR
(A * B)RAW JPA
FACTOR SCORE
JPA FACTOR SCORE RESCALED TO
0.5-1.5 RANGE(B)
BASELINE ADJUSTED BY JPA
FACTOR (A * B)
RAW JPT FACTOR SCORE
JPT FACTOR SCORE RESCALED TO
0.5-1.5 RANGE (B)
BASELINE ADJUSTED BY JPT
FACTOR (A * B)
San Jose 14.4% 34.7% 0.8 12.2% 13.1% 20.32 1.1 16.4% 15.8% 2.40 0.7 9.6% 12.8%San Leandro 1.1% 0.0% 0.5 0.6% 0.6% 18.69 1.1 1.2% 1.2% 3.22 0.7 0.8% 1.1%San Mateo 1.4% 61.1% 1.1 1.6% 1.7% 20.53 1.1 1.6% 1.6% 1.25 0.6 0.8% 1.1%San Pablo 0.2% 0.0% 0.5 0.1% 0.1% 12.43 0.9 0.2% 0.2% 1.30 0.6 0.1% 0.2%San Rafael 1.0% 21.1% 0.7 0.7% 0.8% 4.97 0.7 0.7% 0.7% 0.02 0.5 0.5% 0.7%San Ramon 1.0% 100.0% 1.5 1.5% 1.6% 8.18 0.8 0.7% 0.7% 0.16 0.5 0.5% 0.7%Santa Clara 2.1% 63.9% 1.1 2.4% 2.6% 27.44 1.4 2.9% 2.8% 3.49 0.7 1.6% 2.1%Santa Rosa 1.7% 6.7% 0.6 1.0% 1.1% 4.17 0.6 1.1% 1.1% 0.42 0.5 0.9% 1.2%Saratoga 0.3% 100.0% 1.5 0.4% 0.5% 23.69 1.2 0.3% 0.3% 0.19 0.5 0.1% 0.2%Sausalito 0.1% 100.0% 1.5 0.2% 0.2% 17.73 1.1 0.1% 0.1% 0.68 0.5 0.1% 0.1%Sebastopol 0.1% 0.0% 0.5 0.0% 0.0% 3.67 0.6 0.1% 0.1% 0.00 0.5 0.0% 0.1%Sonoma 0.1% 0.0% 0.5 0.1% 0.1% 0.84 0.5 0.1% 0.1% - 0.5 0.1% 0.1%South San Francisco 0.9% 20.8% 0.7 0.7% 0.7% 26.06 1.3 1.2% 1.2% 1.08 0.6 0.5% 0.7%St. Helena 0.1% 0.0% 0.5 0.0% 0.0% 1.08 0.5 0.0% 0.0% - 0.5 0.0% 0.0%Suisun City 0.2% 0.0% 0.5 0.1% 0.1% 3.69 0.6 0.2% 0.1% 0.22 0.5 0.1% 0.2%Sunnyvale 2.1% 70.2% 1.2 2.5% 2.7% 29.36 1.4 3.0% 2.9% 2.22 0.7 1.4% 1.8%Tiburon 0.1% 100.0% 1.5 0.2% 0.2% 4.76 0.6 0.1% 0.1% 0.03 0.5 0.1% 0.1%Unincorporated Alameda 1.4% 27.9% 0.8 1.1% 1.2% 6.43 0.7 1.0% 1.0% 0.02 0.5 0.7% 1.0%Unincorporated Contra Costa 2.2% 35.9% 0.9 1.9% 2.0% 5.60 0.7 1.5% 1.4% 0.01 0.5 1.1% 1.5%Unincorporated Marin 0.8% 76.1% 1.3 1.0% 1.1% 1.39 0.5 0.4% 0.4% 0.02 0.5 0.4% 0.6%
ABAG REGIONAL HOUSING NEEDS ALLOCATION DRAFT METHODOLOGY: SAN FRANCISCO BAY AREA, 2023-203130 THE RHNA METHODOLOGY RHNA 31
Table 4: Factor Scores by Jurisdiction
Jurisdiction
BASELINE ALLOCATION: Share of Bay Area
Households in Year 2050
(A)
FACTOR: ACCESS TO HIGH OPPORTUNITY AREAS (AHOA) FACTOR: JOB PROXIMITY - AUTO (JPA) FACTOR: JOB PROXIMITY - TRANSIT (JPT)FACTOR PREPARATION
FACTOR DISTRIBUTION:
ADJUSTED BASELINE
RESCALED TO 100%
FACTOR PREPARATIONFACTOR
DISTRIBUTION: ADJUSTED BASELINE
RESCALED TO 100%
FACTOR PREPARATIONFACTOR
DISTRIBUTION: ADJUSTED BASELINE
RESCALED TO 100%RAW AHOA
FACTOR SCORE
AHOAFACTOR SCORE RESCALED TO
0.5-1.5 RANGE(B)
BASELINE ADJUSTED BY AHOA FACTOR
(A * B)RAW JPA
FACTOR SCORE
JPA FACTOR SCORE RESCALED TO
0.5-1.5 RANGE(B)
BASELINE ADJUSTED BY JPA
FACTOR (A * B)
RAW JPT FACTOR SCORE
JPT FACTOR SCORE RESCALED TO
0.5-1.5 RANGE (B)
BASELINE ADJUSTED BY JPT
FACTOR (A * B)
Unincorporated Napa 0.3% 13.2% 0.6 0.2% 0.2% 1.88 0.6 0.2% 0.1% 0.00 0.5 0.1% 0.2%Unincorporated San Mateo 0.8% 44.7% 0.9 0.8% 0.8% 2.24 0.6 0.5% 0.4% 0.04 0.5 0.4% 0.5%Unincorporated Santa Clara 0.8% 42.0% 0.9 0.7% 0.8% 9.50 0.8 0.6% 0.6% 0.07 0.5 0.4% 0.5%Unincorporated Solano 0.4% 0.0% 0.5 0.2% 0.2% 1.94 0.6 0.2% 0.2% 0.02 0.5 0.2% 0.3%Unincorporated Sonoma 1.5% 5.9% 0.6 0.9% 0.9% 1.75 0.6 0.8% 0.8% 0.01 0.5 0.8% 1.0%Union City 0.7% 12.6% 0.6 0.5% 0.5% 9.14 0.8 0.6% 0.5% 1.09 0.6 0.4% 0.6%Vacaville 0.8% 0.0% 0.5 0.4% 0.4% 2.18 0.6 0.4% 0.4% 0.15 0.5 0.4% 0.5%Vallejo 1.1% 0.0% 0.5 0.6% 0.6% 6.28 0.7 0.8% 0.7% 0.15 0.5 0.6% 0.8%Walnut Creek 1.1% 92.2% 1.4 1.6% 1.8% 9.19 0.8 0.9% 0.9% 0.39 0.5 0.6% 0.8%Windsor 0.3% 0.0% 0.5 0.1% 0.1% 3.76 0.6 0.2% 0.2% - 0.5 0.1% 0.2%Woodside 0.1% 98.1% 1.5 0.1% 0.1% 17.35 1.0 0.1% 0.1% 0.04 0.5 0.0% 0.0%Yountville 0.0% 0.0% 0.5 0.0% 0.0% 1.82 0.6 0.0% 0.0% 0.08 0.5 0.0% 0.0%REGION TOTAL 92.87% 100% 103.62% 100% 74.79% 100%

ABAG REGIONAL HOUSING NEEDS ALLOCATION DRAFT METHODOLOGY: SAN FRANCISCO BAY AREA, 2023-203132 THE RHNA METHODOLOGY RHNA 33
Table 5: RHNA Allocation by Jurisdiction, with Factor Components
FACTOR DISTRIBUTIONS ALLOCATION BUILDING BLOCKS(Weights determine the share of each income group’s units that is assigned to a factor, and the factor is used to geographically allocate those units)
(Each sums to 100%) VERY LOW INCOME LOW INCOME MODERATE INCOME ABOVE MODERATE INCOME
Factor
ACCESS TO HIGHOPPORTUNITY
AREAS
JOB PROXIMITY —
AUTO
JOB PROXIMITY —
TRANSIT
ACCESS TO HIGH OPPORTUNITY
AREAS
JOB PROXIMITY —
AUTO
JOB PROXIMITY —
TRANSIT SUBTOTALEQUITY
ADJUSTMENT
ACCESS TO HIGH
OPPORTUNITY AREAS
JOB PROXIMITY —
AUTO
JOB PROXIMITY —
TRANSIT SUBTOTAL
EQUITY ADJUST-
MENT
ACCESS TO HIGH OPPORTUNITY
AREAS
JOB PROXIMITY —
AUTO SUBTOTAL
ACCESS TO HIGH
OPPORTUNITY AREAS
JOB PROXIMITY —
AUTO SUBTOTAL
Factor Weight 70% 15% 15% 100% 70% 15% 15% 100% 40% 60% 100% 40% 60% 100% TOTAL
Jurisdiction 100% 100% 100% 80,109 17,166 17,166 114,442 46,124 9,884 9,884 65,892 29,085 43,627 72,712 75,252 112,878 188,130 441,176 Alameda 1.4% 1.1% 1.0% 1,099 185 171 1,455 -34 633 106 98 837 -19 399 469 868 1,032 1,214 2,246 5,353 Albany 0.3% 0.2% 0.2% 239 35 41 315 -7 138 20 24 182 -4 87 88 175 225 228 453 1,114 American Canyon 0.1% 0.1% 0.1% 76 19 20 115 -3 44 11 12 67 -2 28 47 75 71 123 194 446 Antioch 0.7% 0.7% 0.9% 548 116 147 811 -19 315 67 85 467 -11 199 294 493 515 760 1,275 3,016 Atherton 0.1% 0.1% 0.1% 57 14 10 81 13 33 8 6 47 7 21 35 56 53 91 144 348 Belmont 0.5% 0.3% 0.2% 394 55 39 488 0 227 32 22 281 0 143 140 283 370 363 733 1,785 Belvedere 0.1% 0.0% 0.0% 42 3 4 49 0 24 2 2 28 0 15 8 23 39 21 60 160 Benicia 0.2% 0.2% 0.2% 144 33 31 208 -5 83 19 18 120 -3 52 83 135 136 215 351 806 Berkeley 2.3% 1.7% 2.3% 1,805 299 400 2,504 -58 1,039 172 230 1,441 -33 655 761 1,416 1,696 1,968 3,664 8,934 Brentwood 0.3% 0.3% 0.4% 279 58 74 411 -9 161 33 43 237 -5 101 146 247 262 379 641 1,522 Brisbane 0.2% 0.5% 0.3% 182 93 49 324 -7 105 54 28 187 -4 66 237 303 171 614 785 1,588 Burlingame 0.9% 0.6% 0.4% 707 107 69 883 -20 407 62 40 509 -12 257 272 529 664 704 1,368 3,257 Calistoga 0.0% 0.0% 0.0% 22 4 6 32 -1 13 3 3 19 0 8 11 19 21 29 50 119 Campbell 0.7% 0.7% 0.5% 562 116 92 770 -18 324 67 53 444 -10 204 295 499 528 764 1,292 2,977 Clayton 0.2% 0.1% 0.1% 144 13 13 170 0 83 7 7 97 0 52 32 84 135 84 219 570 Cloverdale 0.1% 0.1% 0.1% 52 10 14 76 -2 30 6 8 44 -1 19 26 45 49 67 116 278 Colma 0.0% 0.1% 0.1% 23 11 11 45 -1 13 7 6 26 -1 8 29 37 21 75 96 202 Concord 1.1% 1.2% 1.2% 911 203 208 1,322 -30 525 117 120 762 -18 331 516 847 856 1,334 2,190 5,073 Corte Madera 0.2% 0.1% 0.1% 179 17 17 213 0 103 10 10 123 0 65 43 108 168 113 281 725
ABAG REGIONAL HOUSING NEEDS ALLOCATION DRAFT METHODOLOGY: SAN FRANCISCO BAY AREA, 2023-203134 THE RHNA METHODOLOGY RHNA 35
Table 5: RHNA Allocation by Jurisdiction, with Factor Components
FACTOR DISTRIBUTIONS ALLOCATION BUILDING BLOCKS(Weights determine the share of each income group’s units that is assigned to a factor, and the factor is used to geographically allocate those units)
(Each sums to 100%) VERY LOW INCOME LOW INCOME MODERATE INCOME ABOVE MODERATE INCOME
Factor
ACCESS TO HIGHOPPORTUNITY
AREAS
JOB PROXIMITY —
AUTO
JOB PROXIMITY —
TRANSIT
ACCESS TO HIGH OPPORTUNITY
AREAS
JOB PROXIMITY —
AUTO
JOB PROXIMITY —
TRANSIT SUBTOTALEQUITY
ADJUSTMENT
ACCESS TO HIGH
OPPORTUNITY AREAS
JOB PROXIMITY —
AUTO
JOB PROXIMITY —
TRANSIT SUBTOTAL
EQUITY ADJUST-
MENT
ACCESS TO HIGH OPPORTUNITY
AREAS
JOB PROXIMITY —
AUTO SUBTOTAL
ACCESS TO HIGH
OPPORTUNITY AREAS
JOB PROXIMITY —
AUTO SUBTOTAL
Factor Weight 70% 15% 15% 100% 70% 15% 15% 100% 40% 60% 100% 40% 60% 100% TOTAL
Jurisdiction 100% 100% 100% 80,109 17,166 17,166 114,442 46,124 9,884 9,884 65,892 29,085 43,627 72,712 75,252 112,878 188,130 441,176 Cotati 0.0% 0.1% 0.1% 40 10 11 61 -1 23 6 6 35 -1 14 25 39 37 64 101 234 Cupertino 1.2% 1.0% 0.5% 937 163 93 1,193 0 539 94 54 687 0 340 415 755 880 1,073 1,953 4,588 Daly City 0.8% 1.2% 1.2% 630 210 199 1,039 297 363 121 114 598 171 229 533 762 592 1,379 1,971 4,838 Danville 0.7% 0.3% 0.3% 548 55 49 652 0 316 32 28 376 0 199 139 338 515 360 875 2,241 Dixon 0.1% 0.1% 0.1% 63 13 17 93 -2 36 8 10 54 -1 23 34 57 59 87 146 347 Dublin 1.1% 0.5% 0.5% 912 90 83 1,085 0 525 52 48 625 0 331 229 560 857 592 1,449 3,719 East Palo Alto 0.1% 0.3% 0.2% 89 50 30 169 -4 51 29 17 97 -2 32 127 159 83 327 410 829 El Cerrito 0.3% 0.4% 0.4% 213 64 65 342 -8 123 37 37 197 -5 77 164 241 200 424 624 1,391 Emeryville 0.3% 0.5% 0.9% 213 91 158 462 -11 122 52 91 265 -6 77 231 308 200 597 797 1,815 Fairfax 0.2% 0.1% 0.1% 127 10 12 149 0 73 6 7 86 0 46 25 71 120 64 184 490 Fairfield 0.7% 0.7% 0.8% 529 124 143 796 -18 304 72 82 458 -11 192 316 508 497 817 1,314 3,047 Foster City 0.5% 0.3% 0.2% 423 58 39 520 0 244 33 22 299 0 154 146 300 398 379 777 1,896 Fremont 3.7% 2.1% 1.7% 2,981 360 299 3,640 0 1,717 207 172 2,096 0 1,082 914 1,996 2,801 2,364 5,165 12,897 Gilroy 0.3% 0.2% 0.3% 265 41 53 359 310 152 24 31 207 178 96 104 200 249 270 519 1,773 Half Moon Bay 0.1% 0.1% 0.1% 64 12 17 93 88 37 7 10 54 50 23 31 54 60 81 141 480 Hayward 0.8% 1.3% 1.1% 678 225 197 1,100 -25 390 129 113 632 -15 246 571 817 637 1,478 2,115 4,624 Healdsburg 0.1% 0.1% 0.1% 52 12 14 78 112 30 7 8 45 64 19 30 49 49 79 128 476 Hercules 0.1% 0.2% 0.2% 114 33 32 179 165 66 19 19 104 94 41 85 126 107 220 327 995 Hillsborough 0.2% 0.1% 0.1% 126 16 11 153 2 73 9 6 88 1 46 41 87 118 105 223 554

ABAG REGIONAL HOUSING NEEDS ALLOCATION DRAFT METHODOLOGY: SAN FRANCISCO BAY AREA, 2023-203136 THE RHNA METHODOLOGY RHNA 37
Table 5: RHNA Allocation by Jurisdiction, with Factor Components
FACTOR DISTRIBUTIONS ALLOCATION BUILDING BLOCKS(Weights determine the share of each income group’s units that is assigned to a factor, and the factor is used to geographically allocate those units)
(Each sums to 100%) VERY LOW INCOME LOW INCOME MODERATE INCOME ABOVE MODERATE INCOME
Factor
ACCESS TO HIGHOPPORTUNITY
AREAS
JOB PROXIMITY —
AUTO
JOB PROXIMITY —
TRANSIT
ACCESS TO HIGH OPPORTUNITY
AREAS
JOB PROXIMITY —
AUTO
JOB PROXIMITY —
TRANSIT SUBTOTALEQUITY
ADJUSTMENT
ACCESS TO HIGH
OPPORTUNITY AREAS
JOB PROXIMITY —
AUTO
JOB PROXIMITY —
TRANSIT SUBTOTAL
EQUITY ADJUST-
MENT
ACCESS TO HIGH OPPORTUNITY
AREAS
JOB PROXIMITY —
AUTO SUBTOTAL
ACCESS TO HIGH
OPPORTUNITY AREAS
JOB PROXIMITY —
AUTO SUBTOTAL
Factor Weight 70% 15% 15% 100% 70% 15% 15% 100% 40% 60% 100% 40% 60% 100% TOTAL
Jurisdiction 100% 100% 100% 80,109 17,166 17,166 114,442 46,124 9,884 9,884 65,892 29,085 43,627 72,712 75,252 112,878 188,130 441,176 Lafayette 0.6% 0.3% 0.3% 494 58 47 599 0 284 33 27 344 0 179 147 326 464 381 845 2,114 Larkspur 0.3% 0.1% 0.1% 245 22 24 291 0 141 13 14 168 0 89 56 145 230 145 375 979 Livermore 1.2% 0.8% 0.9% 955 137 148 1,240 77 550 79 85 714 44 347 349 696 897 902 1,799 4,570 Los Altos 0.5% 0.4% 0.2% 389 73 39 501 0 224 42 22 288 0 141 185 326 365 478 843 1,958 Los Altos Hills 0.1% 0.1% 0.1% 98 18 9 125 0 57 10 5 72 0 36 46 82 92 118 210 489 Los Gatos 0.5% 0.4% 0.2% 434 64 39 537 0 250 37 23 310 0 158 162 320 408 418 826 1,993 Martinez 0.3% 0.3% 0.3% 264 49 45 358 -8 152 28 26 206 -5 96 125 221 248 325 573 1,345 Menlo Park 0.7% 0.7% 0.4% 559 115 66 740 0 322 66 38 426 0 203 293 496 525 759 1,284 2,946 Mill Valley 0.3% 0.1% 0.1% 213 19 20 252 10 122 11 11 144 7 77 49 126 200 126 326 865 Millbrae 0.6% 0.4% 0.3% 453 77 45 575 0 261 44 26 331 0 165 196 361 426 506 932 2,199 Milpitas 1.5% 1.6% 1.1% 1,218 271 196 1,685 0 701 156 113 970 0 442 689 1,131 1,144 1,783 2,927 6,713 Monte Sereno 0.1% 0.0% 0.0% 41 6 4 51 2 24 4 2 30 0 15 16 31 39 40 79 193 Moraga 0.3% 0.2% 0.1% 264 30 24 318 0 152 17 14 183 0 96 76 172 248 197 445 1,118 Morgan Hill 0.2% 0.3% 0.3% 177 43 48 268 -6 102 25 28 155 -4 64 110 174 166 284 450 1,037 Mountain View 2.7% 2.5% 1.5% 2,155 434 249 2,838 -65 1,241 250 144 1,635 -38 782 1,103 1,885 2,025 2,855 4,880 11,135 Napa 0.4% 0.4% 0.5% 350 75 91 516 -12 202 43 53 298 -7 127 192 319 329 496 825 1,939 Newark 0.4% 0.5% 0.4% 322 79 74 475 -11 186 46 42 274 -6 117 201 318 303 521 824 1,874 Novato 0.5% 0.4% 0.5% 436 69 78 583 -13 251 40 45 336 -8 158 174 332 409 451 860 2,090 Oakland 5.1% 6.8% 8.3% 4,061 1,174 1,430 6,665 -154 2,338 676 824 3,838 -88 1,474 2,983 4,457 3,814 7,719 11,533 26,251
ABAG REGIONAL HOUSING NEEDS ALLOCATION DRAFT METHODOLOGY: SAN FRANCISCO BAY AREA, 2023-203138 THE RHNA METHODOLOGY RHNA 39
Table 5: RHNA Allocation by Jurisdiction, with Factor Components
FACTOR DISTRIBUTIONS ALLOCATION BUILDING BLOCKS(Weights determine the share of each income group’s units that is assigned to a factor, and the factor is used to geographically allocate those units)
(Each sums to 100%) VERY LOW INCOME LOW INCOME MODERATE INCOME ABOVE MODERATE INCOME
Factor
ACCESS TO HIGHOPPORTUNITY
AREAS
JOB PROXIMITY —
AUTO
JOB PROXIMITY —
TRANSIT
ACCESS TO HIGH OPPORTUNITY
AREAS
JOB PROXIMITY —
AUTO
JOB PROXIMITY —
TRANSIT SUBTOTALEQUITY
ADJUSTMENT
ACCESS TO HIGH
OPPORTUNITY AREAS
JOB PROXIMITY —
AUTO
JOB PROXIMITY —
TRANSIT SUBTOTAL
EQUITY ADJUST-
MENT
ACCESS TO HIGH OPPORTUNITY
AREAS
JOB PROXIMITY —
AUTO SUBTOTAL
ACCESS TO HIGH
OPPORTUNITY AREAS
JOB PROXIMITY —
AUTO SUBTOTAL
Factor Weight 70% 15% 15% 100% 70% 15% 15% 100% 40% 60% 100% 40% 60% 100% TOTAL
Jurisdiction 100% 100% 100% 80,109 17,166 17,166 114,442 46,124 9,884 9,884 65,892 29,085 43,627 72,712 75,252 112,878 188,130 441,176 Oakley 0.2% 0.2% 0.3% 194 40 52 286 -7 112 23 30 165 -4 70 102 172 182 264 446 1,058 Orinda 0.4% 0.2% 0.2% 304 41 27 372 0 175 24 16 215 0 110 105 215 285 272 557 1,359 Pacifica 0.6% 0.3% 0.2% 461 49 41 551 -13 265 28 24 317 -7 167 124 291 433 320 753 1,892 Palo Alto 1.5% 1.3% 0.7% 1,209 226 121 1,556 0 696 130 70 896 0 439 574 1,013 1,136 1,485 2,621 6,086 Petaluma 0.4% 0.4% 0.5% 356 72 83 511 -12 205 42 48 295 -7 129 184 313 335 475 810 1,910 Piedmont 0.2% 0.1% 0.1% 126 18 19 163 0 73 10 11 94 0 46 46 92 119 119 238 587 Pinole 0.1% 0.1% 0.1% 79 23 22 124 -3 45 13 13 71 -2 29 58 87 74 149 223 500 Pittsburg 0.4% 0.5% 0.5% 339 85 94 518 -12 195 49 54 298 -7 123 217 340 319 561 880 2,017 Pleasant Hill 0.4% 0.3% 0.3% 360 48 43 451 115 208 28 25 261 65 131 123 254 339 318 657 1,803 Pleasanton 1.8% 0.8% 0.8% 1,469 142 139 1,750 0 846 82 80 1,008 0 533 361 894 1,380 933 2,313 5,965 Portola Valley 0.1% 0.0% 0.0% 58 7 5 70 3 33 4 3 40 2 21 18 39 54 45 99 253 Redwood City 1.0% 1.1% 0.7% 826 192 123 1,141 -26 476 111 71 658 -15 300 489 789 776 1,265 2,041 4,588 Richmond 0.7% 1.0% 0.9% 529 175 156 860 -20 305 101 90 496 -11 192 446 638 497 1,154 1,651 3,614 Rio Vista 0.1% 0.1% 0.1% 89 17 24 130 -3 51 10 14 75 -2 32 44 76 84 113 197 473 Rohnert Park 0.3% 0.4% 0.4% 270 66 72 408 -9 155 38 42 235 -5 98 167 265 253 433 686 1,580 Ross 0.0% 0.0% 0.0% 28 2 3 33 1 16 1 2 19 1 10 6 16 26 15 41 111 San Anselmo 0.3% 0.1% 0.1% 216 17 20 253 0 124 10 11 145 0 78 43 121 203 111 314 833 San Bruno 0.6% 0.9% 0.5% 469 159 93 721 -17 270 91 54 415 -10 170 403 573 440 1,043 1,483 3,165 San Carlos 0.7% 0.5% 0.4% 589 88 62 739 0 339 51 35 425 0 214 224 438 553 580 1,133 2,735
ABAG REGIONAL HOUSING NEEDS ALLOCATION DRAFT METHODOLOGY: SAN FRANCISCO BAY AREA, 2023-203140 THE RHNA METHODOLOGY RHNA 41
Table 5: RHNA Allocation by Jurisdiction, with Factor Components
FACTOR DISTRIBUTIONS ALLOCATION BUILDING BLOCKS(Weights determine the share of each income group’s units that is assigned to a factor, and the factor is used to geographically allocate those units)
(Each sums to 100%) VERY LOW INCOME LOW INCOME MODERATE INCOME ABOVE MODERATE INCOME
Factor
ACCESS TO HIGHOPPORTUNITY
AREAS
JOB PROXIMITY —
AUTO
JOB PROXIMITY —
TRANSIT
ACCESS TO HIGH OPPORTUNITY
AREAS
JOB PROXIMITY —
AUTO
JOB PROXIMITY —
TRANSIT SUBTOTALEQUITY
ADJUSTMENT
ACCESS TO HIGH
OPPORTUNITY AREAS
JOB PROXIMITY —
AUTO
JOB PROXIMITY —
TRANSIT SUBTOTAL
EQUITY ADJUST-
MENT
ACCESS TO HIGH OPPORTUNITY
AREAS
JOB PROXIMITY —
AUTO SUBTOTAL
ACCESS TO HIGH
OPPORTUNITY AREAS
JOB PROXIMITY —
AUTO SUBTOTAL
Factor Weight 70% 15% 15% 100% 70% 15% 15% 100% 40% 60% 100% 40% 60% 100% TOTAL
Jurisdiction 100% 100% 100% 80,109 17,166 17,166 114,442 46,124 9,884 9,884 65,892 29,085 43,627 72,712 75,252 112,878 188,130 441,176 San Francisco 16.1% 20.7% 28.7% 12,883 3,554 4,925 21,359 -492 7,418 2,046 2,836 12,294 -280 4,677 9,033 13,717 12,102 23,371 35,471 82,069 San Jose 13.1% 15.8% 12.8% 10,533 2,710 2,201 15,444 -356 6,065 1,560 1,267 8,892 -205 3,824 6,887 10,711 9,895 17,819 27,714 62,200 San Leandro 0.6% 1.2% 1.1% 490 204 188 882 -20 282 117 108 507 -12 178 518 696 461 1,341 1,802 3,855 San Mateo 1.7% 1.6% 1.1% 1,360 268 191 1,819 -42 783 154 110 1,047 -24 494 681 1,175 1,277 1,763 3,040 7,015 San Pablo 0.1% 0.2% 0.2% 107 36 34 177 -4 62 21 19 102 -2 39 93 132 101 240 341 746 San Rafael 0.8% 0.7% 0.7% 643 113 121 877 -20 370 65 69 504 -12 233 288 521 604 746 1,350 3,220 San Ramon 1.6% 0.7% 0.7% 1,261 122 114 1,497 0 726 70 66 862 0 458 309 767 1,185 800 1,985 5,111 Santa Clara 2.6% 2.8% 2.1% 2,097 480 363 2,940 -68 1,207 276 209 1,692 -39 761 1,220 1,981 1,970 3,156 5,126 11,632 Santa Rosa 1.1% 1.1% 1.2% 854 181 212 1,247 -29 492 104 122 718 -17 310 461 771 802 1,193 1,995 4,685 Saratoga 0.5% 0.3% 0.2% 363 58 33 454 0 209 33 19 261 0 132 146 278 341 378 719 1,712 Sausalito 0.2% 0.1% 0.1% 162 22 16 200 0 93 13 9 115 0 59 55 114 152 143 295 724 Sebastopol 0.0% 0.1% 0.1% 37 9 10 56 -1 21 5 6 32 -1 13 22 35 35 57 92 213 Sonoma 0.1% 0.1% 0.1% 58 12 15 85 -2 33 7 9 49 -1 21 29 50 54 76 130 311 South San Francisco 0.7% 1.2% 0.7% 568 202 122 892 -21 327 116 71 514 -12 206 514 720 533 1,330 1,863 3,956 St. Helena 0.0% 0.0% 0.0% 29 6 8 43 60 17 3 4 24 35 11 15 26 27 39 66 254 Suisun City 0.1% 0.1% 0.2% 106 25 29 160 -4 61 14 17 92 -2 38 63 101 100 164 264 611 Sunnyvale 2.7% 2.9% 1.8% 2,165 490 313 2,968 0 1,247 282 180 1,709 0 786 1,246 2,032 2,034 3,223 5,257 11,966 Tiburon 0.2% 0.1% 0.1% 164 14 15 193 0 94 8 8 110 0 59 34 93 154 89 243 639 Unincorporated Alameda 1.2% 1.0% 1.0% 954 164 163 1,281 -30 549 95 94 738 -17 346 417 763 896 1,080 1,976 4,711
ABAG REGIONAL HOUSING NEEDS ALLOCATION DRAFT METHODOLOGY: SAN FRANCISCO BAY AREA, 2023-203142 THE RHNA METHODOLOGY RHNA 43
Table 5: RHNA Allocation by Jurisdiction, with Factor Components
FACTOR DISTRIBUTIONS ALLOCATION BUILDING BLOCKS(Weights determine the share of each income group’s units that is assigned to a factor, and the factor is used to geographically allocate those units)
(Each sums to 100%) VERY LOW INCOME LOW INCOME MODERATE INCOME ABOVE MODERATE INCOME
Factor
ACCESS TO HIGHOPPORTUNITY
AREAS
JOB PROXIMITY —
AUTO
JOB PROXIMITY —
TRANSIT
ACCESS TO HIGH OPPORTUNITY
AREAS
JOB PROXIMITY —
AUTO
JOB PROXIMITY —
TRANSIT SUBTOTALEQUITY
ADJUSTMENT
ACCESS TO HIGH
OPPORTUNITY AREAS
JOB PROXIMITY —
AUTO
JOB PROXIMITY —
TRANSIT SUBTOTAL
EQUITY ADJUST-
MENT
ACCESS TO HIGH OPPORTUNITY
AREAS
JOB PROXIMITY —
AUTO SUBTOTAL
ACCESS TO HIGH
OPPORTUNITY AREAS
JOB PROXIMITY —
AUTO SUBTOTAL
Factor Weight 70% 15% 15% 100% 70% 15% 15% 100% 40% 60% 100% 40% 60% 100% TOTAL
Jurisdiction 100% 100% 100% 80,109 17,166 17,166 114,442 46,124 9,884 9,884 65,892 29,085 43,627 72,712 75,252 112,878 188,130 441,176 Unincorporated Contra Costa
2.0% 1.4% 1.5% 1,633 245 253 2,131 -49 940 141 146 1,227 -28 593 624 1,217 1,534 1,613 3,147 7,645
Unincorporated Marin 1.1% 0.4% 0.6% 894 74 95 1,063 37 515 42 54 611 23 325 187 512 840 484 1,323 3,569 Unincorporated Napa 0.2% 0.1% 0.2% 152 26 32 210 159 88 15 18 121 92 55 65 120 143 169 312 1,014 Unincorporated San Mateo 0.8% 0.4% 0.5% 661 76 93 830 -19 381 44 54 479 -11 240 193 433 621 500 1,121 2,833 Unincorporated Santa Clara 0.8% 0.6% 0.5% 647 107 94 848 -20 372 62 54 488 -11 235 273 508 607 705 1,312 3,125 Unincorporated Solano 0.2% 0.2% 0.3% 164 35 44 243 -6 95 20 25 140 -3 60 89 149 154 231 385 908 Unincorporated Sonoma 0.9% 0.8% 1.0% 742 141 177 1,060 -24 427 81 102 610 -14 269 358 627 697 925 1,622 3,881 Union City 0.5% 0.5% 0.6% 392 94 96 582 280 226 54 55 335 161 142 240 382 368 620 988 2,728 Vacaville 0.4% 0.4% 0.5% 334 73 91 498 -11 192 42 52 286 -7 121 184 305 314 477 791 1,862 Vallejo 0.6% 0.7% 0.8% 482 128 131 741 -17 277 74 75 426 -10 175 326 501 453 844 1,297 2,938 Walnut Creek 1.8% 0.9% 0.8% 1,408 149 139 1,696 -39 810 86 80 976 -22 511 379 890 1,322 982 2,304 5,805 Windsor 0.1% 0.2% 0.2% 112 26 30 168 217 65 15 17 97 125 41 67 108 105 174 279 994 Woodside 0.1% 0.1% 0.0% 73 10 7 90 0 42 6 4 52 0 27 25 52 69 65 134 328 Yountville 0.0% 0.0% 0.0% 13 3 3 19 0 7 2 2 11 0 5 7 12 12 18 30 72 Region 80,109 17,166 17,166 114,442 46,124 9,884 9,884 65,892 29,085 43,627 72,712 75,252 112,878 188,130 441,176
Note: the jurisdiction-specific allocations shown are for illustrative purposes only (refer to Schedule and Process diagram on page 7 for additional steps in determining final allocations).
Unit numbers for each factor may not add up to the total due to rounding.
The allocation is done with floating point precision internally, but rounding is done to get whole unit counts for each income group in a jurisdiction. The rounded unit counts were adjusted in the Subtotal column to ensure they add up to the total units by income category from the regional housing needs determination (RHND). The equity adjustment was applied after this step, and the same check was performed again to ensure the resulting illustrative allocations match the RHND.
Some totals may differ +/- 2 units compared to information presented to the ABAG Executive Board in January 2021 as a result of corrections to fix rounding errors in the January materials.
ABAG REGIONAL HOUSING NEEDS ALLOCATION DRAFT METHODOLOGY: SAN FRANCISCO BAY AREA, 2023-203144
Frfx15%
Unc Snm10%
Mll Vlly13%
Lrkspr17%
Sn Anslm14%
Unc Mrn14%
Sbstpl12%
Hldsbrg8%
Hlf MnBy8%
Pcfc14%
Clm42%
SnFrncsc
20%
Sslt17%
Crt Mdr18%
Rss14%
Nvt10%
Ctt9%
Snt Rs10%
Clvrdl9%
Wdsd16%
Mllbr29%
Sth SnFrncsc
19%
Dly Cty15%
Blvdr17%
Tbrn16%
Sn Rfl12%
Ptlm9%
RhnrtPrk8%
Wndsr8%
Unc SnMt14%
PrtlVlly14%
Sn Mt17%
Hllsbrgh16%
Sn Brn14%
Brsbn147%
Snm7%
St. Hln7%
Ls AltsHlls18%
Athrtn13%
Rdwd Cty17%
Brlngm28%
Fstr Cty16%
Albny18%
Rchmnd11%
AmrcnCnyn8%
Yntvll7%
Clstg10%
Srtg19%
Ls Alts20%
Mnl Prk23%
Sn Crls21%
Blmnt17%
Almd16%
Emryvll23%
El Crrt11%
Sn Pbl9%
Vllj8%
Np7%
Unc Np8%
Mnt Srn14%
Cprtn31%
Pl Alt36%
Est PlAlt12%
Oklnd17%
Brkly16%
Lfytt17%
Pnl9%
Hrcls8%
Bnc8%
Frfld10%
Unc Sln15%
Ls Gts15%
Cmpbll23%
Snnyvl23%
Mntn Vw33%
Unn Cty11%
Sn Lndr10%
Pdmnt16%
Mrg19%
Ornd17%
Mrtnz9%
Ssn Cty7%
Vcvll6%
Mrgn Hll8%
Sn Js21%
Snt Clr26%
Nwrk13%
Frmnt20%
Hywrd9%
Dnvll14%
PlsntHll14%
Cncrd9%
Pttsbrg8%
R Vst5%
Dxn6%
Unc SntClr16%
Glry9%
Mlpts31%
Plsntn17%
Dbln17%
Sn Rmn17%
Wlnt Crk18%
Clytn15%
Antch7%
Unc Almd9%
Lvrmr13%
Unc CntrCst10%
Brntwd8%
Okly8%
Jurisdiction Growth Rate from 2019 households as a result of 2023-2031RHNA
0.0%
10.0%
15.0%
20.0%
25.0%
30.0%
50.0%
150.0%
Note: The ABAG Executive Board and MTC Commission adopted changes to the strategies forthe Plan Bay Area 2050 Final Blueprint in September 2020. The changes adopted at that timewill affect information about total households in Year 2050 from the Final Blueprint;updated data will be available in December 2020. As this information from the Blueprint isused as the baseline allocation for the proposed RHNA methodology, updates in the FinalBlueprint could lead to changes in the ultimate allocations. Data from the Final Blueprintwill be integrated into the Draft RHNA Methodology slated for the end of 2020.
Illustrative Allocations from HMC/RPC Proposed RHNA Methodology
Figure 2: Illustrative Allocations from Draft RHNA Methodology - With Equity AdjustmentJurisdiction growth rate from 2020 households as a result of 2023-2031 RHNA
JURI
SDIC
TION
GROW
TH R
ATE
Note: the jurisdiction-specific allocations shown are for illustrative purposes only. ABAG will issue Final Allocations by the end of 2021.
THE RHNA METHODOLOGY RHNA 45
Almd4.9k
Albny1.2k
AmrcnCnyn0.5k
Antch2.5k
Athrtn0.3k
Blmnt1.8k
Blvdr0.2k
Bnc0.9k
Brkly7.7k
Brntwd1.5k
Brsbn2.8k
Brlngm3.4k
Clstg0.2k
Cmpbll4.0k
Clytn0.6k
Clvrdl0.3k
Clm0.2k
Cncrd3.9kCrt Mdr
0.7k
Ctt0.3k
Cprtn6.2k
Dly Cty4.8k
Dnvll2.2k
Dxn0.4k
Dbln3.6k
Est PlAlt
0.9k
El Crrt1.2k
Emryvll1.5k
Frfx0.5k
Frfld3.6k
Fstr Cty2.0k
Frmnt14.3k
Glry1.5k
Hlf MnBy
0.3k
Hywrd4.2k
Hldsbrg0.4k
Hrcls0.7k
Hllsbrgh0.6k
Lfytt1.7k
Lrkspr1.0k
Lvrmr4.0k
Ls Alts2.3kLs Alts
Hlls0.5k
Ls Gts1.9k
Mrtnz1.4k
Mnl Prk3.1k
Mll Vlly0.8k
Mllbr2.4k
Mlpts6.6k
Mnt Srn0.2k
Mrg1.1k
Mrgn Hll1.1k
Mntn Vw11.4k
Np2.1k
Nwrk1.8k
Nvt2.1k
Oklnd27.3k
Okly0.9k
Ornd1.1k
Pcfc1.9k
Pl Alt10.1k
Ptlm2.1k
Pdmnt0.6k
Pnl0.6k
Pttsbrg1.6k
PlsntHll
1.9k
Plsntn4.8k
PrtlVlly0.3k
Rdwd Cty5.2k
Rchmnd4.2k
R Vst0.2k
RhnrtPrk1.3k
Rss0.1k
Sn Anslm0.7k
Sn Brn2.1k
Sn Crls2.4k
SnFrncsc72.1k
Sn Js66.5k
Sn Lndr3.1k
Sn Mt6.7k
Sn Pbl0.8k
Sn Rfl2.8k
Sn Rmn4.7k
Snt Clr12.0k
Snt Rs6.5k
Srtg2.1k
Sslt0.7k
Sbstpl0.4k
Snm0.3k
Sth SnFrncsc4.0k
St. Hln0.2k
Ssn Cty0.6k
Snnyvl13.0k
Tbrn0.6k
Unc Almd4.5k
Unc CntrCst5.8k
Unc Mrn3.8k
Unc Np0.8k
Unc SnMt
2.9k
Unc SntClr
4.1k
Unc Sln1.0k
Unc Snm5.3k
Unn Cty2.2k
Vcvll2.0k
Vllj3.2k
Wlnt Crk5.7k
Wndsr0.7k
Wdsd0.3k
Yntvll0.1k
Jurisdiction Total Allocation of 2023-2031 RHNA
0
2,500
5,000
7,500
10,000
15,000
20,000
100,000
Note: The ABAG Executive Board and MTC Commission adopted changes to the strategies forthe Plan Bay Area 2050 Final Blueprint in September 2020. The changes adopted at that timewill affect information about total households in Year 2050 from the Final Blueprint;updated data will be available in December 2020. As this information from the Blueprint isused as the baseline allocation for the proposed RHNA methodology, updates in the FinalBlueprint could lead to changes in the ultimate allocations. Data from the Final Blueprintwill be integrated into the Draft RHNA Methodology slated for the end of 2020.
Growth (Units)
Illustrative Allocations from HMC/RPC Proposed RHNA Methodology
Figure 2: Illustrative Allocations from Draft RHNA Methodology - With Equity AdjustmentJurisdiction total allocation of 2023-2031 RHNA
GROW
TH (U
NITS
)
Note: the jurisdiction-specific allocations shown are for illustrative purposes only. ABAG will issue Final Allocations by the end of 2021.
ABAG REGIONAL HOUSING NEEDS ALLOCATION DRAFT METHODOLOGY: SAN FRANCISCO BAY AREA, 2023-203146
RHNA STATUTORY OBJECTIVES AND FACTORS As noted previously, Housing Element Law requires the RHNA methodology to further five objectives that recognize the importance of comprehensively planning for housing in ways that also promote equity, strengthen the economy, improve connections between jobs and housing, and protect the environment. The statutory objectives, and the ways in which the Bay Area’s draft RHNA methodology meets them, are described below.
RHNA ObjectivesOBJECTIVE 1 — “increasing the housing supply and the mix of housing types, tenure, and affordability in all cities and counties within the region in an equitable manner, which shall result in each jurisdiction receiving an allocation of units for low- and very low-income households.”
The methodology furthers this objective by allocating a share of the region’s housing need across all income categories to all jurisdictions in the Bay Area. As a result, all jurisdictions receive an allocation of very low- and low-income units. The methodology allocates these units equitably, as the methodology allocation factors direct very low- and low-income units based primarily on a jurisdiction’s access to opportunity. Accordingly, jurisdictions with the most residents living in census tracts
designated as High Resource or Highest Resource on the California Tax Credit Allocation Committee (TCAC) 2020 Opportunity Map receive a higher share of their allocation as lower-income units than other jurisdictions in the region (see Appendix 2).
As shown in Appendix 2, jurisdictions with the highest housing costs also receive a higher share of their allocation as lower-income units than other jurisdictions in the region. Because jurisdictions must zone at higher densities to accommodate their allocations of low- and very-low-income units, the methodology will result in both greater affordability and a more diverse range of housing types throughout the region, particularly in the jurisdictions that currently lack affordable housing opportunities.
OBJECTIVE 2 — “Promoting infill development and socioeconomic equity, the protection of environmental and agricultural resources, the encouragement of efficient development patterns, and the achievement of the region’s greenhouse gas reductions targets provided by the State Air Resourcess Board pursuant to Section 65080.”
The intent of this objective is consistent with many of the strategies integrated into Plan Bay Area 2050. The draft methodology incorporates the Plan Bay Area 2050 Blueprint as the data source for the baseline allocation used to assign each jurisdiction a beginning share of the RHND, using each jurisdiction’s share of the region’s households in the year 2050. In effect, this baseline
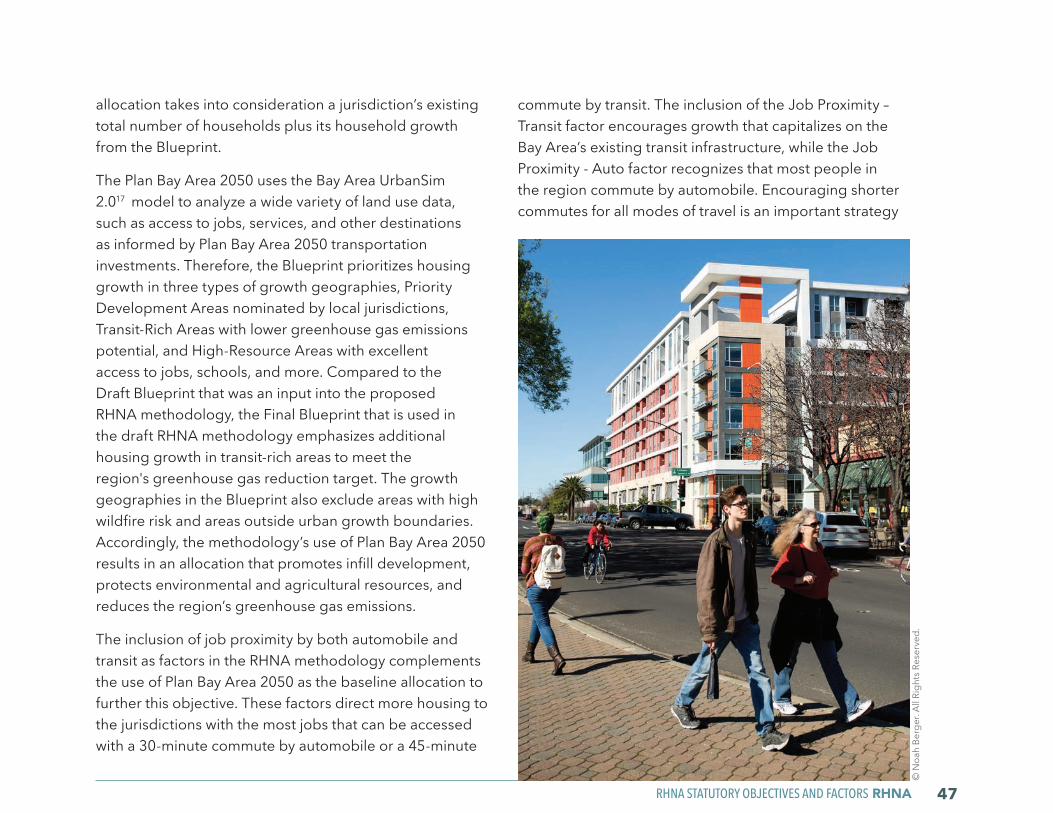
RHNA STATUTORY OBJECTIVES AND FACTORS RHNA 47
allocation takes into consideration a jurisdiction’s existing total number of households plus its household growth from the Blueprint.
The Plan Bay Area 2050 uses the Bay Area UrbanSim 2.017 model to analyze a wide variety of land use data, such as access to jobs, services, and other destinations as informed by Plan Bay Area 2050 transportation investments. Therefore, the Blueprint prioritizes housing growth in three types of growth geographies, Priority Development Areas nominated by local jurisdictions, Transit-Rich Areas with lower greenhouse gas emissions potential, and High-Resource Areas with excellent access to jobs, schools, and more. Compared to the Draft Blueprint that was an input into the proposed RHNA methodology, the Final Blueprint that is used in the draft RHNA methodology emphasizes additional housing growth in transit-rich areas to meet the region's greenhouse gas reduction target. The growth geographies in the Blueprint also exclude areas with high wildfire risk and areas outside urban growth boundaries. Accordingly, the methodology’s use of Plan Bay Area 2050 results in an allocation that promotes infill development, protects environmental and agricultural resources, and reduces the region’s greenhouse gas emissions.
The inclusion of job proximity by both automobile and transit as factors in the RHNA methodology complements the use of Plan Bay Area 2050 as the baseline allocation to further this objective. These factors direct more housing to the jurisdictions with the most jobs that can be accessed with a 30-minute commute by automobile or a 45-minute
commute by transit. The inclusion of the Job Proximity – Transit factor encourages growth that capitalizes on the Bay Area’s existing transit infrastructure, while the Job Proximity - Auto factor recognizes that most people in the region commute by automobile. Encouraging shorter commutes for all modes of travel is an important strategy
© N
oah
Berg
er. A
ll Ri
ghts
Res
erve
d.

ABAG REGIONAL HOUSING NEEDS ALLOCATION DRAFT METHODOLOGY: SAN FRANCISCO BAY AREA, 2023-203148
for reducing greenhouse gas emissions.
As shown in Appendix 2, the draft methodology results in jurisdictions with the most access to jobs and transit as well as jurisdictions with the lowest vehicle miles traveled per resident experiencing higher growth rates from their RHNA allocations than other jurisdictions in the region. Therefore, the methodology furthers the sustainability goals represented by this objective. The draft methodology also promotes socioeconomic equity by expanding the range of housing choices available in all jurisdictions throughout the Bay Area with a particular emphasis on adding homes affordable to lower-income residents in jurisdictions with high resource areas to promote socioeconomic mobility.
OBJECTIVE 3 — “Promoting an improved intraregional relationship between jobs and housing, including an improved balance between the number of low-wage jobs and the number of housing units affordable to low-wage workers in each jurisdiction.”
The draft RHNA methodology directly incorporates the forecasted development pattern from the Plan Bay Area 2050 Blueprint as the baseline allocation. The Blueprint emphasizes growth near job centers and in locations near transit, as well as in high-resource areas, with the intent of reducing greenhouse gas emissions. The strategies incorporated into the Blueprint help improve the region’s jobs-housing balance, leading to shorter commutes—especially for low-income workers.
Moreover, the allocation factors in the draft RHNA
methodology focus entirely on job proximity and access to opportunity. Seventy percent of very low- and low-income units are allocated based on jurisdictions’ access to opportunity according to the TCAC 2020 Opportunity Map methodology, which incorporates proximity to jobs filled by workers with less than a bachelor’s degree. The remaining 30 percent of the lower-income units are allocated based on jurisdictions’ proximity to jobs. Furthermore, 60 percent of the region’s moderate- and above moderate-income units are allocated based on jurisdictions’ proximity to jobs.
As a result of differences in how units are distributed across income categories in the RHND, the draft RHNA methodology allocates 48 percent of all units based on the factors related to job proximity. Thus, the methodology promotes an improved relationship between jobs and housing. As noted previously, the draft methodology results in jurisdictions with the most access
© M
artin
Klim
ek. A
ll Ri
ghts
Res
erve
d.
RHNA STATUTORY OBJECTIVES AND FACTORS RHNA 49
to jobs experiencing higher growth rates from their RHNA allocations than other jurisdictions in the region.
Also, as shown in Appendix 2, the draft methodology results in jurisdictions with the most imbalanced jobs-housing fit (or, ratio between the number of low-wage jobs and the number of housing units affordable to low-wage workers) receiving a higher share of lower-income units than other jurisdictions.
OBJECTIVE 4 — “Allocating a lower proportion of housing need to an income category when a jurisdiction already has a disproportionately high share of households in that income category, as compared to the countywide distribution of households in that category from the most recent American Community Survey.”
The draft RHNA methodology allocates 70 percent of very low- and low-income units based on a jurisdiction’s access to opportunity according to the TCAC 2020 Opportunity Map methodology, which scores jurisdictions partially based on their poverty rates and median home values. Consequently, jurisdictions with the most households in High Resource or Highest Resource census tracts have disproportionately large shares of higher-income residents and relatively small shares of lower-income residents. The draft methodology furthers Objective 4 by allocating lower-income units directly to these jurisdictions with the most access to resources. As a result, the jurisdictions with the largest percentage of households with incomes above 120 percent of the area median income receive a significantly higher share of their RHNA as lower-income units than the jurisdictions with the largest percentage
of households with incomes below 80 percent of area median income (see Appendix 2).
OBJECTIVE 5 — “Affirmatively furthering fair housing, which means taking meaningful actions, in addition to combating discrimination, that overcome patterns of segregation and foster inclusive communities free from barriers that restrict access to opportunity based on protected characteristics. Specifically, affirmatively furthering fair housing means taking meaningful actions that, taken together, address significant disparities in housing needs and in access to opportunity, replacing segregated living patterns with truly integrated and balanced living patterns, transforming racially and ethnically concentrated areas of poverty into areas of opportunity, and fostering and maintaining compliance with civil rights and fair housing laws.”
The draft RHNA methodology affirmatively furthers fair housing by emphasizing access to opportunity based on the data from the TCAC 2020 Opportunity Map. The Access to High Opportunity Areas factor assigns 70 percent of the region’s very low- and low-income units and 40 percent of the region’s moderate- and above moderate-income units.
The equity adjustment included in the draft RHNA methodology also helps affirmatively further fair housing. This adjustment ensures that the 49 jurisdictions identified as exhibiting racial and socioeconomic demographics that differ from the regional average receive a share of the region’s lower-income RHNA units that is at least proportional to the jurisdiction’s share of existing
ABAG REGIONAL HOUSING NEEDS ALLOCATION DRAFT METHODOLOGY: SAN FRANCISCO BAY AREA, 2023-203150
households. Most of these 49 jurisdictions receive allocations that meet this proportionality threshold based on the draft methodology’s emphasis on access to high opportunity areas. However, the equity adjustment ensures that the other 18 jurisdictions that might exhibit racial and economic exclusion but do not have significant shares of households living in high opportunity areas also receive proportional allocations.
Additionally, the draft RHNA methodology’s emphasis on affirmatively furthering fair housing is supported by the inclusion of High-Resource Areas as one of the growth geographies in the Plan Bay Area 2050 Blueprint. In the Blueprint, High-Resource areas are defined as the Census tracts identified as High and Highest Resource in the State’s Opportunity Map if they were inside a Priority Development Area (PDA) or if they were near transit in a jurisdiction that designated less than 50 percent of its PDA-eligible land as PDAs.18
As shown in Appendix 2, the allocations from the draft methodology result in the jurisdictions with the highest percentage of residents living in High Resource or Highest Resource tracts in the TCAC 2020 Opportunity Map receiving a larger share of the region’s lower-income units than other jurisdictions. With the equity adjustment, jurisdictions exhibiting above-average levels of racial and economic exclusion receive a share of the region’s lower-income units that is 19 percent greater than their share of the region’s households, and, as noted above, all of the 49 jurisdictions achieve the proportionality threshold. Thus, the methodology will require jurisdictions with the most access to opportunity and those with a pattern of
excluding people of color and lower-income households to zone for a broader range of housing types, particularly housing that is affordable to lower-income households.
RHNA Methodology FactorsHousing Element Law also identifies factors that ABAG must consider in developing its RHNA methodology, to the extent sufficient data is available. The statutory factors, and the ways in which the Bay Area’s draft RHNA methodology meets them, are described below. Additionally, these factors were considered as part of the local jurisdiction survey conducted by ABAG. A summary of the results of the local jurisdiction survey, which helped provide local context on local conditions during the development of the methodology, is included as Appendix 5.
1. Each member jurisdiction’s existing and projected jobs and housing relationship. This shall include an estimate based on readily available data on the number of low-wage jobs within the jurisdiction and how many housing units within the jurisdiction are affordable to low-wage workers as well as an estimate based on readily available data, of projected job growth and projected household growth by income level within each member jurisdiction during the planning period.
The draft RHNA methodology directly incorporates each jurisdiction’s existing and projected jobs-housing relationship in both the baseline allocation and the allocation factors. Forecasts from Plan Bay Area 2050 inform the baseline allocation, and Plan Bay Area 2050
RHNA STATUTORY OBJECTIVES AND FACTORS RHNA 51
emphasizes growth near job centers and includes strategies related to increased housing densities and office development subsidies to address jobs-housing imbalances in the region. The strategies incorporated into the Blueprint help improve the region’s jobs-housing balance, leading to shorter commutes—especially for low-income workers.
The draft RHNA methodology amplifies the Plan Bay Area 2050 Blueprint’s emphasis on improving jobs-housing balance by using factors related to job proximity to allocate nearly half of the RHND. These factors direct housing units to those jurisdictions with the most jobs that can be accessed with a 30-minute commute by automobile and/or a 45-minute commute by transit. The combination of the Access to High Opportunity Areas factor and job proximity factors for allocating lower-income RHNA units intends to enable more Bay Area workers to reside closer to their jobs, with an emphasis on providing more affordable housing in jurisdictions with the largest imbalance between low-wage jobs and housing affordable to low-wage workers.
The draft methodology helps to create a more balanced relationship between housing and jobs by directing RHNA units to job-rich jurisdictions and jurisdictions with the most imbalanced jobs-housing fit. As shown in Appendix 2, jurisdictions with the largest share of the Bay Area’s jobs receive allocations that result in the highest growth rates compared to the rest of the jurisdictions in the region. Additionally, the jurisdictions with the worst jobs-housing fit receive a larger share of their RHNA as affordable housing than other jurisdictions and receive a share of
the RHND that is 22 percent greater than their share of the region’s households. This outcome is supported by inclusion of the equity adjustment in the RHNA methodology, which directed additional lower-income units to jurisdictions with an imbalanced jobs-housing fit.
2. The opportunities and constraints to development of additional housing in each member jurisdiction, including all of the following:
a. Lack of capacity for sewer or water service due to federal or state laws, regulations or regulatory actions, or supply and distribution decisions made by a sewer or water service provider other than the local jurisdiction that preclude the jurisdiction from providing necessary infrastructure for additional development during the planning period.
b. The availability of land suitable for urban development or for conversion to residential use, the availability of underutilized land, and opportunities for infill development and increased residential densities. The council of governments may not limit its consideration of suitable housing sites or land suitable for urban development to existing zoning ordinances and land use restrictions of a locality, but shall consider the potential for increased residential development under alternative zoning ordinances and land use restrictions. The determination of available land suitable for urban development may exclude lands where the Federal Emergency Management Agency (FEMA) or the Department
ABAG REGIONAL HOUSING NEEDS ALLOCATION DRAFT METHODOLOGY: SAN FRANCISCO BAY AREA, 2023-203152
of Water Resources has determined that the flood management infrastructure designed to protect that land is not adequate to avoid the risk of flooding.
c. Lands preserved or protected from urban development under existing federal or state programs, or both, designed to protect open space, farmland, environmental habitats, and natural resources on a long-term basis, including land zoned or designated for agricultural protection or preservation that is subject to a local ballot measure that was approved by the voters of that jurisdiction that prohibits or restricts conversion to nonagricultural uses.
d. County policies to preserve prime agricultural land, as defined pursuant to Section 56064, within an unincorporated area and land within an unincorporated area zoned or designated for agricultural protection or preservation that is subject to a local ballot measure that was approved by the voters of that jurisdiction that prohibits or restricts its conversion to nonagricultural uses.
The opportunities and constraints to housing development are addressed through the incorporation of the Plan Bay Area 2050 Blueprint as the baseline allocation in the draft RHNA methodology. In developing the Plan Bay Area 2050 Blueprint, ABAG-MTC staff worked with local governments to gather information about local plans, zoning, physical characteristics and potential development opportunities and constraints for each jurisdiction. The Final Blueprint
that was integrated into the draft RHNA methodology includes a number of updates based on corrections to local data provided by jurisdiction staff. This information is an input into the UrbanSim 2.0 model that uses a simulation of buyers and sellers in local real estate markets to estimate housing feasibility. In assessing feasibility, the UrbanSim 2.0 model also integrates the higher cost of building on parcels with physical development constraints, e.g., steep hillsides. Protected park land and open space are excluded from development in the model.
However, the Blueprint does not limit a jurisdiction’s housing allocation based on local plans or zoning. The UrbanSim 2.0 model is used to forecast expanded growth potential in growth geographies identified in the Blueprint, such as Transit-Rich Areas and High Resource Areas. This allows additional feasible growth within the urban footprint by increasing allowable residential densities and expanding housing into areas currently zoned for commercial and industrial uses.
The Plan Bay Area 2050 Blueprint also excludes areas outside urban growth boundaries and areas with unmitigated high hazard risk from additional growth. Existing urban growth boundaries, which take a variety of forms across the region but are relatively common in the Bay Area, help not only to protect prime agricultural lands from development, but also parks and open space as well. Land outside urban growth boundaries also tends not to have urban services such as sewer and water. The Blueprint also incorporates strategies to protect high-value conservation lands, including matching funds to help conserve high-priority natural and agricultural lands.
RHNA STATUTORY OBJECTIVES AND FACTORS RHNA 53
Including the Plan Bay Area 2050 Blueprint in the RHNA methodology addresses concerns about natural hazards, as the Blueprint excludes areas with unmitigated high hazard risk from Growth Geographies. The Blueprint Growth Geographies exclude CAL FIRE designated “Very High” fire severity areas as well as county-designated wildland-urban interfaces (WUIs) where applicable. The Blueprint strategies focus future growth away from the highest fire risk zones, support increased wildland management programs, and support residential building upgrades that reduce the likelihood for damage when fires occur in the wildland urban interface.
The Blueprint also incorporates strategies to mitigate the impacts of sea level rise, protecting nearly all communities at risk from two feet of permanent inundation. Riverine flooding is not yet integrated into the Blueprint because existing research does not provide guidance on how to model impacts of temporary riverine flooding to buildings and land value. Communities can choose to take these risks into consideration with where and how they site future development, either limiting growth in areas of higher hazard or by increasing building standards to cope with the hazard.
3. The distribution of household growth assumed for purposes of a comparable period of regional transportation plans and opportunities to maximize the use of public transportation and existing transportation infrastructure.
As noted above, the draft RHNA methodology’s baseline allocation directly incorporates the forecasted development pattern from Plan Bay Area 2050, the
Bay Area’s Regional Transportation Plan/Sustainable Communities Strategy. The growth geographies in Plan Bay Area 2050 emphasize access to transit, both in locally nominated Priority Development Areas and in regionally identified Transit-Rich Areas. This land use pattern is developed with complementary transportation investments in an effort to ensure past and future transportation investments are maximized. The strategies incorporated into the Plan Bay Area 2050 Final Blueprint focused a greater share of growth in transit-rich, high-resource places, yielding shifts toward San Francisco and higher-resource East Bay cities.
The draft RHNA methodology builds on the transit-focused development pattern from Plan Bay Area 2050 by also allocating 15 percent of the region’s very low- and low-income units based on a jurisdiction’s proximity to jobs that can be accessed by public transit. Thus, the methodology will encourage higher-density housing in jurisdictions with existing transit infrastructure, which can maximize the use of public transportation in these communities.
Similarly, the results in Appendix 2 demonstrate that the jurisdictions with the largest share of the region’s Transit Priority Area (TPA)19 acres experience significantly higher growth rates from the draft methodology than other jurisdictions. The 25 jurisdictions with the most TPA acreage grow by 18 percent on average as a result of allocations from the draft methodology. All other jurisdictions grow by 12 percent on average. The jurisdictions with the most access to public transit receive the most growth from the draft methodology, which will
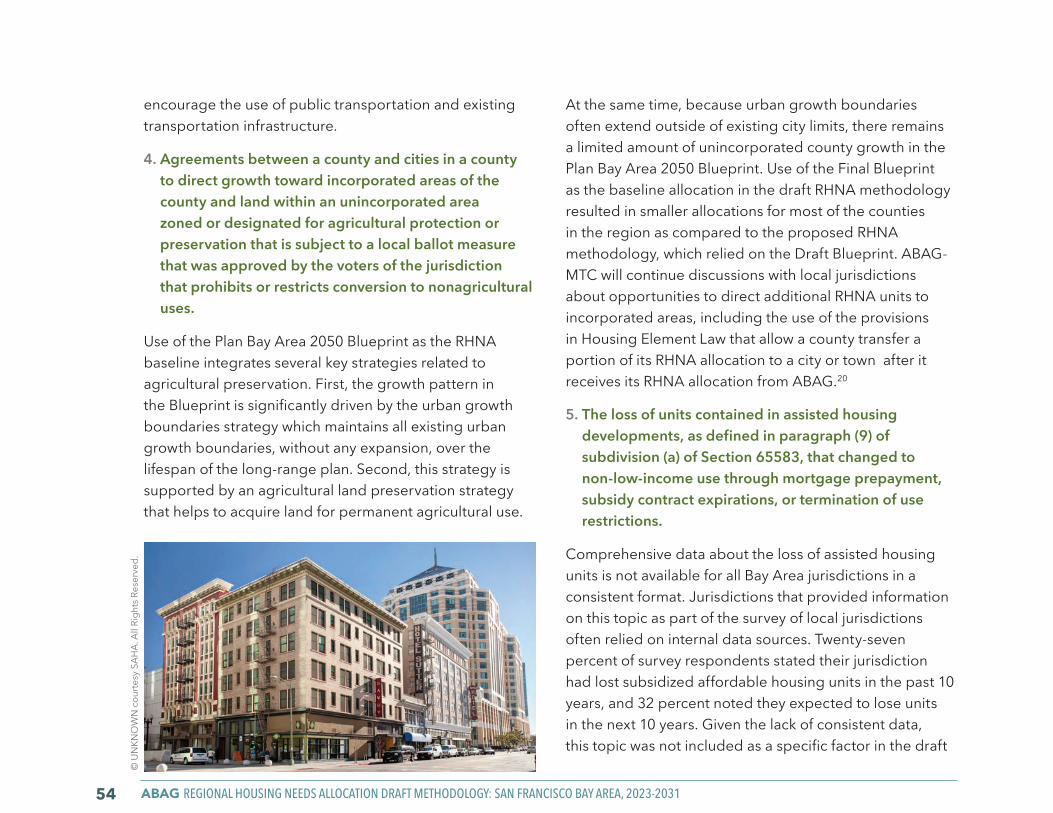
ABAG REGIONAL HOUSING NEEDS ALLOCATION DRAFT METHODOLOGY: SAN FRANCISCO BAY AREA, 2023-203154
encourage the use of public transportation and existing transportation infrastructure.
4. Agreements between a county and cities in a county to direct growth toward incorporated areas of the county and land within an unincorporated area zoned or designated for agricultural protection or preservation that is subject to a local ballot measure that was approved by the voters of the jurisdiction that prohibits or restricts conversion to nonagricultural uses.
Use of the Plan Bay Area 2050 Blueprint as the RHNA baseline integrates several key strategies related to agricultural preservation. First, the growth pattern in the Blueprint is significantly driven by the urban growth boundaries strategy which maintains all existing urban growth boundaries, without any expansion, over the lifespan of the long-range plan. Second, this strategy is supported by an agricultural land preservation strategy that helps to acquire land for permanent agricultural use.
At the same time, because urban growth boundaries often extend outside of existing city limits, there remains a limited amount of unincorporated county growth in the Plan Bay Area 2050 Blueprint. Use of the Final Blueprint as the baseline allocation in the draft RHNA methodology resulted in smaller allocations for most of the counties in the region as compared to the proposed RHNA methodology, which relied on the Draft Blueprint. ABAG-MTC will continue discussions with local jurisdictions about opportunities to direct additional RHNA units to incorporated areas, including the use of the provisions in Housing Element Law that allow a county transfer a portion of its RHNA allocation to a city or town after it receives its RHNA allocation from ABAG.20
5. The loss of units contained in assisted housing developments, as defined in paragraph (9) of subdivision (a) of Section 65583, that changed to non-low-income use through mortgage prepayment, subsidy contract expirations, or termination of use restrictions.
Comprehensive data about the loss of assisted housing units is not available for all Bay Area jurisdictions in a consistent format. Jurisdictions that provided information on this topic as part of the survey of local jurisdictions often relied on internal data sources. Twenty-seven percent of survey respondents stated their jurisdiction had lost subsidized affordable housing units in the past 10 years, and 32 percent noted they expected to lose units in the next 10 years. Given the lack of consistent data, this topic was not included as a specific factor in the draft
© U
NKN
OW
N c
ourte
sy S
AHA.
All
Righ
ts R
eser
ved.
RHNA STATUTORY OBJECTIVES AND FACTORS RHNA 55
RHNA methodology. The loss of assisted housing units for lower-income households is an issue that would best be addressed by local jurisdictions when preparing their Housing Elements. ABAG proposes to include available data in its preapproved data package as a starting point for supporting local jurisdictions in addressing this issue.
6. The percentage of existing households at each of the income levels listed in subdivision (e) of Section 65584 that are paying more than 30 percent and more than 50 percent of their income in rent.
During the consultation process for the RHND, ABAG worked with HCD to compare the Bay Area’s share of cost-burdened households to comparable regions throughout the United States. The comparison used data from the 2012-2016 Comprehensive Housing Affordability Strategy (CHAS) to evaluate cost burden for lower-income and higher-income households. The averages of these cost burdens by income group formed the basis for an adjustment that was included in the RHND.21
The data analysis prepared for the RHND indicated that approximately 66 percent of Bay Area households earning less than 80 percent of the Area Median Income (AMI) are cost-burdened, while 16 percent of households earning above 80 percent AMI are cost-burdened. The prevalence of cost burden as a concern for many Bay Area households was confirmed by the results of the survey sent to local jurisdictions, where 51 respondents (72 percent) indicated that high housing costs and high rates of cost burden affect housing needs in their jurisdictions.
The UrbanSim 2.0 model used to develop the Plan Bay Area 2050 Blueprint considers both housing costs and relative incomes when forecasting future growth. Moreover, Plan Bay Area 2050 incorporates multiple strategies to address housing unaffordability, including allowing a greater mix of housing types and densities in the plan’s growth geographies, reducing barriers to housing near transit and in areas of high opportunity, transforming aging malls and office parks into mixed-income neighborhoods, raising additional funding for affordable housing, requiring 10 to 20 percent of new housing to be affordable, and strengthening renter protections beyond current state regulations.
The RHNA methodology further addresses cost-burdened households in the Bay Area – particularly the high percentage of cost-burdened households earning less than 80 percent of AMI – by allocating lower-income units to all jurisdictions, particularly those with the most access to opportunity. The methodology allocates 70 percent of the region’s lower-income units based on jurisdictions’ access to opportunity according to the TCAC 2020 Opportunity Map.
As shown in Appendix 2, the jurisdictions with the highest housing costs receive a larger percentage of their RHNA as lower-income units than other jurisdictions in the region, and the jurisdictions with the most households in High or Highest Resource census tracts also receive a larger percentage of their allocations as lower-income units than other jurisdictions.
Local governments will have an opportunity to address
ABAG REGIONAL HOUSING NEEDS ALLOCATION DRAFT METHODOLOGY: SAN FRANCISCO BAY AREA, 2023-203156
jurisdiction-specific issues related to cost-burdened households when they update their housing elements. ABAG-MTC staff will include data on jurisdiction-specific rates of housing cost burden as part of housing data packets being prepared to assist with housing element updates.
7. The rate of overcrowding.
During the consultation process for the RHND, ABAG worked with HCD to compare the Bay Area’s rate of overcrowding to comparable regions throughout the United States. The comparison used data from the 2014-2018 American Community Survey (ACS) to evaluate overcrowding. The Bay Area’s overcrowding rate of 6.73 percent is nearly double the rate of comparable regions. Consequently, ABAG’s RHND includes an overcrowding adjustment.22
Overcrowding rates are inputs into the Plan Bay Area 2050 regional growth forecast, which is used as the baseline allocation in the draft methodology. As noted earlier, Plan Bay Area 2050 also directly incorporates multiple strategies to address housing affordability, and these strategies also seek to reduce overcrowding.
Like housing cost burden, overcrowding indicates a lack of adequate housing supply, especially housing units affordable for lower-income households. The draft methodology seeks to expand the housing supply, and especially the supply of affordable units, within the most expensive parts of the region, which can help reduce the rates of overcrowding experienced by Bay Area households. As shown in Appendix 2, the draft
methodology results in the jurisdictions with the highest housing costs receiving a larger percentage of their RHNA as lower-income units than other jurisdictions and a share of the region’s total RHNA that is 8 percent larger than their share of the region’s households.
Local governments will have an opportunity to address jurisdiction-specific issues related to overcrowded households when they update their housing elements. ABAG-MTC staff will include data on jurisdiction-specific rates of overcrowding as part of housing data packets being prepared to assist with housing element updates.
8. The housing needs of farmworkers.
ABAG included questions about housing needs for the region’s farmworkers in its survey of local jurisdictions, however consistent data is not available for all Bay Area jurisdictions. ABAG’s draft RHNA methodology incorporates this factor through its emphasis on proximity to jobs, which includes agricultural jobs. As shown in Appendix 2, the draft methodology also results in jurisdictions with the most low-wage jobs per housing unit affordable to low-wage workers receiving higher percentages of affordable housing compared to other jurisdictions in the region. This outcome is supported by inclusion of the equity adjustment in the RHNA methodology, which directed additional lower-income units to jurisdictions with an imbalanced jobs-housing fit. As a result, jurisdictions with larger farmworker housing need will be expected to provide more very low- and low-income units to meet this demand.
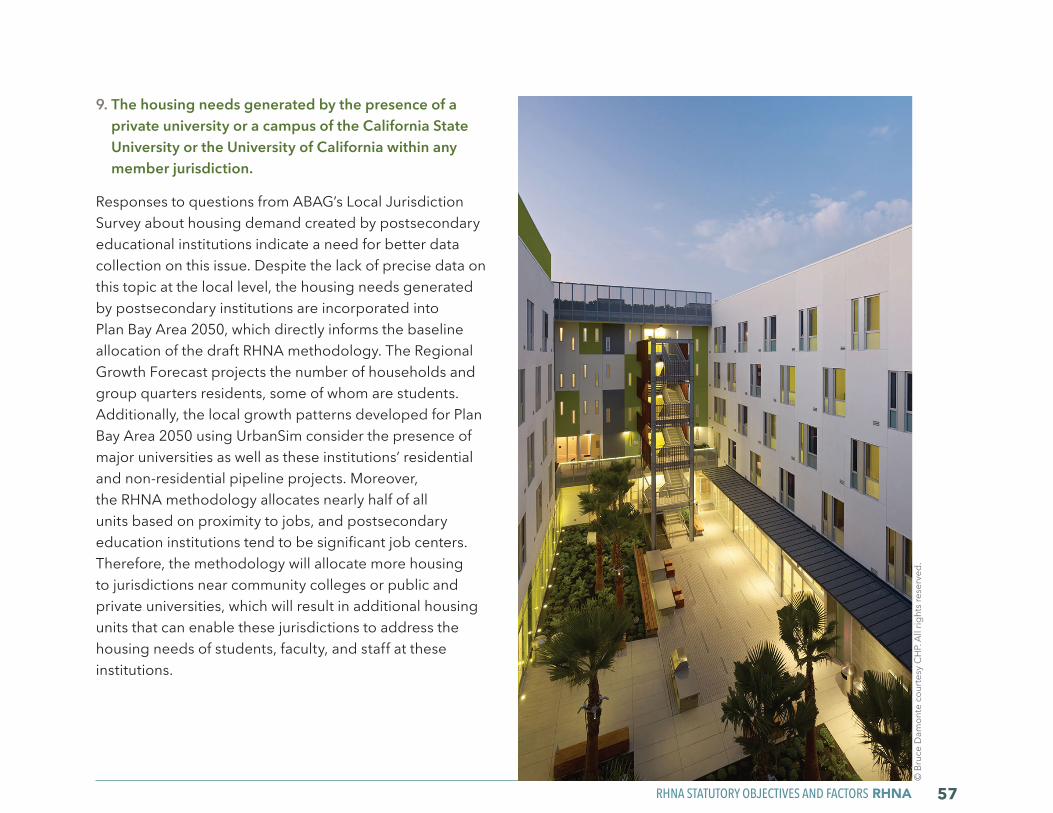
RHNA STATUTORY OBJECTIVES AND FACTORS RHNA 57
9. The housing needs generated by the presence of a private university or a campus of the California State University or the University of California within any member jurisdiction.
Responses to questions from ABAG’s Local Jurisdiction Survey about housing demand created by postsecondary educational institutions indicate a need for better data collection on this issue. Despite the lack of precise data on this topic at the local level, the housing needs generated by postsecondary institutions are incorporated into Plan Bay Area 2050, which directly informs the baseline allocation of the draft RHNA methodology. The Regional Growth Forecast projects the number of households and group quarters residents, some of whom are students. Additionally, the local growth patterns developed for Plan Bay Area 2050 using UrbanSim consider the presence of major universities as well as these institutions’ residential and non-residential pipeline projects. Moreover, the RHNA methodology allocates nearly half of all units based on proximity to jobs, and postsecondary education institutions tend to be significant job centers. Therefore, the methodology will allocate more housing to jurisdictions near community colleges or public and private universities, which will result in additional housing units that can enable these jurisdictions to address the housing needs of students, faculty, and staff at these institutions.
© B
ruce
Dam
onte
cou
rtesy
CH
P. Al
l rig
hts r
eser
ved.
ABAG REGIONAL HOUSING NEEDS ALLOCATION DRAFT METHODOLOGY: SAN FRANCISCO BAY AREA, 2023-203158
10. The housing needs of individuals and families experiencing homelessness.
Comprehensive jurisdiction-level data about individuals and families experiencing homelessness is not available for all Bay Area jurisdictions in a consistent format. As a result, this topic was not included as a specific factor in the draft RHNA methodology. However, the methodology does consider the housing needs of individuals and families experiencing homelessness by allocating very low- and low-income units to all jurisdictions throughout the region. As the RHNA methodology focuses on access to opportunity and proximity to jobs, the methodology can help ensure that housing targeted toward people experiencing homelessness can enable them to access employment and other essential resources for stability and economic mobility. Furthermore, ABAG will encourage all local jurisdictions to adequately plan for the needs of those experiencing homelessness in their housing elements.
11. The loss of units during a state of emergency that was declared by the Governor pursuant to the California Emergency Services Act (Chapter 7 (commencing with Section 8550) of Division 1 of Title 2), during the planning period immediately preceding the relevant revision pursuant to Section 65588 that have yet to be rebuilt or replaced at the time of the analysis.
ABAG received two responses in the survey of local jurisdictions that identified the number of units lost during declared states of emergency. The City of Santa Rosa indicated that 3,043 housing units were lost on October 8,
2017 and that, as of February 2020 when the survey was conducted, 2,323 units had been completed or were in the construction/permitting process. The County of Sonoma stated the unincorporated county lost 2,200 units in the 2017 Sonoma Complex Fires and 1,235 units had been rebuilt or were under construction as of February 2020. The County also lost 176 units in the 2019 Kincade fire and 4 were in the process of being rebuilt as of February 2020. Unincorporated Napa County also reported to the California Department of Finance (DOF) that it lost 587 housing units in during the wildfires that took place in 2017.
In developing the RHND, HCD analyzed Bay Area jurisdictions’ annual reports to DOF and found that the ten-year annual average rate of demolitions for the Bay Area is 0.40 percent of the housing stock. The RHND included HCD’s minimum replacement adjustment of 0.5 percent, which exceeds the region’s demolition rate. This adjustment added 15,120 housing units to the RHND. Since the demolition adjustment in the RHND included significantly more units than were lost, it was not necessary to include a specific factor in the draft methodology to address the loss of units.
12. The region’s greenhouse gas emissions targets provided by the State Air Resources Board pursuant to Section 65080.
Plan Bay Area 2050, which is used as the baseline allocation in the draft RHNA methodology, includes a diverse range of strategies to reduce greenhouse gas emissions, including:
59
• Focusing more housing growth in areas near high-quality public transit and in high-resource communities near job centers
• Redeveloping aging malls and office parks in mixed-income communities
• Vastly expanding the amount of funding for production and preservation of affordable housing
• Focusing more job growth near high-quality public transit, especially in housing-rich communities to address jobs-housing imbalance
• Investing in new local and regional rail lines, express buses, local bus systems, and more to serve communities across the Bay Area
• Investing in world-class bicycle and pedestrian infrastructure in all communities to enable neighborhood trips to be completed without a car.
The greenhouse gas reduction forecasts in Plan Bay Area 2050 are subject to the review of the State Air Resources Board. The Final Blueprint meets and exceeds the 19 percent per-capita target set for this planning cycle.
Additionally, the draft RHNA methodology’s allocation factors focus on locating housing near jobs. As a result, as shown in Appendix 2, jurisdictions with the most access to jobs and transit as well as those with the lowest VMT per resident experience higher growth rates resulting from the draft RHNA methodology’s allocations.
13. Any other factors adopted by the council of governments, that further the objectives listed in subdivision (d) of Section 65584, provided that the council of governments specifies which of the objectives each additional factor is necessary to further.
No other planning factors were adopted by ABAG to review as a specific local planning factor.
ABAG
-MTC
Pho
to A
rchi
ve.
RHNA STATUTORY OBJECTIVES AND FACTORS RHNA
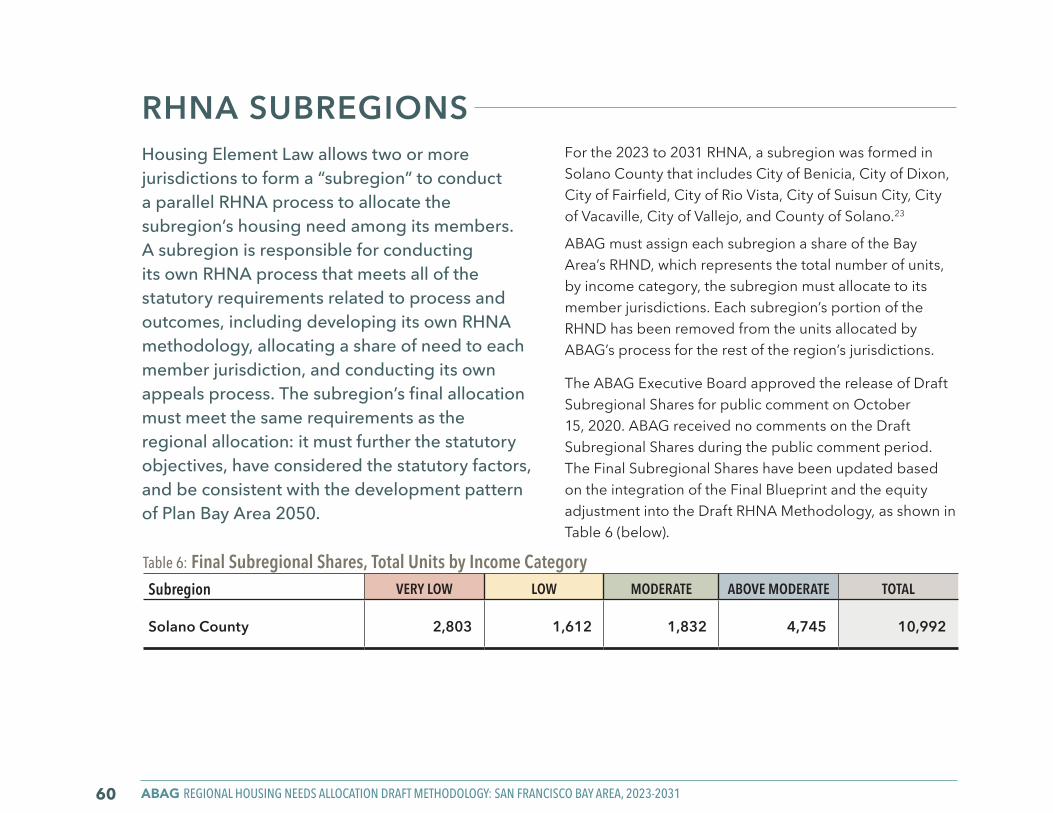
ABAG REGIONAL HOUSING NEEDS ALLOCATION DRAFT METHODOLOGY: SAN FRANCISCO BAY AREA, 2023-203160
Housing Element Law allows two or more jurisdictions to form a “subregion” to conduct a parallel RHNA process to allocate the subregion’s housing need among its members. A subregion is responsible for conducting its own RHNA process that meets all of the statutory requirements related to process and outcomes, including developing its own RHNA methodology, allocating a share of need to each member jurisdiction, and conducting its own appeals process. The subregion’s final allocation must meet the same requirements as the regional allocation: it must further the statutory objectives, have considered the statutory factors, and be consistent with the development pattern of Plan Bay Area 2050.
For the 2023 to 2031 RHNA, a subregion was formed in Solano County that includes City of Benicia, City of Dixon, City of Fairfield, City of Rio Vista, City of Suisun City, City of Vacaville, City of Vallejo, and County of Solano.23
ABAG must assign each subregion a share of the Bay Area’s RHND, which represents the total number of units, by income category, the subregion must allocate to its member jurisdictions. Each subregion’s portion of the RHND has been removed from the units allocated by ABAG’s process for the rest of the region’s jurisdictions.
The ABAG Executive Board approved the release of Draft Subregional Shares for public comment on October 15, 2020. ABAG received no comments on the Draft Subregional Shares during the public comment period. The Final Subregional Shares have been updated based on the integration of the Final Blueprint and the equity adjustment into the Draft RHNA Methodology, as shown in Table 6 (below).
RHNA SUBREGIONS
Table 6: Final Subregional Shares, Total Units by Income Category Subregion VERY LOW LOW MODERATE ABOVE MODERATE TOTAL
Solano County 2,803 1,612 1,832 4,745 10,992
SUBREGIONS AND NEXT STEPS RHNA 61
NEXT STEPSFollowing approval by the ABAG Executive Board in January 2021, the draft RHNA methodology was submitted to HCD for its review. Within 60 days, HCD will review the draft methodology and provide any findings to ABAG. The Executive Board will be asked to adopt a final methodology in spring 2021. At that time, ABAG will issue a draft allocation showing the number of housing units, by income category, that each jurisdiction receives based on the final adopted methodology.
Following the release of the draft allocations, during summer/fall 2021 ABAG will conduct the required appeals process where a local government or HCD can appeal any local government’s draft allocation.24 After ABAG conducts a public hearing to consider appeals and takes action on them, it will
adopt the final allocation plan, currently slated for the end of 2021. Once each jurisdiction receives its RHNA allocation, it must revise its housing element by January 2023 to show how it plans to accommodate its portion of the Bay Area's housing need.
As noted previously, ABAG-MTC will also continue discussions with local jurisdictions about opportunities to direct additional RHNA units from unincorporated counties to incorporated areas, including the use of the provisions in Housing Element Law that allow a county transfer a portion of its RHNA allocation to a city or town after it receives its RHNA allocation from ABAG.
© B
arrie
Rok
each
, 201
0. A
ll Ri
ghts
Res
erve
d
ABAG REGIONAL HOUSING NEEDS ALLOCATION DRAFT METHODOLOGY: SAN FRANCISCO BAY AREA, 2023-203162
ENDNOTES1 Government Code Section 65580 covers all facets of Housing Element Law.
The RHNA process is covered in Section 65584. RHNA factors are covered in Section 65584.04; objectives are covered in 65584(d).
2 The four income categories included in the RHND are:• Very Low Income: 0-50% of Area Median Income• Low Income: 50-80% of Area Median Income• Moderate Income: 80-120% of Area Median Income• Above Moderate Income: 120% or more of Area Median Income
3 Read more on the HCD Regional Housing Needs Allocation and Housing Elements web page.
4 More details about the RHND is available on the ABAG RHNA website (scroll to bottom of page). At this time, the RHND has been finalized by the State for the Bay Area’s RHNA process.
5 Government Code Section 65584.01. 6 Government Code Section 65584(d).7 Government Code Section 65584.04(m)(1).8 According to Government Code Section 65584(e), affirmatively furthering
fair housing means “For purposes of this section, “affirmatively furthering fair housing” means taking meaningful actions, in addition to combating discrimination, that overcome patterns of segregation and foster inclusive communities free from barriers that restrict access to opportunity based on protected characteristics. Specifically, affirmatively furthering fair housing means taking meaningful actions that, taken together, address significant disparities in housing needs and in access to opportunity, replacing segregated living patterns with truly integrated and balanced living patterns, transforming racially and ethnically concentrated areas of poverty into areas of opportunity, and fostering and maintaining compliance with civil rights and fair housing laws.”
9 See State of California Government Code Section 65584.04(b)(1).10 A summary of the Local Jurisdiction Survey responses is available on the
ABAG website.11 For letters HCD sent to other regions, see the January 2020 HMC meeting
agenda packet. 12 The Draft RHNA Methodology and Plan Bay Area 2050 are consistent for all
nine counties and in 33 of 34 superdistricts (i.e., sub-county areas) using the methodology developed during the HMC process. In the one superdistrict flagged during the consistency check, the Final Blueprint reflects the loss of more than 1,000 homes in wildfires since 2015. Anticipated reconstruction of these units during the RHNA period does not yield significant net growth in housing units, making these allocations consistent with the Final Blueprint long-range projections.
13 Plan Bay Area 2050 is the long-range regional plan for the San Francisco Bay Area, serving as the 2021 Regional Transportation Plan/SustainableCommunities Strategy for the Bay Area
14 For more information on the Opportunity Map, see pages 10-13 of this document from the March 2020 HMC meeting’s agenda packet.
15 See Government Code Section 65584(e).
16 Jurisdictions with above-average levels of racial and economic exclusion were identified based on their divergence index scores and their percentage of households above 120 percent Area Median Income. The divergence index score is a calculation of how different a jurisdiction’s racial demographics are from the region’s demographics. If a jurisdiction has the same racial distribution as the region, the jurisdiction’s divergence index is scored at 0. The more a jurisdiction’s demographics diverge from the regional distribution, the higher the divergence index score. A high score does not necessarily indicate that the jurisdiction is racially homogenous, only that its demographic profile differs markedly from the region’s racial demographics. Given the multitude of racial and ethnic groups in the Bay Area, the Othering and Belonging Institute at UC Berkeley has identified the Divergence Index as the best measure of segregation in the region in part because this measure captures segregation for multiple racial groups simultaneously.
17 Bay Area UrbanSim 2.0 is a spatially explicit economic model that forecasts future business and household locations. It forecasts future land use change (e.g., development or redevelopment) starting from an integrated base year database containing information on the buildings, households, businesses and land use policies within the region. During the simulation, Bay Area UrbanSim 2.0 forecasts the choices real estate developers make on how much, what, and where to build, based upon future-focused public policy inputs (strategies & growth geographies adopted for use in Plan Bay Area 2050). This adds additional housing units and commercial space in profitable locations (i.e., land use policies at the site allow the construction of a building that is profitable under forecast demand). Additional documentation for Bay Area UrbanSim 2.0 is available at: https://github.com/UDST/bayarea_urbansim
18 For purposes of designating High-Resource Areas in the Blueprint, “near transit” was defined as within 1/2 mile of a rail station, ferry terminal or bus stop with peak headways of 15 minutes or less, or within 1/4 mile of a bus stop with peak headways of 30 minutes or less.
19 Transit Priority Areas are defined in the California Public Resources Code, Section 21099 as areas within 1/2 mile of a Major Transit stop, which could be any of the following:
• Existing rail stations • Planned rail stations in an adopted Regional Transportation Plan • Existing ferry terminals with bus or rail • Planned ferry terminals with bus or rail service in an adopted
Regional Transportation Plan • Intersection of at least two existing or planned bus routes with
headways of 15 minutes or better during both the morning and evening peak periods
20 Government Code Section 65584.07.21 See the June 9, 2020 letter in which HCD provided the RHND for the Bay Area.22 See the June 9, 2020 letter in which HCD provided the RHND for the Bay Area.23 The jurisdictions that had decided to form a subregion in Napa County (City
of American Canyon, City of Napa, Town of Yountville, and the County of Napa) decided in December 2020 to dissolve their subregion. As a result, these jurisdictions will participate in the RHNA process ABAG is conducting and will receive allocations based on the RHNA methodology adopted by ABAG.
24 Government Code Section 65584.05
CHAPTER.SECTION HERE RHNA A1
APPENDICESAppendix 1: Bay Area Regional Housing Needs Determination Letter from HCD
Appendix 2: Evaluation Metrics
Appendix 3:Equity Adjustment
Appendix 4:Illustrative Allocations
Appendix 5: Summary of Local Jurisdiction Survey Results
© Jim Maurer, 2018. All Rights Reserved.
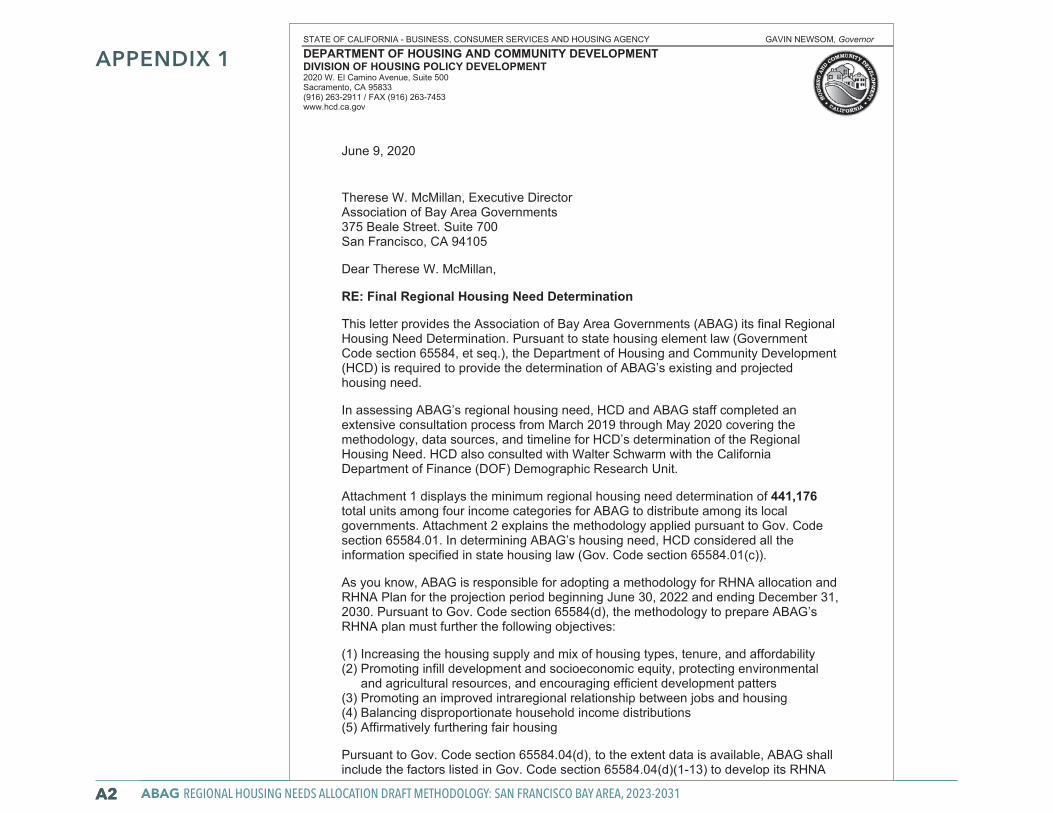
ABAG REGIONAL HOUSING NEEDS ALLOCATION DRAFT METHODOLOGY: SAN FRANCISCO BAY AREA, 2023-2031A2A2
APPENDIX 1STATE OF CALIFORNIA - BUSINESS, CONSUMER SERVICES AND HOUSING AGENCY GAVIN NEWSOM, Governor
DEPARTMENT OF HOUSING AND COMMUNITY DEVELOPMENT DIVISION OF HOUSING POLICY DEVELOPMENT 2020 W. El Camino Avenue, Suite 500 Sacramento, CA 95833 (916) 263-2911 / FAX (916) 263-7453 www.hcd.ca.gov
June 9, 2020
Therese W. McMillan, Executive Director Association of Bay Area Governments 375 Beale Street. Suite 700 San Francisco, CA 94105
Dear Therese W. McMillan,
RE: Final Regional Housing Need Determination
This letter provides the Association of Bay Area Governments (ABAG) its final Regional Housing Need Determination. Pursuant to state housing element law (Government Code section 65584, et seq.), the Department of Housing and Community Development (HCD) is required to provide the determination of ABAG’s existing and projected housing need.
In assessing ABAG’s regional housing need, HCD and ABAG staff completed an extensive consultation process from March 2019 through May 2020 covering the methodology, data sources, and timeline for HCD’s determination of the Regional Housing Need. HCD also consulted with Walter Schwarm with the California Department of Finance (DOF) Demographic Research Unit.
Attachment 1 displays the minimum regional housing need determination of 441,176 total units among four income categories for ABAG to distribute among its local governments. Attachment 2 explains the methodology applied pursuant to Gov. Code section 65584.01. In determining ABAG’s housing need, HCD considered all the information specified in state housing law (Gov. Code section 65584.01(c)).
As you know, ABAG is responsible for adopting a methodology for RHNA allocation and RHNA Plan for the projection period beginning June 30, 2022 and ending December 31, 2030. Pursuant to Gov. Code section 65584(d), the methodology to prepare ABAG’s RHNA plan must further the following objectives:
(1) Increasing the housing supply and mix of housing types, tenure, and affordability (2) Promoting infill development and socioeconomic equity, protecting environmental
and agricultural resources, and encouraging efficient development patters (3) Promoting an improved intraregional relationship between jobs and housing (4) Balancing disproportionate household income distributions (5) Affirmatively furthering fair housing
Pursuant to Gov. Code section 65584.04(d), to the extent data is available, ABAG shall include the factors listed in Gov. Code section 65584.04(d)(1-13) to develop its RHNA
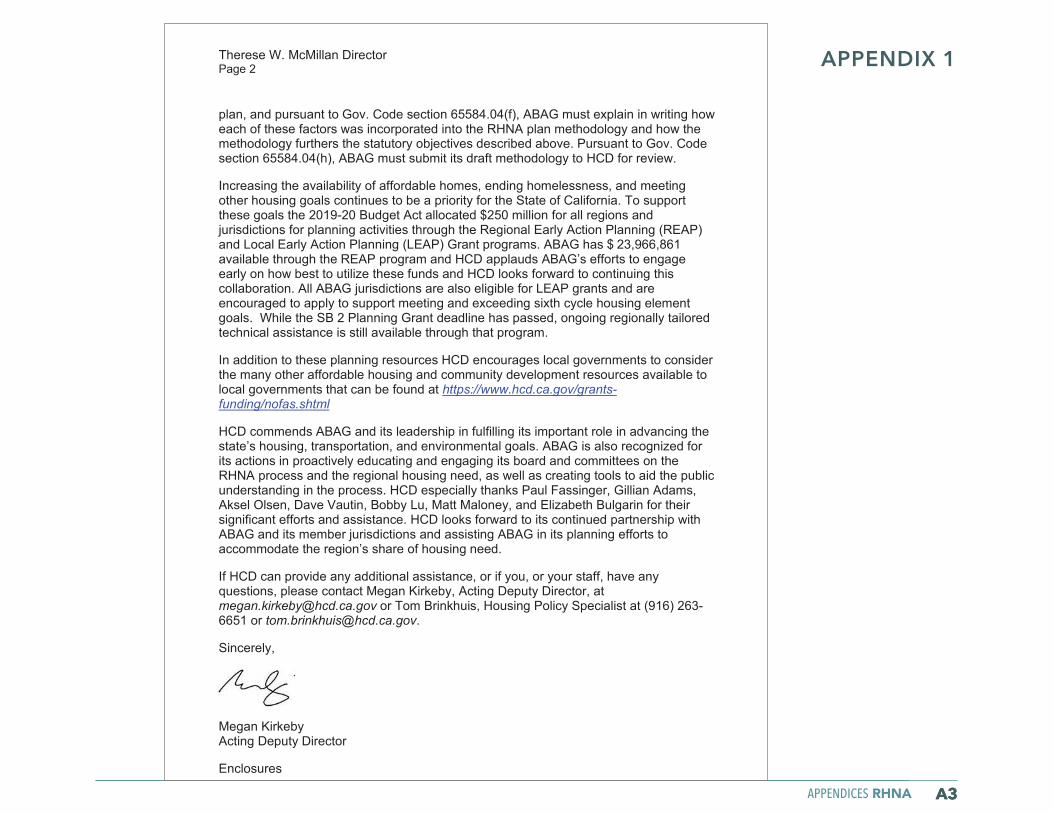
APPENDICES RHNA A3A3
APPENDIX 1 Therese W. McMillan Director Page 2
plan, and pursuant to Gov. Code section 65584.04(f), ABAG must explain in writing how each of these factors was incorporated into the RHNA plan methodology and how the methodology furthers the statutory objectives described above. Pursuant to Gov. Code section 65584.04(h), ABAG must submit its draft methodology to HCD for review.
Increasing the availability of affordable homes, ending homelessness, and meeting other housing goals continues to be a priority for the State of California. To support these goals the 2019-20 Budget Act allocated $250 million for all regions and jurisdictions for planning activities through the Regional Early Action Planning (REAP) and Local Early Action Planning (LEAP) Grant programs. ABAG has $ 23,966,861 available through the REAP program and HCD applauds ABAG’s efforts to engage early on how best to utilize these funds and HCD looks forward to continuing this collaboration. All ABAG jurisdictions are also eligible for LEAP grants and are encouraged to apply to support meeting and exceeding sixth cycle housing element goals. While the SB 2 Planning Grant deadline has passed, ongoing regionally tailored technical assistance is still available through that program.
In addition to these planning resources HCD encourages local governments to consider the many other affordable housing and community development resources available to local governments that can be found at https://www.hcd.ca.gov/grants-funding/nofas.shtml
HCD commends ABAG and its leadership in fulfilling its important role in advancing the state’s housing, transportation, and environmental goals. ABAG is also recognized for its actions in proactively educating and engaging its board and committees on the RHNA process and the regional housing need, as well as creating tools to aid the public understanding in the process. HCD especially thanks Paul Fassinger, Gillian Adams, Aksel Olsen, Dave Vautin, Bobby Lu, Matt Maloney, and Elizabeth Bulgarin for their significant efforts and assistance. HCD looks forward to its continued partnership with ABAG and its member jurisdictions and assisting ABAG in its planning efforts to accommodate the region’s share of housing need.
If HCD can provide any additional assistance, or if you, or your staff, have any questions, please contact Megan Kirkeby, Acting Deputy Director, at [email protected] or Tom Brinkhuis, Housing Policy Specialist at (916) 263-6651 or [email protected].
Sincerely,
Megan Kirkeby Acting Deputy Director
Enclosures
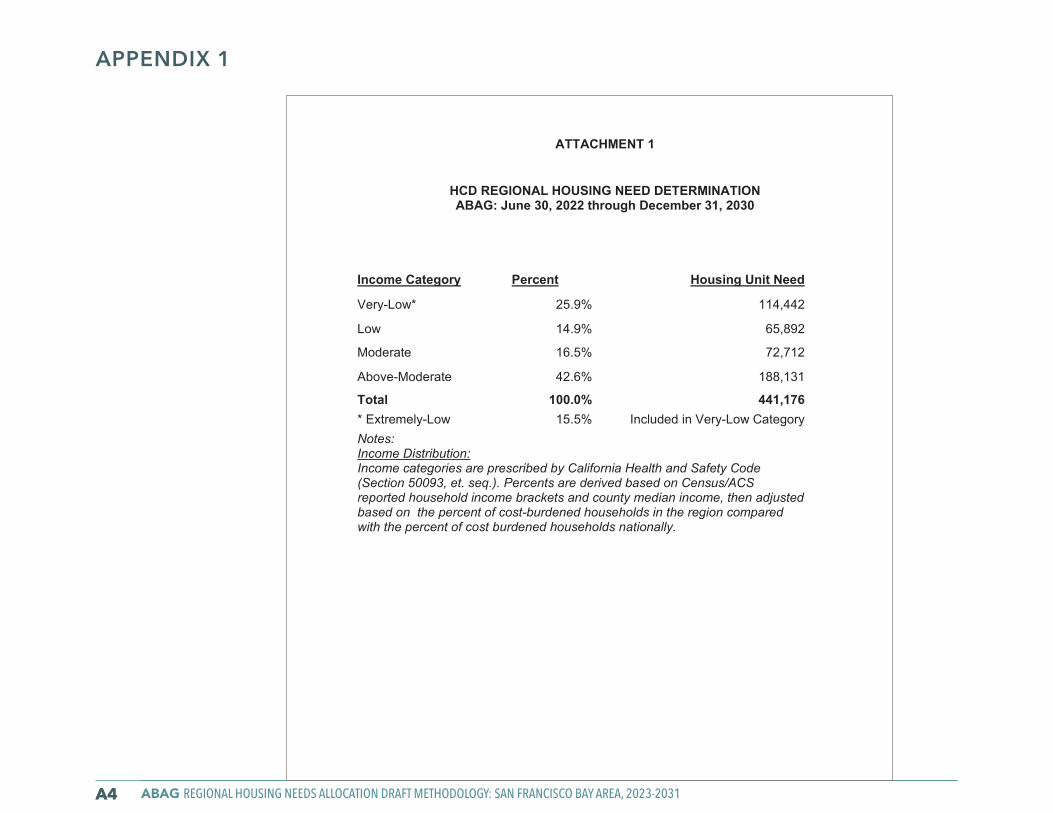
ABAG REGIONAL HOUSING NEEDS ALLOCATION DRAFT METHODOLOGY: SAN FRANCISCO BAY AREA, 2023-2031A4A4
APPENDIX 1
ATTACHMENT 1
HCD REGIONAL HOUSING NEED DETERMINATION ABAG: June 30, 2022 through December 31, 2030
Income Category Percent Housing Unit Need
Very-Low* 25.9% 114,442
Low 14.9% 65,892
Moderate 16.5% 72,712
Above-Moderate 42.6% 188,131
Total 100.0% 441,176 * Extremely-Low 15.5% Included in Very-Low Category Notes: Income Distribution: Income categories are prescribed by California Health and Safety Code (Section 50093, et. seq.). Percents are derived based on Census/ACS reported household income brackets and county median income, then adjusted based on the percent of cost-burdened households in the region compared with the percent of cost burdened households nationally.
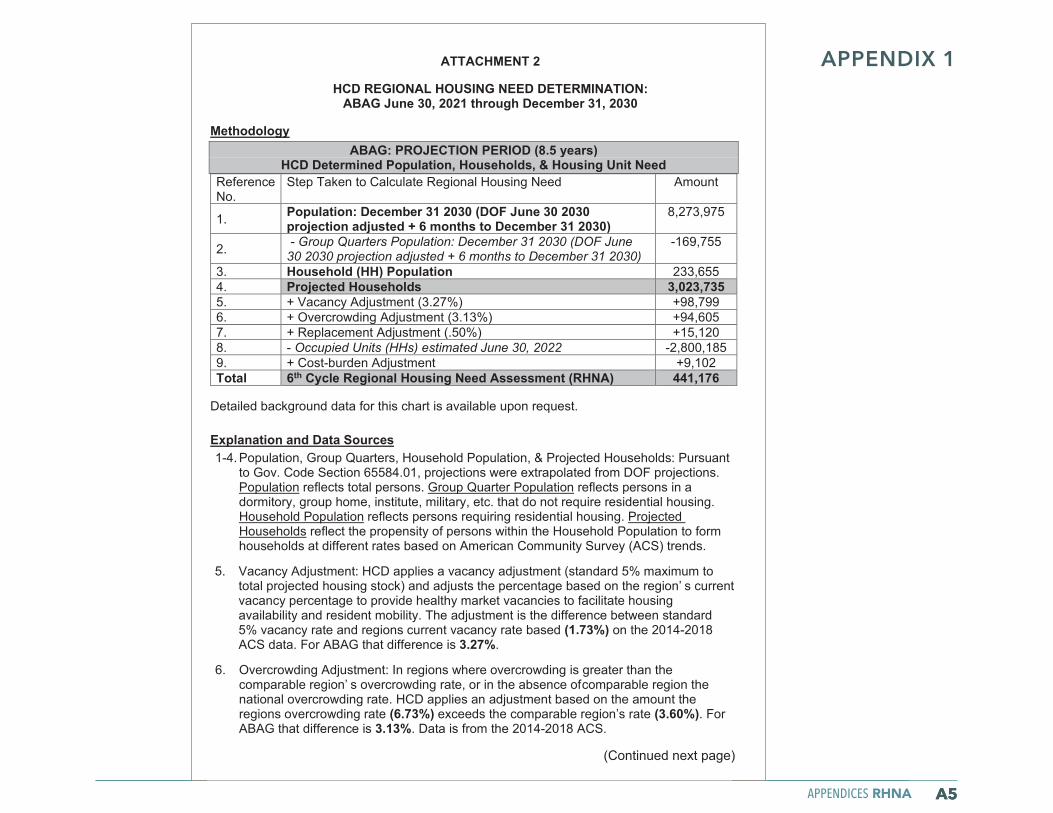
APPENDICES RHNA A5A5
APPENDIX 1
ATTACHMENT 2
HCD REGIONAL HOUSING NEED DETERMINATION: ABAG June 30, 2021 through December 31, 2030
Methodology ABAG: PROJECTION PERIOD ( 8 .5 years)
HCD Determined Pop ulation, Households, & Housing Unit Need R ef erence N o.
S tep T ak en to Calculate R egional H ous ing N eed Amount
1. Pop ulation: December 31 2030 ( DOF June 30 2030 p roj ection adj usted + 6 months to December 31 2030)
8,273,975
2. - G roup Q uarters Population: December 31 2 030 (DO F J une 30 2 030 projection adjusted + 6 months to December 31 2 030)
-169,755
3. Household ( HH) Pop ulation 233,655 4. Proj ected Households 3,023,735 5. + Vacancy Adj us tment ( 3.27%) + 98,799 6. + O vercrowding Adj us tment ( 3.13%) + 94,60 5 7. + R ep lacement Adj us tment ( .50 %) + 15,120 8. - O ccupied U nits (HHs) estimated J une 30, 2 02 2 -2,80 0 ,185 9. + Cos t-burden Adj us tment + 9,10 2 Total 6th Cycle Regional Housing Need Assessment ( RHNA) 441,176
D etailed back ground data f or th is ch art is available up on req ues t.
Ex p lanation and Data Sources 1-4. P op ulation, G roup Q uarters , H ous eh old P op ulation, & P roj ected H ous eh olds : P urs uant
to G ov. Code S ection 65584.0 1, p roj ections were extrap olated f rom D O F p roj ections . P op ulation ref lects total p ers ons . G roup Q uarter P op ulation ref lects p ers ons in a dormitory, group h ome, ins titute, military, etc. th at do not req uire res idential h ous ing. H ous eh old P op ulation ref lects p ers ons req uiring res idential h ous ing. P roj ected H ous eh olds ref lect th e p rop ens ity of p ers ons with in th e H ous eh old P op ulation to f orm h ous eh olds at dif f erent rates bas ed on American Community S urvey ( ACS ) trends .
5. Vacancy Adj us tment: H CD ap p lies a vacancy adj us tment ( s tandard 5% maximum to total p roj ected h ous ing s tock ) and adj us ts th e p ercentage bas ed on th e region’ s current vacancy p ercentage to p rovide h ealth y mark et vacancies to f acilitate h ous ing availability and res ident mobility. T h e adj us tment is th e dif f erence between s tandard 5% vacancy rate and regions current vacancy rate bas ed ( 1.73%) on th e 20 14-20 18 ACS data. F or AB AG th at dif f erence is 3.27%.
6. O vercrowding Adj us tment: In regions wh ere overcrowding is greater th an th e comp arable region’ s overcrowding rate, or in th e abs ence of comp arable region th e national overcrowding rate. H CD ap p lies an adj us tment bas ed on th e amount th e regions overcrowding rate ( 6.73%) exceeds th e comp arable region’ s rate ( 3.60%) . F or AB AG th at dif f erence is 3.13%. D ata is f rom th e 20 14-20 18 ACS .
7. R ep lacement Adj us tment: H CD ap p lies a rep lacement adj us tment between .5% and 5% to th e total h ous ing s tock bas ed on th e current 10 -year annual average p ercent of demolitions th e region’ s local government annual rep orts to D ep artment of F inance ( D O F ) . F or AB AG th e 10 -year annual average multip lied by th e length of th e p roj ection p eriod is .40 %, and th e minimum .5 0% adj us tment is ap p lied.
(Continued next page)
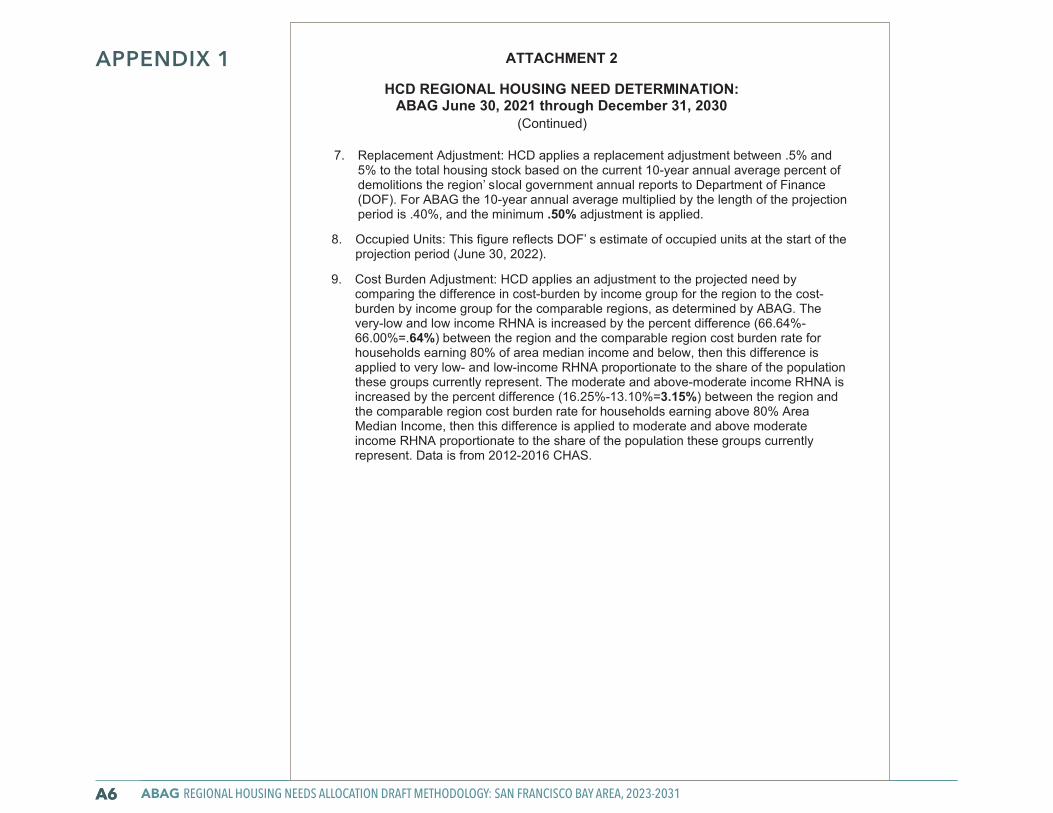
ABAG REGIONAL HOUSING NEEDS ALLOCATION DRAFT METHODOLOGY: SAN FRANCISCO BAY AREA, 2023-2031A6A6
APPENDIX 1
8. O ccup ied U nits : T h is f igure ref lects D O F ’ s es timate of occup ied units at th e s tart of th e
p roj ection p eriod ( J une 30 , 20 22) .
9. Cos t B urden Adj us tment: H CD ap p lies an adj us tment to th e p roj ected need by comp aring th e dif f erence in cos t-burden by income group f or th e region to th e cos t-burden by income group f or th e comp arable regions , as determined by AB AG . T h e very-low and low income R H N A is increas ed by th e p ercent dif f erence ( 66.64%-66.0 0 %= .64% ) between th e region and th e comp arable region cos t burden rate f or h ous eh olds earning 80 % of area median income and below, th en th is dif f erence is ap p lied to very low- and low-income R H N A p rop ortionate to th e s h are of th e p op ulation th es e group s currently rep res ent. T h e moderate and above-moderate income R H N A is increas ed by th e p ercent dif f erence ( 16.25%-13.10 %= 3.15 % ) between th e region and th e comp arable region cos t burden rate f or h ous eh olds earning above 80 % Area Median Income, th en th is dif f erence is ap p lied to moderate and above moderate income R H N A p rop ortionate to th e s h are of th e p op ulation th es e group s currently rep res ent. D ata is f rom 20 12-20 16 CH AS .
ATTACHMENT 2
HCD REGIONAL HOUSING NEED DETERMINATION: ABAG June 30, 2021 through December 31, 2030
Methodology ABAG: PROJECTION PERIOD ( 8 .5 years)
HCD Determined Pop ulation, Households, & Housing Unit Need R ef erence N o.
S tep T ak en to Calculate R egional H ous ing N eed Amount
1. Pop ulation: December 31 2030 ( DOF June 30 2030 p roj ection adj usted + 6 months to December 31 2030)
8,273,975
2. - G roup Q uarters Population: December 31 2 030 (DO F J une 30 2 030 projection adjusted + 6 months to December 31 2 030)
-169,755
3. Household ( HH) Pop ulation 233,655 4. Proj ected Households 3,023,735 5. + Vacancy Adj us tment ( 3.27%) + 98,799 6. + O vercrowding Adj us tment ( 3.13%) + 94,60 5 7. + R ep lacement Adj us tment ( .50 %) + 15,120 8. - O ccupied U nits (HHs) estimated J une 30, 2 02 2 -2,80 0 ,185 9. + Cos t-burden Adj us tment + 9,10 2 Total 6th Cycle Regional Housing Need Assessment ( RHNA) 441,176
D etailed back ground data f or th is ch art is available up on req ues t.
Ex p lanation and Data Sources 1-4. P op ulation, G roup Q uarters , H ous eh old P op ulation, & P roj ected H ous eh olds : P urs uant
to G ov. Code S ection 65584.0 1, p roj ections were extrap olated f rom D O F p roj ections . P op ulation ref lects total p ers ons . G roup Q uarter P op ulation ref lects p ers ons in a dormitory, group h ome, ins titute, military, etc. th at do not req uire res idential h ous ing. H ous eh old P op ulation ref lects p ers ons req uiring res idential h ous ing. P roj ected H ous eh olds ref lect th e p rop ens ity of p ers ons with in th e H ous eh old P op ulation to f orm h ous eh olds at dif f erent rates bas ed on American Community S urvey ( ACS ) trends .
5. Vacancy Adj us tment: H CD ap p lies a vacancy adj us tment ( s tandard 5% maximum to total p roj ected h ous ing s tock ) and adj us ts th e p ercentage bas ed on th e region’ s current vacancy p ercentage to p rovide h ealth y mark et vacancies to f acilitate h ous ing availability and res ident mobility. T h e adj us tment is th e dif f erence between s tandard 5% vacancy rate and regions current vacancy rate bas ed ( 1.73%) on th e 20 14-20 18 ACS data. F or AB AG th at dif f erence is 3.27%.
6. O vercrowding Adj us tment: In regions wh ere overcrowding is greater th an th e comp arable region’ s overcrowding rate, or in th e abs ence of comp arable region th e national overcrowding rate. H CD ap p lies an adj us tment bas ed on th e amount th e regions overcrowding rate ( 6.73%) exceeds th e comp arable region’ s rate ( 3.60%) . F or AB AG th at dif f erence is 3.13%. D ata is f rom th e 20 14-20 18 ACS .
7. R ep lacement Adj us tment: H CD ap p lies a rep lacement adj us tment between .5% and 5% to th e total h ous ing s tock bas ed on th e current 10 -year annual average p ercent of demolitions th e region’ s local government annual rep orts to D ep artment of F inance ( D O F ) . F or AB AG th e 10 -year annual average multip lied by th e length of th e p roj ection p eriod is .40 %, and th e minimum .5 0% adj us tment is ap p lied.
(Continued)
APPENDICES RHNA A7
APPENDIX 2
Overview of Performance Evaluation Metrics
1 See California Government Code Section 65584(d).2 For copies of letters HCD sent to other regions, see this document from the January 2020 HMC meeting agenda packet.
The RHNA allocation methodology must meet five objectives identified in Housing Element Law.1 To help ensure that any proposed methodology will meet the statutory RHNA objectives and receive approval from the California Department of Housing and Community Development (HCD), ABAG-MTC staff developed a set of evaluation metrics to assess different methodology options. These metrics are based largely on the analytical framework used by HCD in evaluating the draft methodologies completed by other regions in California, as evidenced by the approval letters HCD provided to the Sacramento Area Council of Governments (SACOG), San Diego Association of Governments (SANDAG), and Southern California Association of Governments (SCAG).2 Other metrics reflect input from members of the Housing Methodology Committee (HMC).
In the evaluation metrics, each statutory objective has been reframed as a question that reflects the language Housing Element Law uses to define the objectives. Each statutory objective is accompanied by quantitative metrics for evaluating the allocation produced by a methodology. The metrics are structured as a comparison between the allocations to the top jurisdictions in the region for a particular characteristic – such as jurisdictions with the most expensive housing costs – and the allocations to the rest of the jurisdictions in the region.
Metrics Based on Lower-Income Unit Percentage vs. Metrics Based on Total AllocationSeveral of the metrics focus on whether jurisdictions with certain characteristics receive a significant share of their RHNA as lower-income units. These metrics reflect HCD’s analysis in its letters evaluating RHNA methodologies from other regions. However, HMC members advocated for metrics that also examine the total number of units assigned to a jurisdiction. These HMC members asserted that it is ultimately less impactful if a jurisdiction receives a high share of its RHNA as lower-income units if that same jurisdiction receives few units overall. Accordingly, each metric that focuses on the share of lower-income units assigned to jurisdictions with certain characteristics is paired with a complementary metric that examines whether those jurisdictions also receive a share of the regional housing need that is at least proportional to their share of the region’s households. A value of 1.0 for these complementary metrics means that the group of jurisdictions’ overall share of RHNA is proportional relative to its overall share of households in 2020, while a value below 1.0 is less than proportional.
Evaluation of Draft RHNA MethodologyThe graphs below show how well the draft RHNA methodology performs in achieving the five statutory RHNA objectives based on the evaluation metrics.
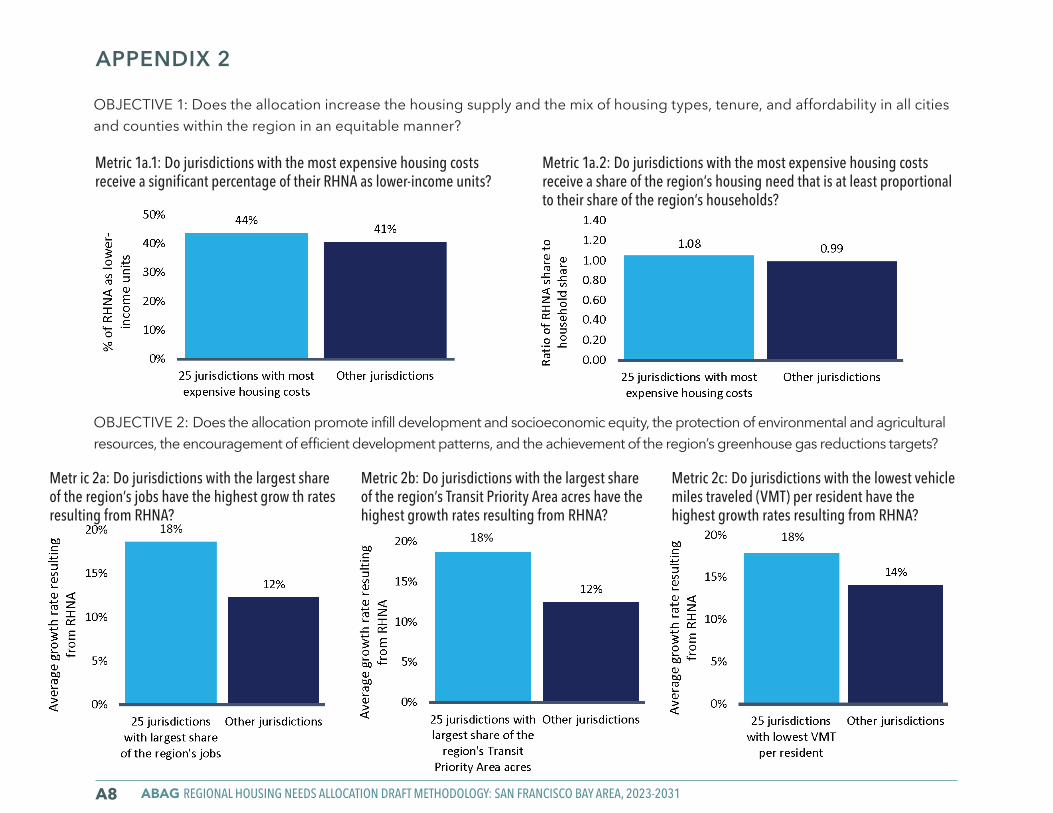
ABAG REGIONAL HOUSING NEEDS ALLOCATION DRAFT METHODOLOGY: SAN FRANCISCO BAY AREA, 2023-2031A8
APPENDIX 2
Metric 1a.1: Do jurisdictions with the most expensive housing costs receive a significant percentage of their RHNA as lower-income units?
Metr ic 2a: Do jurisdictions with the largest share of the region’s jobs have the highest grow th rates resulting from RHNA?
Metric 1a.2: Do jurisdictions with the most expensive housing costs receive a share of the region’s housing need that is at least proportional to their share of the region’s households?
Metric 2b: Do jurisdictions with the largest share of the region’s Transit Priority Area acres have the highest growth rates resulting from RHNA?
Metric 2c: Do jurisdictions with the lowest vehicle miles traveled (VMT) per resident have the highest growth rates resulting from RHNA?
OBJECTIVE 2: Does the allocation promote infill development and socioeconomic equity, the protection of environmental and agricultural resources, the encouragement of efficient development patterns, and the achievement of the region’s greenhouse gas reductions targets?
OBJECTIVE 1: Does the allocation increase the housing supply and the mix of housing types, tenure, and affordability in all cities and counties within the region in an equitable manner?
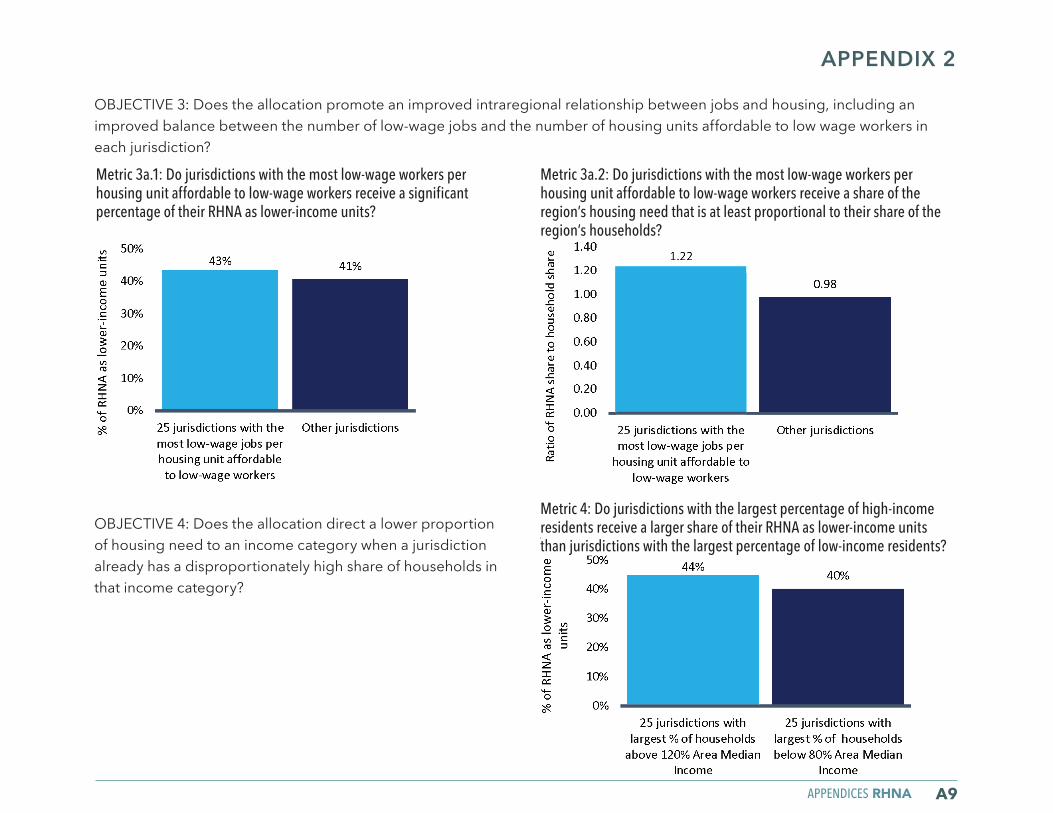
APPENDICES RHNA A9
APPENDIX 2
Metric 3a.1: Do jurisdictions with the most low-wage workers per housing unit affordable to low-wage workers receive a significant percentage of their RHNA as lower-income units?
Metric 3a.2: Do jurisdictions with the most low-wage workers per housing unit affordable to low-wage workers receive a share of the region’s housing need that is at least proportional to their share of the region’s households?
Metric 4: Do jurisdictions with the largest percentage of high-income residents receive a larger share of their RHNA as lower-income units than jurisdictions with the largest percentage of low-income residents?
OBJECTIVE 3: Does the allocation promote an improved intraregional relationship between jobs and housing, including an improved balance between the number of low-wage jobs and the number of housing units affordable to low wage workers in each jurisdiction?
OBJECTIVE 4: Does the allocation direct a lower proportion of housing need to an income category when a jurisdiction already has a disproportionately high share of households in that income category?
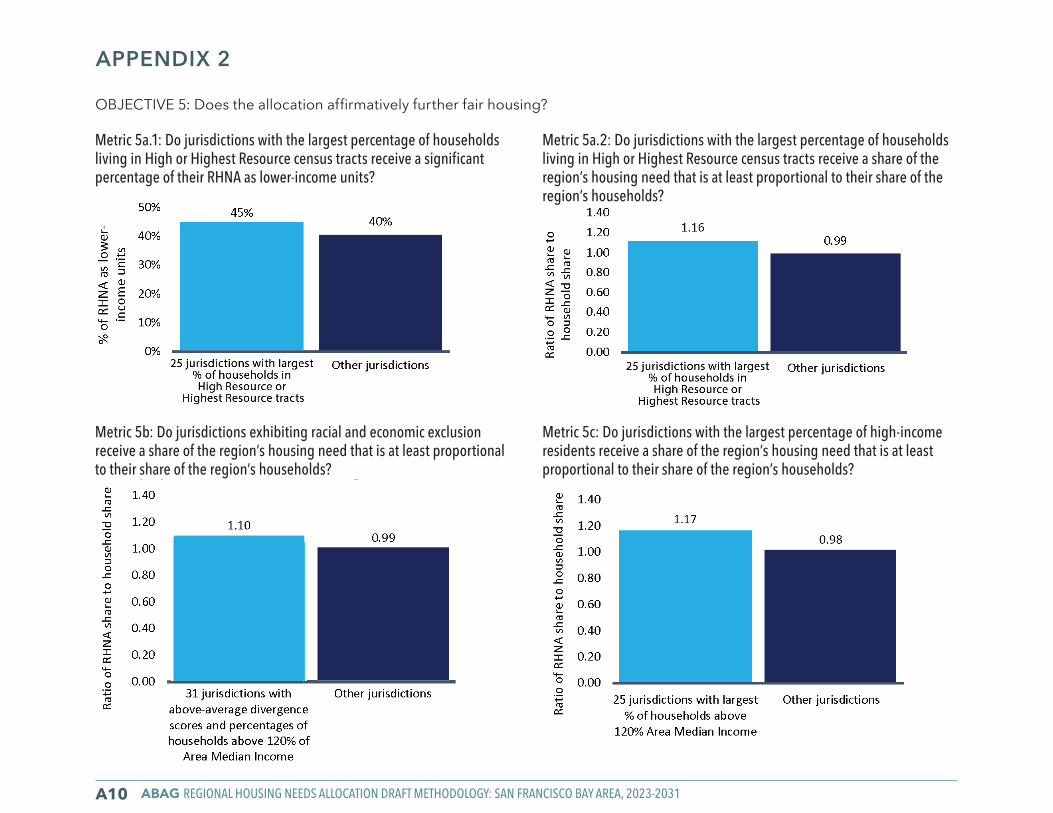
ABAG REGIONAL HOUSING NEEDS ALLOCATION DRAFT METHODOLOGY: SAN FRANCISCO BAY AREA, 2023-2031A10
APPENDIX 2
OBJECTIVE 5: Does the allocation affirmatively further fair housing?
Metric 5a.1: Do jurisdictions with the largest percentage of households living in High or Highest Resource census tracts receive a significant percentage of their RHNA as lower-income units?
Metric 5b: Do jurisdictions exhibiting racial and economic exclusion receive a share of the region’s housing need that is at least proportional to their share of the region’s households?
Metric 5a.2: Do jurisdictions with the largest percentage of households living in High or Highest Resource census tracts receive a share of the region’s housing need that is at least proportional to their share of the region’s households?
Metric 5c: Do jurisdictions with the largest percentage of high-income residents receive a share of the region’s housing need that is at least proportional to their share of the region’s households?
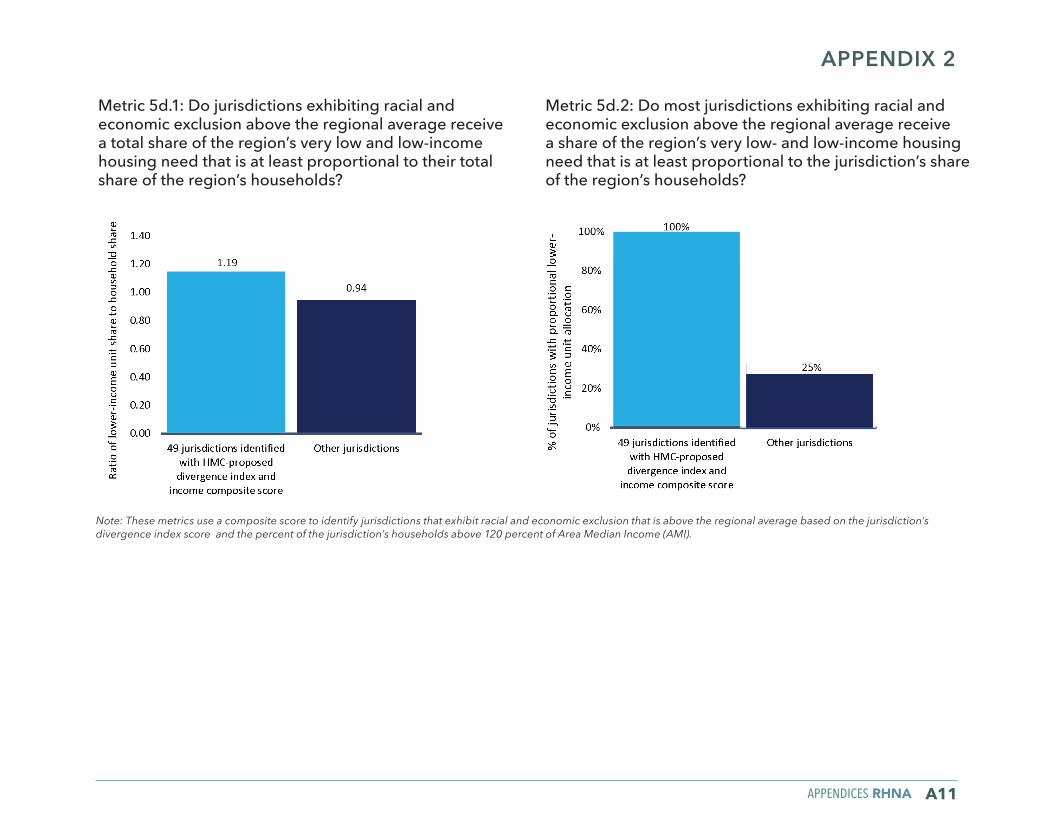
APPENDICES RHNA A11
APPENDIX 2
Metric 5d.1: Do jurisdictions exhibiting racial and economic exclusion above the regional average receive a total share of the region’s very low and low-income housing need that is at least proportional to their total share of the region’s households?
Metric 5d.2: Do most jurisdictions exhibiting racial and economic exclusion above the regional average receive a share of the region’s very low- and low-income housing need that is at least proportional to the jurisdiction’s share of the region’s households?
Note: These metrics use a composite score to identify jurisdictions that exhibit racial and economic exclusion that is above the regional average based on the jurisdiction’s divergence index score and the percent of the jurisdiction’s households above 120 percent of Area Median Income (AMI).
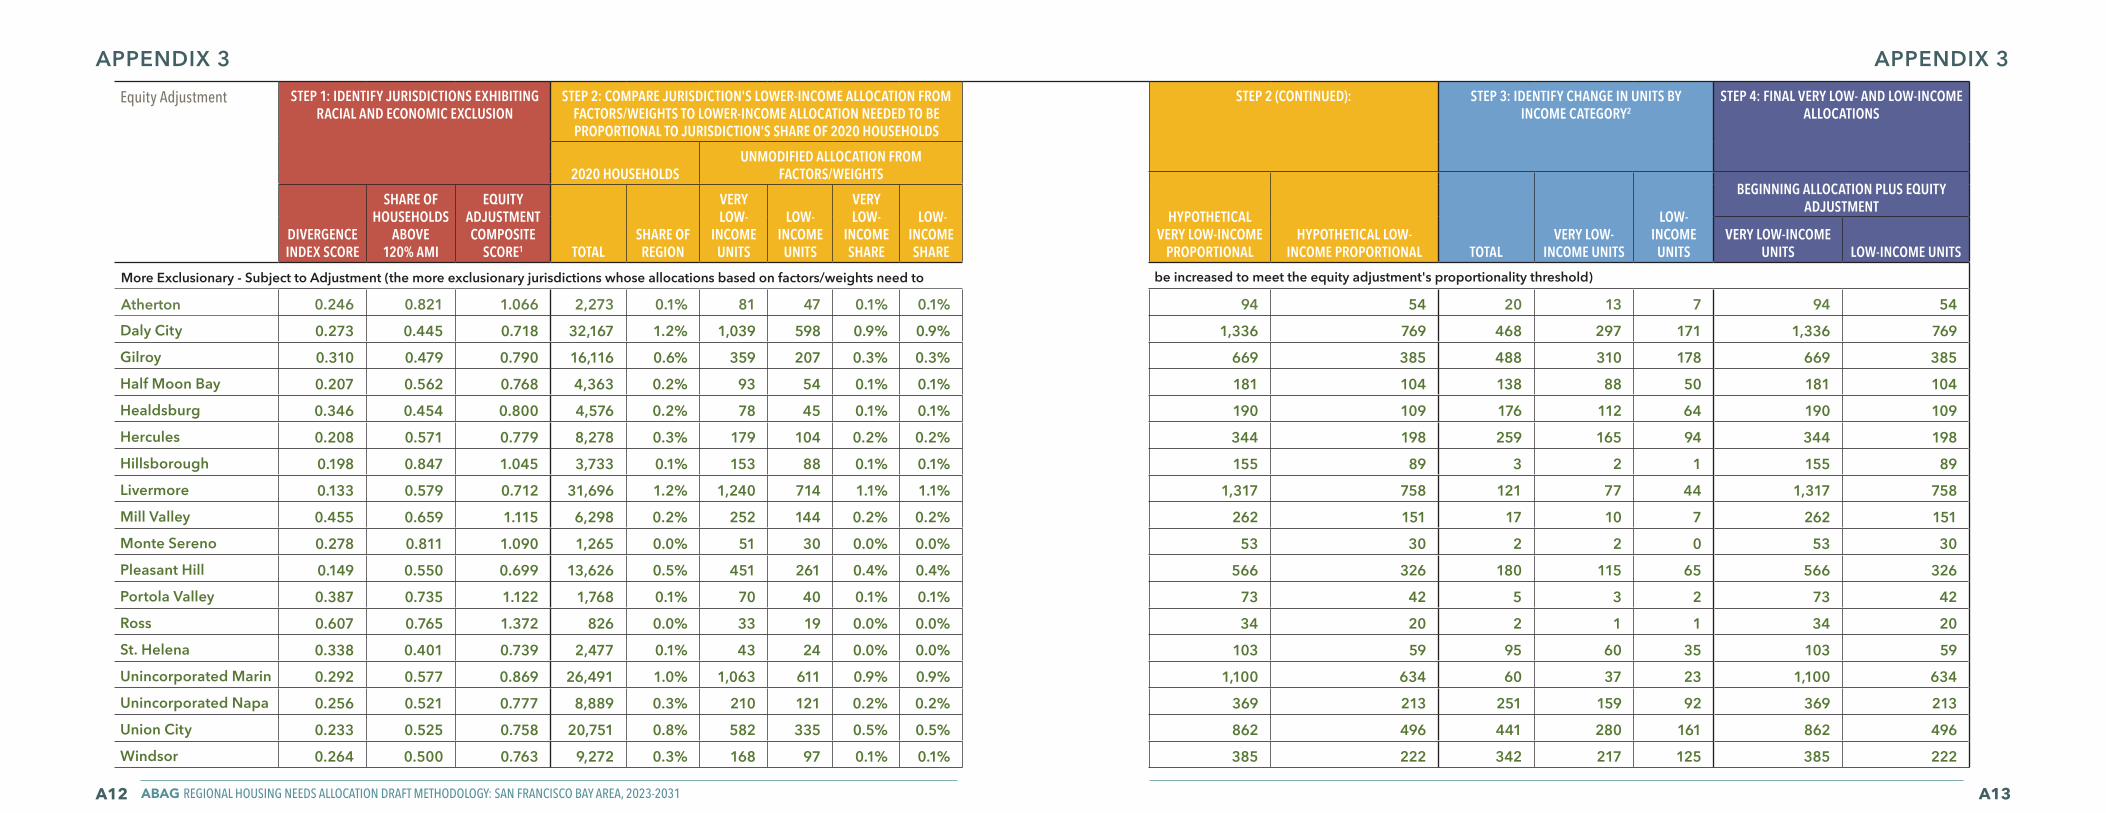
ABAG REGIONAL HOUSING NEEDS ALLOCATION DRAFT METHODOLOGY: SAN FRANCISCO BAY AREA, 2023-2031A12 A13
APPENDIX 3 APPENDIX 3Equity Adjustment STEP 1: IDENTIFY JURISDICTIONS EXHIBITING
RACIAL AND ECONOMIC EXCLUSIONSTEP 2: COMPARE JURISDICTION'S LOWER-INCOME ALLOCATION FROM
FACTORS/WEIGHTS TO LOWER-INCOME ALLOCATION NEEDED TO BE PROPORTIONAL TO JURISDICTION'S SHARE OF 2020 HOUSEHOLDS
STEP 2 (CONTINUED): STEP 3: IDENTIFY CHANGE IN UNITS BY INCOME CATEGORY2
STEP 4: FINAL VERY LOW- AND LOW-INCOME ALLOCATIONS
2020 HOUSEHOLDSUNMODIFIED ALLOCATION FROM
FACTORS/WEIGHTS
HYPOTHETICAL VERY LOW-INCOME
PROPORTIONALHYPOTHETICAL LOW-
INCOME PROPORTIONAL TOTALVERY LOW-
INCOME UNITS
LOW-INCOME
UNITS
BEGINNING ALLOCATION PLUS EQUITY ADJUSTMENT
DIVERGENCE INDEX SCORE
SHARE OF HOUSEHOLDS
ABOVE 120% AMI
EQUITY ADJUSTMENT COMPOSITE
SCORE1 TOTALSHARE OF REGION
VERY LOW-
INCOME UNITS
LOW-INCOME
UNITS
VERY LOW-
INCOME SHARE
LOW-INCOME SHARE
VERY LOW-INCOME UNITS LOW-INCOME UNITS
More Exclusionary - Subject to Adjustment (the more exclusionary jurisdictions whose allocations based on factors/weights need to be increased to meet the equity adjustment's proportionality threshold)
Atherton 0.246 0.821 1.066 2,273 0.1% 81 47 0.1% 0.1% 94 54 20 13 7 94 54
Daly City 0.273 0.445 0.718 32,167 1.2% 1,039 598 0.9% 0.9% 1,336 769 468 297 171 1,336 769
Gilroy 0.310 0.479 0.790 16,116 0.6% 359 207 0.3% 0.3% 669 385 488 310 178 669 385
Half Moon Bay 0.207 0.562 0.768 4,363 0.2% 93 54 0.1% 0.1% 181 104 138 88 50 181 104
Healdsburg 0.346 0.454 0.800 4,576 0.2% 78 45 0.1% 0.1% 190 109 176 112 64 190 109
Hercules 0.208 0.571 0.779 8,278 0.3% 179 104 0.2% 0.2% 344 198 259 165 94 344 198
Hillsborough 0.198 0.847 1.045 3,733 0.1% 153 88 0.1% 0.1% 155 89 3 2 1 155 89
Livermore 0.133 0.579 0.712 31,696 1.2% 1,240 714 1.1% 1.1% 1,317 758 121 77 44 1,317 758
Mill Valley 0.455 0.659 1.115 6,298 0.2% 252 144 0.2% 0.2% 262 151 17 10 7 262 151
Monte Sereno 0.278 0.811 1.090 1,265 0.0% 51 30 0.0% 0.0% 53 30 2 2 0 53 30
Pleasant Hill 0.149 0.550 0.699 13,626 0.5% 451 261 0.4% 0.4% 566 326 180 115 65 566 326
Portola Valley 0.387 0.735 1.122 1,768 0.1% 70 40 0.1% 0.1% 73 42 5 3 2 73 42
Ross 0.607 0.765 1.372 826 0.0% 33 19 0.0% 0.0% 34 20 2 1 1 34 20
St. Helena 0.338 0.401 0.739 2,477 0.1% 43 24 0.0% 0.0% 103 59 95 60 35 103 59
Unincorporated Marin 0.292 0.577 0.869 26,491 1.0% 1,063 611 0.9% 0.9% 1,100 634 60 37 23 1,100 634
Unincorporated Napa 0.256 0.521 0.777 8,889 0.3% 210 121 0.2% 0.2% 369 213 251 159 92 369 213
Union City 0.233 0.525 0.758 20,751 0.8% 582 335 0.5% 0.5% 862 496 441 280 161 862 496
Windsor 0.264 0.500 0.763 9,272 0.3% 168 97 0.1% 0.1% 385 222 342 217 125 385 222

ABAG REGIONAL HOUSING NEEDS ALLOCATION DRAFT METHODOLOGY: SAN FRANCISCO BAY AREA, 2023-2031A14 A15
Equity Adjustment STEP 1: IDENTIFY JURISDICTIONS EXHIBITING RACIAL AND ECONOMIC EXCLUSION
STEP 2: COMPARE JURISDICTION'S LOWER-INCOME ALLOCATION FROM FACTORS/WEIGHTS TO LOWER-INCOME ALLOCATION NEEDED TO BE PROPORTIONAL TO JURISDICTION'S SHARE OF 2020 HOUSEHOLDS
STEP 2 (CONTINUED): STEP 3: IDENTIFY CHANGE IN UNITS BY INCOME CATEGORY2
STEP 4: FINAL VERY LOW- AND LOW-INCOME ALLOCATIONS
2020 HOUSEHOLDSUNMODIFIED ALLOCATION FROM
FACTORS/WEIGHTS
HYPOTHETICAL VERY LOW-INCOME
PROPORTIONALHYPOTHETICAL LOW-
INCOME PROPORTIONAL TOTALVERY LOW-
INCOME UNITS
LOW-INCOME
UNITS
BEGINNING ALLOCATION PLUS EQUITY ADJUSTMENT
DIVERGENCE INDEX SCORE
SHARE OF HOUSEHOLDS
ABOVE 120% AMI
EQUITY ADJUSTMENT COMPOSITE
SCORE1 TOTALSHARE OF REGION
VERY LOW-
INCOME UNITS
LOW-INCOME
UNITS
VERY LOW-
INCOME SHARE
LOW-INCOME SHARE
VERY LOW-INCOME UNITS LOW-INCOME UNITS
More Exclusionary - Not Subject to Adjustment (the more exclusionary jurisdictions whose allocations based on factors/weights already meet the equity adjustment's proportionality threshold)
Belmont 0.104 0.627 0.731 10,516 0.4% 488 281 0.4% 0.4% 437 252 - - - 488 281
Belvedere 0.611 0.709 1.320 933 0.0% 49 28 0.0% 0.0% 39 22 - - - 49 28
Clayton 0.287 0.691 0.978 4,005 0.1% 170 97 0.1% 0.1% 166 96 - - - 170 97
Corte Madera 0.360 0.665 1.026 4,066 0.1% 213 123 0.2% 0.2% 169 97 - - - 213 123
Cupertino 0.432 0.700 1.132 19,998 0.7% 1,193 687 1.0% 1.0% 831 478 - - - 1,193 687
Danville 0.298 0.694 0.992 15,474 0.6% 652 376 0.6% 0.6% 643 370 - - - 652 376
Dublin 0.110 0.705 0.815 22,021 0.8% 1,085 625 0.9% 0.9% 915 527 - - - 1,085 625
Fairfax 0.409 0.536 0.946 3,294 0.1% 149 86 0.1% 0.1% 137 79 - - - 149 86
Foster City 0.150 0.702 0.852 12,449 0.5% 520 299 0.5% 0.5% 517 298 - - - 520 299
Fremont 0.243 0.627 0.871 74,488 2.7% 3,640 2,096 3.2% 3.2% 3,094 1,782 - - - 3,640 2,096
Lafayette 0.274 0.661 0.936 9,503 0.3% 599 344 0.5% 0.5% 395 227 - - - 599 344
Larkspur 0.399 0.514 0.913 5,954 0.2% 291 168 0.3% 0.3% 247 142 - - - 291 168
Los Altos 0.213 0.767 0.980 11,114 0.4% 501 288 0.4% 0.4% 462 266 - - - 501 288
Los Altos Hills 0.215 0.837 1.053 2,915 0.1% 125 72 0.1% 0.1% 121 70 - - - 125 72
Los Gatos 0.225 0.617 0.842 12,821 0.5% 537 310 0.5% 0.5% 533 307 - - - 537 310
Menlo Park 0.093 0.625 0.718 13,076 0.5% 740 426 0.6% 0.6% 543 313 - - - 740 426
Millbrae 0.148 0.577 0.725 8,124 0.3% 575 331 0.5% 0.5% 337 194 - - - 575 331
Milpitas 0.397 0.600 0.997 21,814 0.8% 1,685 970 1.5% 1.5% 906 522 - - - 1,685 970
APPENDIX 3 APPENDIX 3

ABAG REGIONAL HOUSING NEEDS ALLOCATION DRAFT METHODOLOGY: SAN FRANCISCO BAY AREA, 2023-2031A16 A17
Equity Adjustment STEP 1: IDENTIFY JURISDICTIONS EXHIBITING RACIAL AND ECONOMIC EXCLUSION
STEP 2: COMPARE JURISDICTION'S LOWER-INCOME ALLOCATION FROM FACTORS/WEIGHTS TO LOWER-INCOME ALLOCATION NEEDED TO BE PROPORTIONAL TO JURISDICTION'S SHARE OF 2020 HOUSEHOLDS
STEP 2 (CONTINUED): STEP 3: IDENTIFY CHANGE IN UNITS BY INCOME CATEGORY2
STEP 4: FINAL VERY LOW- AND LOW-INCOME ALLOCATIONS
2020 HOUSEHOLDSUNMODIFIED ALLOCATION FROM
FACTORS/WEIGHTS
HYPOTHETICAL VERY LOW-INCOME
PROPORTIONALHYPOTHETICAL LOW-
INCOME PROPORTIONAL TOTALVERY LOW-
INCOME UNITS
LOW-INCOME
UNITS
BEGINNING ALLOCATION PLUS EQUITY ADJUSTMENT
DIVERGENCE INDEX SCORE
SHARE OF HOUSEHOLDS
ABOVE 120% AMI
EQUITY ADJUSTMENT COMPOSITE
SCORE1 TOTALSHARE OF REGION
VERY LOW-
INCOME UNITS
LOW-INCOME
UNITS
VERY LOW-
INCOME SHARE
LOW-INCOME SHARE
VERY LOW-INCOME UNITS LOW-INCOME UNITS
Moraga 0.220 0.667 0.887 5,703 0.2% 318 183 0.3% 0.3% 237 136 - - - 318 183
Orinda 0.260 0.761 1.021 6,789 0.2% 372 215 0.3% 0.3% 282 162 - - - 372 215
Palo Alto 0.154 0.649 0.804 27,667 1.0% 1,556 896 1.4% 1.4% 1,149 662 - - - 1,556 896
Piedmont 0.275 0.799 1.074 3,910 0.1% 163 94 0.1% 0.1% 162 94 - - - 163 94
Pleasanton 0.098 0.674 0.773 27,283 1.0% 1,750 1,008 1.5% 1.5% 1,133 653 - - - 1,750 1,008
San Anselmo 0.501 0.610 1.110 5,318 0.2% 253 145 0.2% 0.2% 221 127 - - - 253 145
San Carlos 0.212 0.686 0.898 11,702 0.4% 739 425 0.6% 0.6% 486 280 - - - 739 425
San Ramon 0.151 0.696 0.847 28,004 1.0% 1,497 862 1.3% 1.3% 1,163 670 - - - 1,497 862
Saratoga 0.267 0.710 0.977 10,800 0.4% 454 261 0.4% 0.4% 449 258 - - - 454 261
Sausalito 0.494 0.570 1.064 4,142 0.2% 200 115 0.2% 0.2% 172 99 - - - 200 115
Sunnyvale 0.101 0.618 0.719 57,888 2.1% 2,968 1,709 2.6% 2.6% 2,405 1,385 - - - 2,968 1,709
Tiburon 0.447 0.675 1.122 3,893 0.1% 193 110 0.2% 0.2% 162 93 - - - 193 110
Woodside 0.382 0.754 1.136 2,034 0.1% 90 52 0.1% 0.1% 84 49 - - - 90 52 Other Jurisdictions (the jurisdictions not identified as exclusionary whose lower-income allocations are shifted to the group of more exclusionary jurisdictions whose allocations need to be increased)
Alameda 0.047 0.490 0.537 31,829 1.2% 1,455 837 1.3% 1.3% 1,322 761 -53 -34 -19 1,421 818
Albany 0.065 0.444 0.509 6,434 0.2% 315 182 0.3% 0.3% 267 154 -11 -7 -4 308 178
American Canyon 0.065 0.489 0.553 5,967 0.2% 115 67 0.1% 0.1% 248 143 -5 -3 -2 112 65
Antioch 0.193 0.347 0.540 34,096 1.2% 811 467 0.7% 0.7% 1,416 815 -30 -19 -11 792 456
Benicia 0.145 0.491 0.636 10,821 0.4% 208 120 0.2% 0.2% 450 259 -8 -5 -3 203 117
APPENDIX 3 APPENDIX 3

ABAG REGIONAL HOUSING NEEDS ALLOCATION DRAFT METHODOLOGY: SAN FRANCISCO BAY AREA, 2023-2031A18 A19
Equity Adjustment STEP 1: IDENTIFY JURISDICTIONS EXHIBITING RACIAL AND ECONOMIC EXCLUSION
STEP 2: COMPARE JURISDICTION'S LOWER-INCOME ALLOCATION FROM FACTORS/WEIGHTS TO LOWER-INCOME ALLOCATION NEEDED TO BE PROPORTIONAL TO JURISDICTION'S SHARE OF 2020 HOUSEHOLDS
STEP 2 (CONTINUED): STEP 3: IDENTIFY CHANGE IN UNITS BY INCOME CATEGORY2
STEP 4: FINAL VERY LOW- AND LOW-INCOME ALLOCATIONS
2020 HOUSEHOLDSUNMODIFIED ALLOCATION FROM
FACTORS/WEIGHTS
HYPOTHETICAL VERY LOW-INCOME
PROPORTIONALHYPOTHETICAL LOW-
INCOME PROPORTIONAL TOTALVERY LOW-
INCOME UNITS
LOW-INCOME
UNITS
BEGINNING ALLOCATION PLUS EQUITY ADJUSTMENT
DIVERGENCE INDEX SCORE
SHARE OF HOUSEHOLDS
ABOVE 120% AMI
EQUITY ADJUSTMENT COMPOSITE
SCORE1 TOTALSHARE OF REGION
VERY LOW-
INCOME UNITS
LOW-INCOME
UNITS
VERY LOW-
INCOME SHARE
LOW-INCOME SHARE
VERY LOW-INCOME UNITS LOW-INCOME UNITS
Berkeley 0.075 0.439 0.514 47,718 1.7% 2,504 1,441 2.2% 2.2% 1,982 1,141 -91 -58 -33 2,446 1,408
Brentwood 0.084 0.522 0.606 20,067 0.7% 411 237 0.4% 0.4% 834 480 -14 -9 -5 402 232
Brisbane 0.009 0.536 0.545 1,890 0.1% 324 187 0.3% 0.3% 79 45 -11 -7 -4 317 183
Burlingame 0.082 0.595 0.677 12,386 0.4% 883 509 0.8% 0.8% 515 296 -32 -20 -12 863 497
Calistoga 0.280 0.322 0.602 2,067 0.1% 32 19 0.0% 0.0% 86 49 -1 -1 0 31 19
Campbell 0.041 0.572 0.613 16,855 0.6% 770 444 0.7% 0.7% 700 403 -28 -18 -10 752 434
Cloverdale 0.228 0.336 0.564 3,328 0.1% 76 44 0.1% 0.1% 138 80 -3 -2 -1 74 43
Colma 0.090 0.470 0.560 499 0.0% 45 26 0.0% 0.0% 21 12 -2 -1 -1 44 25
Concord 0.074 0.397 0.471 45,297 1.6% 1,322 762 1.2% 1.2% 1,882 1,083 -48 -30 -18 1,292 744
Cotati 0.295 0.341 0.636 3,002 0.1% 61 35 0.1% 0.1% 125 72 -2 -1 -1 60 34
Dixon 0.213 0.335 0.548 6,412 0.2% 93 54 0.1% 0.1% 266 153 -3 -2 -1 91 53
East Palo Alto* 0.452 0.337 0.789 7,274 0.3% 169 97 0.1% 0.1% 302 174 -6 -4 -2 165 95
El Cerrito 0.059 0.501 0.561 10,332 0.4% 342 197 0.3% 0.3% 429 247 -13 -8 -5 334 192
Emeryville 0.084 0.505 0.589 6,667 0.2% 462 265 0.4% 0.4% 277 159 -17 -11 -6 451 259
Fairfield 0.074 0.391 0.465 38,288 1.4% 796 458 0.7% 0.7% 1,591 916 -29 -18 -11 778 447
Hayward 0.147 0.383 0.530 48,286 1.8% 1,100 632 1.0% 1.0% 2,006 1,155 -40 -25 -15 1,075 617
Martinez 0.161 0.516 0.677 14,339 0.5% 358 206 0.3% 0.3% 596 343 -13 -8 -5 350 201
Morgan Hill 0.097 0.560 0.657 14,688 0.5% 268 155 0.2% 0.2% 610 351 -10 -6 -4 262 151
Mountain View 0.038 0.609 0.647 34,445 1.3% 2,838 1,635 2.5% 2.5% 1,431 824 -103 -65 -38 2,773 1,597
APPENDIX 3 APPENDIX 3
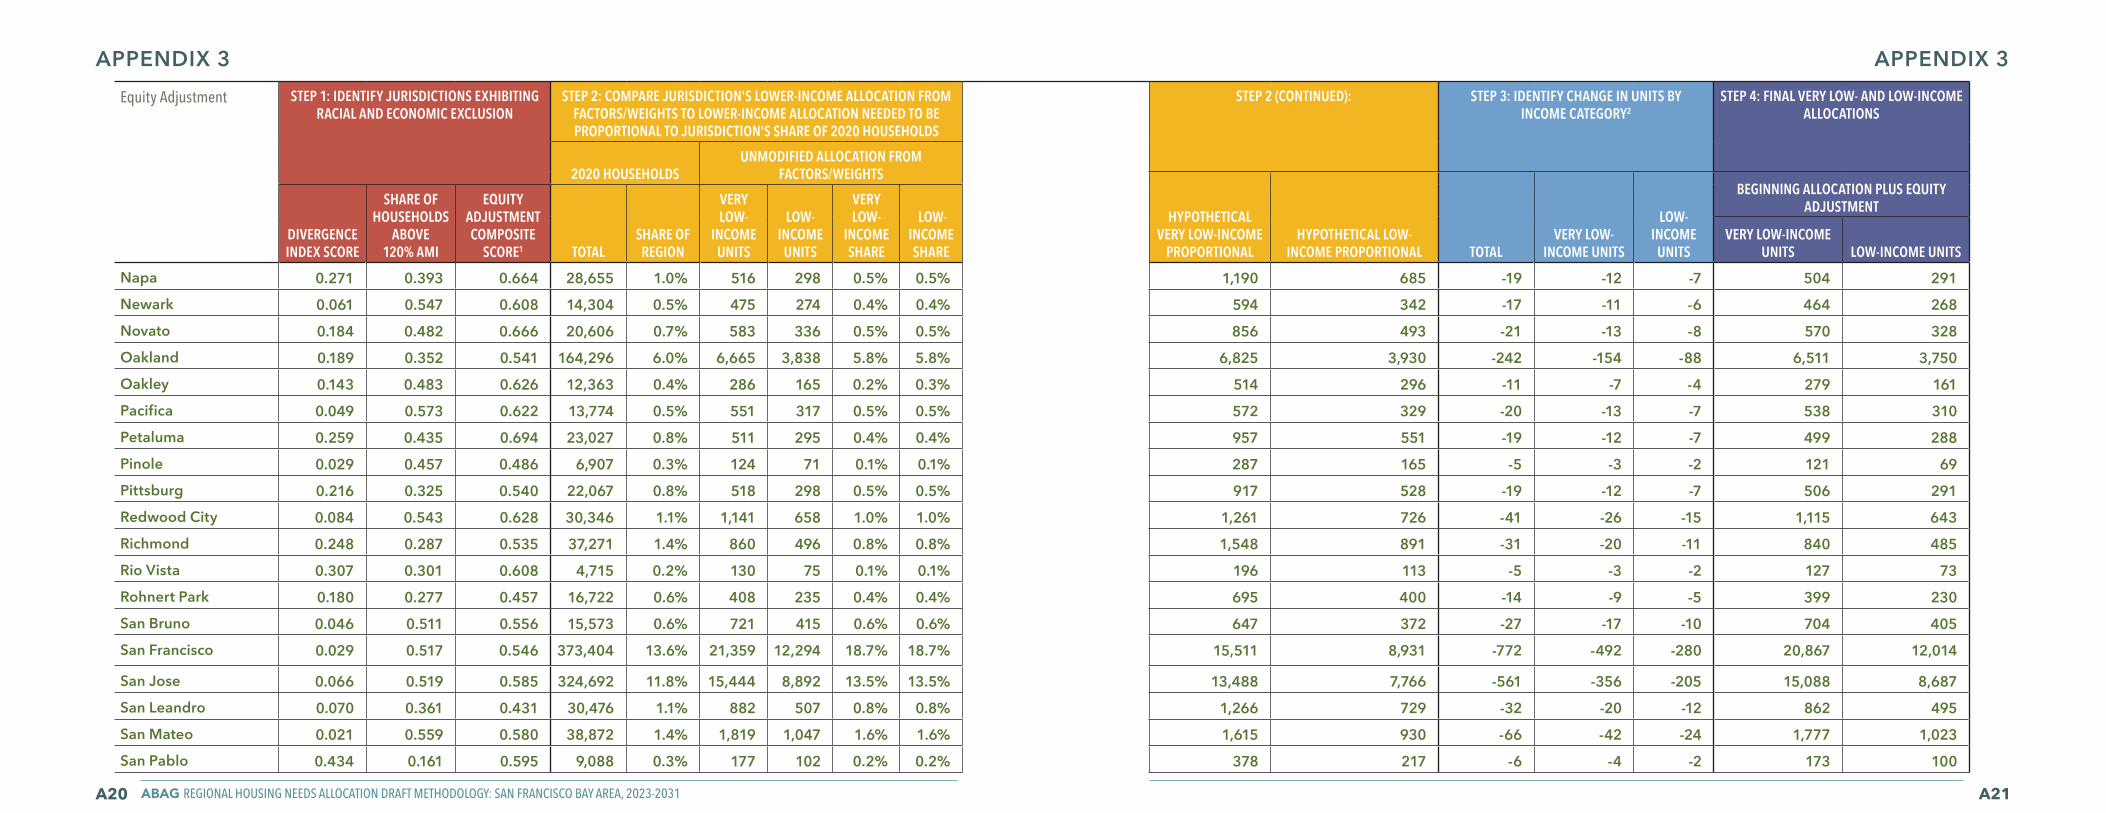
ABAG REGIONAL HOUSING NEEDS ALLOCATION DRAFT METHODOLOGY: SAN FRANCISCO BAY AREA, 2023-2031A20 A21
Equity Adjustment STEP 1: IDENTIFY JURISDICTIONS EXHIBITING RACIAL AND ECONOMIC EXCLUSION
STEP 2: COMPARE JURISDICTION'S LOWER-INCOME ALLOCATION FROM FACTORS/WEIGHTS TO LOWER-INCOME ALLOCATION NEEDED TO BE PROPORTIONAL TO JURISDICTION'S SHARE OF 2020 HOUSEHOLDS
STEP 2 (CONTINUED): STEP 3: IDENTIFY CHANGE IN UNITS BY INCOME CATEGORY2
STEP 4: FINAL VERY LOW- AND LOW-INCOME ALLOCATIONS
2020 HOUSEHOLDSUNMODIFIED ALLOCATION FROM
FACTORS/WEIGHTS
HYPOTHETICAL VERY LOW-INCOME
PROPORTIONALHYPOTHETICAL LOW-
INCOME PROPORTIONAL TOTALVERY LOW-
INCOME UNITS
LOW-INCOME
UNITS
BEGINNING ALLOCATION PLUS EQUITY ADJUSTMENT
DIVERGENCE INDEX SCORE
SHARE OF HOUSEHOLDS
ABOVE 120% AMI
EQUITY ADJUSTMENT COMPOSITE
SCORE1 TOTALSHARE OF REGION
VERY LOW-
INCOME UNITS
LOW-INCOME
UNITS
VERY LOW-
INCOME SHARE
LOW-INCOME SHARE
VERY LOW-INCOME UNITS LOW-INCOME UNITS
Napa 0.271 0.393 0.664 28,655 1.0% 516 298 0.5% 0.5% 1,190 685 -19 -12 -7 504 291
Newark 0.061 0.547 0.608 14,304 0.5% 475 274 0.4% 0.4% 594 342 -17 -11 -6 464 268
Novato 0.184 0.482 0.666 20,606 0.7% 583 336 0.5% 0.5% 856 493 -21 -13 -8 570 328
Oakland 0.189 0.352 0.541 164,296 6.0% 6,665 3,838 5.8% 5.8% 6,825 3,930 -242 -154 -88 6,511 3,750
Oakley 0.143 0.483 0.626 12,363 0.4% 286 165 0.2% 0.3% 514 296 -11 -7 -4 279 161
Pacifica 0.049 0.573 0.622 13,774 0.5% 551 317 0.5% 0.5% 572 329 -20 -13 -7 538 310
Petaluma 0.259 0.435 0.694 23,027 0.8% 511 295 0.4% 0.4% 957 551 -19 -12 -7 499 288
Pinole 0.029 0.457 0.486 6,907 0.3% 124 71 0.1% 0.1% 287 165 -5 -3 -2 121 69
Pittsburg 0.216 0.325 0.540 22,067 0.8% 518 298 0.5% 0.5% 917 528 -19 -12 -7 506 291
Redwood City 0.084 0.543 0.628 30,346 1.1% 1,141 658 1.0% 1.0% 1,261 726 -41 -26 -15 1,115 643
Richmond 0.248 0.287 0.535 37,271 1.4% 860 496 0.8% 0.8% 1,548 891 -31 -20 -11 840 485
Rio Vista 0.307 0.301 0.608 4,715 0.2% 130 75 0.1% 0.1% 196 113 -5 -3 -2 127 73
Rohnert Park 0.180 0.277 0.457 16,722 0.6% 408 235 0.4% 0.4% 695 400 -14 -9 -5 399 230
San Bruno 0.046 0.511 0.556 15,573 0.6% 721 415 0.6% 0.6% 647 372 -27 -17 -10 704 405
San Francisco 0.029 0.517 0.546 373,404 13.6% 21,359 12,294 18.7% 18.7% 15,511 8,931 -772 -492 -280 20,867 12,014
San Jose 0.066 0.519 0.585 324,692 11.8% 15,444 8,892 13.5% 13.5% 13,488 7,766 -561 -356 -205 15,088 8,687
San Leandro 0.070 0.361 0.431 30,476 1.1% 882 507 0.8% 0.8% 1,266 729 -32 -20 -12 862 495
San Mateo 0.021 0.559 0.580 38,872 1.4% 1,819 1,047 1.6% 1.6% 1,615 930 -66 -42 -24 1,777 1,023
San Pablo 0.434 0.161 0.595 9,088 0.3% 177 102 0.2% 0.2% 378 217 -6 -4 -2 173 100
APPENDIX 3 APPENDIX 3

ABAG REGIONAL HOUSING NEEDS ALLOCATION DRAFT METHODOLOGY: SAN FRANCISCO BAY AREA, 2023-2031A22 A23
Equity Adjustment STEP 1: IDENTIFY JURISDICTIONS EXHIBITING RACIAL AND ECONOMIC EXCLUSION
STEP 2: COMPARE JURISDICTION'S LOWER-INCOME ALLOCATION FROM FACTORS/WEIGHTS TO LOWER-INCOME ALLOCATION NEEDED TO BE PROPORTIONAL TO JURISDICTION'S SHARE OF 2020 HOUSEHOLDS
STEP 2 (CONTINUED): STEP 3: IDENTIFY CHANGE IN UNITS BY INCOME CATEGORY2
STEP 4: FINAL VERY LOW- AND LOW-INCOME ALLOCATIONS
2020 HOUSEHOLDSUNMODIFIED ALLOCATION FROM
FACTORS/WEIGHTS
HYPOTHETICAL VERY LOW-INCOME
PROPORTIONALHYPOTHETICAL LOW-
INCOME PROPORTIONAL TOTALVERY LOW-
INCOME UNITS
LOW-INCOME
UNITS
BEGINNING ALLOCATION PLUS EQUITY ADJUSTMENT
DIVERGENCE INDEX SCORE
SHARE OF HOUSEHOLDS
ABOVE 120% AMI
EQUITY ADJUSTMENT COMPOSITE
SCORE1 TOTALSHARE OF REGION
VERY LOW-
INCOME UNITS
LOW-INCOME
UNITS
VERY LOW-
INCOME SHARE
LOW-INCOME SHARE
VERY LOW-INCOME UNITS LOW-INCOME UNITS
San Rafael 0.175 0.462 0.637 23,154 0.8% 877 504 0.8% 0.8% 962 554 -32 -20 -12 857 492
Santa Clara 0.060 0.570 0.631 46,387 1.7% 2,940 1,692 2.6% 2.6% 1,927 1,109 -107 -68 -39 2,872 1,653
Santa Rosa 0.173 0.327 0.500 66,051 2.4% 1,247 718 1.1% 1.1% 2,744 1,580 -46 -29 -17 1,218 701
Sebastopol* 0.372 0.367 0.738 3,372 0.1% 56 32 0.0% 0.0% 140 81 -2 -1 -1 55 31
Sonoma* 0.378 0.390 0.768 5,030 0.2% 85 49 0.1% 0.1% 209 120 -3 -2 -1 83 48
South San Francisco 0.132 0.484 0.616 21,409 0.8% 892 514 0.8% 0.8% 889 512 -33 -21 -12 871 502
Suisun City 0.134 0.367 0.501 9,274 0.3% 160 92 0.1% 0.1% 385 222 -6 -4 -2 156 90
Unincorporated Alameda
0.034 0.431 0.465 48,899 1.8% 1,281 738 1.1% 1.1% 2,031 1,170 -47 -30 -17 1,251 721
Unincorporated Contra Costa
0.056 0.484 0.540 60,527 2.2% 2,131 1,227 1.9% 1.9% 2,514 1,448 -77 -49 -28 2,082 1,199
Unincorporated San Mateo
0.101 0.585 0.686 21,461 0.8% 830 479 0.7% 0.7% 892 513 -30 -19 -11 811 468
Unincorporated Santa Clara
0.063 0.542 0.604 26,299 1.0% 848 488 0.7% 0.7% 1,092 629 -31 -20 -11 828 477
Unincorporated Solano
0.177 0.445 0.623 6,843 0.2% 243 140 0.2% 0.2% 284 164 -9 -6 -3 237 137
Unincorporated Sonoma*
0.328 0.387 0.715 54,387 2.0% 1,060 610 0.9% 0.9% 2,259 1,301 -38 -24 -14 1,036 596
Vacaville 0.114 0.393 0.507 33,985 1.2% 498 286 0.4% 0.4% 1,412 813 -18 -11 -7 487 279
APPENDIX 3 APPENDIX 3
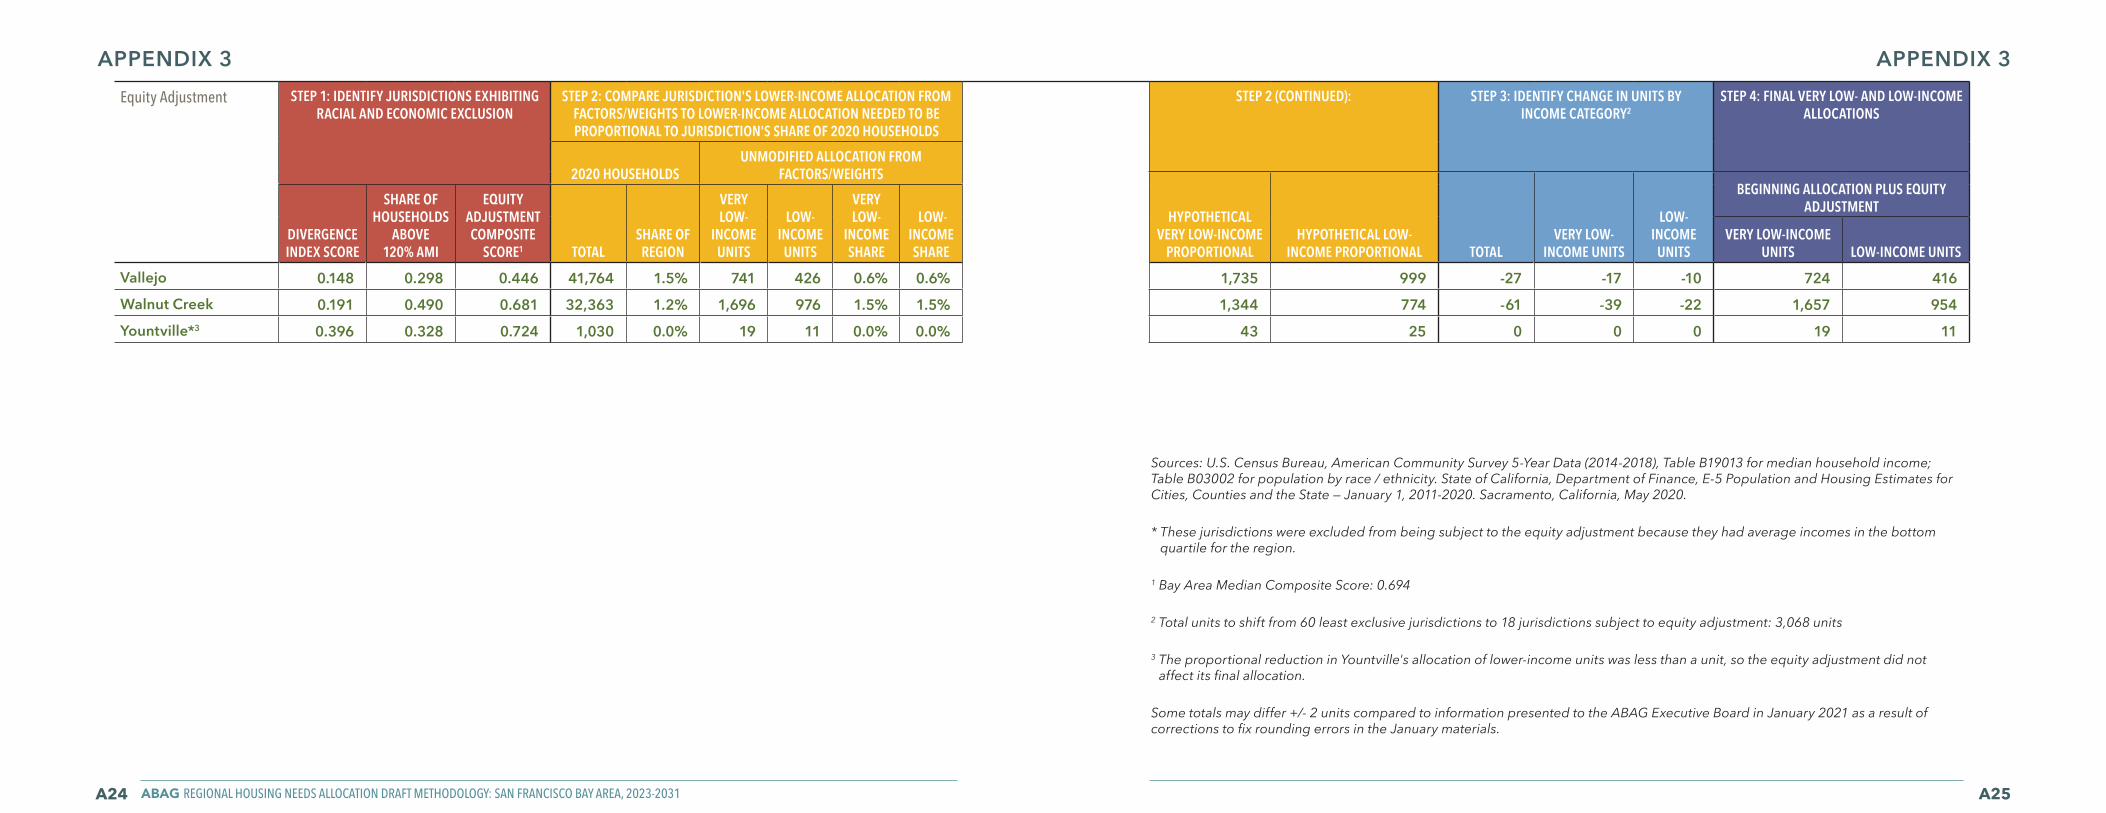
ABAG REGIONAL HOUSING NEEDS ALLOCATION DRAFT METHODOLOGY: SAN FRANCISCO BAY AREA, 2023-2031A24 A25
Equity Adjustment STEP 1: IDENTIFY JURISDICTIONS EXHIBITING RACIAL AND ECONOMIC EXCLUSION
STEP 2: COMPARE JURISDICTION'S LOWER-INCOME ALLOCATION FROM FACTORS/WEIGHTS TO LOWER-INCOME ALLOCATION NEEDED TO BE PROPORTIONAL TO JURISDICTION'S SHARE OF 2020 HOUSEHOLDS
STEP 2 (CONTINUED): STEP 3: IDENTIFY CHANGE IN UNITS BY INCOME CATEGORY2
STEP 4: FINAL VERY LOW- AND LOW-INCOME ALLOCATIONS
2020 HOUSEHOLDSUNMODIFIED ALLOCATION FROM
FACTORS/WEIGHTS
HYPOTHETICAL VERY LOW-INCOME
PROPORTIONALHYPOTHETICAL LOW-
INCOME PROPORTIONAL TOTALVERY LOW-
INCOME UNITS
LOW-INCOME
UNITS
BEGINNING ALLOCATION PLUS EQUITY ADJUSTMENT
DIVERGENCE INDEX SCORE
SHARE OF HOUSEHOLDS
ABOVE 120% AMI
EQUITY ADJUSTMENT COMPOSITE
SCORE1 TOTALSHARE OF REGION
VERY LOW-
INCOME UNITS
LOW-INCOME
UNITS
VERY LOW-
INCOME SHARE
LOW-INCOME SHARE
VERY LOW-INCOME UNITS LOW-INCOME UNITS
Vallejo 0.148 0.298 0.446 41,764 1.5% 741 426 0.6% 0.6% 1,735 999 -27 -17 -10 724 416
Walnut Creek 0.191 0.490 0.681 32,363 1.2% 1,696 976 1.5% 1.5% 1,344 774 -61 -39 -22 1,657 954
Yountville*3 0.396 0.328 0.724 1,030 0.0% 19 11 0.0% 0.0% 43 25 0 0 0 19 11
APPENDIX 3 APPENDIX 3
Sources: U.S. Census Bureau, American Community Survey 5-Year Data (2014-2018), Table B19013 for median household income; Table B03002 for population by race / ethnicity. State of California, Department of Finance, E-5 Population and Housing Estimates for Cities, Counties and the State — January 1, 2011-2020. Sacramento, California, May 2020.
* These jurisdictions were excluded from being subject to the equity adjustment because they had average incomes in the bottom quartile for the region.
1 Bay Area Median Composite Score: 0.694
2 Total units to shift from 60 least exclusive jurisdictions to 18 jurisdictions subject to equity adjustment: 3,068 units
3 The proportional reduction in Yountville's allocation of lower-income units was less than a unit, so the equity adjustment did not affect its final allocation.
Some totals may differ +/- 2 units compared to information presented to the ABAG Executive Board in January 2021 as a result of corrections to fix rounding errors in the January materials.
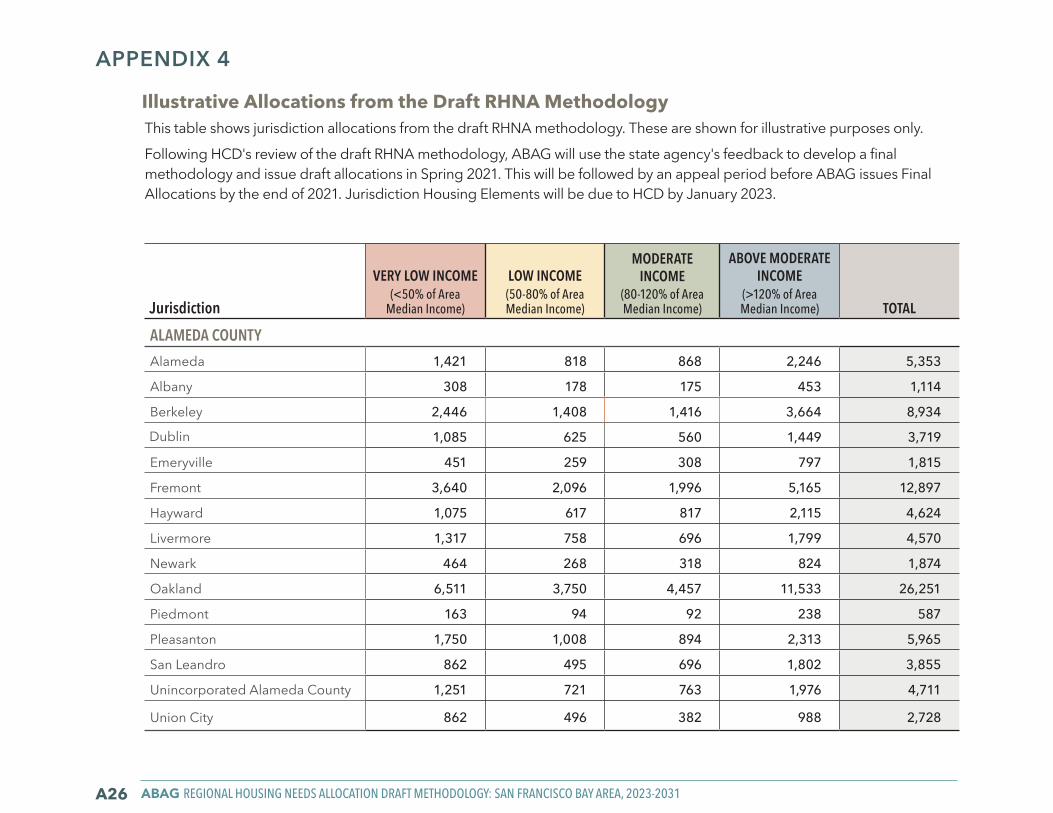
ABAG REGIONAL HOUSING NEEDS ALLOCATION DRAFT METHODOLOGY: SAN FRANCISCO BAY AREA, 2023-2031A26
Jurisdiction
VERY LOW INCOME(<50% of Area
Median Income)
LOW INCOME (50-80% of Area Median Income)
MODERATE INCOME
(80-120% of Area Median Income)
ABOVE MODERATE INCOME
(>120% of Area Median Income)
TOTAL
ALAMEDA COUNTYAlameda 1,421 818 868 2,246 5,353
Albany 308 178 175 453 1,114
Berkeley 2,446 1,408 1,416 3,664 8,934
Dublin 1,085 625 560 1,449 3,719
Emeryville 451 259 308 797 1,815
Fremont 3,640 2,096 1,996 5,165 12,897
Hayward 1,075 617 817 2,115 4,624
Livermore 1,317 758 696 1,799 4,570
Newark 464 268 318 824 1,874
Oakland 6,511 3,750 4,457 11,533 26,251
Piedmont 163 94 92 238 587
Pleasanton 1,750 1,008 894 2,313 5,965
San Leandro 862 495 696 1,802 3,855
Unincorporated Alameda County 1,251 721 763 1,976 4,711
Union City 862 496 382 988 2,728
Illustrative Allocations from the Draft RHNA Methodology This table shows jurisdiction allocations from the draft RHNA methodology. These are shown for illustrative purposes only.
Following HCD's review of the draft RHNA methodology, ABAG will use the state agency's feedback to develop a final methodology and issue draft allocations in Spring 2021. This will be followed by an appeal period before ABAG issues Final Allocations by the end of 2021. Jurisdiction Housing Elements will be due to HCD by January 2023.
APPENDIX 4
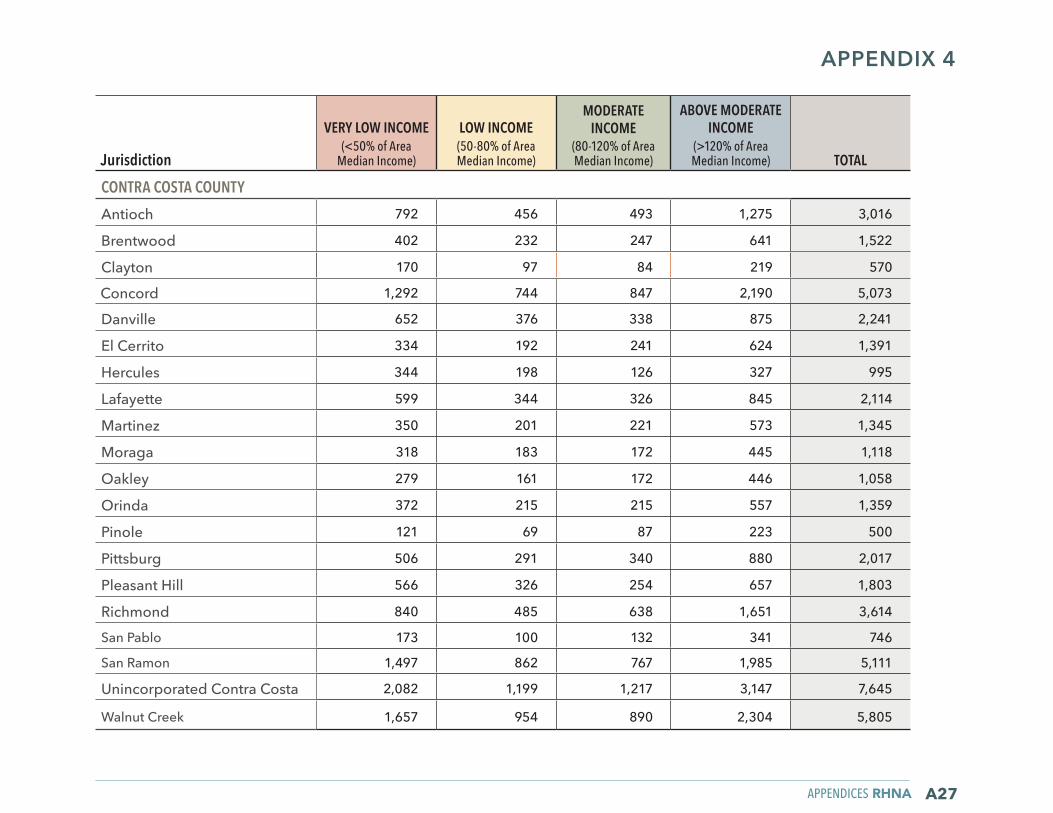
A27
Jurisdiction
VERY LOW INCOME(<50% of Area
Median Income)
LOW INCOME (50-80% of Area Median Income)
MODERATE INCOME
(80-120% of Area Median Income)
ABOVE MODERATE INCOME
(>120% of Area Median Income)
TOTAL
CONTRA COSTA COUNTYAntioch 792 456 493 1,275 3,016
Brentwood 402 232 247 641 1,522
Clayton 170 97 84 219 570
Concord 1,292 744 847 2,190 5,073
Danville 652 376 338 875 2,241
El Cerrito 334 192 241 624 1,391
Hercules 344 198 126 327 995
Lafayette 599 344 326 845 2,114
Martinez 350 201 221 573 1,345
Moraga 318 183 172 445 1,118
Oakley 279 161 172 446 1,058
Orinda 372 215 215 557 1,359
Pinole 121 69 87 223 500
Pittsburg 506 291 340 880 2,017
Pleasant Hill 566 326 254 657 1,803
Richmond 840 485 638 1,651 3,614
San Pablo 173 100 132 341 746
San Ramon 1,497 862 767 1,985 5,111
Unincorporated Contra Costa 2,082 1,199 1,217 3,147 7,645
Walnut Creek 1,657 954 890 2,304 5,805
APPENDIX 4
APPENDICES RHNA
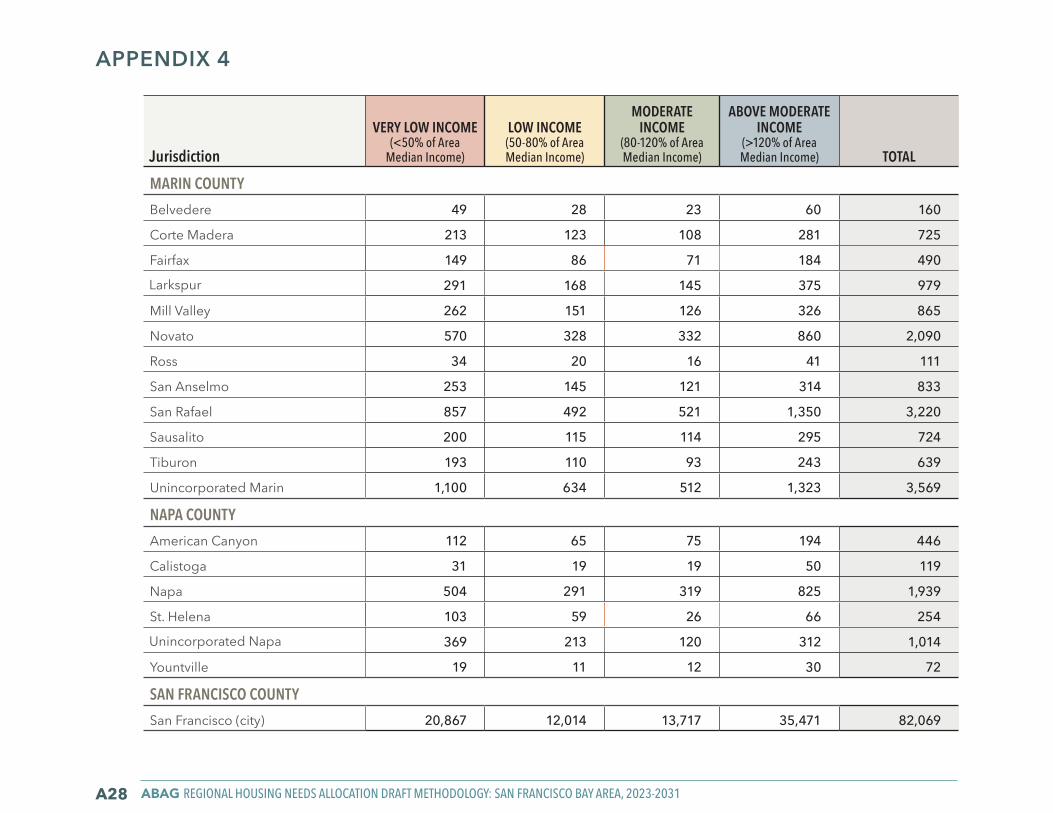
ABAG REGIONAL HOUSING NEEDS ALLOCATION DRAFT METHODOLOGY: SAN FRANCISCO BAY AREA, 2023-2031A28
Jurisdiction
VERY LOW INCOME(<50% of Area
Median Income)
LOW INCOME (50-80% of Area Median Income)
MODERATE INCOME
(80-120% of Area Median Income)
ABOVE MODERATE INCOME
(>120% of Area Median Income)
TOTAL
MARIN COUNTYBelvedere 49 28 23 60 160
Corte Madera 213 123 108 281 725
Fairfax 149 86 71 184 490
Larkspur 291 168 145 375 979
Mill Valley 262 151 126 326 865
Novato 570 328 332 860 2,090
Ross 34 20 16 41 111
San Anselmo 253 145 121 314 833
San Rafael 857 492 521 1,350 3,220
Sausalito 200 115 114 295 724
Tiburon 193 110 93 243 639
Unincorporated Marin 1,100 634 512 1,323 3,569
NAPA COUNTYAmerican Canyon 112 65 75 194 446
Calistoga 31 19 19 50 119
Napa 504 291 319 825 1,939
St. Helena 103 59 26 66 254
Unincorporated Napa 369 213 120 312 1,014
Yountville 19 11 12 30 72
SAN FRANCISCO COUNTYSan Francisco (city) 20,867 12,014 13,717 35,471 82,069
APPENDIX 4
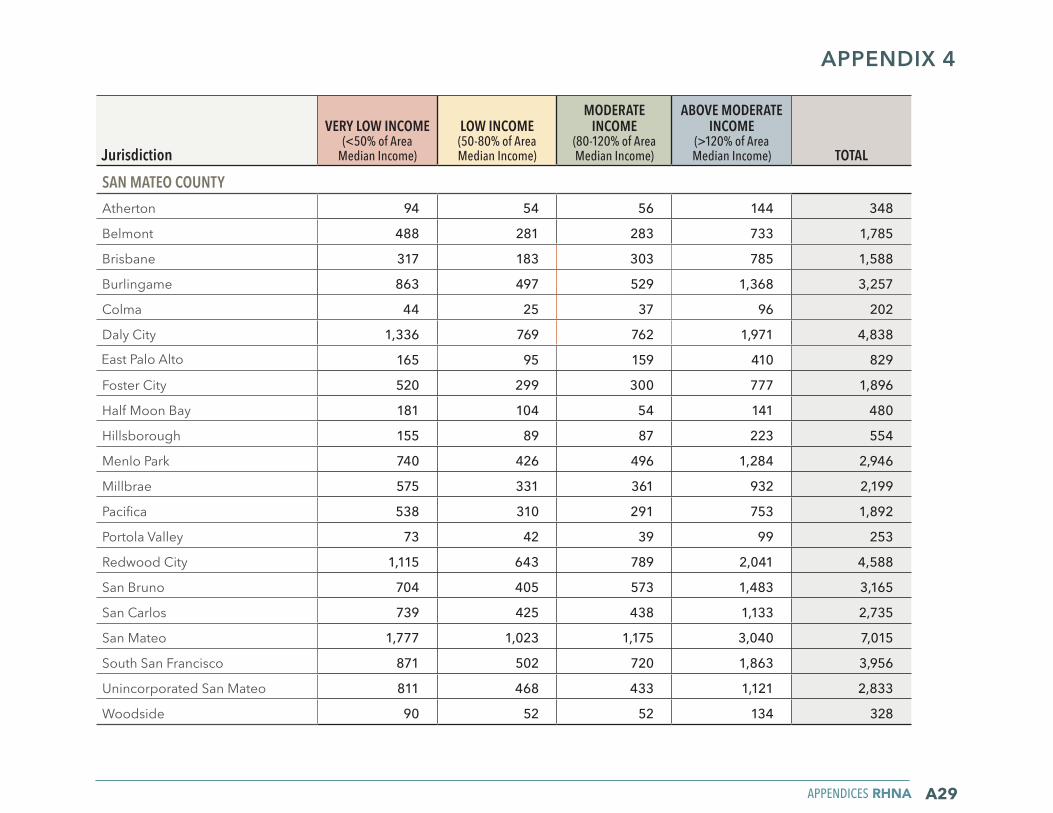
A29
Jurisdiction
VERY LOW INCOME(<50% of Area
Median Income)
LOW INCOME (50-80% of Area Median Income)
MODERATE INCOME
(80-120% of Area Median Income)
ABOVE MODERATE INCOME
(>120% of Area Median Income)
TOTAL
SAN MATEO COUNTYAtherton 94 54 56 144 348
Belmont 488 281 283 733 1,785
Brisbane 317 183 303 785 1,588
Burlingame 863 497 529 1,368 3,257
Colma 44 25 37 96 202
Daly City 1,336 769 762 1,971 4,838
East Palo Alto 165 95 159 410 829
Foster City 520 299 300 777 1,896
Half Moon Bay 181 104 54 141 480
Hillsborough 155 89 87 223 554
Menlo Park 740 426 496 1,284 2,946
Millbrae 575 331 361 932 2,199
Pacifica 538 310 291 753 1,892
Portola Valley 73 42 39 99 253
Redwood City 1,115 643 789 2,041 4,588
San Bruno 704 405 573 1,483 3,165
San Carlos 739 425 438 1,133 2,735
San Mateo 1,777 1,023 1,175 3,040 7,015
South San Francisco 871 502 720 1,863 3,956
Unincorporated San Mateo 811 468 433 1,121 2,833
Woodside 90 52 52 134 328
APPENDIX 4
APPENDICES RHNA
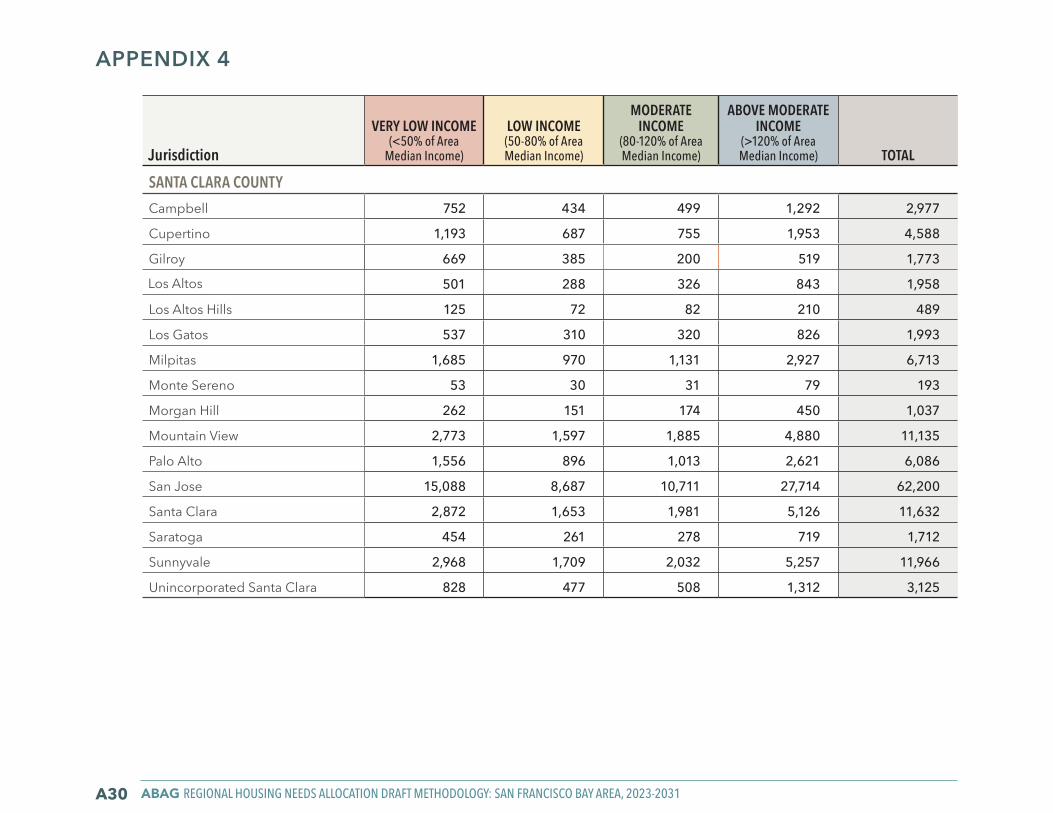
ABAG REGIONAL HOUSING NEEDS ALLOCATION DRAFT METHODOLOGY: SAN FRANCISCO BAY AREA, 2023-2031A30
Jurisdiction
VERY LOW INCOME(<50% of Area
Median Income)
LOW INCOME (50-80% of Area Median Income)
MODERATE INCOME
(80-120% of Area Median Income)
ABOVE MODERATE INCOME
(>120% of Area Median Income)
TOTAL
SANTA CLARA COUNTYCampbell 752 434 499 1,292 2,977
Cupertino 1,193 687 755 1,953 4,588
Gilroy 669 385 200 519 1,773
Los Altos 501 288 326 843 1,958
Los Altos Hills 125 72 82 210 489
Los Gatos 537 310 320 826 1,993
Milpitas 1,685 970 1,131 2,927 6,713
Monte Sereno 53 30 31 79 193
Morgan Hill 262 151 174 450 1,037
Mountain View 2,773 1,597 1,885 4,880 11,135
Palo Alto 1,556 896 1,013 2,621 6,086
San Jose 15,088 8,687 10,711 27,714 62,200
Santa Clara 2,872 1,653 1,981 5,126 11,632
Saratoga 454 261 278 719 1,712
Sunnyvale 2,968 1,709 2,032 5,257 11,966
Unincorporated Santa Clara 828 477 508 1,312 3,125
APPENDIX 4
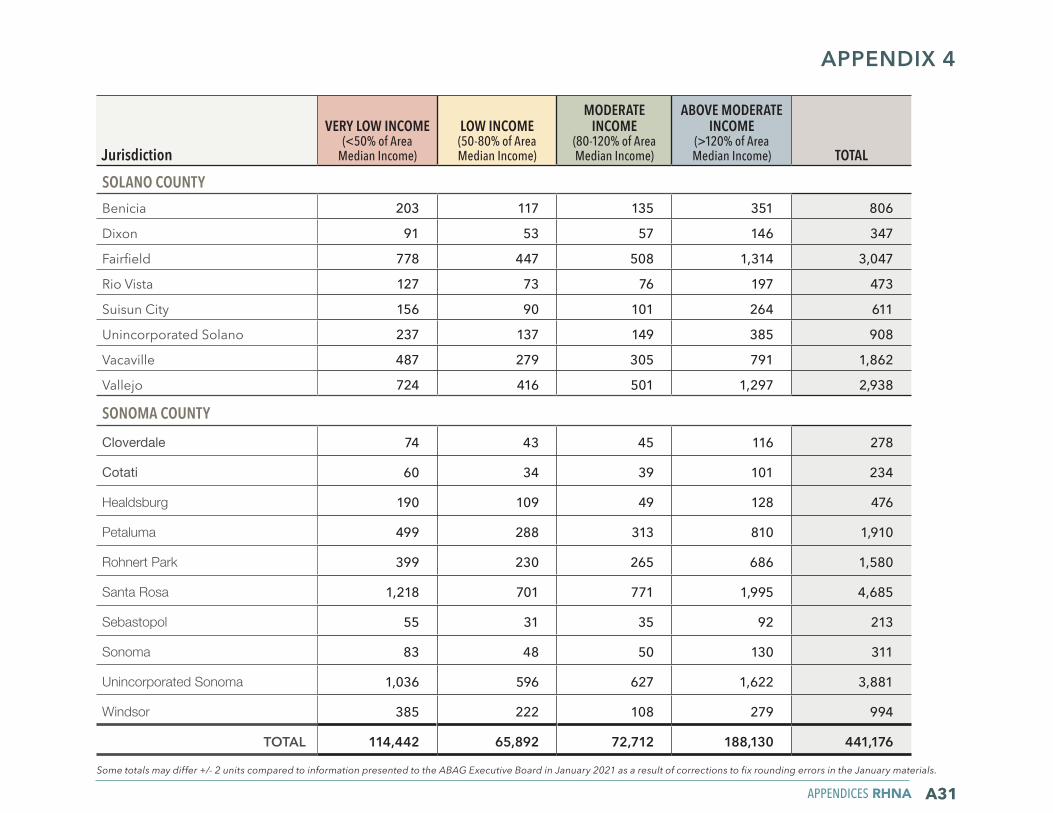
A31
Jurisdiction
VERY LOW INCOME(<50% of Area
Median Income)
LOW INCOME (50-80% of Area Median Income)
MODERATE INCOME
(80-120% of Area Median Income)
ABOVE MODERATE INCOME
(>120% of Area Median Income)
TOTAL
SOLANO COUNTYBenicia 203 117 135 351 806
Dixon 91 53 57 146 347
Fairfield 778 447 508 1,314 3,047
Rio Vista 127 73 76 197 473
Suisun City 156 90 101 264 611
Unincorporated Solano 237 137 149 385 908
Vacaville 487 279 305 791 1,862
Vallejo 724 416 501 1,297 2,938
SONOMA COUNTY
Cloverdale 74 43 45 116 278
Cotati 60 34 39 101 234
Healdsburg 190 109 49 128 476
Petaluma 499 288 313 810 1,910
Rohnert Park 399 230 265 686 1,580
Santa Rosa 1,218 701 771 1,995 4,685
Sebastopol 55 31 35 92 213
Sonoma 83 48 50 130 311
Unincorporated Sonoma 1,036 596 627 1,622 3,881
Windsor 385 222 108 279 994
TOTAL 114,442 65,892 72,712 188,130 441,176
APPENDIX 4
APPENDICES RHNA
Some totals may differ +/- 2 units compared to information presented to the ABAG Executive Board in January 2021 as a result of corrections to fix rounding errors in the January materials.
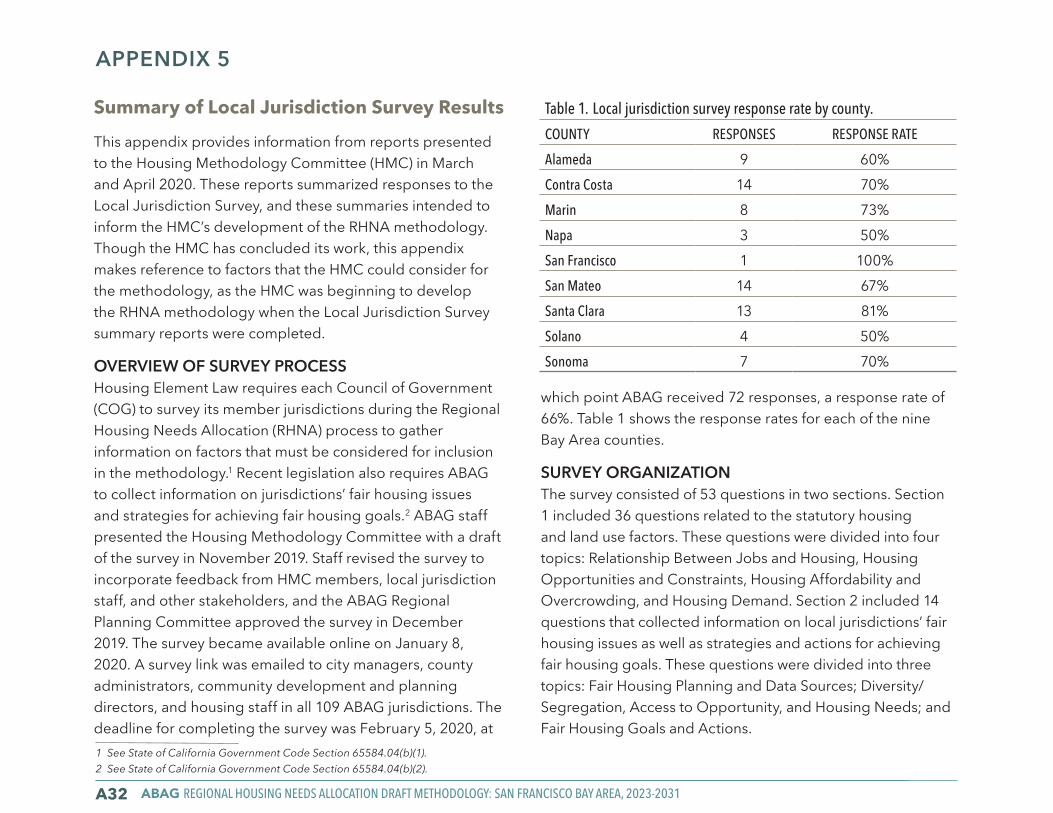
ABAG REGIONAL HOUSING NEEDS ALLOCATION DRAFT METHODOLOGY: SAN FRANCISCO BAY AREA, 2023-2031A32
APPENDIX 5
Summary of Local Jurisdiction Survey Results
This appendix provides information from reports presented to the Housing Methodology Committee (HMC) in March and April 2020. These reports summarized responses to the Local Jurisdiction Survey, and these summaries intended to inform the HMC’s development of the RHNA methodology. Though the HMC has concluded its work, this appendix makes reference to factors that the HMC could consider for the methodology, as the HMC was beginning to develop the RHNA methodology when the Local Jurisdiction Survey summary reports were completed.
OVERVIEW OF SURVEY PROCESSHousing Element Law requires each Council of Government (COG) to survey its member jurisdictions during the Regional Housing Needs Allocation (RHNA) process to gather information on factors that must be considered for inclusion in the methodology.1 Recent legislation also requires ABAG to collect information on jurisdictions’ fair housing issues and strategies for achieving fair housing goals.2 ABAG staff presented the Housing Methodology Committee with a draft of the survey in November 2019. Staff revised the survey to incorporate feedback from HMC members, local jurisdiction staff, and other stakeholders, and the ABAG Regional Planning Committee approved the survey in December 2019. The survey became available online on January 8, 2020. A survey link was emailed to city managers, county administrators, community development and planning directors, and housing staff in all 109 ABAG jurisdictions. The deadline for completing the survey was February 5, 2020, at
which point ABAG received 72 responses, a response rate of 66%. Table 1 shows the response rates for each of the nine Bay Area counties.
SURVEY ORGANIZATIONThe survey consisted of 53 questions in two sections. Section 1 included 36 questions related to the statutory housing and land use factors. These questions were divided into four topics: Relationship Between Jobs and Housing, Housing Opportunities and Constraints, Housing Affordability and Overcrowding, and Housing Demand. Section 2 included 14 questions that collected information on local jurisdictions’ fair housing issues as well as strategies and actions for achieving fair housing goals. These questions were divided into three topics: Fair Housing Planning and Data Sources; Diversity/Segregation, Access to Opportunity, and Housing Needs; and Fair Housing Goals and Actions.
Table 1. Local jurisdiction survey response rate by county.
COUNTY RESPONSES RESPONSE RATE
Alameda 9 60%Contra Costa 14 70%Marin 8 73%Napa 3 50%San Francisco 1 100%San Mateo 14 67%Santa Clara 13 81%Solano 4 50%Sonoma 7 70%
1 See State of California Government Code Section 65584.04(b)(1).2 See State of California Government Code Section 65584.04(b)(2).
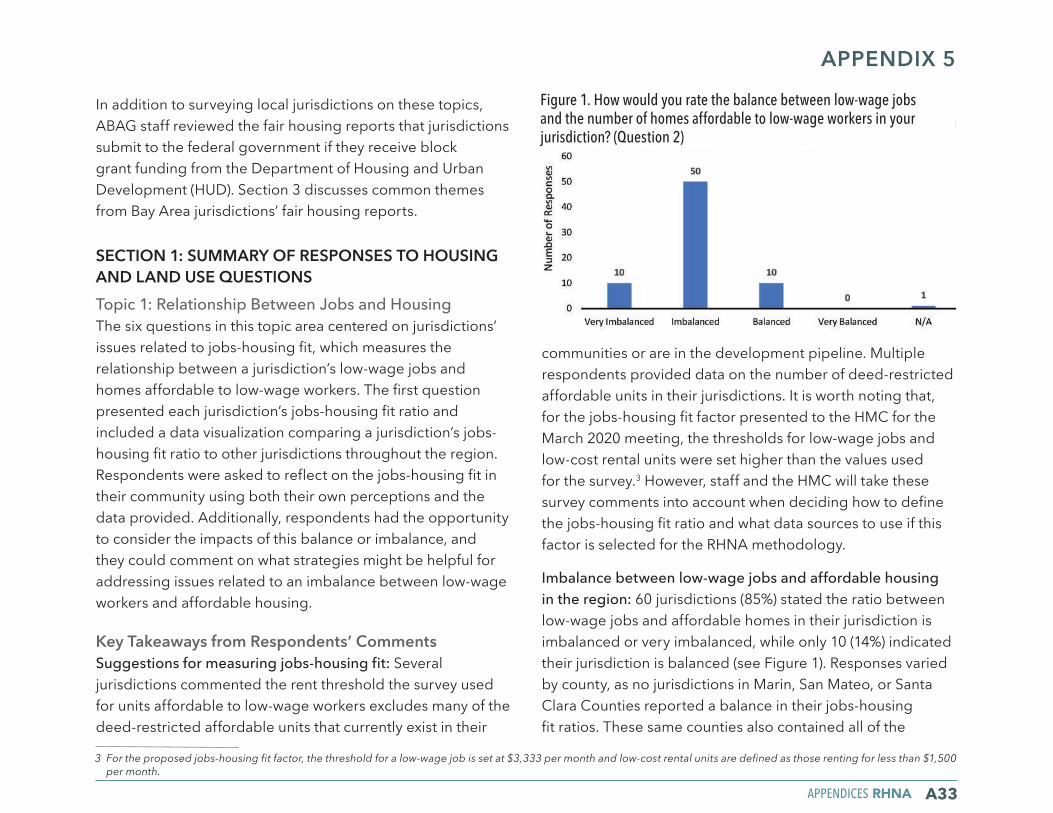
APPENDICES RHNA A33
APPENDIX 5
In addition to surveying local jurisdictions on these topics, ABAG staff reviewed the fair housing reports that jurisdictions submit to the federal government if they receive block grant funding from the Department of Housing and Urban Development (HUD). Section 3 discusses common themes from Bay Area jurisdictions’ fair housing reports.
SECTION 1: SUMMARY OF RESPONSES TO HOUSING AND LAND USE QUESTIONS Topic 1: Relationship Between Jobs and HousingThe six questions in this topic area centered on jurisdictions’ issues related to jobs-housing fit, which measures the relationship between a jurisdiction’s low-wage jobs and homes affordable to low-wage workers. The first question presented each jurisdiction’s jobs-housing fit ratio and included a data visualization comparing a jurisdiction’s jobs-housing fit ratio to other jurisdictions throughout the region. Respondents were asked to reflect on the jobs-housing fit in their community using both their own perceptions and the data provided. Additionally, respondents had the opportunity to consider the impacts of this balance or imbalance, and they could comment on what strategies might be helpful for addressing issues related to an imbalance between low-wage workers and affordable housing.
Key Takeaways from Respondents’ CommentsSuggestions for measuring jobs-housing fit: Several jurisdictions commented the rent threshold the survey used for units affordable to low-wage workers excludes many of the deed-restricted affordable units that currently exist in their
communities or are in the development pipeline. Multiple respondents provided data on the number of deed-restricted affordable units in their jurisdictions. It is worth noting that, for the jobs-housing fit factor presented to the HMC for the March 2020 meeting, the thresholds for low-wage jobs and low-cost rental units were set higher than the values used for the survey.3 However, staff and the HMC will take these survey comments into account when deciding how to define the jobs-housing fit ratio and what data sources to use if this factor is selected for the RHNA methodology.
Imbalance between low-wage jobs and affordable housing in the region: 60 jurisdictions (85%) stated the ratio between low-wage jobs and affordable homes in their jurisdiction is imbalanced or very imbalanced, while only 10 (14%) indicated their jurisdiction is balanced (see Figure 1). Responses varied by county, as no jurisdictions in Marin, San Mateo, or Santa Clara Counties reported a balance in their jobs-housing fit ratios. These same counties also contained all of the
3 For the proposed jobs-housing fit factor, the threshold for a low-wage job is set at $3,333 per month and low-cost rental units are defined as those renting for less than $1,500 per month.
Figure 1. How would you rate the balance between low-wage jobs and the number of homes affordable to low-wage workers in your jurisdiction? (Question 2)
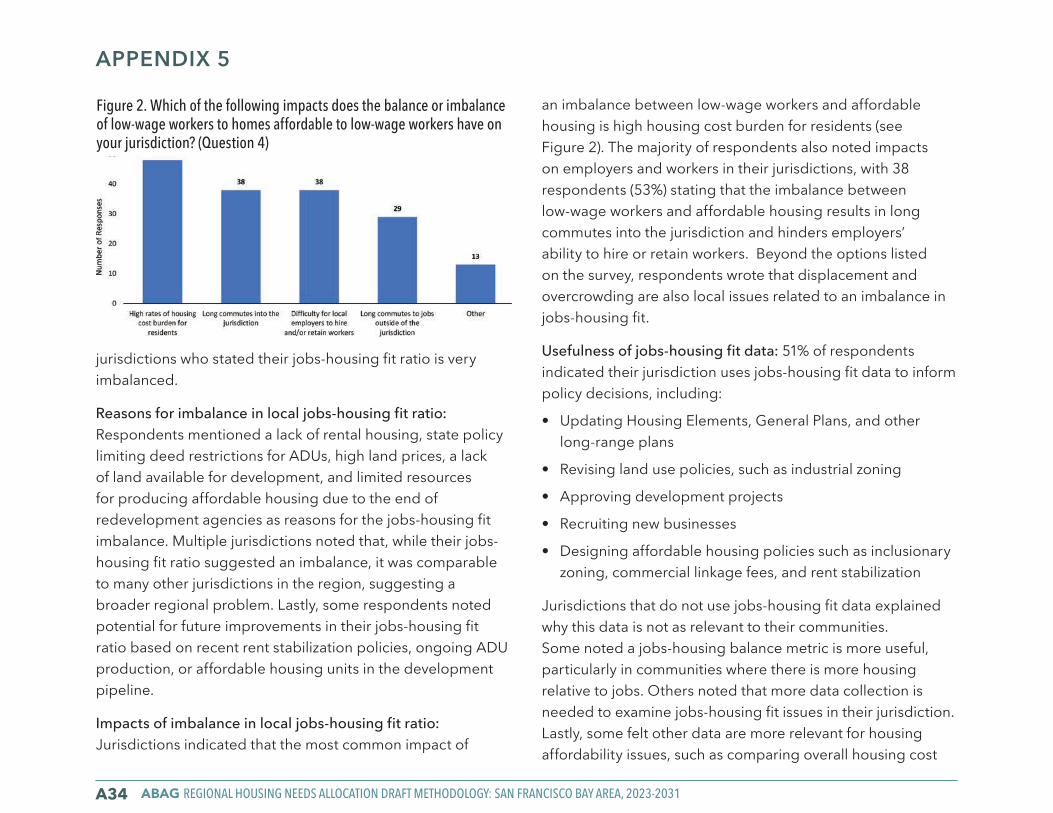
ABAG REGIONAL HOUSING NEEDS ALLOCATION DRAFT METHODOLOGY: SAN FRANCISCO BAY AREA, 2023-2031A34
APPENDIX 5
jurisdictions who stated their jobs-housing fit ratio is very imbalanced.
Reasons for imbalance in local jobs-housing fit ratio: Respondents mentioned a lack of rental housing, state policy limiting deed restrictions for ADUs, high land prices, a lack of land available for development, and limited resources for producing affordable housing due to the end of redevelopment agencies as reasons for the jobs-housing fit imbalance. Multiple jurisdictions noted that, while their jobs-housing fit ratio suggested an imbalance, it was comparable to many other jurisdictions in the region, suggesting a broader regional problem. Lastly, some respondents noted potential for future improvements in their jobs-housing fit ratio based on recent rent stabilization policies, ongoing ADU production, or affordable housing units in the development pipeline.
Impacts of imbalance in local jobs-housing fit ratio: Jurisdictions indicated that the most common impact of
an imbalance between low-wage workers and affordable housing is high housing cost burden for residents (see Figure 2). The majority of respondents also noted impacts on employers and workers in their jurisdictions, with 38 respondents (53%) stating that the imbalance between low-wage workers and affordable housing results in long commutes into the jurisdiction and hinders employers’ ability to hire or retain workers. Beyond the options listed on the survey, respondents wrote that displacement and overcrowding are also local issues related to an imbalance in jobs-housing fit.
Usefulness of jobs-housing fit data: 51% of respondents indicated their jurisdiction uses jobs-housing fit data to inform policy decisions, including:
• Updating Housing Elements, General Plans, and other long-range plans
• Revising land use policies, such as industrial zoning
• Approving development projects
• Recruiting new businesses
• Designing affordable housing policies such as inclusionary zoning, commercial linkage fees, and rent stabilization
Jurisdictions that do not use jobs-housing fit data explained why this data is not as relevant to their communities. Some noted a jobs-housing balance metric is more useful, particularly in communities where there is more housing relative to jobs. Others noted that more data collection is needed to examine jobs-housing fit issues in their jurisdiction. Lastly, some felt other data are more relevant for housing affordability issues, such as comparing overall housing cost
Figure 2. Which of the following impacts does the balance or imbalance of low-wage workers to homes affordable to low-wage workers have on your jurisdiction? (Question 4)
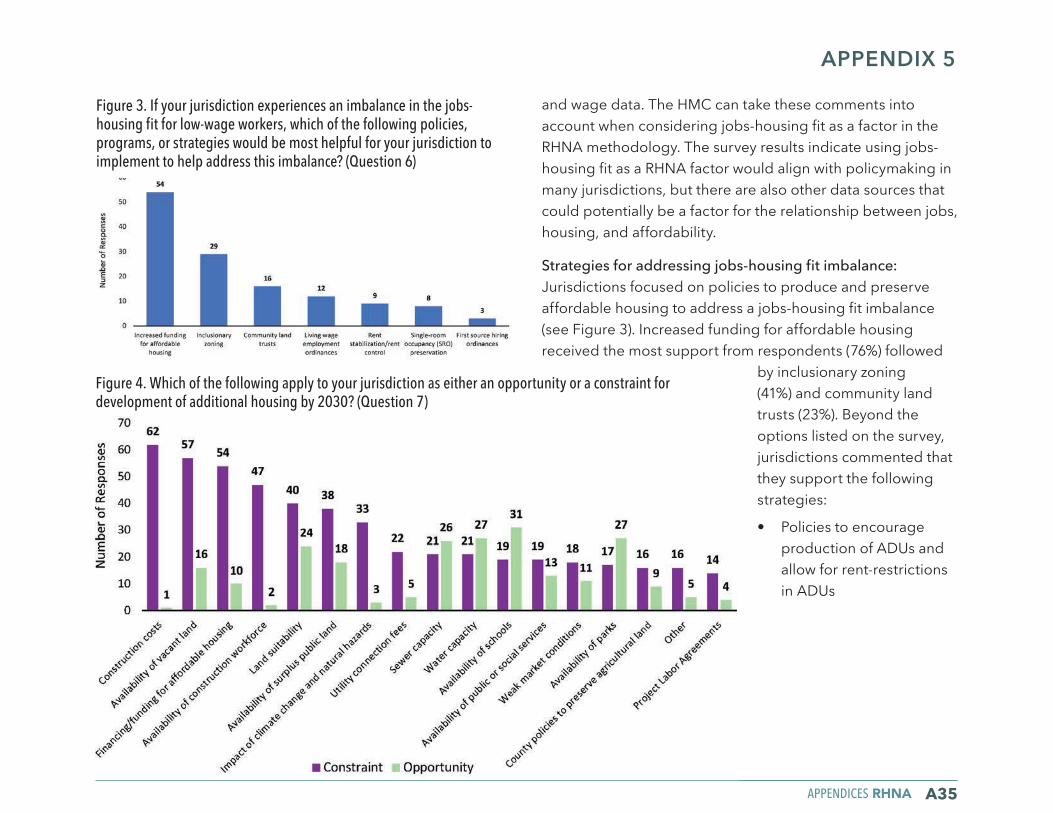
APPENDICES RHNA A35
APPENDIX 5
and wage data. The HMC can take these comments into account when considering jobs-housing fit as a factor in the RHNA methodology. The survey results indicate using jobs-housing fit as a RHNA factor would align with policymaking in many jurisdictions, but there are also other data sources that could potentially be a factor for the relationship between jobs, housing, and affordability.
Strategies for addressing jobs-housing fit imbalance: Jurisdictions focused on policies to produce and preserve affordable housing to address a jobs-housing fit imbalance (see Figure 3). Increased funding for affordable housing received the most support from respondents (76%) followed
by inclusionary zoning (41%) and community land trusts (23%). Beyond the options listed on the survey, jurisdictions commented that they support the following strategies:
• Policies to encourage production of ADUs and allow for rent-restrictions in ADUs
Figure 4. Which of the following apply to your jurisdiction as either an opportunity or a constraint for development of additional housing by 2030? (Question 7)
Figure 3. If your jurisdiction experiences an imbalance in the jobs-housing fit for low-wage workers, which of the following policies, programs, or strategies would be most helpful for your jurisdiction to implement to help address this imbalance? (Question 6)
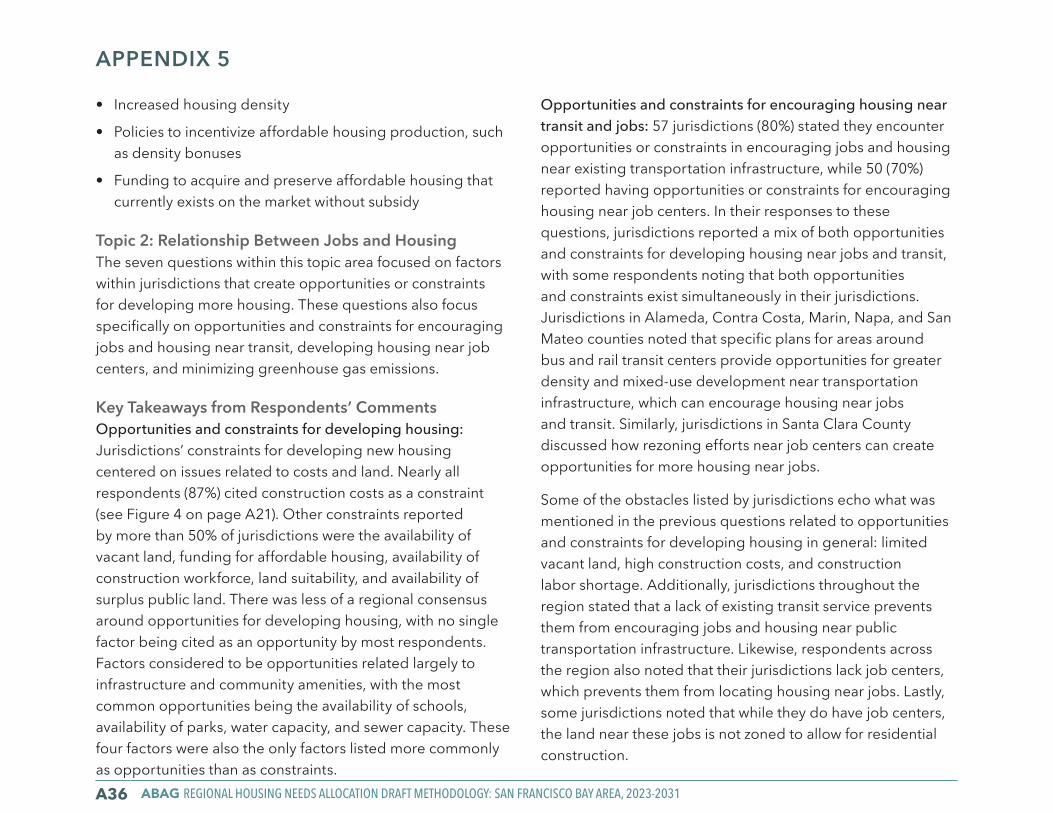
ABAG REGIONAL HOUSING NEEDS ALLOCATION DRAFT METHODOLOGY: SAN FRANCISCO BAY AREA, 2023-2031A36
APPENDIX 5
• Increased housing density
• Policies to incentivize affordable housing production, such as density bonuses
• Funding to acquire and preserve affordable housing that currently exists on the market without subsidy
Topic 2: Relationship Between Jobs and HousingThe seven questions within this topic area focused on factors within jurisdictions that create opportunities or constraints for developing more housing. These questions also focus specifically on opportunities and constraints for encouraging jobs and housing near transit, developing housing near job centers, and minimizing greenhouse gas emissions.
Key Takeaways from Respondents’ CommentsOpportunities and constraints for developing housing:Jurisdictions’ constraints for developing new housing centered on issues related to costs and land. Nearly all respondents (87%) cited construction costs as a constraint (see Figure 4 on page A21). Other constraints reported by more than 50% of jurisdictions were the availability of vacant land, funding for affordable housing, availability of construction workforce, land suitability, and availability of surplus public land. There was less of a regional consensus around opportunities for developing housing, with no single factor being cited as an opportunity by most respondents. Factors considered to be opportunities related largely to infrastructure and community amenities, with the most common opportunities being the availability of schools, availability of parks, water capacity, and sewer capacity. These four factors were also the only factors listed more commonly as opportunities than as constraints.
Opportunities and constraints for encouraging housing near transit and jobs: 57 jurisdictions (80%) stated they encounter opportunities or constraints in encouraging jobs and housing near existing transportation infrastructure, while 50 (70%) reported having opportunities or constraints for encouraging housing near job centers. In their responses to these questions, jurisdictions reported a mix of both opportunities and constraints for developing housing near jobs and transit, with some respondents noting that both opportunities and constraints exist simultaneously in their jurisdictions. Jurisdictions in Alameda, Contra Costa, Marin, Napa, and San Mateo counties noted that specific plans for areas around bus and rail transit centers provide opportunities for greater density and mixed-use development near transportation infrastructure, which can encourage housing near jobs and transit. Similarly, jurisdictions in Santa Clara County discussed how rezoning efforts near job centers can create opportunities for more housing near jobs.
Some of the obstacles listed by jurisdictions echo what was mentioned in the previous questions related to opportunities and constraints for developing housing in general: limited vacant land, high construction costs, and construction labor shortage. Additionally, jurisdictions throughout the region stated that a lack of existing transit service prevents them from encouraging jobs and housing near public transportation infrastructure. Likewise, respondents across the region also noted that their jurisdictions lack job centers, which prevents them from locating housing near jobs. Lastly, some jurisdictions noted that while they do have job centers, the land near these jobs is not zoned to allow for residential construction.
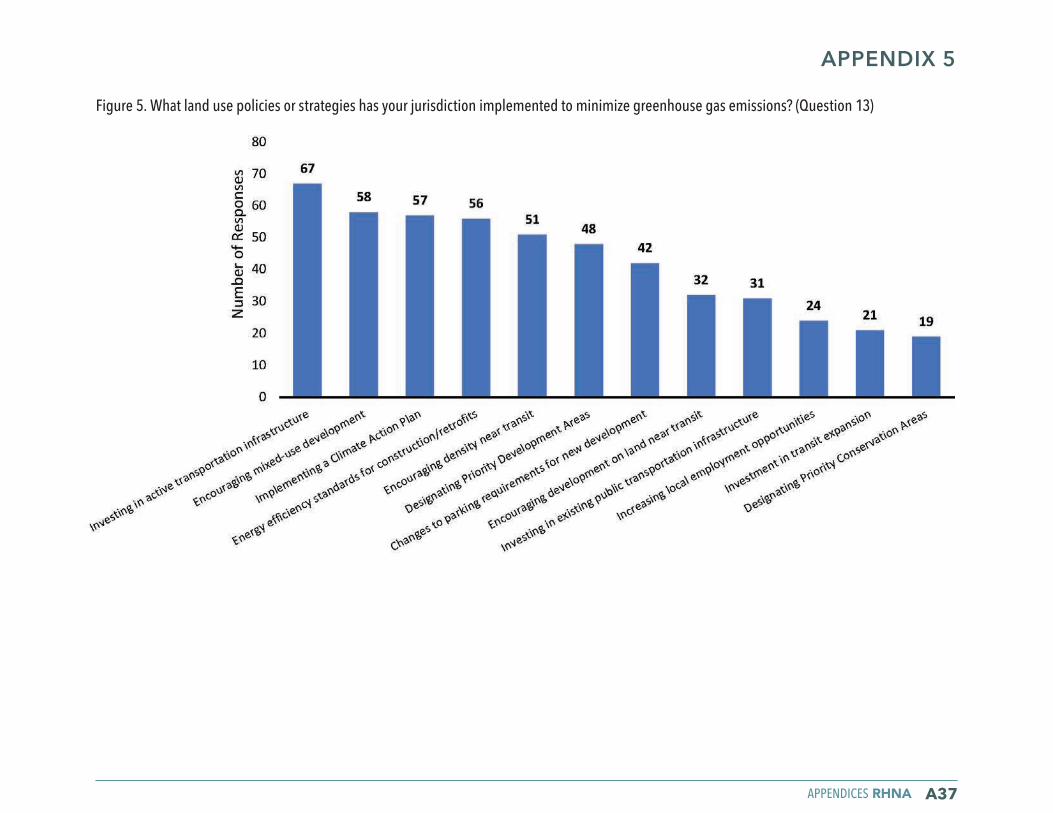
APPENDICES RHNA A37
APPENDIX 5
Figure 5. What land use policies or strategies has your jurisdiction implemented to minimize greenhouse gas emissions? (Question 13)
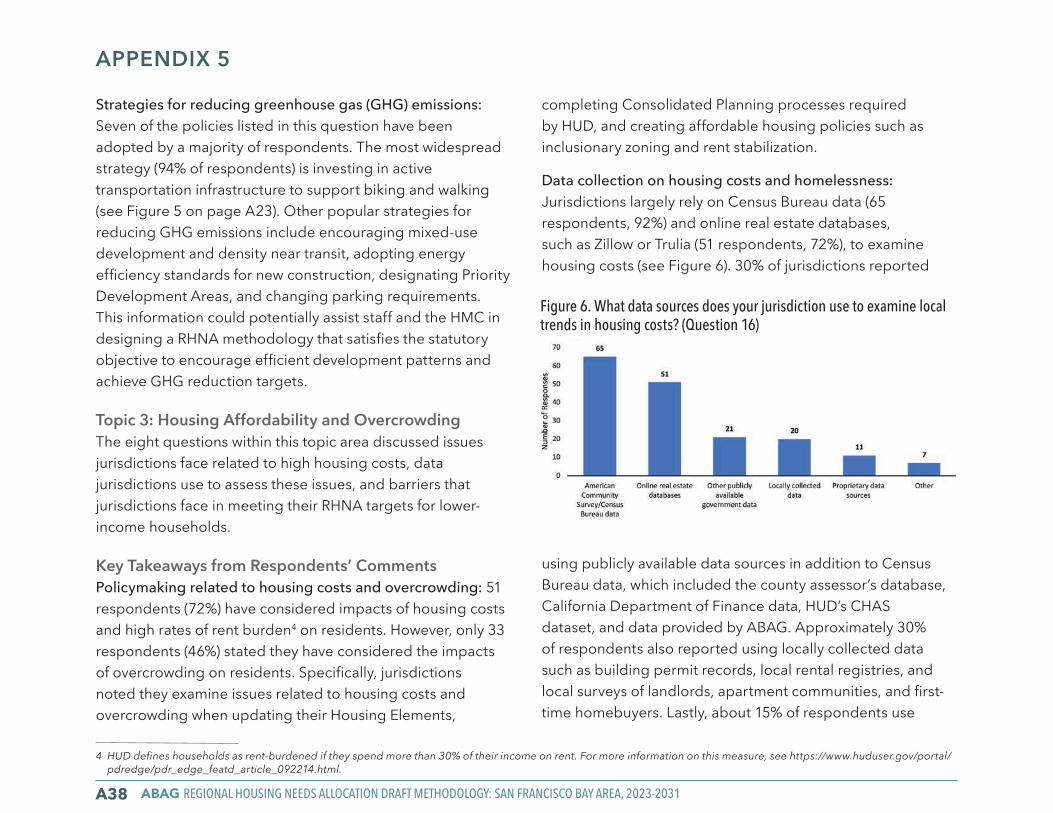
ABAG REGIONAL HOUSING NEEDS ALLOCATION DRAFT METHODOLOGY: SAN FRANCISCO BAY AREA, 2023-2031A38
APPENDIX 5
Strategies for reducing greenhouse gas (GHG) emissions:Seven of the policies listed in this question have been adopted by a majority of respondents. The most widespread strategy (94% of respondents) is investing in active transportation infrastructure to support biking and walking (see Figure 5 on page A23). Other popular strategies for reducing GHG emissions include encouraging mixed-use development and density near transit, adopting energy efficiency standards for new construction, designating Priority Development Areas, and changing parking requirements. This information could potentially assist staff and the HMC in designing a RHNA methodology that satisfies the statutory objective to encourage efficient development patterns and achieve GHG reduction targets.
Topic 3: Housing Affordability and OvercrowdingThe eight questions within this topic area discussed issues jurisdictions face related to high housing costs, data jurisdictions use to assess these issues, and barriers that jurisdictions face in meeting their RHNA targets for lower-income households.
Key Takeaways from Respondents’ CommentsPolicymaking related to housing costs and overcrowding: 51 respondents (72%) have considered impacts of housing costs and high rates of rent burden4 on residents. However, only 33 respondents (46%) stated they have considered the impacts of overcrowding on residents. Specifically, jurisdictions noted they examine issues related to housing costs and overcrowding when updating their Housing Elements,
completing Consolidated Planning processes required by HUD, and creating affordable housing policies such as inclusionary zoning and rent stabilization.
Data collection on housing costs and homelessness: Jurisdictions largely rely on Census Bureau data (65 respondents, 92%) and online real estate databases, such as Zillow or Trulia (51 respondents, 72%), to examine housing costs (see Figure 6). 30% of jurisdictions reported
using publicly available data sources in addition to Census Bureau data, which included the county assessor’s database, California Department of Finance data, HUD’s CHAS dataset, and data provided by ABAG. Approximately 30% of respondents also reported using locally collected data such as building permit records, local rental registries, and local surveys of landlords, apartment communities, and first-time homebuyers. Lastly, about 15% of respondents use
4 HUD defines households as rent-burdened if they spend more than 30% of their income on rent. For more information on this measure, see https://www.huduser.gov/portal/pdredge/pdr_edge_featd_article_092214.html.
Figure 6. What data sources does your jurisdiction use to examine local trends in housing costs? (Question 16)
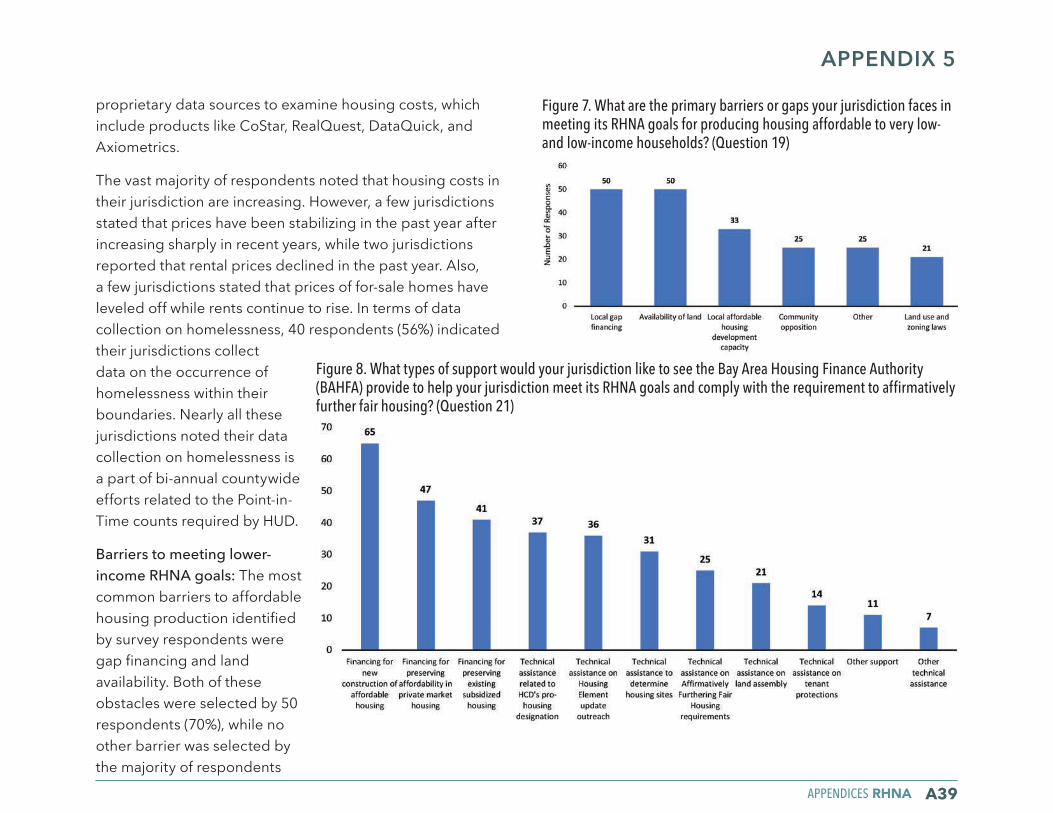
APPENDICES RHNA A39
APPENDIX 5
proprietary data sources to examine housing costs, which include products like CoStar, RealQuest, DataQuick, and Axiometrics.
The vast majority of respondents noted that housing costs in their jurisdiction are increasing. However, a few jurisdictions stated that prices have been stabilizing in the past year after increasing sharply in recent years, while two jurisdictions reported that rental prices declined in the past year. Also, a few jurisdictions stated that prices of for-sale homes have leveled off while rents continue to rise. In terms of data collection on homelessness, 40 respondents (56%) indicated their jurisdictions collect data on the occurrence of homelessness within their boundaries. Nearly all these jurisdictions noted their data collection on homelessness is a part of bi-annual countywide efforts related to the Point-in-Time counts required by HUD.
Barriers to meeting lower-income RHNA goals: The most common barriers to affordable housing production identified by survey respondents were gap financing and land availability. Both of these obstacles were selected by 50 respondents (70%), while no other barrier was selected by the majority of respondents
Figure 7. What are the primary barriers or gaps your jurisdiction faces in meeting its RHNA goals for producing housing affordable to very low- and low-income households? (Question 19)
Figure 8. What types of support would your jurisdiction like to see the Bay Area Housing Finance Authority (BAHFA) provide to help your jurisdiction meet its RHNA goals and comply with the requirement to affirmatively further fair housing? (Question 21)
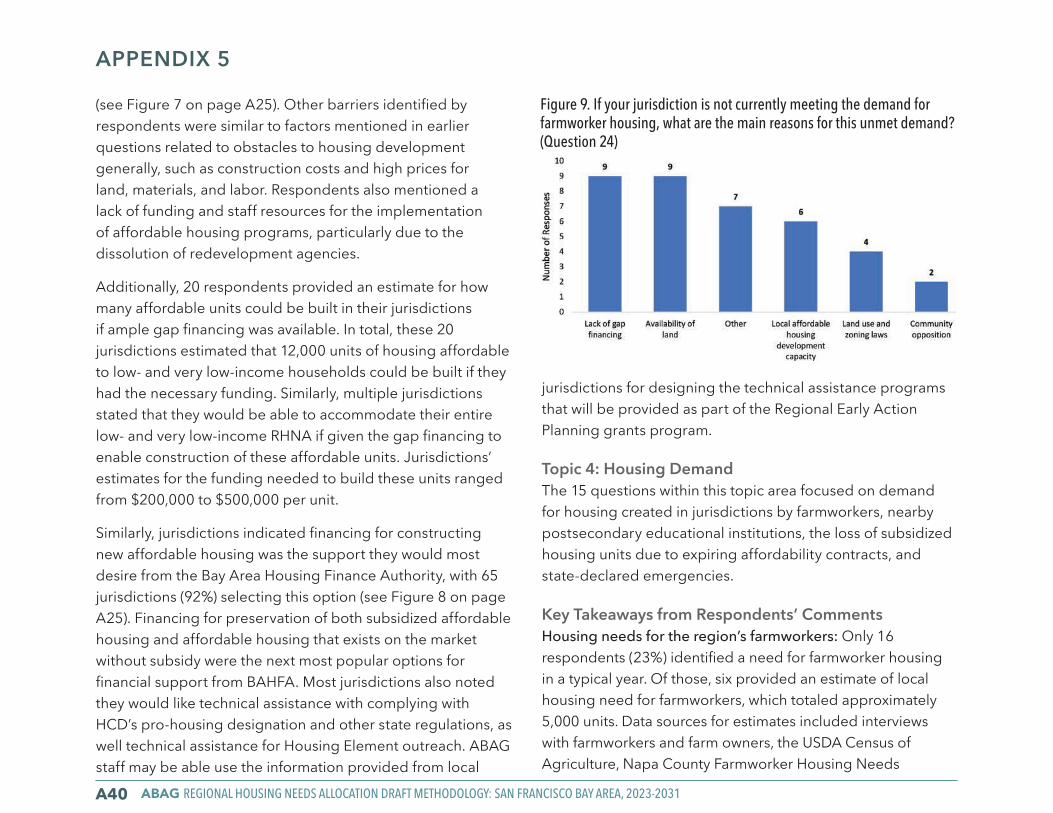
ABAG REGIONAL HOUSING NEEDS ALLOCATION DRAFT METHODOLOGY: SAN FRANCISCO BAY AREA, 2023-2031A40
APPENDIX 5
(see Figure 7 on page A25). Other barriers identified by respondents were similar to factors mentioned in earlier questions related to obstacles to housing development generally, such as construction costs and high prices for land, materials, and labor. Respondents also mentioned a lack of funding and staff resources for the implementation of affordable housing programs, particularly due to the dissolution of redevelopment agencies.
Additionally, 20 respondents provided an estimate for how many affordable units could be built in their jurisdictions if ample gap financing was available. In total, these 20 jurisdictions estimated that 12,000 units of housing affordable to low- and very low-income households could be built if they had the necessary funding. Similarly, multiple jurisdictions stated that they would be able to accommodate their entire low- and very low-income RHNA if given the gap financing to enable construction of these affordable units. Jurisdictions’ estimates for the funding needed to build these units ranged from $200,000 to $500,000 per unit.
Similarly, jurisdictions indicated financing for constructing new affordable housing was the support they would most desire from the Bay Area Housing Finance Authority, with 65 jurisdictions (92%) selecting this option (see Figure 8 on page A25). Financing for preservation of both subsidized affordable housing and affordable housing that exists on the market without subsidy were the next most popular options for financial support from BAHFA. Most jurisdictions also noted they would like technical assistance with complying with HCD’s pro-housing designation and other state regulations, as well technical assistance for Housing Element outreach. ABAG staff may be able use the information provided from local
jurisdictions for designing the technical assistance programs that will be provided as part of the Regional Early Action Planning grants program.
Topic 4: Housing DemandThe 15 questions within this topic area focused on demand for housing created in jurisdictions by farmworkers, nearby postsecondary educational institutions, the loss of subsidized housing units due to expiring affordability contracts, and state-declared emergencies.
Key Takeaways from Respondents’ CommentsHousing needs for the region’s farmworkers: Only 16 respondents (23%) identified a need for farmworker housing in a typical year. Of those, six provided an estimate of local housing need for farmworkers, which totaled approximately 5,000 units. Data sources for estimates included interviews with farmworkers and farm owners, the USDA Census of Agriculture, Napa County Farmworker Housing Needs
Figure 9. If your jurisdiction is not currently meeting the demand for farmworker housing, what are the main reasons for this unmet demand? (Question 24)
APPENDICES RHNA A41
APPENDIX 5
Assessment, Santa Clara County Planning Department survey, and the California Employment Development Department. The most common barriers to meeting demand for farmworker housing are similar to barriers to developing affordable housing generally. Among the 16 respondents with a need for farmworker housing, the most common barriers are a lack of financing and limited availability of land (see Figure 9 on page A26).
Housing demand created by postsecondary educational institutions: Responses to questions about housing demand created by postsecondary educational institutions indicate a need for better data collection on this issue. Only 8 respondents (11%) were able to provide an estimate for this housing need. Several more jurisdictions indicated there is significant housing demand created by nearby postsecondary educational institutions, but the number of housing units needed to meet this demand is unknown. The eight jurisdictions that were able to estimate the housing demand created by postsecondary educational institutions stated that the data for their estimates came from surveys conducted by these institutions, but several more jurisdictions indicated they have not been able to obtain this information from local colleges and universities.
Loss of subsidized affordable housing: 19 respondents (27%) stated their jurisdictions had lost subsidized affordable housing units in the past 10 years due to expiring affordability contracts or other issues facing at-risk affordable housing units. Most of the data for these responses came from internal sources. Jurisdictions noted their awareness of affordable housing built with redevelopment funds that converted to
market-rate due to expiring regulatory agreements, and respondents also stated they were aware of below-market-rate units built through inclusionary housing programs that had lapsing affordability requirements.
A larger number of respondents expected to lose affordable housing units in the next 10 years, with 23 respondents (32%) noting that they anticipated these future losses. These respondents also referred to internal city records that indicated the pending expiration of regulatory agreements. Notably, one jurisdiction stated that 68% of existing below-market-rate rental units in its Below Market Rate Housing Program are set to expire in 10 years. Additionally, another respondent commented that the number of affordable units owned by for-profit owners in their jurisdiction is high according to research by the California Housing Partnership, which indicates a high risk for losing these affordable units in the future.5
These survey responses indicate that helping cities prevent the loss of affordable housing because of expiring affordability requirements could be a potential focus of ABAG’s Regional Early Action Planning grants program. Additionally, the variety of data on at-risk affordable units collected by both individual jurisdictions and the California Housing Partnership points to a need to compile this data if the HMC were to consider using the loss of affordable units as a RHNA methodology factor.
Loss of housing units due to state-declared emergencies: Only six respondents (8%) stated their jurisdiction had lost housing units during a state-declared emergency (such as a fire or other natural disaster) that have not been rebuilt. These
5 For more information on the California Housing Partnership’s research on at-risk affordable housing in California, see https://1p08d91kd0c03rlxhmhtydpr-wpengine.netdna-ssl.com/wp-content/uploads/2020/02/2020-Affordable-Homes-at-Risk_CHPC-Final.pdf.
ABAG REGIONAL HOUSING NEEDS ALLOCATION DRAFT METHODOLOGY: SAN FRANCISCO BAY AREA, 2023-2031A42
APPENDIX 5
jurisdictions are in Napa, San Mateo, Santa Clara, Solano, and Sonoma counties. Two jurisdictions in Sonoma County were able to provide precise data on the number of units lost in recent fires. Another Sonoma County jurisdiction noted that they did not lose any housing in the fire but have experienced increased demand in housing because of lost units in surrounding communities. Additionally, two jurisdictions in Marin County noted that, while they have not lost units recently, they expect that units lost in the future due to sea level rise and increased flooding may not be replaced.
SECTION 2: SUMMARY OF RESPONSES TO FAIR HOUSING QUESTIONSThe data and information collected in the Local Jurisdiction Survey can help Bay Area jurisdictions understand the framework needed for assessing fair housing issues, which state law now requires for the next Housing Element update in 2022. Notably, several jurisdictions reported in the survey that they lack data on segregation patterns and have not previously set goals in their Housing Elements related to removing barriers to housing choice. However, this type of analysis will likely be needed for the upcoming Housing Element update.
Accordingly, the survey results can help ABAG staff identify assistance that they can offer through the Regional Early Action Planning (REAP) grants program to help local jurisdictions comply with new Housing Element requirements. Additionally, both the Local Jurisdiction Survey and the review of Bay Area jurisdictions’ fair housing reports to HUD identified regional themes regarding both barriers to fair housing choice and strategies to further fair housing. This knowledge can inform how ABAG designs technical assistance and grant programs in
the future to help local jurisdictions implement successful fair housing strategies.
Topic 1: Fair Housing Planning and Data SourcesThe eight questions in this topic area centered on jurisdictions’ processes for assessing fair housing issues in their communities. Federal law obligates jurisdictions receiving block grant funding from HUD to submit a Consolidated Plan to HUD every five years, and this process requires jurisdictions to assess local fair housing issues (see Section 3 for more details on federally mandated fair housing reporting). While the Local Jurisdiction Survey did ask whether jurisdictions currently submit fair housing reports to HUD, all questions on the survey could be applicable to jurisdictions regardless of whether they participate in federal fair housing reporting. This portion of the survey also asked about the data jurisdictions use for fair housing planning and the efforts they have made to elicit public participation in their fair housing planning processes.
Key Takeaways from Respondents’ CommentsFair housing reporting to HUD: According to the results of the local jurisdiction survey, 37 respondents (51%) have submitted a fair housing report to HUD. Because these reports are submitted as part of five-year planning cycles, most of these jurisdictions recently submitted a report for the years 2020-2025 or are currently working on a report for this cycle, though a few jurisdictions’ Consolidated Plans are on a different timeline. While some reports are submitted to HUD by individual jurisdictions, this reporting can also be completed as a collaborative effort between a county government and local jurisdictions within the county.
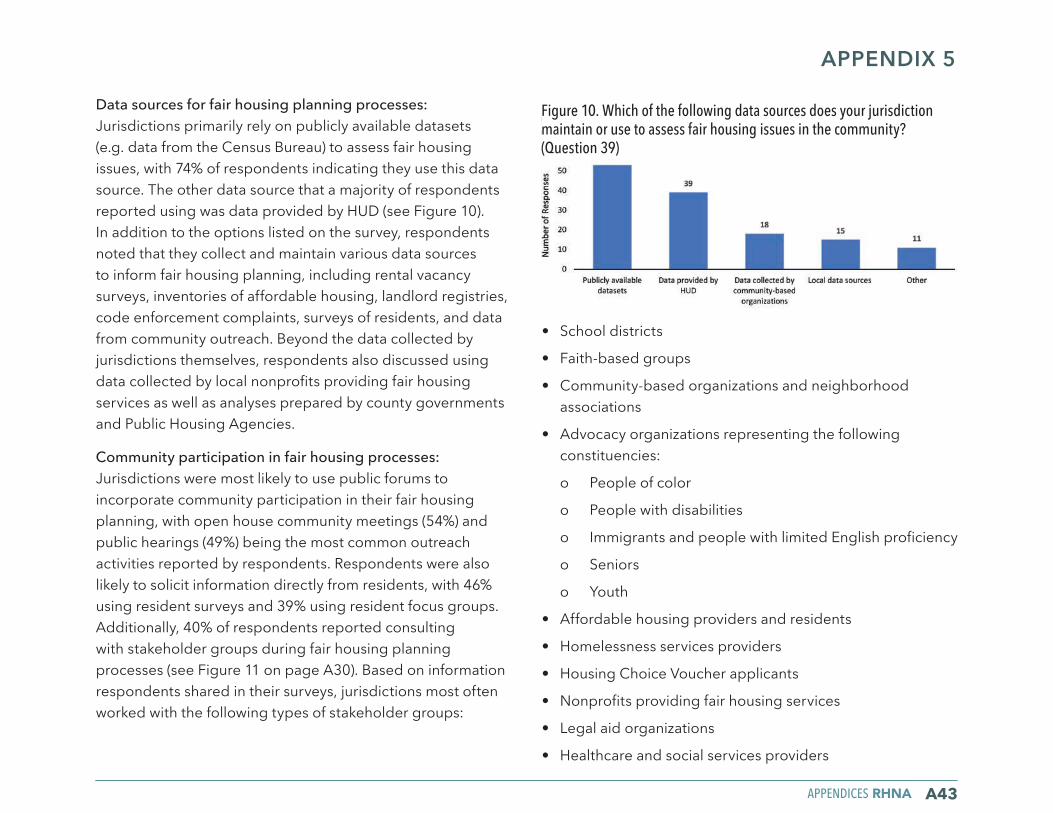
APPENDICES RHNA A43
APPENDIX 5
Figure 10. Which of the following data sources does your jurisdiction maintain or use to assess fair housing issues in the community? (Question 39)
Data sources for fair housing planning processes:Jurisdictions primarily rely on publicly available datasets (e.g. data from the Census Bureau) to assess fair housing issues, with 74% of respondents indicating they use this data source. The other data source that a majority of respondents reported using was data provided by HUD (see Figure 10). In addition to the options listed on the survey, respondents noted that they collect and maintain various data sources to inform fair housing planning, including rental vacancy surveys, inventories of affordable housing, landlord registries, code enforcement complaints, surveys of residents, and data from community outreach. Beyond the data collected by jurisdictions themselves, respondents also discussed using data collected by local nonprofits providing fair housing services as well as analyses prepared by county governments and Public Housing Agencies.
Community participation in fair housing processes: Jurisdictions were most likely to use public forums to incorporate community participation in their fair housing planning, with open house community meetings (54%) and public hearings (49%) being the most common outreach activities reported by respondents. Respondents were also likely to solicit information directly from residents, with 46% using resident surveys and 39% using resident focus groups. Additionally, 40% of respondents reported consulting with stakeholder groups during fair housing planning processes (see Figure 11 on page A30). Based on information respondents shared in their surveys, jurisdictions most often worked with the following types of stakeholder groups:
• School districts
• Faith-based groups
• Community-based organizations and neighborhood associations
• Advocacy organizations representing the following constituencies:
o People of color
o People with disabilities
o Immigrants and people with limited English proficiency
o Seniors
o Youth
• Affordable housing providers and residents
• Homelessness services providers
• Housing Choice Voucher applicants
• Nonprofits providing fair housing services
• Legal aid organizations
• Healthcare and social services providers
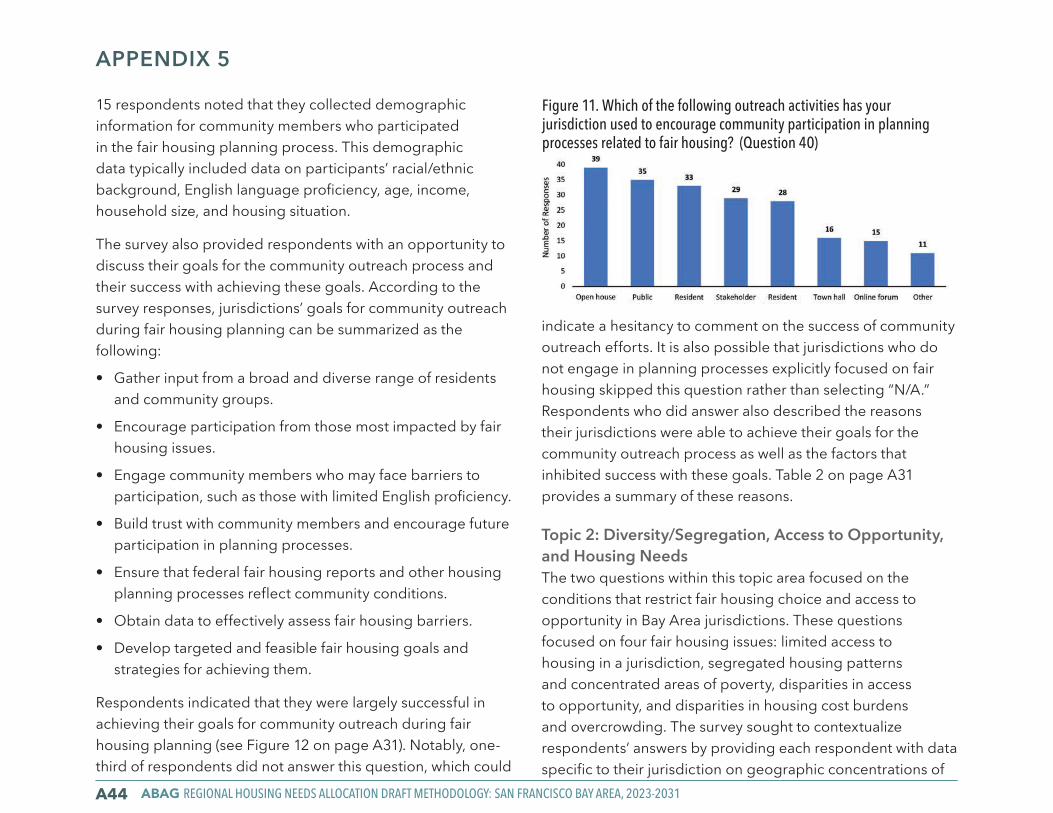
ABAG REGIONAL HOUSING NEEDS ALLOCATION DRAFT METHODOLOGY: SAN FRANCISCO BAY AREA, 2023-2031A44
APPENDIX 5
15 respondents noted that they collected demographic information for community members who participated in the fair housing planning process. This demographic data typically included data on participants’ racial/ethnic background, English language proficiency, age, income, household size, and housing situation.
The survey also provided respondents with an opportunity to discuss their goals for the community outreach process and their success with achieving these goals. According to the survey responses, jurisdictions’ goals for community outreach during fair housing planning can be summarized as the following:
• Gather input from a broad and diverse range of residents and community groups.
• Encourage participation from those most impacted by fair housing issues.
• Engage community members who may face barriers to participation, such as those with limited English proficiency.
• Build trust with community members and encourage future participation in planning processes.
• Ensure that federal fair housing reports and other housing planning processes reflect community conditions.
• Obtain data to effectively assess fair housing barriers.
• Develop targeted and feasible fair housing goals and strategies for achieving them.
Respondents indicated that they were largely successful in achieving their goals for community outreach during fair housing planning (see Figure 12 on page A31). Notably, one-third of respondents did not answer this question, which could
indicate a hesitancy to comment on the success of community outreach efforts. It is also possible that jurisdictions who do not engage in planning processes explicitly focused on fair housing skipped this question rather than selecting “N/A.” Respondents who did answer also described the reasons their jurisdictions were able to achieve their goals for the community outreach process as well as the factors that inhibited success with these goals. Table 2 on page A31 provides a summary of these reasons.
Topic 2: Diversity/Segregation, Access to Opportunity, and Housing Needs The two questions within this topic area focused on the conditions that restrict fair housing choice and access to opportunity in Bay Area jurisdictions. These questions focused on four fair housing issues: limited access to housing in a jurisdiction, segregated housing patterns and concentrated areas of poverty, disparities in access to opportunity, and disparities in housing cost burdens and overcrowding. The survey sought to contextualize respondents’ answers by providing each respondent with data specific to their jurisdiction on geographic concentrations of
Figure 11. Which of the following outreach activities has your jurisdiction used to encourage community participation in planning processes related to fair housing? (Question 40)
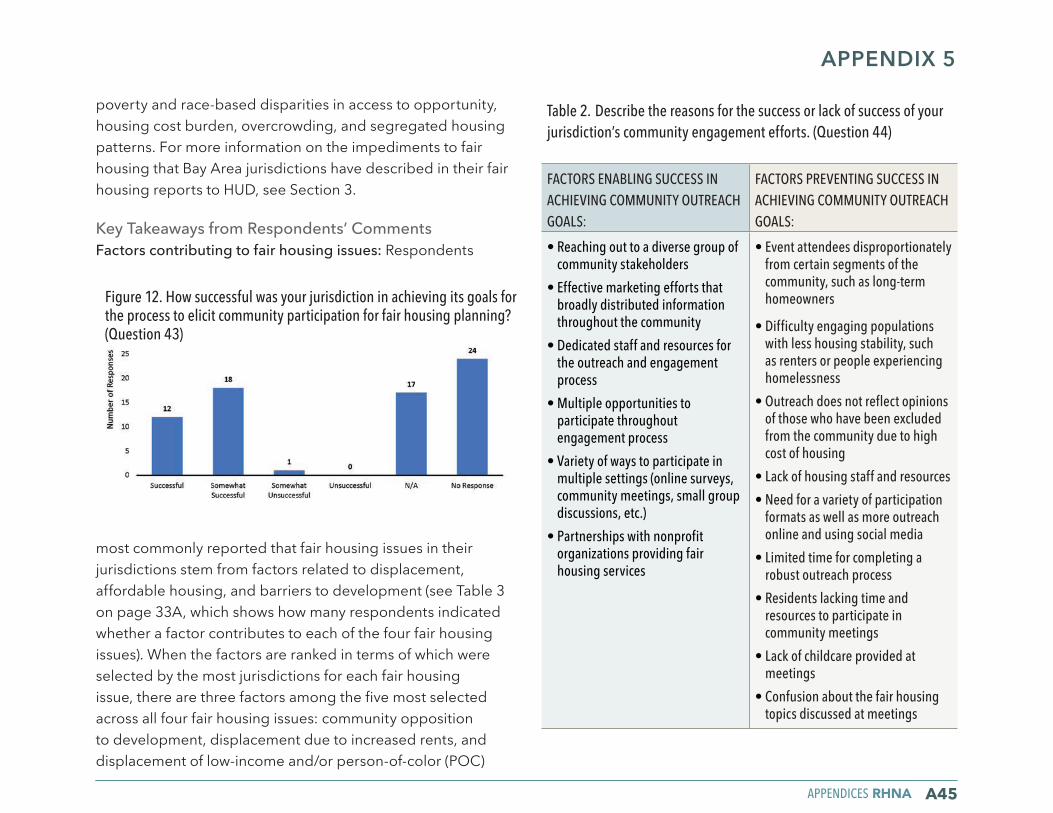
APPENDICES RHNA A45
Figure 12. How successful was your jurisdiction in achieving its goals for the process to elicit community participation for fair housing planning? (Question 43)
Table 2. Describe the reasons for the success or lack of success of your jurisdiction’s community engagement efforts. (Question 44)
FACTORS ENABLING SUCCESS IN ACHIEVING COMMUNITY OUTREACH GOALS:
FACTORS PREVENTING SUCCESS IN ACHIEVING COMMUNITY OUTREACH GOALS:
• Reaching out to a diverse group of community stakeholders
• Effective marketing efforts that broadly distributed information throughout the community
• Dedicated staff and resources for the outreach and engagement process
• Multiple opportunities to participate throughout engagement process
• Variety of ways to participate in multiple settings (online surveys, community meetings, small group discussions, etc.)
• Partnerships with nonprofit organizations providing fair housing services
• Event attendees disproportionately from certain segments of the community, such as long-term homeowners
• Difficulty engaging populations with less housing stability, such as renters or people experiencing homelessness
• Outreach does not reflect opinions of those who have been excluded from the community due to high cost of housing
• Lack of housing staff and resources
• Need for a variety of participation formats as well as more outreach online and using social media
• Limited time for completing a robust outreach process
• Residents lacking time and resources to participate in community meetings
• Lack of childcare provided at meetings
• Confusion about the fair housing topics discussed at meetings
APPENDIX 5
poverty and race-based disparities in access to opportunity, housing cost burden, overcrowding, and segregated housing patterns. For more information on the impediments to fair housing that Bay Area jurisdictions have described in their fair housing reports to HUD, see Section 3.
Key Takeaways from Respondents’ CommentsFactors contributing to fair housing issues: Respondents
most commonly reported that fair housing issues in their jurisdictions stem from factors related to displacement, affordable housing, and barriers to development (see Table 3 on page 33A, which shows how many respondents indicated whether a factor contributes to each of the four fair housing issues). When the factors are ranked in terms of which were selected by the most jurisdictions for each fair housing issue, there are three factors among the five most selected across all four fair housing issues: community opposition to development, displacement due to increased rents, and displacement of low-income and/or person-of-color (POC)
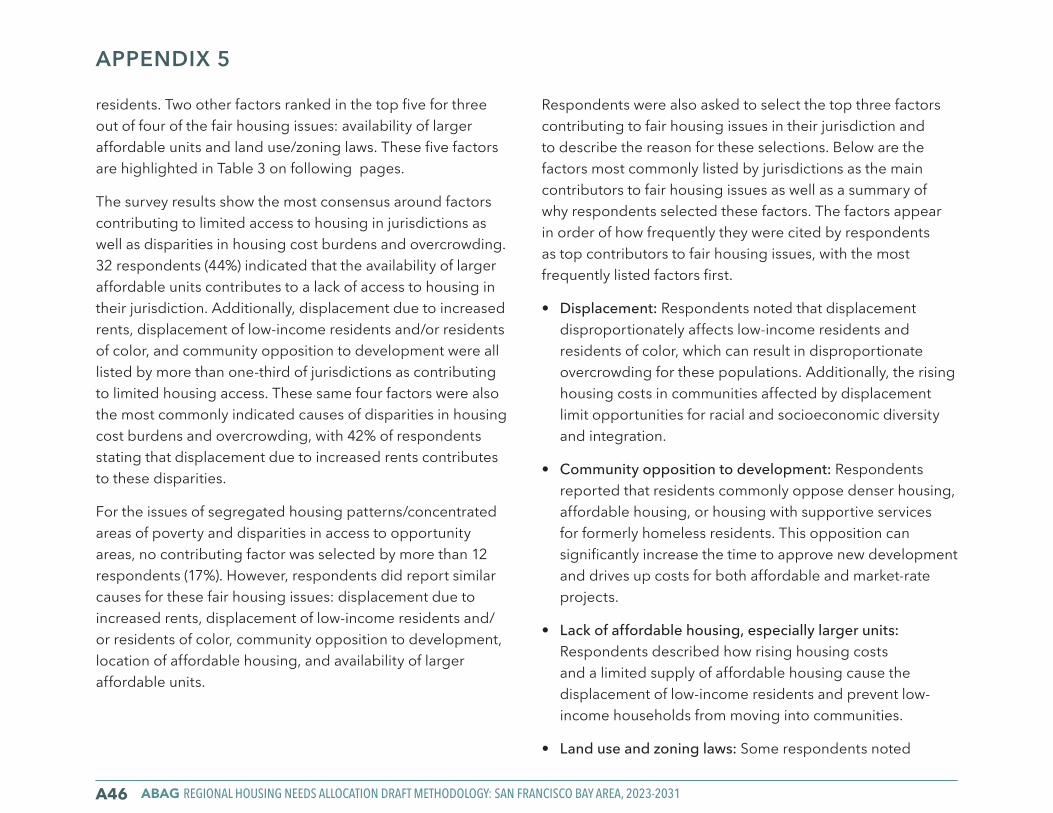
ABAG REGIONAL HOUSING NEEDS ALLOCATION DRAFT METHODOLOGY: SAN FRANCISCO BAY AREA, 2023-2031A46
APPENDIX 5
residents. Two other factors ranked in the top five for three out of four of the fair housing issues: availability of larger affordable units and land use/zoning laws. These five factors are highlighted in Table 3 on following pages.
The survey results show the most consensus around factors contributing to limited access to housing in jurisdictions as well as disparities in housing cost burdens and overcrowding. 32 respondents (44%) indicated that the availability of larger affordable units contributes to a lack of access to housing in their jurisdiction. Additionally, displacement due to increased rents, displacement of low-income residents and/or residents of color, and community opposition to development were all listed by more than one-third of jurisdictions as contributing to limited housing access. These same four factors were also the most commonly indicated causes of disparities in housing cost burdens and overcrowding, with 42% of respondents stating that displacement due to increased rents contributes to these disparities.
For the issues of segregated housing patterns/concentrated areas of poverty and disparities in access to opportunity areas, no contributing factor was selected by more than 12 respondents (17%). However, respondents did report similar causes for these fair housing issues: displacement due to increased rents, displacement of low-income residents and/or residents of color, community opposition to development, location of affordable housing, and availability of larger affordable units.
Respondents were also asked to select the top three factors contributing to fair housing issues in their jurisdiction and to describe the reason for these selections. Below are the factors most commonly listed by jurisdictions as the main contributors to fair housing issues as well as a summary of why respondents selected these factors. The factors appear in order of how frequently they were cited by respondents as top contributors to fair housing issues, with the most frequently listed factors first.
• Displacement: Respondents noted that displacement disproportionately affects low-income residents and residents of color, which can result in disproportionate overcrowding for these populations. Additionally, the rising housing costs in communities affected by displacement limit opportunities for racial and socioeconomic diversity and integration.
• Community opposition to development: Respondents reported that residents commonly oppose denser housing, affordable housing, or housing with supportive services for formerly homeless residents. This opposition can significantly increase the time to approve new development and drives up costs for both affordable and market-rate projects.
• Lack of affordable housing, especially larger units: Respondents described how rising housing costs and a limited supply of affordable housing cause the displacement of low-income residents and prevent low-income households from moving into communities.
• Land use and zoning laws: Some respondents noted
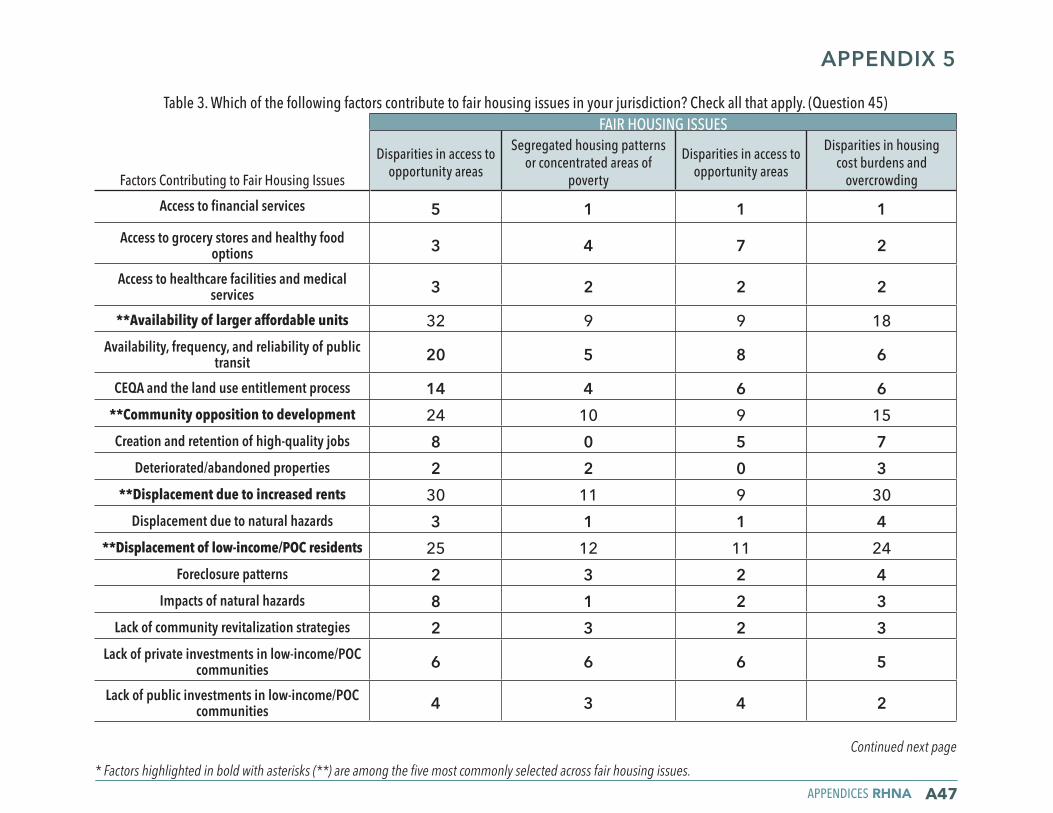
APPENDICES RHNA A47
Table 3. Which of the following factors contribute to fair housing issues in your jurisdiction? Check all that apply. (Question 45)
Factors Contributing to Fair Housing Issues
FAIR HOUSING ISSUES
Disparities in access to opportunity areas
Segregated housing patterns or concentrated areas of
poverty
Disparities in access to opportunity areas
Disparities in housing cost burdens and
overcrowding
Access to financial services 5 1 1 1Access to grocery stores and healthy food
options 3 4 7 2
Access to healthcare facilities and medical services 3 2 2 2
**Availability of larger affordable units 32 9 9 18Availability, frequency, and reliability of public
transit 20 5 8 6
CEQA and the land use entitlement process 14 4 6 6**Community opposition to development 24 10 9 15Creation and retention of high-quality jobs 8 0 5 7
Deteriorated/abandoned properties 2 2 0 3**Displacement due to increased rents 30 11 9 30
Displacement due to natural hazards 3 1 1 4**Displacement of low-income/POC residents 25 12 11 24
Foreclosure patterns 2 3 2 4Impacts of natural hazards 8 1 2 3
Lack of community revitalization strategies 2 3 2 3Lack of private investments in low-income/POC
communities 6 6 6 5
Lack of public investments in low-income/POC communities 4 3 4 2
Continued next page
* Factors highlighted in bold with asterisks (**) are among the five most commonly selected across fair housing issues.
APPENDIX 5
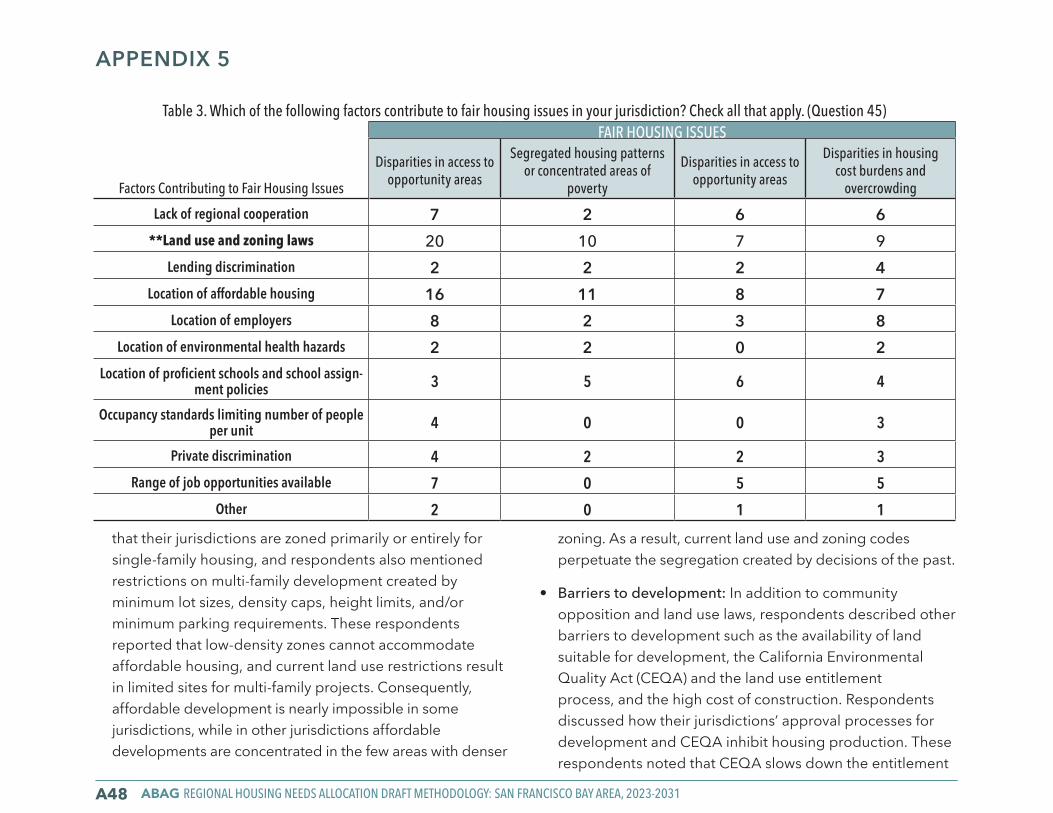
ABAG REGIONAL HOUSING NEEDS ALLOCATION DRAFT METHODOLOGY: SAN FRANCISCO BAY AREA, 2023-2031A48
that their jurisdictions are zoned primarily or entirely for single-family housing, and respondents also mentioned restrictions on multi-family development created by minimum lot sizes, density caps, height limits, and/or minimum parking requirements. These respondents reported that low-density zones cannot accommodate affordable housing, and current land use restrictions result in limited sites for multi-family projects. Consequently, affordable development is nearly impossible in some jurisdictions, while in other jurisdictions affordable developments are concentrated in the few areas with denser
zoning. As a result, current land use and zoning codes perpetuate the segregation created by decisions of the past.
• Barriers to development: In addition to community opposition and land use laws, respondents described other barriers to development such as the availability of land suitable for development, the California Environmental Quality Act (CEQA) and the land use entitlement process, and the high cost of construction. Respondents discussed how their jurisdictions’ approval processes for development and CEQA inhibit housing production. These respondents noted that CEQA slows down the entitlement
Table 3. Which of the following factors contribute to fair housing issues in your jurisdiction? Check all that apply. (Question 45)
Factors Contributing to Fair Housing Issues
FAIR HOUSING ISSUES
Disparities in access to opportunity areas
Segregated housing patterns or concentrated areas of
poverty
Disparities in access to opportunity areas
Disparities in housing cost burdens and
overcrowding
Lack of regional cooperation 7 2 6 6**Land use and zoning laws 20 10 7 9
Lending discrimination 2 2 2 4Location of affordable housing 16 11 8 7
Location of employers 8 2 3 8Location of environmental health hazards 2 2 0 2
Location of proficient schools and school assign-ment policies 3 5 6 4
Occupancy standards limiting number of people per unit 4 0 0 3
Private discrimination 4 2 2 3Range of job opportunities available 7 0 5 5
Other 2 0 1 1
APPENDIX 5
APPENDICES RHNA A49
APPENDIX 5
process and enables groups opposed to development to threaten litigation and create additional delays. The project costs created by CEQA and lengthy entitlement processes can make housing development financially infeasible, particularly for affordable projects. Survey responses indicated that these barriers to development inhibit access to these communities generally and especially for lower-income populations.
• Location of employers: Respondents discussed how limited job options within their jurisdictions and lack of access to job centers increase the costs of living there, as residents need to travel farther for work. Additionally, some mentioned that a lack of high-quality jobs within the jurisdiction prevents local jobholders from affording the high cost of housing.
• Public transit availability: Respondents suggested that a lack of public transit options inhibits those living in their jurisdiction from accessing jobs and services if they do not own a car, which makes the jurisdiction less accessible to a diverse range of households.
Topic 3: Fair Housing Goals and ActionsThe four questions within this topic area discussed the actions jurisdictions have taken to remove barriers to equal housing opportunity and prevent the displacement of low-income households. Respondents were also asked to reflect on their goals for fair housing policies and whether the strategies they have implemented achieve these goals. For more information on the strategies to further fair housing that Bay Area jurisdictions have detailed in their fair housing reports to HUD, see Section 3.
Key Takeaways from Respondents’ CommentsPolicies and initiatives to further fair housing: The survey results indicate that there are eight actions that a majority of respondents have taken to address existing segregation and enable equal housing choice (see Figure 13 on page A36). Most of these actions center on increasing the number of affordable housing units. For example, 69% of respondents have supported the development of affordable housing for special needs populations such as seniors, people with disabilities, people experiencing homelessness, and/or those with mental health issues. The survey responses also indicate that most respondents have sought to increase the supply of affordable housing through inclusionary zoning, land use changes, developing affordable housing near transit, encouraging the construction of larger affordable units, using publicly owned land for affordable development, and establishing local funding sources for affordable housing construction. Other common strategies to advance fair housing focus on low-income homeownership, with 53% of respondents funding home rehabilitation and improvements for low-income homeowners and 49% of respondents providing resources to support low-income homebuyers.
Goals for fair housing policies: Many of the jurisdictions’ survey responses noted that a goal of their fair housing policies is facilitating equal housing opportunities by removing barriers to affordable housing. Specifically, respondents discussed the following objectives for their fair housing policies related to increasing the affordable housing supply:
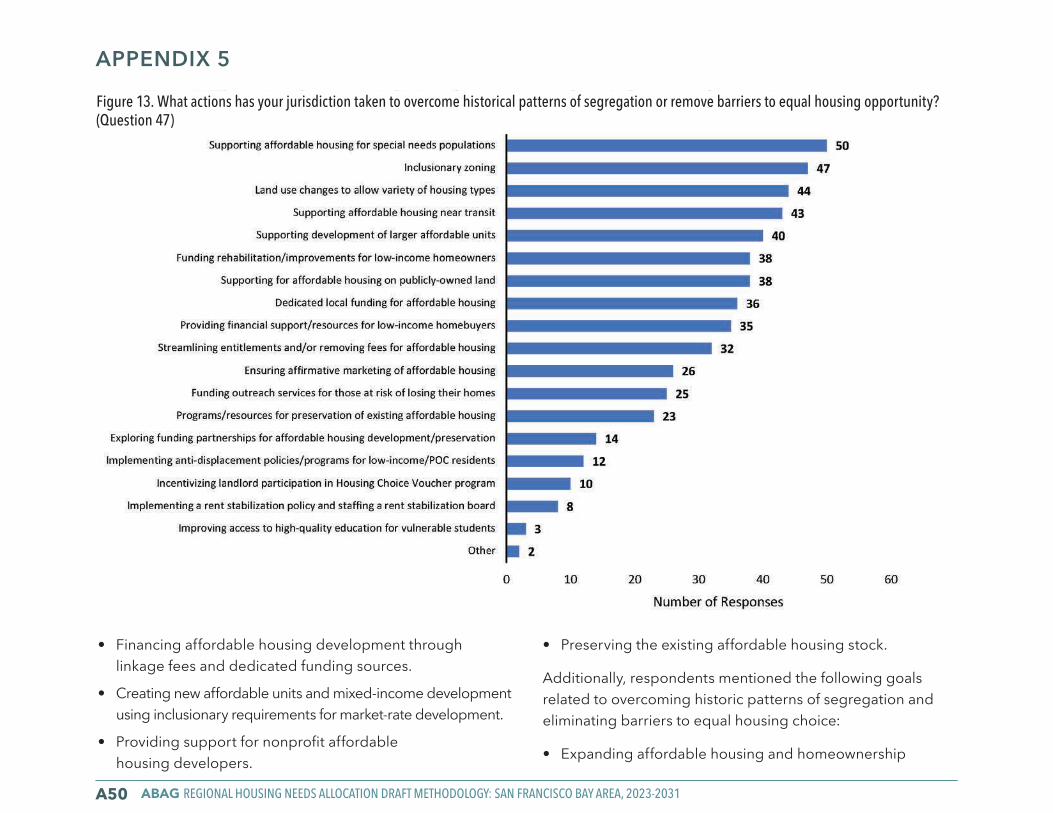
ABAG REGIONAL HOUSING NEEDS ALLOCATION DRAFT METHODOLOGY: SAN FRANCISCO BAY AREA, 2023-2031A50
Figure 13. What actions has your jurisdiction taken to overcome historical patterns of segregation or remove barriers to equal housing opportunity? (Question 47)
APPENDIX 5
• Financing affordable housing development through linkage fees and dedicated funding sources.
• Creating new affordable units and mixed-income development using inclusionary requirements for market-rate development.
• Providing support for nonprofit affordable housing developers.
• Preserving the existing affordable housing stock.
Additionally, respondents mentioned the following goals related to overcoming historic patterns of segregation and eliminating barriers to equal housing choice:
• Expanding affordable housing and homeownership
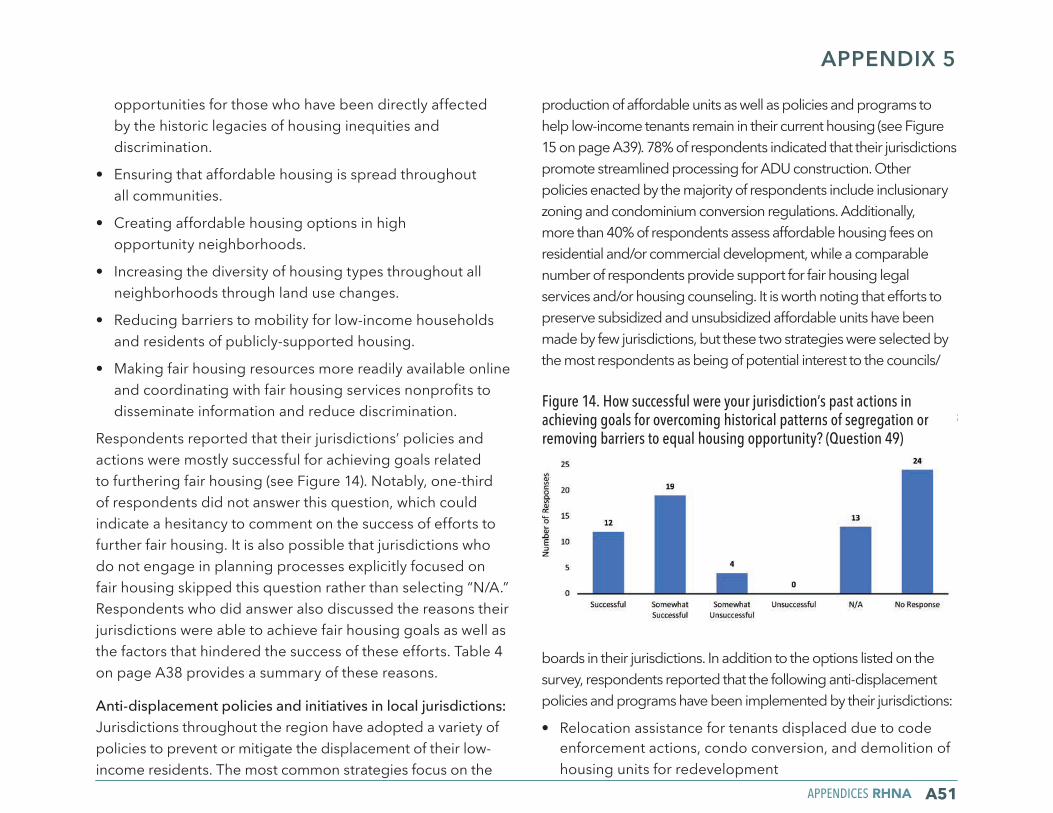
APPENDICES RHNA A51
APPENDIX 5
Figure 14. How successful were your jurisdiction’s past actions in achieving goals for overcoming historical patterns of segregation or removing barriers to equal housing opportunity? (Question 49)
opportunities for those who have been directly affected by the historic legacies of housing inequities and discrimination.
• Ensuring that affordable housing is spread throughout all communities.
• Creating affordable housing options in high opportunity neighborhoods.
• Increasing the diversity of housing types throughout all neighborhoods through land use changes.
• Reducing barriers to mobility for low-income households and residents of publicly-supported housing.
• Making fair housing resources more readily available online and coordinating with fair housing services nonprofits to disseminate information and reduce discrimination.
Respondents reported that their jurisdictions’ policies and actions were mostly successful for achieving goals related to furthering fair housing (see Figure 14). Notably, one-third of respondents did not answer this question, which could indicate a hesitancy to comment on the success of efforts to further fair housing. It is also possible that jurisdictions who do not engage in planning processes explicitly focused on fair housing skipped this question rather than selecting “N/A.” Respondents who did answer also discussed the reasons their jurisdictions were able to achieve fair housing goals as well as the factors that hindered the success of these efforts. Table 4 on page A38 provides a summary of these reasons.
Anti-displacement policies and initiatives in local jurisdictions: Jurisdictions throughout the region have adopted a variety of policies to prevent or mitigate the displacement of their low-income residents. The most common strategies focus on the
production of affordable units as well as policies and programs to help low-income tenants remain in their current housing (see Figure 15 on page A39). 78% of respondents indicated that their jurisdictions promote streamlined processing for ADU construction. Other policies enacted by the majority of respondents include inclusionary zoning and condominium conversion regulations. Additionally, more than 40% of respondents assess affordable housing fees on residential and/or commercial development, while a comparable number of respondents provide support for fair housing legal services and/or housing counseling. It is worth noting that efforts to preserve subsidized and unsubsidized affordable units have been made by few jurisdictions, but these two strategies were selected by the most respondents as being of potential interest to the councils/
boards in their jurisdictions. In addition to the options listed on the survey, respondents reported that the following anti-displacement policies and programs have been implemented by their jurisdictions:
• Relocation assistance for tenants displaced due to code enforcement actions, condo conversion, and demolition of housing units for redevelopment
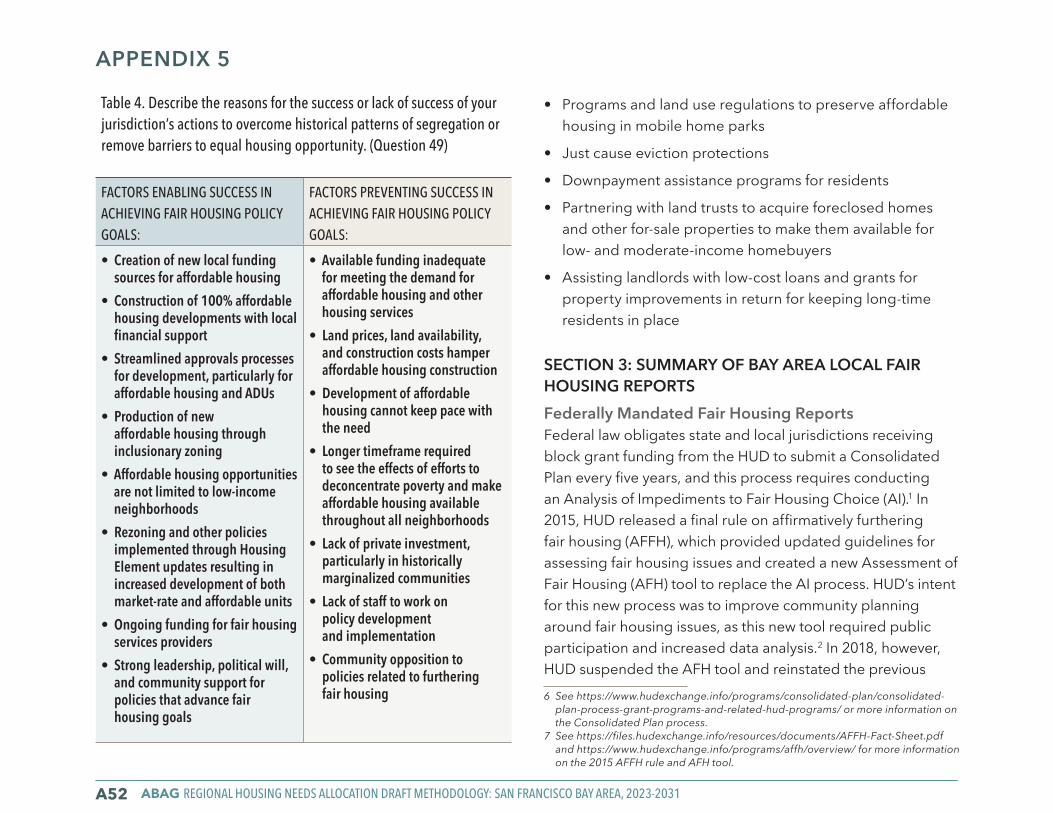
ABAG REGIONAL HOUSING NEEDS ALLOCATION DRAFT METHODOLOGY: SAN FRANCISCO BAY AREA, 2023-2031A52
Table 4. Describe the reasons for the success or lack of success of your jurisdiction’s actions to overcome historical patterns of segregation or remove barriers to equal housing opportunity. (Question 49)
FACTORS ENABLING SUCCESS IN ACHIEVING FAIR HOUSING POLICY GOALS:
FACTORS PREVENTING SUCCESS IN ACHIEVING FAIR HOUSING POLICY GOALS:
• Creation of new local funding sources for affordable housing
• Construction of 100% affordable housing developments with local financial support
• Streamlined approvals processes for development, particularly for affordable housing and ADUs
• Production of new affordable housing through inclusionary zoning
• Affordable housing opportunities are not limited to low-income neighborhoods
• Rezoning and other policies implemented through Housing Element updates resulting in increased development of both market-rate and affordable units
• Ongoing funding for fair housing services providers
• Strong leadership, political will, and community support for policies that advance fair housing goals
• Available funding inadequate for meeting the demand for affordable housing and other housing services
• Land prices, land availability, and construction costs hamper affordable housing construction
• Development of affordable housing cannot keep pace with the need
• Longer timeframe required to see the effects of efforts to deconcentrate poverty and make affordable housing available throughout all neighborhoods
• Lack of private investment, particularly in historically marginalized communities
• Lack of staff to work on policy development and implementation
• Community opposition to policies related to furthering fair housing
APPENDIX 5
• Programs and land use regulations to preserve affordable housing in mobile home parks
• Just cause eviction protections
• Downpayment assistance programs for residents
• Partnering with land trusts to acquire foreclosed homes and other for-sale properties to make them available for low- and moderate-income homebuyers
• Assisting landlords with low-cost loans and grants for property improvements in return for keeping long-time residents in place
SECTION 3: SUMMARY OF BAY AREA LOCAL FAIR HOUSING REPORTSFederally Mandated Fair Housing ReportsFederal law obligates state and local jurisdictions receiving block grant funding from the HUD to submit a Consolidated Plan every five years, and this process requires conducting an Analysis of Impediments to Fair Housing Choice (AI).1 In 2015, HUD released a final rule on affirmatively furthering fair housing (AFFH), which provided updated guidelines for assessing fair housing issues and created a new Assessment of Fair Housing (AFH) tool to replace the AI process. HUD’s intent for this new process was to improve community planning around fair housing issues, as this new tool required public participation and increased data analysis.2 In 2018, however, HUD suspended the AFH tool and reinstated the previous 6 See https://www.hudexchange.info/programs/consolidated-plan/consolidated-
plan-process-grant-programs-and-related-hud-programs/ or more information on the Consolidated Plan process.
7 See https://files.hudexchange.info/resources/documents/AFFH-Fact-Sheet.pdf and https://www.hudexchange.info/programs/affh/overview/ for more information on the 2015 AFFH rule and AFH tool.
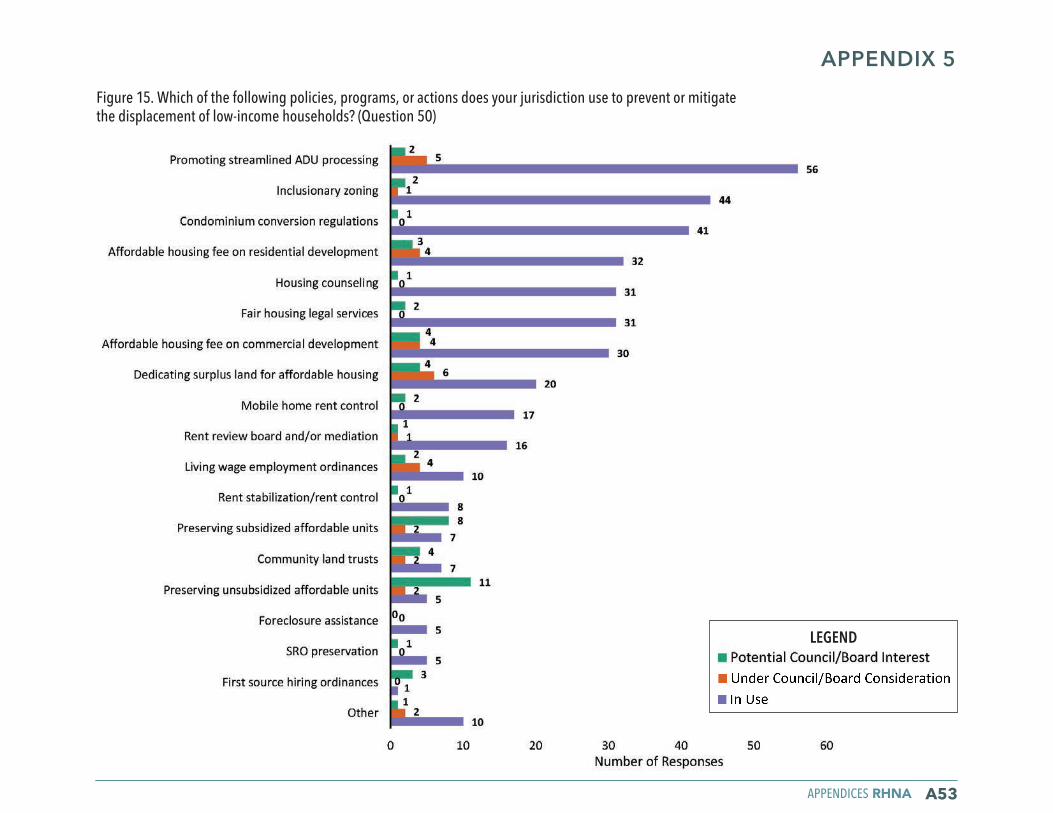
APPENDICES RHNA A53
LEGEND
Figure 15. Which of the following policies, programs, or actions does your jurisdiction use to prevent or mitigate the displacement of low-income households? (Question 50)
APPENDIX 5
ABAG REGIONAL HOUSING NEEDS ALLOCATION DRAFT METHODOLOGY: SAN FRANCISCO BAY AREA, 2023-2031A54
APPENDIX 5
requirement to complete an AI report.3 In response to HUD’s decision, the California legislature passed Assembly Bill 686 in 2018, which states that AFFH obligations must be interpreted in a manner consistent with HUD’s 2015 AFFH rule, regardless of subsequent amendments to or suspensions of the rule.4 As a result, some reports submitted by Bay Area jurisdictions for the 2020-2025 cycle are labeled AFH reports, while others are AI reports, but the content and format of reports submitted since the passage of Assembly Bill 686 are likely to be similar, regardless of whether the report is labeled an AI or AFH.
Bay Area ReportsCurrently, 41 Bay Area cities and counties participate in the Consolidated Plan process and have submitted AI or AFH reports to HUD. Because these reports are submitted as part of five-year planning cycles, most of these jurisdictions recently submitted a report for the years 2020-2025 or are currently working on a report for this cycle, though reporting in some jurisdictions occurs on a different timeline. While some reports are submitted to HUD by individual jurisdictions, this reporting can also be completed as a collaborative effort between a county government and local jurisdictions within the county.
Below is a summary of the 16 AI and AFH reports, which are the most recently submitted fair housing documents from Bay Area jurisdictions available to the public. These reports cover the following jurisdictions:
8 See https://files.hudexchange.info/resources/documents/FR-Notice-AFFH-AI-Notice.pdf for the 2018 HUD notice.9 See https://leginfo.legislature.ca.gov/faces/billTextClient.xhtml?bill_id=201720180AB686 for text of Assembly Bill 686.10 See https://www.hudexchange.info/programs/consolidated-plan/consolidated-plan-process-grant-programs-and-related-hud-programs/ or more information on the
Consolidated Plan process.11 See https://files.hudexchange.info/resources/documents/AFFH-Fact-Sheet.pdf and https://www.hudexchange.info/programs/affh/overview/ for more information on the
2015 AFFH rule and AFH tool.
• Programs and land use regulations to preserve affordable housing in mobile home parks
• Just cause eviction protections
• Downpayment assistance programs for residents
• Partnering with land trusts to acquire foreclosed homes and other for-sale properties to make them available for low- and moderate-income homebuyers
• Assisting landlords with low-cost loans and grants for property improvements in return for keeping long-time residents in place
SECTION 3: SUMMARY OF BAY AREA LOCAL FAIR HOUSING REPORTSFederally Mandated Fair Housing ReportsFederal law obligates state and local jurisdictions receiving block grant funding from the HUD to submit a Consolidated Plan every five years, and this process requires conducting an Analysis of Impediments to Fair Housing Choice (AI).5 In 2015, HUD released a final rule on affirmatively furthering fair housing (AFFH), which provided updated guidelines for assessing fair housing issues and created a new Assessment of Fair Housing (AFH) tool to replace the AI process. HUD’s intent for this new process was to improve community planning around fair housing issues, as this new tool required public participation and increased data analysis.6 In 2018, however,
APPENDICES RHNA A55
APPENDIX 5
HUD suspended the AFH tool and reinstated the previous requirement to complete an AI report.7 In response to HUD’s decision, the California legislature passed Assembly Bill 686 in 2018, which states that AFFH obligations must be interpreted in a manner consistent with HUD’s 2015 AFFH rule, regardless of subsequent amendments to or suspensions of the rule.8 As a result, some reports submitted by Bay Area jurisdictions for the 2020-2025 cycle are labeled AFH reports, while others are AI reports, but the content and format of reports submitted since the passage of Assembly Bill 686 are likely to be similar, regardless of whether the report is labeled an AI or AFH.
Bay Area ReportsCurrently, 41 Bay Area cities and counties participate in the Consolidated Plan process and have submitted AI or AFH reports to HUD. Because these reports are submitted as part of five-year planning cycles, most of these jurisdictions recently submitted a report for the years 2020-2025 or are currently working on a report for this cycle, though reporting in some jurisdictions occurs on a different timeline. While some reports are submitted to HUD by individual jurisdictions, this reporting can also be completed as a collaborative effort between a county government and local jurisdictions within the county.
Below is a summary of the 16 AI and AFH reports, which are the most recently submitted fair housing documents from Bay Area jurisdictions available to the public. These reports cover the following jurisdictions:
12 See https://files.hudexchange.info/resources/documents/FR-Notice-AFFH-AI-Notice.pdf for the 2018 HUD notice.13 See https://leginfo.legislature.ca.gov/faces/billTextClient.xhtml?bill_id=201720180AB686 for text of Assembly Bill 686.
• Alameda County collaborative report: the cities of Alameda, Albany, Berkeley, Dublin, Emeryville, Fremont, Hayward, Livermore, Newark, Oakland, Piedmont, Pleasanton, San Leandro, and Union City as well as Alameda County
• Contra Costa County collaborative report: the cities of Antioch, Concord, Pittsburg, and Walnut Creek as well as Contra Costa County
• Marin County
• City and County of San Francisco
• San Mateo County collaborative report: the cities of Daly City, San Mateo, South San Francisco, Redwood City, as well as San Mateo County
• Santa Clara County
• Sonoma County collaborative report: cities of Santa Rosa and Petaluma as well as Sonoma County
• City of Cupertino
• City of Fairfield
• City of Milpitas
• City of Mountain View
• City of Napa
• City of San Jose
• City of Sunnyvale
• City of Vacaville
• City of Vallejo
ABAG REGIONAL HOUSING NEEDS ALLOCATION DRAFT METHODOLOGY: SAN FRANCISCO BAY AREA, 2023-2031A56
APPENDIX 5
Reported Fair Housing Impediments, Strategies, and ActionsThis summary focuses on common impediments to fair housing experienced by Bay Area jurisdictions, and it also lists specific strategies proposed and actions taken in response to these obstacles. While each AI or AFH report contains extensive city/county demographic information, housing equity history, and details on how the report was produced, including community engagement efforts, this summary does not focus on the individual circumstances of each jurisdiction. Rather, it collates these jurisdictions’ most significant barriers to affirmatively furthering fair housing, as self-reported, and lists the strategies they have taken to overcome them, in an attempt to draw out common themes at the regional level.
The top themes to emerge at the regional level are:
1. There is a severe lack of affordable housing amidst already-high housing costs regionwide.
2. The lack of affordable housing leads to displacement and gentrification, impacting access to employment, transportation, and education for low-income people.
3. Communities often oppose new housing construction, especially when it is dense, affordable housing. While framed as an issue of “local control,” in some circumstances this opposition to housing may be rooted in implicit discrimination based on race and class/income.
4. Jurisdictional zoning and approval policies and practices reflect this community opposition and contribute to the lack of affordable housing supply.
5. Lack of investment in specific neighborhoods is the result of longstanding explicit housing segregation, leading to racially-concentrated areas of poverty that persist today.
6. Outreach, education, and enforcement of fair housing activities are contracted out to nonprofits with insufficient resources.
7. There are significant accessibility barriers to housing for disabled, non-English-speaking, formerly incarcerated, formerly homeless, and other specific populations.
8. Discrimination in the private housing market is prevalent, both in the rental market and in lending policies and practices that impede home ownership.
9. There is much room for improvement in coordination and cooperation regionwide, both between jurisdictions and among different housing advocacy groups.
Below are more details on these highly interrelated obstacles to fair housing in the Bay Area, as well as actions and strategies that may offer solutions. Nearly all of the reports considered each of the following nine impediments, but they were inconsistent in clarifying whether the strategies noted have actually been implemented or are simply being considered. This high-level summary includes all strategies that local fair housing reports listed as potential solutions to these nine impediments. However, ABAG staff could not determine from these reports how many jurisdictions had implemented each strategy versus how many were considering the strategy but had not yet adopted it. The following list orders both the impediments and the strategies by approximate frequency and importance to the collective
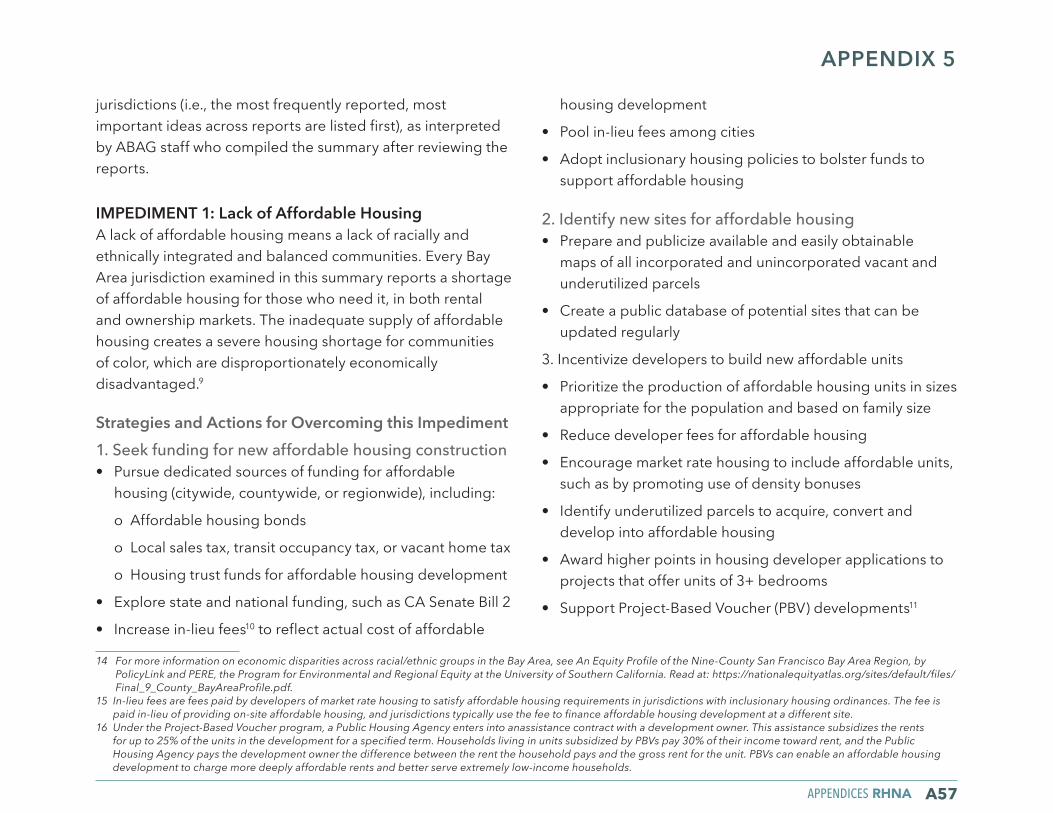
APPENDICES RHNA A57
APPENDIX 5
jurisdictions (i.e., the most frequently reported, most important ideas across reports are listed first), as interpreted by ABAG staff who compiled the summary after reviewing the reports.
IMPEDIMENT 1: Lack of Affordable HousingA lack of affordable housing means a lack of racially and ethnically integrated and balanced communities. Every Bay Area jurisdiction examined in this summary reports a shortage of affordable housing for those who need it, in both rental and ownership markets. The inadequate supply of affordable housing creates a severe housing shortage for communities of color, which are disproportionately economically disadvantaged.9
Strategies and Actions for Overcoming this Impediment1. Seek funding for new affordable housing construction• Pursue dedicated sources of funding for affordable
housing (citywide, countywide, or regionwide), including:
o Affordable housing bonds
o Local sales tax, transit occupancy tax, or vacant home tax
o Housing trust funds for affordable housing development
• Explore state and national funding, such as CA Senate Bill 2
• Increase in-lieu fees10 to reflect actual cost of affordable
14 For more information on economic disparities across racial/ethnic groups in the Bay Area, see An Equity Profile of the Nine-County San Francisco Bay Area Region, by PolicyLink and PERE, the Program for Environmental and Regional Equity at the University of Southern California. Read at: https://nationalequityatlas.org/sites/default/files/Final_9_County_BayAreaProfile.pdf.
15 In-lieu fees are fees paid by developers of market rate housing to satisfy affordable housing requirements in jurisdictions with inclusionary housing ordinances. The fee is paid in-lieu of providing on-site affordable housing, and jurisdictions typically use the fee to finance affordable housing development at a different site.
16 Under the Project-Based Voucher program, a Public Housing Agency enters into anassistance contract with a development owner. This assistance subsidizes the rents for up to 25% of the units in the development for a specified term. Households living in units subsidized by PBVs pay 30% of their income toward rent, and the Public Housing Agency pays the development owner the difference between the rent the household pays and the gross rent for the unit. PBVs can enable an affordable housing development to charge more deeply affordable rents and better serve extremely low-income households.
housing development
• Pool in-lieu fees among cities
• Adopt inclusionary housing policies to bolster funds to support affordable housing
2. Identify new sites for affordable housing• Prepare and publicize available and easily obtainable
maps of all incorporated and unincorporated vacant and underutilized parcels
• Create a public database of potential sites that can be updated regularly
3. Incentivize developers to build new affordable units
• Prioritize the production of affordable housing units in sizes appropriate for the population and based on family size
• Reduce developer fees for affordable housing
• Encourage market rate housing to include affordable units, such as by promoting use of density bonuses
• Identify underutilized parcels to acquire, convert and develop into affordable housing
• Award higher points in housing developer applications to projects that offer units of 3+ bedrooms
• Support Project-Based Voucher (PBV) developments11
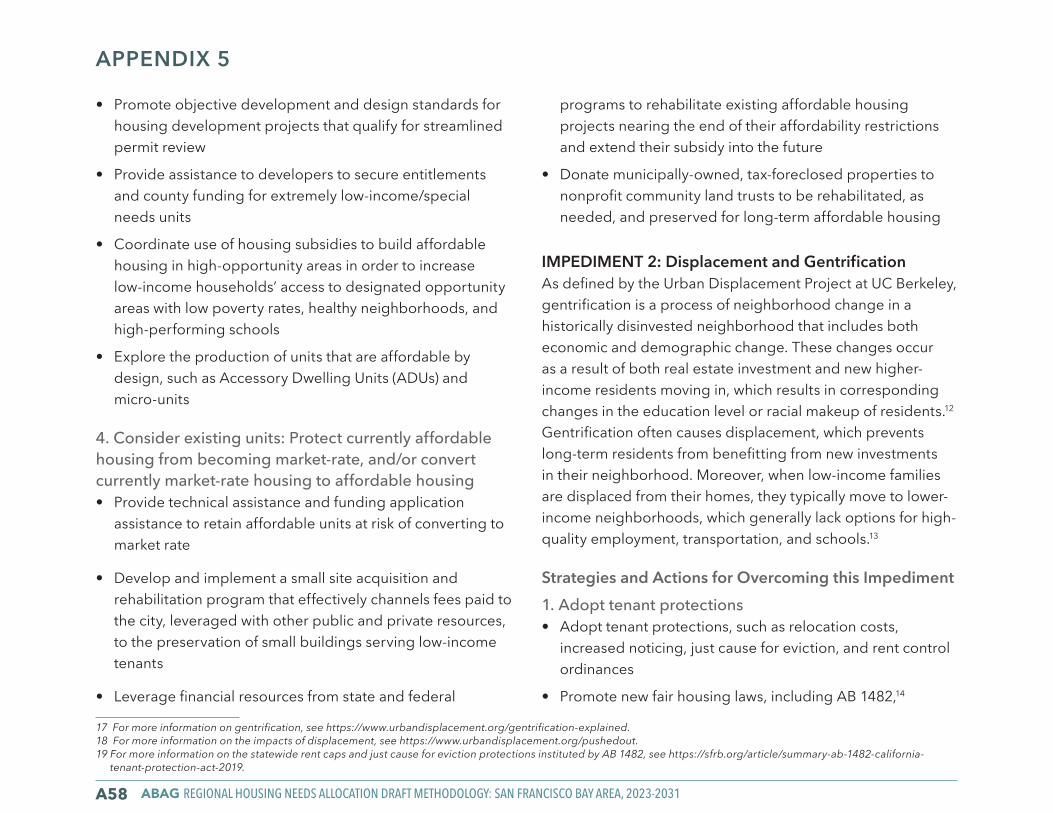
ABAG REGIONAL HOUSING NEEDS ALLOCATION DRAFT METHODOLOGY: SAN FRANCISCO BAY AREA, 2023-2031A58
APPENDIX 5
• Promote objective development and design standards for housing development projects that qualify for streamlined permit review
• Provide assistance to developers to secure entitlements and county funding for extremely low-income/special needs units
• Coordinate use of housing subsidies to build affordable housing in high-opportunity areas in order to increase low-income households’ access to designated opportunity areas with low poverty rates, healthy neighborhoods, and high-performing schools
• Explore the production of units that are affordable by design, such as Accessory Dwelling Units (ADUs) and micro-units
4. Consider existing units: Protect currently affordable housing from becoming market-rate, and/or convert currently market-rate housing to affordable housing• Provide technical assistance and funding application
assistance to retain affordable units at risk of converting to market rate
• Develop and implement a small site acquisition and rehabilitation program that effectively channels fees paid to the city, leveraged with other public and private resources, to the preservation of small buildings serving low-income tenants
• Leverage financial resources from state and federal
17 For more information on gentrification, see https://www.urbandisplacement.org/gentrification-explained.18 For more information on the impacts of displacement, see https://www.urbandisplacement.org/pushedout.19 For more information on the statewide rent caps and just cause for eviction protections instituted by AB 1482, see https://sfrb.org/article/summary-ab-1482-california-
tenant-protection-act-2019.
programs to rehabilitate existing affordable housing projects nearing the end of their affordability restrictions and extend their subsidy into the future
• Donate municipally-owned, tax-foreclosed properties to nonprofit community land trusts to be rehabilitated, as needed, and preserved for long-term affordable housing
IMPEDIMENT 2: Displacement and GentrificationAs defined by the Urban Displacement Project at UC Berkeley, gentrification is a process of neighborhood change in a historically disinvested neighborhood that includes both economic and demographic change. These changes occur as a result of both real estate investment and new higher-income residents moving in, which results in corresponding changes in the education level or racial makeup of residents.12 Gentrification often causes displacement, which prevents long-term residents from benefitting from new investments in their neighborhood. Moreover, when low-income families are displaced from their homes, they typically move to lower-income neighborhoods, which generally lack options for high-quality employment, transportation, and schools.13
Strategies and Actions for Overcoming this Impediment1. Adopt tenant protections• Adopt tenant protections, such as relocation costs,
increased noticing, just cause for eviction, and rent control ordinances
• Promote new fair housing laws, including AB 1482,14
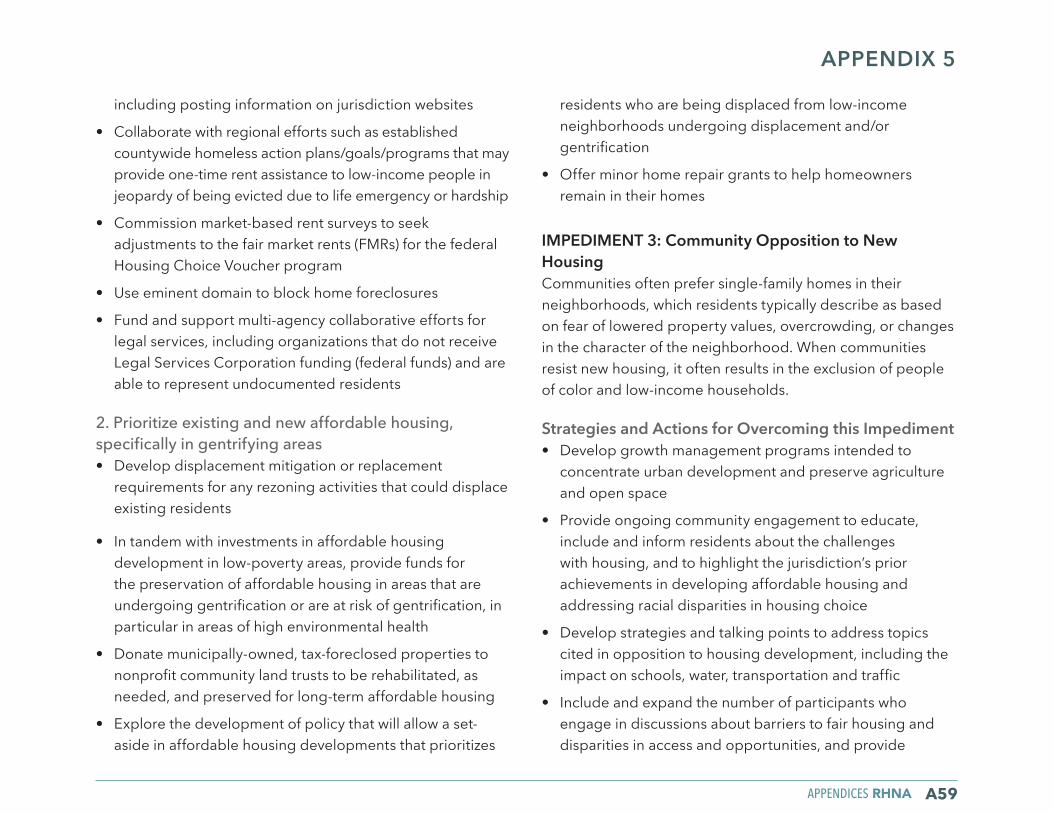
APPENDICES RHNA A59
APPENDIX 5
including posting information on jurisdiction websites
• Collaborate with regional efforts such as established countywide homeless action plans/goals/programs that may provide one-time rent assistance to low-income people in jeopardy of being evicted due to life emergency or hardship
• Commission market-based rent surveys to seek adjustments to the fair market rents (FMRs) for the federal Housing Choice Voucher program
• Use eminent domain to block home foreclosures
• Fund and support multi-agency collaborative efforts for legal services, including organizations that do not receive Legal Services Corporation funding (federal funds) and are able to represent undocumented residents
2. Prioritize existing and new affordable housing, specifically in gentrifying areas• Develop displacement mitigation or replacement
requirements for any rezoning activities that could displace existing residents
• In tandem with investments in affordable housing development in low-poverty areas, provide funds for the preservation of affordable housing in areas that are undergoing gentrification or are at risk of gentrification, in particular in areas of high environmental health
• Donate municipally-owned, tax-foreclosed properties to nonprofit community land trusts to be rehabilitated, as needed, and preserved for long-term affordable housing
• Explore the development of policy that will allow a set-aside in affordable housing developments that prioritizes
residents who are being displaced from low-income neighborhoods undergoing displacement and/or gentrification
• Offer minor home repair grants to help homeowners remain in their homes
IMPEDIMENT 3: Community Opposition to New HousingCommunities often prefer single-family homes in their neighborhoods, which residents typically describe as based on fear of lowered property values, overcrowding, or changes in the character of the neighborhood. When communities resist new housing, it often results in the exclusion of people of color and low-income households.
Strategies and Actions for Overcoming this Impediment• Develop growth management programs intended to
concentrate urban development and preserve agriculture and open space
• Provide ongoing community engagement to educate, include and inform residents about the challenges with housing, and to highlight the jurisdiction’s prior achievements in developing affordable housing and addressing racial disparities in housing choice
• Develop strategies and talking points to address topics cited in opposition to housing development, including the impact on schools, water, transportation and traffic
• Include and expand the number of participants who engage in discussions about barriers to fair housing and disparities in access and opportunities, and provide
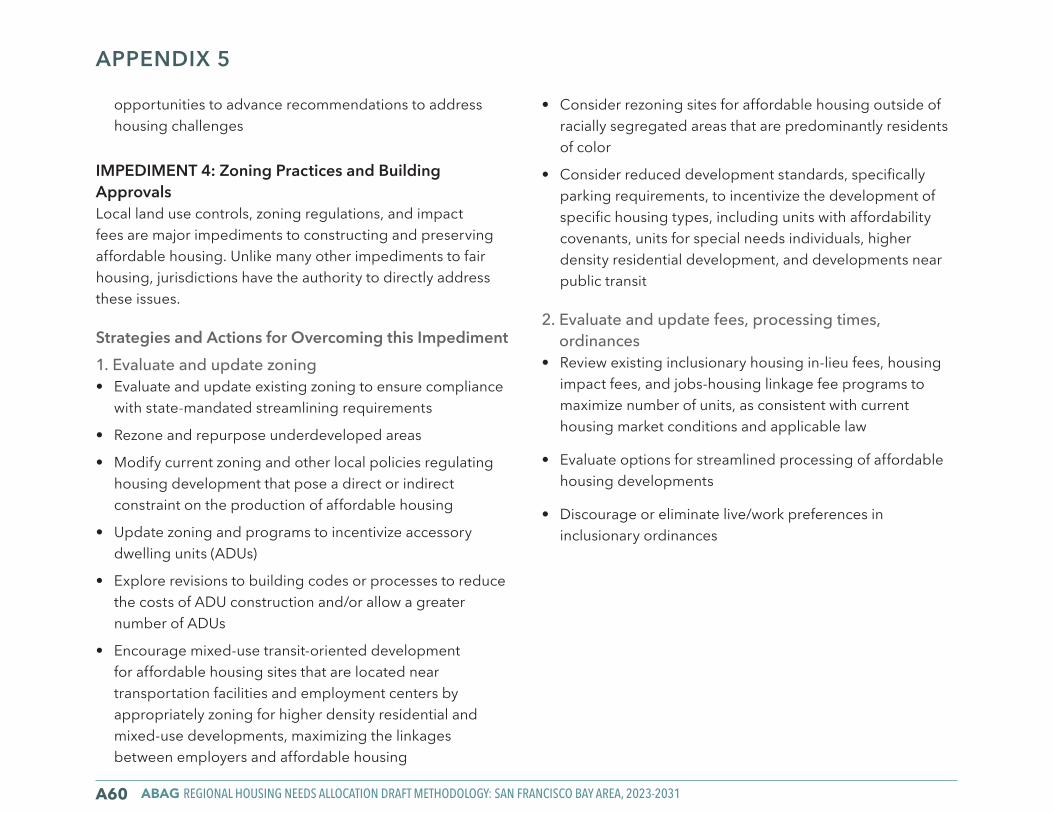
ABAG REGIONAL HOUSING NEEDS ALLOCATION DRAFT METHODOLOGY: SAN FRANCISCO BAY AREA, 2023-2031A60
APPENDIX 5
opportunities to advance recommendations to address housing challenges
IMPEDIMENT 4: Zoning Practices and Building ApprovalsLocal land use controls, zoning regulations, and impact fees are major impediments to constructing and preserving affordable housing. Unlike many other impediments to fair housing, jurisdictions have the authority to directly address these issues.
Strategies and Actions for Overcoming this Impediment1. Evaluate and update zoning• Evaluate and update existing zoning to ensure compliance
with state-mandated streamlining requirements
• Rezone and repurpose underdeveloped areas
• Modify current zoning and other local policies regulating housing development that pose a direct or indirect constraint on the production of affordable housing
• Update zoning and programs to incentivize accessory dwelling units (ADUs)
• Explore revisions to building codes or processes to reduce the costs of ADU construction and/or allow a greater number of ADUs
• Encourage mixed-use transit-oriented development for affordable housing sites that are located near transportation facilities and employment centers by appropriately zoning for higher density residential and mixed-use developments, maximizing the linkages between employers and affordable housing
• Consider rezoning sites for affordable housing outside of racially segregated areas that are predominantly residents of color
• Consider reduced development standards, specifically parking requirements, to incentivize the development of specific housing types, including units with affordability covenants, units for special needs individuals, higher density residential development, and developments near public transit
2. Evaluate and update fees, processing times, ordinances
• Review existing inclusionary housing in-lieu fees, housing impact fees, and jobs-housing linkage fee programs to maximize number of units, as consistent with current housing market conditions and applicable law
• Evaluate options for streamlined processing of affordable housing developments
• Discourage or eliminate live/work preferences in inclusionary ordinances
APPENDICES RHNA A61
APPENDIX 5
IMPEDIMENT 5: Segregation, Lack of Investment in Specific Areas, Racially/Ethnically Concentrated Areas of Poverty (R/ECAPs)Public and private disinvestment in certain areas has resulted in racially/ethnically concentrated areas of poverty (R/ECAPs). In these neighborhoods, lack of tax revenue and funds for services has led to deteriorated and abandoned properties and areas where communities of color cannot access amenities needed for a healthy life.
Strategies and Actions for Overcoming this Impediment1. Target economic investment opportunities in R/ECAPS while protecting against displacement• Fund home-based childcare projects and microenterprise
projects with Community Development Block Grant (CDBG) funds
• Provide Family Self-Sufficiency program participants with job training referrals and career networking15
• Explore financially supporting economic development activities and initiatives in and around R/ECAPs
• Prioritize economic development expenditures in and around R/ECAPs
• Prioritize funding for job training programs in and around R/ECAPs, including industrial jobs
• Prioritize infrastructure and streetscaping improvements in R/ECAPs in order to facilitate local retail development
• Engage with small business incubators to expand to R/ECAPs or to provide technical assistance to start-up
20 Family Self-Sufficiency is a program that enables HUD-assisted families to increase their earned income and reduce their need for welfare assistance and rental subsidies.
incubators
• Explore methods for providing low-interest loans and below-market leases for tax-foreclosed commercial properties to low-income residents seeking to start businesses within R/ECAPs
2. Improve access to home renting and buying for residents in R/ECAPS• Work with communities to develop a community land
trust for low-income residents that creates opportunities for affordable housing and home ownership, with specific inclusion for residents of color with historic connections to the area
• Build affordable housing projects in middle- and upper-income neighborhoods to the maximum degree possible
• Create more standardized screening policies and procedures for city-sponsored affordable housing
• First-time homebuyer down payment assistance programs
IMPEDIMENT 6: Outreach, Education, EnforcementNearly all jurisdictions report contracting with nonprofit organizations (partly funded by city and county grants) to provide local fair housing services and education, including counseling, language services, and handling of fair housing complaints. Despite these efforts, the region lacks sufficient housing search assistance, voucher payment standards, landlord outreach, mobility counseling, and education about fair housing rights. Inadequate funding and organizational capacity of the nonprofits providing services plays a role.
ABAG REGIONAL HOUSING NEEDS ALLOCATION DRAFT METHODOLOGY: SAN FRANCISCO BAY AREA, 2023-2031A62
APPENDIX 5
Strategies and Actions for Overcoming this Impediment1. Better fund all fair housing services • Allocate more federal, state, and local funding for nonprofit
organizations providing fair housing services
• Fund and support multi-agency collaborative efforts for legal services, including organizations that do not receive Legal Services Corporation funding (federal funds) and are able to represent undocumented residents
2. Promote better fair housing outreach and education services• Continue to contract with fair housing service providers
to educate home seekers, landlords, property managers, real estate agents, and lenders regarding fair housing law and recommended practices, including the importance of reasonable accommodation under the Americans with Disabilities Act; to mediate conflicts between home seekers, landlords, property managers, real estate agents, and lenders; and to continue fair housing testing and audits
• Implement annual training programs for property managers and residents
• Seek ways to increase resident access to fair housing services, such as improved marketing of services, improved landlord education, and improved tenant screening services to avoid owner bias
• Educate tenants and landlords on new fair housing laws
• Provide financial literacy and homebuyer education classes
• Continue to fund housing placement services for people with disabilities to assist them in finding accessible housing
• Develop and distribute informational brochure on inclusionary leasing practices, including with licenses where applicable
• Continue and increase outreach and education activities for all protected classes
• Include education on new requirements of Assembly Bill 2413 (Chiu), the Right to a Safe Home Act, in outreach activities to both landlords and the public19
• Explore alternative formats for fair housing education workshops such as pre-taped videos and/or recordings, which could serve persons with more than one job, families with young children and others who find it difficult to attend meetings in person
3. Better advertise affordable housing opportunities• Create a database of all restricted housing units citywide/
countywide/regionwide that could be posted online to provide user-friendly information about the location and application process for each development
• Advertise the availability of subsidized rental units via the jurisdictions’ websites and or apps, the 2-1-1 information and referral phone service, and other media outlets
APPENDICES RHNA A63
APPENDIX 5
IMPEDIMENT 7: Accessibility for Specific PopulationsMany jurisdictions report a lack of accessible housing for persons with disabilities, non-English-speaking people, formerly incarcerated people, formerly homeless people, seniors, and other specific populations—all direct fair housing issues.
Strategies and Actions for Overcoming this Impediment• Fund housing placement services for people with
disabilities to assist them in finding accessible housing
• Offer landlord incentives, such as leasing bonuses, for specific populations
• Conduct a research effort in collaboration with an academic institution to better understand the landlord population and create more evidence-based policy initiatives
• Increase marketing efforts of affordable housing units to people that typically face barriers and discrimination in fair housing choice, such as persons with disabilities, people of color, low-income families, seniors, new immigrants, and people experiencing homelessness
• To the extent practicable, use affordable housing funds for the construction of permanent supportive housing in developments in which 10-25% of units are set aside for persons with disabilities. Affirmatively market units to individuals with intellectual and developmental disabilities, their
families, and service providers
• Explore methods for nonprofit partners to assist in purchasing or master leasing affordable units within inclusionary market-rate developments, and set a portion of those units aside for persons with disabilities
• Develop and disseminate a best practices guide to credit screening in the rental housing context in order to discourage the use of strict credit score cut-offs and overreliance on eviction records
• For publicly-supported housing, develop protocols to ensure responsiveness to reasonable accommodation requests
IMPEDIMENT 8: Discrimination in Home Ownership and Rental MarketsOver time explicit, legal discrimination has given way to implicit, unwritten biases in mortgage access and lending policies and practices for people of color—specifically in high rates of denial of mortgages for African American and Hispanic households. In the rental housing market, discrimination against low-income people, minorities, immigrants, and LGBTQ people is also prevalent. People using Housing Choice Vouchers also face discrimination for their source of income.
Strategies and Actions for Overcoming this Impediment• Work with communities to develop a community
land trust for low-income residents that creates opportunities for affordable housing and home
ABAG REGIONAL HOUSING NEEDS ALLOCATION DRAFT METHODOLOGY: SAN FRANCISCO BAY AREA, 2023-2031A64
APPENDIX 5
ownership, with specific inclusion for residents of color with historic connections to the area
• Explore creating incentives for landlords to rent to Housing Choice Voucher holders, such as a leasing bonus, damage claim reimbursement, security deposit and utility assistance
• Streamline Housing Choice Voucher administration so participation is easy for landlords
• Increase outreach to LGBTQ and immigrant stakeholder groups to provide “know your rights” materials regarding housing discrimination
• Emphasize bilingual fair housing services and activities to ensure all members know their housing rights and the benefits
• Proactively enforce source of income discrimination laws16
• Contract with local service providers to conduct fair housing testing in local apartment complexes
• Modify and standardize screening criteria to ensure access to housing for otherwise qualified applicants with credit challenges or criminal histories
• Educate landlords on criminal background screening in rental housing (using HUD fair housing guidance) and explore the feasibility of adopting ordinances
21 Senate Bill 329, enacted in 2019, prohibits landlords from disriminating against tenants who use Housing Choice Vouchers or other government assistance to pay their rent.
IMPEDIMENT 9: Coordination and CooperationThere is fragmentation among jurisdictions and among fair housing advocacy groups. More regional cooperation is needed to address disproportionate housing needs and the jobs-housing balance across the region.
Strategies and Actions for Overcoming this Impediment• Expand ongoing interagency connections to support
weatherization, energy efficiency, and climate adaptation for low-income residents
• Create a shared list of lenders countywide/regionwide that can help buyers access below-market-rate loans and sponsor down payment and mortgage assistance programs
• Collaborate on cross-jurisdictional informational databases or other resources for all aspects of housing
• Consider a sub-regional approach to share resources and possibly units to increase collaboration and production
© Karl Nielsen. All Rights Reserved.
Images compiled by NPH Northern CaliforniaCover Half Moon Village in Half Moon Bay Bruce Damonte courtesy MidPen Housing
Page 6 Merritt Crossing Senior Apartments in Oakland Tim Griffith courtesy SAHA
Page 8 Fell Street Apartments in San Francisco Clark Mishler courtesy BRIDGE Housing
Page 12 Station Center in Union City Bruce Damonte courtesy MidPen Housing
Page 17 Richardson Apartments in San Francisco Bruce Damonte courtesy CHP
Page 19 Armstrong Place Senior Housing in San FranciscoJulio Cesar courtesy BRIDGE Housing
Page 54 The Savoy in Oakland courtesy SAHA
Page 57 Richardson Apartments in San Francisco Bruce Damonte courtesy CHP
BAY AREA METRO CENTER375 Beale Street, Suite 700San Francisco, CA 94105
415.820.7900 [email protected] E-MAILwww.abag.ca.gov WEB
© Karl Nielsen. All Rights Reserved.