Regional Economic Outlook - IMF -- International … Economic and Financial Surveys Regional...
66
World Economic and Financial Surveys Regional Economic Outlook Western Hemisphere Time to Rebuild Policy Space I N T E R N A T I O N A L M O N E T A R Y F U N D MAY 13
Transcript of Regional Economic Outlook - IMF -- International … Economic and Financial Surveys Regional...

World Economic and Financia l Surveys
Reg iona l Economic Out look
Western Hemisphere Time to Rebuild Policy Space
I N T E R N A T I O N A L M O N E T A R Y F U N D
M
AY
13

©2013 International Monetary Fund
Cataloging-in-Publication Data
Regional economic outlook. Western Hemisphere. – Washington, D.C. : International Monetary Fund, 2006– v. ; cm. — (World economic and financial surveys, 0258-7440)
Once a year. Began in 2006. Some issues have thematic titles.
1. Economic forecasting – North America – Periodicals. 2. Economic forecasting – Latin America – Periodicals. 3. Economic forecasting – Caribbean Area – Periodicals. 4. North America – Economic conditions – Periodicals. 5. Latin America – Economic conditions – 1982- –Periodicals. 6. Caribbean Area – Economic conditions – Periodicals. 7. Economic development –North America – Periodicals. 8. Economic development – Latin America. 9. Economic development – Caribbean Area. I. Title: Western Hemisphere. II. International Monetary Fund. III. Series: World economic and financial surveys.
HC94.A1 R445 ISBN: 978-1-48434-792-8
Publication orders may be placed online, by fax, or through the mail:
International Monetary Fund Publication Services PO Box 92780, Washington, D.C. 20090, U.S.A.
Tel.: (202) 623-7430 Fax: (202) 623-7201 E-mail: [email protected]
www.imf.org www.elibrary.imf.org

iii
Contents
Preface v
Executive Summary vii
1. The United States, Canada, and the World: Outlook and Policy Challenges 1
Global Backdrop: Receding Risks, Three-Speed Recovery 1 The United States: Modest Growth, Bright Spots Appearing 3 Canada: Moderating Growth Amid Currency Strength 6
2. Outlook and Policy Challenges for Latin America and the Caribbean 11
Overview 11 Policy Challenges 13 Financially Integrated Economies 13 Other Commodity Exporters 18 Central America, Panama, and the Dominican Republic 19 The Caribbean 20
3. Is the Growth Momentum in Latin America Sustainable? 31
What Factors Drove the Recent Strong Growth Performance? 32 Is the Recent Strong Performance Sustainable? 34
Policy Implications 35 Annex 3.1. Data and Methodology 36
4. Latin America’s Fiscal and External Strength: How Dependent Is It on External Conditions? 37
Introduction 37 A Decade of Falling Public and External Debt, 2003–12 38 External Factors and Debt Sustainability 39
Conclusions 42 Annex 4.1. Global Variables under Alternative Scenarios 44

CONTENTS
iv
5. Is Latin America Saving Its Terms-of-Trade Windfall? A Metric 47
Introduction 47 The Terms-of-Trade Windfall—a Historical Perspective 47 A Measure of Windfall Saving 49
Concluding Remarks 51 Annex 5.1 52
References 53
New Publications from the Western Hemisphere Department 55
Boxes
1.1 U.S. Household Balance Sheets After Five Years of Repair 8 1.2 Canadian and Mexican Exports to the United States: A Tale of Two Countries 9 2.1 Taking Stock of European Banks’ Deleveraging in Latin America 26 2.2 Foreign Ownership of Local Currency Securities and Exchange Rate Flexibility 27 2.3 Sustaining Progress in Banking Regulation and Supervision in Latin America 28 2.4 The Caribbean: In Search of Lost Competitiveness 29 4.1 Optimal Sovereign Debt Levels: The Information in Sovereign Spreads 45 Tables
2.1 Western Hemisphere: Main Economic Indicators 22 2.2 Western Hemisphere: Main Fiscal Indicators 23 2.3 Western Hemisphere: Selected Economic and Social Indicators 24 2.4 Macroprudential (MaP) and Capital Flow Management (CFM) Measures in Latin America 25

v
Preface
The May 2013 Regional Economic Outlook: Western Hemisphere was prepared by a team led by Dora Iakova and Luis Cubeddu under the overall direction of Alejandro Werner and the guidance of Miguel Savastano. The team included Gustavo Adler, Hye Sun Kim, Nicolás E. Magud, Anayochukwu Osueke, Sebastián Sosa, Ben Sutton, and Evridiki Tsounta. In addition, Gabriel Di Bella, Deniz Igan, Julien Reynaud and Martin Sommer, contributed to Chapter 1. Aliona Cebotari, Juan Carlos Hatchondo, Leonardo Martinez, Paulo Medas, Francisco Roch, and Camilo E. Tovar contributed boxes. Production assistance was provided by Patricia Delgado Pino and David Hidalgo; Joe Procopio of the Communications Department edited the manuscript and coordinated the production with the assistance of Martha Bonilla. This report reflects developments and staff projections through April 10, 2013.


vii
Executive Summary
Global economic prospects have improved as policy actions in advanced economies helped defuse the serious short-term risks that were looming some months ago. World output is expected to rise by about 3¼ percent in 2013 and 4 percent in 2014. The strength of the global recovery, however, remains uncertain. In the near term, fatigue in repairing sovereign and bank balance sheets in the euro area could reignite market stress and compromise global activity. In the United States, the short-term risks have become more balanced, although failure to replace the fiscal sequester with more backloaded measures before October would imply a larger drag on growth in late 2013 and beyond. Meanwhile, medium-term global risks remain elevated. Lack of decisive actions to put public finances on a sustainable path in key advanced economies could hit investors’ confidence and global growth.
Despite these risks, external conditions for Latin America are expected to remain stimulative. With monetary policy in advanced economies expected to stay accommodative for some time, external financing conditions will remain favorable. Strong demand from emerging Asia economies and the gradual recovery in the advanced economies will continue to support commodity prices, benefiting commodity exporters. However, a reversal of these favorable tailwinds at some point in the future remains a distinct risk. In this context, the main policy challenge for most of the region is to take advantage of the current favorable conditions to build a strong foundation for sustained growth.
Output growth in Latin America and the Caribbean moderated to 3 percent in 2012 (from 4½ percent in 2011), with a pronounced deceleration in some of the region’s largest economies. Growth is set to pick up to 3½ percent in 2013, supported by stronger external demand and the effects of earlier policy easing in some countries.
In the context of closed output gaps, the policy priorities for the financially integrated economies of the region should be strengthening public finances and protecting financial sector stability. In these countries, setting macroeconomic policies based on a realistic assessment of economies’ supply potential would be particularly important. A more prudent fiscal stance would ease pressures on capacity and arrest the widening of current account deficits. In addition, maintaining exchange rate flexibility would help discourage large speculative capital inflows.
The less-financially integrated commodity exporters of the region would benefit from saving a larger share of commodity revenues. In some countries, tighter macroeconomic policies will be necessary to contain growing external imbalances and bring down inflation from high levels.
With output broadly at potential, Central American economies should not delay any further the rebuilding of fiscal buffers, as public debt levels in most countries remains well above pre-Lehman levels. Some countries should also give high priority to increasing exchange rate flexibility to help buffer external shocks.

EXECUTIVE SUMMARY
viii
In much of the Caribbean, high debt and weak competitiveness continue to constrain growth. The key challenges for these economies remain broadly unchanged—reducing high public debt, containing external imbalances, and reducing financial sector vulnerabilities.
This edition of the Regional Economic Outlook features three analytical chapters dealing with the challenges of sustaining growth and strengthening balance sheets. Specifically, the chapters assess the region’s growth potential, the impact of changes in external conditions on public and external debt dynamics, and the use of the windfall from the recent terms-of-trade boom. The key findings are:
Latin America’s strong growth during the last decade has been driven primarily by factor accumulation (especially labor, although total factor productivity (TFP) also contributed). This contrasts with the experience of the region in the 1980s and 1990s. For the years ahead, the strong growth momentum is unlikely to be sustainable unless TFP performance improves significantly. Structural reforms, including improving the business climate, increasing competition, and investing in human capital, could help raise productivity growth.
Fiscal and external fundamentals in the region have strengthened markedly over the last decade, on the back of highly favorable external conditions. We look at whether these gains depend on a continuation of such conditions. We find that some countries appear well placed to withstand moderate external shocks, but many would benefit from a stronger fiscal position to be able to mitigate the effects of more severe shocks.
Finally, the recent terms-of-trade boom for the region is assessed through the prism of a simple metric that quantifies the associated income windfall. We find that this windfall has been unprecedented. However, the share of the windfall that has been saved is smaller than in previous episodes. Moreover, savings have been increasingly used for domestic investment (as opposed to foreign asset accumulation) during the current boom.

1
1. The United States, Canada, and the World: Outlook and Policy Challenges
After slowing in 2012, global growth is projected to pick up during 2013–14, supported by policy actions in advanced economies that have helped mitigate downside risks. The global economy is expanding at three different speeds, with the emerging economies growing rapidly, activity in the United States gaining momentum, and Europe continuing to lag as it struggles with balance sheet repair. In this context, external financing conditions are expected to remain easy and commodity prices near their current high levels in the coming years. However, these conditions could reverse over the medium term, including if advanced economies do not decisively deal with unsustainable debt dynamics or if growth falters in key emerging economies.
Global Backdrop: Receding Risks, Three-Speed Recovery Global growth slowed to 3.2 percent in 2012 (from about 4 percent in 2011), as policy uncertainties in key advanced economies weighed heavily on activity and trade. The slowdown was widespread, although particularly sharp in Europe, where the combination of sovereign and financial sector strains took a toll on domestic demand. Emerging economies were also affected by weaker demand from advanced economies, although domestic policy tightening and uncertainties also contributed to the slowdown.
Policy actions since mid-2012 have helped defuse the immediate threats to the global recovery, prompting a broad rally in financial markets (Figure 1.1). In Europe, decisive policy actions have increased confidence in the viability of the Economic and Monetary Union.1 Meanwhile, U.S.
_______ Note: Prepared by Luis Cubeddu, Julien Reynaud, and Martin Sommer, with contributions from Gabriel Di Bella, Deniz Igan, and Paulo Medas. Madelyn Estrada, Tim Mahedy, and Anayo Osueke provided excellent research assistance. 1 European actions include the Outright Monetary Transactions, completion of the European Stability Mechanism, renewed agreement on Greece’s adjustment program, and agreement on the Single Supervisory Mechanism.
policymakers averted a large fiscal contraction (“fiscal cliff”) in January 2013, but allowed the automatic across-the-board spending cuts (“sequester”) to take place in March, and have so far agreed only on a temporary solution for raising the federal debt ceiling. The recent recovery in financial markets has helped to improve global funding conditions and support confidence. Activity in emerging economies is regaining strength and commodity prices have firmed up since the middle
Figure 1.1. Near-term risks have receded since mid-2012, leading to lower sovereign spreads and a moderate recovery in equities and some commodity prices.
10
15
20
25
30
35
40
45
50
2011 2012 2013
70
80
90
100
110
120
130
140
2011 2012 2013
OilMetalsFood
0
100
200
300
400
500
600
700
2011 2012 2013
Italy/SpainGermany/France
European CDS Spreads2
(Basis points)Commodity Prices(Index, Jan. 2011=100)
Equity Prices(Index Jan. 2011 = 100)
Risk Aversion Index (VIX )
60
70
80
90
100
110
120
130
2011 2012 2013
Emerging MarketsAdvanced EuropeUnited States
Global Financial Indicators, 2011–13¹
Sources: Haver Analytics; IMF, Primary Commodity Price System; and IMF staff calculations.1 Dotted line represents mid-June 2012.2 Simple average for countries in each group.
REGIONAL ECONOMIC OUTLOOK: WESTERN HEMISPHERE
2
of last year.2 However, recent activity indicators in advanced economies continue to disappoint, particularly in Europe where credit continues to contract despite reduced sovereign spreads and improved bank liquidity.
As described in detail in the IMF’s World Economic Outlook for April 2013, global growth is set to recover only gradually in 2013–14 (Figure 1.2). World output growth is expected to reach about 3¼ percent in 2013 and 4 percent in 2014, roughly ½ percentage point below that projected six months ago. The global expansion will take place at multiple speeds. Emerging economies will continue to lead the expansion, growth in the United States is expected to gain momentum, and the recovery in Europe will be constrained by balance sheet repair. Global growth is expected to stabilize to about 4½ percent over the medium term, about ½ percentage below the average growth observed in the five years (2003–07) prior to the Great Recession.
In advanced economies, growth is projected to strengthen over the coming years (with some heterogeneity), provided policymakers avoid setbacks and deliver on their commitments. After a weak first quarter in many advanced economies, output growth is projected to rise to 2 percent for the rest of 2013 and to average 2¼ percent in 2014. Monetary policy will remain highly accommodative for some time, while household, financial, and public sector balance sheet repair proceeds.
After contracting in 2012–13, the euro area is projected to expand by 1 percent by 2014. The expected pickup in growth in the second half of 2013 would be underpinned by further improvements in financing conditions, and a smaller drag from fiscal consolidation. The recovery will continue to be much slower in the periphery, where balance sheet problems are more challenging.
_______ 2 As of March 2013, commodity prices were up about 8 percent from June 2012, reflecting stronger external demand and supply constraints in some cases (weather-related shocks in the case of cereal prices, and OPEC production cuts in the case of energy).
Figure 1.2. Global growth and trade is projected to pick up in 2013–14. External financing conditions are to remain easy, as advanced economies repair their balance sheets, and commodity prices will remain high.
Real GDP Growth
2011 2012 2013 2014
World 4.0 3.2 3.3 4.0
Advanced economies 1.6 1.2 1.2 2.2
United States 1.8 2.2 1.9 3.0
Euro area 1.4 -0.5 -0.4 1.1
Japan -0.6 2.0 1.6 1.4
Emerging and developing economies 6.4 5.1 5.3 5.7
China 9.3 7.8 8.0 8.2
Source: IM F, World Economic Outlook.
Proj.
(Percent)
Sources: Haver Analytics; IMF, World Economic Outlook; IMF,Primary Commodity Price System; Consensus Economics; and IMF staff calculations and projections.
Global Trade Commodity Prices(12–month percent change) (Index, 2004 = 100)
2004 2007 2010 201350
100
150
200
250
300
350
400
OilMetalsFood
2005 2008 2011 2014-15
-10
-5
0
5
10
15
20
AE Import volume
EM import volume
0
1
2
3
4
5
6
7
2005 2008 2011 2014
U.S. 10-yr yieldU.S. Fed funds rateGerman 10-yr yieldEurozone policy rate
Policy Rates and 10-yr Primary Structural Fiscal Bond Yields Balance (Percent) (Percent of GDP)
-10
-8
-6
-4
-2
0
2
United States Japan Euro Area
2012 2013 2014

1. THE UNITED STATES, CANADA, AND THE WORLD: OUTLOOK AND POLICY CHALLENGES
3
In the United States, annual average growth is projected to slow down this year after a strong 2013:Q1, given budget sequestration that went into effect in March, but underlying growth should accelerate in the second half of 2013 on the back of continued recovery in private demand (see below).
Growth in Japan is expected to reach 1½ percent in 2013, supported by a large fiscal stimulus package and further monetary easing. The weakening of the yen is also expected to support exports.
In emerging economies, growth is projected to rise to about 5½ percent in 2013, from 4¾ percent in the first half of 2012. The expected recovery in demand from advanced economies continued favorable external financing conditions, and the lagged impact of policy easing adopted in many countries in the second half of 2012 will be the main drivers of growth. The expansion will continue to be led by emerging Asia, and in particular China, where growth is expected to rise to 8½ percent in 2014. Growth over the medium term is expected to hover near 6 percent for emerging economies as a whole—well below the 7½ percent growth rates observed in the years preceding the Great Recession.
In this scenario, commodity prices are projected to remain relatively high, underpinned by strong growth in emerging Asia. Although the overall commodity price index is down 13 percent since peaking in April 2011, prices will remain elevated compared with historical levels, and futures prices suggest they will remain near or slightly below current levels as supply conditions improve. Over the next year, energy prices are expected to fall by 3 percent on increased non-OPEC oil production (particularly in North America); food prices are expected to soften somewhat as supply constraints are alleviated, while metals are expected to remain near current levels. Although tight inventories and strong demand from China provide some near-term upside risks to commodity prices, a sharp reversal in prices cannot be discarded over the medium term, especially if global growth slows sharply (see below).
Compared to mid-2012, near-term risks to the global outlook have receded, although they remain tilted to the downside. 3 Key near-term risks remain centered in Europe, where fatigue in repairing sovereign and bank balance sheets could drive up lending rates and compromise the projected recovery. Renewed financial market volatility in the wake of Italy’s election and recent events in Cyprus demonstrate how vulnerable conditions are to shifts in sentiment. Domestic risks are more balanced in the case of the United States, where growth could surprise on the upside should private demand growth accelerate on the back of a stronger-than-anticipated recovery in the housing market.
Risks are high over the medium term. Lack of decisive actions to put public finances on a sustainable path in key advanced economies could trigger a generalized increase in sovereign and corporate risk premiums, with large spillovers on confidence and global activity. Sharply lower growth in emerging economies, resulting for example from a sudden decline in private investment, could slow down growth and hit commodity prices. Meanwhile, setbacks in addressing sovereign and financial balance sheets in Europe and difficulties in unwinding unconventional monetary policy in advanced economies remain medium-term risks.4
The United States: Modest Growth, Bright Spots Appearing The economic recovery is proceeding in the United States, fueled by the rebound of the housing market and easier financial conditions. However, the automatic spending cuts that began in March will be a drag on growth. Durable solutions to pending fiscal risks are urgently needed.
Growth in the United States remained tepid at 2.2 percent during 2012 (Figure 1.3). This reflected significant legacy effects from the financial crisis,
_______ 3 Near-term risks related to oil supply shocks and geopolitical factors remain unchanged, whereas those related to a hard landing in emerging economies have diminished. 4 The quantitative impact of these downside scenarios for Latin America are also discussed in Chapter 2, and covered in greater detail in the IMF’s World Economic Outlook (April 2013).

REGIONAL ECONOMIC OUTLOOK: WESTERN HEMISPHERE
4
continued fiscal consolidation, a weak external environment, and temporary shocks, including the severe drought that affected farm activity and inventories and disruptions in the northeast following Hurricane Sandy. Policy uncertainty ahead of the fiscal cliff may also have had some influence. Nonetheless, the recovery is beginning to show some bright spots. Credit growth has picked up, and bank lending conditions have eased slowly from tight levels. Construction activity continued to rebound during 2012, albeit from low levels, and house prices have begun to rise. In addition, the pace of job creation accelerated in the second half of 2012, bringing the unemployment rate below 8 percent for the first time since early 2009. Wage growth has remained subdued, helping to keep inflation pressures well in check.
Despite these favorable trends and generally positive data releases in the first quarter of this year, average U.S. growth will likely slow down in 2013, mainly because of the stronger pace of fiscal consolidation associated with the budget “sequester.” Assuming the spending cuts are sustained for the remainder of the current fiscal year (but are replaced with backloaded measures during the next fiscal year, which begins in October), average growth is projected to fall to 1.9 percent in 2013. Although the tighter fiscal stance will be a major drag on growth, the favorable momentum in the housing market is expected to continue to sustain the recovery, with residential investment continuing its ascent toward levels consistent with trend household formation, and stronger house prices improving households’ balance sheets (Box 1.1). Personal consumption expenditures will be supported by continued, though moderate, job gains and low borrowing costs. At the same time, continued favorable financial conditions, strong profitability, and reduced policy uncertainty are likely to support business investment. As the fiscal drag lessens, these factors are expected to increase growth to 3 percent, on average, in 2014. On the external front, the current account deficit is projected to remain broadly stable at about 3 percent of GDP next year, in part improved by booming unconventional energy production.
Figure 1.3. A gradual U.S. recovery is underway, with demand underpinned by improvements in housing and labor markets.
-10
-8
-6
-4
-2
0
2
4
6
2007 2008 2009 2010 2011 2012
Net exportsGovernment consumption and investmentPrivate fixed investmentChange in private inventoriesPersonal consumption expendituresReal GDP growth
United States: Contributions to Real GDP Growth(Percentage points, SAAR)
Sources: Haver Analytics; and IMF staff calculations.
-25
-20
-15
-10
-5
0
5
10
0
200
400
600
800
1,000
1,200
1,400
1,600
2007 2009 2011 2013
Housing starts (thousand units, SAAR)
Housing price index (annual percent change, right scale)
United States: Housing Indicators¹
Sources: Haver Analytics; and IMF staff calculations.¹Housing price used is the S&P Case-Shiller Index.
4
6
8
10
12
60
62
64
66
68
70
2007 2008 2009 2011 2012
Labor force participation rate
Unemployment rate (right scale)
United States: Unemployment and Labor Force Participation Rates1
(Percent)
Source: Haver Analytics.1Civilian population 16 years and older. Seasonally adjusted.

1. THE UNITED STATES, CANADA, AND THE WORLD: OUTLOOK AND POLICY CHALLENGES
5
Non-energy goods imports are expected to grow by 6 percent next year. The risks to the U.S. outlook have become more balanced since the October 2012 World Economic Outlook:
On the external front, the main risk remains a worsening of the euro area debt situation, which would affect the United States through both trade and financial channels, including higher risk aversion and a stronger U.S. dollar. A more benign scenario of prolonged euro area stagnation (analyzed in detail in the April 2013 World Economic Outlook) would reduce U.S. output by about ¼ percentage point over two years.
On the domestic front, although the passage in January of the American Taxpayer Relief Act (ATRA) largely eliminated the threat of the “fiscal cliff,” durable solutions to other fiscal issues are still needed. Failure to replace the across-the-board spending cuts (“sequester”) with other backloaded measures before October would imply a larger drag on growth in late 2013 and beyond. Many important programs in education, science, and infrastructure would face deep cuts, undermining future growth. At the same time, the key drivers of long-term spending pressures (public health care, public pensions) would remain largely unaffected.
Another risk is a rise in the U.S. sovereign risk premium, prompted by further entanglements over raising the debt ceiling (which has been suspended only temporarily until May) or failure to make progress on medium-term consolidation plans. Simulations presented in Chapter 1 of the April 2013 World Economic Outlook suggest that a rise in 200 basis points in Treasury bond yields could lower U.S. growth by 1½ to 2½ percentage points during the first two years, with substantial negative spillovers to the rest of the world. On the upside, a prompt resolution of the remaining uncertainty over fiscal policy could boost sentiment and lead to a faster recovery.
Figure 1.4. Monetary policy remains accommodative, while gradual fiscal consolidation proceeds. The threat of a large fiscal contraction has been defused.
600
800
1,000
1,200
1,400
1,600
1,800
2,000
2,200
2
3
4
5
6
7
8
2007 2008 2009 2010 2011 2012 2013
Mortgage rate (Freddie Mac 30-year fixed, percent)S&P Index (right scale)
QE1 QE2 QE3
Sources: Bloomberg, LP; and IMF staff calculations.
United States: Equities and Mortage Rates
Alternative Minimum Tax
(AMT)
Higher-income taxes³
Higher-income taxes³
Payroll taxes
Payroll taxes
Other revenues²
Other revenues²
Spending sequester⁴
Spending sequester⁴
Other spending¹
0.0
0.5
1.0
1.5
2.0
2.5
3.0
3.5
4.0
4.5
Fiscal Cliff American Taxpayer Relief Act (ATRA)
Revenue: $590B
Revenue: $200B
Total: $240B
Total: $710B
Spending: $120B
Spending: $40B
United States: Averting the "Fiscal Cliff" (Estimated effect in 2013, percent of GDP)
Sources: Congressional Budget Office; IMF staff calcuations.¹Emergency unemployment benefits, Medicare payments to physicians.²ATRA, approved in January 2013, extended the bonus depreciation and most other tax credits for FY2013, but maintained the health care reform taxes.³ATRA also permanently extended the tax cuts enacted in 2001 and 2003 for incomes below $400K/$450K (single/joint filers).⁴ATRA delayed the sequester for two months. The sequester took effect on March 1, 2013 and is assumed to remain in place until the end of fiscal year 2013 (September 30, 2013).
-3
-2
-1
0
1
2
3
4
5
6
2007 2008 2009 2010 2011 2012 2013 2014
Headline Inflation Core InflationFed Fund Target Rate
Source: Haver Analytics; and IMF staff calculations.
United States: Policy Rate and Inflation (Percent )

REGIONAL ECONOMIC OUTLOOK: WESTERN HEMISPHERE
6
Developing a medium-term fiscal deficit reduction framework remains the top policy priority in the United States. Despite progress made so far through discretionary spending caps and modest tax increases, a comprehensive plan that includes entitlement reform and new revenue-raising measures is needed to place public debt on a sustainable footing in the long run. Within the contours of such a plan, fiscal consolidation should proceed gradually in the short run, in light of the fragile recovery and very limited room for monetary policy offset (Figure 1.4).
With the sizeable output gap expected to keep inflation below 2 percent during 2013–14, and given the downside risks still surrounding the recovery, the additional policy easing announced by the U.S. Federal Reserve in December 2012 seems appropriate. Moreover, increased transparency regarding future monetary policy decisions—which now links the timing of the first increase in the policy rate to specific thresholds—should provide further clarity to market participants. The IMF staff growth projections are consistent with a first policy rate hike by the Fed in early 2016. In addition, as the labor market returns to more normal conditions, the pace at which the large asset position of the U.S. Federal Reserve will be unwound will require careful design to avoid unwarranted financial volatility.
Further progress in implementing the Dodd-Frank Act remains critical for improving the resilience of the U.S. financial system. U.S. banks have strong capital ratios and the results of the stress tests published in March 2013 were reassuring. However, pending tasks include completing the designation of systemically important institutions, strengthening the regulation of money market mutual funds, reducing the systemic risk in the tri-party repo market, carefully implementing the Volcker Rule, and progressing with Basel III implementation.
Canada: Moderating Growth Amid Currency Strength After losing steam in 2012, the Canadian economy is set to recover gradually during the course of this year. Policies should
be geared to support the recovery, while remaining vigilant to risks arising from high levels of household debt.
The Canadian economy lost momentum in 2012. The economy rebounded strongly in 2010–11, thanks to effective policy action, a resilient financial sector, and high commodity prices. In 2012, however, growth slowed to below 2 percent, reflecting a weakening in external conditions and a more subdued domestic demand (Figure 1.5).
Fiscal policy has continued to be a drag on growth, as the federal and a majority of provincial governments implement plans to return to balanced budgets. The general government cyclically adjusted fiscal deficit fell by an estimated 1¾ percentage points between 2010 and 2012, mainly reflecting spending cuts. These headwinds from fiscal policy were partially offset by highly accommodative financial conditions, with the Bank of Canada maintaining the policy rate at 1 percent amid subdued inflationary pressures.
Private consumption weakened on the back of sluggish disposable income growth and weak consumer credit, as record-high household debt levels induced more caution in borrowing and a tightening in the access to home equity lines of credit. The housing sector cooled off during the second half of 2012, especially in the large metropolitan areas of Toronto and Vancouver, with home sales and construction activity moderating. Temporary disruptions in the energy sector and uncertainties about the global outlook also weighed on business investment.
A softening in external demand and a strengthening of the currency, boosted by safe haven-induced capital inflows, put pressure on exports and led to a further deterioration in the current account (see Box 1.2 for Canadian export performance to the United States).
Economic growth is expected to pick up in the second half of 2013, accelerating to about 2½ percent by 2014–15, a pace consistent with a

1. THE UNITED STATES, CANADA, AND THE WORLD: OUTLOOK AND POLICY CHALLENGES
7
gradual closure of the output gap and convergence of unemployment to its natural rate.
Business investment and net exports are expected to benefit from the projected strengthening of the U.S. economy and the waning impact of the temporary disruptions in the energy sector, while high household debt and continued moderation of the housing sector are likely to weigh on private consumption and residential construction. Fiscal consolidation will continue to weigh on growth, with financial conditions remaining very accommodative through much of 2013.
Risks around the baseline scenario remain tilted to the downside, in particular from a stronger than anticipated fiscal drag in the United States, further turbulence from Europe, and a decline in global commodity prices. On the domestic front, a more abrupt unwinding of domestic imbalances than currently envisaged in the forecasts cannot be discarded.
The main challenge for Canada’s policymakers is to support growth in the short term while reducing the vulnerabilities that may arise from external shocks and domestic imbalances. The current monetary policy stance is appropriately accommodative, given the negative output gap, and well-anchored inflation expectations. Under staff’s baseline scenario, a gradual tightening of monetary policy should begin in late 2013, when growth is expected to gain momentum. Although Canada’s fiscal position is stronger than many other advanced economies, removing the fiscal stimulus and returning to a balanced budget is important to rebuild fiscal buffers against future adverse shocks and contain appreciation pressures. That said, the pace of consolidation should remain attuned to the strength of the economy and automatic stabilizers should be allowed to operate fully, if growth were to weaken further.
The high level of household debt makes the Canadian economy more vulnerable to adverse external shocks. Although the macroprudential measures adopted during 2011–12 have helped to moderate the growth in mortgage credit and the housing sector, more measures may be needed if the ratio of household debt-to-disposable-income continues to rise.
Figure 1.5. Canadian growth has been constrained by tepid U.S. recovery and gradual fiscal consolidation. Housing sector vulnerabilities have diminished, but persist.
-10
-6
-2
2
6
Private investmentPrivate consumptionPublic consumption and investmentNet exportsReal GDP growth
Canada: Contributions to Real GDP Growth(Percentage points, seasonally adjusted at annual rate)
Sources: Haver Analytics; and IMF staff calculations.
2007 2008 2009 2010 2011 2012
-6
-4
-2
0
2
4
6
60
65
70
75
80
85
90
2006 2008 2010 2012 2014
Cyclically adjusted primary balance (right scale)¹
Gross public debt
Sources: IMF, Fiscal Monitor; and IMF staff calculations.¹As a percent of potential GDP.
Canada: Public Debt and Cyclically Adjusted Primary Balance(Percent of GDP)
-15
-10
-5
0
5
10
15
20
25
0
20
40
60
80
100
120
140
160
2005 2007 2010 2012:Q4
Home sales (Thousands of units)
Housing price (Annual percent change, right scale)
Canada: Home Sales and Housing Prices(Seasonally adjusted )
Sources: Haver Analytics; Canadian Real Estate Association; and IMF staff calculations.
REGIONAL ECONOMIC OUTLOOK: WESTERN HEMISPHERE
8
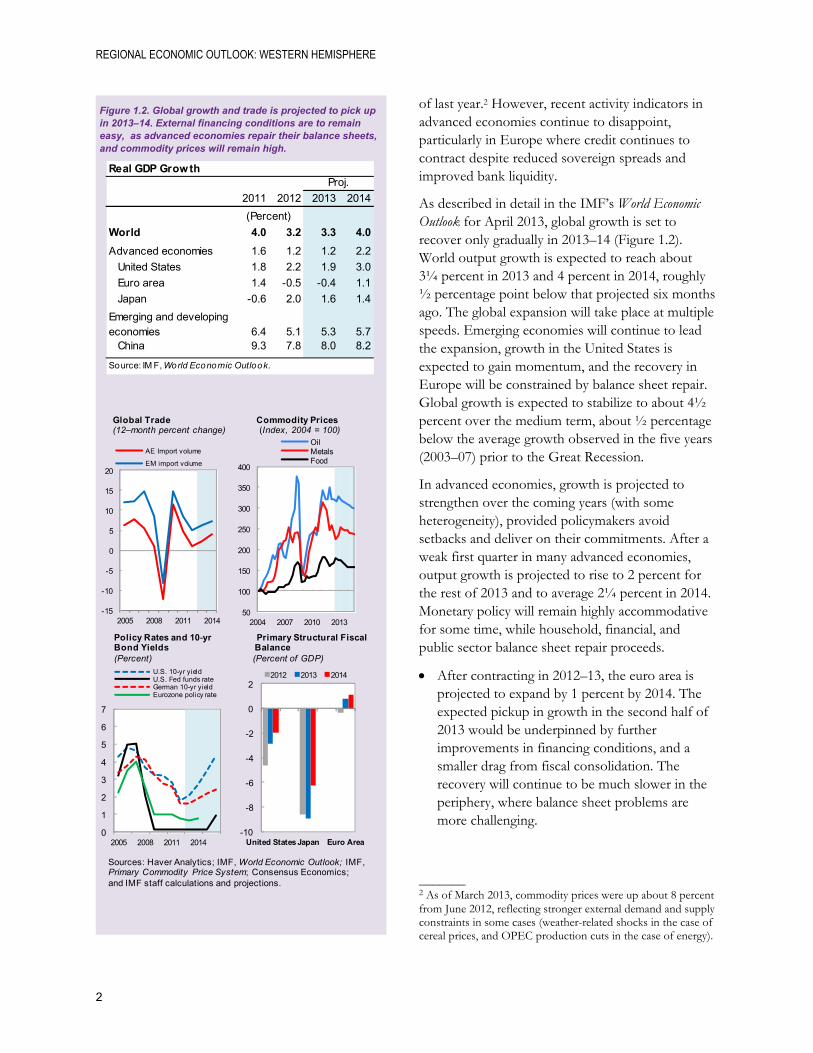
Box 1.1. U.S. Household Balance Sheets After Five Years of Repair
One of the key forces underlying sluggish growth in the United States has been the drawn-out process of household balance sheet repair. In the aftermath of the Great Recession, balance sheets were weakened by the bursting of the housing bubble and lower stock prices—household net worth fell sharply from 650 percent of disposable income (DI) in 2006:Q1 to 480 percent in 2009:Q1. The American households were also over-indebted at the onset of the crisis, with the debt-to-income ratio peaking at around 135 percent of DI in 2007:Q3 compared with the roughly 100 percent debt ratios observed in the early 2000s. Low net worth and over-indebtedness led consumers to boost their savings, putting a drag on private consumption and—more broadly—the pace of economic recovery.
Substantial progress has been made to improve household finances in recent years, but the progress has been uneven.
Household net worth recovered to 543 percent of disposable income, close to the long-term average and optimal wealth holdings (Carroll, Slacalek, Sommer, 2012). However, much of the recovery in asset values has been driven by higher stock market wealth that tends to boost private consumption to a smaller degree than housing wealth, which remains depressed.
Aggregate debt has been reduced to about 110 percent of DI. During the severe financial crises in the Nordic economies during the 1980s/1990s, the household leverage eventually came down to the pre-bubble levels—the United States has followed a similar trend so far. Non-mortgage consumer credit growth has picked up (partly reflecting a boom in the student loans sector), but credit conditions remain tight and ease only slowly in the crucial mortgage market.
The microeconomic evidence provides a cautionary tale. Since about two-thirds of the decline in aggregate household debt reflects households shedding debt through defaults, these households may not be able to borrow when the economic prospects improve, which would moderate the recovery. In addition, households which had precarious balance sheets before the crisis appear to have made limited progress in rebuilding net worth through active savings out of income (Celasun, Cooper, Dagher, and Giri, 2012). In the absence of rapid house price appreciation and income gains, these households could choose to save more in the future.
Overall, household spending will likely remain sluggish in the near term; although consumption could gradually pick up during 2013–14 once the recent tax increases are absorbed by consumers. With the U.S. stock prices close to 5-year highs, measures to further facilitate housing market adjustment would seem an important tool to buttress household balance sheets. Such measures could include participation by the U.S. government-sponsored entities (Fannie Mae, Freddie Mac) in principal writedowns, an expansion of the existing mortgage refinancing and rental programs, and changes in the legal framework governing mortgage bankruptcies (IMF, 2012a and 2012b).
_______
Note: This box was prepared by Martin Sommer.
100
120
140
160
180
200
220
240
260
350
400
450
500
550
600
2000 2002 2005 2007 2010 2012Q3
Financial Housing (right scale)
United States: Household Assets(Percent of disposable income)
Sources: Haver Analytics; and IMF staff calculations.
50
70
90
110
130
150
170
190
-6 -5 -4 -3 -2 -1 0 1 2 3 4 5 6 7 8
Finland (1989)¹ Norway (1988)Sweden (1989) U.S. (2007)
Household Debt: U.S. now vs. Nordics in 1980s/90s(Percent of disposable income; pre-crisis peak at t = 0)
Sources: OECD; Norges Bank; Statistics Finland; Riksbank; and IMF staff calculations.¹The years in parentheses correspond to the peak in the household debt ratio.
350
400
450
500
550
600
650
700
1952 1964 1976 1988 2000 2012Q1
Household Net Worth 20 Yr Moving Average
United States: Net Worth(Percent of disposable income)
Sources: Haver Analytics; and IMF staff calculations.
1. THE UNITED STATES, CANADA AND THE WORLD: OUTLOOK AND POLICY CHALLENGES
9
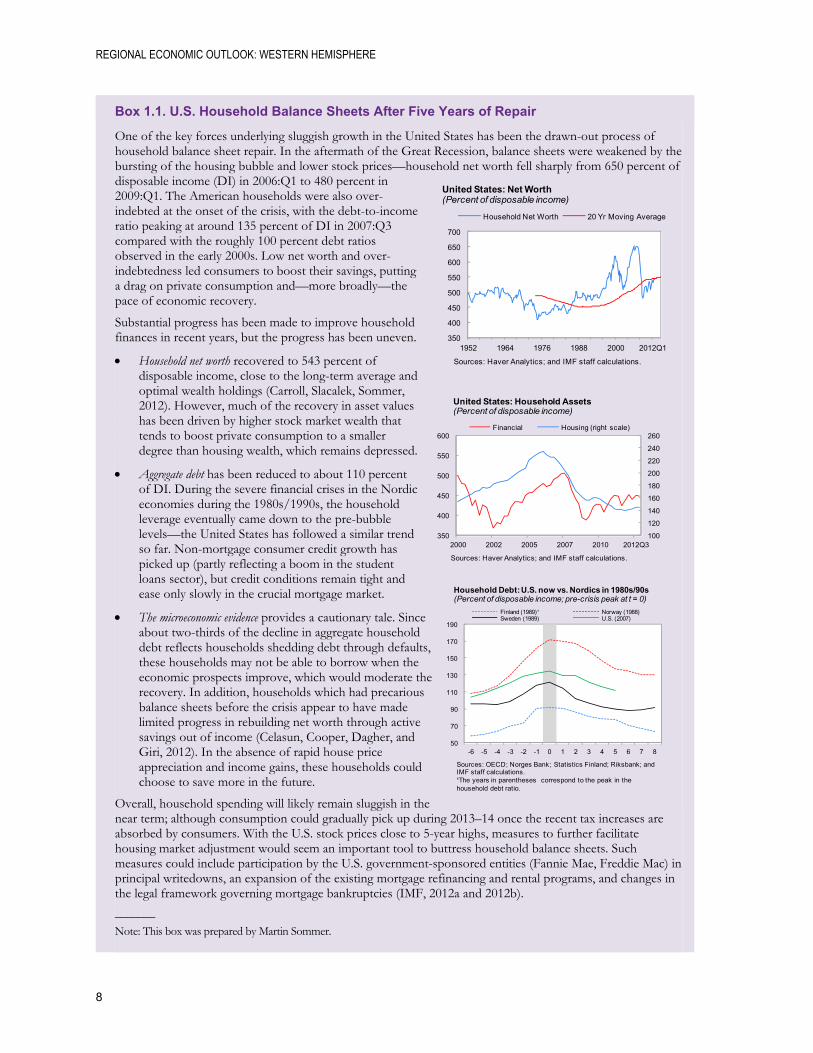
Box 1.2. Canadian and Mexican Exports to the United States: A Tale of Two Countries
The fortunes of Canadian and Mexican exporters have changed significantly over the past two decades.
During the 1990s, both Canada’s and Mexico’s exports benefited from robust U.S. demand and trade agreements (CUFTA and NAFTA). Over this decade, Canada became the largest exporter to the United States (representing almost 20 percent of all U.S. non-oil goods imports), while Mexico’s share of U.S. non-oil imports almost doubled (to about 9 percent).
The 2000s were less favorable for exports from NAFTA partners. Sharply lower U.S. demand hurt both Canada and Mexico—U.S. annual non-oil import growth fell from an average of about 11 percent in the 1990s to 3 percent in the 2000s—at a time when competition from China intensified following its entry in the World Trade Organization in 2001. Canada’s non-oil goods exports as a share of GDP fell by 12 percentage points between 2001 and 2011—mainly owing to lower manufacturing export volumes—and China surpassed Canada as the United States’ largest trading partner. Meanwhile, Mexico’s non-oil export growth slowed significantly from an annual average of 16 percent during 1991–2000 to about 3 percent during 2001–11.
Exports from both countries to the United States have recovered since the Great Recession, yet at a markedly different pace. Although Canada’s non-oil export volumes remain below pre-crisis levels, Mexico’s non-oil exports have reached new highs, consolidating Mexico’s position as the United States’ third largest trading partner (13 percent of all U.S. non-oil imports come from Mexico).
Canada’s loss in external competitiveness over the last decade reflects stiff competition from China, amid strong currency appreciation and relatively low productivity growth. Canada’s share of U.S. non-oil goods imports fell by over 6 percentage points since 1999, driven by declines in manufacturing (7 percentage points). Estimates by Medas and Dai (2012) suggest that the large real appreciation (38 percent between 2000 and 2011), largely driven by the surge in commodity prices, may explain close to two-thirds of Canada’s loss in the U.S. manufacturing import market share. Increased competition from China and relatively weak productivity in the manufacturing sector further undermined its ability to adjust to the stronger currency.1
Mexico has been able to better withstand competition from China. In the first half of the 2000s, Mexican firms saw their overall share of U.S. non-oil imports fall by close to 1 percentage point. However, Mexico’s market share rebounded and reached new highs in 2012, mainly driven by robust gains in manufacturing exports (up over 2 percentage points since 2005). These gains were predominantly due to Mexico’s improved ability to compete with Chinese firms (see Kamil and Zook, 2012), amid increased productivity (resulting in part from structural reforms in the areas of trade and property rights). In addition, increased transportation costs and strong wage growth have eroded China’s cost-advantage. Furthermore, and unlike Canada, Mexico’s currency has depreciated over the last decade (falling by about 10 percent in real effective terms since 2000), providing another boost to exports. _______ Note: This box was prepared by Paulo Medas. 1 In spite of this, the flexible exchange rate has served Canada well, especially by buffering against adverse external shocks.
5
10
15
20
25
1995 1999 2003 2007 2012
Canada
Mexico
China
U.S. Non-Oil Import Shares by Country(Percent)
Sources: Haver Analytics; and IMF staff calculations.
60
80
100
120
140
160
1989 1994 1999 2004 2009
REER: CanadaREER: MexicoTerms of Trade: CanadaTerms of trade: Mexico
Real Exchange Rates and Total Terms of Trade (Index, 2000=100)
Sources: Bank of Canada; Haver Analytics; and IMF staff calculations.
0
2
4
6
8
10
2003 2005 2007 2009 2011
Mexico China
Real Dollar Annual Wages: Mexico and China(In 2011 thousands of US dollars)
Sources: Barclays Capital; and CEIC China Database.


11
2. Outlook and Policy Challenges for Latin America and the Caribbean
Output growth in Latin America firmed up toward the end of 2012, after moderating earlier in the year, particularly in some of the region’s largest economies. In most economies, domestic demand remained robust and external current account deficits widened further. Growth is set to pick up further in 2013, supported by stronger external demand. In the context of closed output gaps and relatively easy financing conditions, key policy priorities are strengthening public finances and protecting financial sector stability. In the Caribbean, growth continues to be held back by high debt levels and weak competitiveness.
Overview
Real GDP growth in Latin America and the Caribbean (LAC) moderated to about 3 percent in 2012, down from 4½ percent the previous year. The deceleration was particularly pronounced in some of the region’s largest economies (Figure 2.1). In Brazil, private investment declined sharply in the early part of 2012, partly reflecting weak business confidence and policy uncertainty, but has started to grow again more recently. In Argentina, widespread exchange and import controls weighed on confidence and activity. Growth remained strong in the rest of Latin America, in most cases with robust domestic demand helping to offset to some extent the slowdown in exports. Meanwhile, in much of the Caribbean, growth remained constrained by high debt levels and slow tourism activity.
Financial markets in the region have recovered from their mid-2012 lows as policy actions in advanced economies helped boost investors’ confidence. Strong portfolio inflows to the region led to further
–––––– Note: Prepared by Luis Cubeddu and Dora Iakova. Marie Kim provided excellent research assistance.
Figure 2.1.Growth remains solid in much of Latin America, driven by strong domestic demand, and output gaps are closed.
Sources: National authorities; and IMF staff calculations.¹ Median of Argentina, Bolivia, Chile, Colombia, Costa Rica, Ecuador, Guatemala, Mexico, Paraguay, Peru, Uruguay, and Venezuela. See Table 2.1, footnote 3 on data issues for Argentina.
2007 2008 2009 2010 2011 2012-20
-15
-10
-5
0
5
10
15Median (excl. Brazil)¹ Brazil
25–75 percentile range
Selected Latin America: Real GDP Growth(Quarter-over-quarter percent change; seasonally adjusted; annualized)
-4
-2
0
2
4
6
2006 2007 2008 2009 2010 2011 2012 2013
LA range¹ Brazil The Caribbean²
Sources: IMF, World Economic Outlook; and IMF staff estimates.1 25–75 percentile range for all Latin American countries (excludes the Caribbean).2 Includes The Bahamas, Barbados, Belize, Guyana, Haiti, Jamaica, Suriname, the ECCU member states, and Trinidad and Tobago.
Latin America and the Caribbean: Output Gaps(Percent of potential GDP)
Latin America: Domestic Demand versus Real GDP Growth, 2012(Percent)
BOLBRA
CHL
COLCRI
DOM
ECU
SLV
GTM MEX
PER
URY
0
2
4
6
8
10
12
0 2 4 6 8 10 12
Rea
l Do
mes
tic
Dem
and
Gro
wth
Real GDP Growth
VEN
Sources: IMF, World Economic Outlook; national authorities; and IMF staff calculations.

REGIONAL ECONOMIC OUTLOOK: WESTERN HEMISPHERE
12
reduction in spreads and put upward pressure on local currencies (Figure 2.2). Sovereigns and corporations, including those with limited access to international markets in the past, have been able to place bonds at record low rates. Meanwhile, equity price-earnings ratios have again risen above historical averages in some countries.
Looking ahead, global financial conditions are expected to remain favorable in the near term, and commodity prices are projected to remain relatively high (see Chapter 1). Under IMF staff baseline, growth in Latin America is projected to strengthen to 3½ percent in 2013, with activity in Brazil firming up. Growth in the Caribbean also should gather some strength, in line with the projected gradual pickup in external demand.
External risks to the near-term outlook have receded. Policy actions in the euro area and the
United States have removed immediate threats to global growth and financial stability. Nonetheless, in Europe, the risk that adjustment fatigue stalls progress on the implementation of policy commitments remains. So far, deleveraging by European banks has had limited effects on the region’s credit markets (see Box 2.1), but as long as the repair of bank balance sheets in Europe is incomplete, further deleveraging remains a risk. In the United States, the short-term risks have become more balanced, although failure to replace the automatic fiscal spending cuts (“the sequester”) with more backloaded measures before the start of the next fiscal year (in October) would affect growth in late 2013 and beyond. Lower U.S. growth would have a negative impact on the region, particularly in Mexico and Central America, where links through trade and remittances are the strongest.
Medium-term risks remain tilted to the downside. The key risk is a reversal of the favorable tailwinds of easy financing conditions and strong commodity prices that have prevailed since 2010. The region would be particularly affected if a sharp slowdown in China or other key economies triggers a drop in commodity prices. Model simulations of a risk scenario of a synchronized 10 percent decline in investment in the four largest emerging markets (the BRICs) suggest that growth in Latin America would decline by about 1 percentage point relative to the baseline (Figure 2.3). Growth could be up to 2 percentage points lower if the investment shock is accompanied by capital outflows.1 Another risk is that lack of progress in addressing the medium-term fiscal challenges in key advanced economies leads to a sharp increase in sovereign and corporate risk premiums, with negative impact on global growth.
Domestically, the risk of a deterioration of external and financial sector balance sheets has increased in some countries. Current account balances have weakened in recent years, and asset prices are on the rise. Credit growth has moderated, but remains high in a number of countries. Although financial stability
_______ 1 See Chapter 1 of the April 2013 World Economic Outlook for details on these risk scenarios.
Figure 2.2. Strong capital flows to the region have boosted asset prices.
Net flows to LA6 Mutual Fund¹( US$ billions, cumulative)
70
80
90
100
110
2011 2012 2013
Brazil Mexico Other LA6²
Exchange Rates(USD per local currency; index,Jan.2011 = 100)
Equity Prices EMBI Spreads(Index, Jan.2011 = 100) (Basis points)
80
120
160
200
240
280
320
2011 2012 2013
Brazil Mexico Other LA6²
Selected Latin America: Financial Indicators, 2011–13
-6
-4
-2
0
2
4
6
8
10
12
2011 2012 2013
60
70
80
90
100
110
120
130
2011 2012 2013
Sources: Bloomberg, L.P.; Haver Analytics; IMF, International Financial Statistics; and IMF staff calculations.¹ New investments less redemptions in mutual and exchange traded funds (ETFs) that track returns in LA6 bond and equity markets.² Simple average of Chile, Colombia, Peru, and Uruguay except for equity prices where there is no data for Uruguay.

2. OUTLOOK AND POLICY CHALLENGES FOR LATIN AMERICA AND THE CARIBBEAN
13
issues do not pose an immediate concern, policies need to focus on mitigating potential balance sheet vulnerabilities.
Policy Challenges Countries in Latin America should take advantage of the current favorable economic conditions to build a strong foundation for sustained growth in the future. Policy priorities include building stronger fiscal buffers, improving policy frameworks, and pressing ahead with structural reforms to increase productivity and potential growth. As global investors allocate a larger share of their portfolio to emerging markets, countries in the region need to continue strengthening prudential regulation to prevent a buildup of financial vulnerabilities.
IMF staff analysis suggests that potential growth rates in many countries are lower than those experienced during the recent cyclical upturn (see Chapter 3). Thus, it would be important for policymakers to calibrate macroeconomic policies based on a realistic assessment of the supply potential of the economy.
Financially Integrated Economies2
Developments
With the recovery from the 2008–09 global economic crisis completed, output growth in most financially integrated economies moderated toward potential in 2012, although heterogeneity among countries increased.
Growth decelerated sharply in Brazil, despite significant monetary and fiscal policy stimulus. High unit labor costs, infrastructure bottlenecks, and domestic policy uncertainty are likely to have weighed on business confidence and private investment. Recent indicators point to strengthening activity, and investment growth turned positive in the last quarter of 2012.
_______ 2 This group, which represents close to 75 percent of the region’s output, includes Brazil, Chile, Colombia, Mexico, Peru, and Uruguay.
Figure 2.3. Growth is projected to reach 3½ percent in 2013 as activity in Brazil rebounds. Medium-term risks remain tilted to the downside.
WEO Downside Scenarios, Spring 2013(Deviations from baseline level, percent)
-3
-2
-1
0
1
2012 2014 2016 2018
Global Real GDP
Weaker BRICs¹Weaker BRICs, plus ouflows²Reassessment of sovereign risk³
-25
-20
-15
-10
-5
0
5
2012 2014 2016 2018
Oil prices
-25
-20
-15
-10
-5
0
5
2012 2014 2016 2018
Non-oil prices
-3
-2
-1
0
1
2012 2014 2016 2018
LAC Real GDP
Source: IMF, World Economic Outlook.¹ Weaker BRICs scenario assumes investment is 10 percent lower relative to the baseline in Brazil, China, India, and Russia.2 In addition to lower investment, the capital outflow scenario assumes an increase in BRIC spreads (sovereigns by 400 basis points, and corporates by 200 basis points), 3 Assumes sovereign risk premiums rise sharply in the United States and Japan (starting in 2015), but more modestly elsewhere.
Pro j.
2010 2011 2012 2013 2014
LA C 6.1 4.6 3.0 3.4 3.9
Financially integrated economies² 6.7 5.3 4.1 4.3 4.5
Other commodity exporters3 5.6 6.1 3.3 4.6 3.8
Central America4 4.0 4.0 3.7 3.1 3.3
Caribbean
Tourism intensive5 -1.2 0.4 0.3 1.2 2.0
Commodity exporters6 2.9 2.4 3.4 3.6 3.9
M emorandum:
Brazil 7.5 2.7 0.9 3.0 4.0
M exico 5.3 3.9 3.9 3.4 3.4
Source: IMF, World Economic Outlook.1 Average for Latin America and the Caribbean weighted by GDP at purchasing power parity exchange rates. Subregional aggregates calculated as simple averages.2 Includes Brazil, Chile, Colombia, Mexico, Peru, and Uruguay.3 Includes Argentina, Bolivia, Ecuador, Paraguay, and Venezuela.4 Includes Costa Rica, El Salvador, Guatemala, Honduras, and the Dominican Republic (excludes Panama).5 Includes The Bahamas, Barbados, Jamaica, and ECCU member states. 6 Includes Belize, Guyana, Suriname, and Trinidad and Tobago.
Latin America and the Caribbean (LAC): Real GDP Growth¹(Percent)

REGIONAL ECONOMIC OUTLOOK: WESTERN HEMISPHERE
14
The slowdown in growth in the other economies was more gradual, and reflected mainly earlier policy tightening and softer external demand. Nonetheless, domestic demand remained robust. Consumption continued to be supported by rising labor income and easy credit conditions. In Chile and Peru, private investment also made a strong contribution to growth, partly reflecting large foreign direct investments in the mining sector. Following dynamic growth in early 2012, economic activity in Mexico moderated in the latter part of the year, in line with the slowdown in U.S. industrial production. Growth in Colombia also slowed in the second half of 2012, prompting some easing of macroeconomic policies.
Labor markets remained tight in all countries. Employment creation continued to exceed labor force growth, bringing unemployment rates to near record lows in most economies. Real wage growth was also strong, exceeding labor productivity growth in some cases (Brazil).
Inflation pressures remained contained, with some exceptions. Both core and headline inflation rates fell since mid-2012 in Chile, Colombia, and Peru, driven by moderation of food and energy prices and pass-through effects from currency appreciation. In these countries, headline inflation is close to the target (or below), and inflation expectations remain well anchored. In Mexico, inflation expectations have been relatively stable at a level somewhat above the mid-point of the inflation target. In contrast, inflation remains elevated in Brazil and Uruguay (Figure 2.4). In Brazil, inflation has risen since mid-2012, reflecting strong wage growth, tight capacity constraints in some sectors, and past currency depreciation. In Uruguay, higher food prices (driven by local weather-related shocks) and widespread wage indexation have played a role in keeping inflation well above the target.
The external current account deficits of these countries widened further despite strong terms of trade. Current account deficits rose to an average of 2.8 percent of GDP in 2012 (from 2 percent of
Figure 2.4. Domestic demand remained strong. Inflation rates are close to the target in most countries despite tight labor markets.
-6
-4
-2
0
2
4
6
8
2007 2008 2009 2010 2011 2012 2013
Uruguay Brazil
Other LA6¹
LA6: Headline Inflation less Target Inflation(12-month percent change)
Sources: Haver Analytics; national authorities; and IMF staff calculations.¹ Shading presents range of Chile, Colombia,Mexico, and Peru.
LA6: Real GDP Growth Contributions, 2012¹(Percentage points)
Sources: IMF, World Economic Outloook; and IMF staff calculations.¹ Investment includes inventories and statistical discrepancy.
-4
-2
0
2
4
6
8
10
Brazil Chile Colombia Mexico Peru Uruguay
Net Exports Investment¹ Consumption Growth
Sources: Haver Analytics; national authorities; and IMF staff calculations.¹ Simple average of Chile, Colombia, Peru, and Uruguay. January–2013 data are seasonally adjusted.
2
4
6
8
10
12
14
2003 2004 2005 2006 2007 2008 2009 2010 2011 2012
Other LA6¹ MEX BRA
Jan-2013
LA6: Unemployment Rates(Annual average; percent)

2. OUTLOOK AND POLICY CHALLENGES FOR LATIN AMERICA AND THE CARIBBEAN
15
GDP in 2011) as domestic demand growth continued to exceed output growth. In most countries, the deterioration was driven largely by buoyant private demand, partly offset by a modest increase in public savings (Figure 2.5).
Capital inflows remained robust, although outflows have also increased, leaving net financial flows broadly at the same level as in 2011 (Figure 2.6). Foreign direct investment (in the commodity, finance, and retail sectors) continued to account for a large share of inflows, though portfolio inflows also picked up in the second half of the year (particularly in Mexico), putting upward pressure on
local currencies and prompting a step up in the pace of reserve accumulation in some cases. One exception was Brazil, where lower interest rates, weaker growth, and the earlier tightening of capital flow measures led to deceleration of inflows in 2012.3
Bank credit growth remained strong, at more than 10 percent in real terms, although the pace of growth has moderated in recent months (Figure 2.7). Corporate bond issuance also picked up, with an increasing number of firms issuing for the first time. Firms in the region are increasingly able to
_______ 3 Brazil eased some of its capital flow restrictions in the second half of 2012 as portfolio flows subsided.
Figure 2.6. Strong capital inflows put pressure on local currencies in most countries and prompted a step up in reserve accumulation.
LA6: GIR and Real Exchange Rates (Index, 2005 = 100)Brazil Other LA6¹
Sources: Haver Analytics; and IMF staff calculations.¹ Simple average of Chile, Colombia, Mexico, Peru, and Uruguay.
80
100
120
140
160
180
0
100
200
300
400
500
600
700
2006 2008 2010 2012
Gross international reserve (GIR)REER (increase denotes appreciation, right axis)
80
100
120
140
160
180
0
100
200
300
400
2006 2008 2010 2012
LA6: Gross and Net Financial Flows(US$ billions)
Brazil Other LA6¹
Sources: Haver Analytics; IMF, World Economic Outlook ; and IMF staff calculations.¹ Sum of Chile, Colombia, Mexico, Peru, and Uruguay. Data for Uruguay are through 2012:Q3.
-30
0
30
60
90
120
150
180
2006 2008 2010 2012
FDI Portfolio investment Other investment
Total NetInflows
2006 2008 2010 2012
Figure 2.5. Strong domestic demand led to further widening of current account deficits.
-4
-3
-2
-1
0
1
2
15
20
25
30
2002 2004 2006 2008 2010 2012
CA balance (right axis) Savings Investment
LA6: Savings, Investment, and Current Account Balance, 2002–12¹(Percent of GDP)
Sources: IMF, World Economic Outlook; and IMF staff calculations.¹Simple average for Brazil, Chile, Colombia, Mexico, Peru, and Uruguay.
LA6: Change in Current Account (CA) Balance:2010–12¹(Percentage points of GDP)
-8
-6
-4
-2
0
2
4
Brazil Chile Colombia Mexico Peru Uruguay
Private CA balance Public CA balance Total CA balance
Sources: IMF, World Economic Outlook; and IMF staff calculations.¹Private (public) current account is the difference between private (public) savings and private (public) investment.

REGIONAL ECONOMIC OUTLOOK: WESTERN HEMISPHERE
16
issue bonds at much lower interest rates and at longer maturities than previously. Analysis of corporate balance sheets in the region suggests that they remain generally healthy, although debt-to-asset ratios have increased in some sectors such as construction, manufacturing, and retail trade (see Gonzalez-Miranda, 2012).
House prices in major metropolitan areas in the region have increased rapidly in recent years, especially in Brazil and Peru. Household leverage is rising in many countries, although it remains relatively low compared with other emerging economies.
Outlook and Policy Priorities
Growth in the financially integrated economies is projected to be close to potential in 2013. In Brazil, output growth is expected to recover to 3 percent in 2013 (from 0.9 percent in 2012), reflecting the lagged impact of domestic policy easing and measures targeted at boosting private investment.
If the fiscal stance is relaxed or financing conditions ease further, domestic demand in these countries may grow faster than projected. With tight capacity constraints, this would lead to further widening of current account deficits and upward pressure on domestic prices.
In view of these risks, policy efforts should focus on preventing a buildup of macroeconomic and financial vulnerabilities. A key policy priority is to step up the pace of fiscal consolidation. Public debt declined rapidly in the years prior to the 2008 financial crisis, but regaining fiscal space since then has proved challenging, despite the boost to fiscal revenues from high commodity prices and strong growth. The ratio of public expenditure to GDP has remained high in most countries, and growth in public spending accelerated further in 2012. The 2013 fiscal budget implies a mild easing of the fiscal stance in Chile, Colombia, and Peru.
More prudent fiscal policy would help ease pressure on domestic capacity constraints and mitigate the widening of current account deficits. Stronger public balance sheets would also help shield these economies
Figure 2.7.Credit growth remains strong, and financial sector indicators appear healthy.
0
20
40
60
80
100
2005 2007 2009 2011
Other LA6 Mexico Brazil
Corporate Bond Issuance1
(US$ billions)
Sources: Dealogic; and IMF staff calculations.¹ Data for Latin America. Other LA6 is the sum for Chile, Colombia, Peru, and Uruguay.
0
5
10
15
20
2003 2006 2009 2012
First-time Corporate Issuers1
(Percent of total)
LA6: Real Credit to the Private Sector(12 -month percent change)
2007 2008 2009 2010 2011 2012 2013-10
-5
0
5
10
15
20
25
30Brazil Mexico Other LA6¹
Sources: Haver Analytics; IMF staff calculations.¹ Simple average of Chile, Colombia, Peru, and Uruguay.
0
1
2
3
4
5
2008 2009 2010 2011 2012
60
80
100
120
140
160
180
2008 2009 2010 2011 2012
10
12
14
16
18
20
2008 2009 2010 2011 2012
LA5 range¹ Simple average
Regulatory Capital to Risk-weighted Assets
0
1
2
3
4
5
6
2008 2009 2010 2011 2012
Return on Asset
Nonperforming Loansto Total Gross Loans
Loan-to-Deposit Ratio
Financial Soundness Indicators, 2008–12
Sources: IMF, Financial Soundness Indicators (FSIs) ; and IMF staff calculations.¹ Range for Brazil, Chile, Colombia, Mexico, and Peru.

2. OUTLOOK AND POLICY CHALLENGES FOR LATIN AMERICA AND THE CARIBBEAN
17
from adverse external shocks in the future (see Chapter 4), and strengthen their ability to deal with long-term challenges related to population aging.
Monetary policy should remain flexible and respond to changing economic circumstances. Countries with relatively high inflation (Brazil and Uruguay), or with strong pressures on capacity constraints, may need to tighten policies to help maintain macroeconomic stability (Figure 2.8). Countries with well-anchored inflation expectations can lower rates below neutral to support activity in the event of a slowdown.
Exchange rate flexibility should continue to be used to discourage speculative capital flows (see Box 2.2). Stepping up the pace of reserve accumulation could be considered in countries where real exchange rates are close to the upper limit of the range consistent with fundamentals. In addition, further tightening of prudential policies could help limit the buildup of financial sector vulnerabilities (see below). Capital flow restrictions aimed at changing the volume or composition of inflows are also an option, although the effectiveness of these measures is limited and frequent readjustments are necessary to avoid circumvention.
Strengthening financial sector regulation and supervision remains critical to protect the stability of the banking system and prevent financial excesses. Banks in these countries have high capital and liquidity ratios, low nonperforming loans, and high return on assets. However, strong bank financial indicators are not unusual at this stage of the cycle and could mask rising vulnerabilities. Increasing leverage in cyclically sensitive sectors such as construction and retail should be monitored carefully. Prudential measures (such as forward-looking provisioning requirements, stricter loan-to-value ratios, higher capital requirements, and limits on sectoral exposure) would help mitigate risks. In fact, a number of countries (Peru, Colombia, and Uruguay) have appropriately tightened prudential policies in recent months (see Table 2.4). Additional prudential measures may be required in some
countries to keep credit growth and associated vulnerabilities in check.
With a rising share of financial services provided outside the banking system, countries should also step up efforts to increase the perimeter of regulation and supervision to nonbank financial institutions (see Box 2.3). Greater efforts are also needed to improve data collection to allow better monitoring of financial sector vulnerabilities. The establishment of comprehensive credit registries for individual borrowers, for example, should improve the assessment of credit risk.
Figure 2.8. Fiscal stance eased in some countries in 2012. Monetary policy remains highly accommodative in Brazil and Uruguay.
0
1
2
3
4
5
6
Brazil Uruguay Chile Colombia Peru Mexico
Sources: Haver Analytics; Magud and Tsounta (2012); and IMF staff calculations.¹ Red dots denote February 2013 real policy rate (deflated by expected inflation). Rectangle represents range for estimated neutral rates (excluding outliers) based on information through August 2012.
LA6: Neutral Interest Rates and Policy Rates¹(Percent)
-3
0
3
6
9
12
Brazil² Chile Colombia Mexico Peru Uruguay
2011 2012 2013Potential output growth
LA6: Growth of Government Primary Expenditure1
(Percent)
Source: IMF staff estimates and calculations.1 Deflated by consumer price inflation.2 Excludes policy lending in all years.

REGIONAL ECONOMIC OUTLOOK: WESTERN HEMISPHERE
18
Other Commodity Exporters4
Developments
After expanding rapidly in 2011, growth in most of the less-financially integrated commodity exporters slowed, although output gaps remained closed or positive in most countries. The slowdown was particularly sharp in Argentina and Paraguay, which were affected by weather-related shocks, and softer activity in Brazil. In the case of Argentina, import and foreign exchange restrictions also weighed heavily on investment and activity. The slowdown was less pronounced in the case of Ecuador, whereas in Venezuela, output growth rose on the back of highly expansionary policies (Figure 2.9).
External current account balances in most of these countries continued to deteriorate, often driven by strong public sector spending. In Argentina and Venezuela, inflation remained high and capital flight continued (although at a slower pace than in 2011), despite further tightening of import and exchange restrictions aimed at limiting reserve losses.
Outlook and Policy Priorities
Growth is projected to moderate in 2013 for the energy exporters (Bolivia, Ecuador, and Venezuela). This projection hinges on the adoption of prudent macroeconomic policies, which are necessary to contain inflation and improve confidence. In contrast, growth in Paraguay is expected to pick up sharply, supported by the unwinding of weather-related shocks and the recovery in Brazil.
Going forward, these countries would benefit from saving a much larger share of their commodity revenues (see Chapter 5). On average, primary public spending has increased by 10 percentage points of GDP since 2005. Given these countries’ high vulnerability to terms-of-trade shocks, spending
_______ 4 This group includes Argentina, Bolivia, Ecuador, Paraguay, and Venezuela. In the case of Argentina, the IMF issued a declaration of censure, calling it to adopt remedial measures to address the quality of the official GDP and Consumer Price Index for Greater Buenos Aires (CPI-GBA) data. In this report, alternative data sources are also used in some cases for the assessment of developments.
Figure 2.9. In other commodity-exporting countries in South America, policies remained highly procyclical, with large private capital outflows in some cases.
Argentina Bolivia Ecuador Paraguay Venezuela-5
0
5
10
15
20
25
30
35
2010 2011 2012Potential output growth
Other South America: Real Primary Expenditure Growth¹(Percent)
Source: IMF staff calculations.¹ Deflated by consumer price inflation. Provincial inflation estimates are used for Argentina. See Table 2.1, footnote 3 on data issues for Argentina.
-12
-10
-8
-6
-4
-2
0
2
4
6
Argentina Bolivia Ecuador Paraguay Venezuela
FDI Non-FDI Reserves+Errors and omssions CA Deficit
Other South America: Current and FinancialAccount , 2012¹(Percent of GDP)
Source: IMF, World Economic Outlook.1 Positive values for reserves means reserve use; negative values are reserve accumulation. Negative current account is a surplus.
Sources: Haver Analytics; national authorities; and IMF staff calculations.¹ Data through December 2012. Deflated by consumer prices. IMF staff estimates of average provincial inflation are used for Argentina.
Other South America: Growth in Real Bank Credit and Real Interest Rates, 2012¹(Percent)
Argentina Bolivia Ecuador Paraguay Venezuela-5
0
5
10
15
-10
0
10
20
30Private sector credit growth Real policy rate (right axis)

2. OUTLOOK AND POLICY CHALLENGES FOR LATIN AMERICA AND THE CARIBBEAN
19
will need to be reined in to ensure fiscal sustainability. Countries could also take advantage of the current favorable global financing conditions to extend the maturity profile of their public debt.5
Central America, Panama, and the Dominican Republic
Developments
Average growth in Central America and the Dominican Republic was about 3½ percent during 2012, and activity remains close to potential in most countries. Strong domestic demand helped offset somewhat weaker net exports. Panama continued to post the strongest growth in the region, boosted by investment related to the canal expansion and a large public investment program. At the other end of the spectrum, activity remained subdued in El Salvador. Inflation declined across the region to 4¼ percent by end-2012 (2 percentage points lower than in 2011), due in part to lower energy and food prices (Figure 2.10).
After a robust performance in 2011, export growth decelerated in most countries, reflecting weaker demand from the United States and lower coffee prices. Remittances also slowed in some cases. As a result, the external current account deficits widened to an average of 8 percent of GDP. The deficits continued to be financed mainly with FDI and official flows, although in the case of Costa Rica, private non-FDI inflows increased sharply in the second half of 2012.
Outlook and Policy Priorities
Growth in these countries is projected to remain close to potential in 2013. Risks are mainly related to the outlook for the United States and to oil price developments. A sharp increase in oil prices would widen further current account deficits, and increase fiscal strains in countries with energy subsidy schemes. Policy uncertainty in Venezuela could also increase external vulnerability in some countries
_______ 5 Bolivia and Paraguay recently issued sovereign debt at historically low rates.
Figure 2.10. In the Central American region, growth continues to hold up well, but fiscal consolidation efforts have waned in many countries.
-12
-9
-6
-3
0
3
6
9
12
15
2008 2009 2010 2011 2012 2013
Rest of CA El Salvador Panama
CAPDR: Economic Activity Index¹(3–month moving average,12–month percent change)
Sources: Haver Analyticis; SEMCA; national authorities; and IMF staff calculations.¹ Rest of Central America (CA) is simple average of Costa Rica, Guatemala, Honduras, and Nicaragua (excludes El Salvador and Dominican Republic).
Central America: Nominal Exchange Rates¹ (US$/LC, Index, 2005 = 100)
80
90
100
110
120
130
2005 2006 2007 2008 2009 2010 2011 2012 2013
Central America LA6
Sources: IMF, World Economic Outlook; national authorities; and IMF staff calculations.¹ Central America is the simple average for Costa Rica, Dominican Republic, El Salvador, Guatemala, and Honduras. LA6 is the simple average for Brazil, Chile, Colombia, Mexico, Peru, and Uruguay.
-5
0
5
10
15
CRI SLV GTM HND NIC PAN DOM
2011 2012 2013Potential output growth
39
-12
CAPDR: Real Primary Expenditure Growth¹(Percent)
Source: IMF staff calculations.¹ Deflated by consumer price inflation.

REGIONAL ECONOMIC OUTLOOK: WESTERN HEMISPHERE
20
(e.g., Nicaragua), which have benefited from concessional oil import financing.
Public debt remains above pre-Lehman levels in most of the region, and consolidation efforts have lost momentum. In 2012, real primary expenditure growth accelerated, while tax revenues remained low.6 Looking ahead, gradual tightening of fiscal policy would be necessary to reduce fiscal and external imbalances and ensure debt sustainability. Consolidation efforts should include both a reduction in the pace of government spending (particularly in public wage and energy subsidies) and revenue mobilization.
Countries with a domestic currency would benefit from a gradual move to greater exchange rate flexibility. More flexible exchange rates would provide a buffer against external shocks, and could reduce vulnerabilities by creating incentives for corporations to hedge foreign currency borrowing.
The Caribbean
Developments
The recovery in much of the Caribbean remains weak. Growth in the tourism-dependent economies averaged under ½ percent in 2012 (more than ½ percentage point below the October 2012 Regional Economic Outlook projections). Tourist arrivals slowed in the second half of 2012 reflecting subdued growth in the advanced economies. In contrast, growth was more robust in the Caribbean’s commodity exporters (Belize, Guyana, Suriname, and Trinidad and Tobago), reaching an average of about 3½ percent in 2012. 7 Meanwhile in Haiti, growth slowed to 2¾ percent in 2012 (compared with 5½ percent in 2011), mainly on account of delays in the implementation of reconstruction-related projects.
_______ 6 Many countries in the region (Costa Rica, El Salvador, Guatemala, and Honduras) have issued sovereign debt at relatively low rates in recent months. The easing of external financing constraints could increase external and fiscal vulnerabilities if it relaxes fiscal discipline. 7 In the case of Trinidad and Tobago, maintenance work in the energy sector held back growth in 2012.
Weak domestic demand and large output gaps helped keep inflation low in much of the region. Meanwhile, the external current account deficit in the tourism-dependent economies remained high (more than 16 percent of GDP on average), largely reflecting the region’s high dependency on energy imports. These deficits continued to be financed largely by FDI and official flows (including from Venezuela), although international reserves were used in some cases (especially Jamaica) (Figure 2.11).
Fiscal consolidation continued, although in many cases it fell short of initial plans. Primary fiscal balances improved slightly in most tourism-dependent economies (deteriorating in Barbados and St. Lucia), and public debt levels have started to stabilize, albeit at high levels. Fiscal efforts are being accompanied by debt restructurings in a few countries, including Jamaica, St. Kitts and Nevis, and more recently Grenada.8
In the commodity-exporting Caribbean, debt levels remain relatively low, although they have risen in the case of Trinidad and Tobago owing to assumption of liabilities related to the rescue of a large financial company.
Outlook and Policy Priorities
Going forward, growth in tourism-dependent economies is expected to pick up only gradually, constrained by high debt levels and weak competitiveness. These economies are projected to expand by about 1¼ percent in 2013, as external demand strengthens gradually. Risks, however, remain tilted to the downside. Higher oil prices or lower oil-related concessional financing could heighten external imbalances in some aid recipients (Dominica, Grenada, Guyana, Haiti, Jamaica, and St. Kitts and Nevis).
The key challenge for these countries is to reduce high public debt. Fiscal retrenchment is critical to
_______ 8 St. Kitts and Nevis reached an agreement in 2012 with external creditors to reduce the face value of debt by about 6 percent of GDP. Other debt restructurings in recent years include Antigua and Barbuda (2011) and Jamaica (2011). Haiti received official debt relief following the devastating earthquake of early 2011.

2. OUTLOOK AND POLICY CHALLENGES FOR LATIN AMERICA AND THE CARIBBEAN
21
address growing external imbalances (see Box 2.4). In this regard, expenditure growth rules could be a useful tool to limit the growth in public wages, especially if combined with civil service reform. Consolidation efforts should protect infrastructure investment and social spending.
Financial sector vulnerabilities still need to be addressed. Deteriorating asset quality, inadequate provisioning and low profitability have put the financial system under stress in much of the Eastern Caribbean Currency Union (ECCU). Several indigenous banks and systemically important credit unions need to be resolved to avoid contagion while containing associated fiscal costs.
In the Caribbean commodity-exporting economies, growth is expected to be about 3½ to 4 percent during 2013–14. The key near-term challenge is to contain the rapid growth in domestic demand, which continues to outpace output growth. As in the case of other commodity exporters, greater fiscal efforts are needed to rebuild policy space.
Figure 2.11. Growth in most of the Caribbean continues to be held back by high debt levels and weak competitiveness.
Caribbean: Current and Capital Accounts , 2012¹(Percent of GDP)
Sources: IMF, World Economic Outlook; and IMF staff calculations.1 Positive values for reserves means reserve use; negative values are reserve accumulation.
-10
-5
0
5
10
15
20
BHS/BRB/JAM ECCU Comm. Exporters
FDI Non-FDIReserves Errors and omissionsCurrent account deficit
Sources: Caribbean Tourism Organization; national authorities; and IMF staff calculations. 1 Commodity exporters include Belize, Guyana, Suriname and Trinidad and Tobago; Tourism dependent economies include Antigua and Barbuda, the Bahamas, Barbados, Dominica, Grenada, Jamaica, St. Kitts and Nevis, St. Lucia, and St. Vincent and Grenadines. ECCU includes Dominica, Grenada, St. Lucia, and St. Vincent and Grenadines. 2 Data on tourist arrivals through April 2012. 3 Includes commodity exporters and tourism dependent economies. Excludes St. Kitts and Nevis, which recently had a debt restructuring.
-4
-2
0
2
4
6
8
2007 2009 2011 2013
Commodity exporters
Tourism dependent economies
80
90
100
110
120
2007 2009 2011
Bahamas and BelizeECCU and Barbados¹Jamaica
2012
-2
-1
0
1
2
55
60
65
70
75
2007 2009 2011 2013
Primary Balance
Government Debt (right axis)
0
5
10
15
20
25
0
5
10
15
2008 2010 2012
ECCU¹JamaicaBelize (right scale)
Q3
Real GDP Growth1 Tourist Arrivals²
(Percent change) (Index, 2007 = 100)
Primary Balance and Nonperforming Government Debt 3 Loans(Percent of GDP) (Percent of total loans)

REGIONAL ECONOMIC OUTLOOK: WESTERN HEMISPHERE
22
2010 2011 2012 2013 2014 2010 2011 2012 2013 2014 2010 2011 2012 2013 2014
North AmericaCanada 3.2 2.6 1.8 1.5 2.4 2.2 2.7 0.9 1.9 1.9 -3.6 -3.0 -3.7 -3.5 -3.4Mexico 5.3 3.9 3.9 3.4 3.4 4.4 3.8 4.0 3.6 3.3 -0.2 -0.8 -0.8 -1.0 -1.0United States 2.4 1.8 2.2 1.9 3.0 1.7 3.1 1.8 1.7 1.8 -3.0 -3.1 -3.0 -2.9 -3.0
South AmericaArgentina3 9.2 8.9 1.9 2.8 3.5 10.9 9.5 10.8 10.1 10.1 0.6 -0.4 0.1 -0.1 -0.5Bolivia 4.1 5.2 5.2 4.8 5.0 7.2 6.9 4.5 4.4 4.2 4.9 2.2 7.5 4.8 3.5Brazil 7.5 2.7 0.9 3.0 4.0 5.9 6.5 5.8 5.5 4.5 -2.2 -2.1 -2.3 -2.4 -3.2Chile 5.8 5.9 5.5 4.9 4.6 3.0 4.4 1.5 3.0 3.0 1.5 -1.3 -3.5 -4.0 -3.6Colombia 4.0 6.6 4.0 4.1 4.5 3.2 3.7 2.4 2.4 3.0 -3.1 -3.0 -3.4 -3.4 -2.9Ecuador 3.3 8.0 5.0 4.4 3.9 3.3 5.4 4.2 6.1 2.1 -2.6 -0.2 -0.5 -1.3 -1.5Guyana 4.4 5.4 3.3 5.5 6.0 4.5 3.3 4.6 6.0 5.5 -9.6 -13.4 -13.2 -14.1 -20.0Paraguay 13.1 4.3 -1.2 11.0 4.6 7.2 4.9 4.0 5.0 5.0 -3.1 -1.1 -2.0 -2.4 -2.9Peru 8.8 6.9 6.3 6.3 6.1 2.1 4.7 2.6 2.1 2.0 -2.5 -1.9 -3.6 -3.5 -3.4Suriname 4.1 4.7 4.5 4.5 4.5 10.3 15.3 4.1 4.5 4.0 6.4 5.8 6.4 3.9 1.8Uruguay 8.9 5.7 3.8 3.8 4.0 6.9 8.6 7.5 7.8 7.0 -1.9 -2.8 -3.4 -2.9 -2.5Venezuela -1.5 4.2 5.5 0.1 2.3 27.2 27.6 20.1 28.0 27.3 2.2 7.7 2.9 6.2 7.7
Central AmericaBelize 2.7 1.9 5.3 2.5 2.5 0.0 2.5 0.6 2.0 2.0 -2.8 -1.1 -2.6 -3.2 -3.6Costa Rica 4.7 4.2 5.0 4.2 4.4 5.8 4.7 4.6 5.0 5.0 -3.5 -5.3 -5.3 -5.5 -5.4El Salvador 1.4 2.0 1.6 1.6 1.6 2.1 5.1 0.8 2.3 2.6 -2.7 -4.6 -5.1 -4.9 -4.5Guatemala 2.9 4.1 3.0 3.3 3.4 5.4 6.2 3.4 4.5 4.8 -1.5 -3.6 -3.5 -3.7 -3.6Honduras 3.7 3.7 3.3 3.3 3.0 6.5 5.6 5.4 5.9 5.7 -5.3 -8.5 -9.9 -11.2 -8.7Nicaragua 3.6 5.4 5.2 4.0 4.0 5.5 8.1 7.2 7.7 7.1 -11.0 -13.7 -15.8 -13.7 -13.3Panama 7.5 10.8 10.7 9.0 7.2 4.9 6.3 4.6 4.8 4.5 -10.2 -12.2 -9.0 -8.9 -8.7
The Caribbean Antigua and Barbuda -8.5 -3.0 1.6 1.7 3.2 2.9 4.0 1.8 3.1 3.1 -14.7 -10.8 -12.8 -13.1 -14.0The Bahamas 0.2 1.6 2.5 2.7 2.5 1.5 3.2 2.3 2.0 2.0 -10.5 -14.0 -14.1 -13.7 -12.8Barbados 0.2 0.6 0.0 0.5 1.0 6.6 9.5 1.2 -0.3 -0.7 -8.2 -8.7 -5.7 -6.1 -5.8Dominica 0.7 1.9 0.4 1.3 1.5 0.1 2.0 3.6 1.5 1.6 -16.2 -12.8 -13.5 -13.8 -13.9Dominican Republic 7.8 4.5 3.9 2.2 3.4 6.2 7.8 3.9 5.0 4.5 -8.4 -7.9 -7.2 -4.6 -3.3Grenada -0.4 1.0 -0.8 0.5 1.0 4.2 3.5 1.8 2.6 2.6 -24.1 -23.3 -23.0 -23.4 -23.4Haiti4 -5.4 5.6 2.8 6.5 6.3 4.7 10.4 6.5 5.0 4.5 -12.5 -4.6 -4.0 -5.6 -5.3Jamaica -1.4 1.5 0.1 0.5 1.2 11.8 6.0 7.4 8.3 6.2 -8.7 -12.6 -11.9 -10.3 -8.7St. Kitts and Nevis 0.0 -1.9 -0.9 1.9 3.2 5.2 2.9 0.3 3.4 2.5 -22.4 -15.6 -13.5 -15.9 -17.2St. Lucia 0.2 1.4 -0.4 1.1 2.2 4.2 4.8 6.2 2.4 2.8 -16.9 -20.1 -19.1 -18.2 -17.2St. Vincent and the Grenadines -2.3 0.4 0.5 1.0 2.0 0.9 4.7 0.8 2.4 2.5 -30.6 -28.8 -27.9 -26.8 -25.2Trinidad and Tobago 0.2 -2.6 0.4 2.0 2.5 13.4 5.3 7.2 4.0 4.0 20.3 11.1 12.1 11.0 11.2
Memorandum:Latin America and the Caribbean (LAC)¹ 6.1 4.6 3.0 3.4 3.9 6.6 6.8 5.9 6.1 5.5 -1.2 -1.3 -1.7 -1.7 -2.0
Financially Integrated LAC5 6.7 5.3 4.1 4.3 4.5 4.2 5.3 4.0 4.1 3.8 -1.4 -2.0 -2.8 -2.9 -2.8
Other Commodity Exporters6 5.6 6.1 3.3 4.6 3.8 11.2 10.9 8.7 10.7 9.7 0.4 1.6 1.6 1.4 1.2
CAPDR7 4.0 4.0 3.7 3.1 3.3 5.3 6.2 4.2 5.1 4.9 -5.4 -7.3 -7.8 -7.3 -6.5
Caribbean
Tourism dependent8 -1.2 0.4 0.3 1.2 2.0 4.1 4.5 2.8 2.8 2.5 -16.9 -16.3 -15.7 -15.7 -15.3
Commodity exporters9 2.9 2.4 3.4 3.6 3.9 7.1 6.6 4.1 4.1 3.9 3.6 0.6 0.7 -0.6 -2.6
Eastern Caribbean Currency Union10 -2.6 -0.5 0.0 1.2 2.2 3.1 4.1 3.0 2.4 2.5 -20.1 -18.0 -17.8 -18.3 -18.0
ProjectedProjectedProjected
Output Growth(Percent)
Inflation2
(End of period, percent)
Table 2.1. Western Hemisphere: Main Economic Indicators1
External Current Account Balance(Percent of GDP)
Source: IMF staf f calculations.¹Regional aggregates are PPP-GDP weighted averages, unless otherwise noted.²End-of-period (December) rates. These will generally dif fer f rom period average inf lation rates reported in the IMF's World Economic Outlook, although both are based on identical underlying projections.³Data for Argentina are of f icially reported data. The IMF has, however, issued a declaration of censure and called on Argentina to adopt remedial measures to address the quality of the of f icial GDP and CPI-GBA data. Alternative data sources have shown signif icantly lower real growth than the of f icial data since 2008, and higher inf lation rates than the of f icial data since 2007. In this context, the IMF is also using alternative estimates of GDP growth for the surveillance of macroeconomic developments in Argentina. Note that the data f rom alternative statistical agencies may alsohave methodological shortcomings.⁴Fiscal year data.⁵Simple average for Brazil, Chile, Colombia, Mexico, Peru, and Uruguay.⁶Simple average for Argentina, Bolivia, Ecuador, Paraguay, and Venezuela.7Simple average of Costa Rica, Dominican Republic, El Salvador, Guatemala, Honduras, and Nicaragua.8Simple average of The Bahamas, Barbados, Jamaica, and ECCU member states. 9Simple average of Belize, Guyana, Suriname, and Trinidad and Tobago.10Antigua and Barbuda, Dominica, Grenada, St. Kitts and Nevis, St. Lucia, and St. Vincent and the Grenadines, as well as Anguilla and Montserrat, which are not IMF members.

2. OUTLOOK AND POLICY CHALLENGES FOR LATIN AMERICA AND THE CARIBBEAN
23
2010 2011 2012 2013 2014 2010 2011 2012 2013 2014 2010 2011 2012 2013 2014Est. Proj. Proj. Est. Proj. Proj. Est. Proj. Proj.
North AmericaCanada 39.4 38.1 37.6 37.4 37.1 -4.9 -3.9 -3.2 -2.7 -2.7 83.0 83.4 85.6 87.0 84.6Mexico 24.6 24.1 24.7 23.6 23.1 -1.8 -1.0 -1.1 -0.5 -0.4 42.9 43.7 43.5 43.5 43.9United States 39.8 38.6 37.6 36.7 36.6 -8.5 -7.2 -5.8 -3.8 -2.5 98.2 102.5 106.5 108.1 109.2
South AmericaArgentina3 35.6 37.9 41.2 42.3 42.5 1.6 -0.5 -0.9 -0.6 -0.5 49.2 44.9 44.9 42.4 41.7Bolivia 30.1 34.1 34.8 35.2 34.3 3.1 2.1 2.8 2.6 2.3 38.5 34.7 33.1 34.2 33.3Brazil 33.0 31.9 33.1 31.3 31.4 2.5 3.2 2.1 3.3 3.1 65.2 64.9 68.5 67.2 65.9Chile 23.4 22.7 22.7 23.1 22.8 0.2 2.0 1.2 0.9 0.7 8.6 11.1 11.2 11.1 11.4Colombia4 26.6 26.1 25.5 26.5 25.8 -0.4 0.8 2.8 1.6 1.8 36.5 35.8 32.8 32.0 31.2Ecuador 37.2 43.3 43.6 45.2 42.8 -0.8 -0.2 0.2 -1.7 -0.7 20.9 19.9 18.6 20.0 20.6Guyana5 29.2 29.1 31.1 30.5 30.1 -1.0 -1.5 -3.4 -1.7 -1.0 65.3 65.2 60.3 61.3 60.5Paraguay 17.9 18.8 22.3 23.3 22.5 1.6 1.0 -0.8 -1.9 -1.2 13.7 11.9 11.4 11.3 11.5Peru 19.1 17.9 18.6 18.9 19.2 0.9 3.0 3.1 2.8 2.5 24.6 22.0 19.8 17.5 16.7Suriname6 25.3 25.9 28.8 28.6 28.2 -2.6 1.9 -1.0 -1.4 -1.1 18.5 20.4 20.5 20.0 19.6
Uruguay7 30.3 29.7 31.8 32.2 32.1 1.9 2.0 0.1 1.1 1.6 58.0 57.8 53.7 53.1 51.2Venezuela 30.2 37.9 42.2 37.0 33.3 -9.0 -10.0 -15.8 -8.5 -5.9 25.4 39.7 57.3 61.8 63.0
Central AmericaBelize8 25.7 25.9 25.6 25.7 25.5 1.8 2.3 1.3 1.0 1.0 84.4 82.3 78.1 81.8 98.9
Costa Rica5 16.8 15.8 16.2 16.5 16.9 -3.0 -1.9 -2.3 -2.4 -2.7 29.2 30.9 34.8 35.9 37.3
El Salvador7 19.3 19.5 20.1 20.3 20.1 -2.1 -1.9 -1.6 -1.3 -1.0 49.7 50.1 52.2 54.3 55.8
Guatemala8 13.0 13.1 12.6 13.4 13.2 -1.8 -1.3 -0.9 -0.9 -0.6 24.4 24.3 25.1 26.0 26.7
Honduras9 26.1 24.9 25.9 25.9 25.7 -3.4 -3.0 -4.2 -3.9 -3.9 29.7 32.1 34.7 36.2 40.3
Nicaragua7 24.5 24.7 26.3 26.2 28.0 0.7 1.5 0.6 0.9 -0.1 62.8 56.1 52.1 50.2 40.6
Panama10 23.8 24.3 25.1 24.9 24.4 0.8 0.1 -0.1 -1.1 -1.2 39.6 39.8 38.8 36.9 38.3
The CaribbeanAntigua and Barbuda9 20.6 22.1 19.1 26.4 19.9 1.9 -1.5 1.1 -3.9 3.0 90.8 92.9 89.2 91.9 86.2
The Bahamas8 19.0 20.5 21.8 22.1 21.6 -2.1 -1.9 -3.4 -3.6 -2.9 45.5 48.4 51.9 56.5 58.9
Barbados11 37.0 35.1 34.9 33.4 32.9 -1.6 1.1 -0.5 1.4 2.4 72.6 75.3 72.6 72.3 71.3
Dominica9 39.6 34.2 32.0 31.3 30.6 -1.9 -2.9 -2.2 -1.8 -1.3 69.9 70.7 72.2 73.6 74.7Dominican Republic 14.2 14.0 18.4 15.8 14.7 -0.6 -0.5 -4.6 -0.2 1.4 29.0 30.3 33.5 35.0 36.2Grenada9 25.7 25.8 23.1 24.3 23.4 -1.0 -2.0 -2.0 -3.3 -2.4 104.3 109.0 112.6 116.1 118.6
Haiti8 25.4 33.1 28.9 29.3 28.3 3.0 -3.3 -5.5 -4.9 -5.1 17.7 12.2 15.4 20.4 24.2
Jamaica9 21.8 22.4 20.5 19.7 19.5 4.5 3.2 5.2 7.5 7.5 140.8 141.5 146.6 142.8 136.1
St. Kitts and Nevis9 34.1 30.6 26.8 27.1 25.4 -3.0 6.5 9.2 5.2 2.3 163.9 153.6 89.3 83.0 78.4
St. Lucia9 28.9 31.7 33.6 31.0 30.4 -1.7 -3.7 -8.3 -5.4 -4.2 66.0 71.1 78.4 84.8 89.4
St. Vincent and Grenadines9 29.8 27.9 25.7 26.4 26.5 -2.4 -1.2 0.0 -0.3 0.2 66.2 67.8 70.2 74.2 74.7
Trinidad and Tobago 35.9 33.5 33.7 33.7 33.2 -1.3 2.1 0.4 0.3 0.1 35.5 33.4 39.7 36.4 40.7
ECCU12 28.5 28.2 26.2 27.8 25.7 -0.7 -0.7 -0.8 -2.0 -0.6 86.9 87.6 80.1 81.7 81.2
Memorandum:Latin America and the Caribbean (LAC) 33.5 33.8 34.9 33.6 33.3 -0.7 -0.3 -0.3 -0.2 -0.1 48.7 49.9 51.4 50.4 49.8
Financially Integrated LAC13 26.2 25.4 26.1 25.9 25.7 0.5 1.7 1.4 1.5 1.6 39.3 39.2 38.2 37.4 36.7Other Commodity Exporters14 30.2 34.4 36.8 36.6 35.1 -0.7 -1.5 -2.9 -2.0 -1.2 29.6 30.2 33.0 34.0 34.0CAPDR15 19.0 18.7 19.9 19.7 19.8 -1.7 -1.2 -2.2 -1.3 -1.1 37.5 37.3 38.7 39.6 39.5Caribbean
Tourism intensive16 28.5 27.8 26.4 26.8 25.6 -0.8 -0.3 -0.1 -0.5 0.5 91.1 92.2 87.0 88.3 87.6
Commodity exporters17 29.0 28.6 29.8 29.6 29.2 -0.8 1.2 -0.7 -0.4 -0.2 50.9 50.3 49.7 49.9 54.9
Table 2.2. Western Hemisphere: Main Fiscal Indicators1
Public Sector Primary Expenditure(Percent of GDP)
Public Sector Primary Balance2
(Percent of GDP)Public Sector Gross Debt
(Percent of GDP)
Source: IMF staf f calculations.¹Def initions of public sector accounts vary by country, depending on country-specif ic institutional dif ferences, including on what constitutes the appropriate coverage from a f iscal policy perspective, as def ined by the IMF staf f . All indicators reported on f iscal year basis. Regional aggregates are PPP-GDP-weighted averages, unless otherwise noted.² Primary balance def ined as total revenue less primary expenditures.³ Federal government and provinces; includes interest payments on an accrued basis. Primary expenditure and balance include the federal government and provinces. Gross debt is for the federal government only.⁴Nonfinancial public sector reported for primary balances (excluding statistical discrepancies); combined public sector including Ecopetrol and excluding Banco de la República’s outstanding external debt reported for gross public debt.⁵ Includes central government and social security agency. Gross debt is for the central government only.⁶ Primary expenditures for Suriname exclude net lending.⁷Consolidated public sector; data for El Salvador include operations of pension trust funds. ⁸Central government only. Gross debt for Belize includes both public and publicly guaranteed debt.⁹Central government for primary balance accounts; public sector for gross debt.¹⁰ Fiscal data cover the nonf inancial public sector excluding the Panama Canal Authority.¹¹ Overall and primary balances include of f -budget and public-private partnership activities for Barbados and the nonf inancial public sector. General government for gross debt.¹² Eastern Caribbean Currency Union members are Anguilla, Antigua and Barbuda, Dominica, Grenada, Montserrat, St. Kitts and Nevis, St. Lucia, and St. Vincent and the Grenadines. Central government for primary balance accounts; public sector for gross debt. ¹³ Simple average for Brazil, Chile, Colombia, Mexico, Peru, and Uruguay. ¹⁴Simple average for Argentina, Bolivia, Ecuador, Paraguay, and Venezuela.15 Simple average of Costa Rica, Dominican Republic, El Salvador, Guatemala, Honduras, and Nicaragua.16 Simple average of The Bahamas, Barbados, Jamaica, and ECCU member states. 17 Simple average of Belize, Guyana, Suriname, and Trinidad and Tobago.

24
REG
ION
AL ECO
NO
MIC
OU
TLOO
K: WESTER
N H
EMISPH
ERE
GDP2
($US bil.)Population
(Million)
GDP per capita
($PPP)
Nominal output
share of LAC
region2
Real GDP growth
(Percent)
CPI
inflation3
(Percent)
Current account (Percent of GDP)
Domestic saving
(Percent of GDP)
Trade
openness4
(Percent of GDP)
Gross reserves
(Percent of GDP)
Unemploymentrate
(Percent)
Poverty
rate5
Gini
coefficient5
Sovereign credit
rating6
North AmericaCanada 1,819.1 34.8 42,734 -- 1.9 1.9 -0.6 22.4 65.6 3.8 7.3 — 32.0 AAAMexico 1,177.1 114.9 15,312 20.4 2.5 4.3 -0.9 24.1 58.6 13.6 4.8 12.6 47.5 BBBUnited States 15,684.8 314.2 49,922 -- 1.7 2.4 -4.4 13.7 27.7 1.0 8.1 — 46.9 AAA
South America
Argentina7 475.0 41.0 18,112 8.2 7.2 8.7 2.1 23.5 42.8 8.4 7.2 5.4 43.1 B-Bolivia 27.4 10.8 5,099 0.5 4.5 5.9 6.4 24.0 66.0 42.8 — 31.1 55.6 BB-Brazil 2,396.0 198.4 11,875 41.6 3.6 5.9 -0.4 17.6 25.2 15.4 5.5 15.1 53.7 BBBChile 268.2 17.4 18,419 4.7 4.7 3.2 0.7 23.0 71.3 15.5 6.4 4.3 51.9 AA-Colombia 366.0 46.6 10,792 6.3 4.7 4.6 -2.2 19.6 34.8 10.0 10.4 12.8 56.5 BBB-Ecuador 80.9 15.2 10,056 1.4 4.6 4.3 0.6 24.4 60.4 1.4 5.3 16.2 48.9 B-Guyana 2.8 0.8 7,939 0.0 3.0 5.9 -9.9 8.1 131.3 31.0 — — —Paraguay 26.0 6.7 6,136 0.5 3.9 6.6 -0.1 15.8 94.2 17.6 5.8 18.4 52.2 BB-Peru 199.0 30.5 10,719 3.5 6.5 2.9 -0.8 21.5 46.8 31.3 6.8 18.4 47.2 BBBSuriname 4.7 0.5 12,398 0.1 5.0 9.1 0.3 — 101.1 18.8 — 45.1 61.6 BB-Uruguay 49.4 3.4 15,911 0.9 5.2 7.6 -1.8 17.2 56.5 27.5 6.1 2.8 45.3 BBB-Venezuela 382.4 29.5 13,616 6.6 5.0 23.1 9.0 33.1 51.6 2.8 7.8 14.1 38.7 B+
Central AmericaBelize 1.6 0.3 8,754 0.0 3.7 2.4 -7.6 12.6 123.0 18.7 16.1 38.1 52.9 B-Costa Rica 45.1 4.7 12,606 0.8 4.9 9.0 -5.0 17.4 92.3 15.2 7.3 9.0 49.7 BB+El Salvador 23.8 6.2 7,438 0.4 1.9 3.5 -4.4 11.0 71.5 11.8 5.7 22.0 45.5 BB-Guatemala 49.9 15.1 5,209 0.9 3.4 6.2 -3.7 13.8 64.6 12.7 — 46.7 55.8 BB+Honduras 18.4 8.2 4,610 0.3 4.2 6.9 -7.3 20.2 123.8 13.6 4.4 40.6 56.7 B+Nicaragua 10.5 6.0 4,458 0.2 3.7 8.8 -12.5 15.9 97.0 18.0 7.8 42.7 52.3 B-Panama 36.3 3.7 15,617 0.6 8.3 3.8 -7.1 16.3 70.2 6.7 4.2 13.2 51.9 BBB
The CaribbeanThe Bahamas 8.0 0.4 31,382 0.1 0.4 2.4 -10.4 15.7 91.6 10.5 11.0 3.9 — BBB+Barbados 4.5 0.3 25,373 0.1 1.2 5.1 -6.4 11.0 94.3 18.1 11.0 — — BB+Dominican Republic 59.0 10.2 9,646 1.0 5.4 12.1 -3.9 12.7 66.9 6.0 13.0 16.1 47.2 B+Haiti 7.9 10.4 1,243 0.1 1.1 13.1 -3.4 25.0 61.1 16.3 — 78.8 59.2 —Jamaica 15.2 2.8 9,159 0.3 0.6 11.5 -11.2 14.7 90.9 9.1 13.0 43.1 59.9 CCCTrinidad and Tobago 25.3 1.3 20,087 0.4 4.4 7.4 19.0 36.1 100.8 38.8 5.5 — — A-Eastern Caribbean Currency Union 5.1 0.6 14,692 0.1 2.0 3.1 -20.5 12.4 99.8 21.2 — — — —
Antigua and Barbuda 1.2 0.1 18,027 0.0 1.7 2.4 -17.9 20.7 114.4 13.5 — — — —Dominica 0.5 0.1 14,166 0.0 2.3 2.5 -17.9 1.4 90.6 18.8 9.8 — — —Grenada 0.8 0.1 13,697 0.0 1.8 3.2 -22.7 7.5 82.2 15.0 — — — CSt. Kitts and St. Nevis 0.7 0.1 16,241 0.0 1.4 3.7 -19.7 25.6 87.5 35.7 — — — —St. Lucia 1.2 0.2 13,104 0.0 2.8 3.2 -20.2 10.4 113.3 18.8 20.6 — — —St. Vincent and the Grenadines 0.7 0.1 11,776 0.0 2.0 3.5 -25.2 1.5 86.7 15.5 — 2.9 40.2 B
Latin America and the Caribbean¹ 5,765.6 585.8 12,332 100.0 4.1 6.4 -0.1 16.2 44.8 13.9 — — — —
2012 2003–12 average 2012
Table 2.3. Western Hemisphere: Selected Economic and Social Indicators, 2003–121
Latest available
Sources: Bloomberg, L.P.; World Bank, World Development Indicators; and IMF staf f calculations.¹ Estimates may vary f rom those reported by national authorities on account of dif ferences in methodology and source. Regional aggregates are PPP-GDP weighted averages, except for regional GDP in $US and population where totals are computed.² At market exchange rates, except for Venezuela for which of f icial exchange rates are used. ³ End-of-period, 12-month percent change. ⁴ Exports plus imports of goods and services in percent of GDP.⁵Data f rom Socio-Economic Database for Latin America and the Caribbean (SEDLAC). Poverty is share of population earning less than US$2.50 per day. Data for the United States are f rom the U.S. Census Bureau and for Canada, Statistics Canada. ⁶Median of ratings published by Moody's, Standard & Poor's, and Fitch.⁷ Figures on real GDP growth and CPI inf lation for Argentina are based on of f icial data.The IMF has, however, issued a declaration of censure and called on Argentina to adopt remedial measures to address the quality of the of f icial GDP and CPI-GBA data. Alternative data sources have shown signif icantly lower real growth than the of f icial data since 2008, and higher inf lation rates than the of f icial data since 2007. In this context, the IMF is also using alternative estimates of GDP growth for the surveillance of macroeconomic developments in Argentina. Note that the data f rom alternative statistical agencies may also have methodological shortcomings.
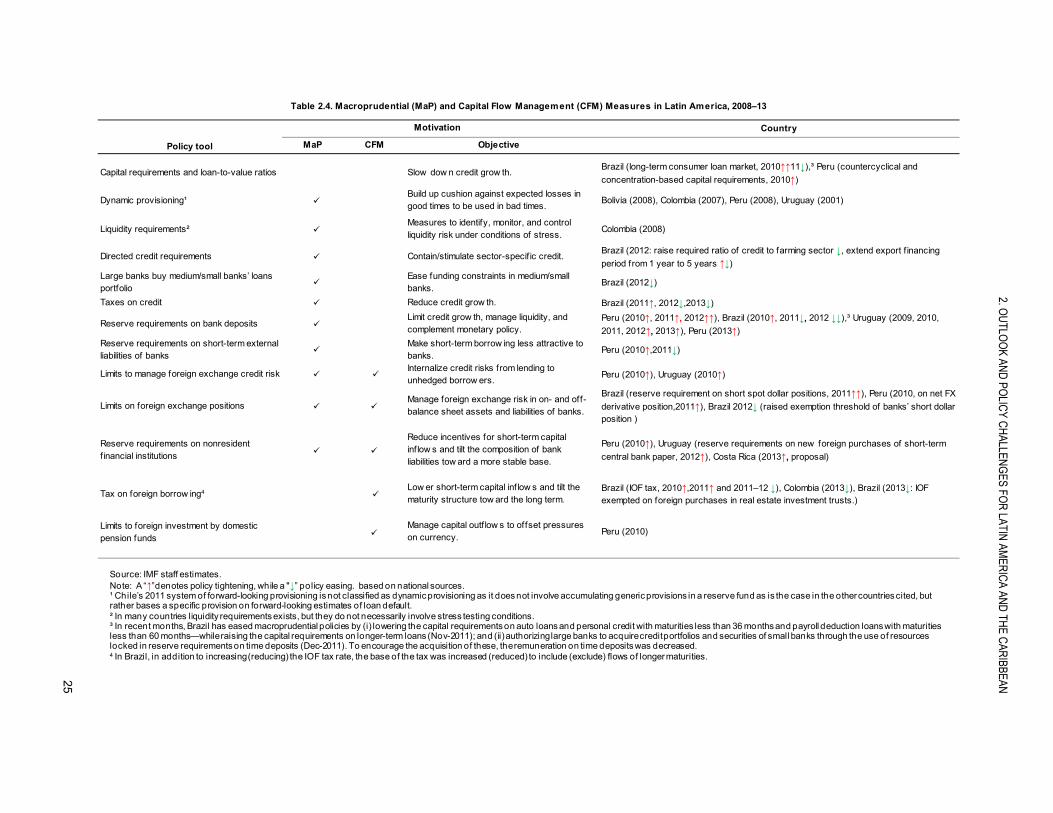
2. OU
TLOO
K AND
POLIC
Y CH
ALLENG
ES FOR
LATIN AM
ERIC
A AND
THE C
ARIBBEAN
25
Country
MaP CFM
Capital requirements and loan-to-value ratios Brazil (long-term consumer loan market, 2010↑↑11↓),³ Peru (countercyclical and
concentration-based capital requirements, 2010↑)
Dynamic provisioning¹ Bolivia (2008), Colombia (2007), Peru (2008), Uruguay (2001)
Liquidity requirements² Colombia (2008)
Directed credit requirements Brazil (2012: raise required ratio of credit to farming sector ↓, extend export f inancing
period from 1 year to 5 years ↑↓)Large banks buy medium/small banks’ loans portfolio
Brazil (2012↓)
Taxes on credit Brazil (2011↑, 2012↓,2013↓)
Reserve requirements on bank deposits Peru (2010↑, 2011↑, 2012↑↑), Brazil (2010↑, 2011↓, 2012 ↓↓),³ Uruguay (2009, 2010,
2011, 2012↑, 2013↑), Peru (2013↑) Reserve requirements on short-term external liabilities of banks
Peru (2010↑,2011↓)
Limits to manage foreign exchange credit risk Peru (2010↑), Uruguay (2010↑)
Limits on foreign exchange positions
Brazil (reserve requirement on short spot dollar positions, 2011↑↑), Peru (2010, on net FX
derivative position,2011↑), Brazil 2012↓ (raised exemption threshold of banks’ short dollar position )
Reserve requirements on nonresident f inancial institutions
Peru (2010↑), Uruguay (reserve requirements on new foreign purchases of short-term
central bank paper, 2012↑), Costa Rica (2013↑, proposal)
Tax on foreign borrow ing4 Brazil (IOF tax, 2010↑,2011↑ and 2011–12 ↓), Colombia (2013↓), Brazil (2013↓: IOF exempted on foreign purchases in real estate investment trusts.)
Limits to foreign investment by domestic pension funds Peru (2010)
Reduce incentives for short-term capital inf low s and tilt the composition of bank liabilities tow ard a more stable base.
Low er short-term capital inf low s and tilt the maturity structure tow ard the long term.
Manage capital outf low s to offset pressures on currency.
Make short-term borrow ing less attractive to banks.Internalize credit risks from lending to unhedged borrow ers.
Manage foreign exchange risk in on- and off-balance sheet assets and liabilities of banks.
Ease funding constraints in medium/small banks.
Reduce credit grow th.
Limit credit grow th, manage liquidity, and complement monetary policy.
Build up cushion against expected losses in good times to be used in bad times.
Measures to identify, monitor, and control liquidity risk under conditions of stress.
Contain/stimulate sector-specif ic credit.
Policy tool Objective
Slow dow n credit grow th.
Table 2.4. Macroprudential (MaP) and Capital Flow Management (CFM) Measures in Latin America, 2008–13
Motivation
Source: IMF staff estimates.Note: A “↑”denotes policy tightening, while a "↓” policy easing. based on national sources. ¹ Chile’s 2011 system of forward-looking provisioning is not classified as dynamic provisioning as it does not involve accumulating generic provisions in a reserve fund as is the case in the other countries cited, but rather bases a specific provision on forward-looking estimates of loan default. ² In many countries liquidity requirements exists, but they do not necessarily involve stress testing conditions.³ In recent months, Brazil has eased macroprudential policies by (i) lowering the capital requirements on auto loans and personal credit with maturities less than 36 months and payroll deduction loans with maturities less than 60 months—while raising the capital requirements on longer-term loans (Nov-2011); and (ii) authorizing large banks to acquire credit portfolios and securities of small banks through the use of resources locked in reserve requirements on time deposits (Dec-2011). To encourage the acquisition of these, the remuneration on time deposits was decreased.4 In Brazil, in addition to increasing (reducing) the IOF tax rate, the base of the tax was increased (reduced) to include (exclude) flows of longer maturities.

REGIONAL ECONOMIC OUTLOOK: WESTERN HEMISPHERE
26
Box 2.1. Taking Stock of European Banks’ Deleveraging in Latin America
A large-scale withdrawal of European banks from Latin America has been a major concern of policymakers since the onset of the European financial crisis. This box documents the extent of European banks’ deleveraging in Latin America in recent years, focusing on Brazil, Chile, and Mexico. The data suggest that deleveraging by European banks has been relatively modest, with limited impact on overall credit availability, although European subsidiaries appear to have been more cautious in extending credit than their domestic counterparts lately.
Foreign banks’ total claims (Figure 1): Total consolidated claims by European banks (including both cross-border claims by parent banks and local claims by subsidiaries) have either declined (Brazil and Mexico) or remained broadly unchanged (Chile) since mid-2011, when the European financial distress intensified. In Chile and Mexico, the decline was driven by non-Spanish European banks, which reduced their exposure to the region (mostly cross-border claims). However, claims by non-European banks declined by much less in Brazil and Mexico, and even rose sharply in the case of Chile. In all three cases, the share of claims by non-European banks in the region is up since late 2011.
Subsidiaries’ local claims (Figures 2 and 3): Domestic bank credit data suggest that claims by subsidiaries of foreign banks declined somewhat since 2008 in the three countries. The data also indicate that Spanish subsidiaries (for which data were readily available) have been more cautious than domestic banks. For example, in 2012, credit by Spanish subsidiaries grew at a slower pace than the rest of the banking system in all three countries, with other banks (particularly domestic banks) increasing their market share. In relation to equity prices, the performance of Spanish bank subsidiaries (in Brazil and Chile, where they are publicly traded) has lagged slightly behind that of other banks since 2011:Q3.
Asset sales. Another mechanism to reduce exposure to the region has been the sales of assets. Public data suggest that from 2008 to 2012, Spanish banks shed asset holdings in the region for a combined total of US$7 billion (less than 2 percent of total claims of Spanish banks in the three countries). In addition, one of the Spanish subsidiaries raised US$4.1 billion in equity in December 2012 by issuing an IPO equivalent to 25 percent of its Mexico operations. Although large relative to the size of domestic markets, these operations have had a limited impact on the stability of financial markets as the deleveraging process has been orderly.
______ Note: This box was prepared by Nicolas E. Magud, Anayo Osueke, and Yi Wu.
0
100
200
300
400
500
600
700
2008 2009 2010 2011 2012:Q3
Non-European banks Other European banks Spanish banks Total foreign claims
0
20
40
60
80
100
120
140
160
2008 2009 2010 2011 2012:Q30
100
200
300
400
500
2008 2009 2010 2011 2012:Q3
Brazil Chile Mexico
Sources: BIS; and IMF staff calculations.
Figure 1. Consolidated Claims by ForeignBanks on Local Residents (US$ billions)
Figure 2. Credit Composition
2008
-Q4
2012
-Q3
0%
20%
40%
60%
80%
100%
2008
-Q4
2012
-Q3
Domestic Foreign (non-Spanish) Spanish
2008
-Q4
2012
-Q3
Source: National authorities.
Brazil Chile Mexico
-5
5
15
25
35
45
55
2010 2011 2012
Spanish banks Foreign banks (non-Spanish) Domestic banks
Brazil Chile Mexico
Source: National Authorities.
Figure 3. Domestic Credit Growth (y/y): 2010:Q1 – 2012:Q3
-5
5
15
25
35
45
55
2010 2011 2012
-5
5
15
25
35
45
55
2010 2011 2012

2. OUTLOOK AND POLICY CHALLENGES FOR LATIN AMERICA AND THE CARIBBEAN
27
Box 2.2. Foreign Ownership of Local Currency Securities and Exchange Rate Flexibility
Low interest rates in advanced economies and stronger fundamentals in emerging economies have increased the relative attractiveness of emerging market assets, most of which are not denominated in U.S. dollars. In recent years, countries in Latin America as well as in other emerging economy regions have seen a sharp increase in foreign investor participation in their local-currency denominated securities market. In Latin America, the share of foreign ownership of government securities has doubled from an average of about 12 percent in early 2008 to more than 25 percent by end-2012. Similar increases have been observed in other emerging regions.
The marked increase in foreign ownership of debt securities has put policymakers on alert, in part because foreign investors are perceived to be more likely to sell their holdings in the event of a sudden reversal in global sentiment. In fact, during the six months following the Lehman crisis, foreign holdings of emerging markets’ domestic securities fell by close to US$70 billion (from 15 percent to under 10 percent of total holdings), exerting pressure on currencies and pushing bond yields higher (Figure 1).
However, the magnitude and speed of the selloff of domestic debt securities during periods of global financial stress, such as Lehman, can differ substantially across countries. It depends, among other things, on economic fundamentals, the degree of financial openness, and especially, the degree of exchange rate flexibility. In fact, a simple event analysis around Lehman suggests that countries with greater exchange rate flexibility appear to have experienced, on average, a smaller reduction in foreign investors’ holdings of debt securities (Figure 2). This suggests that foreign investors who experienced a sudden sharp drop in the U.S. dollar value of their assets were less likely to exit than investors in countries where currencies did not depreciate as sharply. Conversely, the data show that since March 2009, the countries that experienced the largest increase in foreign investor holding of domestic debt were those with a relatively more stable exchange rate. Overall, the evidence suggests that exchange rate flexibility reduces the vulnerability to sudden changes in foreign investors of domestic debt.
_______ Note: This box was prepared by Luis Cubeddu and Marie Kim.
5
10
15
20
25
30
100
200
300
400
500
600
2008 2009 2010 2011 2012
U.S. dollars (in billions) Share of total debt (right scale)²
Dec-12
Sources: Haver Analytics; national authorities; IMF, World Economic Outlook; and IMF staff calculations.1 Shaded areas are periods where VIX increased by at least 15 points over a quarter. EM includes Brazil, Colombia, Hungary, Indonesia, Korea, Malaysia, Mexico, Peru, Poland, Thailand, and Turkey.² Calculated as simple average.
0
10
20
30
40
50
60
PE
R
ME
X
BR
A
CO
L
IND
MA
L
TH
A
KO
R
HU
N
PO
L
TU
R
Per
cen
t o
f to
tal
Jun-08 Latest
Figure 1. Selected EMs: Nonresidents' Holding Domestic Public Debt¹
BRACOL
MEX
PER
IDNKOR
MYSTHA
TUR
HUN
POL
0.00
0.02
0.04
0.06
0.08
0.10
0.12
0.14
0.16
-40 -30 -20 -10 0
Exc
han
ge
rate
vo
lati
lity²
Change in foreign ownership of public debt¹(Percent)
Figure 2. Selected EMs: Change in Foreign Ownership of Public Debt and Exchange Rate Flexibility
Sources: Bloomberg, L.P.; Haver Analytics; national authorities; IMF, International Financial Statistics; and IMF staff calculations.1 Cumulative changes in foreign ownership measured in local currency.² Exchange rate volatility is normalized measure of standard deviation (coefficient of variation) of the nominal exchange rate for each subperiod.
Lehman: September 2008 to March 2009
BRA
COL
MEXPER
IDNKOR MYS THA
TURHUN
POL
0.00
0.02
0.04
0.06
0.08
0.10
0 200 400 600 800 1,000Change in foreign ownership of public debt¹
(Percent)
Post-Lehman: March 2009 to December 2012

REGIONAL ECONOMIC OUTLOOK: WESTERN HEMISPHERE
28
Box 2.3. Sustaining Progress in Banking Regulation and Supervision in Latin America
Recent Financial System Stability Assessments (FSSA) reports suggest that the region’s more financially integrated economies (Brazil, Chile, Colombia, Mexico, and Peru) have made good progress toward adopting international regulatory financial standards.1 Banking supervision is not only highly compliant with Basel’s Core Principles for Effective Banking Supervision, but it is also more sophisticated, comprehensive (that is, requiring a closer and deeperknowledge of the supervised entity), and risk-based than in the past. Prudential regulations and requirements are generally adequate. Capital levels are high (in most cases exceeding Basel III’s new minimum requirements), liquidity is ample, and leverage is low; and banks are profitable. Moreover, stress tests conducted under the FSSA suggest that banks in most countries would withstand extreme adverse shocks (for example, severe global recession, reversal of capital inflows, and terms-of-trade shocks).
Notwithstanding these favorable assessments, important challenges remain for the region’s banking systems.
On the supervision side, key pending tasks are to strengthen the legal protection and independence of bank supervisors, and improve consolidated and cross-border supervision to limit potential large exposures or related party lending.
On the regulation front, while capital levels are ample, it is important to improve their quality and transparency in line with Basel III (see figure), to ensure that banks have sufficient loss-absorption capacity. Some countries are already moving in this direction. Mexico recently adopted, ahead of schedule, Basel’s III standards for capital requirements (including the capital conservation buffer, but not the countercyclical capital buffer), although liquidity requirements are currently under observation (to allow regulators to assess their impact). In Brazil, consultations are currently under way for the phase-in of Basel III, which will include countercyclical capital buffers and a surcharge for systemically important banks. Other financially integrated economies in the region appear to be well placed to conform to Basel III’s capital and liquidity requirements by 2015.
Beyond banks, there is a need in some countries to strengthen the oversight and regulation of nonbank financial entities and/or large corporates. Easy external financing conditions are making it easier and cheaper for firms to borrow outside the banking system, whereas compliance with tighter Basle III regulations will likely constrain banks’ ability to finance some projects. Addressing these issues will require:
Strengthening oversight within the existing regulatory perimeter for nonbank entities. The recent intervention and liquidation of a large broker dealer in Colombia made evident weaknesses in regulatory standards (for example, liquidity and related party lending through financial conglomerates).
Extending the regulatory perimeter and strengthening supervision to include nonbank financial institutions. For instance, in Chile, the rapid expansion of electronic payments has led the authorities to establish a new set of regulations for credit cards, which requires issuers and operators to have strong solvency, liquidity, risk management, and information disclosure standards.
Improving banks’ risk management practices, and ensuring that informational asymmetries (for example, short-lived credit histories, weak accounting practices of smaller firms) do not result in the new sources of vulnerabilities.
Strengthening the oversight of larger firms, including identifying potential currency and maturity balance sheet mismatches. These efforts should be complemented with (i) the creation of comprehensive credit registries with credit information from both banks and other credit providers (including department stores); and (ii) the strengthening of corporate governance rules to protect bondholders and shareholders and allow the healthy development of corporate bond and equity markets. The latter will require improving the quality, timeliness, and disclosure of information of firms (for example, on internal controls, risk management policies, and the nomination and compensation of boards).
______ Note: This box was prepared by Luis Cubeddu and Camilo E. Tovar. 1 FSSA reports are publicly available at http://www.imf.org/external/NP/fsap/fsap.aspx. Recently published reports include Brazil (2012), Chile (2011), Colombia (2013), Mexico (2011), and Peru (2011). ² In Chile roughly 45 percent of credit cards are issued by nonbanks.
0
2
4
6
8
10
12
14
16
18
Basel II Basel III
SIFI capital surcharge
Countercyclical Capital Buffer
Capital Conservation Buffer
Common Equity Tier 2
Common Equity Tier 1
Basel III: Improving the Definition of Capital (Percentage points over risk-weighted assets)
Source: BCBS.Note: SIFI stands for systemically important financial institution.

2. OUTLOOK AND POLICY CHALLENGES FOR LATIN AMERICA AND THE CARIBBEAN
29
Box 2.4. The Caribbean: In Search of Lost Competitiveness
Over the past two decades, the Caribbean region has experienced relatively low growth, largely as a result of deep-rooted competitiveness problems. These have translated into large external current account deficits, high levels of external debt and, more generally, unsustainable external positions. Meanwhile, attempts by the public sector to support flagging growth came at a high fiscal cost and led to unsustainable debt dynamics. In light of this, the region faces a conundrum: how to bolster growth in a weak external environment at a time when fiscal retrenchment has become imperative. One way to tackle this conundrum is to focus on improving competitiveness. This box discusses the available policy options, taking into account that many countries in the region are under fixed exchange rate regimes.
There are three main ways to improve competitiveness and reduce relative domestic costs: (i) a fiscal adjustment to bring domestic inflation below that of major trading partners (internal devaluation); (ii) a nominal depreciation (external devaluation); and (iii) structural reforms to boost private investment and productivity.1
Structural Reforms. Structural reforms should be pursued vigorously regardless of other policies. These should focus on: (i) improving the effectiveness of public investment, which has had relatively low returns; (ii) improving the ease of doing business and the overall investment environment, including through lower regulatory burdens and more efficient public services; (iii) increasing efficiency and reducing costs in the product, labor and financial markets, including through reformed labor relations, electricity market reforms, and phasing out of administered interest rate floors; and (iv) pursuing deeper regional integration to help overcome size-related disadvantages.
Internal or external devaluation? The choice between the remaining two policy options―external and internal devaluation―is difficult, because both may entail adverse macroeconomic effects. Moreover, in small open economies, the balance between the positive and negative effects of the two options differs from those in larger economies, because of their high degree of trade openness. To better understand this balance, IMF staff has conducted event studies as well as simulations of dynamic stochastic general equilibrium (DSGE) models calibrated for small open economies. The main results of these analyses are:
Fiscal adjustment (internal devaluation). Model-based simulations and case studies provide some evidence that an internal devaluation may be effective in boosting competitiveness in Caribbean economies. Fiscal consolidation produces a real depreciation, which helps correct external imbalances. In line with recent country experiences with internal devaluations (Barbados, 1991; Hong Kong, 1997; and Argentina, 1998), the model predicts that smaller states will experience a smaller real depreciation than larger ones, but a larger current account improvement (because of the higher import content of cuts in government spending and the sheer size of the import bill). Although there are some expected short-term losses in output from reduced demand, these tend to be smaller in smaller states (where the share of imports in government spending tends to be larger). The simulations thus confirm that fiscal multipliers are lower in smaller states, implying that the contractionary effects of a fiscal adjustment will be smaller than in larger economies.
––––– Note: Prepared by A. Cebotari, based on Acevedo and others (2013). For a recent assessment of competitiveness in the Caribbean, see the April 2012 Western Hemisphere Regional Economic Outlook (Box 2.5). 1 A fourth option would be a fiscal devaluation (a revenue-neutral tax shift from payroll taxes to consumption-based taxes to reduce unit labor costs and consumption); this option would be difficult to implement in the Caribbean.
50
100
150
200
250
300
350
1990 1994 1998 2002 2006 2010
Tourism-based Caribbean
Commodity-exporting Caribbean
Other small islands
Emerging and developing economies
Real GDP(Indexes, 1990 = 100)
Sources: IMF, World Economic Outlook; and IMF staff calculations.

REGIONAL ECONOMIC OUTLOOK: WESTERN HEMISPHERE
30
Box 2.4. (concluded)
Source: Acevedo and others (2013). Note: The figures depict impulse response functions (deviations from the steady state) to a 3 percentage points of GDP fiscal consolidation undertaken over 3 years, using GIMF. The improvement in the fiscal position is maintained for seven years, and half of it is reversed thereafter.
External devaluation. Model simulations also suggest that external devaluations will help boost competitiveness and increase growth, though these effects tend to be smaller in small states. Model-based simulations and the experience following 83 large devaluation episodes since 1975 (of which 24 in small states) suggest that (i) growth and the external position improve immediately following the devaluation for both large and small economies; (ii) the real depreciation appears to be lower in small states because domestic prices rise more, reflecting the larger import content of their consumption basket; and (iii) the gains in output will not be as notable in small states because of the smaller decline in relative costs. The event studies also show that in addition to being small, countries undergoing financial crises or experiencing substantial reserve pressures had lower gains from devaluations.
Source: Acevedo and others (2013). Note: The figures depict impulse response functions (deviations from the steady state) to a onetime 1 percent nominal devaluation, using GIMF.
For the Caribbean, the choice between internal and external devaluations is made easier because most countries have to undertake significant fiscal adjustments to improve their debt dynamics, which will also help improve competitiveness. Should an additional external adjustment be needed, external devaluations can be used, although they are not expected to be as effective as in larger and less open economies. To improve the likelihood that they would have an expansionary effect, external devaluations should be undertaken together with measures to boost confidence that further devaluations would not be needed, such as structural reforms and fiscal adjustment.
-2
-1
0
1
2
3
0 2 4 6 8 10 12 14 16 18 20Years
Small countries Medium countries
0
1
2
3
0 2 4 6 8 10 12 14 16 18 20Years
0
1
2
3
0 2 4 6 8 10 12 14 16 18 20
Years
Small countries
Medium countries
Real GDP ( Differences in percentage points)
Real Effective Exchange Rate ( Differences in percentage points;+= Depreciation)
Current Account( Percent of GDP; Differences in percentage points)
-0.2
0.0
0.2
0.4
0 2 4 6 8 10 12 14 16 18 20Years
Medium countries Small countries
-0.2
0.0
0.2
0.4
0.6
0.8
0 2 4 6 8 10 12 14 16 18 20Years
-0.1
0.0
0.1
0.2
0 2 4 6 8 10 12 14 16 18 20
Years
Real GDP ( Differences in percentage points)
Real Effective Exchange Rate ( Differences in percentage points;+= Depreciation)
Current Account( Percent of GDP; Differences in percentage points)

31
3. Is the Growth Momentum in Latin America Sustainable?
Latin America has enjoyed strong growth momentum during the last decade. While factor accumulation remains the main driver of GDP growth, the recent acceleration is mainly explained by higher total factor productivity (TFP). However, moving forward, this growth momentum might not be sustainable given some natural constraints on labor, despite recent capital and TFP trends.
Highly favorable external conditions—interrupted only temporarily during the 2008–09 global financial crisis—coupled with prudent macroeconomic policies bolstered GDP growth in most of Latin America during the last decade. The Latin America and the Caribbean (LAC) region has grown by an average of 4 percent per year since 2003, compared with less than 2½ percent annually in 1980–2002 (Figure 3.1). But, what explains this remarkable growth performance from a supply-side perspective, and will this momentum be sustainable in the years ahead?
_____ Note: Prepared by Sebastián Sosa, Evridiki Tsounta, and Hye Sun Kim. See Sosa, Tsounta, and Kim (2013) for a more detailed and technical version of this study.
This chapter addresses these questions by identifying the proximate causes of the recent strong growth performance and estimating potential growth rates for the period ahead based on standard (Solow-style) growth accounting methodologies.1 Our analysis is based on a group of 19 LAC countries starting in 1980.2 First, we decompose the sources of output growth into accumulation of factors of production and total factor productivity. The results are compared with the region’s performance in the past as well as with other regional benchmarks. Then, we analyze the sustainability of the recent strong growth momentum by estimating the potential growth rate ranges using the production function approach. To this end, we use a battery of common filtering techniques to measure the trend of the subcomponents of output (namely, capital, labor, and TFP), smoothing out cyclical fluctuations. We then use these trend series obtained with alternative methods to compute potential growth rate ranges for each country rather than a specific point estimate. To investigate the sustainability of recent high growth rates, we explore possible constraints on factor accumulation for the region’s growth performance.
This study is, to the best of our knowledge, the first to examine growth decomposition while looking at potential GDP growth rates in LAC countries from a cross-country perspective with actual data extended to 2012. Existing research usually focuses on only one country or a small group of countries, typically analyzing long-term developments over a 30–40 year time-span; and importantly, the analysis _______ 1 The potential growth rate is a good theoretical proxy for the long-term sustainable growth rate. 2 Our sample includes the following countries: Barbados, Bolivia, Brazil, Chile, Colombia, Costa Rica, Dominican Republic, Ecuador, El Salvador, Honduras, Jamaica, Mexico, Nicaragua, Panama, Paraguay, Peru, Trinidad and Tobago, Uruguay, and Venezuela. Argentina, Guatemala, and most of the small Caribbean islands are excluded owing to data limitations.
Figure 3.1. Latin America and the Caribbean: Real GDP Growth Rate (Percent)¹
-4
-2
0
2
4
6
8
198
0
198
2
198
4
198
6
198
8
199
0
199
2
199
4
199
6
199
8
200
0
200
2
200
4
200
6
200
8
201
0
201
2
Average 1980–1989 = 2.0
Average 1990-–2002 = 2.7
Average 2003–2012 = 4.0
Sources: IMF, World Economic Outlook; and IMF staff calculations.¹ Weighted average of countries in Latin America and the Caribbean.

REGIONAL ECONOMIC OUTLOOK: WESTERN HEMISPHERE
32
is usually concentrated in the period prior to the global financial crisis.3 To incorporate the latest available data, we create a new database for the subcomponents of output using data from Penn World Table 7.1 and the latest IMF World Economic Outlook database.
What Factors Drove the Recent Strong Growth Performance? Although there is consensus that the robust growth performance in recent years has been to a great extent due to favorable external conditions (namely strong global growth, high commodity prices, and easy external financing conditions) that fueled external and domestic demand, it is less clear what the main drivers were from a supply perspective. To examine the latter, we use a simple accounting framework that decomposes output growth into the contributions from the accumulation of capital and (quality-adjusted) labor, and changes in TFP (see Annex 3.1 for details on the methodology and data).
Our key findings can be summarized as follows (Figure 3.2):
Factor accumulation (especially labor), rather than TFP growth, remains the main driver of output growth. In Latin America, total factor accumulation explained 3¾ percentage points of annual GDP growth in 2003–12, compared with ¾ percentage points by TFP. Interestingly, similar patterns are observed throughout Latin America irrespective of the country’s financial integration, export base/orientation, or market structure. Factor accumulation was also the main driver of growth in the Caribbean, but growth performance in this region during the recent period has been weaker than in the previous decade.
The recent growth pickup in Latin America is mainly explained by higher TFP. During the recent period, TFP has increased in most
_______ 3 See, for example, Ferreira and others (2013), Inter-American Development Bank (2010), and Loayza and others (2005).
Figure 3.2. Decomposition of Real GDP Growth
Labor Contribution to Real GDP Growth(Simple average, annual, percent)¹
-1
0
1
2
3
LA6 Other SA³ CA³ The Caribbean
Human capital Working age pop. Participation rate
Employment rate Total
2003–121990–2002
Contribution to Real GDP Growth(Annual average, percent)¹
-2
0
2
4
6
8
Latin America The Caribbean Emerging Asia Advanced Commodity Exporters
TFP Labor Capital Real GDP growth
2003–121990–2002²
-5
-4
-3
-2
-1
0
1
2
LA6 OtherSA
CA The Caribbean
TFP Labor Capital Real GDP growth
2003–12
1990–2002²
-1
0
1
2
LA6 OtherSA
CA The Caribbean
Factors Explaining Real GDP Growth Rate Gaps(Annual average, percent)¹
Gap vis-à-vis Emerging Asia
Gap between 2003–12 and 1990–2002
Sources: IMF, World Economic Outlook; International Labor Organization; Penn World Table 7.1; World Bank, World Development Indicators; and IMF staff calculations.1 Simple average of countries within each group. Latin America includes all Latin American countries in our sample. LA6 includes Brazil, Chile, Colombia, Mexico, Peru, and Uruguay. Other South America (SA) includes Bolivia, Ecuador, Paraguay, and Venezuela. Central America (CA) includes Costa Rica, Dominican Republic, El Salvador, Honduras, Nicaragua, and Panama. The Caribbean includes Barbados, Jamaica, and Trinidad and Tobago. Emerging Asia includes China, Indonesia, Malaysia, Philippines,and Thailand. Advanced commodity exporters includes Australia, Canada, New Zealand, and Norway. 2 For Central America:1992–2002. 3 Excludes Paraguay and Nicaragua, owing to data limitations.

3. IS THE GROWTH MOMENTUM IN LATIN AMERICA SUSTAINABLE?
33
countries, in contrast to the lukewarm performance of the 1990s. Our estimates suggest that TFP explains about 1–1½ percentage points of the higher growth performance since 2003 compared with the 1990–2002 period. The contribution of physical capital also increased, though to a lesser extent, partly reflecting favorable external financial conditions and high investment (including foreign direct investment) in the primary sector associated with the commodity price boom.
Growth in the LAC region remains below that of emerging Asia, with most of the growth differential being explained by differences in TFP performance. On the positive side, Latin America’s growth gap vis-à-vis emerging Asia has narrowed compared with the 1990s, on account of a reduction in differences in capital contributions. However, large TFP growth differentials remain, accounting for most of the GDP growth gap in 2003–12. The labor contribution, in turn, has historically been larger in Latin America (especially in Central America) than in emerging Asia.
Declining unemployment is behind the strong labor contribution to growth in recent years. Much like in the 1990s, labor continues to be the main contributor to growth during 2003–12. However, the factors explaining this high contribution to growth have changed significantly. While increases in the working-age population and higher participation rates were the main factors in 1990–2002, their contribution (while still positive) has been smaller in 2003–12. Instead, increases in the rate of employment—a factor hindering growth in the previous period—played a key role more recently, consistent with near-record low unemployment levels in many countries. The contribution of improvements in human capital to output growth has typically been positive and broadly stable over time, accounting for about ½ percentage point of GDP growth.
TFP performance generally improved in 2003–12, although important differences across countries remain. After exhibiting declines in most of the region in previous decades, TFP growth mostly turned positive (particularly strong growth is recorded in Panama, Peru, and Uruguay), with a few exceptions (Figure 3.3).4 This partly reflects the expansionary phase of the economic cycle in most of these economies in 2003–12, as well as idiosyncratic factors in some cases (such as the canal expansion in Panama).5 In Chile—one of the few countries with positive TFP growth in Latin America during the 1980s and 1990s, TFP growth has turned negative in the last decade, partly reflecting declining productivity in the mining sector. This is in line with the experience in commodity-exporting advanced economies (such as Australia, Canada, and Norway) in the recent past, and is to a significant extent related to the expansion of energy and mining production to areas (fields or mines) of lower
_______ 4 Our growth decomposition estimates (in particular the contribution of TFP growth) for the 1980s, 1990s, and early 2000s are in line with the findings in the literature (see Ferreira et al., 2013; Inter-American Development Bank, 2010; and Loayza et al., 2005). 5 Labor productivity has been particularly strong in the services sector in 2003–12, with declining trends in the mining sector. See Sosa and Tsounta (2013).
Figure 3.3. Latin America and the Caribbean: TFP Growth(Annual average, percent)
-4
-2
0
2
4
PA
NU
RY
PE
RTT
OD
OM
EC
UC
RI
BO
LC
OL
PR
YV
EN
BR
AH
ND
NIC
CH
LB
RB
ME
XJ
AM
SLV
2003–12 1981–2002¹
Sources: Barro-Lee (2010); IMF, World Economic Outlook; Penn World Table 7.1; and IMF staff calculations.¹ For Central America:1992–2002.

REGIONAL ECONOMIC OUTLOOK: WESTERN HEMISPHERE
34
marginal productivity—where production has become profitable due to the commodity price boom. A few caveats about the estimation of TFP are worth mentioning, which imply that the results should be interpreted with caution.6 The TFP measure is by definition a residual—the difference between output growth and growth in the quantity (and quality) of inputs. Thus, any measurement errors in the labor and capital series are automatically imputed to TFP. For instance, (i) changes in the quality of the capital and labor stocks that we fail to account for, (ii) changes in the level of capital utilization, and/or (iii) changes in the use of land (a factor our methodology does not account for) would be reflected in the TFP component.
Is the Recent Strong Performance Sustainable? To address this question, we estimate potential growth rate ranges for 2013–17 in LAC countries using a simple accounting framework that decomposes trend GDP growth into the contribution of changes in capital and labor inputs and TFP.
_______ 6 TFP measures the efficiency with which factors of production are used in the production process, and includes technology as well as the efficiency of markets.
We find that, if recent historical trends for capital and TFP continue, and given some natural constraints on labor, then the current strong growth momentum is unlikely to be sustainable. While the region has, on average, grown by 4 percent during 2003–12, our estimates suggest that the average potential GDP growth rate in 2013–17 is closer to 3¼ percent.7 Indeed, the strong GDP growth rates observed in recent years are higher than (or close to the upper bound of) the potential output growth ranges for 2013–17 in most countries (Figure 3.4).8
This envisaged growth deceleration (from the recent high growth to projected potential growth rates) reflects lower contributions from all sources in the coming years:
Growth of physical capital is expected to moderate somewhat, reflecting a normalization of the easy external financing conditions and the stabilization of commodity prices—both key factors driving the recent strong domestic and foreign direct investment in the region.
The contribution of labor to output growth in the future will likely be limited by some natural constraints (Figure 3.5), including: (i) population ageing (the dependency ratio is expected to reach its minimum over the next years in several countries); (ii) limited scope to further increase labor force participation rates (including for females), which are relatively high already by international standards;9 and (iii) record low unemployment rates (which declined
_______ 7 These estimates are based on the assumption that both capital and TFP will grow at the average annual rate observed in 2000–12. This period covers a full economic cycle in most countries, whereas 2003–12 includes mainly the expansionary phase of the cycle. See Annex 3.1 for more details on our assumptions to project capital, labor, and TFP. 8 Mexico (strongly affected by the 2008–09 global financial crisis given its tight linkages with the U.S. economy) and Paraguay (owing to some idiosyncratic shocks) are exceptions. 9 In fact, the contributions to output growth of both changes in working-age population and the labor force participation rate have already narrowed significantly in 2003–12 compared with those of the 1990s. It is worth noting that these constraints on labor are less binding in countries with a large informal sector (e.g., Colombia, Mexico, Peru, and several Central American countries).
Figure 3.4. Latin America and the Caribbean: Potential Output Growth Rate Ranges, 2013–171 (Annual average, percent)
0
1
2
3
4
5
6
7
8
9
PA
N
PE
R
DO
M
EC
U
CR
I
CO
L
HO
N
PR
Y
UR
Y
CH
L
BO
L
VE
N
ME
X
BR
A
NIC
TTO SLV
BR
B
JAM
Ranges Actual real GDP growth (2003–12)
Sources: IMF, World Economic Outlook; Penn World Table 7.1; United Nations Population Projections Database; and IMF staff calculations.1 Ranges estimated using equation (3) in Annex 3.1, with trend series for K, L, h, and A obtained from four alternative filtering techniques.

3. IS THE GROWTH MOMENTUM IN LATIN AMERICA SUSTAINABLE?
35
significantly, now representing a key driver of the labor contribution to output growth). Stronger contributions from human capital will require important improvements in the quality of schooling.10
TFP growth would also slow down, in line with the normalization of the business cycle. Therefore, TFP performance, which remains a concern despite its recent improvement, will be pivotal to sustain high growth rates in the region.
Potential output ranges vary significantly across countries (see Figure 3.4). In this chapter, we do not attempt to explain cross-country differences in growth potential, although these often reflect differences in economic institutions, natural resource endowments, income inequality, financial sector deepening, and trade openness.
Policy Implications In light of the expected moderation in capital accumulation and the existing natural constraints on labor, the strong growth momentum in the region is unlikely to be sustainable unless TFP performance improves significantly.11 Although TFP contributed positively to GDP growth in recent years in most countries, its contribution was modest, especially considering cyclical issues and compared with other regions. Thus, fostering TFP growth remains a key challenge and priority for the LAC region.
The causes of low TFP growth in LAC countries are many and varied, and designing a policy agenda to unleash productivity is a difficult task. Policymakers should aim at policies that help reduce distortions in the allocation of resources, and this typically entails
_______ 10 Although LAC region’s performance in terms of average years of schooling is relatively good compared with countries with similar income per capita, the quality of education has ample room for improvement (the region generally underperforms in terms of standard international tests). 11 Mobilizing higher domestic saving (which is low in the LAC region by international standards) could enhance the contribution of capital to long-term growth. Improving the quality of education would also help increasing potential output growth.
country-specific measures. Policies to be considered include: improving the business climate and enhancing competition; strengthening entry and exit regulation to facilitate the reallocation of resources to new and high-productivity sectors; improving infrastructure; promoting deeper and more efficient financial markets; enhancing research and development and innovation; and strengthening institutions to secure property rights and stamp out corruption. In the Caribbean, efforts are needed to tackle high debt levels and weak competitiveness, which have held back growth.
Figure 3.5. Labor Constraints to Future GDP Growth
0
20
40
60
80
100
40
45
50
55
60
65
70
LAC EM¹ LAC EM¹ LAC EM¹
Labor force participation rate
Female labor force participation rate
Working-age population
share
1990–2002 2003–12
Right scale
Constraints to Labor Growth(Simple average, percent)
Sources: Penn World Table 7.1; World Bank, WorldDevelopment Indicators; and IMF staff calculations. ¹ Emerging markets (EM) include China, Czech Republic, Estonia, Hungary, India, Indonesia, Poland, Russia, Slovakia, Slovenia, and Turkey.
Source: CELADE.1 Dependency ratio = (population aged 0-14 + population aged 65 and over) / (population aged 15-64) * 100.
2000
2010
2020
2030
2040
2050
2060
CHLCOL
BRA CRI URY
MEX PAN VEN
ECU PER DOM
ESV NIC PRY
BOLHON
GTM
Selected Latin America: Year with Dependency Ratio at its Minimum1
(Greatest demographic dividend )

REGIONAL ECONOMIC OUTLOOK: WESTERN HEMISPHERE
36
Annex 3.1. Data and Methodology This annex describes the data and methodology used in the growth decomposition and in estimating potential growth rate ranges.12
The growth accounting exercise is based on the following standard Cobb-Douglas production function:
(1)
where represents domestic output in period t, the physical capital stock, the employed labor force, human capital per worker, and total factor productivity (TFP).13
We use annual data from Penn World Table 7.1 (PWT) for the period 1980 until 2010 and other sources—mainly the IMF’s World Economic Outlook (WEO) database for the subsequent years. Specifically, data on output, measured by real GDP, are obtained from PWT until 2010 and extended using WEO for 2011–12. The capital stock series is constructed with investment data from the PWT using the perpetual inventory method until 2010, and investment data from WEO for 2011–12. Our labor input series (measured by employment) refers to inputs effectively used in the production process. The employment series is obtained using the labor force series from PWT and the employment rate (one minus unemployment rate) from WEO. For 2011–12, we assume that the labor force rises in line with United Nation’s (U.N.) Population Projections
_______ 12 For more details about the data and methodology, see Sosa, Tsounta, and Kim (2013) and Sosa and Tsounta (2013). 13 Our assumptions for the capital share of output, α, are country-specific and based on World Bank (2005) and are typically around 0.40 (in line with Gollin, 2002). Our main findings, however, are robust to a range of reasonable values for this parameter.
(constant fertility scenario) for individuals aged 15 and over. To get quality-adjusted labor, we follow Bils and Klenow (2000) and Ferreira, Pessoa, and Veloso (2013) to model human capital as a function of the average years of schooling, using data from Barro and Lee (2010).
Using equation (1), we can decompose GDP growth as follows (denoting by the growth rate of a variable x):
1 1 (2)
To estimate potential growth rates, we first estimate TFP using equation (1). We then obtain trend series for capital, labor, human capital, and TFP (KT, LT, hT, AT) for the period 1980–2017 using the Hodrick-Prescott (for both λ = 6.25 and λ = 100), Baxter and King, and Christiano and Fitzgerald filters.14 The following assumptions about the behavior of K, L, h, and A in 2013–17 are made: (i) we assume that both capital and TFP will grow by the average annual rate observed in 2000–12; and (ii) to project the labor input, we use projected unemployment rates (from WEO) and we assume that labor force grows in line with working-age population from U.N.’s Population Projections database and labor force participation rates remain constant at their latest observation. Finally, our measure of human capital increases at the 2005–10 average annual growth rate.
Potential output growth ( is then computed as follows:
1 1 (3)
_______ 14 We include projections through 2017 to avoid the end-of-sample bias.

37
4. Latin America’s Fiscal and External Strength: How Dependent Is It on External Conditions?
Highly favorable terms of trade and external financing conditions have helped Latin America strengthen its fiscal and external fundamentals markedly over the last decade. But, how dependent are these gains on a continuation of such conditions? This chapter assesses debt sustainability under less favorable external scenarios. It finds that, while some countries are well placed to withstand sizeable shocks, many would benefit from a stronger fiscal position to be able to deploy countercyclical policies, especially under tail events. External sustainability, in turn, does not appear to be a source of concern for most countries yet.
Introduction Over the last decade, and especially during 2003–08, Latin America experienced a remarkable improvement in key macroeconomic fundamentals, reducing public and external debt ratios (Figure 4.1), accumulating foreign assets, strengthening fiscal
––––––– Note: Prepared by Gustavo Adler and Sebastián Sosa, with research assistance from Andresa Lagerborg. See Adler and Sosa (2013) for technical details.
and external current account balances, and reducing debt structure vulnerabilities (currency denomination and maturity). While, undoubtedly, prudent policies played an important role, these gains reflected to a significant extent a highly favorable external environment—interrupted only temporarily by the 2008–09 financial crisis, and characterized by strong external demand, a commodity price boom, and benign external financing conditions.1 However, with prospects of a less favorable global environment ahead, a key question arises: How vulnerable are the region’s fiscal and external positions to external shocks?
This chapter sheds light on this question by studying the link between global variables—such as commodity prices, world growth, and global financial market conditions—and a set of key domestic variables (GDP growth, trade balance, real exchange rate, and sovereign spreads) that drive the dynamics of public and external sustainability indicators. To this end, it develops a simple framework that integrates (i) econometric estimates of the effect of exogenous external variables on these key domestic variables with (ii) the IMF’s standard framework for debt-sustainability analysis (DSA). This integrated framework allows us to examine debt dynamics under alternative global scenarios; and consequently assess the vulnerability of current fiscal and external positions for 11 Latin American economies.2, 3
_______ 1 See Chapter 5 and Adler and Magud (2013) for a discussion on the magnitude of the terms-of-trade income windfall. 2 The sample includes South America and Mexico, representing about 95 percent of Latin America’s GDP. The study entails a methodological contribution to the existing IMF’s DSA framework, as the latter is not equipped to assess how changes in external conditions affect debt dynamics. Unlike traditional DSA, our framework also takes into account the correlation among shocks and their joint dynamic responses. For details on IMF’s DSA framework, see IMF (2002, 2003, 2005, 2011, and 2012a). 3 See Box 4.1 for a discussion on a complementary approach to assess the adequacy of public debt levels.
Figure 4.1. Latin America: Public and External Debt, 2002–12¹ (Percent of GDP)
Mex Col
Ven Bra
Per
Pry
Bol
Chl
Ecu Ury
Arg
0
20
40
60
80
100
120
140
160
180
Chl
Per
Col
Mex
Ven
Ecu Pry
Bol
Bra
Ury
Arg
2002
2012
Public debt External debt
Sources: IMF, International Financial Statistics; and IMF staff calculations.¹Blue (white) bars indicate a fall (increase) in the indicator between 2002 and 2012, with the value at bottom (top) of the bar corresponding to 2012 (2002).

REGIONAL ECONOMIC OUTLOOK: WESTERN HEMISPHERE
38
A Decade of Falling Public and External Debt, 2003–12
Public Debt
Between 2003 and 2008, Latin America witnessed a remarkable decline in public debt-to-GDP ratios (about 30 percentage points of GDP, on average). The downward trend, however, came to a halt in 2009, on account of the effects of the global financial crisis, with no further reductions since then. There are, however, visible differences across countries, especially with respect to the management of rapidly rising revenues (Figure 4.2).
In the LA7 group (Brazil, Chile, Colombia, Mexico, Paraguay, Peru, and Uruguay), a drop of 20 percentage points of GDP in public debt was mainly driven by primary surpluses and rapid real GDP growth, with the former being the result of real public expenditure growing at a slower pace than booming revenues—and generally slower than potential GDP growth. The extraordinary increase in revenues came primarily from the commodity sector, as noncommodity revenues in these economies increased in line with real GDP at rates that, while higher than those observed in the previous decade, were broadly in line with long-term potential.
The rest of Latin America (Argentina, Bolivia, Ecuador, and Venezuela) also experienced a remarkable fall in public indebtedness during this period (averaging about 45 percentage points of GDP), although starting from much higher levels. This decline was largely driven by the direct effect of the economic boom on output (with GDP growth considerably above long-term potential, except in Bolivia) and by negative real interest rates.4 Although primary balances also played an important role in reducing debt ratios, the extent of savings of the booming revenues appears to have been limited. Indeed, real public expenditure grew at a faster pace than potential GDP and even faster than observed output.
_______ 4 Argentina’s debt restructuring in 2005 was a major factor driving debt ratios down. Bolivia also benefitted from a debt relief program, of roughly 25 percent of GDP, in 2006.
Figure 4.2. Components of Public Debt Dynamics, 2003–12
Main Components1
(Cumulative contributions since 2002, in percent of GDP, simple averages)
83.7
37.5
-80
-60
-40
-20
0
20
40
60
4
24
44
64
84
104
124
144
2002
2007
2012
56.2
33.7
-80
-60
-40
-20
0
20
40
60
-24
-4
16
36
56
76
96
116
2002
2007
2012
66.2
35.1
-80
-60
-40
-20
0
20
40
60
-14
6
26
46
66
86
106
126
2002
2007
2012
Primary balance (rhs) Real GDP growth (rhs)
Real interest rate (rhs) Real exchange rate (rhs)
Other (rhs)² Public debt
Latin America LA 7³ Other LA⁴
50
100
150
200
250
1995
2000
2005
2010
Commodity revenue Non-commodity rev.
Primary expenditure⁶ Real GDP
Potential GDP⁷
50
100
150
200
250
199
5
200
0
200
5
201
0
50
100
150
200
25019
95
2000
2005
2010
Latin America LA7³ Other LA⁴
Sources: IMF International Financial Statistics; and IMF staff calculations.¹Main factors driving public debt dynamics, as identified in IMF's standard DSA framework.²Includes the accumulation of (gross) assets in different types of sovereign wealth funds.³Includes Brazil, Chile, Colombia, Mexico, Paraguay, Peru, and Uruguay.⁴Includes Argentina, Bolivia, Ecuador, and Venezuela. ⁵Data on commodity-related revenues for Ecuador, Mexico, and Venezuela (Chile) are available from 2000 (2005).⁶Expenditure in base year is indexed to the percentage of revenues in that year. ⁷Based on projected growth for 2015–17.
Sub-components of Primary Balance, 1995-12⁵(Index, 2003=100 unless otherwise stated, simple averages in real terms)

4. LATIN AMERICA’S FISCAL AND EXTERNAL STRENGTH: HOW DEPENDENT IS IT ON EXTERNAL CONDITIONS?
39
External Debt
External debt ratios exhibit similar patterns, falling by more than 30 percentage points, on average, during 2003–08 (Figure 4.3), and being accompanied by a sizable increase in foreign assets (nearly 70 percent of GDP on a cumulative basis).5 Since 2009, external debt ratios have remained broadly stable at about 30 percent of GDP.
In the LA7 group, the decline in external indebtedness averaged 25 percentage points of GDP, primarily on account of significant real exchange rate appreciation and external financing in the form of non-debt flows (especially FDI), combined with moderate current account surpluses. The drop for the rest of Latin America was even more remarkable, reaching about 50 percentage points of GDP, although starting from much higher levels. This improvement was mainly explained by large current account surpluses—on
_______ 5 This reflected both public policies oriented to the accumulation of international reserves and assets under sovereign funds as well as private sector foreign savings (e.g., pension funds accumulating assets abroad).
account of highly favorable terms of trade—as well as sizable real exchange rate appreciation.6
External factors played a large role in the strengthening of the region’s fundamentals, reflecting the region’s sensitivity to global conditions.7 Precisely because of such sensitivity, whether the region is well placed to withstand a significant deterioration in the external environment remains an open question. This is studied next.
External Factors and Debt Sustainability
Methodological Approach
We develop a framework that maps how shocks to key global variables affect a set of domestic variables that are the primary drivers of public and external debt dynamics. The framework integrates econometric estimates of this relationship with the IMF’s standard DSA framework (Figure 4.4).8 Then, we evaluate debt dynamics under different scenarios, based on conditional forecasts of the endogenous variables of the econometric model, under alternative paths of the exogenous (global) variables.
Specifically, our focus is on the effect of global variables on five key domestic variables—GDP growth, trade balance, real exchange rate, and sovereign spreads—derived from the estimation of country-specific VAR models of the following (reduced) form:
where is a vector of endogenous variables and is a vector of exogenous variables. The vector
_______ 6 These economies also accumulated large amounts of foreign assets (mostly by the public sector in Bolivia and Ecuador, and by the private sector in Argentina and Venezuela). 7 See, for example, Inter-American Development Bank(2008); Izquierdo and others (2008); and Osterholm and Zettelmeyer (2008). 8 As in standard debt sustainability analysis, the focus of our analysis is the dynamics of gross debt and primary balance. Risks related to financing needs as well as the composition of creditors are beyond the scope of our work.
Figure 4.3. Factors Driving External Debt Dynamics, 2002–12¹ (Percent of GDP, cumulative contributions since 2002, simple averages)
61.9
28.5
-150
-100
-50
0
50
100
-88
-38
12
62
112
162
2002
2007
2012
Real GDP growth (rhs) Non-debt flows (rhs)Real interest rate (rhs) Real exchange rate (rhs)Current account Other (rhs)⁴External debt
Latin America LA 7² Other LA ³
51.5
27.3
-150
-100
-50
0
50
100
-99
-49
2
52
102
152
2002
2007
2012
80.1
30.6
-150
-100
-50
0
50
100
-70
-20
30
80
130
180
2002
2007
2012
Sources: IMF, International Financial Statistics; and IMF staff calculations.¹Main factors driving external debt dynamics, as identified in IMF's standard DSA framework.²Includes Brazil, Chile, Colombia, Mexico, Paraguay, Peru, and Uruguay.³Includes Argentina, Bolivia, Ecuador, and Venezuela.⁴Includes accumulation of foreign assets by public and private sectors.

REGIONAL ECONOMIC OUTLOOK: WESTERN HEMISPHERE
40
includes real GDP growth ( ), the change in the trade balance in percent of GDP (dTBt), and the (log difference of) the real effective exchange rate ( )). The vector includes global real GDP growth ( , the S&P 500 Chicago Board Options Exchange Market Volatility Index (vix) as a proxy for international financial conditions, the (log differences of) agriculture, energy, and metal prices ( , , and respectively), the primary balance in percent of GDP (pb), and the public debt-to-GDP ratio (dp). 9, 10 The VAR models are estimated using quarterly data for the period 1990–2012, from the IMF’s International Financial Statistics (IFS) and World Economic Outlook (WEO), and Haver Analytics. A sovereign spread equation is estimated separately (due to data limitations) to capture the effect of
_______ 9 The VAR model (together with the spread equation) and the debt motion equations capture the key linkages between domestic and external variables. To fully determine the dynamics of debt ratios, however, a few assumptions are necessary. See details in Adler and Sosa (2013). 10 A key feature of our framework is that primary balances and debt levels are included in the VAR to allow feedback effects from these variables to the other domestic variables that determine debt dynamics. Our approach, however, does not entail estimating a fiscal reaction function, as our objective is not to obtain debt paths under fiscal responses that mirror those of the past—which may have been constrained (or sub-optimal)—but rather under broadly unconstrained policies. Primary balances are projected by linking fiscal revenues to commodity prices and output growth, as well as evaluating different exogenous expenditure rules.
external shocks on interest rates. These econometric estimates are then used to obtain forecasts of the domestic variables—conditional on a set of assumed global variables (scenarios)—and thus derive debt dynamics under these different scenarios.
Scenario Analysis
We study four adverse global scenarios—two of them entailing temporary shocks and two with more persistent shocks (see Annex Table A4.1 for details):
i. A temporary financial shock, reflected in a spike of the VIX of similar magnitude than the one observed following the Lehman event, and returning to baseline levels in 2014.
ii. A temporary real shock, entailing a global recession with lower growth and commodity prices during 2013–14, returning to the baseline path afterward.
iii. A protracted global slowdown, characterized by a relatively high level of uncertainty (VIX), lower commodity prices, and lower global growth (all relative to the baseline).
iv. A tail event, with an impact on global variables (VIX, global GDP growth, and commodity prices) of magnitudes similar to those observed after the Lehman event, but somewhat more persistent.
Debt trajectories are constructed by adding the estimated impact of these external shocks to the
Figure 4.4. Integrated Public and External Debt Sustainability Framework
Key Domestic Variables
External Variables
Key Domestic Variables
Interest rate spread
Risk free interest rate
Interest rate spread
Real exchange rate
Financial conditions
Real exchange rate
Real GDP growth
World growthReal GDP growth
Revenues Trade balance Trade balance
Commodity-related revenues
Commodity prices
Other Other revenues
Expenditure
Feedback Feedback
Econometric model
IMF's Public DSA Framework Econometric model IMF's External DSA Framework
Factors Driving Public Debt Dynamics
Factors Driving External Debt Dynamics
Nondebt flows
Public debt-to-
GDP ratio
Interest on existing debt Interest on existing debt
External debt-to-
GDP ratio
Exchange rate valuation effect (on FC debt)
Exchange rate valuation effect (on FC debt)
Real GDP growth Real GDP growth
Primary balanceNon-interest current account balance
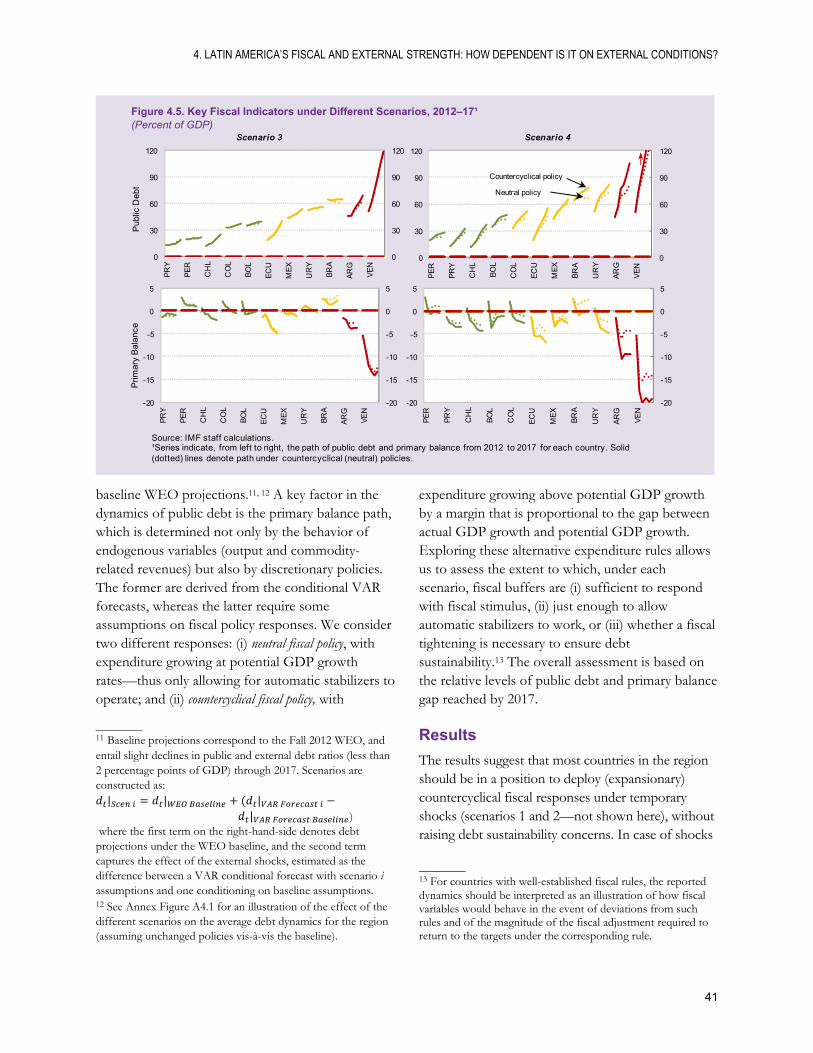
4. LATIN AMERICA’S FISCAL AND EXTERNAL STRENGTH: HOW DEPENDENT IS IT ON EXTERNAL CONDITIONS?
41
baseline WEO projections.11, 12 A key factor in the dynamics of public debt is the primary balance path, which is determined not only by the behavior of endogenous variables (output and commodity-related revenues) but also by discretionary policies. The former are derived from the conditional VAR forecasts, whereas the latter require some assumptions on fiscal policy responses. We consider two different responses: (i) neutral fiscal policy, with expenditure growing at potential GDP growth rates—thus only allowing for automatic stabilizers to operate; and (ii) countercyclical fiscal policy, with
_______ 11 Baseline projections correspond to the Fall 2012 WEO, and entail slight declines in public and external debt ratios (less than 2 percentage points of GDP) through 2017. Scenarios are constructed as: | | |
| ) where the first term on the right-hand-side denotes debt projections under the WEO baseline, and the second term captures the effect of the external shocks, estimated as the difference between a VAR conditional forecast with scenario i assumptions and one conditioning on baseline assumptions. 12 See Annex Figure A4.1 for an illustration of the effect of the different scenarios on the average debt dynamics for the region (assuming unchanged policies vis-à-vis the baseline).
expenditure growing above potential GDP growth by a margin that is proportional to the gap between actual GDP growth and potential GDP growth. Exploring these alternative expenditure rules allows us to assess the extent to which, under each scenario, fiscal buffers are (i) sufficient to respond with fiscal stimulus, (ii) just enough to allow automatic stabilizers to work, or (iii) whether a fiscal tightening is necessary to ensure debt sustainability.13 The overall assessment is based on the relative levels of public debt and primary balance gap reached by 2017.
Results
The results suggest that most countries in the region should be in a position to deploy (expansionary) countercyclical fiscal responses under temporary shocks (scenarios 1 and 2—not shown here), without raising debt sustainability concerns. In case of shocks
_______ 13 For countries with well-established fiscal rules, the reported dynamics should be interpreted as an illustration of how fiscal variables would behave in the event of deviations from such rules and of the magnitude of the fiscal adjustment required to return to the targets under the corresponding rule.
Figure 4.5. Key Fiscal Indicators under Different Scenarios, 2012–17¹ (Percent of GDP)
0
30
60
90
120
0
30
60
90
120
PE
R
PR
Y
CH
L
BO
L
CO
L
EC
U
ME
X
BR
A
UR
Y
AR
G
VE
N
Countercyclical policy
Neutral policy
Source: IMF staff calculations.¹Series indicate, from left to right, the path of public debt and primary balance from 2012 to 2017 for each country. Solid (dotted) lines denote path under countercyclical (neutral) policies.
Scenario 3 Scenario 4
0
30
60
90
120
0
30
60
90
120
PR
Y
PE
R
CH
L
CO
L
BO
L
EC
U
ME
X
UR
Y
BR
A
AR
G
VE
N
Pub
lic D
ebt
Prim
ary
Bal
ance
-20
-15
-10
-5
0
5
-20
-15
-10
-5
0
5
PE
R
PR
Y
CH
L
BO
L
CO
L
EC
U
ME
X
BR
A
UR
Y
AR
G
VE
N
-20
-15
-10
-5
0
5
-20
-15
-10
-5
0
5
PR
Y
PE
R
CH
L
CO
L
BO
L
EC
U
ME
X
UR
Y
BR
A
AR
G
VE
N

REGIONAL ECONOMIC OUTLOOK: WESTERN HEMISPHERE
42
with more persistent effects (scenarios 3 and 4), countries can be broadly classified into three different groups (Figure 4.5):
A first group of countries (Venezuela and, to a lesser extent, Argentina) that would need to strengthen their current fiscal position considerably; otherwise they may have to undertake sizable (procyclical) fiscal consolidation in the face of adverse shocks, including moderate ones. This reflects both their sensitivity to external conditions and a relatively weaker initial fiscal position.
A second group (Brazil, Ecuador, Mexico, and Uruguay) that could manage moderate shocks but would benefit from building additional fiscal space to be in a position to deploy countercyclical policies (and even neutral policies in some cases) under more adverse scenarios, without reaching debt and/or primary balance levels that could raise concerns about fiscal sustainability.14
_______ 14 In countries with well-established fiscal rules, adherence to the rule after a temporary deviation would ensure that public debt remains on a sustainable path. In some cases, however, returning to the rule’s fiscal targets could entail significant fiscal effort.
A third group (Bolivia, Chile, Paraguay, Peru, and to a lesser extent Colombia) with a relatively solid fiscal position to withstand sizable external shocks—even responding with expansionary policies—without putting fiscal solvency at risk.
On the external front, even under the more extreme scenarios (3 and 4), countries in the region appear to be in a position to maintain external debt sustainability (Figure 4.6).15, 16 A key factor driving this result is that current accounts tend to improve in the face of large negative external shocks (especially financial ones). Although this macroeconomic response does not appear to have negative implications for debt sustainability, it may still have adverse welfare implications, but this issue is beyond the scope of this study.
Conclusions Latin America experienced a remarkable improvement in key macroeconomic fundamentals over the last decade, on the back of a highly favorable external environment. With prospects of less benign global conditions ahead, however, the region’s fundamentals could change drastically. This chapter examined how important these changes could be, thus informing the discussion on whether current levels of policy buffers (especially fiscal) are adequate to withstand a deterioration of the global environment.
The results indicate that, while external sustainability does not appear to be, at this point, a source of concern, fiscal space may still be limited in several countries. These results suggest that the region would benefit from building further fiscal space, while favorable conditions last, to be in a position to actively use fiscal policy should the external environment deteriorate markedly.
_______ 15 An exception is Venezuela, where external sustainability concerns could arise in case of a tail event. 16 Under both scenarios (and even assuming active policy responses), debt levels would remain moderate and current account balance gaps would be either closed or positive.
Figure 4.6. External Indicators under Different Scenarios, 2012–17¹ (Percent of GDP)
-7
-2
3
8
BR
AP
RY
CO
LE
CU
PE
RM
EX
BO
LU
RY
AR
GC
HL
VE
N
0
20
40
60
80
BR
AP
RY
CO
LE
CU
PE
RM
EX
BO
LU
RY
AR
GC
HL
VE
NB
RA
EC
UP
AR
CO
LM
EX
PE
RU
RY
AR
GB
OL
CH
LV
EN
Source: IMF staff calculations.¹Series indicate, from left to right, the path of external debt and non-interest current account balance gap from 2012 to 2017 for each country. Solid (dotted) lines denote path under countercyclical (neutral) policies.
Ext
erna
l Deb
tN
on-I
nter
estC
urre
nt
Acc
ount
Bal
ance
BR
AE
CU
PA
RC
OL
ME
XP
ER
UR
YA
RG
BO
LC
HL
VE
N
Scenario 3 Scenario 4

4. LATIN AMERICA’S FISCAL AND EXTERNAL STRENGTH: HOW DEPENDENT IS IT ON EXTERNAL CONDITIONS?
43
Annex 4.1
1 2 3 4
2013–17 avg.
2013: Lehman-like 2014–17: BL-1%
Table A4.1. Global Variables under Alternative Scenarios
Global Variables
ScenariosBaseline (BL)
Financial Shock¹
Global Recession²
Protracted Global
S lowdown³Tail
Event⁴
World GDP growth (Percent) 3.6 BL2013 : BL-1.5% 2014: BL-0.5% 2015–17: BL
BL-1%
2013–14 : BL-100bps 2015–17: BL-50bps
VIX 172013 : Lehman-like 2014–17: = BL
BL BL + 4 pts2013 : Lehman-like 2014–17: BL+2pts(Points)
10-year U.S . Treasury interest rate (Basis points)
3002013 : BL–100bps 2014-17: BL
√ BL - 50bps
√ 2013 : BL-25%⁷ 2014–17: BL
BL-15% 2013 : BL-45% 8
2014–17: BL-10%
Food -10⁵ BL 2013 : BL-10%⁷ 2014–17: BL
BL-7%
BL-15% 2013 : BL-35% 8
2014–17: BL-10%
Non debt flowsby country⁶ √ BL BL* 0.7
2013 : BL+2008-09 change 2014–17: BL*0.8
Commodity prices
Metals -8⁵ √ 2013 : BL-20%⁷ 2014–17: BL
2013 : BL-15% 8
2014–17: BL-5%
Energy -8⁵
⁷Reported gap vis-à-vis baseline is reached by end-2013. Prices recover gradually afterwards to reach baseline by end-2014.
⁸Reported gap vis-à-vis baseline is reached by 2013:Q2. Prices recover gradually afterwards to reach new path by end-2014.
Source: Adler and Sosa (2013).¹Temporary financial shock affecting 2013 only. Financial variables return to projected path under the baseline in 2014.²Temporary real shock (commodity prices and world growth) in 2013–14. Variables return to projected path under the baseline in 2015.³Global slowdown over the whole forecast horizon.
⁴Lehman-like event in 2013–14, with protracted impact on global growth, commodity prices, and the VIX.
⁵ Relative to 2012 level.
⁶As projected by country desks for each country.

REGIONAL ECONOMIC OUTLOOK: WESTERN HEMISPHERE
44
Figure A4.1. Latin America: Factors Driving Public and External Debt Dynamics under Alternative Global Scenarios, 2003–171
(Contributions to change in debt-to-GDP ratio, in percent of GDP, simple average)
28.5 27.5
‐20
-10
0
10
20
-1
9
19
29
39
49
59
2003 2006 2009 2012 2015
Current account (exc. Interests, rhs) Interest rate (rhs) Real GDP growth *rhs) Real Exchange Rate (rhs)
Other (rhs) Non-debt flows (rhs) External debt
WEO Baseline 2 Scenario 1 3 Scenario 2 3 Scenario 3 3 Scenario 4 3
28.0
27.5
-20
-10
0
10
20
9
19
29
39
49
2012 2015
Baseline
Scen
28.5
27.5
-20
-10
0
10
20
9
19
29
39
49
2012 2015
33.7
27.5
-20
-10
0
10
20
9
19
29
39
49
2012 2015
33.5
27.5
-20
-10
0
10
20
9
19
29
39
49
2012 2015
External Debt
62.3
35.1 34.2
-40
-20
0
20
40
-5
5
15
25
35
45
55
65
75
2003 2006 2009 2012 2015
Non-commodity PB (rhs) Real interest rate (rhs) Real GDP growth (rhs) Real Exchange Rate (rhs)
Other (rhs) Commodity Revenue (rhs) Public Debt (lhs)
46
34.2
-20
-15
-10
-5
0
5
10
15
20
-5
5
15
25
35
45
55
65
75
2012 2015
Scen
Baseline
Public Debt
WEO Baseline 2 Scenario 1 3 Scenario 2 3
42
-20
-15
-10
-5
0
5
10
15
20
-5
5
15
25
35
45
55
65
75
2012 2015
48
-20
-15
-10
-5
0
5
10
15
20
-5
5
15
25
35
45
55
65
75
2012 2015
Scenario 3 3
57
-20
-15
-10
-5
0
5
10
15
20
-5
5
15
25
35
45
55
65
75
2012 2015
Scenario 4 3
-6
-4
-2
0
2
2012 2017
VAR Scenario 1 VAR Scenario 2 VAR Scenario 3 VAR Scenario 4
Real GDP Growth(percent)
-15
-11
-7
-3
1
5
2012 2017
Real GDP 4/(Index)
-12
-8
-4
0
4
2012 2017
Real Exchange Rate 4/ (Index)
-3
-1
1
2012 2017
Current Account(exc ints., % GDP)
-4
-3
-2
-1
0
1
2
2012 2017
Primary Balance(percent of GDP)
Real Interest Rate (percent)
Sovereign Spread percent)
-1
0
1
2012 2017
Key Domestic Variables(deviations from baseline)
-1
0
1
2
3
2012 2017Sources: IMF, Internatonal Financial Statistics; and IMF staff calculations.1 Simple average for Argentina, Bolivia, Brazil, Chile, Colombia, Ecuador, Mexico, Peru, Uruguay, and Venezuela.2 Country desk projections (based on WEO baseline assumptions).3 Based on differential between VAR forecasts and VAR baseline. Bars denote contributions of different factors to the deviation of the debt ratios from the baseline.4 Deviation in percent of baseline.

4. LATIN AMERICA’S FISCAL AND EXTERNAL STRENGTH: HOW DEPENDENT IS IT ON EXTERNAL CONDITIONS?
45
Box 4.1. Optimal Sovereign Debt Levels: The Information in Sovereign Spreads
Although there is growing consensus about the desirability of low sovereign debt levels—to weather external and domestic shocks and allow for countercyclical fiscal policy—there is still significant debate about what the “optimal” levels of sovereign debt should be. This issue has become increasingly important for much of Latin America, as most countries have witnessed significant reductions in their public debt (and spreads) over the last decade (Figure A), and questions have been raised on whether further consolidation efforts are warranted. Our analysis suggests that such consolidations are optimal (maximize welfare), and that countries still facing significant sovereign risk would benefit from further consolidation. The analysis complements work by Adler and Sosa (2013), who assess the desirability of consolidation from the perspective of preventing adverse debt dynamics under scenarios of large external shocks.
We use a structural model to assess welfare under government’s commitment to different (future) levels of sovereign debt, where sovereign spreads in turn depend on the expected future debt levels. The model is calibrated to capture the historical relationship between the levels of aggregate income, sovereign debt, and spreads in emerging economies. Thus, model predictions match the average levels of sovereign debt and spread, the countercyclicality of spreads, and the implied procyclicality of sovereign borrowing in emerging economies.
The relationship between sovereign debt and spread levels varies widely across countries, reflecting idiosyncratic country characteristics (Figure A). This indicates that optimal debt levels can vary widely across countries. That said, we find that optimal debt levels are always associated with low sovereign spreads (around 100 basis points, Figure B). This implies that countries with sovereign spreads much higher than this threshold could benefit from further fiscal consolidation, independently from their debt level.
When sovereign spreads are high, reducing debt increases welfare. This would be especially so if sovereigns can commit to lower future debt levels through a gradual and smooth consolidation path, as the expectation of lower future debt levels allows the government to pay a lower spread today.1 Our findings suggest that credible fiscal rules can produce sizable welfare gains. For instance, announcing a fiscal rule that would reduce public debt by 18 points of aggregate income over 9 years could deliver a drop in sovereign spreads of 690 basis points (Figure C) and a welfare gain equivalent to up to a 0.3 percent permanent increase in consumption. Much of this debt reduction arises automatically from the lower spreads.
_______ Note: This box was prepared by Juan Carlos Hatchondo (Indiana University and Richmond Fed), Leonardo Martinez, and Francisco Roch (both IMF) and based on Hatchondo and others (2012). 1 Our analysis is silent on how this commitment can be achieved. Institutions that improve commitment to fiscal rules (Schaechter and others, 2012) and floating rate sovereign debt instruments (Hatchondo and others, 2011) may help committing to sovereign debt levels that produce a low sovereign premium.
ARG
BRACHL
ECU
MEXPER
URY
VEN
BOL (12)
0
200
400
600
800
1000
1200
1400
1600
1800
2000
0 20 40 60
EM
BIG
Sp
read
s (
basi
s p
oint
s)
Gross general government debt(Percent of GDP)
Figure A. Latin America: Evolution of Sovereign Debt and Spreads, 2000–12
Figure B. Spreads and Welfare Gains for different Debt Limits1
1 Welfare gains (consumption compensation) are for an economy without initial debt and with trend income.
Figure C. Sovereign Debt and Spread Dynamics
0.0
0.1
0.2
0.3
0.4
0.5
0.6
0
100
200
300
400
500
600
700
No Limit 35 30 25 20
Wel
fare
ga
in
Av
era
ge
Sp
read
(ba
sis
po
ints
)
Debt limit (Percent of trend GDP)
0
100
200
300
400
500
600
700
800
900
0.00
0.05
0.10
0.15
0.20
0.25
0.30
0.35
0.40
0.45
0 1 2 3 4 5 6 7 8 9
Sov
erei
ng
spre
ad (
basi
s p
oint
s)
Sov
erei
gn
deb
t le
vel (
Pe
rcen
t o
f inc
ome
)
Years after the fiscal rule announcement
Debt level without rule
Debt level with rule
Spread without rule
Spread with rule


47
5. Is Latin America Saving Its Terms-of-Trade Windfall? A Metric
On the back of a sizable terms-of-trade boom, Latin America’s fundamentals have improved markedly during the last decade. This has fed a sense of complacency that this time the macroeconomic response has been indeed different. Against this background, we propose a simple metric to quantify the terms-of-trade income windfall of the recent boom, and compare it with previous episodes. We find that while the recent terms-of-trade shock is not much larger than those observed during the 1970s, the associated income windfall has been far greater. Moreover, although aggregate saving increased more than in past episodes, the share of the windfall saved appears to be smaller. This suggests that stronger fundamentals reflect mostly the sheer size of the recent shock rather than a greater effort to save the windfall. Finally, our estimates suggest that, historically, using the windfall to increase domestic investment has been less beneficial to post-boom income than saving it in foreign assets. This raises questions about the recent weakening of external current accounts in Latin America.
Introduction Commodity exporting countries in Latin America have benefited strongly from the commodity price boom that began around 2002. Along with broadly prudent policies, the associated terms-of-trade boom allowed most countries to markedly strengthen their public and external sectors’ fundamentals (Figure 5.1). This has fed a sense that this time the macroeconomic response to the terms-of-trade shock has been different (and more prudent) than in past episodes. Whether that is the case remains an open question, which we address below.
The Terms-of-Trade Windfall—a Historical Perspective To shed some light on this issue, we study episodes of large terms-of-trade booms from 1970 to the
–––––– Note: Prepared by Gustavo Adler and Nicolas E. Magud, with excellent research assistance from Anayo Osueke. See Adler and Magud (2013) for technical details.
present, for a sample of 180 countries. The episodes are defined as those events where countries experience a cumulative terms-of-trade increase of at least 15 percent, and at least 3 percent per year on average. These simple thresholds identify 270 episodes, encompassing low-income countries, emerging market economies, and advanced economies. A first glance at the historical data shows that, while sizable, Latin America’s recent terms-of-trade boom has not been larger than those seen in the 1970s. Furthermore, the region’s recent boom is comparable only with those of oil-exporting countries in the Middle East and North Africa (MENA) region (Figure 5.2). The income impact of these terms-of-trade shocks, however, has increased over the course of the last four decades.
A Metric of the Terms-of-Trade Windfall
To quantify the impact of terms-of-trade variations on aggregate income, we propose a simple metric. The metric focuses on the difference between actual
Figure 5.1. Emerging Latin America: Terms of Trade and Selected Fundamentals, 2002–12¹ (Simple averages and 20th and 80th percentiles)
2002 05 08 11
Average 20th 80th
Terms of trade²(Index,
2002=100)
0
20
40
60
80
100
2002 05 08 1190
120
150
180
210
2002 05 08 11
Sources: IMF, International Financial Statistics; and IMF country desks.¹Emerging Latin America includes Argentina, Bolivia, Brazil, Chile, Colombia, Ecuador, Mexico, Paraguay, Peru, Uruguay, and Venezuela. ²Of goods and services.
Grossgovernment debt (percent of GDP,
right scale)
Gross external debt
(percent of GDP, right scale)

REGIONAL ECONOMIC OUTLOOK: WESTERN HEMISPHERE
48
real (gross domestic) income and a measure of real income at pre-boom terms of trade (see Figure 5.3 and Annex 5.1). This metric of income windfall takes into account the degree of trade openness of the economy and quantifies the ‘extra’ income arising from the terms-of-trade price-effects only (as a share of what income would have been had no shock occurred). It provides a lower bound estimate of the effect of the shock.1
This is a key innovation relative to other recent studies of the impact of external factors on Latin American economies, which have focused on the effect on output, rather than on income.2 The importance of focusing on income is evident from Figure 5.3. This is especially true for countries which output has not grown faster during the recent terms-of-trade boom than previously anticipated (e.g., Bolivia and Chile), in part because of the deployment of countercyclical policies.
A comparison of the cumulative income windfall across episodes points to a much larger effect in the recent episode than in past ones (Figure 5.4) on account of the higher degree of trade openness and
_______ 1 The measure is a conservative estimate as it ignores the effect of these exogenous shocks on output levels. See Adler and Magud (2013) for estimates that include the latter effect as well. 2 See, for example, IADB (2008), Izquierdo et al (2008), Osterholm and Zettelmeyer (2008), and Cespedes and Velasco (2011).
the longer duration of the boom. Estimates of the income impact are sizable, implying an average increase in income of close to 15 percent per year during the recent episode. Furthermore, given the length of the latter, these estimates mean an average of about 100 percent of a year’s GDP cumulative
Figure 5.3. Selected Latin American Countries–Recent Episodes: Real Domestic Income¹ (Index T-1 = 1)
0.9
1.4
1.9
2.4
T-3
T-1
T+
1T
+3
T+
5T
+7
Trend³
Actual²
At pre-boom ToT
T-3
T-1
T+
1T
+3
T+
5T
+7
T-3
T-1
T+
1T
+3
T+
5T
+7
T-3
T-1
T+
1T
+3
T+
5T
+7
0.9
1.4
1.9
2.4
T-3
T-1
T+
1T
+3
T+
5T
+7
T-3
T-1
T+
1T
+3
T+
5T
+7
T-3
T-1
T+
1T
+3
T+
5T
+7
T-3
T-1
T+
1T
+3
T+
5T
+7
Bolivia (03) Brazil (06) Chile (03)Argentina (03)4
Colombia (04) Ecuador (05) Peru (03) Venezuela (03)
Source: IMF staff estimates.¹ Episode first year is reported in parenthesis. ²Real gross domestic income, as defined in Annex 5.1.³Real gross domestic income projected at long-term growth rate (average of 1970-2012).4 Calculations are based on official data.
Figure 5.2. Emerging Latin America and Selected Regions: Terms-of-Trade Booms, 1970–2012¹ (Percentage change, cumulative during upswing)
2 0 0 0
SAU
KUW
RUS
BEL
UKR
ROM
IDN
SRI
1975
PER
ECU
MEX
COLBOL
CHL
1985 199019800
20
40
60
80
100
120
140
1970
ECU
BOL
ARG
URY
PER
1995
VEN
2000
VEN
BOL
CHL
ARG
PER
ECU
BRA
PAR
COL
PAR
Sources: IMF, International Financial Statistics; and IMF staff estimates.¹Cumulative percentage change in terms of trade (of goods and services) from start to peak of each identified episode (that meets the criteria of at least 15 percent cumulative and 3 percent average increase). Episodes are grouped in 5-year windows according to the date of their first year. Dotted lines indicate group averages.²Emerging Latin America includes Argentina, Bolivia, Brazil, Chile, Colombia, Ecuador, Mexico, Paraguay, Peru, Uruguay, and Venezuela.
EM EUR AE MENA Oil Exporters
Emerging Latin America²2000
NOR
AUS
CAN
EM Asia
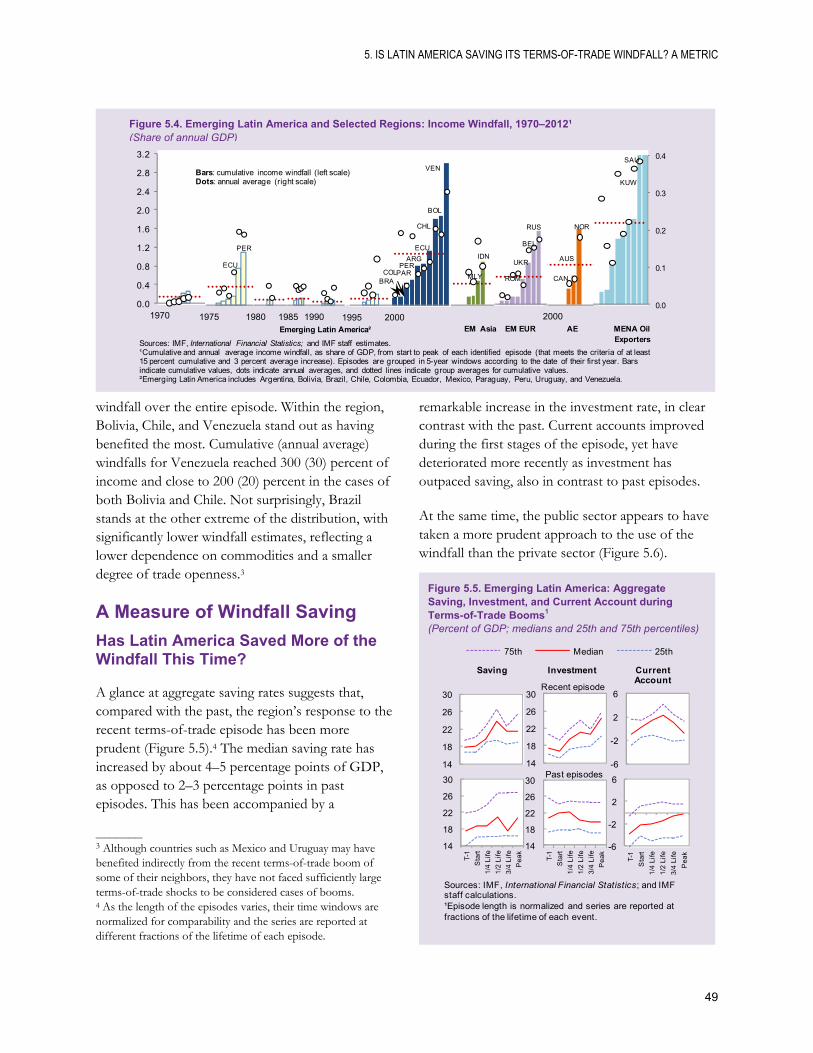
5. IS LATIN AMERICA SAVING ITS TERMS-OF-TRADE WINDFALL? A METRIC
49
windfall over the entire episode. Within the region, Bolivia, Chile, and Venezuela stand out as having benefited the most. Cumulative (annual average) windfalls for Venezuela reached 300 (30) percent of income and close to 200 (20) percent in the cases of both Bolivia and Chile. Not surprisingly, Brazil stands at the other extreme of the distribution, with significantly lower windfall estimates, reflecting a lower dependence on commodities and a smaller degree of trade openness.3
A Measure of Windfall Saving
Has Latin America Saved More of the Windfall This Time?
A glance at aggregate saving rates suggests that, compared with the past, the region’s response to the recent terms-of-trade episode has been more prudent (Figure 5.5).4 The median saving rate has increased by about 4–5 percentage points of GDP, as opposed to 2–3 percentage points in past episodes. This has been accompanied by a
_______ 3 Although countries such as Mexico and Uruguay may have benefited indirectly from the recent terms-of-trade boom of some of their neighbors, they have not faced sufficiently large terms-of-trade shocks to be considered cases of booms. 4 As the length of the episodes varies, their time windows are normalized for comparability and the series are reported at different fractions of the lifetime of each episode.
remarkable increase in the investment rate, in clear contrast with the past. Current accounts improved during the first stages of the episode, yet have deteriorated more recently as investment has outpaced saving, also in contrast to past episodes.
At the same time, the public sector appears to have taken a more prudent approach to the use of the windfall than the private sector (Figure 5.6).
Figure 5.5. Emerging Latin America: Aggregate Saving, Investment, and Current Account during Terms-of-Trade Booms1 (Percent of GDP; medians and 25th and 75th percentiles)
14
18
22
26
30
75th Median 25th
Saving Investment CurrentAccount
14
18
22
26
30
T-1
Sta
rt
1/4
Lif
e
1/2
Lif
e
3/4
Lif
e
Pe
ak
Recent episode
14
18
22
26
30
T-1
Sta
rt
1/4
Lif
e
1/2
Lif
e
3/4
Lif
e
Pe
ak
14
18
22
26
30
-6
-2
2
6
-6
-2
2
6
T-1
Sta
rt
1/4
Lif
e
1/2
Lif
e
3/4
Lif
e
Pe
ak
Sources: IMF, International Financial Statistics; and IMF staff calculations.¹Episode length is normalized and series are reported at fractions of the lifetime of each event.
Past episodes
Figure 5.4. Emerging Latin America and Selected Regions: Income Windfall, 1970–2012¹ (Share of annual GDP)
2 0 0 0
NOR
AUS
CAN
2 0 0 0
RUS
UKR
ROM
BEL
2 0 0 0
IDN
MLY
0.0
0.1
0.2
0.3
0.4
2 0 0 0
SAU
KUW
1975
PER
ECU
0.0
0.4
0.8
1.2
1.6
2.0
2.4
2.8
3.2
1970 1985 1990 1995 2000
VEN
BOL
CHL
ARGPER
PARCOL
ECU
BRA
1980
Bars: cumulative income windfall (left scale)Dots: annual average (right scale)
Sources: IMF, International Financial Statistics; and IMF staff estimates.¹Cumulative and annual average income windfall, as share of GDP, from start to peak of each identified episode (that meets the criteria of at least 15 percent cumulative and 3 percent average increase). Episodes are grouped in 5-year windows according to the date of their first year. Bars indicate cumulative values, dots indicate annual averages, and dotted lines indicate group averages for cumulative values.²Emerging Latin America includes Argentina, Bolivia, Brazil, Chile, Colombia, Ecuador, Mexico, Paraguay, Peru, Uruguay, and Venezuela.
EM Asia EM EUR AE MENA Oil Exporters
Emerging Latin America²
2000

REGIONAL ECONOMIC OUTLOOK: WESTERN HEMISPHERE
50
These measures of average saving and investment rates, however, are affected by the size of the income windfall and do not inform us about how much of the windfall has been saved (i.e., the ‘marginal’ rates). To get a sense of the latter, we compute marginal saving (investment) rates, which measure the increase in saving (investment) as a proportion of the estimated income windfall (see Annex 5.1 for details).
Subsequently, we compute the marginal rates of domestic and foreign saving (i.e., how much is allocated to domestic capital formation and to foreign asset accumulation, respectively). Key findings are summarized as follows:
Latin America’s marginal saving rates have been lower in the recent episode than in past ones. This suggests that the ‘effort’ to save the windfall has not been necessarily stronger this time (Figure 5.7).
Furthermore, a glance at the dynamics of marginal saving rates (not shown) point to a gradual decline over time.5
At the same time, a growing share of the windfall is being allocated to domestic capital formation rather than to improving countries’ net foreign asset position (via a strengthening of the current account). This pattern may be consistent with a need to accumulate physical capital. Yet, it remains an empirical question whether domestic investment or foreign asset accumulation is preferable (in terms of increasing post-boom income) during periods of terms-of-trade booms. This is studied next.
Windfall Saving and Post-Boom Income
We assess the effects of different saving patterns during the boom on the level of post-boom income by way of a cross-section econometric exercise.
_______ 5 These dynamics may reflect changing perceptions of the persistence of this terms-of-trade shock, possibly being increasingly perceived as more persistent, and thus affecting saving and investment decisions over time. We do not assess the optimality of these changes in this chapter.
The following specification is estimated using Ordinary Least Squares (OLS):
where denotes real gross national disposable income for episode i, measured 5 years after the boom’s peak, and ws stands for the corresponding windfall saving.
We use RGNDY, as it is a broad measure of real income, which includes net factor and financial income from abroad (the income balance of the external current account). As such, it takes into account the net income associated with changes in the country’s net external asset position.
Figure 5.7. Latin America and Other Groups-Current Episode: Windfall Saving1 (Cumulative, as a share of income windfall; medians and 25th and 75th percentiles)
Figure 5.6. Emerging Latin America: Saving, Investment and Balance (In percent of GDP, change from T-1, group simple averages)
-3
0
3
6
T-1
Sta
rt
1/4
Lif
e
1/2
Lif
e
3/4
Lif
e
Pea
k
Public Sector
PrivateSector
Aggregate
T-1
Sta
rt
1/4
Life
1/2
Life
3/4
Life
Pea
k
T-1
Sta
rt
1/4
Life
1/2
Life
3/4
Life
Pea
k
Saving Investment Saving - Investment
Sources: IMF, International Financial Statistics; and IMF staff estimations.
0.45
-0.5
0.0
0.5
1.0
1.5
LA Last
75th perc.
25th perc.
Median
LA Past
0.80
Other EMs
0.51
Adv. Econ.
0.52
MENA Oil exp.
0.85
Sources: IMF, International Financial Statistics; and IMF staff estimations.1Marginal savings rates as defined in Annex 5.1.

5. IS LATIN AMERICA SAVING ITS TERMS-OF-TRADE WINDFALL? A METRIC
51
Regressions include a number of country-specific controls X (e.g., terms-of-trade, pre-boom growth and de facto exchange rate regime) and global controls Z (e.g., U.S. real interest rates and world GDP growth), which are measured as averages over the 5 years after the boom. We also control for the level of real income at the peak of the boom. To assess the effects of domestic versus foreign saving, the regression is subsequently modified, decomposing the contribution of each of them, as follows:
α β wsD γwsF Θ X Ω Z ε
where wsD and wsF denote windfall saving allocated to (domestic) investment and foreign assets, respectively. Finally, a Latin America dummy and its interaction with the windfall saving measures are included in alternative specifications to study if the effects have been different for the region.
Results reveal, as expected, that a higher windfall saving (during the boom) increases post-boom real income (Table 5.1, column 1). More important, the composition of the windfall saving matters. Results (column 2) point to a substantially higher payoff from allocating saving to foreign assets than to domestic investment (despite the fact that the sample is mostly composed of developing economies).6 These results appear to be particularly strong for Latin America (columns 3 and 4), likely reflecting a history of poor performance following terms-of-trade booms in previous decades. While conditions may be different this time, including because of more flexible policy frameworks, these results suggest that, in the current context, the deteriorating external current account balances in Latin America could be a source of concern worth monitoring.
While Latin America’s recent terms-of-trade boom is of similar magnitude to those of the 1970s, the associated income windfall has been
_______ 6 This result may reflect that the abundance arising from large terms-of-trade booms often lead to misallocation of resources, or that weak underlying current account positions end up being a drag on growth as terms-of-trade booms revert.
Concluding Remarks The chapter presented simple metrics of windfall income and saving that allow to compare terms-of-trade episodes across regions and time, and to assess the effects of saving the windfall. The analysis provides some interesting insights:
much larger. This reflects higher trade openness and longer persistence of the shock.
Sizable increases in aggregate saving rates in the recent episode, as opposed to past episodes, suggest a more prudent response this time around. At the same time, estimates of marginal saving rates suggest a weaker effort this time, thus implying that the observed improvement in fundamentals is mostly driven by the sheer size of the income windfall.
Notwithstanding the above, Latin America’s governments seem to have been more prudent in saving the windfall than the private sector.
Finally, econometric evidence suggests that, while savings pay off by increasing post-boom income, its allocation matters. In previous episodes, foreign savings appear to have delivered higher post-boom income than domestic savings. Hence, the current weakening of external current account balances in Latin America—even if driven by higher domestic investment—warrants a close monitoring.
Table 5.1. Effects of Windfall Saving on Post-Boom Real Income¹
Windfall saving 0.12 *** 0.14 ***
Domestic w indfall saving 0.06 0.16
Foreign w indfall saving 0.13 *** 0.14 ***
Dummy Latin America -2.67 -1.46
Windfal saving * dummy LA -0.24 *
Domestic saving * dummy LA -0.43 *
Foreign saving * dummy LA 0.00
Constant 8.17 8.22 9.98 11.26
Observations 156 155 156 155Adjusted R2 0.63 0.64 0.64 0.64
F-probability 0.000 0.000 0.000 0.000
Source: Authors' estimations.Confidence level: (*) denotes 10 percent, (**) 5 percent, and (***) 1 percent.
Real Income 5 years after Peak
¹ OLS estimation based on cross-section of terms-of-trade boom episodes. Controls are omitted in the table ow ing to space limitations.
(4)(3)(2)(1)
Dependent Variable:
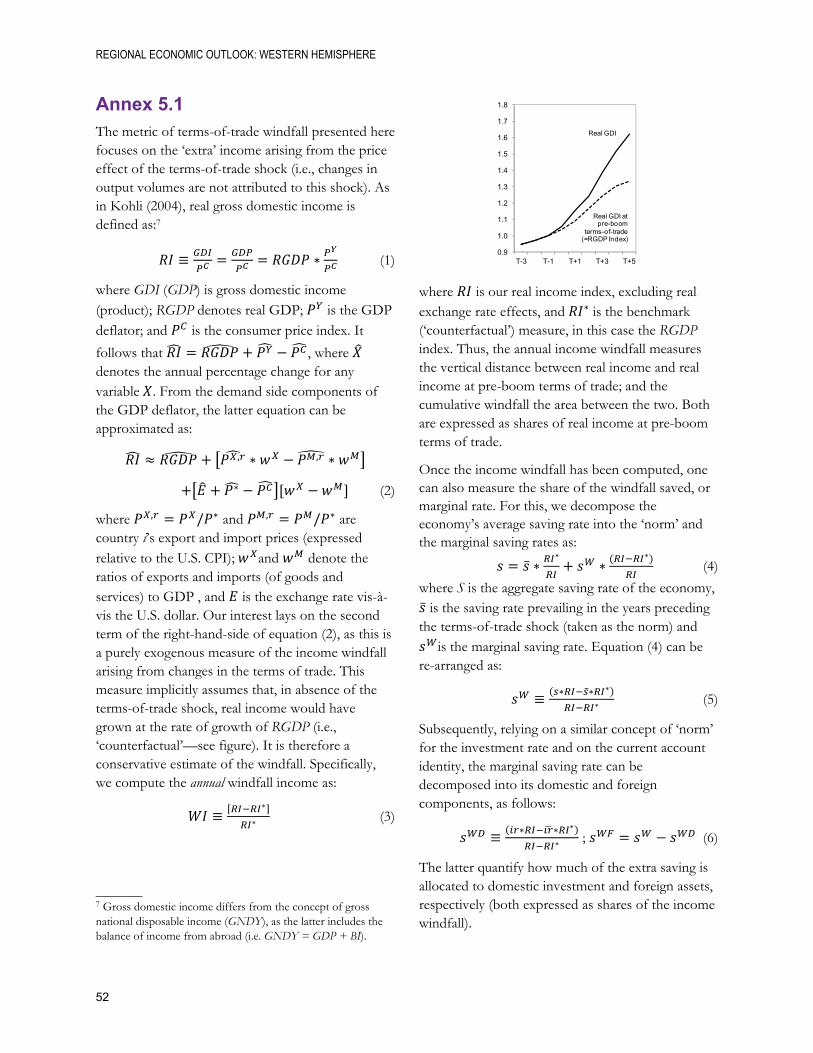
REGIONAL ECONOMIC OUTLOOK: WESTERN HEMISPHERE
52
Annex 5.1 The metric of terms-of-trade windfall presented here focuses on the ‘extra’ income arising from the price effect of the terms-of-trade shock (i.e., changes in output volumes are not attributed to this shock). As in Kohli (2004), real gross domestic income is defined as:7
(1)
where GDI (GDP) is gross domestic income (product); RGDP denotes real GDP; is the GDP deflator; and is the consumer price index. It
follows that , where denotes the annual percentage change for any variable . From the demand side components of the GDP deflator, the latter equation can be approximated as:
, ,
(2)
where , / and , / are country i’s export and import prices (expressed relative to the U.S. CPI); and denote the ratios of exports and imports (of goods and services) to GDP , and is the exchange rate vis-à-vis the U.S. dollar. Our interest lays on the second term of the right-hand-side of equation (2), as this is a purely exogenous measure of the income windfall arising from changes in the terms of trade. This measure implicitly assumes that, in absence of the terms-of-trade shock, real income would have grown at the rate of growth of RGDP (i.e., ‘counterfactual’—see figure). It is therefore a conservative estimate of the windfall. Specifically, we compute the annual windfall income as:
(3)
_______ 7 Gross domestic income differs from the concept of gross national disposable income (GNDY), as the latter includes the balance of income from abroad (i.e. GNDY = GDP + BI).
where is our real income index, excluding real exchange rate effects, and is the benchmark (‘counterfactual’) measure, in this case the RGDP index. Thus, the annual income windfall measures the vertical distance between real income and real income at pre-boom terms of trade; and the cumulative windfall the area between the two. Both are expressed as shares of real income at pre-boom terms of trade.
Once the income windfall has been computed, one can also measure the share of the windfall saved, or marginal rate. For this, we decompose the economy’s average saving rate into the ‘norm’ and the marginal saving rates as:
(4)
where S is the aggregate saving rate of the economy, is the saving rate prevailing in the years preceding
the terms-of-trade shock (taken as the norm) and is the marginal saving rate. Equation (4) can be
re-arranged as:
(5)
Subsequently, relying on a similar concept of ‘norm’ for the investment rate and on the current account identity, the marginal saving rate can be decomposed into its domestic and foreign components, as follows:
; (6)
The latter quantify how much of the extra saving is allocated to domestic investment and foreign assets, respectively (both expressed as shares of the income windfall).
0.9
1.0
1.1
1.2
1.3
1.4
1.5
1.6
1.7
1.8
T-3 T-1 T+1 T+3 T+5
Real GDI at pre-boom
terms-of-trade(=RGDP Index)
Real GDI
53
References
Adler, G., and N. Magud, 2013, “Four Decades of
Terms-of-Trade Booms: A New Metric of Income Windfall and Saving Investment Patterns,” IMF Working Paper, forthcoming (Washington: International Monetary Fund).
Adler, G., and S. Sosa, 2013, “External Conditions and Debt Sustainability in Latin America,” IMF Working Paper No. 13/27 (Washington: International Monetary Fund).
Acevedo, S., A. Cebotari, K. Greenidge, G. Kim, M. Mrkaic, and S. Snudden, 2013, “Caribbean: In Search of Lost Competitiveness,” forthcoming IMF Working Paper (Washington: International Monetary Fund).
Barro, Robert, and Jong-Wha Lee, 2010, “A New Data Set of Educational Attainment,” NBER Working Paper No. 15902 (Cambridge, Massachusetts: National Bureau of Economic Research).
Bils, Mark, and Peter J. Klenow, 2000, “Does Schooling Cause Growth?” American Economic Review, Vol. 90, No. 5, pp. 1160–83.
Carroll, C., J. Slacalek, and M. Sommer, 2012, “Dissecting Saving Dynamics: Measuring Wealth, Precautionary, and Credit Effects,” IMF Working Paper No. 12/219 (Washington: International Monetary Fund).
Celasun, O., D. Cooper, J. Dagher, and R. Giri, 2012, “U.S. Household Wealth and Saving: The Micro Story Behind the Macro Dynamics,” in United States––Selected Issues, IMF Country Report No. 12/214 (Washington: International Monetary Fund).
Céspedes, L.F., and A. Velasco, 2011, “Was This Time Different?: Fiscal Policy in Commodity Republics,” BIS Working Papers No. 365 (Basel: Bank for International Settlements).
Ferreira, Pedro Cavalcanti, Samuel De Abreu Pessoa, and Fernando A. Leloso, 2013, “On the Evolution of Total Factor Productivity in Latin America,” Economic Inquiry, Vol. 51, No. 1, pp. 16–30.
Gollin, Douglas, 2002, “Getting Income Shares Right,” Journal of Political Economy, Vol. 110, No. 2, pp. 458–74.
Gonzalez-Miranda, Maria, 2012, “Nonfinancial Firms in Latin America: A Source of Vulnerability?” IMF Working Paper No. 12/279 (Washington: International Monetary Fund).
Hatchondo, J.C., L. Martinez, and F. Roch, 2012,
“Fiscal Rules and the Sovereign Default Premium,” IMF Working Paper No. 12/30 (Washington: International Monetary Fund).
______, 2011, “Debt Dilution and Sovereign Default Risk,” IMF Working Paper No. 11/70 (Washington: International Monetary Fund).
Heston, Alan, Robert Summers, and Bettina Aten, 2012, Penn World Table Version 7.1, Center for International Comparisons of Production, Income and Prices at the University of Pennsylvania, July.
Inter-American Development Bank, 2008, All that Glitters May Not Be Gold. Assessing Latin America’s Recent Macroeconomic Performance, Annual Report (Washington: Inter-American Development Bank).
______, 2010, The Age of Productivity: Transforming Economies from the Bottom Up (Washington: Inter-American Development Bank).
International Monetary Fund, 2002, Assessing Sustainability (Washington: International Monetary Fund). Available at: www.imf.org/external/np/pdr/sus/2002/eng/052802.pdf
______, 2003, Sustainability Assessments-Review of Application and Methodological Refinements (Washington: International Monetary Fund). Available at: www.imf.org/external/np/pdr/sustain/2003/061003.pdf
______, 2005, Information Note on Modifications to the Fund’s Debt Sustainability Assessment Framework for Market Access Countries

REGIONAL ECONOMIC OUTLOOK: WESTERN HEMISPHERE
54
(Washington: International Monetary Fund). Available at: www.imf.org/external/np/pp/eng/2005/070105.pdf
______, 2011, Modernizing the Framework for Fiscal Policy and Public Debt Sustainability Analysis (Washington: International Monetary Fund). Available at: www.imf.org/external/np/pp/eng/2011/080511.pdf
______, 2012a, Macroeconomic Policy Frameworks for Resource-Rich Developing Countries (Washington: International Monetary Fund). Available at: www.imf.org/external/np/pp/eng/2012/082412.pdf
Rendak, N., A. Giddings, C. DeLong, Y. Liu, M. Luedersen, and F. Chukwu, 2012b, “United States Foreclosure Crisis: Can Modification of the Personal Bankruptcy Framework Facilitate Residential Mortgage Restructuring?” in United States––Selected Issues, IMF Country Report No. 12/214.
Izquierdo, A., R. Romero, and E. Talvi, 2008, “Booms and Busts in Latin America: The Role of External Factors,” Research Department Working Paper No. 631 (Washington: Inter-American Development Bank).
Kamil, H., and J. Zook, 2012, “What Explains Mexico’s Recovery of U.S. Market Share?” in Mexico––Selected Issues, IMF Country Report No. 12/317 (Washington: International Monetary Fund).
Kohli, U., 2004, “Real GDP, Real Domestic Income, and Terms-of-Trade Changes,” Journal of International Economics, No. 62, pp. 83–106.
Loayza, Norman, Pablo Fajnzylber, and César Calderón, 2005, Economic Growth in Latin America and the Caribbean: Stylized Facts, Explanations, and Forecasts (Washington: World Bank).
Magud, N. E., and E. Tsounta, 2012, “To Cut or Not to Cut? That is the (Central Bank’s) Question. In Search of the Neutral Interest Rate in Latin America,” IMF Working Paper No. 12/243 (Washington: International Monetary Fund).
Medas, P., and Y. Dai, 2012, “Canada’s Loss of External Competitiveness: The Role of Commodity Prices and the Emergence of China,” in Canada––Selected Issues, IMF Country Report No. 13/41 (Washington: International Monetary Fund).
Österholm, P., and J. Zettelmeyer, 2008, “The Effect of External Conditions on Growth in Latin America,” IMF Staff Papers, Vol. 55, No. 4, pp. 595–623.
Schaechter, A., T. Kinda, N. Budina, and A. Weber, 2012, “Fiscal Rules in Response to the Crisis: Toward the Next-Generation Rules. A New Dataset,” IMF Working Paper No. 12/187 (Washington: International Monetary Fund).
Sosa, S., and E. Tsounta, 2013, “Labor Productivity and Potential Growth in Latin America: A Post Crisis Assessment” IMF Working Paper, forthcoming (Washington: International Monetary Fund).
Sosa, S., E. Tsounta, and H. S. Kim, 2013, “Is the Growth Momentum in Latin America Sustainable?” IMF Working Paper, forthcoming (Washington: International Monetary Fund).

55
New Publications from the Western Hemisphere Department, May 2012–April 2013
1. IMF Working Papers WP/13/40 – Growth and Employment in the Dominican Republic: Options for a Job-Rich Growth, by Umidjon Abdullaev and Marcello Estevão. WP/13/27 – External Conditions and Debt Sustainability in Latin America, by Gustavo Adler and Sebastián Sosa. WP/12/301 – The Determinants of Banks’ Liquidity Buffers in Central America, by Corinne Delechat, Camila Henao Arbelaez, Priscilla Muthoora, and Svetlana Vtyurina. WP/12/279 – Nonfinancial Firms in Latin America: A Source of Vulnerability? by Maria Gonzalez. WP/12/276 – The Challenges of Fiscal Consolidation and Debt Reduction in the Caribbean, by Charles Amo-Yartey, Machiko Narita, Garth Peron Nicholls, Joel Chiedu Okwuokei, Alexandra Peter, and Therese Turner-Jones. WP/12/261 – Performance of Publicly Listed Chilean Firms During the 2008–09 Global Financial Crisis, by Yi Wu. WP/12/254 – Financial Spillovers to Chile, by Jiri Podpiera. WP/12/245 – Natural Disasters: Mitigating Impact, Managing Risks, by Nicole Laframboise and Boileau Loko. WP/12/243 – To Cut or Not to Cut? That is the (Central Bank’s) Question - In Search of the Neutral Interest Rate in Latin America, by Nicolas E. Magud and Evridiki Tsounta. WP/12/235 – Caribbean Growth in an International Perspective: The Role of Tourism and Size, by Nita Thacker, Sebastian Acevedo, and Roberto Perrelli. WP/12/234 – Central America, Panama, and the Dominican Republic: Trade Integration and Economic Performance, by Stephanie Medina Cas, Andrew Swiston, and Luis-Diego Barrot. WP/12/225 – Inflation Responses to Commodity Price Shocks–How and Why Do Countries Differ? by Gaston Gelos and Yulia Ustyugova. WP/12/224 – Brazil's Capital Market: Current Status and Issues for Further Development, by Joonkyu Park. WP/12/219 – Dissecting Saving Dynamics: Measuring Wealth, Precautionary, and Credit Effects, by Christopher Carroll, Jiri Slacalek, and Martin Sommer.

REGIONAL ECONOMIC OUTLOOK: WESTERN HEMISPHERE
56
WP/12/193 – Latin America: Vulnerabilities under Construction? By Luis Cubeddu, Camilo E. Tovar, and Evridiki Tsounta. WP/12/188 – Riding Global Financial Waves: The Economic Impact of Global Financial Shocks on Emerging Market Economies, by Gustavo Adler and Camilo E. Tovar. WP/12/178 – Intertwined Sovereign and Bank Solvencies in a Model of Self-Fulfilling Crisis, by Gustavo Adler. WP/12/157 – Threshold Effects of Sovereign Debt: Evidence from the Caribbean, by Kevin Greenidge, Roland Craigwell, Chrystol Thoma, and Lisa Drakes. WP/12/155 – Banks’ Liability Structure and Mortgage Lending During the Financial Crisis, by Jihad C. Dagher and Kazim Kazimov. WP/12/145 – Intra-Regional Spillovers in South America: Is Brazil Systemic after All? by Gustavo Adler and Sebastián Sosa. WP/12/142 – Credit Growth and the Effectiveness of Reserve Requirements and Other Macroprudential Instruments in Latin America, by Camilo E. Tovar, Mercedes Garcia-Escribano, and Mercedes Vera Martin. WP/12/124 – Do Dynamic Provisions Enhance Bank Solvency and Reduce Credit Procyclicality? A Study of the Chilean Banking System, by Jorge A. Chan-Lau. WP/12/112 – Commodity Price Shocks and Fiscal Outcomes, by Nikola Spatafora and Issouf Samake. WP/12/110 – Dynamic Loan Loss Provisioning: Simulations on Effectiveness and Guide to Implementation, by Torsten Wezel, Jorge A. Chan-Lau, and Francesco Columba. 2. Selected Issues Papers
Brazil
Macroeconomic Implications of Pension Reform in Brazil, Joana Pereira.
Real Exchange Rate Appreciation: Can Fiscal Policy Help? Marialuz Moreno Badia and Alex Segura-Ubiergo.
Consumer Credit Growth and Risks for Household Financial Stress, Mercedes García-Escribano.
Canada
Is There an Excess Supply of Housing in Canada? Julien Reynaud.
Recent Experience with Macro-Prudential Tools in Canada: Effectiveness and Options Moving Forward, Ivo Krznar
and Pablo Medas.
Canada’s Loss of External Competitiveness: The Role of Commodity Prices and the Emergence of China, Pablo Medas.

PUBLICATIONS
57
Caribbean
Credit Unions in the ECCU: Prospects and Challenges, Y. Wong and A. Lemus.
Macroeconomic Statistics in the ECCU, S. Benjamin, A. Brousseau, H. Corbin, M. Mrkaic, and L. Sahely.
Chile
Output Fluctuations in Chile––The Role of External Factors, Sebastián Sosa.
Financial Spillovers to Chile, Jiri Podpiera.
Performance of Publicly Listed Chilean Firms during the 2008–09 Global Financial Crisis, Yi Wu.
Costa Rica
International Spillovers, Yulia Ustyugova.
Potential Estimates, Yulia Ustyugova.
Assessing Fiscal Vulnerability and Medium-Term Sustainability, Pablo Morra.
Basel III and Coasta Rica’s Banking System, Fernando Delgado.
Haiti
A Renewed Public Investment Policy in Support of Growth and Poverty Reduction, Abdel Bessaha.
Mexico
What Explains Mexico’s Recovery of U.S. Market Share? Herman Kamil and Jeremy Zook.
The Case for Tax Revenue Mobilization in Mexico, Santiago Acosta-Ormaechea.
Mexico: Financial Sector Development, Francisco Vázquez Ahued and Esteban Vesperoni.
Mexico: Migration and Labor Markets, Enrique Flores and Esteban Vesperoni.
Nicaragua
Raising Potential Output: The Challenge of Inclusive Growth, Christian Johnson.
Lifting a Constraint on Growth: Achievements and Challenges of Nicaragua’s Electricity Sector, Gabriel Di Bella.
Fiscal Consolidation–Issues and Policy Options, Issouf Samake.
Panama
Panama: Taking Stock of a Decade of Tax Reforms, Svetlana Vtyurina.

REGIONAL ECONOMIC OUTLOOK: WESTERN HEMISPHERE
58
Paraguay
Credit Booms: Relaxing Constraints During Capital Inflow Booms, Nicolas E. Magud.
External Financial Shocks: How Important for Paraguay? Jiri Podpiera and Volodymyr Tulin.
Peru
Institutional Framework for Macroprudential Policy, M. Vera Martin.
Advances and Challenges in Social Policies, Yu Ching Wong.
Fiscal Objectives: Lower Debt or Higher Savings? M. Vera Martin.
Trade Evolution and Policy Challenges, Yu Ching Wong.
Banking Sector Spreads, Kevin Ross.
Trinidad and Tobago
The Heritage and Stabilization Fund: Key Issues for the 2012 Review, Joel Okwuokei, Hunter Monroe, and Judith
Gold.
Developments and Prospects in the Energy Sector, Machiko Narita and Judith Gold.
United States
U.S. Household Wealth and Saving: The Micro Story Behind the Macro Dynamics, Oya Celasun, Daniel Cooper,
Jihad Dagher, and Rahul Giri.
The Residential Construction Sector: When Will it Emerge from its Rubble? Jihad Dagher and Julien Reynaud.
Output Losses Following Financial Crises—A Sensitivity Analysis, Geoffrey Keim, Oya Celasun, and
Martin Sommer.
Is Long-Term Unemployment Pushing Up Structural Unemployment? Eric Le Borgne.