Regional disparities, migration and geographical mobility in the EU Adnett ch.5.5,5.6,5.7 Employment...
29
Regional disparities, migration and geographical mobility in the EU Adnett ch.5.5,5.6,5.7 Employment in Europe ch.5
-
date post
22-Dec-2015 -
Category
Documents
-
view
214 -
download
0
Transcript of Regional disparities, migration and geographical mobility in the EU Adnett ch.5.5,5.6,5.7 Employment...

Regional disparities, migration and geographical mobility in the EU
Adnett ch.5.5,5.6,5.7
Employment in Europe ch.5

Mobility patterns in the EU• Low geographic mobility within the EU both relative to the
EU population and compared to migration inflows from non EU countries
• Regional mobility within EU member states is higher than cross-borders mobility.
• Overall internal mobility rates in the EU are lower than in the US; between 2000-2005 around 1% of the working age population have changed residence each year from one region to another compared to 2,8%-3,4% in the US
• Since the EU enlargement the mobility flows did not increase much
• Mobile and migrant workers are usually younger and more educated/skilled than the average sending country population.

Variables which affect migration choices• Economic determinants
– Differentials in income per capita, (un)employment rates, social security systems
• Characteristics of the population:– Age, education, female participation
• Distance – Physical distance (km), border
• Cultural aspects– Common language– Networks
• Institutional aspects− Regulations of flows− Pensions’ portability− Recognition of qualifications/educational degrees

Economic models of migration/labour mobility• According to standard neoclassical theory workers compare the net
present value of job offers outside their region/country with those within. The net present value of job offers is the difference between expected benefits and expected costs of migration/mobility,
• Expected benefits are given by income/wage differentials between arrival countries/regions and countries/region of origin (Wa-Wo) and differences in employment opportunities.
• Expected costs are given by the opportunity costs (Co: differences in employment probabilities and forgone earnings) and direct mobility costs (Cd), both monetary (search costs and re-locating costs such as information costs, housing costs, moving costs, etc.) and psycological (breaking family ties,..)
• Migration costs and benefits vary according to the abilities/skills of individuals (A), because ability affects both C and wage differentials.
rm = f ( Wa-Wo; A;Co; Cd)

Implications of the neoclassical model• Labour mobility and migration contribute to optimal allocation of
resources and labour market adjustment: high wage and low unemployment regions attract migration inflows from low wage and high unemployment regions; migration flows, by increasing labour supply in high wage countries and reducing it in low wage countries, reduce regional differences in wages and unemployment.
• Returns and costs of mobility vary across workers due to personal and family characteristcs:
Young people are more likely to move, because for older workers higher post – move earnings are discounted over fewer years
If skill/educational qualifications are transferable, skilled and better educated and higher potential income workers are more likely to move, because they have lower moving costs (i.e.easier access to information and lower re-locations costs) and higher expected benefits
The policy implication is that labour mobility should not be limited, but rather encouraged.

Effects of migration/1• According to human capital models, the wages of migrant
workers in arrival countries are initially lower than similar indigenous workers, but then increase with the duration of stay in the arrival country, reflecting the initial investment in “country specific human capital”. With temporary migration this initial investment is not convenient, if acquired skills are not recognised in the country of origin.
• Selective migration: differences in wage distribution across skills/occupation between sending and arrival countries and the transferability of qualifications may affect the composition of migration inflows. If the wage dispersions across qualifications is higher in arrival countries, there will be higher incentives for highly skilled workers to migrate, than for low skilled ones. On the other hand low skilled workers are incentivated to migrate by differences in welfare benefits and low direct migration costs.

Effects of migration/2• Effects of migration on arrival countries depend on the
composition of migration flows and their complementarity/ substitubility with local workers. They also depend on wage flexibility in arrival countries. Econometric studies on wage and employment impact of migration find low or no wage and employment effects of immigration
• The economic conditions of sending countries may be worsened by out-migration if it is made mainly by the most skilled young workers (brain drain)
• However if the migrant workers acquires skills in the arrival country which are more valued (in terms of real wages) in the country of origin than in the arrival country, migrants may decide to return to the country of origin.

Empirical evidence: Serious data problems– Population and migration statistics:
• Few EU-countries report migration stocks (residents) and flows accordinglyDK, FIN, GER, NL, SWE
• Others provide short time series and not in all years AUS, BEL, LX, ITA, ESP?
• Many provide no or incomplete or flawed dataFRA, IRE, GRE, POR, UK
– Other data sources• Labour Force Survey: underreporting of temporary
migrants, low response rates• Work permits: underreporting of return migration,
inflated figures

Why low migration patterns in the EU?
Migration flows are restricted by cultural and institutional barriers, which are particularly relevant in EU countries and may explain the low mobility patterns:
• Linguistic and cultural differences• Institutional obstacles
• Housing transaction costs• Lack of pension portability• Restrictions to foreign access to domestic labor markets (Immigration
laws, imperfect recognition of diplomas,…)• No recognition of qualifications/educational degrees
• Others: Social ties • On the other hand, generous welfare regimes may be an
attracting factor.

Migration Policies: a European dilemma• A stagnating and ageing Europe badly needs migrants: for
example in Spain they contributed to almost 50% of growth in the last 5 years.
• But migration to countries with a rich welfare state creates fiscal spillovers across jurisdictions, increasing concerns of public opinion about migrants..
• ..inducing “race to the top” in migration restrictions and tightening of national policies.
FEARS with enlargement:• Deterioration of living standards, wage losses and job
displacements if substitution effect prevails, especially for low skilled and Southern Europe
• Pressures on labour markets and social cohesion due to mass migration. Especially on bordering areas and on traditional, labour intensive sectors (agriculture and industrial sectors).

Migration policies
• Everywhere tightening of migration policies towards the unskilled
• While race to attract highly skilled migrants
• Explicit point systems in an increasing number of countries outside the EU (Canada since 67, Australia since 84, New Zealand since 91, Switzerland since 96)

Tightening everywhere, mostly in rich welfare state countries
www.frdb.org index of the stance of migration policies (increasing in restrictions)

Table A.8 Indicator of the restrictiveness of immigration laws in OECD countries (scale 0-10)
Average 1992-2003
Switzerland 4.32
Austria 5.34
Spain 5.81
Norway 5.95
United States 6.11
Australia 6.36
Greece 6.44
New Zealand 6.48
Iceland 6.63
France 6.65
Canada 6.71
Ireland 6.71
Germany 6.85
United Kingdom 6.91
Italy 6.98
Finland 7.01
Belgium 7.20
Netherlands 7.32
Portugal 7.40
Sweden 7.52
Luxembourg 7.55
Denmark 7.73

Are these fears based on reality?
– Has Eastern Enlargement resulted in more migration than expected?
– Have transitional periods resulted in diversion of migration flows?
– What is the impact of migration diversion on GDP and labour markets?
– What can we conclude for the next Enlargement round?

Estimated impacts of enlargement on migration• The increase in migration flows are of a minor magnitude. Currently
immigrants from NMS represent only 0.3% of the EU workforce, and 80% are located in Austria and Germany. Migration especially from Baltic countries and Poland. Migration flows will be reduced with growth and ageing population in AC.
• Temporary rather than permanent migration, especially seasonal workers in construction and catering sectors.
• Negative effects on EU workers would be limited to blue collar workers in the industrial and construction sectors and unskilled service workers, however this effect is estimated to be lower than feared, even in Austria and Germany
• Migration flows, especially in the form of crossborder commuting, may have positive effects on hosting countries with problems of excess labour demand and mismatches and of ageing population.
• Limiting migration flows may be negative, because it reduces integration potentials and increase incentives to illegal immigration and black economy.

Eastern-Enlargement migration policies
Pre-Enlargement migration conditions – exclusion of labour markets from step-wise-
integration of NMS into Common Market– some bilateral agreements and quotas
(e.g. Germany, Austria)– other channels:
• shadow economy
• establishment of companies (‘self-employment’)
• posting of workers through service trade
• students

Transitional restrictions (2004-2007) in labour mobility from NMS
– Majority of countries maintained restrictions– We can classify Member States into 4 groups:
• free movement (Community rules apply)• free access to labour markets,
restricted access to welfare benefits• largely restricted: small quotas,
sectoral exceptions, some bilateral agreements• totally restricted: similar treatment as non-EU
citizens
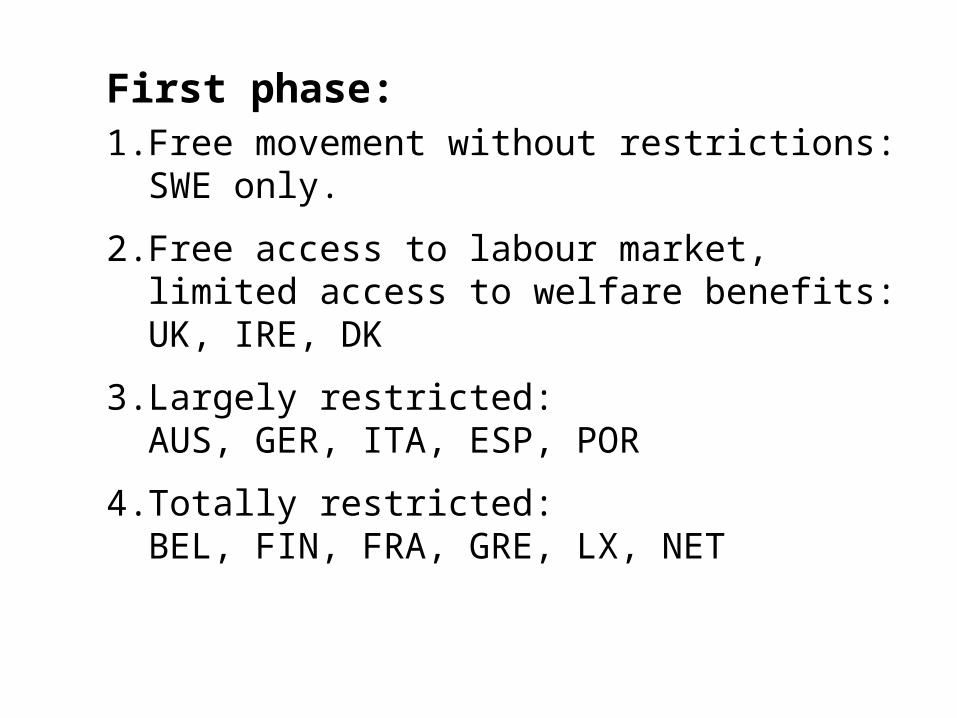
First phase:1. Free movement without restrictions:
SWE only.
2. Free access to labour market, limited access to welfare benefits:UK, IRE, DK
3. Largely restricted:AUS, GER, ITA, ESP, POR
4. Totally restricted:BEL, FIN, FRA, GRE, LX, NET

Second phase:1. Free movement without restrictions:
SWE + FIN, GRE, ITA, POR, ESP.
2. Free access to labour market, limited access to welfare benefits:UK, IRE, DK
3. Largely restricted:AUS, GER + BEL, FRA, NET, LX
4. Totally restricted: --

… and Bulgaria and Romania?– Policy shift in UK and Ireland
– Free access to labour market: ESP?
– Largely restricted:AUS, GER, GRE, POR, IRE, UK, ITA?
– Totally restricted:BEL, NET, LX
Preliminary, not all countries yet decided.

Post-Enlargement migration
What did we expect before Enlargement?
– Most studies expected long-run migration potential of 3.0-4.5 per cent of NMS population (Layard et al., 1992; Bauer/Zimmermann, 1999; Boeri/Brücker, 2001; Alvarez-Plata et al. 2003)
– Short-run growth of NMS population of 250-400,000 persons p.a. (net migration rate)
„The transitional periods can distort the regional distribution of migrants from the Eastern Europe across the EU-15, that is, the diversion of migration flows away from countries which restrict immigration into countries which pursue a more liberal immigration policy.”

1. Aggregate post-Enlargement migration flows into EU-15 below baseline forecasts under free movement
2. Dramatic shift in regional migration pattern away from AUS and GER towards UK und IRE, but not to SWE and DK
3. Substantial pre-Enlargement migration from BUL+ROM towards Spain and Italy, reflect at least in case of Spain bilateral agreements

0
50
100
150
200
250
300
EU-15 open countries closed countries
net
ch
ang
e in
fo
reig
n r
esid
ents
fro
m N
MS
-8
baseline scenarioactual development
net increase of NMS-residents, 2006: baseline projection and actual development 2006

Dramatic shift in regional distribution
0.0
50.0
100.0
150.0
200.0
250.0
300.0
350.0
400.0
450.0
500.0
GER UK ITA AUS ESP BEL IRE FR SWE NET GRE FIN DK LX POR
NM
S-8
res
iden
ts (
tho
usa
nd
s)
2000 2006

Simulating diversion impact
How do selective restrictions affect welfare?
1. Less migration: more individuals stay at home although they could obtain higher utility from higher income and/or quality of life abroad
2. Diversion: More migrants move to locations of second choice, i.e. locations where the receive less utility
• Economic factors: lower wages and lower labour productivity; less employment opportunities
• Non-economic factors: quality of life, social networks, geographical and cultural distance

Economic implications:– Aggregate GDP falls, if
(i) more labour stays in low-productivity regions; (ii) labour is diverted away from high productivity countries to countries with lower productivity
– Aggregate unemployment rate increases, if (i) more labours remains in regions with high unemployment rates, (ii) less labour moves to regions where unemployment is low and integration is easy

Short-run impact: GDP
-0.80
-0.60
-0.40
-0.20
0.00
0.20
0.40
0.60
0.80
GER UK NMS-8 EU-15 enlarged EU
chan
ge
in %
diversion free movement

Summary of results
– Transitional restrictions reduce GDP in Enlarged EU• short-run: -0.05%• long-run: -0.36%
– Main losers are migrants (incl. families)• short-run: -26%• long-run: - 32%
– German natives gain from diversion• short-run: 0.07• long-run: 0.14
– UK natives lose from diversion
• short-run: -0.01• long-run: -0.03

What can be done to improve EU internal mobility?
– Enhance migration policy coordination at EU-level (point system?)
– Attract high skilled migrants
– Reduce administrative and legal barriers to mobility from NMS
– Introduce minimum EU wide Social Security Schemes and improve the portability of pension rights
– Improve information and transparency on job opportunities