Regional Arias Intensity Attenuation Relationship for ...gis.geo.ncu.edu.tw/papers/Regional Arias...
14
Regional Arias Intensity Attenuation Relationship for Taiwan Considering V S30 by Chyi-Tyi Lee, Bow-Shan Hsieh, Chih-Hsuan Sung, and Po-Shen Lin Abstract The Arias intensity is a measure of earthquake intensity arrived at through the integration of a square of the acceleration time history. It has been demonstrated to be an effective predictor of earthquake damage potential in relation to short-period structures, liquefaction, and seismic slope stability, and has begun to be considered as a ground-motion measure suitable for use in probabilistic seismic hazard analysis (PSHA), as well as earthquake loss estimation. A new empirical Arias intensity attenuation relationship for shallow crustal earthquakes is developed where both fault type and a continuous site variable V S30 are considered. The relationship is based on a large number of strong-motion records (6570) from a wide range of earth- quake magnitudes (3.9–7.6) from the Taiwan Strong Motion Instrument Program (TSMIP) network. Its functional form is modified from that of Travasarou et al. (2003), which is derived from a point-source model, and the coefficients are determined through nonlinear regression analyses using a mixed-effects model. The results show that the incorporation of V S30 can significantly reduce regression error. The Arias intensity value predicted in the present study is generally similar to that obtained by Travasarou et al. (2003), but is different in detail, being more suitable for usage in PSHA for a tectonically young orogenic belt like that in Taiwan or New Zealand. Introduction The Arias intensity (Arias, 1970) is an important measure of the strength of ground motion arrived at through the integration of the square of the acceleration time history. It is different from the peak ground acceleration (PGA), peak ground velocity (PGV), or individual ordinates of spectral acceleration (SA), which are also of interest in ground- motion attenuation relationship studies. The amplitude, fre- quency content, and duration of the ground motion are all incorporated in the intensity, and it is thus likely to be a more effective predictor of the earthquake damage potential. It cor- relates well with several commonly used demand measures of short-period structural performance, liquefaction (Kayen and Mitchell, 1997), and seismic slope stability (Wilson and Keefer, 1985; Harp and Wilson, 1995). In light of this utility, the Arias intensity has begun to be considered a ground- motion measure suitable for use in probabilistic seismic hazard analysis (PSHA) and earthquake loss estimation (Staf- ford et al., 2009). The attenuation relationship for the Arias intensity has been studied by various authors for different regions (e.g., Wilson and Keefer, 1985; Keefer and Wilson, 1989; Sabetta and Pugliese, 1996; Kayen and Mitchell, 1997; Paciello et al., 2000; Travasarou et al., 2003; Hwang et al., 2004; Danciu and Tselentis, 2007; Stafford et al., 2009). Taiwan is commonly recognized as a country with significant levels of seismic activity by worldwide standards, yet very few empirical ground-motion models have been derived for the area. This study takes a step toward remedying this situation by present- ing new equations for predicting the Arias intensity of crustal earthquakes in Taiwan, for a wide range of magnitudes and distance values. In previous work, Travasarou et al. (2003) and Hwang et al. (2004) used the Chi-Chi dataset (Lee, Shin, et al., 2001a; Lee, Cheng, et al., 2001a) of Taiwan. However, their dataset is relatively small, and the continuous site param- eter V S30 was not considered in these studies. V S30 is the average shear-wave velocity in the upper 30 meters of a soil profile and is an important parameter for consideration in many earthquake ground-motion site-effect studies (Anderson et al., 1996; BSSC, 1997a, b; Castro et al., 1997; Park and Elrick, 1998). Borcherdt (1994) and Martin and Dobry (1994) recommended that structures be designed based on these properties. V S30 has been used by the Next Generation Attenuation of Ground Motions Project (NGA) of the Pacific Earthquake Engineering Research Center (PEER) in their ground-motion attenuation models (Abra- hamson and Silva, 2008; Boore and Atkinson, 2008; Camp- bell and Bozorgnia, 2008; Chiou and Youngs, 2008; Idriss, 2008). It can be seen from this that V S30 has become very important in the field of ground-motion prediction and site-effect studies. 129 Bulletin of the Seismological Society of America, Vol. 102, No. 1, pp. 129–142, February 2012, doi: 10.1785/0120100268
-
Upload
nguyenhanh -
Category
Documents
-
view
218 -
download
0
Transcript of Regional Arias Intensity Attenuation Relationship for ...gis.geo.ncu.edu.tw/papers/Regional Arias...

Regional Arias Intensity Attenuation Relationship
for Taiwan Considering VS30
by Chyi-Tyi Lee, Bow-Shan Hsieh, Chih-Hsuan Sung, and Po-Shen Lin
Abstract The Arias intensity is a measure of earthquake intensity arrived atthrough the integration of a square of the acceleration time history. It has beendemonstrated to be an effective predictor of earthquake damage potential in relationto short-period structures, liquefaction, and seismic slope stability, and has begun to beconsidered as a ground-motion measure suitable for use in probabilistic seismichazard analysis (PSHA), as well as earthquake loss estimation. A new empirical Ariasintensity attenuation relationship for shallow crustal earthquakes is developed whereboth fault type and a continuous site variable VS30 are considered. The relationship isbased on a large number of strong-motion records (6570) from a wide range of earth-quake magnitudes (3.9–7.6) from the Taiwan Strong Motion Instrument Program(TSMIP) network. Its functional form is modified from that of Travasarou et al. (2003),which is derived from a point-source model, and the coefficients are determinedthrough nonlinear regression analyses using a mixed-effects model. The results showthat the incorporation of VS30 can significantly reduce regression error. The Ariasintensity value predicted in the present study is generally similar to that obtainedby Travasarou et al. (2003), but is different in detail, being more suitable for usagein PSHA for a tectonically young orogenic belt like that in Taiwan or New Zealand.
Introduction
The Arias intensity (Arias, 1970) is an importantmeasure of the strength of ground motion arrived at throughthe integration of the square of the acceleration time history.It is different from the peak ground acceleration (PGA), peakground velocity (PGV), or individual ordinates of spectralacceleration (SA), which are also of interest in ground-motion attenuation relationship studies. The amplitude, fre-quency content, and duration of the ground motion are allincorporated in the intensity, and it is thus likely to be a moreeffective predictor of the earthquake damage potential. It cor-relates well with several commonly used demand measuresof short-period structural performance, liquefaction (Kayenand Mitchell, 1997), and seismic slope stability (Wilson andKeefer, 1985; Harp and Wilson, 1995). In light of this utility,the Arias intensity has begun to be considered a ground-motion measure suitable for use in probabilistic seismichazard analysis (PSHA) and earthquake loss estimation (Staf-ford et al., 2009).
The attenuation relationship for the Arias intensity hasbeen studied by various authors for different regions (e.g.,Wilson and Keefer, 1985; Keefer and Wilson, 1989; Sabettaand Pugliese, 1996; Kayen andMitchell, 1997; Paciello et al.,2000; Travasarou et al., 2003;Hwang et al., 2004; Danciu andTselentis, 2007; Stafford et al., 2009). Taiwan is commonlyrecognized as a country with significant levels of seismic
activity by worldwide standards, yet very few empiricalground-motion models have been derived for the area. Thisstudy takes a step toward remedying this situation by present-ing new equations for predicting the Arias intensity of crustalearthquakes in Taiwan, for a wide range of magnitudes anddistance values. In previous work, Travasarou et al. (2003)and Hwang et al. (2004) used the Chi-Chi dataset (Lee, Shin,et al., 2001a; Lee, Cheng, et al., 2001a) of Taiwan. However,their dataset is relatively small, and the continuous site param-eter VS30 was not considered in these studies.
VS30 is the average shear-wave velocity in the upper30 meters of a soil profile and is an important parameter forconsideration in many earthquake ground-motion site-effectstudies (Anderson et al., 1996; BSSC, 1997a, b; Castro et al.,1997; Park and Elrick, 1998). Borcherdt (1994) and Martinand Dobry (1994) recommended that structures be designedbased on these properties. VS30 has been used by the NextGeneration Attenuation of Ground Motions Project (NGA)of the Pacific Earthquake Engineering Research Center(PEER) in their ground-motion attenuation models (Abra-hamson and Silva, 2008; Boore and Atkinson, 2008; Camp-bell and Bozorgnia, 2008; Chiou and Youngs, 2008; Idriss,2008). It can be seen from this that VS30 has become veryimportant in the field of ground-motion prediction andsite-effect studies.
129
Bulletin of the Seismological Society of America, Vol. 102, No. 1, pp. 129–142, February 2012, doi: 10.1785/0120100268
This study uses strong-motion data from the TaiwanStrong-Motion Instrument Program (TSMIP) to establish anew empirical Arias intensity attenuation relationship forshallow crustal earthquakes. The functional form of the at-tenuation model is modified from a version of the theoreticalmodel proposed by Travasarou et al. (2003), by the additionof an alternative site term, VS30. The maximum likelihoodestimate (MLE) and mixed-effects model were used forregression. The goodness-of-fit of the median attenuationcurve to the data was evaluated by analyses of inter-event andintra-event residuals and the residuals associated with siteeffect. The reduction of the standard deviation (sigma) forthese terms will be discussed.
Regional Setting
Tectonic Environment
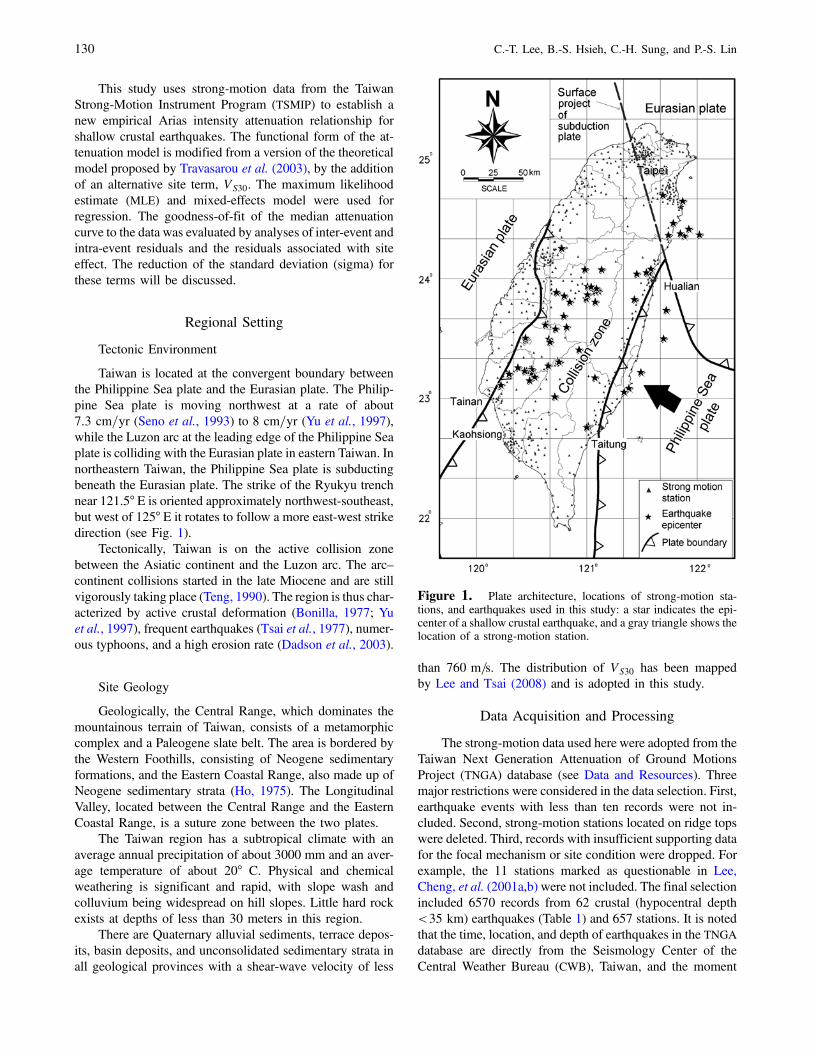
Taiwan is located at the convergent boundary betweenthe Philippine Sea plate and the Eurasian plate. The Philip-pine Sea plate is moving northwest at a rate of about7:3 cm=yr (Seno et al., 1993) to 8 cm=yr (Yu et al., 1997),while the Luzon arc at the leading edge of the Philippine Seaplate is colliding with the Eurasian plate in eastern Taiwan. Innortheastern Taiwan, the Philippine Sea plate is subductingbeneath the Eurasian plate. The strike of the Ryukyu trenchnear 121.5° E is oriented approximately northwest-southeast,but west of 125° E it rotates to follow a more east-west strikedirection (see Fig. 1).
Tectonically, Taiwan is on the active collision zonebetween the Asiatic continent and the Luzon arc. The arc–continent collisions started in the late Miocene and are stillvigorously taking place (Teng, 1990). The region is thus char-acterized by active crustal deformation (Bonilla, 1977; Yuet al., 1997), frequent earthquakes (Tsai et al., 1977), numer-ous typhoons, and a high erosion rate (Dadson et al., 2003).
Site Geology
Geologically, the Central Range, which dominates themountainous terrain of Taiwan, consists of a metamorphiccomplex and a Paleogene slate belt. The area is bordered bythe Western Foothills, consisting of Neogene sedimentaryformations, and the Eastern Coastal Range, also made up ofNeogene sedimentary strata (Ho, 1975). The LongitudinalValley, located between the Central Range and the EasternCoastal Range, is a suture zone between the two plates.
The Taiwan region has a subtropical climate with anaverage annual precipitation of about 3000 mm and an aver-age temperature of about 20° C. Physical and chemicalweathering is significant and rapid, with slope wash andcolluvium being widespread on hill slopes. Little hard rockexists at depths of less than 30 meters in this region.
There are Quaternary alluvial sediments, terrace depos-its, basin deposits, and unconsolidated sedimentary strata inall geological provinces with a shear-wave velocity of less
than 760 m=s. The distribution of VS30 has been mappedby Lee and Tsai (2008) and is adopted in this study.
Data Acquisition and Processing
The strong-motion data used here were adopted from theTaiwan Next Generation Attenuation of Ground MotionsProject (TNGA) database (see Data and Resources). Threemajor restrictions were considered in the data selection. First,earthquake events with less than ten records were not in-cluded. Second, strong-motion stations located on ridge topswere deleted. Third, records with insufficient supporting datafor the focal mechanism or site condition were dropped. Forexample, the 11 stations marked as questionable in Lee,Cheng, et al. (2001a,b) were not included. The final selectionincluded 6570 records from 62 crustal (hypocentral depth<35 km) earthquakes (Table 1) and 657 stations. It is notedthat the time, location, and depth of earthquakes in the TNGAdatabase are directly from the Seismology Center of theCentral Weather Bureau (CWB), Taiwan, and the moment
Figure 1. Plate architecture, locations of strong-motion sta-tions, and earthquakes used in this study: a star indicates the epi-center of a shallow crustal earthquake, and a gray triangle shows thelocation of a strong-motion station.
130 C.-T. Lee, B.-S. Hsieh, C.-H. Sung, and P.-S. Lin
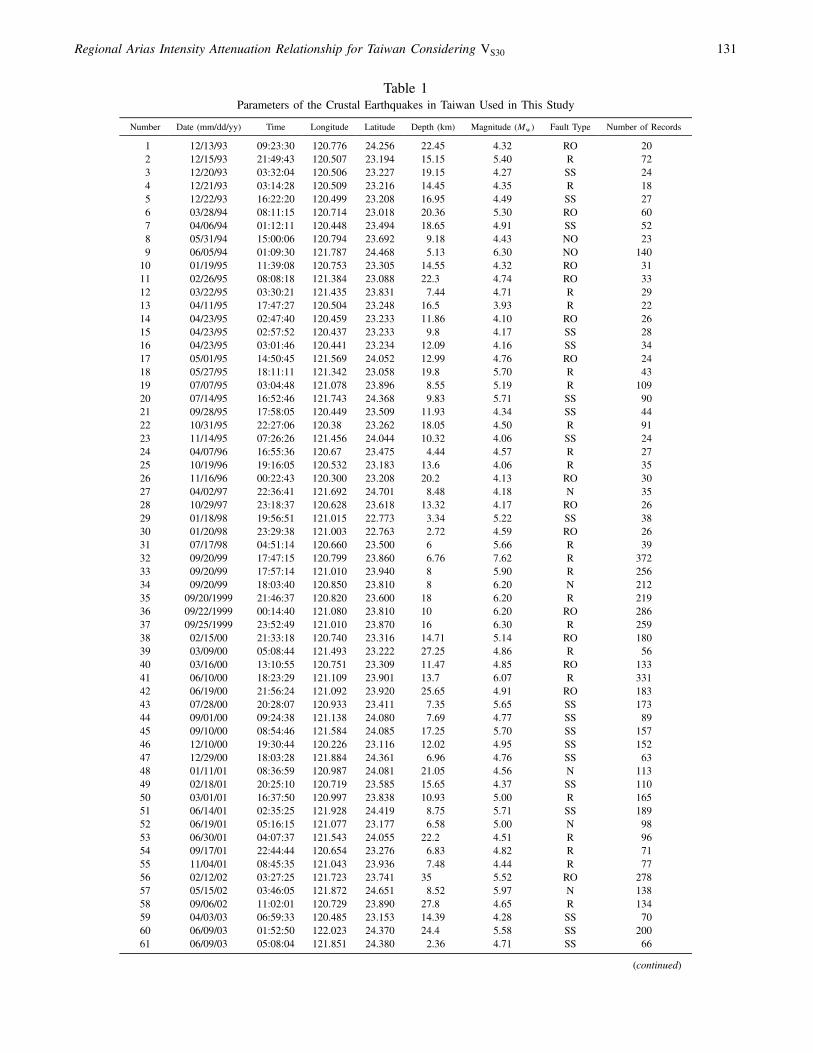
Table 1Parameters of the Crustal Earthquakes in Taiwan Used in This Study
Number Date (mm/dd/yy) Time Longitude Latitude Depth (km) Magnitude (Mw) Fault Type Number of Records
1 12/13/93 09:23:30 120.776 24.256 22.45 4.32 RO 202 12/15/93 21:49:43 120.507 23.194 15.15 5.40 R 723 12/20/93 03:32:04 120.506 23.227 19.15 4.27 SS 244 12/21/93 03:14:28 120.509 23.216 14.45 4.35 R 185 12/22/93 16:22:20 120.499 23.208 16.95 4.49 SS 276 03/28/94 08:11:15 120.714 23.018 20.36 5.30 RO 607 04/06/94 01:12:11 120.448 23.494 18.65 4.91 SS 528 05/31/94 15:00:06 120.794 23.692 9.18 4.43 NO 239 06/05/94 01:09:30 121.787 24.468 5.13 6.30 NO 14010 01/19/95 11:39:08 120.753 23.305 14.55 4.32 RO 3111 02/26/95 08:08:18 121.384 23.088 22.3 4.74 RO 3312 03/22/95 03:30:21 121.435 23.831 7.44 4.71 R 2913 04/11/95 17:47:27 120.504 23.248 16.5 3.93 R 2214 04/23/95 02:47:40 120.459 23.233 11.86 4.10 RO 2615 04/23/95 02:57:52 120.437 23.233 9.8 4.17 SS 2816 04/23/95 03:01:46 120.441 23.234 12.09 4.16 SS 3417 05/01/95 14:50:45 121.569 24.052 12.99 4.76 RO 2418 05/27/95 18:11:11 121.342 23.058 19.8 5.70 R 4319 07/07/95 03:04:48 121.078 23.896 8.55 5.19 R 10920 07/14/95 16:52:46 121.743 24.368 9.83 5.71 SS 9021 09/28/95 17:58:05 120.449 23.509 11.93 4.34 SS 4422 10/31/95 22:27:06 120.38 23.262 18.05 4.50 R 9123 11/14/95 07:26:26 121.456 24.044 10.32 4.06 SS 2424 04/07/96 16:55:36 120.67 23.475 4.44 4.57 R 2725 10/19/96 19:16:05 120.532 23.183 13.6 4.06 R 3526 11/16/96 00:22:43 120.300 23.208 20.2 4.13 RO 3027 04/02/97 22:36:41 121.692 24.701 8.48 4.18 N 3528 10/29/97 23:18:37 120.628 23.618 13.32 4.17 RO 2629 01/18/98 19:56:51 121.015 22.773 3.34 5.22 SS 3830 01/20/98 23:29:38 121.003 22.763 2.72 4.59 RO 2631 07/17/98 04:51:14 120.660 23.500 6 5.66 R 3932 09/20/99 17:47:15 120.799 23.860 6.76 7.62 R 37233 09/20/99 17:57:14 121.010 23.940 8 5.90 R 25634 09/20/99 18:03:40 120.850 23.810 8 6.20 N 21235 09/20/1999 21:46:37 120.820 23.600 18 6.20 R 21936 09/22/1999 00:14:40 121.080 23.810 10 6.20 RO 28637 09/25/1999 23:52:49 121.010 23.870 16 6.30 R 25938 02/15/00 21:33:18 120.740 23.316 14.71 5.14 RO 18039 03/09/00 05:08:44 121.493 23.222 27.25 4.86 R 5640 03/16/00 13:10:55 120.751 23.309 11.47 4.85 RO 13341 06/10/00 18:23:29 121.109 23.901 13.7 6.07 R 33142 06/19/00 21:56:24 121.092 23.920 25.65 4.91 RO 18343 07/28/00 20:28:07 120.933 23.411 7.35 5.65 SS 17344 09/01/00 09:24:38 121.138 24.080 7.69 4.77 SS 8945 09/10/00 08:54:46 121.584 24.085 17.25 5.70 SS 15746 12/10/00 19:30:44 120.226 23.116 12.02 4.95 SS 15247 12/29/00 18:03:28 121.884 24.361 6.96 4.76 SS 6348 01/11/01 08:36:59 120.987 24.081 21.05 4.56 N 11349 02/18/01 20:25:10 120.719 23.585 15.65 4.37 SS 11050 03/01/01 16:37:50 120.997 23.838 10.93 5.00 R 16551 06/14/01 02:35:25 121.928 24.419 8.75 5.71 SS 18952 06/19/01 05:16:15 121.077 23.177 6.58 5.00 N 9853 06/30/01 04:07:37 121.543 24.055 22.2 4.51 R 9654 09/17/01 22:44:44 120.654 23.276 6.83 4.82 R 7155 11/04/01 08:45:35 121.043 23.936 7.48 4.44 R 7756 02/12/02 03:27:25 121.723 23.741 35 5.52 RO 27857 05/15/02 03:46:05 121.872 24.651 8.52 5.97 N 13858 09/06/02 11:02:01 120.729 23.890 27.8 4.65 R 13459 04/03/03 06:59:33 120.485 23.153 14.39 4.28 SS 7060 06/09/03 01:52:50 122.023 24.370 24.4 5.58 SS 20061 06/09/03 05:08:04 121.851 24.380 2.36 4.71 SS 66
(continued)
Regional Arias Intensity Attenuation Relationship for Taiwan Considering VS30 131
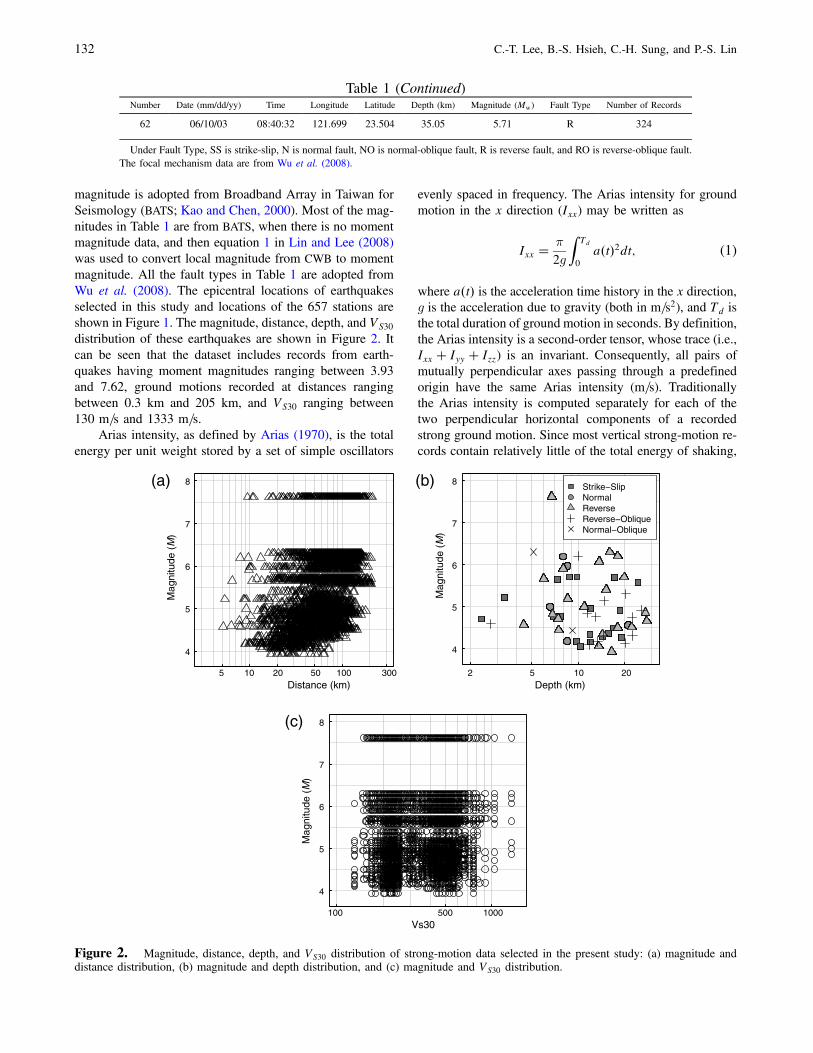
magnitude is adopted from Broadband Array in Taiwan forSeismology (BATS; Kao and Chen, 2000). Most of the mag-nitudes in Table 1 are from BATS, when there is no momentmagnitude data, and then equation 1 in Lin and Lee (2008)was used to convert local magnitude from CWB to momentmagnitude. All the fault types in Table 1 are adopted fromWu et al. (2008). The epicentral locations of earthquakesselected in this study and locations of the 657 stations areshown in Figure 1. The magnitude, distance, depth, and VS30
distribution of these earthquakes are shown in Figure 2. Itcan be seen that the dataset includes records from earth-quakes having moment magnitudes ranging between 3.93and 7.62, ground motions recorded at distances rangingbetween 0.3 km and 205 km, and VS30 ranging between130 m=s and 1333 m=s.
Arias intensity, as defined by Arias (1970), is the totalenergy per unit weight stored by a set of simple oscillators
evenly spaced in frequency. The Arias intensity for groundmotion in the x direction (Ixx) may be written as
Ixx �π2g
ZTd
0
a�t�2dt; (1)
where a�t� is the acceleration time history in the x direction,g is the acceleration due to gravity (both in m=s2), and Td isthe total duration of ground motion in seconds. By definition,the Arias intensity is a second-order tensor, whose trace (i.e.,Ixx � Iyy � Izz) is an invariant. Consequently, all pairs ofmutually perpendicular axes passing through a predefinedorigin have the same Arias intensity (m=s). Traditionallythe Arias intensity is computed separately for each of thetwo perpendicular horizontal components of a recordedstrong ground motion. Since most vertical strong-motion re-cords contain relatively little of the total energy of shaking,
Table 1 (Continued)Number Date (mm/dd/yy) Time Longitude Latitude Depth (km) Magnitude (Mw) Fault Type Number of Records
62 06/10/03 08:40:32 121.699 23.504 35.05 5.71 R 324
Under Fault Type, SS is strike-slip, N is normal fault, NO is normal-oblique fault, R is reverse fault, and RO is reverse-oblique fault.The focal mechanism data are from Wu et al. (2008).
Distance (km)
Mag
nitu
de (
M)
5 10 20 50 100 300
4
5
6
7
8(a)
Depth (km)
Mag
nitu
de (
M)
2 5 10 20
4
5
6
7
8Strike−SlipNormalReverseReverse−ObliqueNormal−Oblique
(b)
Vs30
Mag
nitu
de (
M)
100 500 1000
4
5
6
7
8(c)
Figure 2. Magnitude, distance, depth, and VS30 distribution of strong-motion data selected in the present study: (a) magnitude anddistance distribution, (b) magnitude and depth distribution, and (c) magnitude and VS30 distribution.
132 C.-T. Lee, B.-S. Hsieh, C.-H. Sung, and P.-S. Lin
they have been largely ignored in strong-motion engineeringstudies. In design practice, it would be desirable to predictthe median of the average horizontal component during anearthquake scenario. This quantity Ixx � Iyy is taken to bea constant (Travasarou et al., 2003) and is easy to processfrom two mutually perpendicular strong-motion instruments.The proposed attenuation relationship estimates theparameter
Ia � Ixx � Iyy2
; (2)
where Ixx and Iyy are the Arias intensities computed from thetwo perpendicular horizontal components of the recordedstrong ground motion.
VS30 is a key indicator of the site response dominatingthe ground-motion amplification. VS30 for each free-fieldstrong-motion station in Taiwan has been evaluated and pro-posed by Lee and Tsai (2008). In the 2008 study, if measure-ment data are missing or a quality measurement record is notavailable, SPT-N values were used in the evaluation of ashear-wave velocity for soil and soft rock sites, or a value of760 m=s was assigned to a rock site. During and after 2008,more measurements have become available, and the datasetis updated (see Data and Resources).
Attenuation Model and Regression Method
In the present study, we use a modification of thetheoretically derived Arias intensity attenuation form fromTravasarou et al. (2003). That form is based on the point-source model, with adjustments accounting for the finite-source effect and for nonlinear magnitude scaling. The formis further modified by adding an alternative site term VS30 asfollows:
ln Ia � c1 � c2�M � 6� � c3 ln�M=6� � c4 ln������������������R2 � h2
p�
� c5 ln�VS30=1130� � c6FN � c7FR � η� ε; (3)
whereM is the moment magnitude of an earthquake, R is theclosest distance to the rupture plane (rupture distance) forlarge earthquakes and hypocentral distance for others in km,h is a fictitious hypocentral depth (in km) determined by theregression, VS30 is the average shear-wave velocity in theupper 30 meters of the soil profile, assuming that the VS30
of hard rock is equal to 1130 m=s (Chiou and Youngs, 2008),FN and FR are dummy variables for the fault types (bothbeing 0 for strike-slip faults, 1 and 0, respectively, for normalfaults, and 0 and 1, respectively, for reverse or reverse-oblique faults; rake angle less than 45 degrees or greater than135 degrees is classified as a strike-slip fault), η is earthquakeinter-event errors, and ε is intra-event errors.
The MLE and mixed-effects model are adopted in thenonlinear regression in equation (3) using the Taiwan crustalearthquake dataset mentioned previously. The processingwas done using the nlme module in statistical software R(Pinheiro et al., 2011).
Results and Evaluations
The attenuation relation for the Arias intensity is foundusing the mixed-effects model and MLE, using the Taiwandataset. The median attenuation equation is
ln Ia � 3:757 � 1:043�M � 6� � 18:077 ln�M=6�� 2:251 ln�
�����������������������R2 � 9:562
p� � 1:042 ln�VS30=1130�
� 0:214FN � 0:220FR; (4)
where Ia is the arithmetic mean of the Arias intensities of twohorizontal components in units m=s, and other variables areas previously defined. The inter-event standard deviationσln η is 0.528, the intra-event standard deviation σln ε is 0.842,and the total standard deviation σt, which is composed ofσln η and σln ε, is 0.994. The data used are 3.93–7.62 for earth-quake magnitude, 0.3–205 km for rupture distance, 3–28 kmfor focal depth, and 130–1333 m=s for VS30. These rangesmay be referred to when predicting strong ground motion.Uncertainty should become larger if the model is used out-side of these ranges, especially for a low VS30 value, becausea nonlinear site effect is not considered in the present model.
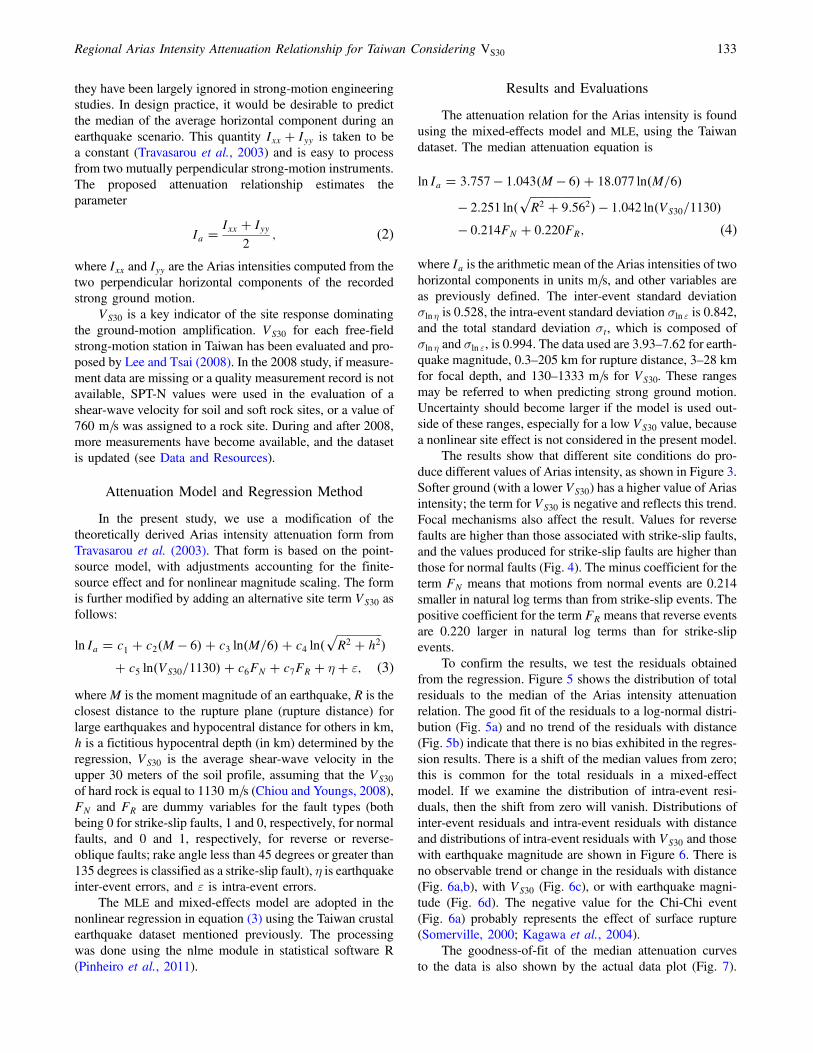
The results show that different site conditions do pro-duce different values of Arias intensity, as shown in Figure 3.Softer ground (with a lower VS30) has a higher value of Ariasintensity; the term for VS30 is negative and reflects this trend.Focal mechanisms also affect the result. Values for reversefaults are higher than those associated with strike-slip faults,and the values produced for strike-slip faults are higher thanthose for normal faults (Fig. 4). The minus coefficient for theterm FN means that motions from normal events are 0.214smaller in natural log terms than from strike-slip events. Thepositive coefficient for the term FR means that reverse eventsare 0.220 larger in natural log terms than for strike-slipevents.
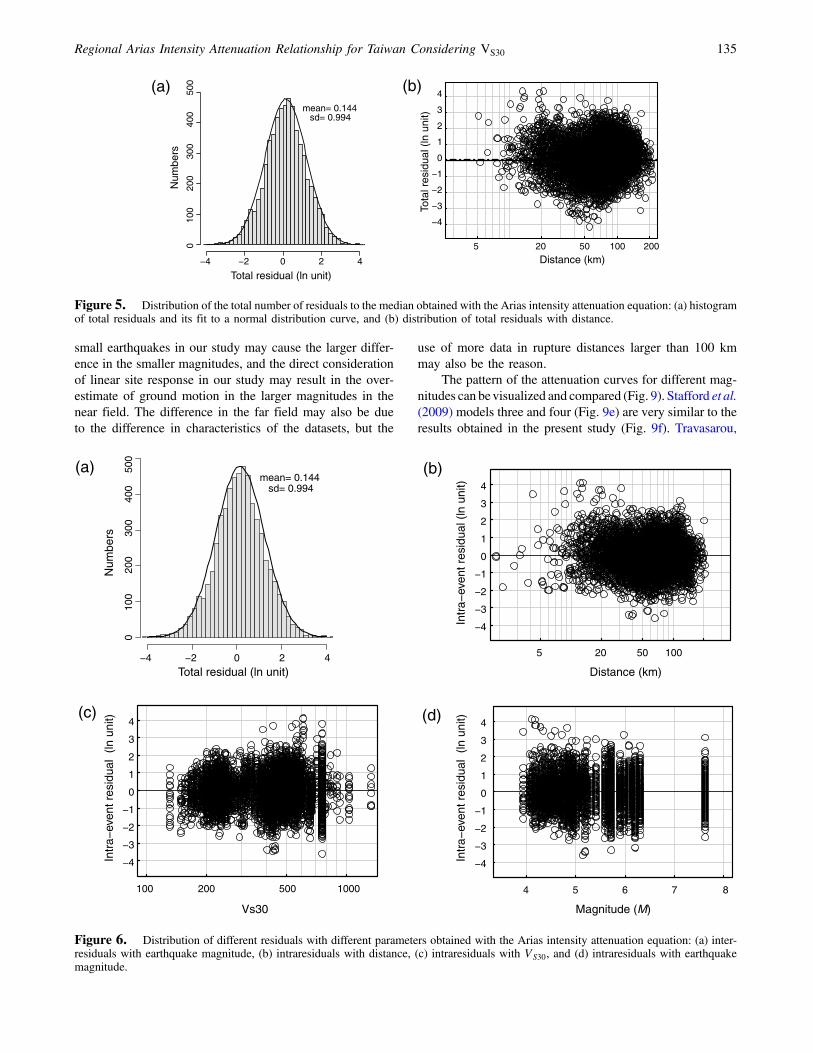
To confirm the results, we test the residuals obtainedfrom the regression. Figure 5 shows the distribution of totalresiduals to the median of the Arias intensity attenuationrelation. The good fit of the residuals to a log-normal distri-bution (Fig. 5a) and no trend of the residuals with distance(Fig. 5b) indicate that there is no bias exhibited in the regres-sion results. There is a shift of the median values from zero;this is common for the total residuals in a mixed-effectmodel. If we examine the distribution of intra-event resi-duals, then the shift from zero will vanish. Distributions ofinter-event residuals and intra-event residuals with distanceand distributions of intra-event residuals with VS30 and thosewith earthquake magnitude are shown in Figure 6. There isno observable trend or change in the residuals with distance(Fig. 6a,b), with VS30 (Fig. 6c), or with earthquake magni-tude (Fig. 6d). The negative value for the Chi-Chi event(Fig. 6a) probably represents the effect of surface rupture(Somerville, 2000; Kagawa et al., 2004).
The goodness-of-fit of the median attenuation curvesto the data is also shown by the actual data plot (Fig. 7).
Regional Arias Intensity Attenuation Relationship for Taiwan Considering VS30 133
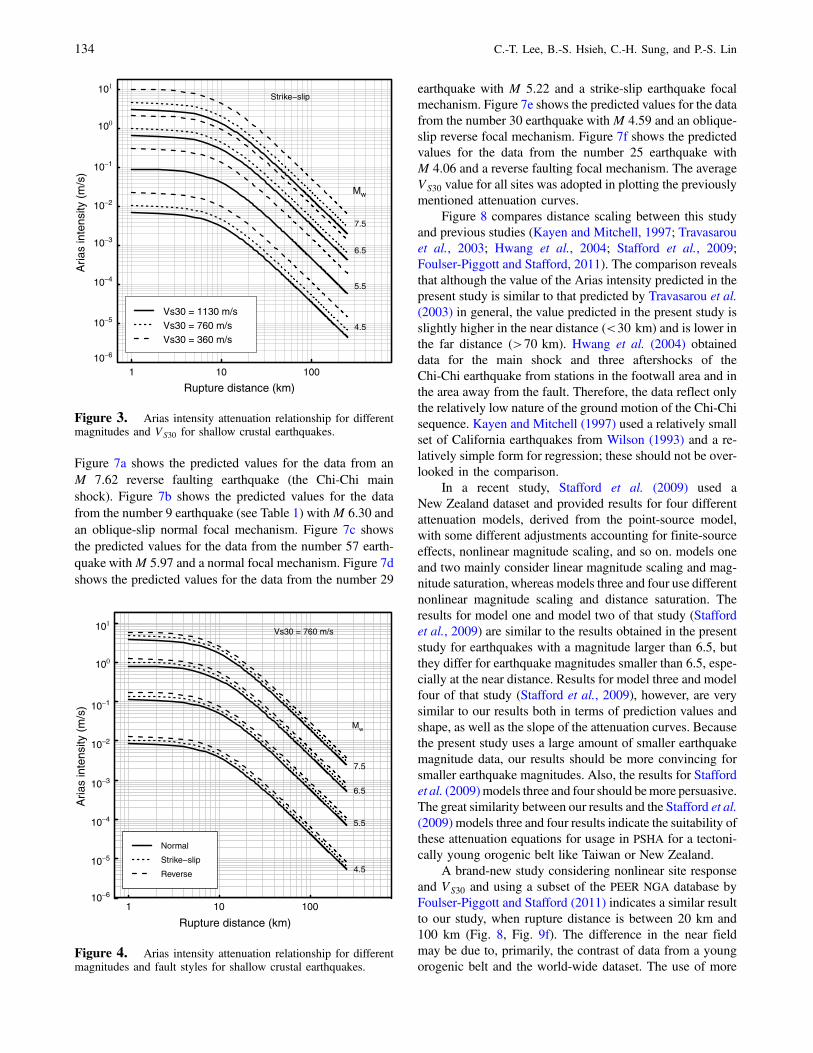
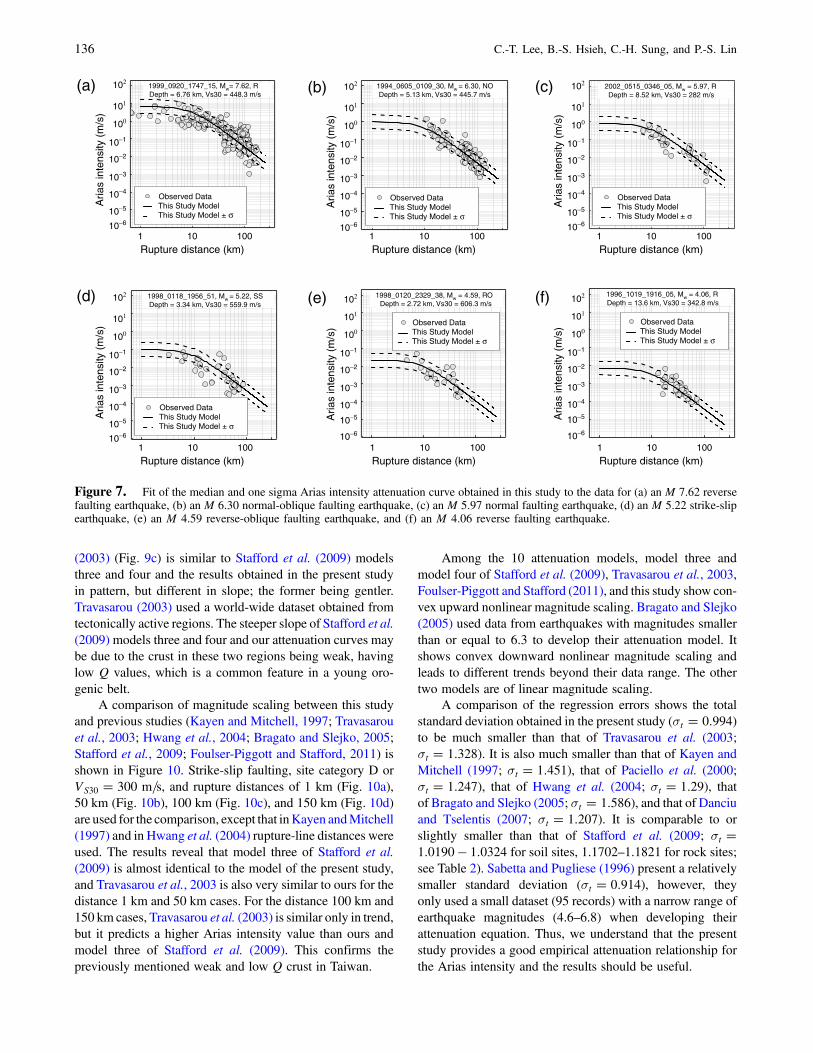
Figure 7a shows the predicted values for the data from anM 7.62 reverse faulting earthquake (the Chi-Chi mainshock). Figure 7b shows the predicted values for the datafrom the number 9 earthquake (see Table 1) withM 6.30 andan oblique-slip normal focal mechanism. Figure 7c showsthe predicted values for the data from the number 57 earth-quake withM 5.97 and a normal focal mechanism. Figure 7dshows the predicted values for the data from the number 29
earthquake with M 5.22 and a strike-slip earthquake focalmechanism. Figure 7e shows the predicted values for the datafrom the number 30 earthquake withM 4.59 and an oblique-slip reverse focal mechanism. Figure 7f shows the predictedvalues for the data from the number 25 earthquake withM 4.06 and a reverse faulting focal mechanism. The averageVS30 value for all sites was adopted in plotting the previouslymentioned attenuation curves.
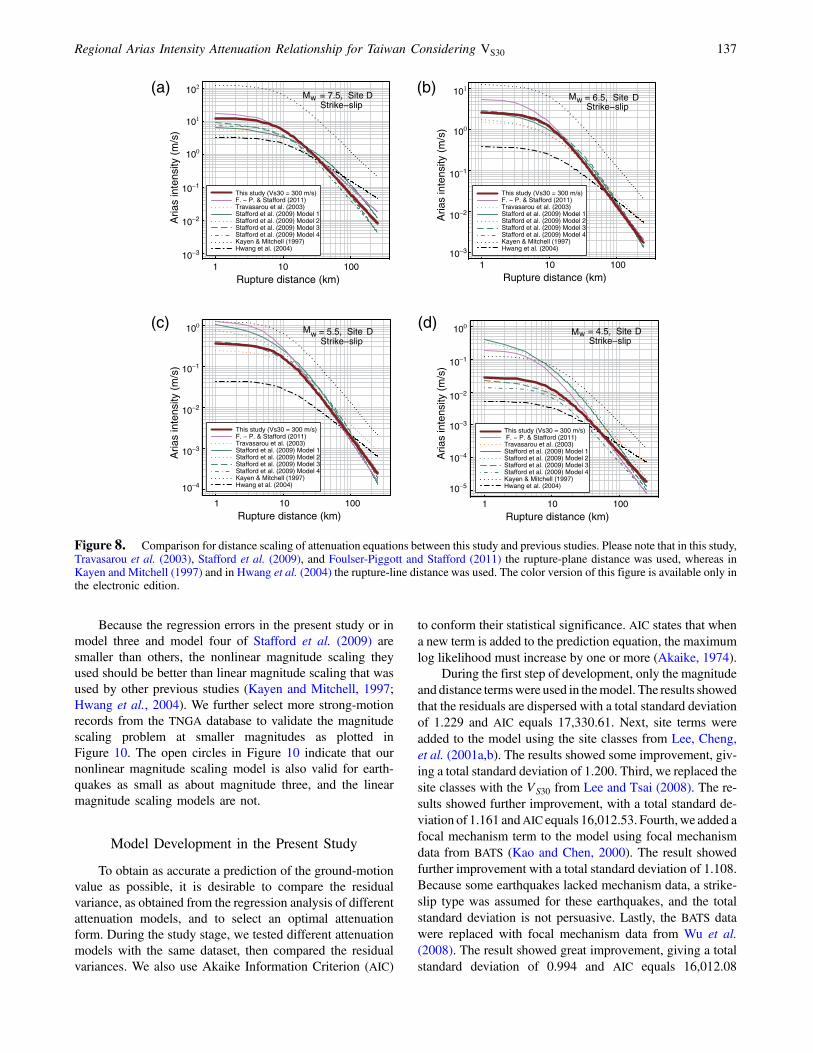
Figure 8 compares distance scaling between this studyand previous studies (Kayen and Mitchell, 1997; Travasarouet al., 2003; Hwang et al., 2004; Stafford et al., 2009;Foulser-Piggott and Stafford, 2011). The comparison revealsthat although the value of the Arias intensity predicted in thepresent study is similar to that predicted by Travasarou et al.(2003) in general, the value predicted in the present study isslightly higher in the near distance (<30 km) and is lower inthe far distance (>70 km). Hwang et al. (2004) obtaineddata for the main shock and three aftershocks of theChi-Chi earthquake from stations in the footwall area and inthe area away from the fault. Therefore, the data reflect onlythe relatively low nature of the ground motion of the Chi-Chisequence. Kayen and Mitchell (1997) used a relatively smallset of California earthquakes from Wilson (1993) and a re-latively simple form for regression; these should not be over-looked in the comparison.
In a recent study, Stafford et al. (2009) used aNew Zealand dataset and provided results for four differentattenuation models, derived from the point-source model,with some different adjustments accounting for finite-sourceeffects, nonlinear magnitude scaling, and so on. models oneand two mainly consider linear magnitude scaling and mag-nitude saturation, whereas models three and four use differentnonlinear magnitude scaling and distance saturation. Theresults for model one and model two of that study (Staffordet al., 2009) are similar to the results obtained in the presentstudy for earthquakes with a magnitude larger than 6.5, butthey differ for earthquake magnitudes smaller than 6.5, espe-cially at the near distance. Results for model three and modelfour of that study (Stafford et al., 2009), however, are verysimilar to our results both in terms of prediction values andshape, as well as the slope of the attenuation curves. Becausethe present study uses a large amount of smaller earthquakemagnitude data, our results should be more convincing forsmaller earthquake magnitudes. Also, the results for Staffordet al. (2009)models three and four should bemore persuasive.The great similarity between our results and the Stafford et al.(2009) models three and four results indicate the suitability ofthese attenuation equations for usage in PSHA for a tectoni-cally young orogenic belt like Taiwan or New Zealand.
A brand-new study considering nonlinear site responseand VS30 and using a subset of the PEER NGA database byFoulser-Piggott and Stafford (2011) indicates a similar resultto our study, when rupture distance is between 20 km and100 km (Fig. 8, Fig. 9f). The difference in the near fieldmay be due to, primarily, the contrast of data from a youngorogenic belt and the world-wide dataset. The use of more
1 10 100
Rupture distance (km)
10−6
10−5
10−4
10−3
10−2
10−1
100
101 A
rias
inte
nsity
(m
/s)
Vs30 = 1130 m/sVs30 = 760 m/sVs30 = 360 m/s
Mw
4.5
5.5
6.5
7.5
Strike−slip
Figure 3. Arias intensity attenuation relationship for differentmagnitudes and VS30 for shallow crustal earthquakes.
1 10 100
Rupture distance (km)
10−6
10−5
10−4
10−3
10−2
10−1
100
101
Aria
s in
tens
ity (
m/s
)
Normal
Strike−slip
Reverse
Mw
4.5
5.5
6.5
7.5
Vs30 = 760 m/s
Figure 4. Arias intensity attenuation relationship for differentmagnitudes and fault styles for shallow crustal earthquakes.
134 C.-T. Lee, B.-S. Hsieh, C.-H. Sung, and P.-S. Lin
small earthquakes in our study may cause the larger differ-ence in the smaller magnitudes, and the direct considerationof linear site response in our study may result in the over-estimate of ground motion in the larger magnitudes in thenear field. The difference in the far field may also be dueto the difference in characteristics of the datasets, but the
use of more data in rupture distances larger than 100 kmmay also be the reason.
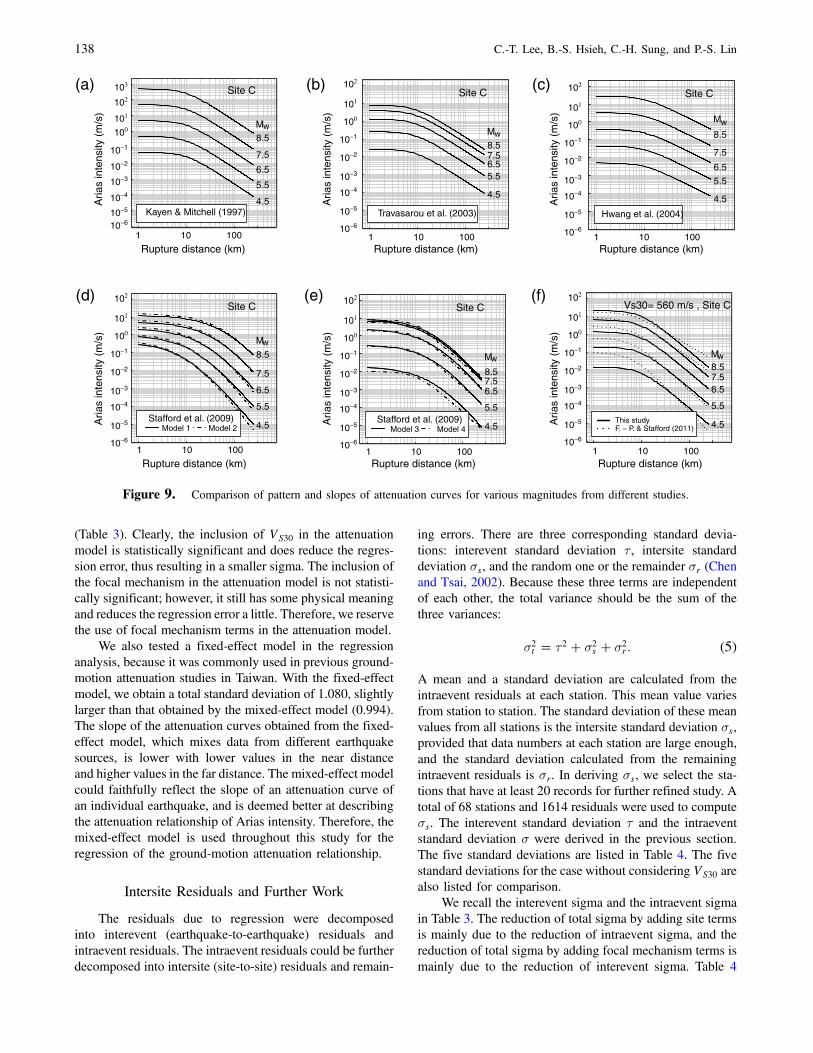
The pattern of the attenuation curves for different mag-nitudes can bevisualized and compared (Fig. 9). Stafford et al.(2009) models three and four (Fig. 9e) are very similar to theresults obtained in the present study (Fig. 9f). Travasarou,
Total residual (ln unit)
Num
bers
−4 −2 0 2 4
010
020
030
040
050
0(a)mean= 0.144
sd= 0.994
5 20 50 100 200
Distance (km)
−4
−3
−2
−1
0
1
2
3
4
Tota
l res
idua
l (ln
uni
t)
(b)
Figure 5. Distribution of the total number of residuals to the median obtained with the Arias intensity attenuation equation: (a) histogramof total residuals and its fit to a normal distribution curve, and (b) distribution of total residuals with distance.
Total residual (ln unit)
Num
bers
010
020
030
040
050
0
(a)mean= 0.144
sd= 0.994
−4 −2 0 2 4 5 20 50 100
Distance (km)
−4
−3
−2
−1
0
1
2
3
4
Intr
a−ev
ent r
esid
ual (
ln u
nit)
(b)
Vs30
−4
−3
−2
−1
0
1
2
3
4
Intr
a−ev
ent r
esid
ual
(ln u
nit)(c)
100 200 500 1000 4 5 6 7 8
Magnitude (M)
−4
−3
−2
−1
0
1
2
3
4
Intr
a−ev
ent r
esid
ual
(ln u
nit)(d)
Figure 6. Distribution of different residuals with different parameters obtained with the Arias intensity attenuation equation: (a) inter-residuals with earthquake magnitude, (b) intraresiduals with distance, (c) intraresiduals with VS30, and (d) intraresiduals with earthquakemagnitude.
Regional Arias Intensity Attenuation Relationship for Taiwan Considering VS30 135
(2003) (Fig. 9c) is similar to Stafford et al. (2009) modelsthree and four and the results obtained in the present studyin pattern, but different in slope; the former being gentler.Travasarou (2003) used a world-wide dataset obtained fromtectonically active regions. The steeper slope of Stafford et al.(2009) models three and four and our attenuation curves maybe due to the crust in these two regions being weak, havinglow Q values, which is a common feature in a young oro-genic belt.
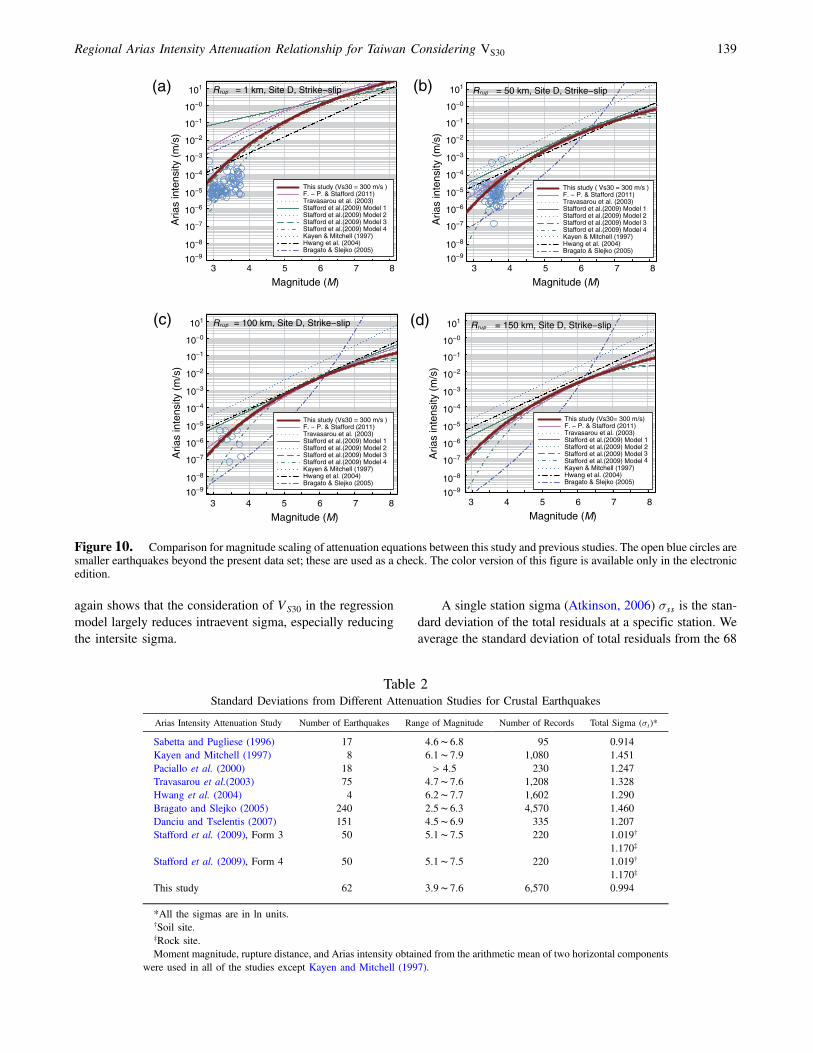
A comparison of magnitude scaling between this studyand previous studies (Kayen and Mitchell, 1997; Travasarouet al., 2003; Hwang et al., 2004; Bragato and Slejko, 2005;Stafford et al., 2009; Foulser-Piggott and Stafford, 2011) isshown in Figure 10. Strike-slip faulting, site category D orVS30 � 300 m=s, and rupture distances of 1 km (Fig. 10a),50 km (Fig. 10b), 100 km (Fig. 10c), and 150 km (Fig. 10d)are used for the comparison, except that inKayen andMitchell(1997) and in Hwang et al. (2004) rupture-line distances wereused. The results reveal that model three of Stafford et al.(2009) is almost identical to the model of the present study,and Travasarou et al., 2003 is also very similar to ours for thedistance 1 km and 50 km cases. For the distance 100 km and150 km cases, Travasarou et al. (2003) is similar only in trend,but it predicts a higher Arias intensity value than ours andmodel three of Stafford et al. (2009). This confirms thepreviously mentioned weak and low Q crust in Taiwan.
Among the 10 attenuation models, model three andmodel four of Stafford et al. (2009), Travasarou et al., 2003,Foulser-Piggott and Stafford (2011), and this study show con-vex upward nonlinear magnitude scaling. Bragato and Slejko(2005) used data from earthquakes with magnitudes smallerthan or equal to 6.3 to develop their attenuation model. Itshows convex downward nonlinear magnitude scaling andleads to different trends beyond their data range. The othertwo models are of linear magnitude scaling.
A comparison of the regression errors shows the totalstandard deviation obtained in the present study (σt � 0:994)to be much smaller than that of Travasarou et al. (2003;σt � 1:328). It is also much smaller than that of Kayen andMitchell (1997; σt � 1:451), that of Paciello et al. (2000;σt � 1:247), that of Hwang et al. (2004; σt � 1:29), thatof Bragato and Slejko (2005; σt � 1:586), and that of Danciuand Tselentis (2007; σt � 1:207). It is comparable to orslightly smaller than that of Stafford et al. (2009; σt �1:0190 � 1:0324 for soil sites, 1.1702–1.1821 for rock sites;see Table 2). Sabetta and Pugliese (1996) present a relativelysmaller standard deviation (σt � 0:914), however, theyonly used a small dataset (95 records) with a narrow range ofearthquake magnitudes (4.6–6.8) when developing theirattenuation equation. Thus, we understand that the presentstudy provides a good empirical attenuation relationship forthe Arias intensity and the results should be useful.
1 10 100
Rupture distance (km)
10−6
10−5
10−4
10−3
10−2
10−1
100
101
102
Aria
s in
tens
ity (
m/s
)
10−6
10−5
10−4
10−3
10−2
10−1
100
101
102
Aria
s in
tens
ity (
m/s
)(a)
Observed Data This Study Model This Study Model ± σ
Observed Data This Study Model This Study Model ± σ
1999_0920_1747_15, Mw= 7.62, R Depth = 6.76 km, Vs30 = 448.3 m/s
1 10 100
Rupture distance (km)
Observed Data This Study Model This Study Model ± σ
1994_0605_0109_30, Mw = 6.30, NODepth = 5.13 km, Vs30 = 445.7 m/s
1 10 100
Rupture distance (km)
1 10 100
Rupture distance (km)1 10 100
Rupture distance (km)1 10 100
Rupture distance (km)
Observed Data This Study Model This Study Model ± σ
2002_0515_0346_05, Mw = 5.97, RDepth = 8.52 km, Vs30 = 282 m/s
(d)
10−6
10−5
10−4
10−3
10−2
10−1
100
101
102
Aria
s in
tens
ity (
m/s
)
10−6
10−5
10−4
10−3
10−2
10−1
100
101
102
Aria
s in
tens
ity (
m/s
)
(b)
(e)
10−6
10−5
10−4
10−3
10−2
10−1
100
101
102
Aria
s in
tens
ity (
m/s
)
10−6
10−5
10−4
10−3
10−2
10−1
100
101
102
Aria
s in
tens
ity (
m/s
)
(c)
(f)
Observed Data This Study Model
This Study Model ± σ
1998_0118_1956_51, Mw = 5.22, SSDepth = 3.34 km, Vs30 = 559.9 m/s
Observed Data This Study Model This Study Model ± σ
1998_0120_2329_38, Mw = 4.59, RODepth = 2.72 km, Vs30 = 606.3 m/s
Observed Data This Study Model This Study Model ± σ
1996_1019_1916_05, Mw = 4.06, RDepth = 13.6 km, Vs30 = 342.8 m/s
Figure 7. Fit of the median and one sigma Arias intensity attenuation curve obtained in this study to the data for (a) an M 7.62 reversefaulting earthquake, (b) an M 6.30 normal-oblique faulting earthquake, (c) an M 5.97 normal faulting earthquake, (d) an M 5.22 strike-slipearthquake, (e) an M 4.59 reverse-oblique faulting earthquake, and (f) an M 4.06 reverse faulting earthquake.
136 C.-T. Lee, B.-S. Hsieh, C.-H. Sung, and P.-S. Lin
Because the regression errors in the present study or inmodel three and model four of Stafford et al. (2009) aresmaller than others, the nonlinear magnitude scaling theyused should be better than linear magnitude scaling that wasused by other previous studies (Kayen and Mitchell, 1997;Hwang et al., 2004). We further select more strong-motionrecords from the TNGA database to validate the magnitudescaling problem at smaller magnitudes as plotted inFigure 10. The open circles in Figure 10 indicate that ournonlinear magnitude scaling model is also valid for earth-quakes as small as about magnitude three, and the linearmagnitude scaling models are not.
Model Development in the Present Study
To obtain as accurate a prediction of the ground-motionvalue as possible, it is desirable to compare the residualvariance, as obtained from the regression analysis of differentattenuation models, and to select an optimal attenuationform. During the study stage, we tested different attenuationmodels with the same dataset, then compared the residualvariances. We also use Akaike Information Criterion (AIC)
to conform their statistical significance. AIC states that whena new term is added to the prediction equation, the maximumlog likelihood must increase by one or more (Akaike, 1974).
During the first step of development, only the magnitudeand distance termswere used in themodel. The results showedthat the residuals are dispersed with a total standard deviationof 1.229 and AIC equals 17,330.61. Next, site terms wereadded to the model using the site classes from Lee, Cheng,et al. (2001a,b). The results showed some improvement, giv-ing a total standard deviation of 1.200. Third, we replaced thesite classes with the VS30 from Lee and Tsai (2008). The re-sults showed further improvement, with a total standard de-viation of 1.161 andAIC equals 16,012.53. Fourth,we added afocal mechanism term to the model using focal mechanismdata from BATS (Kao and Chen, 2000). The result showedfurther improvement with a total standard deviation of 1.108.Because some earthquakes lacked mechanism data, a strike-slip type was assumed for these earthquakes, and the totalstandard deviation is not persuasive. Lastly, the BATS datawere replaced with focal mechanism data from Wu et al.(2008). The result showed great improvement, giving a totalstandard deviation of 0.994 and AIC equals 16,012.08
1 10 100Rupture distance (km)
1 10 100Rupture distance (km)
1 10 100Rupture distance (km)
1 10 100Rupture distance (km)
10−3
10−2
10−1
100
101
102
Aria
s in
tens
ity (
m/s
)
10−3
10−2
10−1
100
101
Aria
s in
tens
ity (
m/s
)
(a) (b)
10−3
10−4
10−2
10−1
100
Aria
s in
tens
ity (
m/s
)
(c)
10−3
10−5
10−4
10−2
10−1
100
Aria
s in
tens
ity (
m/s
)
(d)
This study (Vs30 = 300 m/s) F. − P. & Stafford (2011) Travasarou et al. (2003) Stafford et al. (2009) Model 1 Stafford et al. (2009) Model 2 Stafford et al. (2009) Model 3 Stafford et al. (2009) Model 4 Kayen & Mitchell (1997) Hwang et al. (2004)
= 7.5, Site DStrike−slip
Mw
This study (Vs30 = 300 m/s) F. − P. & Stafford (2011) Travasarou et al. (2003) Stafford et al. (2009) Model 1 Stafford et al. (2009) Model 2 Stafford et al. (2009) Model 3 Stafford et al. (2009) Model 4 Kayen & Mitchell (1997) Hwang et al. (2004)
= 6.5, Site DStrike−slip
Mw
This study (Vs30 = 300 m/s) F. − P. & Stafford (2011) Travasarou et al. (2003) Stafford et al. (2009) Model 1 Stafford et al. (2009) Model 2 Stafford et al. (2009) Model 3 Stafford et al. (2009) Model 4 Kayen & Mitchell (1997) Hwang et al. (2004)
= 5.5, Site DStrike−slip
Mw
This study (Vs30 = 300 m/s) F. − P. & Stafford (2011) Travasarou et al. (2003) Stafford et al. (2009) Model 1 Stafford et al. (2009) Model 2 Stafford et al. (2009) Model 3 Stafford et al. (2009) Model 4 Kayen & Mitchell (1997) Hwang et al. (2004)
= 4.5, Site DStrike−slip
Mw
Figure 8. Comparison for distance scaling of attenuation equations between this study and previous studies. Please note that in this study,Travasarou et al. (2003), Stafford et al. (2009), and Foulser-Piggott and Stafford (2011) the rupture-plane distance was used, whereas inKayen and Mitchell (1997) and in Hwang et al. (2004) the rupture-line distance was used. The color version of this figure is available only inthe electronic edition.
Regional Arias Intensity Attenuation Relationship for Taiwan Considering VS30 137
(Table 3). Clearly, the inclusion of VS30 in the attenuationmodel is statistically significant and does reduce the regres-sion error, thus resulting in a smaller sigma. The inclusion ofthe focal mechanism in the attenuation model is not statisti-cally significant; however, it still has some physical meaningand reduces the regression error a little. Therefore, we reservethe use of focal mechanism terms in the attenuation model.
We also tested a fixed-effect model in the regressionanalysis, because it was commonly used in previous ground-motion attenuation studies in Taiwan. With the fixed-effectmodel, we obtain a total standard deviation of 1.080, slightlylarger than that obtained by the mixed-effect model (0.994).The slope of the attenuation curves obtained from the fixed-effect model, which mixes data from different earthquakesources, is lower with lower values in the near distanceand higher values in the far distance. The mixed-effect modelcould faithfully reflect the slope of an attenuation curve ofan individual earthquake, and is deemed better at describingthe attenuation relationship of Arias intensity. Therefore, themixed-effect model is used throughout this study for theregression of the ground-motion attenuation relationship.
Intersite Residuals and Further Work
The residuals due to regression were decomposedinto interevent (earthquake-to-earthquake) residuals andintraevent residuals. The intraevent residuals could be furtherdecomposed into intersite (site-to-site) residuals and remain-
ing errors. There are three corresponding standard devia-tions: interevent standard deviation τ , intersite standarddeviation σs, and the random one or the remainder σr (Chenand Tsai, 2002). Because these three terms are independentof each other, the total variance should be the sum of thethree variances:
σ2t � τ 2 � σ2
s � σ2r : (5)
A mean and a standard deviation are calculated from theintraevent residuals at each station. This mean value variesfrom station to station. The standard deviation of these meanvalues from all stations is the intersite standard deviation σs,provided that data numbers at each station are large enough,and the standard deviation calculated from the remainingintraevent residuals is σr. In deriving σs, we select the sta-tions that have at least 20 records for further refined study. Atotal of 68 stations and 1614 residuals were used to computeσs. The interevent standard deviation τ and the intraeventstandard deviation σ were derived in the previous section.The five standard deviations are listed in Table 4. The fivestandard deviations for the case without considering VS30 arealso listed for comparison.
We recall the interevent sigma and the intraevent sigmain Table 3. The reduction of total sigma by adding site termsis mainly due to the reduction of intraevent sigma, and thereduction of total sigma by adding focal mechanism terms ismainly due to the reduction of interevent sigma. Table 4
1 10 100
Rupture distance (km)
1 10 100
Rupture distance (km)
1 10 100Rupture distance (km)
1 10 100Rupture distance (km)
1 10 100Rupture distance (km)
1 10 100Rupture distance (km)
10−610−5
10−4
10−3
10−2
10−1
100101
102
103
Aria
s in
tens
ity (
m/s
)(a)
10−6
10−5
10−4
10−3
10−2
10−1
100
101
102
Aria
s in
tens
ity (
m/s
)
(d)
10−6
10−5
10−4
10−3
10−2
10−1
100
101
102
Aria
s in
tens
ity (
m/s
)
(e)
10−6
10−5
10−4
10−3
10−2
10−1
100
101
102
Aria
s in
tens
ity (
m/s
)
(b)
10−6
10−5
10−4
10−3
10−2
10−1
100
101
102
Aria
s in
tens
ity (
m/s
)
(c)
10−6
10−5
10−4
10−3
10−2
10−1
100
101
102
Aria
s in
tens
ity (
m/s
)
(f)
Kayen & Mitchell (1997)
Mw
4.5
5.5
6.5
7.5
8.5
Site C
Travasarou et al. (2003)
Mw
4.5
5.56.57.58.5
Site C
Hwang et al. (2004)
Mw
4.5
5.5
6.5
7.5
8.5
Site C
Model 1 Model 2 Stafford et al. (2009)
Mw
4.5
5.5
6.5
7.5
8.5
Site C
Model 3 Model 4 Stafford et al. (2009)
Mw
4.5
5.5
6.57.58.5
Site C
This studyF. − P. & Stafford (2011)
Mw
4.5
5.5
6.57.58.5
= 560 m/s , Site CVs30
Figure 9. Comparison of pattern and slopes of attenuation curves for various magnitudes from different studies.
138 C.-T. Lee, B.-S. Hsieh, C.-H. Sung, and P.-S. Lin
again shows that the consideration of VS30 in the regressionmodel largely reduces intraevent sigma, especially reducingthe intersite sigma.
A single station sigma (Atkinson, 2006) σss is the stan-dard deviation of the total residuals at a specific station. Weaverage the standard deviation of total residuals from the 68
3 4 5 6 7 8
Magnitude (M)3 4 5 6 7 8
Magnitude (M)
3 4 5 6 7 8
Magnitude (M)
3 4 5 6 7 8
Magnitude (M)
10−9
101
10−0
10−1
10−2
10−3
10−4
10−5
10−6
10−7
10−8
Aria
s in
tens
ity (
m/s
)
(a)
10−9
101
10−0
10−1
10−2
10−3
10−4
10−5
10−6
10−7
10−8
Aria
s in
tens
ity (
m/s
)
(d)
10−9
101
10−0
10−1
10−2
10−3
10−4
10−5
10−6
10−7
10−8
Aria
s in
tens
ity (
m/s
)
(b)
10−9
101
10−0
10−1
10−2
10−3
10−4
10−5
10−6
10−7
10−8
Aria
s in
tens
ity (
m/s
)
(c)
This study (Vs30 = 300 m/s ) F. − P. & Stafford (2011) Travasarou et al. (2003) Stafford et al.(2009) Model 1 Stafford et al.(2009) Model 2 Stafford et al.(2009) Model 3 Stafford et al.(2009) Model 4 Kayen & Mitchell (1997) Hwang et al. (2004) Bragato & Slejko (2005)
= 1 km, Site D, Strike−slipRrup
This study ( Vs30 = 300 m/s ) F. − P. & Stafford (2011) Travasarou et al. (2003) Stafford et al.(2009) Model 1 Stafford et al.(2009) Model 2 Stafford et al.(2009) Model 3 Stafford et al.(2009) Model 4 Kayen & Mitchell (1997) Hwang et al. (2004) Bragato & Slejko (2005)
= 50 km, Site D, Strike−slipRrup
This study (Vs30 = 300 m/s ) F. − P. & Stafford (2011) Travasarou et al. (2003) Stafford et al.(2009) Model 1 Stafford et al.(2009) Model 2 Stafford et al.(2009) Model 3 Stafford et al.(2009) Model 4 Kayen & Mitchell (1997) Hwang et al. (2004) Bragato & Slejko (2005)
= 100 km, Site D, Strike−slipRrup
This study (Vs30= 300 m/s) F. − P. & Stafford (2011) Travasarou et al. (2003) Stafford et al.(2009) Model 1 Stafford et al.(2009) Model 2 Stafford et al.(2009) Model 3 Stafford et al.(2009) Model 4 Kayen & Mitchell (1997) Hwang et al. (2004) Bragato & Slejko (2005)
= 150 km, Site D, Strike−slipRrup
Figure 10. Comparison for magnitude scaling of attenuation equations between this study and previous studies. The open blue circles aresmaller earthquakes beyond the present data set; these are used as a check. The color version of this figure is available only in the electronicedition.
Table 2Standard Deviations from Different Attenuation Studies for Crustal Earthquakes
Arias Intensity Attenuation Study Number of Earthquakes Range of Magnitude Number of Records Total Sigma (σt)*
Sabetta and Pugliese (1996) 17 4:6 ∼ 6:8 95 0.914Kayen and Mitchell (1997) 8 6:1 ∼ 7:9 1,080 1.451Paciallo et al. (2000) 18 > 4:5 230 1.247Travasarou et al.(2003) 75 4:7 ∼ 7:6 1,208 1.328Hwang et al. (2004) 4 6:2 ∼ 7:7 1,602 1.290Bragato and Slejko (2005) 240 2:5 ∼ 6:3 4,570 1.460Danciu and Tselentis (2007) 151 4:5 ∼ 6:9 335 1.207Stafford et al. (2009), Form 3 50 5:1 ∼ 7:5 220 1.019†
1.170‡
Stafford et al. (2009), Form 4 50 5:1 ∼ 7:5 220 1.019†
1.170‡
This study 62 3:9 ∼ 7:6 6,570 0.994
*All the sigmas are in ln units.†Soil site.‡Rock site.Moment magnitude, rupture distance, and Arias intensity obtained from the arithmetic mean of two horizontal components
were used in all of the studies except Kayen and Mitchell (1997).
Regional Arias Intensity Attenuation Relationship for Taiwan Considering VS30 139
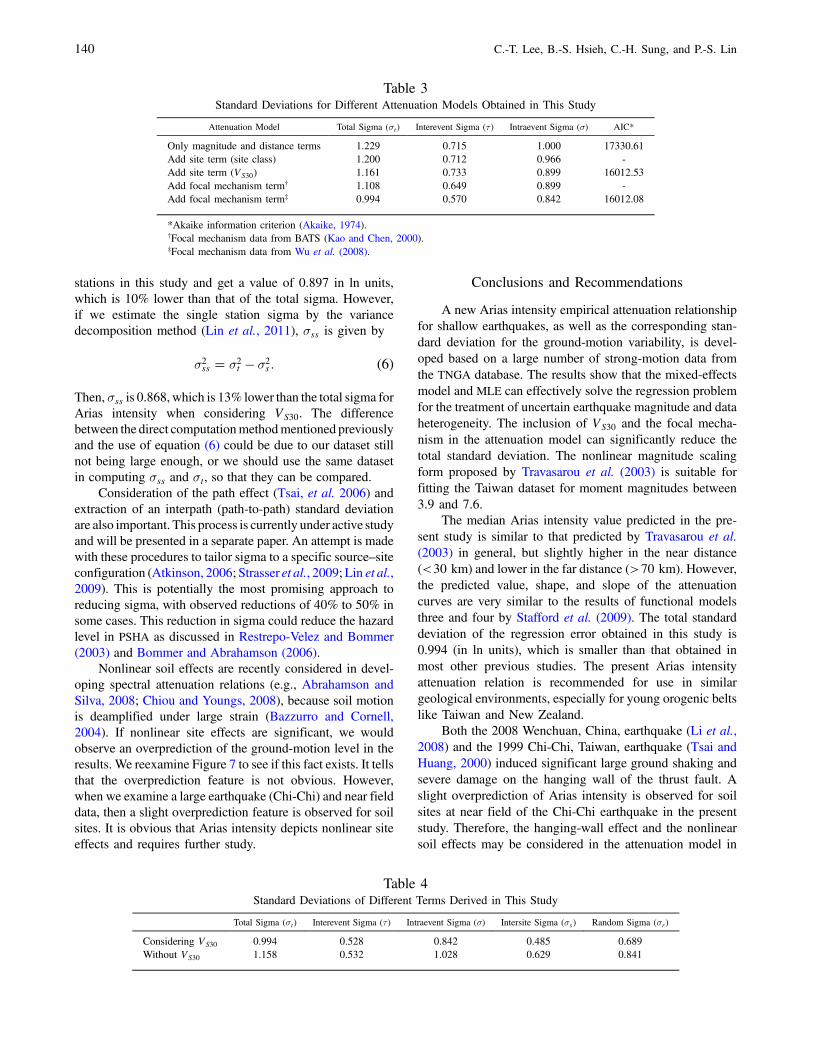
stations in this study and get a value of 0.897 in ln units,which is 10% lower than that of the total sigma. However,if we estimate the single station sigma by the variancedecomposition method (Lin et al., 2011), σss is given by
σ2ss � σ2
t � σ2s : (6)
Then, σss is 0.868, which is 13% lower than the total sigma forArias intensity when considering VS30. The differencebetween the direct computationmethodmentioned previouslyand the use of equation (6) could be due to our dataset stillnot being large enough, or we should use the same datasetin computing σss and σt, so that they can be compared.
Consideration of the path effect (Tsai, et al. 2006) andextraction of an interpath (path-to-path) standard deviationare also important. This process is currently under active studyand will be presented in a separate paper. An attempt is madewith these procedures to tailor sigma to a specific source–siteconfiguration (Atkinson, 2006; Strasser et al., 2009; Lin et al.,2009). This is potentially the most promising approach toreducing sigma, with observed reductions of 40% to 50% insome cases. This reduction in sigma could reduce the hazardlevel in PSHA as discussed in Restrepo-Velez and Bommer(2003) and Bommer and Abrahamson (2006).
Nonlinear soil effects are recently considered in devel-oping spectral attenuation relations (e.g., Abrahamson andSilva, 2008; Chiou and Youngs, 2008), because soil motionis deamplified under large strain (Bazzurro and Cornell,2004). If nonlinear site effects are significant, we wouldobserve an overprediction of the ground-motion level in theresults. We reexamine Figure 7 to see if this fact exists. It tellsthat the overprediction feature is not obvious. However,when we examine a large earthquake (Chi-Chi) and near fielddata, then a slight overprediction feature is observed for soilsites. It is obvious that Arias intensity depicts nonlinear siteeffects and requires further study.
Conclusions and Recommendations
A new Arias intensity empirical attenuation relationshipfor shallow earthquakes, as well as the corresponding stan-dard deviation for the ground-motion variability, is devel-oped based on a large number of strong-motion data fromthe TNGA database. The results show that the mixed-effectsmodel and MLE can effectively solve the regression problemfor the treatment of uncertain earthquake magnitude and dataheterogeneity. The inclusion of VS30 and the focal mecha-nism in the attenuation model can significantly reduce thetotal standard deviation. The nonlinear magnitude scalingform proposed by Travasarou et al. (2003) is suitable forfitting the Taiwan dataset for moment magnitudes between3.9 and 7.6.
The median Arias intensity value predicted in the pre-sent study is similar to that predicted by Travasarou et al.(2003) in general, but slightly higher in the near distance(<30 km) and lower in the far distance (>70 km). However,the predicted value, shape, and slope of the attenuationcurves are very similar to the results of functional modelsthree and four by Stafford et al. (2009). The total standarddeviation of the regression error obtained in this study is0.994 (in ln units), which is smaller than that obtained inmost other previous studies. The present Arias intensityattenuation relation is recommended for use in similargeological environments, especially for young orogenic beltslike Taiwan and New Zealand.
Both the 2008 Wenchuan, China, earthquake (Li et al.,2008) and the 1999 Chi-Chi, Taiwan, earthquake (Tsai andHuang, 2000) induced significant large ground shaking andsevere damage on the hanging wall of the thrust fault. Aslight overprediction of Arias intensity is observed for soilsites at near field of the Chi-Chi earthquake in the presentstudy. Therefore, the hanging-wall effect and the nonlinearsoil effects may be considered in the attenuation model in
Table 3Standard Deviations for Different Attenuation Models Obtained in This Study
Attenuation Model Total Sigma (σt) Interevent Sigma (τ ) Intraevent Sigma (σ) AIC*
Only magnitude and distance terms 1.229 0.715 1.000 17330.61Add site term (site class) 1.200 0.712 0.966 -Add site term (VS30) 1.161 0.733 0.899 16012.53Add focal mechanism term† 1.108 0.649 0.899 -Add focal mechanism term‡ 0.994 0.570 0.842 16012.08
*Akaike information criterion (Akaike, 1974).†Focal mechanism data from BATS (Kao and Chen, 2000).‡Focal mechanism data from Wu et al. (2008).
Table 4Standard Deviations of Different Terms Derived in This Study
Total Sigma (σt) Interevent Sigma (τ ) Intraevent Sigma (σ) Intersite Sigma (σs) Random Sigma (σr)
Considering VS30 0.994 0.528 0.842 0.485 0.689Without VS30 1.158 0.532 1.028 0.629 0.841
140 C.-T. Lee, B.-S. Hsieh, C.-H. Sung, and P.-S. Lin
further studies. Regression errors can be further minimized tomake the results even more applicable in PSHA.
The attempt at effective extraction of the aleatory varia-bility from the total residuals and tailoring sigma to a specificsource–site configuration is actively proceeding. This ispotentially the most promising approach to reducing sigmafor reduction of the hazard level in PSHA and is worth pursu-ing in future studies.
Data and Resources
The strong-motion data used in the present study wereadopted from the TNGA database (Lee et al., 2006). Thisdatabase contains strong-motion data collected from TSMIPfrom 1993 to 2003; this includes the main shock and fiveaftershocks of the Chi-Chi earthquake (Lee, Shin, et al.,2001a,b). Base-line correction and filtering of the data wereperformed according to the standard procedures suggestedby PEER (Darragh et al., 2005).
The strong-motion data used in TNGA were purchasedfrom CWB, Taiwan. They cannot be released to the publicat present; however, the Bureau is now discussing its opendata policy. Researchers need to wait for a while, or contactCWB directly.
The VS30 data used here are updated from Lee and Tsai(2008) and is available at http://gis.geo.ncu.edu.tw/Pub/Vs30.htm (last accessed November 2011).
Acknowledgments
We extend our deepest thanks to the Seismology Center of the CentralWeather Bureau, Taiwan, for providing the strong-motion records. This re-search was partially supported by the Taiwan Earthquake Research Center(TEC) funded through the National Science Council (NSC) under GrantNumber NSC97-2119-M-008-014.
References
Abrahamson, N. A., and W. Silva (2008). Summary of the Abrahamson &Silva NGA ground-motion relations, Earthq. Spectra 24, 67–97, doi10.1193/1.2924360.
Akaike, H. (1974). A new look at the statistical model identification,IEEE Trans. Automat. Contr. 19, no. 6, 716–723, doi 10.1109/TAC.1974.1100705.
Anderson, J. G., Y. Lee, Y. Zeng, and S. Day (1996). Control of strong mo-tion by the upper 30 meters, Bull. Seismol. Soc. Am. 86, 1749–1759.
Arias, A. (1970). A measure of earthquake intensity, in Seismic Design forNuclear Power Plants, R. J. Hansen (Editor), MIT Press, Cambridge,Massachusetts 438–483.
Atkinson, G. M. (2006). Single-station sigma, Bull. Seismol. Soc. Am. 96,446–455, doi 10.1785/0120050137.
Bazzurro, P., and C. A. Cornell (2004). Ground-motion amplification innonlinear soil sites with uncertain properties, Bull. Seismol. Soc.Am. 94, 2090–2109, doi 10.1785/0120030215.
Bommer, J. J., and N. A. Abrahamson (2006). Why do modern probabilisticseismic-hazard analyses often lead to increased hazard estimates?Bull. Seismol. Soc. Am. 96, 1967–1977, doi 10.1785/0120060043.
Bonilla, M. G. (1977). Summary of Quaternary faulting and elevationchanges in Taiwan, Geol. Soc. China Mem. 2, 43–55.
Boore, D. M., and G. M. Atkinson (2008). Ground-motion predictionequations for the average horizontal component of PGA, PGV, and
5%-damped PSA at spectral periods between 0.01 s and 10.0 s, Earthq.Spectra 24, 99–138.
Borcherdt, R. D. (1994). Estimates of site-dependent response spectrafor design (methodology and justification), Earthq. Spectra 10,617–653, doi 10.1193/1.1585791.
Bragato, P. L., and D. Slejko (2005). Empirical ground-motion attenuationrelations for the eastern Alps in the magnitude range 2.5–6.3, Bull.Seismol. Soc. Am. 95, 252–276, doi 10.1785/0120030231.
Building Seismic Safety Council (BSSC) (1997a). NEHPR recommendedprovisions for seismic regulations for new buildings and other struc-tures, Part 1: Provisions (FEMA 302), National Institute of BuildingSciences, developed for the Federal Emergency Management Agency,Washington D. C., 336 p.
Building Seismic Safety Council (BSSC) (1997b). NEHPR recommendedprovisions for seismic regulations for new buildings and other struc-tures, Part 2: Commentary (FEMA 303), National Institute of BuildingSciences, developed for the Federal Emergency Management Agency,Washington D. C., 336 pp.
Campbell, K. W., and Y. Bozorgnia (2008). NGA ground motion model forthe geometric mean horizontal component of PGA, PGV, PGD and 5%damped linear elastic response spectra for periods ranging from 0.01 to10 s, Earthq. Spectra 24, 139–171, doi 10.1193/1.2857546.
Castro, R. R., M. Mucciarelli, F. Pacor, and C. Petrungaro (1997). S-wavesite-response estimates using horizontal-to-vertical spectral rations,Bull. Seismol. Soc. Am. 87, 256–260.
Chen, Y. H., and C. P. Tsai (2002). A new method of estimation of the at-tenuation relationship with variance components, Bull. Seismol. Soc.Am. 92, 1984–1991, doi 10.1785/0120010205.
Chiou, B. S., and R. R. Youngs (2008). An NGA model for the averagehorizontal component of peak ground motion and response spectra,Earthq. Spectra 24, 173–215, doi 10.1193/1.2894832.
Dadson, S. J., N. Hovious, H. Chen, B. W. Dade, S. D. Willett, J. C. Hu,M. J. Horng, M. C. Chen, C. P. Stark, D. Lague, and J. C. Lin (2003).Links between erosion, runoff variability, and seismicity in the Taiwanorogen, Nature 426, 648–651, doi 10.1038/nature02150.
Danciu, L., and G. A. Tselentis (2007). Engineering ground-motionparameters attenuation relationships for Greece, Bull. Seismol. Soc.Am. 97, 162–183, doi 10.1785/0120050087.
Darragh, B., W. Silva, and N. Gregor (2005). Strong motion recordprocessing for the PEER center, http://www.cosmos‑eq.org:16080/events/wkshop_records_processing/papers/Darragh_Silva_Gregor_Paper.pdf (last accessed November 2011).
Foulser-Piggott, R., and P. J. Stafford (2011). A predictive model for Ariasintensity at multiple sites and consideration of spatial correlations,Earthq Eng. Struct. Dynam. doi 10.1002/eqe.1137.
Harp, E. L., and R. C. Wilson (1995). Shaking intensity thresholds for rockfalls and slides: Evidence from 1987 Whittier Narrows and Supersti-tion Hills earthquake strong-motion records, Bull. Seismol. Soc. Am.85, 1739–1757.
Ho, C. S. (1975). An introduction to the geology of Taiwan, explanatorytext of the geologic map of Taiwan, Ministry of Economic Affairs,ROC, 312 p.
Hwang, H., C. K. Lin, Y. T. Yeh, S. N. Cheng, and K. C. Chen (2004).Attenuation relations of Arias intensity based on the Chi-Chi Taiwanearthquake data, Soil Dynam. Earthq. Eng. 24, 509–517.
Idriss, I. M. (2008). An NGA empirical model for estimating the horizontalspectral values generated by shallow crustal earthquakes, Earthq.Spectra 24, 217–242, doi 10.1193/1.2924362.
Kao, H., and W. P. Chen (2000). The Chi-Chi earthquake sequence: Active,out-of-sequence thrust faulting in Taiwan, Science 288, 2346–2349,doi 10.1126/science.288.5475.2346.
Kagawa, T., K. Irikura, and P. G. Somerville (2004). Differences in groundmotion and fault rupture process between the surface and buriedrupture earthquakes, Earth Planets Space 56, 3–14.
Kayen, R. E., and J. K. Mitchell (1997). Assessment of liquefaction potentialduring earthquakes by Arias intensity, J. Geotech. Geoenviron. Eng.123, 1162–1174.
Regional Arias Intensity Attenuation Relationship for Taiwan Considering VS30 141
Keefer, D. K., and R. C. Wilson (1989). Predicting earthquake-inducedlandslides, with emphasis on arid and semi-arid environments, inLandslides in a semi-arid environment with emphasis on the inlandvalleys of southern California, P. M. Sadler and D. M. Morton(Editors), Inland Geological Society of Southern California Publica-tions 2, 118–149.
Lee, C. T., and B. R. Tsai (2008). Mapping VS30 in Taiwan, Terr. Atmos.Ocean. Sci. 19, 671–682, doi 10.3319/TAO.2008.19.6.671(PT).
Lee, C. T., H. C. Chiu, P. S. Lin, and C. T. Cheng (2006). Research onestablishment and maintenance of strong-motion database anddevelopment of user platform, Sinotech Engineering Consultants,Inc., Taiwan, 83 p.
Lee, C. T., C. T. Cheng, C. W. Liao, and Y. B. Tsai (2001a). Site classifica-tion of Taiwan free-field strong-motion stations, Bull. Seismol. Soc.Am. 91, 1283–1297, doi 10.1785/0120000736.
Lee, C. T., C. T. Cheng, C. W. Liao, and Y. B. Tsai (2001b). Data file from“Site classification of Taiwan free-field strong-motion stations”, Bull.Seismol. Soc. Am. 91, 1386, doi 10.1785/0120000753.
Lee, W. H. K., T. C. Shin, K. W. Kuo, K. C. Chen, and C. F. Wu (2001a).CWB free-field strong-motion data from the 21 September Chi-Chi,Taiwan earthquake, Bull. Seismol. Soc. Am. 91, 1370–1376, doi10.1785/0120000744.
Lee, W. H. K., T. C. Shin, K. W. Kuo, K. C. Chen, and C. F. Wu (2001b).Data files from “CWB free-field strong-motion data from the 21 Sep-tember Chi-Chi, Taiwan, earthquake”, Bull. Seismol. Soc. Am. 91,1390, doi 10.1785/0120000756.
Li, X., Z. Zhou, H. Yu, R. Wen, D. Lu, M. Huang, Y. Zhou, and J. Cu (2008).Strong motion observations and recordings from the great WenchuanEarthquake, Earthq. Eng. Eng. Vib. 7, 235–246.
Lin, P. S., and C. T. Lee (2008). Ground-motion attenuation relationships forsubduction-zone earthquakes in northeastern Taiwan, Bull. Seismol.Soc. Am. 98, 220–240, doi 10.1785/0120060002.
Lin, P. S., C. T. Lee, N. Abrahamson, and B. Chiou (2009). Repeatable patheffects on the standard deviation for empirical ground motion models,in Proc. of the Next Generation of Research on Earthquake-inducedLandslides—an International Conference in Commemoration of 10thAnniversary of the Chi-Chi Earthquake, National Central University,Jhongli, Taiwan, 21–26 September 2009.
Lin, P. S., B. Chiou, N. Abrahamson, M.Walling, C. T. Lee, and C. T. Cheng(2011). Repeatable source, site, and path effects on the standard devia-tion for empirical ground motion prediction models, Bull. Seismol.Soc. Am. 101, no. 5, 2251–2295, doi 10.1785/0120090312.
Martin, G. R., and R. Dobry (1994). Earthquake site response and seismiccode provisions, NCEER Bull. 8, 1–6.
Paciello, A., D. Rinaldis, and R. Romeo (2000). Incorporating groundmotion parameters related to earthquake damage into seismic hazardanalysis, in Proc. of the Sixth International Conf. on Seismic Zonation:Managing Earthquake Risk in the 21st Century, Earthquake Engineer-ing Research Institute, Oakland, California, November 2000.
Park, S., and S. Elrick (1998). Predictions of shear-wave velocities insouthern California using surface geology, Bull. Seismol. Soc. Am.88, 677–685.
Pinheiro, J., D. Bates, S. DebRoy, D. Sarkar , and The R Core Team (2011).nlme: Linear and nonlinear mixed effects models, R package version3.1-102.
Restrepo-Velez, L. F., and J. J. Bommer (2003). An exploration of the natureof the scatter in ground motion prediction equations and the implica-tions for seismic hazard assessment, J. Earthq. Eng. 7, 171–199.
Sabetta, F., and A. Pugliese (1996). Estimation of response spectra andsimulation of nonstationary earthquake ground motions, Bull. Seismol.Soc. Am. 86, 337–352.
Seno, T., S. Stein, and A. E. Gripp (1993). A model for the motion of thePhilippine Sea plate consistent with NUVEL-1 and geological data, J.Geophys. Res. 98, 941–948.
Somerville, P. G. (2000). Magnitude scaling of near fault ground motions,Earthq. Eng. Eng. Seismol. 2, no. 2, 15–24.
Stafford, P. J., J. B. Berrill, and J. R. Pettinga (2009). New predictive equa-tions for Arias intensity from crustal earthquakes in New Zealand, J.seismol. 13, 31–52.
Strasser, F. O., N. A. Abrahamson, and J. J. Bommer (2009). Sigma: Issues,insights, and challenges, Seismol. Res. Lett. 80, 40–56, doi 10.1785/gssrl.80.1.40.
Teng, L. S. (1990). Geotectonic evolution of late Cenozoic arc-continentcollision in Taiwan, Tectonophysics 183, 57–76.
Travasarou, T., J. D. Bray, and N. A. Abrahamson (2003). Empirical attenua-tion relationship for Arias intensity, Earthq. Eng. Sturct. Dynam. 32,1133–1155, doi 10.1002/eqe.270.
Tsai, C. P., Y. H. Chen, and C. H. Liu (2006). The path effect in ground-motion variability: An application of the variance-components techni-que, Bull. Seismol. Soc. Am. 96, 1170–1176, doi 10.1785/0120050155.
Tsai, Y. B., and M. W. Huang (2000). Strong ground motion characteristicsof the Chi-Chi, Taiwan earthquake of September 21, 1999, Earthq.Eng. Eng. Seismol. 2, 1–21.
Tsai, Y. B., T. L. Teng, J.M.Chiu, andH. L. Liu (1977). Tectonic implicationsof the seismicity in the Taiwan region,Geol. Soc. ChinaMem. 2, 13–41.
Wilson, R. C. (1993). Relation of Arias intensity to magnitude and distancein Carifornia, U. S. Geol. Surv. Open-File Rept. 93-556, 38–42.
Wilson, R. C., and D. K. Keefer (1985). Predicting areal limits ofearthquake-induced landsliding, in Evaluating Earthquake Hazardsin the Los Angeles Regine, U. S. Geol. Surv. Profess. Pap. 1360,317–345.
Wu, Y. M., L. Zhao, C. H. Chang, and Y. J. Hsu (2008). Focal mechanismdetermination in Taiwan by genetic algorithm, Bull. Seismol. Soc. Am.98, 651–661, doi 10.1785/0120070115.
Yu, S. B., H. Y. Chen, and L. C. Kuo (1997). Velocity field of GPS stations inthe Taiwan area, Tectonophysics 274, 41–59, doi 10.1016/S0040-1951(96)00297-1.
Graduate Institute of Applied GeologyNational Central UniversityNo. 300 Jhongda RdJhongli City, Taoyuan [email protected]@[email protected]@gis.geo.ncu.edu.tw
Manuscript received 4 October 2010
142 C.-T. Lee, B.-S. Hsieh, C.-H. Sung, and P.-S. Lin