Regional and Local Traffic Impacts from Coal Train...
29
JUNE 2014 ENERGY EXPORT CONFERENCE PRESENTATION Regional and Local Traffic Impacts from Coal Train Traffic
Transcript of Regional and Local Traffic Impacts from Coal Train...

June 2014
ENERGY EXPORT CONFERENCE PRESENTATION
Regional and Local Traf f ic Impacts f rom Coal Tra in Traf f ic

Agenda
• Regional Impacts from PSRC Study
• Daily Train Capacity and Utilization
• Vehicle Delay at At-Grade Crossings
• Environmental Impacts
• Local Impacts in Seattle
• Impacts from Gate Down Time
• Collisions and Emergency Vehicle Access
• Potential Crossing Improvements

Study Purpose
Evaluate the impacts to local roads and the environment from potential coal train operations in Seattle and the Puget Sound Region.

Proposed Gateway Paci f ic Terminal
• Construction in two phases.
• At full build out, the Terminal would be able to handle 54 million metric tons of dry bulk commodities per year.
• There would be 18 trains at approximately 1.6 miles in length at full build out.

Freight Rai l in Washington State
Freight Tonnage Traveling by Rail in Washington State (1991-2007)
Mill
ions
of T
ons
• Rail freight volume in the region has significantly increased over the years and is projected to continue increasing over the next twenty years – consistent with national and statewide trends.
• Between 1991 and 2010, rail freight volume traveling through Washington grew by 81 percent – from 64 million tons to 116 million tons.
Source: 2010 Washington State 2010-2030 Freight Rail Plan

Projected Growth in Fre ight Rai l in Washington State
116
238
0
50
100
150
200
250
2010 2035 proj.
Tons
(mill
ions
)
Tons of Freight Moved by Railin Washington State (millions)
Tons of Freight Moved by Rail (millions)
Tons of Freight Moved by Rail in Washington State (millions)
• The State Department of Transportation projects that statewide rail volume will grow by an additional 130 percent by 2035.
• In the Puget Sound region, marine-related rail freight is projected to grow by at least 52.2 million tons by 2030 – a 160 percent increase.
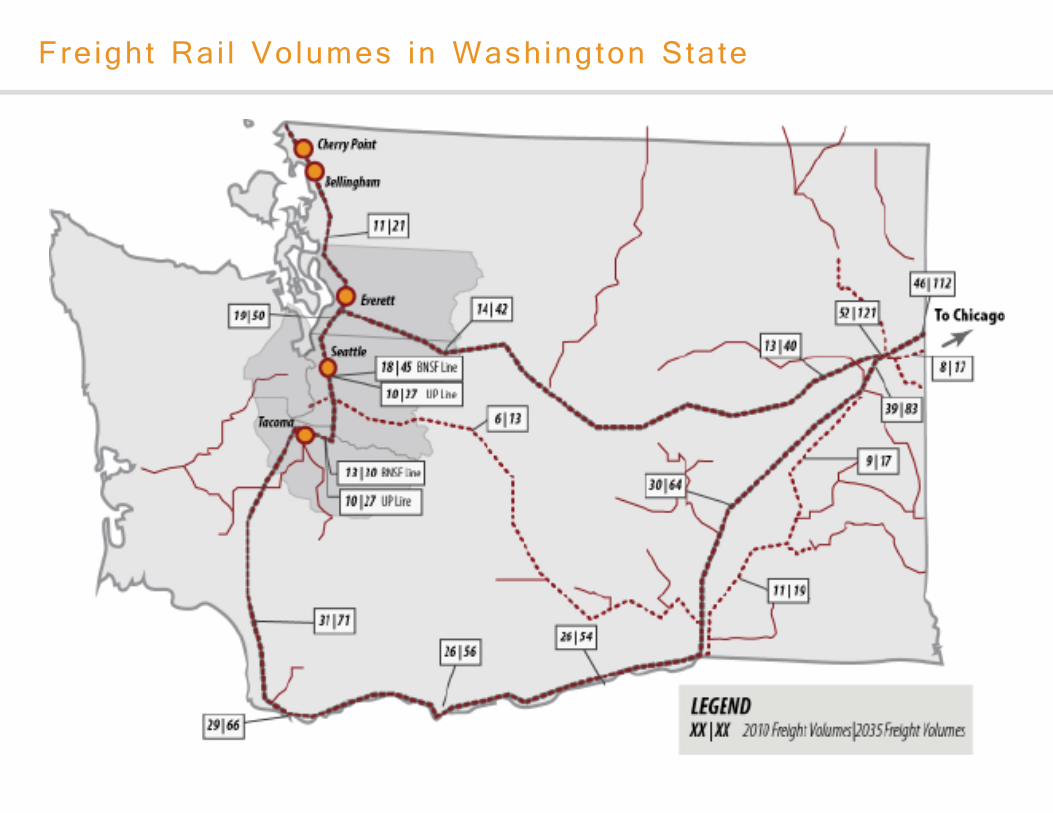
Freight Rai l Volumes in Washington State

Passenger Rai l Volumes in Washington State

Exist ing Dai ly Tra in Capaci ty Ut i l izat ion
WSDOT Washington State Freight Mobility Plan
2010 Daily Train Capacity Utilization
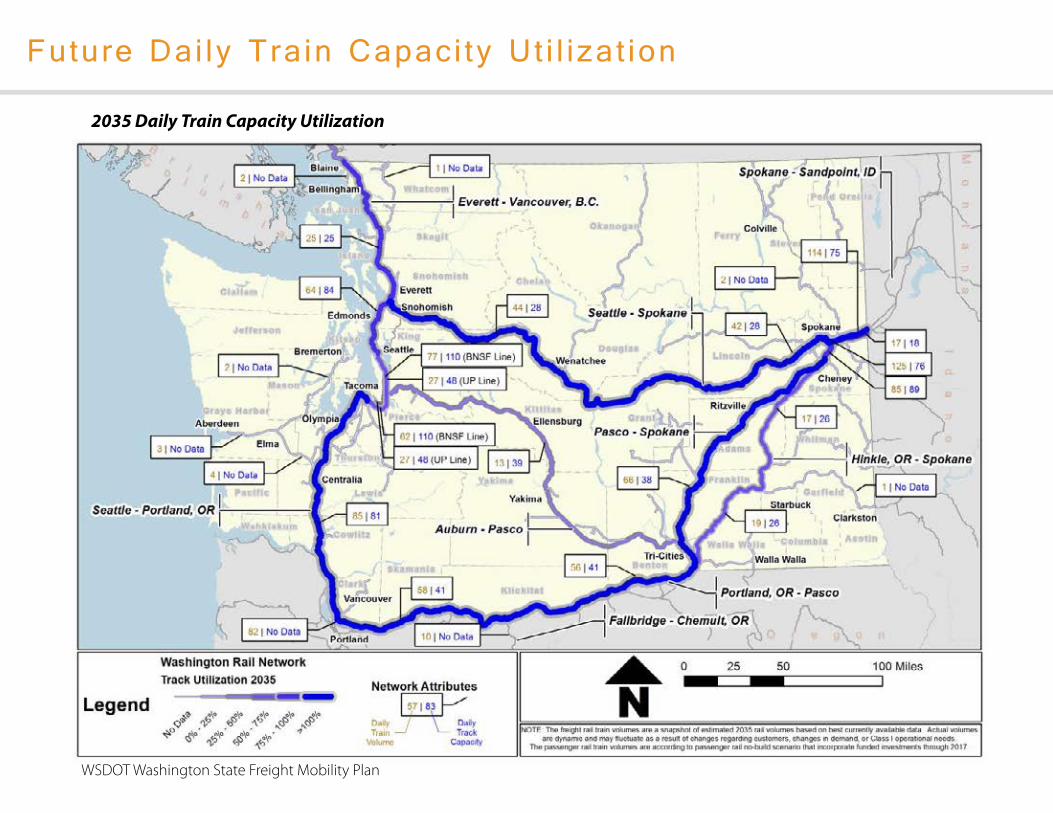
Future Dai ly Tra in Capaci ty Ut i l izat ion
2035 Daily Train Capacity Utilization
WSDOT Washington State Freight Mobility Plan

At-Grade Crossings in the Puget Sound Region
5 At-Grade Crossings
51 At-Grade Crossings
25 At-Grade Crossings
BNSF Mainline
Stevens Pass
Stampede Pass
• 81 At-Grade Crossings in the Central Puget Sound

At-Grade Crossings by Communi ty
Community Number of At-Grade Crossings
North/South Line(shown north to south)
Stanwood 1Marysville 10Mukilteo 1Edmonds 2Seattle 9Kent 8Auburn 4Sumner 5Puyallup 7Tacoma 3Steilacoom 1
Community Number of At-Grade Crossings
Stevens Pass Line(shown west to east)
Everett 3Snohomish 1Monroe 9Sultan 5Gold Bar 2Index 1Baring 1Skykomish 3
Stampede Pass(shown west to east)
Auburn 1Kent 1Maple Valley 1Ravensdale 2

Regional Envi ronmenta l Impacts
• Additional coal trains could impact long-term planning efforts.
• North of Everett, GPT coal trains could depreciate property values.
• Air and water quality could be impacted from added diesel emissions and fugitive coal dust.
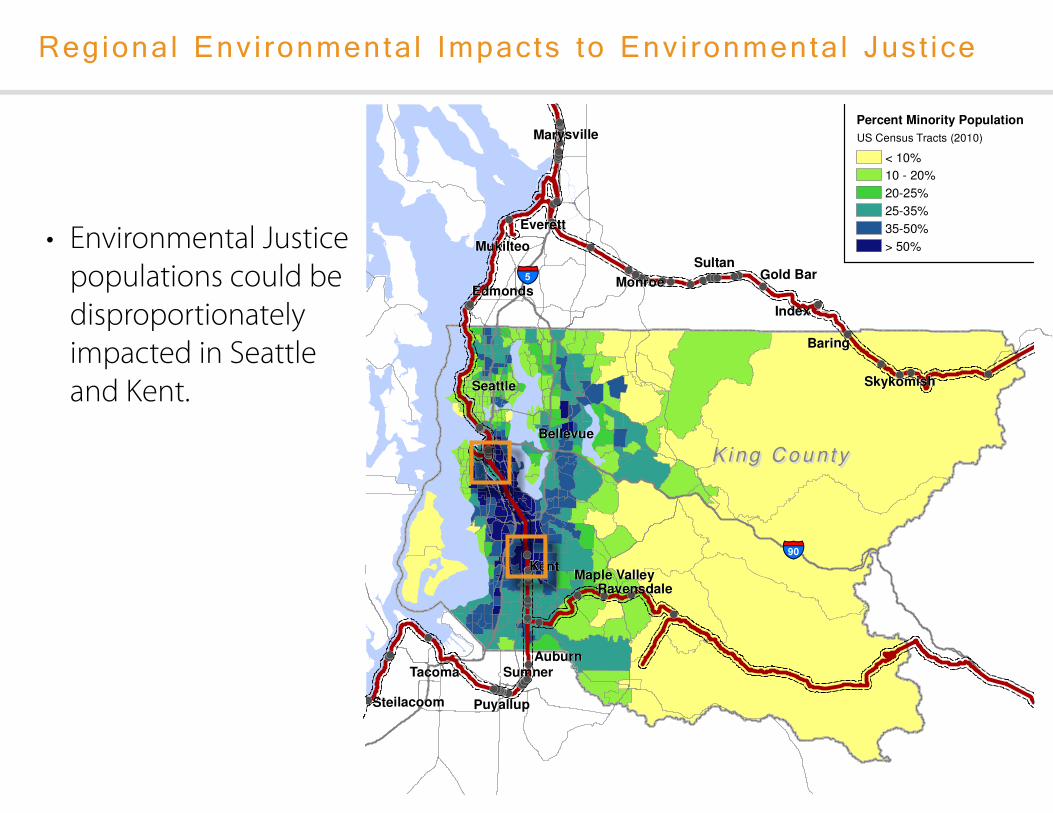
Regional Envi ronmenta l Impacts to Envi ronmenta l Just ice
Seattle
Kent
Tacoma
Everett
Bellevue
Marysville
Puyallup
Edmonds
Sumner
Monroe
Mukilteo
Maple Valley
Sultan
Auburn
Baring
Steilacoom
Gold Bar
Ravensdale
Index
Skykomish
K ing C o u n t yK ing C o u n t y
90
5
Date: 4/9/2014 Path: P:\555_7190_001_GatewayCoal\Figures_R2\Figure_GatewayCoal_King_Minority.mxd
Figure 14:Minority PopulationsKing County
0 5 10
Miles
Puget SoundWashington
BNSF Rail Line 0.5-Mile Study Rail Line Buffer
At-Grade Rail Line Crossing
King County
Percent Minority Population
< 10%
10 - 20%
20-25%
25-35%
35-50%
> 50%
US Census Tracts (2010)
• Environmental Justice populations could be disproportionately impacted in Seattle and Kent.

North Water f ront Study Area
StakeholderS
• Port of Seattle
• Cruise ships
• Olympic Sculpture Park
• Victoria Clipper
• Waterfront businesses
• Freight Community
• Area residents
• Edgewater Hotel
• Marriott Waterfront Hotel
• Washington State Ferries

Dai ly Vehic le Volumes at Rai l road Crossings
0
200
400
600
800
1,000
1,200
1,400
vehi
cles
per
hou
r
BROAD STREET
0
200
400
600
800
1,000
1,200
1,400
vehi
cles
per
hou
r
CLAY STREET
0
200
400
600
800
1,000
1,200
1,400
vehi
cles
per
hou
r
VINE STREET
0
200
400
600
800
1,000
1,200
1,400
vehi
cles
per
hou
r
WALL STREET
ADT 8,900
ADT 1,350
ADT 840
ADT 3,680
AM PEAK PM PEAK
AM PEAK PM PEAK
AM PEAK PM PEAK
AM PEAK PM PEAK

SODO
StakeholderS
• SODO businesses
• Industries
• Stadiums
• Port of Seattle facilities
• Washington State Ferries

0
200
400
600
800
1,000
1,200
1,400
vehi
cles
per
hou
r
HOLGATE STREET
0
200
400
600
800
1,000
1,200
1,400
vehi
cles
per
hou
r
LANDER STREET
0
200
400
600
800
1,000
1,200
1,400
vehi
cles
per
hou
r
HORTON STREET
0
200
400
600
800
1,000
1,200
1,400
vehi
cles
per
hou
r
SPOKANE STREET
Dai ly Vehic le Volumes at Rai l road Crossings
ADT 10,490
ADT 14,080
ADT 3,440
ADT 14,600
AM PEAK PM PEAK
AM PEAK PM PEAK
AM PEAK PM PEAK
AM PEAK PM PEAK
Freight rail
• Approximately 30 freight trains (North Waterfront) and 65 to 85 freight trains (SODO) each day.
• Includes long-haul trains that are 1.6 miles long.PaSSenger rail
• Sound Transit operates 4 Sounder trains north and 9 trains south.
• Amtrak operates 14 trains daily through Seattle.
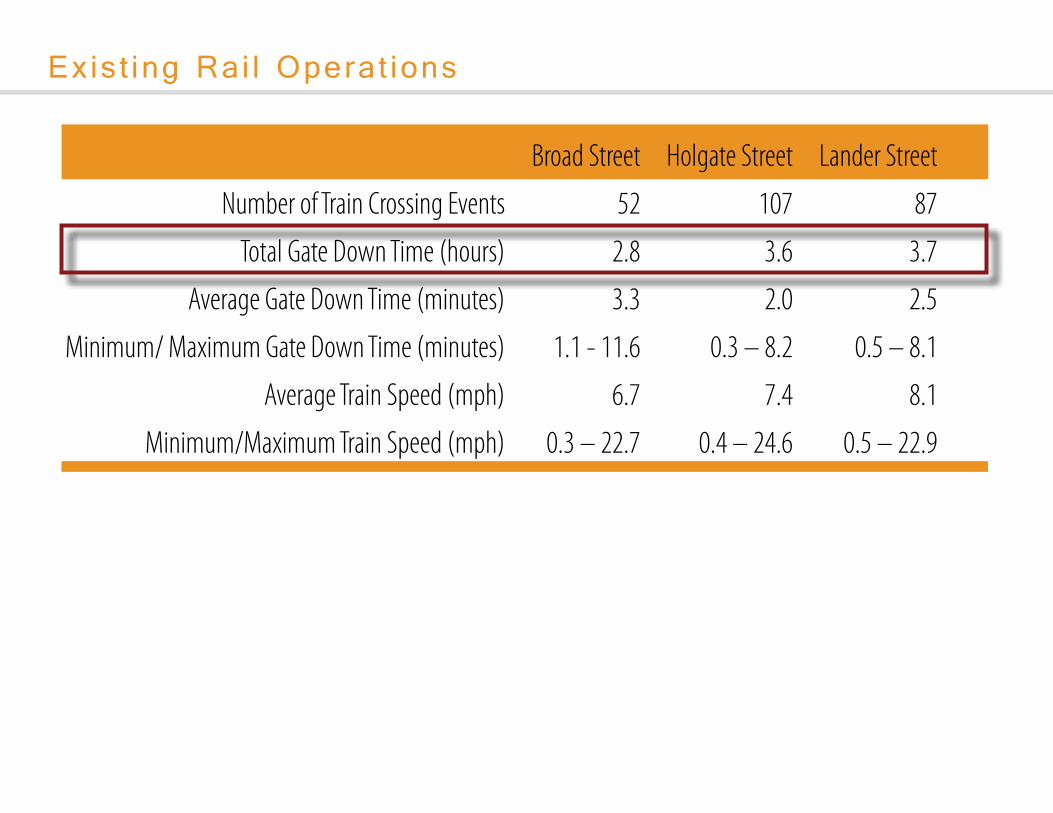
Exist ing Rai l Operat ions
Exist ing Rai l Operat ions
Number of Train Crossing Events
Total Gate Down Time (hours)
Average Gate Down Time (minutes)
Minimum/ Maximum Gate Down Time (minutes)
Average Train Speed (mph)
Minimum/Maximum Train Speed (mph)
Broad Street
52
2.8
3.3
1.1 - 11.6
6.7
0.3 – 22.7
Holgate Street
107
3.6
2.0
0.3 – 8.2
7.4
0.4 – 24.6
Lander Street
87
3.7
2.5
0.5 – 8.1
8.1
0.5 – 22.9
NOTE: Train speed is calculated from the observed number of railroad cars per train, observed gate down time subtracting an assumed gate down time in advance of the train and following the train (approximately 30 seconds), and an assumed railcar length of 60’.

Coal Tra in Assumpt ions
30 mph
20 mph
10 mph
1.3 miles 1.6 milesTrain Length
Gate down time
TrainSpeed
3.1 min 3.7 min
4.4 min
8.4 min
5.3 min
10.2 min
2015 2026• From: www.coaltrainfacts.org/pid
• 2015: 10 daily 1.3 mile long trains
• 2026: 18 daily 1.6 mile long trains
• Operating speed based on existing track observation (24-hours)
oPerating Year

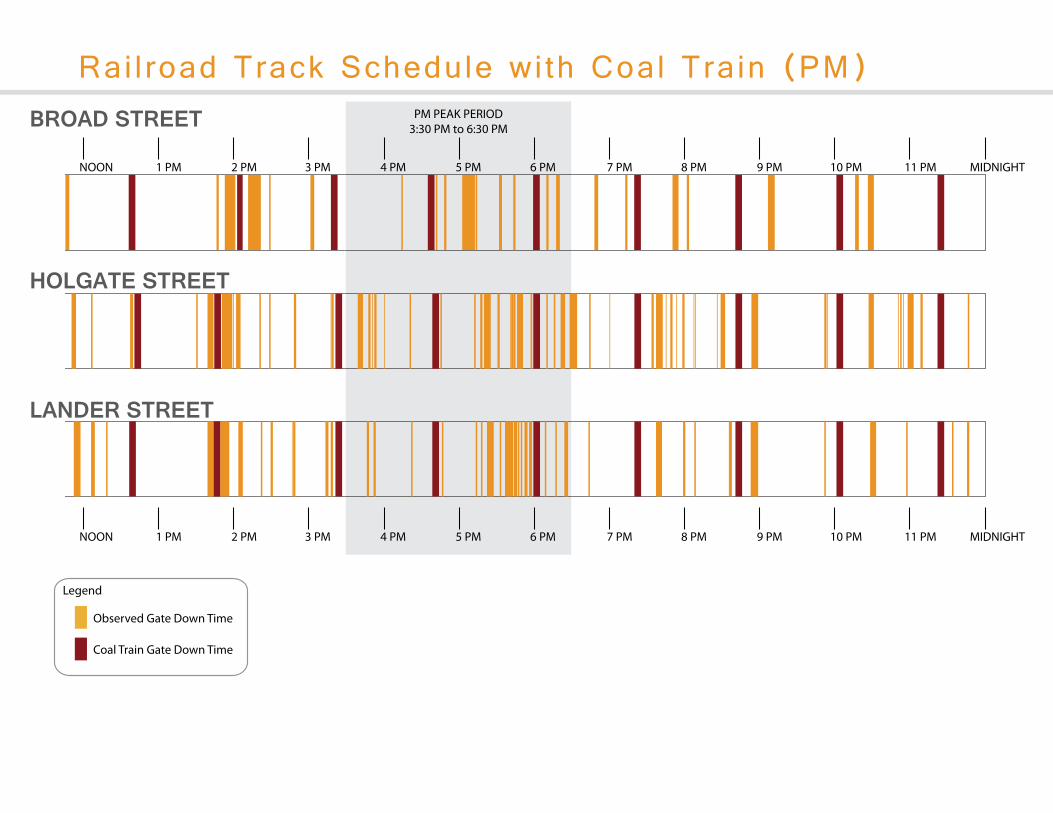
Observed Gate Down Time
MIDNIGHT 6 AM NOON 6 PM
LANDER STREET
MIDNIGHT NOON 6 PM
BROAD STREET AM PEAK PERIOD6:00 AM to 9:00 AM
PM PEAK PERIOD3:30 PM to 6:30 PM
HOLGATE STREET
1 AM 2 AM 3 AM 4 AM 5 AM 7 AM 8 AM 9 AM 10 AM 11 AM 1 PM 2 PM 3 PM 4 PM 5 PM 7 PM 8 PM 9 PM 10 PM 11 PM MIDNIGHT
6 AM1 AM 2 AM 3 AM 4 AM 5 AM 7 AM 8 AM 9 AM 10 AM 11 AM 1 PM 2 PM 3 PM 4 PM 5 PM 7 PM 8 PM 9 PM 10 PM 11 PM MIDNIGHT
Coal Train Gate Down Time
Legend
Rai l road Track Schedule wi th Coal Tra in (AM)
• One day of observed gate down times
• 18 total coal train trips equally distributed (2026)
• Coal trains assumed to be 1.6 miles long, operating at 20 mph
Observed Gate Down Time
MIDNIGHT 6 AM NOON 6 PM
LANDER STREET
MIDNIGHT NOON 6 PM
BROAD STREET AM PEAK PERIOD6:00 AM to 9:00 AM
PM PEAK PERIOD3:30 PM to 6:30 PM
HOLGATE STREET
1 AM 2 AM 3 AM 4 AM 5 AM 7 AM 8 AM 9 AM 10 AM 11 AM 1 PM 2 PM 3 PM 4 PM 5 PM 7 PM 8 PM 9 PM 10 PM 11 PM MIDNIGHT
6 AM1 AM 2 AM 3 AM 4 AM 5 AM 7 AM 8 AM 9 AM 10 AM 11 AM 1 PM 2 PM 3 PM 4 PM 5 PM 7 PM 8 PM 9 PM 10 PM 11 PM MIDNIGHT
Coal Train Gate Down Time
Legend
Rai l road Track Schedule wi th Coal Tra in (PM)
Observed Gate Down Time
MIDNIGHT 6 AM NOON 6 PM
LANDER STREET
MIDNIGHT NOON 6 PM
BROAD STREET AM PEAK PERIOD6:00 AM to 9:00 AM
PM PEAK PERIOD3:30 PM to 6:30 PM
HOLGATE STREET
1 AM 2 AM 3 AM 4 AM 5 AM 7 AM 8 AM 9 AM 10 AM 11 AM 1 PM 2 PM 3 PM 4 PM 5 PM 7 PM 8 PM 9 PM 10 PM 11 PM MIDNIGHT
6 AM1 AM 2 AM 3 AM 4 AM 5 AM 7 AM 8 AM 9 AM 10 AM 11 AM 1 PM 2 PM 3 PM 4 PM 5 PM 7 PM 8 PM 9 PM 10 PM 11 PM MIDNIGHT
Coal Train Gate Down Time
Legend
Broad Street
holgate Street
lander Street

Ant ic ipated Dai ly Gate Down Times
170
213 219201
244 250
214
257 264253
297 303
0
100
200
300
400
Broad Street
Gat
e D
own
Tim
e (m
inut
es)
Existing
30 mph
20 mph
10 mph
Holgate Street Lander Street
170
213 219237
280 286266
309 315
353
396 402Existing
30 mph
20 mph
10 mph
0
100
200
300
400
Broad Street
Gat
e D
own
Tim
e (m
inut
es)
Holgate Street Lander Street
2015 dailY gate down time
• 10 trains
• 1.3 miles long
• 20 mph
2026 dailY gate down time
• 18 trains
• 1.6 miles long
• 20 mph

0
200
400
600
800
1,000
1,200
Que
ue L
engt
h (fe
et)
10 mph
20 mph
30 mph
Existing
Lander Street Hour ly Queues
• Slower coal train operating speed will have a greater impact on vehicles queues.
• Upward trends = Crossing gates down (queue builds)
• Downward trends = Crossing gates up (queue dissipates)

Col l is ions
• 4 train/vehicle collisions in the past 10 years.
• 127 improper crossings within a 24-hour period at Broad Street, South Holgate Street, and South Lander Street crossings.
• Safety concerns increase with more trains.
observed improper crossings 2012
Broad Street
Lander Street
Holgate Street
Total
Bicycle
6
0
0
6
Pedestrian
1
15
0
16
Vehicle
26
34
45
105
Total
33
49
45
127

Emergency Vehic le Access
• Three fire stations directly impacted by rail delays in the SODO and North Waterfront districts.
• Station 14 - 3224 4th Avenue South (Under Construction)
• Station 5 - 925 Alaskan Way
• Station 2 - 2320 4th Avenue
• Blockage from the proposed coal trains would impact emergency vehicle trips to/from the waterfront.
• Delays caused by the coal train affect local area responses and the ability to send emergency resources across the SODO district.

Potent ia l Crossing Improvements
recommendation From PreviouS rePortS
• Grade separated overpasses at Broad Street and Lander Street
• Closure of Holgate Street
• Other possible improvements include:
• Streetscape, such as fencing and plantings
• Consolidating crossing gates
• Raised medians
• Pedestrian gates
• Electronic message signs

Summary
• 10 total coal train trips (5 round trips) are expected each day or one train approximately every 2.4 hours.
• In 2026, the number of daily trains would increase to 18 total daily trips (9 round trips) or one train every 1.3 hours.
• Assumed coal train operating speed of 20 mph; slower speeds would create additional delay.
• In 2015, estimated additional daily gate down time for coal trains could be 31 to 83 minutes; increase of 15% to 49%
• In 2026, the estimated additional daily gate down time for coal trains could be approximately 67 to 183 minutes; increase of 31% to 108%