REGION VII CENTRAL VISAYAS - rsso07.psa.gov.phrsso07.psa.gov.ph/sites/default/files/2018 RSET of...
365
Transcript of REGION VII CENTRAL VISAYAS - rsso07.psa.gov.phrsso07.psa.gov.ph/sites/default/files/2018 RSET of...


REGION VII – CENTRAL VISAYAS
Regional Statistical Services Office VII Cebu City

The Regional Social and Economic Trends (RSET) is an annual publication prepared by the Regional Statistical Services Office VII of the PHILIPPINE STATISTICS AUTHORITY (PSA).
For technical inquiries, please contact us at tel. no. (032) 254-0470 or email us at [email protected]
TERMS OF USE OF PSA PUBLICATIONS The PSA reserves its exclusive right to reproduce all its publications in whatever form. • Any part of this publication should not be reproduced, recopied, lend or repackaged for other parties for any
commercial purposes without written permission from the PSA. • Any part of this publication may
only be reproduced for internal use of the recipient/customer company. • Should any portion of the data in this publication are to be included in a report/article, the source of the data, the title of the
publication and the PSA as publisher should always be cited. • Any information derived from the manipulation of data contained in the publication will no longer be the responsibility of PSA.
ISSN 2619-709X
Published by the Philippine Statistics Authority
Regional Statistical Services Office VII 2nd Floor Gaisano Capital South, Colon Street
Cebu City 6000 Philippines.
October 2018
The 2018 RSET is available in printed and electronic format (PDF in CDRom).
For details, please contact us at (032) 254-0470 or at [email protected]

FOREWORD
The Philippine Statistics Authority (PSA), through its Regional Statistical Services Offices (RSSOs), continues to update and publish local level statistics designed to address the varied statistical needs of planners and policy makers at the subnational
level. Now on its 3rd edition, the Regional Social and Economic Trends (RSET) for Region VII – Central Visayas has proven to be very useful for planning and decision-making and for setting policies towards effective governance and improved service delivery at the local level.
The RSET, a compendium of local level statistics, presents annual time series data on various sectors of the region and its component provinces, cities, and municipalities. It also contains data that are disaggregated in different dimensions
and includes a glossary of terms of official concepts and definitions for statistical purposes as approved by the PSA Board.
We gratefully and sincerely acknowledge the valuable contributions and support of our various data sources for without which, the publication of the RSET would not have been made possible. We likewise appreciate the support of our clients who will patronize and recognize this publication as an important tool for evidence-based decision making.
We reiterate our call on our partner agencies to continue our collaboration towards the empowerment of the countryside by making statistics more available and accessible to users. Furthermore, to continue improving our statistical products and services, we enjoin both our data sources and users to share their comments and suggestions to guide us in improving future editions of the RSET and other publications of the PSA.
PHILIPPINE STATISTICS AUTHORITY REGIONAL
STATISTICAL SERVICES OFFICE VII
October 2018

Contents
Foreword iii
Contents iv
Central Visayas- Regional Statistics Committee v
Philippine Statistics Authority Board vi
Philippine Statistics Authority vi
List of Data Sources vii
Standard Symbols Used vii
Overview of Central Visayas viii
Summary of Major Statistical Series 1
Chapter 1 POPULATION and HOUSING 1-1
Chapter 2 INCOME and PRICES 2-1
Chapter 3 ECONOMIC ACCOUNTS 3-1
Chapter 4 ENVIRONMENT and NATURAL RESOURCES 4-1
Chapter 5 AGRICULTURE and AGRARION REFORM 5-1
Chapter 6 INDUSTRY 6-1
Chapter 7 TRADE 7-1
Chapter 8 TOURISM 8-1
Chapter 9 VITAL, HEALTH and NUTRITION STATISTICS 9-1
Chapter 10 EDUCATION 10-1
Chapter 11 LABOR and EMPLOYMENT 11-1
Chapter 12 SOCIAL SERVICES 12-1
Chapter 13 TRANSPORTATION and COMMUNICATION 13-1
Chapter 14 ENERGY and WATER RESOURCES 14-1
Chapter 15 PUBLIC ADMINISTRATION 15-1
Chapter 16 MONEY and BANKING 16-1
Chapter 17 PUBLIC ORDER, SAFETY and JUSTICE 17-1
Appendix
iv

CENTRAL VISAYAS REGIONAL STATISTICS COMMITTEE
NATIONAL ECONOMIC AND DEVELOPMENT AUTHORITY Chairperson
PHILIPPINE STATISTICS AUTHORITY Vice Chairperson
MEMBERS OF THE COMMITTEE
Bureau of Fisheries and Aquatice Resources Bangko Sentral ng Pilipinas
Bureau of Local Government Finance Commission on Higher Education
Cebu Port Authority Department of Agriculture
Department of Budget and Management Department of Education
Department of Energy Department of Environment and Natural Resources
Department of Health Department of Information and Communications Technology
Department of Interior and Local Government Department of Labor and Employment
Department of Public Works and Highways Department of Science and Technology
Department of Social Welfare and Development Authority Department of Tourism
Department of Trade and Industry Environmental Management Bureau
Technical Education and Skills Development Authority Bohol Island State University
Cebu Normal University Cebu Technological University
Negros Oriental State University Siquijor State College
University of the Philippines- Cebu Philippine Statistical Association, Inc. - Central Visayas
Cebu Provincial Planning Development Office Bohol Provincial Planning Development Office
Negros Oriental Provincial Planning Development Office Siquijor Provincial Planning Development Office
Cebu City Planning Development Office Lapu-Lapu City Planning Development Office Mandaue City Planning Development Office Mactan Cebu International Airport Authority
Mines and Geosciences Bureau National Telecommunications Commission
Philippine Fiber Industry Development Authority
RSC SECRETARIAT
PHILIPPINE STATISTICS AUTHORITY Regional Statistical Services Office VII
v

PHILIPPINE STATISTICS AUTHORITY
USEC. LISA GRACE S. BESALES, Ph. D. National Statistician and Civil Registrar General
Deputy National Statisticians
JOSIE B. PEREZ DANIEL A. ARIASO, SR Censuses and Technical Civil Registration and
Coordination Office Central Office
OIC- DNS ROSALINDA P. BAUTISTA Sectoral Services Office
Regional Statistical Services Office VII
ENGR. ARIEL E. FLORENDO Regional Director
ENGR. LEOPOLDO P. ALFANTA, JR. EDWINA M. CARRIAGA Chief Statistical Specialist Chief Administrative Officer Statistical Operations and Civil Registration and Coordination Division Administrative Support Division
Provincial Statistical Offices
JESSAMYN ANNE C. ALCAZAREN FIRMO C. DIPUTADO Provincial Statistics Officer Provincial Statistics Officer
Bohol Cebu
ENGR. ARIEL T. FORTUITO AURELIA M. CANDA Provincial Statistics Officer Provincial Statistics Officer
Negros Oriental Siquijor
vi

Data Sources
BFP -- Bureau of Fire Protection
BJMP -- Bureau of Jail Management and Penology
BLGF -- Bureau of Local Government Finance
BOI -- Board of Investments
BSP -- Bangko Sentral ng Pilipinas
CAAP -- Civil Aviation Authority of the Philippines
CDA -- Cooperative Development Authority
CHED -- Commission on Higher Education
CPA -- Cebu Ports Authority
DENR -- Department of Environment and Natural Resources
DOE -- Department of Energy
DOH -- Department of Health
DOLE -- Department of Labor and Employment
DOT -- Department of Tourism
DPWH -- Department of Public Works and Highways
DTI -- Department of Trade and Industry
FMB -- Forest Management Bureau
LTFRB -- Land Transportation and Franchising Regulatory Board
LTO -- Land Transportation Office
LWUA -- Local Water and Utilities Association
MCIAA -- Mactan-Cebu International Airport Authority
MGB -- Mines and Geosciences Bureau
NEA -- National Electrification Administration
NTC -- National Telecommunications Commission
PNP -- Philippine National Police
PPA -- Philippine Ports Authority
PSA -- Philippine Statistics Authority
Symbols and Abbreviations Used
CY Census Year
AY Academic Year
FY Fiscal Year
n.e.c. Not Elsewhere Classified
n.e.s. Not Elsewhere Stated
r Revised
… Not Available - (dash)Nil or Zero
.. Not Applicable - Negative value
vii

OVERVIEW OF CENTRAL VISAYAS
Central Visayas lies at the center of the Philippine archipelago between islands
of Luzon and Mindanao. As of 31 December 2018, the region consists of 4 provinces,
namely: Bohol, Cebu, Negros Oriental and Siquijor and 16 cities including the highly
urbanized cities of Cebu, Mandaue and Lapu-Lapu, 116 municipalities and 3,003
barangays. The region is blessed with beautiful beaches, abundant marine lives,
numerous caves, potential areas for mountain trekking, and steeped in historical
significance.
Bohol is about 700 km south of Manila and 70 km southeast of Mactan Island.
Mainland Bohol is oval-shaped surrounded by smaller islands, the largest if which is the
Panglao Island facing Tagbilaran City in the southwest. Its boundaries are Cebu to the
northwest, Leyte to the northeast and Mindanao to the south. The province has a total
land area of 484,095 hectares and has gently rolling terrain, ideal for commercial and
industrial site development. The terrain of Bohol is basically rolling and hilly and about
half of the island is covered in limestone. Near the outer areas of the island are low
mountain ranges. The interior uplands are suitable for agro-forestry and high value
agricultural production. The central and northern lowlands also have fertile grounds and
abundant water supply.
Cebu is located at the center of Central Visayas, to the east of Negros and to the
west of Leyte and Bohol. The province consists of Cebu Island as well as smaller
islands which include Mactan, Bantayan, Malapascua, Olango and the Camotes Island.
The province is characterized by narrow coastlines, limestone plateaus and coastal
plains but with predominant rolling hills and rugged mountain ranges traversing then
northern and southern lengths of the island. Cebu City is the capital of the province and
nicknamed as the “Queen City of the Southern Philippines”. Cebu is one of the most
developed provinces in the Philippines, with Cebu City as the main center of
commerce, trade and industry in the Visayas.
Negros Oriental also called as Eastern Negros is a province located
southwestern portion pf Negros Island. The province is a breathtaking mixture of culture
and modernization. Dumaguete City is the capital of the province. Negros Oriental
faces Cebu to the east across the Tañon Strait and Siquijor to the southeast. The Sulu
sea boarders is to the southwest.
Siquijor is a small island midway between Visayas and Mindanao. It is situated
some 30 km from Negros and about 565 aerial km from Manila. It is bounded in the north
by the islands of Cebu; Bohol to the northwest, to the west is Negros Island, to the east is
Camiguin, to the South is mainland Mindanao. Facing its northern shores in Bohol Strait,
southeast shores in Mindanao Sea. It has a total land area of 34,350 hectares.
Siquijor dubbed as the “Island Paradise of Central Visayas” is a former sub-province
of Negros Oriental and was created as independent province on September 17, 1971 under
Republic Act No. 6398. On November 8, 1971, a special local election was
viii

made to choose the capital of the province. The town of Siquijor received the highest vote
and on September 12, 1972, Siquijor town was proclaimed as the provincial capital.
The region’s economy is basically services-based in 2016 with 52.2 percent of its
work force dependent on the services. The distribution of the region’s total output in
2016 by major economic sector show that 5.4 percent was contributed by agriculture,
hunting, forestry and fishing; 39.1 percent by industry; and 55.5 percent by services.
The economy of Central Visayas grow by 8.8 percent in 2016.
The region’s population count as of August 1, 2015 was placed at 7,396,898 with
an average annual population growth rate of 1.62 percent during 2010-2015 period.
ix

SUMMARY OF MAJOR
STATISTICAL SERIES

Summary of Major Statistical Series
Latest Data Previous Percent
Statistical Series Reference
Reference
Value Value Change Period Period
Chapter 1. POPULATION and HOUSING
1. Population 01 August 2015 01 May 2010
Central Visayas 7,396,898 6,800,100 8.8
Provincial Population Bohol 1,313,560 1,255,128 4.7
Cebu 2,938,982 2,619,362 12.2
Negros Oriental 1,354,995 1,286,666 5.3
Siquijor 95,984 91,066 5.4
City Population (Highly Urbanized) Cebu City 922,611 866,171 6.5
Lapu- Lapu City 408,112 350,467 16.4
Mandaue City 362,654 331,320 9.5
2. Average Annual Population 01 August 2015 01 May 2010 Growth Rate 7,396,898 6,800,100 8.8
3. Population Density (persons in square meter) 2015 2010 Central Visayas 466 428 8.9
Provincial Population Density (persons in square meter)
Bohol 272 260 4.6
Cebu (including HUCs) 594 530 12.1
Negros Oriental 252 239 5.4
Siquijor 284 270 5.2
4. Household Population 2015 Central Visayas 7,359,900
Provincial Household Population Density
Bohol 1,308,785 Cebu (excluding HUCs) 2,928,034
Negros Oriental 1,350,913 Siquijor 95,360
1

Summary of Major Statistical Series
Latest Data Previous Percent
Statistical Series Reference
Reference
Value Value Change Period Period
5. Average Household Size 2015 Central Visayas 4.3
Provincial Average Household Size
Bohol 4.5 Cebu (excluding HUCs) 4.4
Negros Oriental 4.3 Siquijor 4.2
Chapter 2. INCOME and PRICES
1. Average Family Income
(In Pesos) 2015 2012
239,000 209,000 14.4
2. Average Family Expenditure 2015 2012 (In Pesos) 193,000 164,000 17.7
3. Annual Per Capita Poverty 2015 2012 Threshold (In Pesos) 21,914 18,767 16.8
4. Consumer Price Index (CPI) For All Items (2012=100) 2017 2016
Central Visayas 115.2 112.4 2.5
Bohol 115.0 110.7 3.9
Cebu 116.5 114.1 2.1
Negros Oriental 110.8 107.8 2.8
Siquijor 109.7 106.2 3.3
2

Summary of Major Statistical Series
Latest Data Previous Percent
Statistical Series Reference
Reference
Value Value Change Period Period
Chapter 3. ECONOMIC ACCOUNTS
1. Gross Regional Domestic Product (In Thousand Pesos)
At constant 2000 prices 2017 966,897,268 2016 867,162,727 11.5
At current prices 2017 525,163,813 2016 482,898,676 8.8
2. Gross Regional Domestic Product by Industrial Origin 2017 2016
(Level in thousand pesos at
constant 2000 prices)
I. AGRI., HUNTING, FORESTRY & FISHING 30,411,538 28,424,168 7.0
a. Agriculture and Forestry 26,614,813 24,273,175 9.6
b. Fishing 3,796,725 4,150,993 -8.5
II. INDUSTRY SECTOR 210,417,996 204,310,866 3.0
a. Mining & Quarrying 4,328,632 4,581,825 -5.5
b. Manufacturing 134,934,701 127,937,791 5.5
a. Construction 62,023,034 62,578,022 -0.9
b. Electricity, Gas and Water Supply 9,131,629 9,213,228 -0.9
III. SERVICE SECTOR 310,350,418 291,862,351 6.3
a. Transport, Storage & Communication 42,668,773 40,552,669 5.2
b. Trade and Repair of Motor Vehicles, 83,002,403 78,993,983 5.1
Motorcycles, Personal and
Household Goods
c. Financial Intermediation 40,885,529 37,947,557 7.7
d. Real Estate, Renting & Business Act. 62,326,318 57,785,522 7.9
e. Public Administration & Defense; 15,519,421 14,316,460 8.4
Compulsory Social Security
f. Other Services 65,947,974 62,326,159 5.8
3. Per Capita Gross Regional Domestic 2017
2016
Product (In Thousand Pesos)
At constant 2000 prices 71,677 69,315 3.4
At current prices 69,315 127,489 -45.6
Chapter 4. ENVIRONMENT and NATURAL RESOURCES
1. Alienable and dispose land 2017
Bohol 310,455
3

Summary of Major Statistical Series
Latest Data Previous Percent
Statistical Series Reference
Reference
Value Value Change Period Period
Cebu 368,146
Negros Oriental 258,841
Siquijor 26,727 Forest
Bohol 101,271
Cebu 141,091
Negros Oriental 215,748
Siquijor 1,160
Unclassified 65,638
Total Area 1,489,077
2. Volume of Mineral Production Gold (in kilograms) 680 1,050 -35.2
Silver (in kilograms) 2,172 3,465 -37.3
3. Forest Products Production 2017 2016 Logs (in thousand cubic meters)
CENTRAL VISAYAS 28,609 26,575 7.7
Bohol 25,932 18,451 40.5
Cebu 502 7,343 -93.2
Negros Oriental 1,185 619 91.4
Siquijor 990 162 511.1
Chapter 5. AGRICULTURE and AGRARIAN REFORM
1. Palay Production and Area Harvested by Province (Production in metric tons)
Bohol 2017 2016
Production
Irrigated 143,303 104,476 37.2
Rainfed 95,425 56,527 68.8
Area Harvested
Irrigated 38,613 31,429 22.9
Rainfed 33976 23977 41.7
Cebu 2017 2016 Production
Irrigated 13,786 13,135 5.0
Rainfed 728 411 77.1
Area Harvested
Irrigated 4,189 4,016 4.3
Rainfed 291 192 51.6
Negros Oriental 2017 2016 Production
Irrigated 57,501 46,724 23.1
4

Summary of Major Statistical Series
Latest Data Previous Percent
Statistical Series Reference
Reference
Value Value Change Period Period
Rainfed 11,804 9,020 30.9
Area Harvested Irrigated 16,993 15,820 7.4
Rainfed 4,959 4,227 17.3
Siquijor 2017 2016 Production
Irrigated 2,376 1,689 40.7
Rainfed 286 0
Area Harvested Irrigated 610 492 24.0
Rainfed 114 0
2. Corn Production and Area Harvested 2017 2016 by Province Production in metric tons
Bohol 2017 2016 Production
White 10,722 11,732 -8.6
Yellow 42 4 950.0
Area Harvested
White 12,408 12,569 -1.3
Yellow 15 2 650.0
Cebu 2017 2016 Production
White 75,892 82,817 -8.4
Yellow 2,317 1,529 51.5
Area Harvested
White 85,185 92,304 -7.7
Yellow 428 277 54.5
Negros Oriental 2017 2016 Production
White 51,712 55,268 -6.4
Yellow 546 582 -6.2
Area Harvested
White 59,426 62,872 -5.5
Yellow 238 297 -19.9
Siquijor 2017 2016 Production
White 5,239 4,797 9.2
Yellow 0 0
Area Harvested
White 6,067 5,946 2.0
Yellow 0 0
5

Summary of Major Statistical Series
Latest Data Previous Percent
Statistical Series Reference
Reference
Value Value Change Period Period
3. Volume of Production of Livestock & Poultry 2017 2016 by Kind in Central Visayas (In Metric Tons)
Central Visayas Carabao 7,976 7,472 6.7
Cattle 25,229 24,784 1.8
Hog 192,199 175,105 9.8
Goat 9,376 9,305 0.8
Chicken 104,845 99,743 5.1
Chicken Egg 48,568 46,304 4.9
Duck 266 251 6.0
Duck Egg 339 351 -3.4
4. Inventory of Livestock & Poultry 2017 2016 by Kind and By Province (In Metric Tons)
Bohol 2017 2016 Carabao 70,057 69,576 0.7
Cattle 74,236 73,476 1.0
Hog 312,288 306,292 2.0
Goat 82,907 82,143 0.9
Chicken 3,494,575 3,495,644 0.0
Duck 36,241 30,828 17.6
Cebu 2017 2016 Carabao 49,213 48,414 1.7
Cattle 116,019 114,108 1.7
Hog 412,361 385,336 7.0
Goat 224,463 222,750 0.8
Chicken 8,122,380 7,127,770 14.0
Duck 19,047 17,432 9.3
Negros Oriental 2017 2016 Carabao 63,474 62,664 1.3
Cattle 65,103 67,087 -3.0
Hog 243,301 221,993 9.6
Goat 171,524 168,474 1.8
Chicken 1,956,316 1,821,282 7.4
Duck 95,690 95,522 0.2
Siquijor 2017 2016 Carabao 932 877 6.3
Cattle 19,654 19,594 0.3
Hog 44,455 43,071 3.2
Goat 21,692 20,048 8.2
Chicken 595,711 592,331 0.6
Duck 1,056 916 15.3
6

Summary of Major Statistical Series
Latest Data Previous Percent
Statistical Series Reference
Reference
Value Value Change Period Period
5. Animals Slaughtered, Central Visayas (In Heads) 2017 2016
Carabao 9,189 7,087 29.7
Cattle 59,697 54,633 9.3
Goat 47,897 52,403 -8.6
Swine 1,160,980 1,052,472 10.3
6. Fish Production, Central Visayas (In Metric Tons) 2017 2016
Commercial 17,310.80 30,453.91 -43.2
Municipal 59,307.99 55,076.20 7.7
Aquaculture 74,878.45 98,111.32 -23.7
Chapter 6. ESTABLISHMENT CHARACTRISTICS: INDUSTRICL SECTOR
1. Building Construction 2017 2016 Total Number 15,069 19,941 -24.4
Total Floor Area 2,993,195 3,225,731 -7.2
Total Value 30,968,940 34,034,335 -9.0
2. Residential 2017 2016 Total Number 11,873 17,122 -30.7
Floor Area (In Sq. Meter) 1,459,646 2,163,711 -32.5
Total Value (In Thousands) 14,229,714 21,302,827 -33.2
Non Residential 2017 2016 Total Number 2,275 1,776 28.1
Floor Area (In Sq. Meter) 1,496,635 1,028,084 45.6
Total Value (In Thousands) 14,373,271 9,592,808 49.8
Chapter 7. TRADE
1. QUANTITY and VALUE of Domestic Trade and Mode of Transport in Central Visayas (Quantity in tons, Value in thousand pesos)
Quantity 2017p 2016
Water 3,034,424 1,845,219 64.4
Air 3,734 1,911 95.4
Value Water 118,537,514 85,891,965 38.0
Air 90,184 68,499 31.7
7

Summary of Major Statistical Series
Latest Data Previous Percent
Statistical Series Reference
Reference
Value Value Change Period Period
Chapter 8. TOURISM
1. Visitor Arrivals 2017 2016
Domestic 4,068,648 3,619,941 12.4
Foreign 2,881,801 2,323,129 24.0
Asia 1,969,650 1,625,925 21.1
America 285,475 248,568 14.8
Europe 361,165 299,174 20.7
Ocenia 90,069 74,631 20.7
Africa 4,256 4,047 5.2
1. Distribution of Travellers
Bohol 2017 2016 Domestic 668,858 731,915 -8.6
Overseas Filipinos 730 1,958 -62.7
Foreign 443,477 266,313 66.5
Asia 299,859 142,877 109.9
America 34,325 31,950 7.4
Europe 92,846 70,637 31.4
Ocenia 13,995 9,329 50.0
Africa 847 1,296 -34.6
Cebu 2017 2016 Domestic 2,613,005 2,288,571 14.2
Overseas Filipinos 18,833 8,051 133.9
Foreign 2,245,209 1,875,516 19.7
Asia 1,580,480 1,389,497 13.7
America 255,166 193,068 32.2
Europe 228,812 176,853 29.4
Ocenia 70,577 58,047 21.6
Africa 3,233 2,499 29.4
Negros Oriental 2017 2016 Domestic 716,393 554,550 29.2
Overseas Filipinos 4,662 1,524 205.9
Foreign 148,719 140,329 6.0
Asia 69,795 77,345 -9.8
America 19,370 22,290 -13.1
Europe 25,897 35,842 -27.7
Ocenia 4,252 6,067 -29.9
Africa 110 198 -44.4
8

Summary of Major Statistical Series
Latest Data Previous Percent
Statistical Series Reference
Reference
Value Value Change Period Period
Siquijor 2017 2016
Domestic 52,392 44,905 16.7
Overseas Filipinos - -
Foreign 44,396 4,097 983.6
Asia 19,516 16,206 20.4
America 3,694 4,180 -11.6
Europe 17,844 18,323 -2.6
Ocenia 1,188 1,245 -4.6
Africa 54 66 -18.2
Chapter 9. VITAL, HEALTH and NUTRITION STATISTICS
1. Marriages By Province of Occurrence 2017 2016
Central Visayas 36,776 34,192 7.6
Bohol 7,046 6,512 8.2
Cebu 21,627 19,809 9.2
Negros Oriental 7,711 7,551 2.1
Siquijor 392 320 22.5
2. Live Births by Usual Residence of Mother 2017 2016 Central Visayas 141,833 145,550 -2.6
Bohol 21,823 22,420 -2.7
Cebu 96,643 97,876 -1.3
Negros Oriental 21,990 23,861 -7.8
Siquijor 1,377 1393 -1.1
Chapter 10. EDUCATION 2013 2008
1. Population of 10 years and over By Sex (In Thousands)
Both Sexes 5,656 5,283 7.1
Male 2,841 2,647 7.3
Female 2,814 2,637 6.7
2. Functional Literacy Rate of Population 2013 2008 10- 64 years old by Sex
Both Sexes 87.3 86.6 0.8
Male 84.8 84.4 0.5
Female 89.8 88.8 1.1
9

Summary of Major Statistical Series
Latest Data Previous Percent
Statistical Series Reference
Reference
Value Value Change Period Period
3. Enrolment in Tertiary Institution by Discpline
and By Sex 2016-2017 2015-2016
MALE Discipine
Business 14,756 18,408 -19.8
Education Science and Teacher Training 6,754 11,140 -39.4
Engineering 24,213 33,196 -27.1
Maritime 16,837 27,590 -39.0
IT- related 9,477 12,986 -27.0
FEMALE Discipine
Business 31,375 41,659 -24.7
Education Science and Teacher Training 31,060 39,093 -20.5
Engineering 11,010 19,141 -42.5
Maritime 439 655 -33.0
IT- related 7,411 10,293 -28.0
4. Graduates of Tertiary Institutions 2016-2017 2015-2016
MALE Discipline
Pre and Post Baccalaureate 5,230 4,672 11.9
Masters 2,641 883 199.1
Doctoral 157 185 -15.1
FEMALE Discipline
Pre and Post Baccalaureate 4,371 3,595 21.6
Masters 1,057 1,530 -30.9
Doctoral 273 285 -4.2
Chapter 11. LABOR and EMPLOYMENT
1. Labor Force (In Thousands) 2017 2016
CENTRAL VISAYAS
Employed 3,224 - 2,891 11.5
Unemployed 154 - 1,586 -90.3
MALE
Employed 1,884 1,526 23.5
Unemployed 103 1,530 -93.3
FEMALE
Employed 1,340 1,365 -1.8
Unemployed 51 56 -8.9
10

Summary of Major Statistical Series
Latest Data Previous Percent
Statistical Series Reference
Reference
Value
Value
Change Period Period
2. Labor Participation Rate (%) Oct-17 Oct-16 CENTRAL VISAYAS 63.6 68.1 -6.6
Male 74.7 78.3 -4.6
Female 52.8 57.9 -8.8
3. Unemployment Rate (%) Oct-17 Oct-16 CENTRAL VISAYAS 4.1 5.0 -18.0
Male 4.9 5.3 -7.5
Female 3.1 4.6 -32.6
Chapter 12. SOCIAL SERVICES
1. Household Population with Disability
By Sex and By Province (All Ages) 2010
CENTRAL VISAYAS
Bohol Male 11,705
Female 11,210
Cebu
Male 19,887
Female 19,536
Negros Oriental
Male 12,630
Female 11,670
Siquijor
Male 1,091
Female 1,108
Chapter 13. TRANSPORTATION and COMMUNICATION
1. Number of Motor Vehicles Registered 2016 2015
By Province
CENTRAL VISAYAS 726,028 715,016 1.5
Bohol 87,458 74,056 18.1
Cebu 544,472 551,856 -1.3
Negros Oriental 84,707 80,797 4.8
Siquijor 9,391 8,307 13.0
2. Number of Permits/Licenses Issued 2016 2015 By Province
CENTRAL VISAYAS
Bohol 57,784 54,272 6.5
Cebu 313,532 307,440 2.0
Negros Oriental 61,467 62,352 -1.4
Siquijor 5,263 4,487 17.3
11

Summary of Major Statistical Series
Latest Data Previous Percent
Statistical Series Reference
Reference
Value Value Change Period Period
3. Existing Road Length (In km) 2017 2016
CENTRAL VISAYAS Concrete 1,438.03 1,397.56 2.9
Asphalt 854.32 848.02 0.7
Gravel 8.93 50.50 -82.3
Earth 3.23 8.43 -61.7
4. Number of Existing National Bridges 2017 2016 CENTRAL VISAYAS
Permanent Concrete 450 446 0.9
Steel 105 107 -1.9
Temporary
Bailey 2 1 100.0
Timber 0 0
Chapter 14. ENERGY and IRRIGATION
1. Sub-grid Generation by Province 2017 2016
CENTRAL VISAYAS 7,073,842 6,452,992 9.6
Bohol 67,913 40,538 67.5
Cebu 4,559,900 4,208,895 8.3
Negros Oriental 2,446,029 2,203,559 11.0
Chapter 15. PUBLIC FINANCE
1. Total Tax Revenues Collected by Province 2017 2016
(In Million Pesos)
CENTRAL VISAYAS 498 418 19.22
Bohol 139.74 100.97 38.40
Cebu 278.01 263.24 5.61
Negros Oriental 80.64 53.82 49.83
Siquijor 11.30 8.90 26.97
Chapter 16. MONEY and BANKING
1. Banking Statistics: Deposit Liabilities 2017 2016
(In Billion Pesos)
CENTRAL VISAYAS 546.41 582.73 -6.23
12

Summary of Major Statistical Series
Latest Data Previous Percent
Statistical Series Reference
Reference
Value Value Change Period Period
Chapter 17. PUBLIC ORDER, SAFETY and JUSTICE 1. Data on Index and Non-Index Crimes 2,017 2,016
CENTRAL VISAYAS 18,922 14,287 32.44
Index 3,090 3,054 1.18
Non- Index 15,832 11,233 40.94
2. Data on Inmates with Drug Cases by Province 2017 2016 CENTRAL VISAYAS
Bohol 1,427 1,191 19.82
Cebu 8,137 11,685 -30.36
Negros Oriental 1,015 1,181 -14.06
Siquijor 58 49 18.37
13


Chapter 1
POPULATION AND HOUSING
Data on size, distribution, growth and demographic characteristics of the population and the
stock and condition of housing are essential in the planning and decision making processes of the
governmental instrumentalities and private businesses alike. The data provide the bases in
determining what, where, how and when public services and facilities and interventions should be
put in place. The impact of services, programs and projects implemented are measured vis-à-vis
the effects in the socioeconomic well-being of the populace, as the ultimate beneficiaries of
governance and development. Entrepreneurs and corporate executives and managers in the private
sector use the data in making decisions on the level, form, programming, distribution, and situs of
resources that will be invested. The returns in their investments are largely determined by their
responses to the market created by the demands of the consumers and readiness to supply goods
and services that satisfy the needs and capabilities of the public.
This chapter presents data series pertaining to the region and by province/city/ municipality,
where available. The data include the population counts during several censuses conducted
nationwide as well as the demographic characteristics. Projections of the population of the region
up to 2045, which are estimated based on the results of the population census and demographic
surveys, are also presented. The data sources are from Philippine Statistics Authority for censal
data and the Technical Working Group on Population Projections of the Technical Committee on
Population and Housing of the Philippine Statistics Authority for the population projections.
Highlights
Total population in Central Visayas reached 7.3 million.
As of 1 August 2015, Central Visayas had a total population of 7,396,898 persons, an increase
of 596,718 persons over the May 1, 2010 population count of 6,800,100 persons. The increase in the population count from 2010 to 2015 translated to an average annual population growth rate (PGR)
of 1.62 percent. This is lower than the 1.77 percent annual PGR of the region between the census years 2000 and 2010.
Among the four provinces and three highly urbanized cities, Cebu Province, which excluded the three highly urbanized cities (HUCs), has the largest population size comprising 40.0 percent of
the region’s total population. On the other hand, Siquijor is smallest with only 1.0 percent of the total population of Central Visayas in 2015. Further, of the three HUCs, Cebu City is the largest, accounted about 12.0 percent of the region’s total population.
Land Area and Population Density
The top 5 densely populated city and municipality in Central Visayas in 2015 are the following:
first is Mandaue City with 14,402 persons per square kilometer followed by Lapu-Lapu City with 7,024
persons per square kilometer. In the third and fourth place is Talisay City and Dumaguete City with

1-2
5,710 and 3,908 persons per square kilometers, respectively. The fifth densely populated area is the municipality of Cordoba with 3,482 persons per square kilometer. Average household size of the region in 2015 was 4.3 persons
In 2015, the average household size in Central Visayas was 4.3 persons. This is slightly higher
than its 2010 average household size of 4.6 persons. Among the four provinces, Bohol recorded the
highest average household size of 4.5 persons while Siquijor is lowest at 4.2. Meanwhile, for the HUCs, Cebu City, Lapu-Lapu City and Mandaue City, average household size are 4.3, 4.1 and 3.8
persons, respectively.
Sex ratio remains at 102 males per 100 females
Of the 7,396,898 household population of Central Visayas in 2015, males accounted for
50.6 percent while females comprised 49.4 percent. These figures resulted in a sex ratio of 102 males for every 100 females.
Central Visayas Median Age at 24.2 years old
In 2015, the median age of the region’s total population was 24.2 years old which means that half of the population was below 24.2 years old. Median age was highest in Siquijor at 28.7 years old and lowest in Cebu (excluding HUCs) at 23.8 years.
In Central Visayas children aged 0 to 4 years and 5 to 9 years comprised the largest age
groups.
The age-sex distribution of the population showed that children aged 0 to 4 years and 5 to 9
years, comprised the largest age groups, with each making up 7.6 percent of the household population, followed by those in the age groups 10 to 14 years (7.2 percent) and 15 to 19 years (6.7 percent). Males outnumbered females in the age groups 0 to 54 years. Females, on the other hand,
outnumbered their male counterparts in the older age groups (55 years old and over).
Sixty-one dependents per 100 persons in the working-age group.
In Central Visayas, 62.2 percent belonged to the working-age population (15 to 64
years). Children below 15 years of age comprised 32.3 percent while older persons (65 years and over) accounted for 5.4 percent. The overall dependency ratio of Central Visayas in 2015 was 61
dependents for every 100 persons in the working age group.

ContentsHighlights 1-1
Statistical Tables
Table 1.1 Total Population and Growth Rate in Central Visayas by Province/City/Municipality
Census Years 2000, 2007, 2010, 2015 ……………………………………………...……………..…......1-4
Table 1.2 Projected Provincial Population in Central Visayas by Five-Years Age Group and
by Five-Calendar Years: 2010-2045 (Medium Assumption) ………………………………...….......1-8
Table 1.3 Projected Provincial Population by Selected Age Group and
by Five-Calendar Years: 2010-2045 (Medium Assumption) ………………………………........…..1-11
Table 1.4 Land Area, Population Density and Percent Change in Population Density
Census Year 2015 …………………………………………………………………………………………...........1-12
Table 1.5 Total Population, Household Population, Number of Households
and Average Household Size: Census Year 2015 …………………………………………………….....1-16
Table 1.6 Household Population by Age Group and by Sex: Census Year 2015 ……………………….…...1-20
Table 1.7 Household Population by Marital Status and by Age Group
Census Year 2015 ………………………………………………………………………………………………......1-24
FIGURES
Figure 1.1 Total Population in Central Visayas
1990, 1995, 2000, 2007, 2010 and 2015 …………………………......................……………...…1-7
Figure 1.2 Distribution of Total Population by Province/HUCs
Central Visayas: 2015 ………………………………………………………………………….....................1-7
1-3

Table 1.1
TOTAL POPULATION AND GROWTH RATE BY PROVINCE/CITY/MUNICIPALITY
Census Years 2000, 2007, 2010, 2015
1-May-00 1-Aug-07 1-May-10 1-Aug-151990-
2000
2000-
2007
2000-
2010
2010-
2015
PHILIPPINES 76,506,928 88,566,732 92,337,852 100,979,303 2.34 2.04 1.90 1.72
CENTRAL VISAYAS 5,706,953 6,400,698 6,800,180 7,396,898 2.19 1.59 1.77 1.62
BOHOL 1,139,130 1,230,110 1,255,128 1,313,560 1.85 1.06 0.90 0.87
Albuquerque 8,715 9,644 9,921 10,540 2.39 1.41 1.30 1.16
Alicia 21,605 23,422 22,285 23,517 1.48 1.12 0.31 1.03
Anda 17,863 16,616 16,909 16,462 2.84 (0.99) (0.55) (0.51)
Antequera 13,758 14,357 14,481 14,425 1.09 0.59 0.51 (0.07)
Baclayon 14,996 18,015 18,630 20,591 2.26 2.56 2.19 1.92
Balilihan 16,837 17,131 17,147 17,903 1.26 0.24 0.18 0.83
Batuan 11,835 12,137 12,431 12,767 0.34 0.35 0.49 0.51
Bilar 16,628 17,078 17,098 17,590 1.08 0.37 0.28 0.54
Buenavista 25,960 26,443 27,031 27,261 1.82 0.25 0.40 0.16
Calape 27,921 29,786 30,146 30,863 1.27 0.90 0.77 0.45
Candijay 30,389 31,183 29,043 29,475 1.53 0.36 (0.45) 0.28
Carmen 40,713 43,153 43,579 46,306 1.65 0.81 0.68 1.16
Catigbian 21,461 23,333 22,686 22,675 2.14 1.16 0.56 (0.01)
Clarin 18,040 18,871 20,296 20,301 0.19 0.62 1.18 0.00
Corella 6,048 7,471 7,699 8,479 (0.17) 2.96 2.44 1.86
Cortes 12,702 14,586 15,294 16,954 1.89 1.92 1.87 1.98
Dagohoy 16,845 18,311 18,868 19,158 2.53 1.16 1.14 0.29
Danao 17,265 17,716 17,952 17,890 3.14 0.36 0.39 (0.07)
Dauis 26,415 36,525 39,448 45,663 1.13 4.57 4.09 2.83
Dimiao 14,151 14,187 15,166 14,364 1.92 0.04 0.69 (1.03)
Duero 16,485 17,254 17,580 17,876 1.47 0.63 0.64 0.32
Garcia-Hernandez 21,428 21,308 23,038 24,194 1.23 (0.08) 0.73 0.94
Guindulman 31,028 32,355 31,789 32,408 1.69 0.58 0.24 0.37
Inabanga 40,714 43,331 43,291 45,880 0.85 0.86 0.62 1.11
Jagna 30,643 32,034 32,566 33,892 1.59 0.61 0.61 0.76
Getafe 26,826 27,852 27,788 30,955 2.41 0.52 0.35 2.08
Lila 10,322 10,801 11,985 12,257 1.89 0.63 1.50 0.43
Loay 14,433 15,881 16,261 16,691 1.30 1.33 1.20 0.50
Loboc 15,734 16,299 16,312 15,993 1.38 0.49 0.36 (0.38)
Loon 45,215 42,441 42,800 42,813 2.77 (0.87) (0.55) 0.01
Mabini 27,250 28,788 28,174 27,150 2.23 0.76 0.33 (0.70)
Maribojoc 16,786 18,113 20,491 20,675 0.99 1.05 2.01 0.17
Panglao 21,337 25,558 28,603 33,244 2.29 2.52 2.97 2.91
Pilar 25,095 27,276 26,887 27,209 2.33 1.16 0.69 0.23
Pres. Carlos P. Garcia (Pitogo) 20,744 25,118 23,287 23,355 (0.20) 2.67 1.16 0.06
Sagbayan (Borja) 18,346 19,399 20,091 22,307 1.79 0.77 0.91 2.01
San Isidro 9,106 9,176 9,125 8,740 1.51 0.11 0.02 (0.82)
San Miguel 20,828 22,199 23,574 24,130 2.19 0.88 1.25 0.45
Sevilla 10,281 11,289 10,443 10,661 1.15 1.30 0.16 0.39
Sierra Bullones 25,499 26,398 24,698 24,734 1.91 0.48 (0.32) 0.03
Notes: * Excluding Cebu City, Lapu-Lapu City and Mandaue City
a/ With boundary dispute with Barangay Sabang, Municipality of Siquijor
b/ Includes population count in part of the barangay being disputed by Barangay Sabang, Municipality of Larena
Sources: 2015 Census of Population
2010 Census of Population and Housing Report No. 1J; Philippine Statistics Authority
2007 Census of Population Report No. 1H; Philippine Statistics Authority
PROVINCE/CITY/
MUNICIPALITY
POPULATION GROWTH RATE
1-4

Table 1.1 - Continued
1-May-00 1-Aug-07 1-May-10 1-Aug-151990-
2000
2000-
2007
2000-
2010
2010-
2015
Sikatuna 6,602 6,335 6,380 6,726 1.80 (0.57) (0.34) 1.01
Tagbilaran City (Capital) 77,700 92,297 96,792 105,051 3.26 2.40 2.22 1.57
Talibon 54,147 59,274 61,373 66,969 2.60 1.25 1.26 1.68
Trinidad 25,683 27,580 28,828 31,956 2.56 0.99 1.16 1.98
Tubigon 40,385 44,434 44,902 45,893 1.64 1.33 1.07 0.42
Ubay 59,827 65,900 68,578 73,712 2.04 1.34 1.37 1.38
Valencia 24,363 28,043 27,586 27,126 1.55 1.96 1.25 (0.32)
Bien Unido 22,176 23,412 25,796 27,115 1.53 0.75 1.52 0.95
CEBU* 2,160,569 2,440,120 2,619,362 2,938,982 2.37 1.69 1.94 2.22
Alcantara 11,532 13,036 13,556 15,160 1.89 1.70 1.63 2.15
Alcoy 13,497 14,571 14,757 16,979 2.56 1.06 0.90 2.71
Alegria 20,677 21,699 22,072 23,300 1.25 0.67 0.95 1.04
Aloguinsan 24,180 26,353 27,650 32,100 2.32 1.19 1.84 2.88
Argao 61,010 62,226 69,503 72,366 1.58 0.27 1.44 0.77
Asturias 38,961 40,939 44,732 47,857 2.51 0.68 1.95 1.29
Badian 30,400 35,876 37,699 37,912 1.36 2.31 1.77 0.11
Balamban 59,922 66,261 71,237 87,177 2.70 1.40 2.22 3.92
Bantayan 68,125 71,655 74,785 79,084 1.28 0.70 1.11 1.07
Barili 57,764 60,430 65,524 73,862 1.91 0.62 1.59 2.31
Bogo 63,869 69,123 69,911 78,120 2.26 1.10 1.58 2.14
Boljoon 13,380 14,877 15,027 16,344 1.40 1.47 1.28 1.61
Borbon 28,571 32,278 31,598 35,526 2.09 1.70 1.55 2.26
Carcar 89,199 100,632 107,323 119,664 2.33 1.68 2.10 2.09
Carmen 37,351 41,279 44,648 51,325 2.47 1.39 2.13 2.69
Catmon 25,083 27,330 28,320 30,471 2.41 1.19 1.81 1.40
Compostela 31,446 39,167 42,574 47,898 3.63 3.07 3.35 2.27
Consolacion 62,298 87,544 106,649 131,528 4.20 4.80 4.86 4.07
Cordova 34,032 45,066 50,353 59,712 4.30 3.95 4.15 3.30
Daanbantayan 69,336 73,254 74,897 84,430 1.67 0.76 1.22 2.31
Dalaguete 57,331 61,405 63,239 67,497 2.33 0.95 1.65 1.25
Danao City 98,781 109,354 119,252 136,471 3.02 1.41 2.46 2.60
Dumanjug 39,666 44,807 46,754 51,210 2.19 1.69 1.92 1.75
Ginatilan 14,073 13,654 15,327 15,919 2.34 (0.42) 1.60 0.72
Liloan 64,970 92,606 100,500 118,753 4.31 5.01 4.38 3.23
Madridejos 29,020 30,673 34,905 36,429 1.20 0.77 1.53 0.82
Malabuyoc 17,015 18,117 18,426 19,373 1.52 0.87 1.16 0.96
Medellin 43,113 44,860 50,047 55,332 2.35 0.55 1.92 1.93
Minglanilla 77,268 101,585 113,178 132,135 4.26 3.84 4.08 2.99
Moalboal 23,402 27,398 27,676 31,130 1.56 2.20 1.63 2.27
Naga 80,189 95,163 101,571 115,750 2.87 2.39 2.63 2.52
Oslob 22,472 22,732 26,116 27,893 1.28 0.16 1.40 1.26
Pilar 11,226 11,941 11,564 11,308 (0.24) 0.85 0.03 (0.43)
Pinamungahan 51,715 54,859 57,997 65,955 2.59 0.82 1.87 2.48
Poro 21,397 21,529 23,498 25,212 1.11 0.08 1.03 1.35
Ronda 16,808 17,214 18,582 20,360 0.97 0.33 0.99 1.76
Samboan 16,659 18,140 18,613 20,884 1.05 1.18 1.08 2.22
San Fernando 48,235 54,932 60,970 66,280 3.24 1.81 2.80 1.60
San Francisco 41,327 44,588 47,357 55,180 1.24 1.05 1.31 2.95
San Remigio 44,028 48,516 51,394 57,557 2.00 1.35 1.78 2.18
Santa Fe 22,956 26,826 27,270 28,603 0.97 2.17 1.35 0.91
Santander 13,842 15,294 16,105 17,857 1.58 1.38 1.55 1.99
PROVINCE/CITY/
MUNICIPALITY
POPULATION GROWTH RATE
1-5

Table 1.1 - Continued
1-May-00 1-Aug-07 1-May-10 1-Aug-151990-
2000
2000-
2007
2000-
2010
2010-
2015
Sibonga 38,281 40,765 43,641 48,186 1.47 0.87 1.39 1.90
Sogod 27,432 28,955 30,626 35,108 1.59 0.75 1.35 2.64
Tabogon 27,827 31,942 33,024 39,013 1.10 1.92 1.41 3.23
Tabuelan 19,373 21,421 22,292 25,630 2.24 1.39 1.83 2.69
Talisay 148,110 179,359 200,772 227,645 4.22 2.67 3.65 2.42
Toledo City 141,174 152,960 157,078 170,335 1.64 1.11 1.36 1.56
Tuburan 51,845 53,663 58,914 63,866 1.87 0.48 1.58 1.55
Tudela 10,401 11,266 9,859 11,296 0.87 1.11 0.17 2.63
Cebu City 718,821 799,762 866,171 922,611 1.65 1.48 1.88 1.21
Lapu-lapu City 217,019 292,530 350,467 408,112 4.03 4.20 4.91 2.94
Mandaue City 259,728 318,577 331,320 362,654 3.72 2.86 2.46 1.74
NEGROS ORIENTAL 1,130,088 1,231,904 1,286,666 1,354,995 2.02 1.20 1.66 0.99
Amlan (Ayuquitan) 19,227 22,173 22,206 23,624 1.76 1.98 1.61 1.19
Ayungon 40,744 42,643 46,146 46,303 2.03 0.63 1.64 0.06
Bacong 23,219 28,310 32,286 36,527 3.55 2.77 3.45 2.38
Bais City 68,115 74,702 74,722 76,291 1.34 1.28 1.14 0.40
Basay 21,366 22,713 24,913 26,566 1.88 0.85 1.71 1.23
City of Bayawan (Tulong) 101,391 110,250 114,074 117,900 2.62 1.16 1.90 0.63
Bindoy (Payabon) 34,773 36,226 39,416 39,819 1.71 0.57 1.48 0.19
Canlaon City 46,548 50,208 50,627 54,509 2.27 1.05 1.56 1.42
Dauin 21,077 23,681 25,239 27,786 1.87 1.62 1.84 1.85
Dumaguete City (Capital) 102,265 116,392 120,883 131,377 2.45 1.80 2.07 1.60
City of Guihulngan 84,607 91,358 93,675 95,969 1.28 1.06 1.15 0.46
Jimalalud 26,756 27,728 29,044 30,945 1.93 0.49 1.38 1.21
La Libertad 35,122 37,007 38,904 38,602 1.60 0.72 1.31 (0.15)
Mabinay 67,001 70,548 74,187 78,864 1.29 0.71 1.16 1.17
Manjuyod 37,863 39,722 41,107 42,332 1.70 0.66 1.26 0.56
Pamplona 32,790 34,557 34,906 37,596 1.60 0.73 1.11 1.42
San Jose 15,665 17,250 19,098 20,413 2.02 1.34 2.01 1.28
Santa Catalina 67,197 72,629 73,306 75,756 2.29 1.08 1.58 0.63
Siaton 64,258 67,943 73,285 77,696 2.75 0.77 2.03 1.12
Sibulan 37,523 47,162 51,519 59,455 3.28 3.20 3.25 2.77
City of Tanjay 70,169 78,539 79,098 80,532 1.14 1.57 1.17 0.34
Tayasan 30,795 32,383 34,609 35,470 1.80 0.70 1.49 0.47
Valencia (Luzurriaga) 24,365 27,933 31,477 34,852 3.01 1.90 2.80 1.96
Vallehermoso 33,914 34,933 36,943 38,259 1.95 0.41 1.40 0.67
Zamboanguita 23,338 24,914 24,996 27,552 3.15 0.90 1.91 1.87
SIQUIJOR 81,598 87,695 91,066 95,984 0.99 1.00 1.10 1.01
Enrique Villanueva 5,364 5,878 5,972 6,104 1.26 1.27 1.08 0.42
Larena a/ 12,281 12,550 12,931 13,847 1.10 0.30 0.52 1.31
Lazi 18,314 19,440 20,024 20,490 0.94 0.83 0.90 0.44
Maria 12,275 12,974 13,383 13,828 0.97 0.77 0.87 0.62
San Juan 12,198 13,180 13,525 14,854 0.58 1.07 1.04 1.80
Siquijor (Capital) b/ 21,166 23,673 25,231 26,861 1.16 1.55 1.77 1.20
PROVINCE/CITY/
MUNICIPALITY
POPULATION GROWTH RATE
1-6

1990 May 1
4,594,124
Population
Cebu
Negros Oriental
Bohol
Cebu City
Lapu-Lapu City
Mandau City
Siquijor
4,594,124 5,014,588
5,706,953
6,400,698 6,800,180
7,396,898
1990
May 1
1995
September 1
2000
May 1
2007
August 1
2010
May 1
2015
August 1
Figure 1.1: Total Population in Central Visayas
1990, 1995, 2000, 2007, 2010, 2015
Cebu…
Negros Oriental
18%
Bohol
18%
Cebu City
12%
Lapu-Lapu City
6%
Mandau City
5%
Siquijor
1%
Figure 1.2: Distribution of Total Population by Province/HUCs
in Central Visayas: 2015
1-7

Table 1.2
PROJECTED PROVINCIAL POPULATION BY FIVE-YEARS AGE GROUP AND BY FIVE-CALENDAR
YEARS: 2010-2045 (Medium Assumption)
PHILIPPINES
Both Sexes
0-4 10,767,800 11,327,300 11,475,800 11,360,700 11,043,800 10,622,300 10,119,600 9,523,800
5-9 10,355,000 10,671,000 11,233,600 11,385,600 11,273,500 10,957,600 10,536,100 10,032,000
10-14 10,212,600 10,283,900 10,601,800 11,162,300 11,312,500 11,197,900 10,878,500 10,452,700
15-19 9,736,800 10,136,900 10,208,500 10,524,400 11,081,200 11,226,900 11,107,500 10,783,000
20-24 8,435,900 9,643,400 10,045,400 10,117,800 10,431,700 10,984,500 11,126,500 11,002,600
25-29 7,447,800 8,332,500 9,540,100 9,944,300 10,017,200 10,329,300 10,878,000 11,015,900
30-34 6,794,800 7,342,000 8,229,200 9,435,800 9,841,200 9,915,000 10,225,000 10,770,500
35-39 6,033,400 6,685,300 7,238,600 8,127,400 9,333,700 9,741,900 9,819,000 10,129,900
40-44 5,489,400 5,916,400 6,573,800 7,133,600 8,024,400 9,231,100 9,645,000 9,727,500
45-49 4,695,800 5,351,200 5,787,300 6,449,500 7,015,500 7,909,000 9,115,500 9,536,800
50-54 3,907,500 4,530,000 5,185,800 5,630,000 6,295,500 6,868,200 7,762,300 8,967,600
55-59 2,996,800 3,703,100 4,319,200 4,970,900 5,421,200 6,087,100 6,665,000 7,557,100
60-64 2,235,700 2,765,500 3,444,600 4,045,700 4,685,300 5,138,100 5,798,700 6,378,200
65-69 1,502,400 1,978,400 2,472,300 3,109,600 3,684,300 4,301,200 4,750,400 5,396,600
70-74 1,146,200 1,249,200 1,667,600 2,110,400 2,686,400 3,217,800 3,795,000 4,230,200
75-79 709,400 870,200 966,600 1,313,000 1,688,800 2,183,300 2,652,700 3,170,100
80 & over 667,800 776,000 957,700 1,138,400 1,501,300 1,992,700 2,657,400 3,420,600
All ages 93,135,100 101,562,300 109,947,900 117,959,400 125,337,500 131,903,900 137,532,200 142,095,100
CENTRAL VISAYAS
Both Sexes
0-4 774,000 815,100 825,000 815,800 790,200 752,900 706,100 670,200
5-9 759,900 772,200 814,300 824,600 815,300 789,300 751,600 704,600
10-14 737,300 759,000 772,000 814,000 824,300 814,600 788,200 750,100
15-19 721,700 733,900 755,600 768,600 810,700 820,900 811,200 784,700
20-24 617,800 714,000 725,800 747,100 759,600 801,100 810,900 800,800
25-29 537,000 610,900 707,500 719,500 740,600 752,900 794,300 803,800
30-34 480,700 531,000 605,600 702,200 714,300 735,300 747,400 788,500
35-39 430,600 474,700 525,900 600,800 697,700 710,300 731,400 743,500
40-44 388,400 424,200 469,200 521,000 596,200 693,500 706,600 728,100
45-49 344,200 380,400 417,200 462,800 515,100 590,700 688,300 702,500
50-54 287,800 333,600 370,600 407,900 454,100 506,800 582,700 680,500
55-59 231,400 274,300 320,000 357,300 395,000 441,300 494,300 570,200
60-64 174,200 215,200 257,100 301,900 339,000 376,700 422,800 475,500
65-69 130,500 155,900 194,500 234,200 277,200 313,400 350,400 395,500
70-74 101,800 109,000 131,900 166,700 203,100 243,000 277,400 313,000
75-79 65,200 76,400 83,700 103,200 133,000 164,800 200,400 232,200
80 & over 60,900 67,000 79,600 93,000 115,600 151,200 196,200 251,000
All ages 6,843,400 7,446,800 8,055,500 8,640,600 9,181,000 9,658,700 10,060,200 10,394,700
Note: * - Total Includes Cebu City, Lapu-Lapu City and Mandaue City
Source: 2010 Census-Based National, Regional and Provincial Population Projections; Philippine Statistics Authority
2025 2030 2035 2040 2045
Region
/Prov /Age
/Sex
2010 2015 2020
1-8

Table 1.2 - Continued
BOHOL
Both Sexes
0-4 146,000 164,900 171,200 175,100 175,800 174,500 169,000 165,300
5-9 146,300 147,000 166,100 172,500 176,500 176,900 175,000 170,000
10-14 141,900 146,900 147,700 166,900 173,400 177,500 177,700 176,400
15-19 128,900 139,600 145,300 146,900 167,200 175,100 180,900 182,700
20-24 102,400 125,300 136,600 143,200 146,100 168,000 177,900 184,900
25-29 86,000 101,500 124,500 136,300 143,300 146,700 169,600 180,500
30-34 79,400 86,000 101,700 125,000 136,800 143,900 147,400 170,400
35-39 75,900 79,300 86,100 101,900 125,200 137,300 144,500 147,900
40-44 70,700 75,400 79,000 86,000 101,700 125,200 137,300 144,600
45-49 63,700 69,600 74,600 78,500 85,600 101,500 125,300 137,700
50-54 55,000 62,000 68,300 73,300 77,400 84,600 100,600 124,500
55-59 44,100 52,700 59,700 66,100 71,300 75,600 83,000 99,000
60-64 37,300 41,200 49,600 56,600 62,900 68,200 72,700 80,100
65-69 32,200 33,500 37,300 45,200 52,100 58,300 63,600 68,200
70-74 24,900 26,900 28,300 32,000 39,400 45,900 51,900 57,100
75-79 16,700 18,700 20,700 22,300 25,800 32,300 38,300 44,200
80 & over 16,900 17,700 20,100 23,300 26,700 31,400 39,800 49,700
All ages 1,268,300 1,388,200 1,516,800 1,651,100 1,787,200 1,922,900 2,054,500 2,183,200
CEBU*
Both Sexes
0-4 470,400 491,800 488,400 471,900 446,200 415,300 384,300 355,800
5-9 460,700 467,600 489,300 486,000 469,300 443,400 412,400 380,800
10-14 436,500 459,300 466,100 487,500 483,600 466,000 439,600 407,600
15-19 440,400 437,200 458,100 463,100 482,300 475,700 454,900 425,000
20-24 400,900 439,300 433,600 451,700 453,400 468,800 457,400 434,200
25-29 355,000 396,500 434,300 427,500 444,200 444,400 457,700 443,700
30-34 312,800 349,800 391,500 428,900 421,700 438,100 437,600 450,300
35-39 271,000 307,900 345,300 386,900 424,300 417,100 433,300 432,800
40-44 238,200 266,100 303,500 341,100 382,700 420,100 413,100 429,100
45-49 206,200 232,800 261,100 298,500 336,100 377,700 414,800 407,900
50-54 169,800 199,600 226,400 254,800 292,200 329,900 371,400 408,500
55-59 135,100 161,600 191,200 218,000 246,400 283,500 321,100 362,600
60-64 99,400 125,500 151,500 180,400 206,800 234,900 271,500 308,600
65-69 69,300 89,100 113,800 138,300 165,900 191,400 218,600 254,000
70-74 52,700 58,000 75,700 97,800 120,200 145,700 169,800 195,500
75-79 33,500 39,700 44,700 59,400 78,300 97,800 120,500 142,200
80 & over 30,700 34,700 41,800 49,900 65,500 88,600 116,500 150,900
All ages 4,182,600 4,556,500 4,916,300 5,241,700 5,519,100 5,738,400 5,894,500 5,989,500
2030 2035 2040 2045
Region
/Prov /Age
/Sex
2010 2020 20252015
1-9

Table 1.2 - Continued
NEGROS ORIENTAL
Both Sexes
0-4 148,600 147,900 154,300 157,400 156,400 151,000 140,800 136,900
5-9 143,800 148,200 147,700 154,100 157,100 156,200 151,000 140,600
10-14 150,000 143,500 148,300 147,700 154,300 157,500 156,700 151,500
15-19 143,600 148,200 142,800 148,600 149,100 156,900 161,400 162,200
20-24 107,400 140,700 146,700 142,800 150,000 152,000 161,900 167,200
25-29 89,700 105,600 139,300 146,000 142,700 150,700 153,300 164,300
30-34 82,500 88,600 104,600 138,300 145,200 142,000 150,200 152,900
35-39 78,000 81,300 87,600 103,600 137,300 144,300 141,200 149,500
40-44 74,000 76,800 80,200 86,600 102,800 136,500 143,600 140,700
45-49 69,100 72,500 75,500 79,200 85,800 102,100 135,800 143,400
50-54 58,400 66,900 70,400 73,700 77,700 84,400 100,800 134,500
55-59 48,300 55,600 64,100 67,800 71,200 75,400 82,200 98,600
60-64 34,300 44,800 51,900 60,100 64,100 67,700 71,900 78,900
65-69 26,100 30,400 40,000 46,900 54,700 58,700 62,500 66,900
70-74 21,800 21,600 25,400 33,900 40,200 47,400 51,300 55,200
75-79 13,300 16,200 16,400 19,600 26,600 31,900 38,300 42,000
80 & over 11,600 12,900 15,800 17,700 21,200 28,500 36,600 46,300
All ages 1,300,500 1,401,700 1,511,000 1,624,000 1,736,400 1,843,200 1,939,500 2,031,600
SIQUIJOR
Both Sexes
0-4 9,000 10,500 11,100 11,400 11,800 12,100 12,000 12,200
5-9 9,100 9,400 11,200 12,000 12,400 12,800 13,200 13,200
10-14 8,900 9,300 9,900 11,900 13,000 13,600 14,200 14,600
15-19 8,800 8,900 9,400 10,000 12,100 13,200 14,000 14,800
20-24 7,100 8,700 8,900 9,400 10,100 12,300 13,700 14,500
25-29 6,300 7,300 9,400 9,700 10,400 11,100 13,700 15,300
30-34 6,000 6,600 7,800 10,000 10,600 11,300 12,200 14,900
35-39 5,700 6,200 6,900 8,400 10,900 11,600 12,400 13,300
40-44 5,500 5,900 6,500 7,300 9,000 11,700 12,600 13,700
45-49 5,200 5,500 6,000 6,600 7,600 9,400 12,400 13,500
50-54 4,600 5,100 5,500 6,100 6,800 7,900 9,900 13,000
55-59 3,900 4,400 5,000 5,400 6,100 6,800 8,000 10,000
60-64 3,200 3,700 4,100 4,800 5,200 5,900 6,700 7,900
65-69 2,900 2,900 3,400 3,800 4,500 5,000 5,700 6,400
70-74 2,400 2,500 2,500 3,000 3,300 4,000 4,400 5,200
75-79 1,700 1,800 1,900 1,900 2,300 2,800 3,300 3,800
80 & over 1,700 1,700 1,900 2,100 2,200 2,700 3,300 4,100
All ages 92,000 100,400 111,400 123,800 138,300 154,200 171,700 190,400
2035 2040 2045
Region
/Prov /Age
/Sex
2010 2015 2020 2025 2030
1-10

Table 1.3
PROJECTED PROVINCIAL POPULATION BY SELECTED AGE GROUP AND
BY FIVE-CALENDAR YEARS: 2010-2045 (Medium Assumption)
Region/Province/
Age/Sex2010 2015 2020 2025 2030 2035 2040 2045
PHILIPPINES
Pop 0-4 10,767,800 11,327,300 11,475,800 11,360,700 11,043,800 10,622,300 10,119,600 9,523,800
Pop 0-14 31,335,400 32,282,200 33,311,200 33,908,600 33,629,800 32,777,800 31,534,200 30,008,500
Pop 15-64 57,773,900 64,406,300 70,572,500 76,379,400 82,146,900 87,431,100 92,142,500 95,869,100
Pop 60 & over 6,261,500 7,639,300 9,508,800 11,717,100 14,246,100 16,833,100 19,654,200 22,595,700
Pop 65 & over 4,025,800 4,873,800 6,064,200 7,671,400 9,560,800 11,695,000 13,855,500 16,217,500
Female 15-49 23,972,000 26,274,800 28,269,600 30,253,400 32,141,600 33,783,500 34,930,900 35,335,300
CENTRAL VISAYAS
Pop 0-4 774,000 815,100 825,000 815,800 790,200 752,900 706,100 670,200
Pop 0-14 2,271,200 2,346,300 2,411,300 2,454,400 2,429,800 2,356,800 2,245,900 2,124,900
Pop 15-64 4,213,800 4,692,200 5,154,500 5,589,100 6,022,300 6,429,500 6,789,900 7,078,100
Pop 60 & over 532,600 623,500 746,800 899,000 1,067,900 1,249,100 1,447,200 1,667,200
Pop 65 & over 358,400 408,300 489,700 597,100 728,900 872,400 1,024,400 1,191,700
Female 15-49 1,728,900 1,894,500 2,051,900 2,201,000 2,345,600 2,467,600 2,546,800 2,566,400
BOHOL
Pop 0-4 146,000 164,900 171,200 175,100 175,800 174,500 169,000 165,300
Pop 0-14 434,200 458,800 485,000 514,500 525,700 528,900 521,700 511,700
Pop 15-64 743,400 832,600 925,400 1,013,800 1,117,500 1,226,100 1,339,200 1,452,300
Pop 60 & over 128,000 138,000 156,000 179,400 206,900 236,100 266,300 299,300
Pop 65 & over 90,700 96,800 106,400 122,800 144,000 167,900 193,600 219,200
Female 15-49 293,700 326,000 359,000 391,600 433,100 475,800 515,600 547,100
CEBU*
Pop 0-4 470,400 491,800 488,400 471,900 446,200 415,300 384,300 355,800
Pop 0-14 1,367,600 1,418,700 1,443,800 1,445,400 1,399,100 1,324,700 1,236,300 1,144,200
Pop 15-64 2,628,800 2,916,300 3,196,500 3,450,900 3,690,100 3,890,200 4,032,800 4,102,700
Pop 60 & over 285,600 347,000 427,500 525,800 636,700 758,400 896,900 1,051,200
Pop 65 & over 186,200 221,500 276,000 345,400 429,900 523,500 625,400 742,600
Female 15-49 1,103,000 1,201,300 1,293,600 1,372,900 1,439,200 1,479,600 1,483,800 1,451,200
NEGROS ORIENTAL
Pop 0-4 148,600 147,900 154,300 157,400 156,400 151,000 140,800 136,900
Pop 0-14 442,400 439,600 450,300 459,200 467,800 464,700 448,500 429,000
Pop 15-64 785,300 881,000 963,100 1,046,700 1,125,900 1,212,000 1,302,300 1,392,200
Pop 60 & over 107,100 125,900 149,500 178,200 206,800 234,200 260,600 289,300
Pop 65 & over 72,800 81,100 97,600 118,100 142,700 166,500 188,700 210,400
Female 15-49 310,700 343,500 373,100 407,000 439,400 473,800 504,200 520,600
SIQUIJOR
Pop 0-4 9,000 10,500 11,100 11,400 11,800 12,100 12,000 12,200
Pop 0-14 27,000 29,200 32,200 35,300 37,200 38,500 39,400 40,000
Pop 15-64 56,300 62,300 69,500 77,700 88,800 101,200 115,600 130,900
Pop 60 & over 11,900 12,600 13,800 15,600 17,500 20,400 23,400 27,400
Pop 65 & over 8,700 8,900 9,700 10,800 12,300 14,500 16,700 19,500
Female 15-49 21,500 23,700 26,200 29,500 33,900 38,400 43,200 47,500
Note: * - Total Includes Cebu City, Lapu-Lapu City and Mandaue City
Source: Philippine Statistics Authority
1-11

Table 1.4
LAND AREA, POPULATION DENSITY AND PERCENT CHANGE IN POPULATION DENSITY
Census Year 2015
(square kilometer)
1990 2000 2010 2015
PHILIPPINES 300,000.00 202 255 305 337
CENTRAL VISAYAS 15,885.97 289 359 428 466
BOHOL 4,820.95 197 236 260 272
Albuquerque 26.98 255 323 368 391
Alicia 114.50 163 189 195 205
Anda 61.89 218 289 273 266
Antequera 118.60 104 116 122 122
Baclayon 34.43 348 436 541 598
Balilihan 127.27 117 132 135 141 Batuan 48.79 234 243 255 262 Bilar 129.71 115 128 132 136 Buenavista 96.00 226 270 282 284 Calape 75.36 327 371 400 410 Candijay 103.26 253 294 281 285 Carmen 239.45 114 170 182 193 Catigbian 113.33 153 189 200 200 Clarin 52.12 307 346 389 390 Corella 37.22 165 162 207 228 Cortes 27.32 385 465 560 621 Dagohoy 77.59 169 217 243 247 Danao 162.76 78 106 110 110 Dauis 43.33 545 610 910 1,054 Dimiao 135.75 86 104 112 106 Duero 97.30 146 169 181 184 Garcia-Hernandez 127.50 149 168 181 190 Guindulman 125.63 209 247 253 258 Inabanga 168.49 222 242 257 272 Jagna 120.50 217 254 270 281 Jetafe 179.17 118 150 155 173 Lila 40.50 211 255 296 303 Loay 48.24 263 299 337 346 Loboc 57.65 238 273 283 277 Loon 113.36 303 399 378 380
Note: * Excluding Cebu City, Lapu-Lapu City and Mandaue City
Sources: 2010 Census of Population and Housing Report No. 3 ; Philippine Statistics Authority
Region/ Province / HUC / City /
Municipality
Land Area
Population Density(persons in square kilometer)
1-12

Table 1.4 - Continued
(square kilometer)
1990 2000 2010 2015
Mabini 104.57 209 261 269 260 Maribojoc 49.35 308 340 415 419 Panglao 47.79 356 446 599 702 Pilar 120.39 166 208 223 226 Pres. Carlos P. Garcia (Pitogo) 54.82 386 378 425 426 Sagbayan (Borja) 69.61 221 264 289 321 San Isidro 60.04 131 152 152 146 San Miguel 123.29 136 169 191 196 Sevilla 116.75 79 88 89 91 Sierra Bullones 198.87 106 128 124 124 Sikatuna 38.22 145 173 167 176 Tagbilaran City (Capital) 36.50 1,544 2,129 2,652 2,878 Talibon 140.46 298 385 437 477 Trinidad 195.30 102 132 148 164 Tubigon 81.87 419 493 548 561 Ubay 335.06 146 179 205 220 Valencia 116.67 179 209 236 233 Bien Unido 27.39 695 810 942 990
CEBU* 4,943.72 346 437 530 594
Alcantara 35.20 272 328 385 431 Alcoy 61.63 170 219 239 275 Alegria 89.49 204 231 247 260 Aloguinsan 61.92 310 391 447 518 Argao 191.50 272 319 363 378 Asturias 190.45 160 205 235 251 Badian 110.07 241 276 343 344 Balamban 333.56 138 180 214 261 Bantayan 81.68 735 834 916 968 Barili 122.21 391 473 536 604 Bogo 103.52 493 617 675 755 Boljoon 117.00 100 114 128 140 Borbon 120.94 192 236 261 294 Carcar 116.78 607 764 919 1,025 Carmen 84.78 345 441 527 605
Region/ Province / HUC / City /
Municipality
Land Area
Population Density(persons in square kilometer)
1-13

Table 1.4 - Continued
(square kilometer)
1990 2000 2010 2015
Catmon 109.64 180 229 258 278 Compostela 53.90 408 583 790 889 Consolacion 147.20 280 423 725 894 Cordova 17.15 1,302 1,984 2,936 3,482 Daanbantayan 92.27 637 751 812 915 Dalaguete 154.96 294 370 408 436
Danao City 107.30 684 921 1,111 1,272
Dumanjug 85.53 373 464 547 599
Ginatilan 70.10 159 201 219 227
Liloan 45.92 927 1,415 2,189 2,586
Madridejos 23.95 1,075 1,212 1,457 1,521
Malabuyoc 69.27 211 246 266 280
Medellin 73.19 467 589 684 756
Minglanilla 65.60 776 1,178 1,725 2,014
Moalboal 124.86 161 187 222 249
Naga 101.97 593 786 996 1,135
Oslob 134.75 147 167 194 207
Pilar 32.42 355 346 357 349
Pinamungahan 109.16 367 474 531 604
Poro 63.59 301 336 370 396
Ronda 57.10 267 294 325 357
Samboan 45.16 332 369 412 462
San Fernando 69.39 505 695 879 955
San Francisco 106.93 342 386 443 516
San Remigio 95.27 379 462 539 604
Santa Fe 28.05 743 818 972 1,020
Santander 29.53 401 469 545 605
Sibonga 133.45 248 287 327 361
Sogod 119.23 196 230 257 294
Tabogon 101.35 246 275 326 385
Tabuelan 141.13 110 137 158 182
Talisay 39.87 2,457 3,715 5,036 5,710
Toledo City 216.28 555 653 726 788
Tuburan 224.50 192 231 262 284
Tudela 33.02 289 315 299 342
Cebu City 315.00 1,938 2,282 2,750 2,929
Lapu-lapu City 58.10 2,516 3,735 6,032 7,024
Mandaue City 25.18 7,160 10,315 13,158 14,402
Region/ Province / HUC / City /
Municipality
Land Area
Population Density(persons in square kilometer)
1-14

Table 1.4 - Continued
(square kilometer)
1990 2000 2010 2015
NEGROS ORIENTAL 5,385.53 172 210 239 252
Amlan (Ayuquitan) 111.85 144 172 199 211
Ayungon 265.10 126 154 174 175
Bacong 40.30 407 576 801 906
Bais City 319.64 186 213 234 239
Basay 162.00 109 132 154 164
City of Bayawan (Tulong) 699.08 112 145 163 169
Bindoy (Payabon) 173.70 169 200 227 229
Canlaon City 170.93 217 272 296 319
Dauin 114.10 153 185 221 244
Dumaguete City (Capital) 33.62 2,387 3,042 3,596 3,908
City of Guihulngan 388.56 192 218 241 247
Jimalalud 139.50 158 192 208 222
La Libertad 139.60 215 252 279 277
Mabinay 319.44 184 210 232 247
Manjuyod 264.60 121 143 155 160
Pamplona 202.20 138 162 173 186
San Jose 54.46 235 288 351 375
Santa Catalina 523.10 102 128 140 145
Siaton 335.90 146 191 218 231
Sibulan 163.00 167 230 316 365
City of Tanjay 276.05 227 254 287 292
Tayasan 154.20 167 200 224 230
Valencia (Luzurriaga) 147.49 123 165 213 236
Vallehermoso 101.25 276 335 365 378
Zamboanguita 85.86 199 272 291 321
SIQUIJOR 337.49 219 242 270 284
Enrique Villanueva 28.60 165 188 209 213
Larena 49.81 221 247 260 278
Lazi 70.64 236 259 283 290
Maria 53.37 209 230 251 259
San Juan 44.37 260 275 305 335
Siquijor (Capital) 90.70 208 233 278 296
Region/ Province / HUC / City /
Municipality
Land Area
Population Density(persons in square kilometer)
1-15

Table 1.5
Census Year 2015
City/MunicipalityTotal
Population
Household
Population
Number of
Households
Average
Household
Size
PHILIPPINES 100,979,303 100,573,715 22,975,630 4.4
CENTRAL VISAYAS 7,396,898 7,359,900 1,699,148 4.3
BOHOL 1,313,560 1,308,785 288,515 4.5
Albuquerque 10,540 10,508 2,422 4.3
Alicia 23,517 23,421 5,105 4.6
Anda 16,462 16,460 3,764 4.4
Antequera 14,425 14,425 3,482 4.1
Baclayon 20,591 20,512 4,397 4.7
Balilihan 17,903 17,902 4,084 4.4
Batuan 12,767 12,764 2,853 4.5
Bilar 17,590 17,522 3,768 4.7
Buenavista 27,261 27,261 6,034 4.5
Calape 30,863 30,863 7,404 4.2
Candijay 29,475 29,427 6,771 4.3
Carmen 46,306 46,087 10,306 4.5
Catigbian 22,675 22,675 5,124 4.4
Clarin 20,301 20,245 4,623 4.4
Corella 8,479 8,451 1,908 4.4
Cortes 16,954 16,917 3,630 4.7
Dagohoy 19,158 19,158 4,176 4.6
Danao 17,890 17,889 3,921 4.6
Dauis 45,663 45,500 9,900 4.6
Dimiao 14,364 14,295 3,227 4.4
Duero 17,876 17,854 4,017 4.4
Garcia-Hernandez 24,194 24,192 4,993 4.8
Guindulman 32,408 32,338 7,234 4.5
Inabanga 45,880 45,861 9,896 4.6
Jagna 33,892 33,874 7,506 4.5
Note:
* Excluding Cebu City, Lapu-Lapu City and Mandaue City
Sources: Philippine Statistics Authority, 2015 Census of Population Report No. 1J
TOTAL POPULATION, HOUSEHOLD POPULATION, NUMBER OF HOUSEHOLDS
AND AVERAGE HOUSEHOLD SIZE
1-16

Table 1.5 - Continued
City/MunicipalityTotal
Population
Household
Population
Number of
Households
Average
Household
Size
Getafe 30,955 30,955 6,487 4.8
Lila 12,257 12,224 2,090 5.8
Loay 16,691 16,680 3,578 4.7
Loboc 15,993 15,993 3,483 4.6
Loon 43,034 42,813 9,952 4.3
Mabini 27,171 27,150 6,254 4.3
Maribojoc 20,688 20,675 4,748 4.4
Panglao 33,553 33,244 7,020 4.7
Pilar 27,256 27,209 5,975 4.6
Pres. Carlos P. Garcia (Pitogo) 23,356 23,355 5,164 4.5
Sagbayan (Borja) 22,339 22,307 5,157 4.3
San Isidro 8,744 8,740 2,198 4.0
San Miguel 24,135 24,130 5,396 4.5
Sevilla 10,661 10,661 2,240 4.8
Sierra Bullones 24,745 24,734 5,412 4.6
Sikatuna 6,726 6,708 1,515 4.4
Tagbilaran City (Capital) 105,051 102,448 21,863 4.7
Talibon 66,969 66,796 14,335 4.7
Trinidad 31,956 31,923 6,857 4.7
Tubigon 45,893 45,872 10,356 4.4
Ubay 73,712 73,589 16,578 4.4
Valencia 27,126 27,067 5,587 4.8
Bien Unido 27,115 27,111 5,725 4.7
CEBU* 2,938,982 2,928,034 669,322 4.4
Alcantara 15,160 15,155 3,444 4.4
Alcoy 16,979 16,979 3,388 5.0
Alegria 23,300 23,262 5,028 4.6
Aloguinsan 32,100 32,098 6,901 4.7
Argao 72,366 72,132 16,574 4.4
Asturias 47,857 47,832 10,222 4.7
Badian 37,912 37,902 8,218 4.6
Balamban 87,177 86,953 19,614 4.4
Bantayan 79,084 78,867 18,494 4.3
Barili 73,862 73,783 15,778 4.7
Bogo 78,120 77,915 19,360 4.0
Boljoon 16,344 16,320 3,374 4.8
Borbon 35,526 35,526 8,420 4.2
Carcar 119,664 119,352 27,149 4.4
Carmen 51,325 51,145 11,265 4.5
Catmon 30,471 30,460 6,940 4.4
1-17

Table 1.5 - Continued
City/MunicipalityTotal
Population
Household
Population
Number of
Households
Average
Household
Size
Compostela 47,898 47,771 10,880 4.4
Consolacion 131,528 131,161 30,625 4.3
Cordova 59,712 59,601 13,324 4.5
Daanbantayan 84,430 84,350 19,790 4.3
Dalaguete 67,497 67,450 14,433 4.7
Danao City 136,471 135,987 31,611 4.3
Dumanjug 51,210 51,185 10,960 4.7
Ginatilan 15,919 15,919 3,380 4.7
Liloan 118,753 118,515 27,847 4.3
Madridejos 36,429 36,388 8,113 4.5
Malabuyoc 19,373 19,369 3,817 5.1
Medellin 55,332 54,874 12,836 4.3
Minglanilla 132,135 129,649 30,599 4.2
Moalboal 31,130 31,109 7,284 4.3
Naga 115,750 115,409 26,177 4.4
Oslob 27,893 27,889 5,998 4.6
Pilar 11,308 11,302 2,989 3.8
Pinamungahan 65,955 65,937 13,874 4.8
Poro 25,212 25,200 6,104 4.1
Ronda 20,360 20,360 4,823 4.2
Samboan 20,884 20,884 4,510 4.6
San Fernando 66,280 66,257 14,258 4.6
San Francisco 55,180 55,157 12,278 4.5
San Remigio 57,557 57,494 14,470 4.0
Santa Fe 28,603 28,533 6,779 4.2
Santander 17,857 17,857 4,256 4.2
Sibonga 48,186 48,135 11,350 4.2
Sogod 35,108 35,096 8,452 4.2
Tabogon 39,013 39,013 9,628 4.1
Tabuelan 25,630 25,623 6,415 4.0
Talisay 227,645 224,075 51,239 4.4
Toledo City 170,335 169,714 38,259 4.4
Tuburan 63,866 63,803 15,028 4.2
Tudela 11,296 11,287 2,767 4.1
Cebu City (Capital) 922,611 910,678 213,781 4.3
Lapu-lapu City (Opon) 408,112 406,353 99,573 4.1
Mandaue City 362,654 359,777 94,547 3.8
1-18

Table 1.5 - Continued
City/MunicipalityTotal
Population
Household
Population
Number of
Households
Average
Household
Size
NEGROS ORIENTAL 1,354,995 1,350,913 310,673 4.3
Amlan (Ayuquitan) 23,624 23,624 5,525 4.3
Ayungon 46,303 46,248 10,573 4.4
Bacong 36,527 36,472 8,265 4.4
Bais City 76,291 76,137 17,693 4.3
Basay 26,566 26,526 5,971 4.4
City of Bayawan (Tulong) 117,900 117,572 25,646 4.6
Bindoy (Payabon) 39,819 39,819 8,702 4.6
Canlaon City 54,509 54,294 12,692 4.3
Dauin 27,786 27,776 6,520 4.3
Dumaguete City (Capital) 131,377 129,226 29,750 4.3
City of Guihulngan 95,969 95,697 22,518 4.2
Jimalalud 30,945 30,935 7,191 4.3
La Libertad 38,602 38,564 9,187 4.2
Mabinay 78,864 78,789 17,709 4.4
Manjuyod 42,332 42,213 9,943 4.2
Pamplona 37,596 37,596 8,714 4.3
San Jose 20,413 20,413 4,607 4.4
Santa Catalina 75,756 75,725 16,873 4.5
Siaton 77,696 77,583 17,857 4.3
Sibulan 59,455 59,260 13,903 4.3
City of Tanjay 80,532 80,418 19,043 4.2
Tayasan 35,470 35,465 8,623 4.1
Valencia (Luzurriaga) 34,852 34,808 7,990 4.4
Vallehermoso 38,259 38,201 8,571 4.5
Zamboanguita 27,552 27,552 6,607 4.2
SIQUIJOR 95,984 95,360 22,737 4.2
Enrique Villanueva 6,104 6,078 1,476 4.1
Larena 13,847 13,438 3,115 4.3
Lazi 20,490 20,468 5,011 4.1
Maria 13,828 13,816 3,164 4.4
San Juan 14,854 14,854 3,579 4.2
Siquijor (Capital) 26,861 26,706 6,392 4.2
1-19

Table 1.6
Census Year 2015
Age Group / Province Both Sexes Male Female
CENTRAL VISAYAS
All Ages 7,396,898 3,743,601 3,653,297
Under 1 162,763 84,315 78,448
1 - 4 650,717 336,835 313,882
5 - 9 805,114 415,422 389,692
10 - 14 771,030 397,281 373,749
15 -19 728,697 373,778 354,919
20 - 24 688,915 349,544 339,371
25 - 29 601,759 307,753 294,006
30 - 34 521,584 268,783 252,801
35 - 39 467,901 240,525 227,376
40 - 44 413,989 211,598 202,391
45 - 49 372,302 188,493 183,809
50 - 54 324,721 162,712 162,009
55 - 59 268,442 132,562 135,880
60 - 64 216,145 103,263 112,882
65 - 69 151,067 69,476 81,591
70 - 74 106,498 46,163 60,335
75 -79 75,490 30,249 45,241
80 years old and over 69,764 24,849 44,915
BOHOL
All Ages 1,313,560 667,430 646,130
Under 1 25,564 13,275 12,289
1 - 4 107,825 56,316 51,509
5 - 9 141,703 73,573 68,130
10 - 14 146,422 75,960 70,462
15 -19 127,992 67,291 60,701
20 - 24 105,577 54,870 50,707
25 - 29 94,527 48,342 46,185
30 - 34 84,766 43,619 41,147
35 - 39 79,720 41,059 38,661
40 - 44 74,789 38,483 36,306
45 - 49 69,406 35,309 34,097
50 - 54 62,001 31,206 30,795
55 - 59 52,526 26,147 26,379
60 - 64 42,021 20,170 21,851
65 - 69 33,433 15,403 18,030
70 - 74 27,158 11,721 15,437
75 -79 19,112 7,863 11,249
80 years old and over 19,018 6,823 12,195
Note: * Excluding Cebu City, Lapu-Lapu City and Mandaue City
Source: Philippine Statistics Authority, 2015 Census of Population
HOUSEHOLD POPULATION BY AGE GROUP AND BY SEX
1-20

Table 1.6 - Continued
Age Group / Province Both Sexes Male Female
CEBU*
All Ages 2,938,982 1,494,506 1,444,476
Under 1 64,507 33,609 30,898
1 - 4 261,608 136,298 125,310
5 - 9 330,514 171,947 158,567
10 - 14 313,702 161,908 151,794
15 -19 292,429 150,130 142,299
20 - 24 270,778 138,427 132,351
25 - 29 234,858 120,566 114,292
30 - 34 206,546 106,547 99,999
35 - 39 186,628 96,100 90,528
40 - 44 163,320 83,940 79,380
45 - 49 145,102 74,012 71,090
50 - 54 125,775 63,676 62,099
55 - 59 104,069 51,689 52,380
60 - 64 84,885 40,571 44,314
65 - 69 58,834 27,020 31,814
70 - 74 40,584 17,674 22,910
75 -79 28,669 11,336 17,333
80 years old and over 26,174 9,056 17,118
NEGROS ORIENTAL
All Ages 1,354,995 690,141 664,854
Under 1 27,920 14,597 13,323
1 - 4 115,104 59,451 55,653
5 - 9 145,512 74,943 70,569
10 - 14 143,413 73,780 69,633
15 -19 136,153 70,616 65,537
20 - 24 121,583 62,546 59,037
25 - 29 102,407 53,442 48,965
30 - 34 88,411 46,223 42,188
35 - 39 81,855 42,505 39,350
40 - 44 76,049 38,618 37,431
45 - 49 70,781 35,832 34,949
50 - 54 65,478 32,772 32,706
55 - 59 54,624 27,033 27,591
60 - 64 44,719 21,875 22,844
65 - 69 29,699 14,090 15,609
70 - 74 21,052 9,465 11,587
75 -79 16,066 6,732 9,334
80 years old and over 14,169 5,621 8,548
1-21

Table 1.6 - Continued
Age Group / Province Both Sexes Male Female
SIQUIJOR
All Ages 95,984 48,717 47,267
Under 1 1,491 733 758
1 - 4 6,870 3,524 3,346
5 - 9 8,841 4,613 4,228
10 - 14 9,074 4,736 4,338
15 -19 8,919 4,805 4,114
20 - 24 7,587 3,999 3,588
25 - 29 6,954 3,540 3,414
30 - 34 6,517 3,381 3,136
35 - 39 6,181 3,175 3,006
40 - 44 5,911 3,050 2,861
45 - 49 5,394 2,775 2,619
50 - 54 5,025 2,549 2,476
55 - 59 4,382 2,157 2,225
60 - 64 3,729 1,832 1,897
65 - 69 2,943 1,366 1,577
70 - 74 2,533 1,132 1,401
75 -79 1,855 749 1,106
80 years old and over 1,778 601 1,177
CEBU CITY
All Ages 922,611 458,003 464,608
Under 1 23,279 11,852 11,427
1 - 4 85,811 43,656 42,155
5 - 9 96,157 48,157 48,000
10 - 14 88,592 44,899 43,693
15 -19 91,316 44,924 46,392
20 - 24 98,975 49,066 49,909
25 - 29 84,707 42,912 41,795
30 - 34 69,269 35,602 33,667
35 - 39 57,710 29,568 28,142
40 - 44 49,620 24,986 24,634
45 - 49 45,523 22,330 23,193
50 - 54 38,409 18,699 19,710
55 - 59 31,011 14,883 16,128
60 - 64 24,759 11,394 13,365
65 - 69 16,002 7,047 8,955
70 - 74 9,592 3,945 5,647
75 -79 6,245 2,241 4,004
80 years old and over 5,634 1,842 3,792
1-22

Table 1.6 - Continued
Age Group / Province Both Sexes Male Female
LAPU-LAPU CITY
All Ages 408,112 202,089 206,023
Under 1 10,581 5,378 5,203
1 - 4 39,688 20,348 19,340
5 - 9 43,803 22,420 21,383
10 - 14 38,460 19,883 18,577
15 -19 38,496 19,104 19,392
20 - 24 43,384 20,435 22,949
25 - 29 40,361 19,640 20,721
30 - 34 35,151 17,583 17,568
35 - 39 30,595 15,124 15,471
40 - 44 23,912 12,003 11,909
45 - 49 18,755 9,509 9,246
50 - 54 14,143 6,932 7,211
55 - 59 10,963 5,283 5,680
60 - 64 8,299 3,840 4,459
65 - 69 5,404 2,371 3,033
70 - 74 2,911 1,157 1,754
75 -79 1,790 675 1,115
80 years old and over 1,416 404 1,012
MANDAUE CITY
All Ages 362,654 182,715 179,939
Under 1 9,421 4,871 4,550
1 - 4 33,811 17,242 16,569
5 - 9 38,584 19,769 18,815
10 - 14 31,367 16,115 15,252
15 -19 33,392 16,908 16,484
20 - 24 41,031 20,201 20,830
25 - 29 37,945 19,311 18,634
30 - 34 30,924 15,828 15,096
35 - 39 25,212 12,994 12,218
40 - 44 20,388 10,518 9,870
45 - 49 17,341 8,726 8,615
50 - 54 13,890 6,878 7,012
55 - 59 10,867 5,370 5,497
60 - 64 7,733 3,581 4,152
65 - 69 4,752 2,179 2,573
70 - 74 2,668 1,069 1,599
75 -79 1,753 653 1,100
80 years old and over 1,575 502 1,073
1-23

Table 1.7
HOUSEHOLD POPULATION 10 YEARS AND OVER BY MARITAL STATUS AND BY AGE GROUP
Census Year 2015
Single Married WidowedDivorced/
Separated
Common-
law /
Live-in
Unknown
Central Visayas
Both Sexes 5,741,839 2,539,719 2,304,319 261,002 66,278 568,909 1,612
Below 20 1,487,637 1,451,505 6,152 100 223 28,838 819
20 - 24 682,697 475,898 82,237 405 1,938 122,121 98
25 - 29 596,635 247,125 208,122 1,367 4,934 134,967 120
30 - 34 517,960 118,454 294,735 2,731 7,588 94,368 84
35 - 39 464,852 68,239 319,982 4,938 9,154 62,456 83
40 - 44 411,830 46,278 305,711 8,371 9,218 42,184 68
45 - 49 370,683 36,308 281,681 13,596 8,829 30,176 93
50 - 54 323,738 27,836 246,596 20,627 7,779 20,850 50
55 - 59 267,782 21,038 199,013 27,489 6,335 13,848 59
60 - 64 215,814 16,867 149,732 35,428 4,644 9,096 47
65 - 69 150,838 11,303 96,063 35,514 2,823 5,111 24
70 - 74 106,358 7,664 58,736 35,721 1,521 2,685 31
75 - 79 75,377 5,634 34,678 32,927 792 1,332 14
80 years and over 69,638 5,570 20,881 41,788 500 877 22
BOHOL
Both Sexes 1,033,797 454,680 443,437 54,867 9,622 70,560 631
Below 20 273,324 268,431 879 14 38 3,616 346
20 - 24 104,527 76,225 14,009 61 234 13,960 38
25 - 29 93,673 41,189 36,850 191 527 14,873 43
30 - 34 84,233 20,036 51,909 439 952 10,861 36
35 - 39 79,351 12,190 57,275 773 1,189 7,897 27
40 - 44 74,521 8,806 57,195 1,316 1,276 5,901 27
45 - 49 69,214 7,105 54,090 2,206 1,336 4,458 19
50 - 54 61,881 5,759 48,225 3,447 1,204 3,232 14
55 - 59 52,440 4,350 39,911 4,873 1,027 2,262 17
60 - 64 41,974 3,469 29,923 6,286 767 1,512 17
65 - 69 33,407 2,523 22,057 7,274 538 1,004 11
70 - 74 27,145 1,896 15,686 8,685 306 556 16
75 - 79 19,099 1,320 9,421 7,951 138 261 8
80 years and over 19,008 1,381 6,007 11,351 90 167 12
Note: * Excluding Cebu City, Lapu-Lapu City and Mandaue City
Sources: 2015 Census of Population, Philippine Statistics Authority
Age Group/
Province / HUC
Household
Population
10 Years Old
and over
Marital Status
1-24

Table 1.7 - Continued
Single Married WidowedDivorced/
Separated
Common-
law /
Live-in
Unknown
CEBU *
Both Sexes 2,271,570 994,896 893,240 102,320 26,734 254,340 40
Below 20 600,286 585,383 1,959 22 45 12,877 -
20 - 24 269,606 182,916 29,900 163 776 55,850 1
25 - 29 233,948 90,566 79,532 612 2,200 61,035 3
30 - 34 205,832 43,156 116,167 1,161 3,259 42,081 8
35 - 39 186,006 25,517 126,666 2,070 3,751 27,996 6
40 - 44 162,801 17,248 119,919 3,438 3,700 18,489 7
45 - 49 144,779 13,429 109,330 5,366 3,440 13,208 6
50 - 54 125,535 10,167 95,171 8,090 3,084 9,020 3
55 - 59 103,916 7,823 76,871 10,900 2,467 5,851 4
60 - 64 84,790 6,425 58,464 14,193 1,807 3,901 -
65 - 69 58,765 4,508 37,122 13,957 1,092 2,086 -
70 - 74 40,550 3,082 21,912 13,862 614 1,079 1
75 - 79 28,628 2,340 12,733 12,726 301 527 1
80 years and over 26,128 2,336 7,494 15,760 198 340 -
NEGROS ORIENTAL
Both Sexes 1,062,476 457,504 467,002 50,292 11,562 75,649 467
Below 20 278,581 270,426 2,150 15 50 5,774 166
20 - 24 120,788 80,233 23,271 61 301 16,883 39
25 - 29 101,835 39,622 45,102 220 688 16,158 45
30 - 34 88,005 19,464 55,643 476 1,082 11,315 25
35 - 39 81,525 12,289 59,252 927 1,541 7,477 39
40 - 44 75,737 8,696 58,489 1,570 1,571 5,389 22
45 - 49 70,565 7,108 55,432 2,622 1,512 3,866 25
50 - 54 65,335 5,832 51,076 3,979 1,465 2,962 21
55 - 59 54,513 4,474 41,263 5,340 1,214 2,196 26
60 - 64 44,678 3,600 31,757 6,759 957 1,580 25
65 - 69 29,663 2,173 19,300 6,656 579 943 12
70 - 74 21,037 1,452 12,050 6,669 296 561 9
75 - 79 16,054 1,057 7,692 6,818 185 299 3
80 years and over 14,160 1,078 4,525 8,180 121 246 10
Age Group/
Province / HUC
Household
Population
10 Years Old
and over
Marital Status
1-25

Table 1.7 - Continued
Single Married WidowedDivorced/
Separated
Common-
law /
Live-in
Unknown
SIQUIJOR
Both Sexes 78,162 32,882 32,575 5,141 807 6,464 293
Below 20 17,700 17,143 44 - - 228 285
20 - 24 7,452 5,567 750 3 7 1,125 -
25 - 29 6,907 3,272 2,248 13 35 1,337 2
30 - 34 6,493 1,876 3,570 28 70 949 -
35 - 39 6,143 1,177 4,061 58 99 747 1
40 - 44 5,887 895 4,118 97 126 650 1
45 - 49 5,369 710 3,925 181 118 433 2
50 - 54 5,004 599 3,633 332 91 348 1
55 - 59 4,375 489 3,154 426 81 225 -
60 - 64 3,725 370 2,546 569 67 173 -
65 - 69 2,943 258 1,839 677 46 123 -
70 - 74 2,532 221 1,387 822 36 66 -
75 - 79 1,854 181 813 790 24 45 1
80 years and over 1,778 124 487 1,145 7 15 -
CEBU CITY (Capital)
Both Sexes 705,531 338,152 244,007 28,702 10,681 83,940 49
Below 20 177,142 173,035 539 27 60 3,479 2
20 - 24 96,648 72,399 6,538 66 390 17,248 7
25 - 29 82,638 40,422 20,395 192 926 20,696 7
30 - 34 67,947 19,458 31,642 344 1,338 15,158 7
35 - 39 56,556 10,097 34,881 585 1,510 9,481 2
40 - 44 48,923 6,529 33,560 1,046 1,505 6,283 -
45 - 49 44,924 5,153 32,041 1,792 1,454 4,477 7
50 - 54 38,091 3,616 27,514 2,755 1,193 3,006 7
55 - 59 30,785 2,564 21,954 3,384 956 1,922 5
60 - 64 24,644 2,019 16,277 4,537 681 1,130 -
65 - 69 15,925 1,258 9,671 4,084 339 572 1
70 - 74 9,526 705 4,847 3,511 175 284 4
75 - 79 6,206 483 2,540 2,959 93 131 -
80 years and over 5,576 414 1,608 3,420 61 73 -
Age Group/
Province / HUC
Household
Population
10 Years Old
and over
Marital Status
1-26

Table 1.7 - Continued
Single Married WidowedDivorced/
Separated
Common-
law /
Live-in
Unknown
LAPU-LAPU CITY (OPON)
Both Sexes 312,323 138,758 122,622 10,732 3,632 36,579 -
Below 20 76,794 75,080 380 5 16 1,313 -
20 - 24 43,091 30,377 4,716 21 101 7,876 -
25 - 29 40,053 16,216 13,625 92 306 9,814 -
30 - 34 34,808 7,282 20,266 161 498 6,601 -
35 - 39 30,346 3,702 21,591 309 589 4,155 -
40 - 44 23,743 2,061 17,967 520 595 2,600 -
45 - 49 18,664 1,398 14,177 789 494 1,806 -
50 - 54 14,088 846 10,696 1,109 370 1,067 -
55 - 59 10,934 639 7,957 1,402 296 640 -
60 - 64 8,292 491 5,555 1,691 179 376 -
65 - 69 5,397 280 3,201 1,598 109 209 -
70 - 74 2,909 168 1,426 1,193 44 78 -
75 - 79 1,788 115 719 892 28 34 -
80 years and over 1,416 103 346 950 7 10 -
MANDAUE CITY
Both Sexes 277,980 122,847 101,436 8,948 3,240 41,377 132
Below 20 63,810 62,007 201 17 14 1,551 20
20 - 24 40,585 28,181 3,053 30 129 9,179 13
25 - 29 37,581 15,838 10,370 47 252 11,054 20
30 - 34 30,642 7,182 15,538 122 389 7,403 8
35 - 39 24,925 3,267 16,256 216 475 4,703 8
40 - 44 20,218 2,043 14,463 384 445 2,872 11
45 - 49 17,168 1,405 12,686 640 475 1,928 34
50 - 54 13,804 1,017 10,281 915 372 1,215 4
55 - 59 10,819 699 7,903 1,164 294 752 7
60 - 64 7,711 493 5,210 1,393 186 424 5
65 - 69 4,738 303 2,873 1,268 120 174 -
70 - 74 2,659 140 1,428 979 50 61 1
75 - 79 1,748 138 760 791 23 35 1
80 years and over 1,572 134 414 982 16 26 -
Household
Population
10 Years Old
and over
Marital Status
Age Group/
Province / HUC
1-27

Chapter 2
INCOME AND PRICES
Data on the levels and patterns of family income and expenditure, poverty incidence and
threshold and price indices are vital indicators of the socio-economic status of the people. Specifically, these data provide a picture of the standard of living, the varying degrees of inequality,
the purchasing capacity, and the demand for goods and services of families. The data are essential in the conceptualization and assessment of poverty alleviation programs of government, private and non-governmental organizations. The data have become more significant to all sectors now, that
genuine efforts are being demonstrated in pursuing the social reform agenda. The trends, patterns and signals shown by the data have been given wide and serious attention due to the far-reaching
ramifications on policies and programs aimed at people empowerment. The usage of the data has accordingly permeated all echelons of the government bureaucracy, private businesses and even the ordinary citizens themselves. With the support provided by the data, interventions can be
implemented to help the citizenry respond to situations brought about by increased prices and incidence of poverty and low income capacity, among others.
This chapter presents data for the region and by province pertaining to family income, expenditures and consumer price indices. Several indicators derived from these basic data such as
poverty incidence and threshold, inflation rate and purchasing power of the peso are also presented in this chapter. The income, expenditures and price data are generated from the results of the Family Income and Expenditures Survey (FIES) and price surveys of the PSA. The poverty statistics, on the
other hand, were computed by the Technical Working Group on Income Statistics of the PSA using the results of the FIES.
Highlights
• Average family income in Central Visayas increased by 14.4 percent between 2012 and 2015, based on the results of the 2015 FIES. Average family expenditure, on the other hand, rose by 17.7 percent.
• Families in the P40,000.00 – P59,999.00 income bracket recorded a drop from about 139,000 families in 2012 to 96,000 families in 2015. On the other hand, families in the
P250,000.00 and over income bracket recorded an increase from 402,000 families in 2012 to about 498,000 families in 2015.
• Siquijor recorded the highest average family income among provinces in Central Visayas in 2012 at P232,525.00 while Negros Oriental registered the lowest at P170,929.00.
• Majority of families in Central Visayas in 2015 derived their income from other sources of income.
• Food remained the biggest expenditure item of families accounting for 44.3 percent of the total family expenditures in 2015. For families under P40,000.00 income bracket, food took up 60.5 percent of the total family expenditure.

2-2
• On the average, families in Central Visayas needed P21,914.00 to be considered non-poor. The 2015 annual per capita poverty threshold for Central Visayas was 16.8 percent higher than the 2012 threshold. Incidence of poor families reduced from 25.7 to 23.6 percent.
• In 2017, the average annual inflation rate (2012=100) in Central Visayas was recorded at 2.5 percent with September and October being the highest at 3.1 percent and May and June being
the lowest at 2.0 percent.

Contents
Highlights 2-1
STATISTICAL TABLES:
Table 2.1 Total Number of Families, Total and Average Family Income and Expenditure
by Region: 2006, 2009, 2012 and 2015 ……………………………………………….………….….. 2-5
Table 2.2 Total Number of Families, Total and Average Family Income and Expenditure
by Income Class, Central Visayas: 2006, 2009, 2012 and 2015 ………………………….….. 2-7
Table 2.3 Total Number of Families, Total and Average Family Income and Expenditure
by Expenditure Class, Central Visayas: 2006, 2009, 2012 and 2015 …………………….…. 2-9
Table 2.4 Total Number of Families, Average Income and Expenditure
by Family Size and Income Class, Central Visayas: 2006, 2009, 2012 and 2015 ….….. 2-10
Table 2.5 Average Annual Family Income and Expenditure, Standard Error,
Coefficient of Variation by Province: 2006, 2009, 2012 and 2015 ….……………………..… 2-12
Table 2.6 Total Number of Families by Main Source of Income and Income Class
Central Visayas: 2006, 2009, 2012 and 2015 ….……………………………………………………. 2-13
Table 2.7 Mean and Median Family Income and Expenditure by Income Decile
Central Visayas: 2006, 2009, 2012 and 2015 ……………………………………………………….. 2-14
Table 2.8 Distribution of Total Family Expenditure by Expenditure Group and Income Class
Central Visayas: 2006, 2009, 2012 and 2015 ….……………………………………………………. 2-15
Table 2.9A Per Capita Poverty Thresholds and Poverty Incidence Among Families and
Population by Province: 2006, 2009, 2012 and 2015 ….....………………………………………. 2-19
Table 2.9B Per Capita Food Thresholds and Subsistence Incidence Among Families and
Population by Province: 2006, 2009, 2012 and 2015 ……………………………………………... 2-19
Table 2.10 Poverty Statistics for the Basic Sector
Central Visayas: 2006, 2009, 2012 and 2015 …………………………………………………....…. 2-20
Table 2.11 Consumer Price Index, Inflation Rate and Purchasing Power of Peso
for All Income Households by Month and Province: 2014-2017 ….…………………………… 2-21
Table 2.12 Consumer Price Index for All Income Households by Month and Province: 2017 ......... 2-23
2-3

ContentsFIGURES:
Figure 2.1 Average Annual Family Income and Expenditure by Province: 2012 ……………….………. 2-8
Figure 2.2 Total Number of Families, Average Family Income and Expenditure by Income Class
Central Visayas: 2015 …………………………………………………………………………….….………… 2-8
Figure 2.3 Total Number of Families by Main Source of Income and Income Class
Central Visayas: 2015 ….……………………………………………………………………………………… 2-12
Figure 2.4 Annual Poverty Incidence Among Families by Province
2009, 2012 and 2015 ...…..................................................................................... 2-24
Figure 2.5 Consumer Price Index and Inflation Rate by Province: 2017 ….………………………………. 2-25
Figure 2.6 Consumer Price Index and Inflation Rate, Central Visayas: 2014-2017 ….………………… 2-25
2-4

Table 2.1
TOTAL NUMBER OF FAMILIES, TOTAL AND AVERAGE FAMILY INCOME AND EXPENDITURE BY REGION
2006, 2009, 2012 and 2015
(Total Number of Families in Thousands; Totals in Million Pesos; Averages in Thousand Pesos)
Total Average Total Average
17,403 3,006,104 173 2,561,437 147
NCR National Capital Region 2,362 734,207 311 609,195 258
CAR Cordillera Administrative Region 303 58,120 192 45,530 151
I Ilocos Region 947 134,762 142 116,913 124
II Cagayan Valley 620 88,448 143 73,034 118
III Central Luzon 1,909 377,387 198 325,271 170
IVA CALABARZON 2,251 472,042 210 419,240 186
IVB MIMAROPA 545 59,427 109 50,728 93
V Bicol Region 1,010 126,422 125 111,590 110
VI Western Visayas 1,370 177,965 130 158,843 116
VII Central Visayas 1,293 186,627 144 159,893 124
VIII Eastern Visayas 814 102,366 126 84,730 104
IX Zamboanga Peninsula 623 78,200 125 61,512 99
X Northern Mindanao 789 111,796 142 91,998 117
XI Davao Region 841 113,237 135 96,849 115
XII SOCCSKSARGEN 749 85,283 144 71,746 96
XIII Caraga 444 52,490 118 44,406 100
ARMM Autonomous Region in Muslim
Mindanao 534 47,324 89 39,959 75
18,452 3,804,325 206 3,239,186 176
NCR National Capital Region 2,461 876,564 356 760,363 309
CAR Cordillera Administrative Region 322 70,454 219 56,182 174
I Ilocos Region 1,005 187,342 186 152,646 152
II Cagayan Valley 653 118,187 181 92,306 141
III Central Luzon 2,028 448,001 221 382,492 189
IVA CALABARZON 2,406 598,038 249 511,515 312
IVB MIMAROPA 590 83,374 141 71,121 121
V Bicol Region 1,070 162,567 152 146,595 137
VI Western Visayas 1,452 231,473 159 207,669 143
VII Central Visayas 1,374 252,424 184 208,641 152
VIII Eastern Visayas 865 138,599 160 110,885 128
IX Zamboanga Peninsula 662 95,410 144 76,598 116
X Northern Mindanao 839 138,259 165 116,690 139
XI Davao Region 884 146,292 166 125,043 142
XII SOCCSKSARGEN 801 123,067 154 105,539 132
XIII Caraga 470 69,864 149 58,951 125
ARMM Autonomous Region in Muslim
Mindanao 572 64,412 113 55,950 98
Note: Details may not add up to totals due to rounding.
Source: Family Income and Expenditure Survey
Philippine Statistics Authority
Year / Region Total Number
of Families
Income Expenditure
PHILIPPINES
2006
2009
PHILIPPINES
2-5

Table 2.1 - Continued
Total Average Total Average
21,426 5,026,798 235 4,125,312 193
NCR National Capital Region 2,917 1,106,169 379 947,599 325
CAR Cordillera Administrative Region 375 96,351 257 70,633 188
I Ilocos Region 1,105 225,050 204 175,220 159
II Cagayan Valley 771 150,089 195 107,884 140
III Central Luzon 2,386 618,893 259 503995 211
IVA CALABARZON 3,082 876,006 284 748,129 243
IVB MIMAROPA 638 114,117 179 88,215 138
V Bicol Region 1,165 189,185 162 167,256 144
VI Western Visayas 1,604 324,028 202 260,971 163
VII Central Visayas 1,577 329,415 209 258,635 164
VIII Eastern Visayas 902 149,493 166 118,998 132
IX Zamboanga Peninsula 772 124,903 162 93,829 122
X Northern Mindanao 976 185,015 190 139,353 143
XI Davao Region 1,078 209,405 194 167,651 156
XII SOCCSKSARGEN 988 160,674 163 138,089 140
XIII Caraga 532 95,809 180 75,352 142
ARMM Autonomous Region in Muslim
Mindanao 557 72,196 130 63,506 114
22,730 6,068,162 267 4,882,860 215
NCR National Capital Region 3,019 1,282,823 425 1,053,215 349
CAR Cordillera Administrative Region 402 113,531 282 84,004 209
I Ilocos Region 1,170 278,515 238 212,525 182
II Cagayan Valley 816 193,589 237 132,063 162
III Central Luzon 2,507 750,054 299 600095 239
IVA CALABARZON 3,251 1,013,942 312 875,400 269
IVB MIMAROPA 697 154,612 222 111,907 161
V Bicol Region 1,262 236,476 187 202,469 160
VI Western Visayas 1,699 384,039 226 299,808 176
VII Central Visayas 1,672 399,734 239 323,434 193
VIII Eastern Visayas 976 191,720 196 151,994 156
IX Zamboanga Peninsula 824 156,872 190 118,758 144
X Northern Mindanao 1,029 227,998 222 166,005 161
XI Davao Region 1,156 285,560 247 219,680 190
XII SOCCSKSARGEN 1,055 198,438 188 170,863 162
XIII Caraga 579 114,745 198 92,243 159
ARMM Autonomous Region in Muslim
Mindanao 616 85,514 139 68,397 111
2015
PHILIPPINES
Total Number
of Families
Income Expenditure
2012
PHILIPPINES
Year / Region
2-6

Table 2.2
TOTAL NUMBER OF FAMILIES, TOTAL AND AVERAGE FAMILY INCOME AND EXPENDITURE
BY INCOME CLASS, CENTRAL VISAYAS
2006, 2009, 2012 and 2015
(Number of Families in Thousands; Totals in Million Pesos; Averages in Thousand Pesos)
Total Average Total Average
2006
Central Visayas 1,293 186,627 144 159,893 124
Under 40,000 194 5,494 28 5,889 30
40,000 - 59,999 185 9,167 50 9,051 49
60,000 - 99,999 311 24,341 78 23,044 74
100,000 - 249,999 414 64,030 155 56,650 137
250,000 and over 190 83,595 441 65,259 344
2009
Central Visayas 1,374 252,424 184 208,641 152
Under 40,000 105 3,050 29 3,229 31
40,000 - 59,999 159 8,117 51 8,419 53
60,000 - 99,999 300 23,622 79 22,926 76
100,000 - 249,999 533 83,374 156 73,498 138
250,000 and over 277 134,262 485 100,570 363
2012
Central Visayas 1,577 329,415 209 258,635 164
Under 40,000 94 2,738 29 3,049 32
40,000 - 59,999 139 6,961 50 7,403 53
60,000 - 99,999 325 25,802 79 24,940 77
100,000 - 249,999 617 97,920 159 84,919 138
250,000 and over 402 195,994 487 138,324 344
2015
Central Visayas 1,672 399,734 239 323,434 193
Under 40,000 75 2,207 29 3,219 43
40,000 - 59,999 96 4,922 51 6,263 65
60,000 - 99,999 274 22,079 80 24,778 90
100,000 - 249,999 729 116,696 160 107,274 147
250,000 and over 498 253,830 510 181,901 365
Note: Details may not add up to totals due to rounding.
Source: Family Income and Expenditure Survey
20015 Family Income and Expenditure Survey, Public Use Files
Philippine Statistics Authority
Income ClassTotal Number
of Families
Income Expenditure
2-7

Under 40,000
40,000 - 59,999
60,000 - 99,999
100,000 - 249,999
250,000 and over
2012
Province
Bohol
Cebu
Negros Oriental
Siquijor
2015
Province
Bohol
Cebu
Negros Oriental
Siquijor
-
100
200
300
400
500
600
700
800
-
100
200
300
400
500
600
Under 40,000 40,000 - 59,999 60,000 - 99,999 100,000 - 249,999 250,000 and over
Nu
mb
er
of
Fam
ilie
s
Av
era
ge
In
co
me a
nd
Exp
en
dit
ure
(in
peso
s)
Income Class
Figure 2.2 Total Number of Families, Average Family Income and Expenditureby Income Class, Central Visayas: 2015
Number of Families
Average Income
Average Expenditure
0
50,000
100,000
150,000
200,000
250,000
Bohol Cebu Negros Oriental Siquijor
in p
es
os
Figure 2.1 Average Annual Family Income and Expenditureby Province: 2012
Income Expenditure
2-8

Table 2.3
TOTAL NUMBER OF FAMILIES, TOTAL AND AVERAGE FAMILY INCOME AND EXPENDITURE
BY EXPENDITURE CLASS, CENTRAL VISAYAS
2006, 2009, 2012 and 2015
(Number of Families in Thousands; Totals in Million Pesos; Averages in Thousand Pesos)
Total Average Total Average
2006
Central Visayas 1,293 186,627 144 159,893 124
Under 40,000 …. 6,560 32 5,846 28
40,000 - 59,999 …. 12,614 56 11,108 50
60,000 - 99,999 …. 28,188 88 24,996 78
100,000 - 249,999 …. 72,035 178 61,690 153
250,000 and over …. 67,230 481 56,253 403
2009
Central Visayas 1,374 252,424 184 208,641 152
Under 40,000 …. 3,569 32 3,210 29
40,000 - 59,999 …. 10,749 59 9,309 51
60,000 - 99,999 …. 32,369 94 27,237 79
100,000 - 249,999 …. 94,600 181 80,872 154
250,000 and over …. 111,139 525 88,015 416
2012
Central Visayas 1,577 329,415 209 258,635 164
Under 40, 000 …. 3,901 37 3,145 30
40,000 - 59,999 …. 9,728 61 8,155 51
60,000 - 99,999 …. 35,328 93 30,095 79
100,000 - 249,999 …. 127,217 195 101,425 156
250,000 and over …. 153,240 549 115,815 415
2015
Central Visayas 1,672 329,415 209 258,635 164
Under 40, 000 …. 2,424 38 1,899 30
40,000 - 59,999 …. 7,681 66 5,922 51
60,000 - 99,999 …. 35,148 102 27,859 81
100,000 - 249,999 …. 145,902 190 121,028 158
250,000 and over …. 208,578 546 166,727 437
Note: Details may not add up to totals due to rounding.
Source: Family Income and Expenditure Survey
2003 Family Income and Expenditure Survey, Public Use Files
Philippine Statistics Authority
Expenditure ClassTotal Number of
Families
Income Expenditure
2-9

Table 2.4
TOTAL NUMBER OF FAMILIES, AVERAGE INCOME AND EXPENDITURE BY FAMILY SIZE AND
INCOME CLASS
CENTRAL VISAYAS
2006, 2009, 2012 and 2015
(Number of Families in Thousands; Average Income and Expenditure in Thousand Pesos)
All Income
Class
Under
40,000
40,000 -
59,999
60,000 -
99,999
100,000 -
249,999
250,000
and over
2006
Central Visayas
Number of Families 1,293 194 185 311 414 190
Average Income 144 28 50 78 155 441
Average Expenditure 124 30 49 74 137 344
Five Persons or less
Average Income 129 28 50 79 153 430
Average Expenditure 111 29 47 74 136 335
Six Persons or more
Average Income 172 32 49 78 158 453
Average Expenditure 146 38 53 75 139 345
2009
Central Visayas
Number of Families 1,374 105 159 300 533 277
Average Income 184 29 51 79 156 485
Average Expenditure 152 31 53 76 138 363
Five Persons or less
Average Income 164 29 51 78 155 474
Average Expenditure 135 30 52 73 136 345
Six Persons or more
Average Income 216 35 52 80 158 498
Average Expenditure 181 42 57 82 140 384
Note: Details may not add up to the total due to rounding.
Source: Family Income and Expenditure Survey
2003 Family Income and Expenditure Survey, Public Use Files
Philippine Statistics Authority
Income Class
Family Size
2-10

Table 2.4 - Continued
All Income
Class
Under
40,000
40,000 -
59,999
60,000 -
99,999
100,000 -
249,999
250,000
and over
2012
Central Visayas
Number of Families 1,577 94 139 326 616 402
Average Income 209 29 50 79 159 487
Average Expenditure 164 32 53 77 138 344
Five Persons or less
Average Income 180 29 50 79 159 487
Average Expenditure 141 32 53 77 138 335
Six Persons or more
Average Income 260 37 51 80 161 487
Average Expenditure 205 50 59 83 143 352
2015
Central Visayas
Number of Families 1,672 75 96 274 729 498
Average Income 239 29 51 80 160 510
Average Expenditure 193 43 65 90 147 365
Five Persons or less
Average Income 211 29 51 80 158 513
Average Expenditure 173 40 64 87 143 368
Six Persons or more
Average Income 294 36 53 82 164 507
Average Expenditure 454 94 76 101 155 363
Note: Details may not add up to the total due to rounding.
Source: Family Income and Expenditure Survey
Philippine Statistics Authority
Family Size
Income Class
2-11

Table 2.5
AVERAGE ANNUAL FAMILY INCOME AND EXPENDITURE, STANDARD ERROR, COEFFICIENT
OF VARIATION BY PROVINCE
2006, 2009, 2012 and 2015
(In Pesos)
EstimateStandard
Error
Coefficient
of VariationEstimate
Standard
Error
Coefficient
of Variation
2006
Bohol 114,535 12,197 10.65 94,675 8,581 9.1
Cebu 164,006 8,532 5.20 143,502 7,742 5.4
Negros Oriental 110,129 14,535 13.20 89,013 10,077 11.3
Siquijor 160,616 31,258 19.46 128,868 24,487 19.0
2009
Bohol 148,638 16,439 11.1 129,881 13,156 10.1
Cebu 207,478 10,061 4.8 170,998 7,837 4.6
Negros Oriental 146,286 16,546 11.3 113,496 9,983 8.8
Siquijor 106,487 21,964 20.6 108,938 25,301 23.2
2012 208,194 8,108 3.89 159,539 5,783 3.62
Bohol 180,047 16,353 9.08 140,850 10,937 7.77
Cebu 227,827 9,944 4.36 175,753 7,241 4.12
Negros Oriental 170,929 21,988 12.86 126,901 15,473 12.19
Siquijor 232,525 55,167 23.73 159,708 37,089 23.22
2015 (regional level ) 239,054 9,400 4.14 193,425 6,882 3.56
Note: Details may not add up to totals due to rounding.
Source: Family Income and Expenditure Survey
Philippine Statistics Authority
Income Expenditure
Year / Province
-
100
200
300
400
500
600
700
800
Under 40,000 40,000-59,999 60,000-99,999 100,000-249,999 250,000 and over
Figure 2.3 Total Number of Families by Main Source of Income and Income Class, Central Visayas: 2015
Wage / Salaries
Entrepreneurial Activities
Other Sources of Income
Other receipts
2-12

Table 2.6
TOTAL NUMBER OF FAMILIES BY MAIN SOURCE OF INCOME AND INCOME CLASS
CENTRAL VISAYAS
2006, 2009, 2012 and 2015
Under
40,000
40,000 -
59,999
60,000 -
99,999
100,000 -
249,999
250,000 -
and over
2006
CENTRAL VISAYAS 1,293 194 185 311 414 190
Wage / Salaries 613 43 64 161 257 89
Entrepreneurial Activities 362 83 85 95 66 33
Other Source of Income 318 67 36 55 91 68
2009
CENTRAL VISAYAS 1,374 105 159 300 533 277
Wage / Salaries 677 15 45 140 322 154
Entrepreneurial Activities 352 39 65 104 111 34
Other Source of Income 345 51 49 56 100 89
2012
CENTRAL VISAYAS 1,577 94 139 325 617 402
Wage / Salaries 718 14 36 128 312 181
Entrepreneurial Activities 279 29 42 87 126 58
Other Source of Income 580 51 61 110 178 163
2015
CENTRAL VISAYAS 1,672 75 96 274 729 498
Wage and Salaries 1,347 27 61 210 622 427
Entrepreneurial Activities 1,143 61 73 209 493 306
Other Sources of Income 1,670 75 96 274 728 497
Other receipts 623 18 38 94 269 204
Source: Family Income and Expenditure Survey
2003 Family Income and Expenditure Survey, Public Use Files
Philippine Statistics Authority
Total Number of
FamiliesMain Source of Income
Income Class
2-13

Table 2.7
MEAN AND MEDIAN FAMILY INCOME AND EXPENDITURE BY INCOME DECILE, CENTRAL VISAYAS
2006, 2009, 2012 and 2015
(In Thousand Pesos)
Mean Median Mean Median
2006 Central Visayas 144 93 124 85
First Decile 31 32 26 26
Second Decile 46 47 41 41
Third Decile 56 56 52 51
Fourth Decile 65 65 65 64
Fifth Decile 77 78 79 78
Sixth Decile 92 93 96 93
Seventh Decile 111 111 118 118
Eighth Decile 147 146 150 145
Ninth Decile 217 213 214 208
Tenth Decile 455 376 395 340
2009 Central Visayas 184 119 152 107
First Decile 54 53 59 55
Second Decile 70 38 70 65
Third Decile 83 80 78 74
Fourth Decile 105 103 97 90
Fifth Decile 115 112 106 99
Sixth Decile 136 129 122 122
Seventh Decile 160 150 137 127
Eighth Decile 215 203 183 175
Ninth Decile 312 299 249 234
Tenth Decile 588 491 418 360
2012 Central Visayas 209 138 164 119
First Decile 57 55 63 61
Second Decile 82 77 81 67
Third Decile 93 91 89 81
Fourth Decile 111 106 98 97
Fifth Decile 136 130 117 108
Sixth Decile 164 156 140 132
Seventh Decile 205 189 167 151
Eighth Decile 248 228 195 179
Ninth Decile 335 322 248 238
Tenth Decile 656 587 443 363
2015 Central Visayas 239 160 193 139
First Decile 67 62 86 77
Second Decile 95 90 109 97
Third Decile 123 118 127 111
Fourth Decile 138 132 125 115
Fifth Decile 167 160 149 136
Sixth Decile 186 172 161 137
Seventh Decile 230 219 193 164
Eighth Decile 278 260 230 207
Ninth Decile 392 366 302 267
Tenth Decile 716 607 454 400
Source: Family Income and Expenditure Survey
Family Income and Expenditure Survey, Public Use Files
Philippine Statistics Authority
Income ExpenditureYear Income Decile
2-14

Table 2.8
DISTRIBUTION OF TOTAL FAMILY EXPENDITURE BY EXPENDITURE GROUP AND INCOME CLASS
CENTRAL VISAYAS
2006, 2009, 2012 and 2015
(In Percent)
Under
40,000
40,000 -
59,999
60,000 -
99,999
100,000 -
249,999
250,000
and over
CENTRAL VISAYAS
Total Family Expenditure( In Million Pesos) 159,893 5,889 9,051 23,044 56,650 65,259
Average Expenditure (In thousands) 124 30 49 74 137 344
Expenditure Group 100.00 100.00 100.00 100.00 100.00 100.00
Food Expenditure 44.80 64.60 63.80 58.10 47.30 33.60
Food Consumed at Home 40.20 63.60 61.70 54.50 41.70 28.70
Cereals and Cereal preparation 12.80 29.50 28.00 20.70 12.70 6.40
Roots and Tubers 0.40 1.20 1.00 0.60 0.40 0.30
Fruits and Vegetables 3.60 5.80 5.10 4.50 3.60 2.80
Meat and Meat Preparations 6.20 3.90 4.60 6.10 6.90 6.10
Dairy Products and Eggs 3.40 2.10 2.90 3.40 3.50 3.50
Fish and Marine Products 6.80 12.60 11.30 10.20 7.00 4.20
Coffee, Cocoa and Tea 1.10 1.60 1.60 1.50 1.10 0.70
Non-Alcoholic Beverages 1.70 0.70 1.00 1.60 1.90 1.80
Food N.E.C 4.20 6.20 6.10 5.80 4.60 2.90
Food Consumed Outside Home 4.60 1.00 2.10 3.60 5.60 4.90
Alcoholic Beverages 0.90 1.40 1.30 1.40 1.00 0.40
Tobacco 0.70 1.30 1.10 1.30 0.80 0.30
Fuel, Light and Water 6.60 6.90 6.40 6.60 6.70 6.60
Transportation and Communication 7.70 2.40 3.70 4.90 7.10 10.20
Household Operations 2.50 1.90 1.70 1.60 1.80 3.60
Personal Care and Effects 3.30 2.70 3.10 3.40 3.60 3.20
Clothing, Footwear and Other Wear 2.00 1.30 1.70 1.80 2.10 2.20
Educational Fees 4.50 0.60 1.30 2.00 3.90 6.70
Recreation 0.40 0.10 0.10 0.20 0.20 0.80
Medical Care 3.10 1.10 0.80 1.80 2.70 4.30
Non-Durable Furnishings 0.20 0.10 0.10 0.10 0.10 0.20
Durable Furniture and Equipment 2.80 0.30 0.70 2.20 3.10 3.20
Taxes 1.70 0.20 0.20 0.40 1.40 2.80
House Rental Value 11.50 9.30 8.50 9.00 11.60 13.00
House Maintenance and Repairs 0.80 0.50 0.60 0.50 0.70 0.90
Special Family Occasion 3.10 1.50 2.00 2.30 2.80 4.00
Gifts and Contributions 0.70 0.50 0.40 0.50 0.60 1.00
Other Expenditure 2.60 3.40 2.60 1.90 2.40 2.90
Note: Details may not add up to totals due to rounding.
Source: Family Income and Expenditure Survey
Philippine Statistics Authority
Expenditure Group Total
2006
Income Class
2-15

Table 2.8 - Continued
Under
40,000
40,000 -
59,999
60,000 -
99,999
100,000 -
249,999
250,000
and over
CENTRAL VISAYAS
Total Family Expenditure( In Million Pesos) 208,641 3,229 8,419 22,926 73,498 100,570
Average Expenditure (In Pesos) 152 31 53 76 138 363
Expenditure Group 100.00 100.00 100.00 100.00 100.00 100.00
Food Expenditure 45.00 61.90 62.30 61.30 52.70 33.70
Food Consumed at Home 40.20 61.30 60.50 58.30 47.50 28.30
Cereals and Cereal preparation 14.20 29.90 29.40 25.90 17.00 7.80
Roots and Tubers 0.40 1.20 0.90 0.70 0.40 0.20
Fruits and Vegetables 3.40 5.60 5.20 4.90 3.70 2.50
Meat and Meat Preparations 5.90 3.50 4.00 4.90 6.90 5.60
Dairy Products and Eggs 3.10 2.00 2.20 3.10 3.40 3.00
Fish and Marine Products 6.50 11.30 11.00 10.40 7.70 4.20
Coffee, Cocoa and Tea 1.10 1.30 1.40 1.50 1.30 0.70
Non-Alcoholic Beverages 1.70 0.50 1.00 1.50 2.00 1.60
Food N.E.C 4.00 5.90 5.40 5.20 5.10 2.70
Food Consumed Outside Home 4.80 0.70 1.80 3.00 5.10 5.40
Alcoholic Beverages 0.80 0.90 1.10 1.20 1.00 0.40
Tobacco 0.60 1.30 1.00 1.10 0.90 0.30
Fuel, Light and Water 6.40 7.60 5.90 6.00 6.40 6.40
Transportation and Communication 7.00 2.50 3.10 4.10 6.20 8.60
Household Operations 2.50 1.90 1.70 1.70 1.80 3.20
Personal Care and Effects 3.20 2.50 2.90 3.20 3.50 3.00
Clothing, Footwear and Other Wear 1.90 1.20 1.60 1.60 1.80 2.10
Educational Fees 4.30 0.30 1.00 1.70 3.10 6.30
Recreation 0.30 0.10 0.10 0.10 0.10 0.40
Medical Care 3.20 1.60 2.40 1.60 2.10 4.50
Non-Durable Furnishings 0.20 0.10 0.10 0.10 0.20 0.20
Durable Furniture and Equipment 2.50 0.00 0.40 1.10 1.90 3.50
Taxes 2.00 0.10 0.30 0.20 0.70 3.40
House Rental Value 12.60 12.00 9.80 9.60 11.30 14.40
House Maintenance and Repairs 0.80 0.10 0.40 0.40 0.70 1.00
Special Family Occasion 2.90 0.80 1.70 1.60 2.40 3.70
Gifts and Contributions 0.90 0.40 0.50 0.50 0.80 1.00
Other Expenditure 3.20 4.50 3.60 2.80 2.50 3.80
Expenditure Group Total
2009
Income Class
2-16

Table 2.8 - Continued
Under
40,000
40,000 -
59,999
60,000 -
99,999
100,000 -
249,999
250,000
and over
CENTRAL VISAYAS
Total Family Expenditure( In Million Pesos) 258,635 3,049 7,403 24,940 84,919 138,324
Average Expenditure (In Pesos) 164 32 53 77 138 344
Percent to Total Expenditure 100.0 100.0 100.0 100.0 100.0 100.0
Food Expenditure 44.5 62.1 62.9 60.6 52.3 35.4
Food Consumed at Home 38.4 57.1 59.7 55.5 45.7 29.2
Bread and Cereals 13.9 27.0 28.2 24.7 17.5 8.7
Meat 5.9 3.5 4.1 4.8 6.5 5.8
Fish and Sea Foods 6.5 10.8 10.6 10.8 7.9 4.5
Milk, Cheese and Eggs 3.1 2.2 2.6 3.0 3.3 3.1
Oils and Fats 0.7 1.1 1.1 1.0 0.8 0.6
Fruits 1.3 1.8 1.9 1.5 1.4 1.2
Vegetables 2.3 4.9 4.9 3.9 2.6 1.6
Sugar, Jam, Honey, Chocolate and Confectionary 0.9 1.6 1.6 1.3 1.0 0.7
Food not Elsewhere Classified 0.9 1.4 1.7 1.2 1.0 0.6
Coffee, Cocoa and Tea 1.3 2.0 1.9 1.8 1.6 1.0
Mineral Water, Softdrinks, Fruits and Vegetables Juices1.7 0.8 1.0 1.4 2.0 1.5
Food Regularly Consumed Outside the Home 6.1 4.9 3.2 5.2 6.6 6.2
Alcoholic Beverages 0.7 1.2 1.3 1.0 0.9 0.5
Tobacco 0.7 1.5 1.1 1.1 0.9 0.4
Other Vegetable-Based Products 0.0 0.1 0.2 0.0 0.0 0.0
Clothing and Footwear 2.4 1.7 1.9 1.8 2.2 2.7
Furnishings, Household Equipment and Routine Household2.8 2.3 2.2 2.1 2.1 3.4
Health 3.7 2.0 1.5 1.8 2.7 4.9
Housing, Water, Electricity, gas and Other Fuels 20.0 20.0 17.7 16.8 18.7 21.5
Transportation 8.2 3.6 4.4 5.8 7.5 9.3
Communication 2.6 0.6 0.8 1.3 2.1 3.3
Recreation and Culture 1.5 0.3 0.7 0.6 1.1 1.9
Education 4.1 0.2 1.0 1.8 3.0 5.4
Accommodation Services 0.2 0.0 0.0 0.0 0.1 0.4
Miscellaneous Goods and Services 6.3 3.7 3.9 4.4 5.5 7.3
Other Expenditure 2.4 0.8 0.4 0.6 1.0 3.6
Expenditure GroupIncome Class
Total
2012
2-17

Table 2.8 - Continued
Under
40,000
40,000 -
59,999
60,000 -
99,999
100,000 -
249,999
250,000
and over
CENTRAL VISAYAS 340,688 3,268 6,389 25,126 110,606 195,298
Total Family Expenditure( In Million Pesos) 323,434 3,219 6,263 24,778 107,274 181,901
Average Expenditure (In thousand) 193 43 65 90 147 368
Percent to Total Expenditure 100.0 100.0 100.0 100.0 100.0 100.0
Food Expenditure 44.3 60.5 60.2 58.8 52.1 36.8
Food Consumed at Home 35.9 56.9 55.4 51.7 43.2 28.4
Bread and Cereals 13.5 23.1 27.8 24.0 17.1 9.3
Meat 4.7 3.6 3.6 3.9 4.9 4.8
Fish and Sea Foods 5.8 12.9 8.6 8.9 7.4 4.3
Milk, Cheese and Eggs 3.1 2.4 2.8 3.1 3.3 3.0
Oils and Fats 0.6 1.1 0.9 0.8 0.7 0.5
Fruits 1.3 1.7 1.5 1.4 1.3 1.2
Vegetables 2.2 5.4 4.1 3.5 2.8 1.6
Sugar, Jam, Honey, Chocolate and Confectionary 0.8 1.4 1.3 1.3 1.0 0.6
Food not Elsewhere Classified 0.8 1.5 1.4 1.2 1.0 0.6
Coffee, Cocoa and Tea 1.5 2.4 2.0 2.0 1.9 1.2
Mineral Water, Softdrinks, Fruits and Vegetables Juices1.5 1.5 1.4 1.5 1.7 1.4
Food Regularly Consumed Outside the Home 8.3 3.6 4.8 7.0 8.9 8.4
Alcoholic Beverages 0.6 1.2 0.8 0.9 0.8 0.4
Tobacco 0.9 2.4 1.4 1.6 1.3 0.6
Other Vegetable-Based Products 0.0 0.1 0.1 0.0 0.0 0.0
Clothing and Footwear 2.3 1.6 1.9 2.0 2.1 2.5
Furnishings, Household Equipment and Routine Household2.5 2.4 2.3 2.1 2.0 2.9
Health 3.9 1.4 2.7 1.9 2.8 4.8
Housing, Water, Electricity, gas and Other Fuels 20.5 19.9 18.4 16.8 18.3 22.4
Transportation 5.7 3.9 3.3 4.7 5.5 6.1
Communication 2.0 0.5 0.8 0.9 1.3 2.7
Recreation and Culture 0.8 0.3 0.7 0.6 0.7 1.0
Education 3.7 0.3 1.0 2.0 2.7 4.7
Accommodation Services 0.1 - 0.2 0.0 0.1 0.1
Miscellaneous Goods and Services 5.5 3.6 3.9 4.1 5.0 6.1
Durable Furniture and Equipment 2.6 0.2 0.4 0.8 2.1 3.3
Special Family Occasion 3.0 1.2 1.5 2.2 2.2 3.7
Other Expenditure 1.5 0.6 0.5 0.7 1.0 2.0
2015
Income ClassExpenditure Group Total
2-18

Table 2.9A
PER CAPITA POVERTY THRESHOLDS AND POVERTY INCIDENCE AMONG FAMILIES AND
POPULATION BY PROVINCE
2006, 2009, 2012 and 2015
(Threshold in Pesos; Incidence in Percent)
2006 2009 2012 2015 2006 2009 2012 2015 2006 2009 2012 2015
CENTRAL VISAYAS 13,963 16,662 18,767 21,914 30.7 26.0 25.7 23.6 35.9 31.0 30.2 27.6
Bohol 14,098 16,633 18,847 20,437 40.3 36.6 30.6 21.7 48.2 43.7 36.8 26.0
Cebu 15,064 17,770 18,855 21,740 25.6 22.3 18.9 17.9 30.4 26.8 22.7 21.4
Negros Oriental 11,518 13,625 18,589 22,823 38.2 28.0 43.9 38.7 42.9 33.2 50.1 45.0
Siquijor b/c/
13,971 16,469 18,420 21,675 25.6 27.2 24.0 48.9 22.7 31.0 32.6 52.9
Note:a/
- Provincial estimates were not generated due to limitations of the sampling design of the 1991 Family Income and Expenditure Survey.b/ -
Coefficient of variation of 2012 poverty incidence among families is greater than 20%.c/ - Province with sample size less than 100.
1/ - The per capita income required or the amount to be spent to satisfy the nutritional requirements
(2,000 calories) and other basic needs.2/ - The proportion of poor families/population to the total number of families/population.
Source: Official Poverty Statistics - Philippine Statistics Authority
Table 2.9B
PER CAPITA FOOD THRESHOLDS AND SUBSISTENCE INCIDENCE AMONG FAMILIES AND
POPULATION BY PROVINCE
2006, 2009, 2012 and 2015
(Threshold in Pesos; Incidence in Percent)
2006 2009 2012 2015 2006 2009 2012 2015 2006 2009 2012 2015
CENTRAL VISAYAS 9,765 11,635 13,048 15,357 14.9 11.1 11.1 9.8 18.8 14.6 13.6 16.3
Bohol 9,831 11,596 13,155 14,249 21.9 16.6 12.2 7.2 28.6 21.6 16.0 25.3
Cebu 10,519 12,360 13,049 15,139 11.6 9.7 7.0 6.8 14.9 12.7 8.4 15.1
Negros Oriental 8,092 9,505 12,999 15,916 18.6 11.1 24.1 19.5 22.4 14.6 19.4 27.8
Siquijor b/c/
9,756 11,500 12,863 15,136 18.7 5.9 8.7 18.8 17.8 6.2 13.2 -
Note:a/
- Provincial estimates were not generated due to limitations of the sampling design of the 1991 Family Income and Expenditure Survey.b/ - Coefficient of variation of 2012 poverty incidence among families is greater than 20%.
c/ - Province with sample size less than 100.
1/ - The per capita income required or the amount to be spent to satisfy the nutritional requirements
(2,000 calories).2/ - The proportion of poor families/population whose annual per capita income falls below the annual per
capita food threshold to the total number of families/population.
Source: Official Poverty Statistics - Philippine Statistics Authority
Poverty Incidence Among
Population 2/
Subsistence Incidence Among
Population 2/
Province
ProvinceAnnual Per Capita Food Threshold 1/
Subsistence Incidence Among
Families 2/
Annual Per Capita Poverty
Threshold 1/ Poverty Incidence Among Families
2/
2-19

Table 2.10
POVERTY STATISTICS FOR THE BASIC SECTOR
CENTRAL VISAYAS
2006, 2009, 2012 and 2015
(Poverty Incidence in Percent)
2006 a/
2009 a/ 2012 2015 2003 2006 2009
Women /1
34.5 29.9 30.7 27.8 1,042,827 1,133,773 1,152,659
Youth 2/ 3/
27.7 24.0 25.8 22.2 467,220 495,129 536,502
Children 4/ 5/
45.6 40.2 40.4 37.5 1,158,170 1,251,095 1,202,629
Senior Citizens 6/ 7/
28.3 23.2 24.8 22.3 128,599 169,019 167,823
Individuals Residing in Urban Areas 8/
20.1 16.5 17.2 20.2 552,765 677,080 669,162
Migrant and Formal Sector Workers 9/ 10/
20.4 17.7 17.7 16.3 186,074 245,137 279,068
Farmers 11/ 12/
54.6 48.4 47.4 41.6 247,530 219,133 208,462
Fishermen 13/ 14/
46.0 43.4 40.2 31.2 49,350 51,216 41,020
Self-employed and Unpaid Family Workers 15/ 16/
39.6 36.6 37.2 31.1 478,836 475,868 493,355
Employed Population 17/ 18/
29.9 26.5 26.5 23 699,646 776,739 833,306
Unemployed Population 19/ 20/ 21/
30.3 21.6 19.4 22.8 - 47,260 56,746
Notes:
Basic Sectors1/
- Poverty incidence among women refers to the proportion of women with per capita income less than the per capita poverty
threshold to the total number of women.2/
- Youth refers to individuals aged 15 to 30 years old, based on RA 8044, The Youth in Nation-Building Act.3/
- Poverty incidence among youth refers to the proportion of youth with per capita income less than the per capita poverty threshold
to the total number of youth.4/
- Child refers to individual below 18 years old based on, RA 7610, Special Protection of Children Against Abuse, Exploitation and Discrimination Act.5/
- Poverty incidence among children refers to the proportion of children with per capita income less than the per capita poverty
threshold to the total number of children.6/
- Senior citizen refers to an individual aged 60 years old and above, based on RA 9257, the Expanded Senior Citizens Act.7/
- Poverty incidence among senior citizens refers to the proportion of senior citizens with per capita income less than the per capita
poverty threshold to the total number of senior citizens.8/
- Poverty incidence among individuals residing in urban areas refers to the proportion of individuals residing in urban areas with per
capita income less than the per capita poverty threshold to the total number of individuals residing in urban areas.9/
- Migrant and formal sector workers refer to individuals who are Overseas Contract Workers (OCW) or Workers other than OCWs
or employed persons working for private establishments and government organizations and corporations.10/ -
Poverty incidence among migrant and formal sector workers refers to the proportion of migrant and formal sector workers with
per capita income less than the per capita poverty threshold to the total number of migrant and formal sector workers.11/
- Farmers refer to employed individuals 15 years old and over whose primary occupation is farming, plant growing or animal production.12/
- Poverty incidence among farmers refers to the proportion of senior citizens with per capita income less than the per capita
poverty threshold to the total number of farmers.13/
- Fishermen refer to employed individuals 15 years old and over whose primary occupation is fishing.14/
- Poverty incidence among fishermen refers to the proportion of fishermen with per capita income less than the per capita poverty
threshold to the total number of fishermen.15/ -
Self-employed and unpaid family workers refer to employed individuals 15 years old and over who are either self-employed or
worked without pay on family owned farm or business.16/
- Poverty incidence among self-employed and unpaid family workers refers to the proportion of self-employed and unpaid family
workers with per capita income less than the per capita poverty threshold to the total number of self-employed and unpaid family workers.17/
- Employed refers to individuals who are 15 years and over, who during the reference period are reported either at work or with a job but not at work.18/
- Poverty incidence among employed refers to the proportion of employed with per capita income less than the per capita poverty
threshold to the total number of employed.19/
- Unemployed refers to individuals who are 15 years and over, who during the reference period are reported without work and
currently available for work and seeking work.20/
- Poverty incidence among unemployed population refers to the proportion of unemployed with per capita income less than the per
capita poverty threshold to the total number of employed.21/
- Poverty incidence among unemployed population was generated only for 2006 and 2009 since the 2003 Labor Force Survey still
used the old definition of unemployed.
a/ - Poverty estimates for the basic sectors for 2006 and 2009, which were released on 7 June 2012 were revised based on the following: a) adopt the
new urban and rural classification in the Family Income and Expenditure Survey (FIES) as defined in the NSCB Resolution No. 9 Series of 2003; and
b) use 2006-Based Consumer Price Index (CPI) prices in the computation of the food or subsistence thresholds.
Source: Official Poverty Statistics - Philippine Statistics Authority
Basic SectorsPoverty Incidence Magnitude of Poor Population
2-20

Table 2.11
CONSUMER PRICE INDEX, INFLATION RATE AND PURCHASING POWER OF PESO FOR ALL INCOME HOUSEHOLDS
BY MONTH AND PROVINCE
2014-2017
(Inflation Rate in Percent)
(2012 = 100)
CPIInflation
Rate
Purchasing
Power of
Peso
CPIInflation
Rate
Purchasing
Power of
Peso
CPIInflation
Rate
Purchasing
Power of
Peso
2014 Annual Average 109.1 4.7 0.92 108.3 4.1 0.92 110.4 5.0 0.91
January 107.2 4.8 0.93 107.6 0.6 0.93 108.2 5.3 0.92
February 107.3 4.2 0.93 107.2 -0.4 0.93 108.3 4.2 0.92
March 107.7 4.5 0.93 107.9 0.7 0.93 108.6 4.3 0.92
April 108.2 4.8 0.92 108.1 0.2 0.93 109.4 5.0 0.91
May 108.7 5.2 0.92 108.1 0.0 0.93 110.1 5.6 0.91
June 109.1 5.0 0.92 108.1 0.0 0.93 110.5 5.2 0.90
July 109.6 5.1 0.91 109.3 1.1 0.91 110.8 5.3 0.90
August 109.8 4.7 0.91 109.0 -0.3 0.92 111.0 5.1 0.90
September 109.8 4.5 0.91 109.0 0.0 0.92 111.1 5.0 0.90
October 110.4 4.9 0.91 109.0 0.0 0.92 111.9 5.7 0.89
November 110.8 4.6 0.90 108.6 -0.4 0.92 112.5 5.3 0.89
December 110.4 3.6 0.91 108.2 -0.4 0.92 112.1 4.3 0.89
2015 Annual Average 110.4 1.2 0.91 108.9 0.6 0.92 111.9 1.4 0.89
January 110.3 2.9 0.91 109.0 1.3 0.92 111.8 3.3 0.89
February 110.1 2.6 0.91 108.6 1.3 0.92 111.6 3.0 0.90
March 110.3 2.4 0.91 109.0 1.0 0.92 111.7 2.9 0.90
April 110.3 1.9 0.91 109.2 1.0 0.92 111.8 2.2 0.89
May 110.4 1.6 0.91 108.9 0.7 0.92 111.9 1.6 0.89
June 110.3 1.1 0.91 108.7 0.6 0.92 111.9 1.3 0.89
July 110.3 0.6 0.91 108.8 -0.5 0.92 111.8 0.9 0.89
August 109.9 0.1 0.91 108.7 -0.3 0.92 111.1 0.1 0.90
September 110.1 0.3 0.91 108.4 -0.6 0.92 111.4 0.3 0.90
October 110.4 0.0 0.91 108.8 -0.2 0.92 111.8 -0.1 0.89
November 110.7 -0.1 0.90 109.1 0.5 0.92 112.3 -0.2 0.89
December 111.4 0.9 0.90 109.2 0.9 0.92 113.2 1.0 0.88
2016 Annual Average 112.4 1.8 0.89 110.7 1.7 0.9 114.1 2.0 0.88
January 111.5 1.1 0.90 109.5 0.5 0.91 113.4 1.4 0.88
February 111.3 1.1 0.90 109.3 0.6 0.91 113.1 1.3 0.88
March 111.6 1.2 0.90 109.5 0.5 0.91 113.5 1.6 0.88
April 112.0 1.5 0.89 109.7 0.5 0.91 114.0 2.0 0.88
May 112.4 1.8 0.89 110.0 1.0 0.91 114.3 2.1 0.87
June 112.6 2.1 0.89 110.1 1.3 0.91 114.5 2.3 0.87
July 112.6 2.1 0.89 110.5 1.6 0.90 114.4 2.3 0.87
August 112.6 2.5 0.89 111.5 2.6 0.90 114.3 2.9 0.87
September 112.2 1.9 0.89 110.7 2.1 0.90 113.9 2.2 0.88
October 112.7 2.1 0.89 111.8 2.8 0.89 114.3 2.2 0.87
November 113.1 2.2 0.88 112.6 3.2 0.89 114.6 2.0 0.87
December 113.6 2.0 0.88 113.3 3.8 0.88 115.1 1.7 0.87
2017 Annual Average 115.2 2.5 0.87 115.0 3.9 0.87 116.5 2.1 0.86
January 114.3 2.5 0.87 114.2 4.3 0.88 115.8 2.1 0.86
February 114.4 2.8 0.87 113.3 3.7 0.88 116.0 2.6 0.86
March 114.1 2.2 0.88 114.1 4.2 0.88 115.5 1.8 0.87
April 114.6 2.3 0.87 115.1 4.9 0.87 115.8 1.6 0.86
May 114.7 2.0 0.87 114.7 4.3 0.87 116.1 1.6 0.86
June 114.8 2.0 0.87 114.1 3.6 0.88 116.4 1.7 0.86
July 115.1 2.2 0.87 114.6 3.7 0.87 116.5 1.8 0.86
August 115.5 2.6 0.87 115.1 3.2 0.87 116.9 2.3 0.86
September 115.7 3.1 0.86 115.1 4.0 0.87 117.2 2.9 0.85
October 116.2 3.1 0.86 116.0 3.8 0.86 117.4 2.7 0.85
November 116.1 2.7 0.86 116.5 3.5 0.86 117.1 2.2 0.85
December 116.3 2.4 0.86 117.2 3.4 0.85 117.2 1.8 0.85
Source: Philippine Statistics Authority
Year Month
CENTRAL VISAYAS Bohol Cebu
2-21

Table 2.11 - Continued
CPI Inflation Rate
Purchasing
Power of
Peso
CPI Inflation Rate
Purchasing
Power of
Peso
2014 Annual Average 105.6 3.8 0.95 102.2 2.5 0.98
January 103.8 2.5 0.96 101.4 2.4 0.99
February 104.2 2.9 0.96 101.6 3.1 0.98
March 104.6 3.7 0.96 101.4 2.4 0.99
April 104.4 3.4 0.96 101.3 2.3 0.99
May 104.8 3.9 0.95 101.7 2.5 0.98
June 105.7 4.4 0.95 102.0 2.6 0.98
July 106.1 4.6 0.94 102.4 2.8 0.98
August 106.5 4.4 0.94 103.1 3.0 0.97
September 106.4 4.2 0.94 103.0 2.6 0.97
October 106.6 3.9 0.94 103.1 2.8 0.97
November 106.9 4.3 0.94 102.7 2.2 0.97
December 106.9 3.2 0.94 102.5 1.4 0.98
2015 Annual Average 107.0 1.3 0.93 102.5 0.3 0.98
January 106.7 2.8 0.94 101.9 0.5 0.98
February 106.8 2.5 0.94 102.1 0.5 0.98
March 106.9 2.2 0.94 101.6 0.2 0.98
April 107.0 2.5 0.93 100.8 -0.5 0.99
May 107.0 2.1 0.93 100.8 -0.9 0.99
June 106.9 1.1 0.94 100.9 -1.1 0.99
July 106.9 0.8 0.94 102.5 0.1 0.98
August 107.4 0.8 0.93 102.3 -0.8 0.98
September 107.3 0.8 0.93 104.0 1.0 0.96
October 107.3 0.7 0.93 104.2 1.1 0.96
November 106.9 0.0 0.94 104.6 1.9 0.96
December 107.4 0.5 0.93 104.7 2.1 0.96
2016 Annual Average 107.8 0.7 0.93 106.2 3.6 0.94
January 106.8 0.1 0.94 104.2 2.3 0.96
February 106.7 -0.1 0.94 104.0 1.9 0.96
March 107.0 0.1 0.93 105.6 3.9 0.95
April 107.2 0.2 0.93 106.1 5.3 0.94
May 107.9 0.8 0.93 106.3 5.5 0.94
June 108.2 1.2 0.92 106.7 5.7 0.94
July 108.2 1.2 0.92 106.7 4.1 0.94
August 107.9 0.5 0.93 106.7 4.3 0.94
September 107.8 0.5 0.93 106.5 2.4 0.94
October 108.1 0.7 0.93 106.9 2.6 0.94
November 108.7 1.7 0.92 107.1 2.4 0.93
December 108.9 1.4 0.92 107.6 2.8 0.93
2017 Annual Average 110.8 2.8 0.9 109.7 3.3 0.91
January 109.3 2.3 0.91 108.6 4.2 0.92
February 109.8 2.9 0.91 107.9 3.8 0.93
March 109.5 2.3 0.91 107.7 2.0 0.93
April 110.1 2.7 0.91 107.9 1.7 0.93
May 110.0 1.9 0.91 108.5 2.1 0.92
June 110.2 1.8 0.91 108.5 1.7 0.92
July 111.0 2.6 0.90 108.2 1.4 0.92
August 111.2 3.1 0.90 108.3 1.5 0.92
September 111.5 3.4 0.90 108.4 1.8 0.92
October 112.0 3.6 0.89 113.8 6.5 0.88
November 112.0 3.0 0.89 114.1 6.5 0.88
December 112.4 3.2 0.89 114.5 6.4 0.87
Year Month
Negros Oriental Siquijor
2-22

Table 2.12
CONSUMER PRICE INDEX FOR ALL INCOME HOUSEHOLDS BY MONTH AND PROVINCE
2017
(2012 = 100)
Jan Feb Mar Apr May Jun Jul Aug Sep Oct Nov Dec Ave
Central Visayas
All Items 114.3 114.4 114.1 114.6 114.7 114.8 115.1 115.5 115.7 116.2 116.1 116.3 115.2
Food and Non-Alcoholic Beverage 117.1 117.9 117.9 117.5 117.8 117.9 118.6 119.0 119.4 120.1 119.6 119.9 118.6
Alcoholic Beverages and Tobacco 151.6 151.7 151.8 152.0 152.0 151.8 153.4 153.4 153.5 153.6 154.2 155.3 152.9
Clothing and Footwear 118.8 118.9 119.0 119.0 119.0 119.0 119.6 119.6 119.6 119.7 119.7 119.7 119.3
Housing, Water, Electricity, Gas and Other
Fuels 115.6 116.3 114.9 116.2 116.8 117.3 116.6 117.1 117.2 118.2 118.5 118.5 116.9
Furnishings, Household Equipment, and
Routine Maintenance of the House 112.9 112.9 112.9 114.1 114.1 114.2 114.7 114.8 114.9 114.9 115.1 115.1 114.2
Health 105.2 105.2 105.2 105.2 105.3 105.3 106.4 106.5 106.5 106.5 106.5 106.5 105.9
Transportation 106.1 101.9 101.7 105.3 104.1 103.3 102.4 103.5 104.0 103.5 104.1 105.2 103.8
Communication 101.4 101.4 101.4 101.4 101.5 101.5 101.5 101.5 101.6 101.7 101.7 101.7 101.5
Recreation and Culture 103.3 103.3 103.3 103.3 103.4 103.4 103.7 103.7 103.7 103.7 103.7 103.7 103.5
Education 127.6 127.6 127.6 127.6 127.6 129.7 129.7 129.7 129.7 129.7 129.7 129.7 128.8
Restaurant and Miscellaneous Goods and
Services 105.1 105.1 105.1 105.1 105.1 105.2 105.9 105.9 105.9 105.9 105.9 105.9 105.5
Bohol
All Items 114.2 113.3 114.1 115.1 114.7 114.1 114.6 115.1 115.1 116.0 116.5 117.2 115.0
Food and Non-Alcoholic Beverage 114.2 113.9 115.2 114.4 114.4 114.1 114.9 115.7 115.3 116.5 117.7 119.0 115.4
Alcoholic Beverages and Tobacco 125.0 125.0 125.0 125.0 125.0 125.0 127.5 127.5 128.0 128.1 128.1 128.5 126.5
Clothing and Footwear 109.4 109.4 109.6 109.6 109.6 109.6 109.8 110.0 110.0 110.3 110.3 110.3 109.8
Housing, Water, Electricity, Gas and Other
Fuels 121.6 122.0 123.4 124.2 124.5 123.4 123.2 123.6 124.2 126.5 126.5 126.5 124.1
Furnishings, Household Equipment, and
Routine Maintenance of the House 128.1 128.1 128.1 129.7 130.2 130.7 132.0 132.8 133.2 133.2 134.5 134.7 131.3
Health 105.8 105.8 105.8 105.8 105.8 105.8 105.9 106.0 106.0 106.0 106.0 106.0 105.9
Transportation 117.5 108.2 108.3 120.4 115.0 111.4 111.6 112.2 113.1 112.7 112.1 114.5 113.1
Communication 102.4 102.4 102.6 102.6 102.8 102.8 102.9 103.0 103.2 103.3 103.3 103.3 102.9
Recreation and Culture 109.5 109.5 109.8 109.8 109.8 109.8 110.1 110.1 109.8 109.8 109.9 109.9 109.8
Education 122.5 122.5 122.5 122.5 122.5 125.5 125.5 125.5 125.5 125.5 125.5 125.5 124.3
Restaurant and Miscellaneous Goods and
Services 104.7 104.7 104.8 104.8 104.8 104.8 105.3 105.3 105.4 105.4 105.4 105.4 105.1
Cebu
All Items 115.8 116.0 115.5 115.8 116.1 116.4 116.5 116.9 117.2 117.4 117.1 117.2 116.5
Food and Non-Alcoholic Beverage 118.9 119.8 119.9 119.4 119.8 120.0 120.5 121.0 121.5 122.1 121.0 121.0 120.4
Alcoholic Beverages and Tobacco 164.2 164.4 164.4 164.4 164.4 164.2 165.8 165.8 165.8 165.9 166.9 168.5 165.4
Clothing and Footwear 125.2 125.2 125.3 125.3 125.3 125.3 126.0 126.0 126.0 126.0 126.0 126.0 125.6
Housing, Water, Electricity, Gas and Other
Fuels 117.2 118.1 115.6 117.1 118.0 118.9 117.9 118.5 118.5 118.6 119.0 119.0 118.0
Furnishings, Household Equipment, and
Routine Maintenance of the House 110.8 110.8 110.8 112.2 112.2 112.2 112.6 112.6 112.6 112.6 112.6 112.6 112.1
Health 104.2 104.2 104.2 104.2 104.3 104.3 105.9 105.9 105.9 105.9 105.9 105.9 105.1
Transportation 105.3 101.7 101.4 103.2 102.5 102.8 101.8 103.1 103.3 102.7 103.5 104.3 103.0
Communication 101.4 101.4 101.4 101.4 101.4 101.4 101.4 101.4 101.4 101.5 101.5 101.5 101.4
Recreation and Culture 101.6 101.6 101.6 101.6 101.6 101.6 101.7 101.7 101.7 101.7 101.7 101.7 101.7
Education 130.1 130.1 130.1 130.1 130.1 131.1 131.1 131.1 131.1 131.1 131.1 131.1 130.7
Restaurant and Miscellaneous Goods and
Services 105.5 105.5 105.5 105.5 105.5 105.5 106.0 106.0 106.0 106.0 106.0 106.0 105.8
Source: Philippine Statistics Authority
Province / Commodity Group 2017
2-23

Table 2.13 - Continued
CONSUMER PRICE INDEX FOR ALL INCOME HOUSEHOLDS BY MONTH AND PROVINCE
2017
(2012 = 100)
Jan Feb Mar Apr May Jun Jul Aug Sep Oct Nov Dec Ave
Negros Oriental
All Items 109.3 109.8 109.5 110.1 110.0 110.2 111.0 111.2 111.5 112.0 112.0 112.4 110.8
Food and Non-Alcoholic Beverage 113.9 114.8 113.7 114.1 114.2 114.2 115.4 115.5 116.0 116.8 116.8 117.4 115.2
Alcoholic Beverages and Tobacco 130.9 130.9 131.1 131.8 131.8 131.8 132.3 132.3 132.4 132.5 132.5 132.6 131.9
Clothing and Footwear 104.7 105.0 105.0 105.0 105.0 105.0 105.7 105.7 105.7 105.7 105.7 105.7 105.3
Housing, Water, Electricity, Gas and Other
Fuels 104.9 105.7 107.3 108.3 107.7 107.7 108.0 108.2 108.5 108.7 108.7 108.7 107.7
Furnishings, Household Equipment, and
Routine Maintenance of the House 107.7 107.7 107.7 107.8 107.8 107.8 108.2 108.2 108.2 108.2 108.2 108.2 108.0
Health 109.1 109.1 109.1 109.1 109.1 109.1 109.9 109.9 109.9 110.1 110.1 110.1 109.6
Transportation 95.9 95.6 95.6 98.1 98.4 95.8 94.9 95.8 97.1 96.9 98.1 98.9 96.8
Communication 100.0 100.0 100.0 100.0 100.0 100.0 100.3 100.3 100.3 100.3 100.3 100.3 100.2
Recreation and Culture 103.0 103.0 103.0 103.0 103.1 103.1 104.3 104.3 104.5 104.5 104.5 104.5 103.7
Education 115.9 115.9 115.9 115.9 115.9 124.4 124.4 124.4 124.4 124.4 124.4 124.4 120.9
Restaurant and Miscellaneous Goods and
Services 103.0 103.0 103.0 103.0 103.0 103.7 105.3 105.3 105.3 105.3 105.3 105.3 104.2
Siquijor
All Items 108.6 107.9 107.7 107.9 108.5 108.5 108.2 108.3 108.4 113.8 114.1 114.5 109.7
Food and Non-Alcoholic Beverage 113.8 114.2 112.3 112.0 112.8 113.4 113.7 114.0 114.1 114.9 115.6 117.1 114.0
Alcoholic Beverages and Tobacco 129.9 130.5 131.2 131.9 132.0 132.0 134.3 134.4 134.4 134.4 134.4 134.4 132.8
Clothing and Footwear 108.6 108.6 108.6 108.7 108.7 108.8 110.6 110.6 110.6 110.6 110.6 110.6 109.6
Housing, Water, Electricity, Gas and Other
Fuels 104.9 104.6 104.7 104.7 105.0 105.0 104.9 104.9 105.0 115.2 115.2 115.2 107.4
Furnishings, Household Equipment, and
Routine Maintenance of the House 119.4 119.4 119.5 119.5 119.5 119.5 119.8 119.8 121.4 121.4 121.4 121.4 120.2
Health 105.2 105.2 105.2 105.2 105.2 105.3 105.3 105.3 105.3 105.3 105.3 105.3 105.3
Transportation 106.4 100.2 101.5 104.3 107.0 104.7 100.2 101.1 101.1 100.8 101.7 103.2 102.7
Communication 103.1 103.1 103.1 103.1 103.1 103.1 103.2 103.2 103.2 103.2 103.2 103.2 103.2
Recreation and Culture 108.3 108.3 108.3 108.3 108.3 108.3 109.1 109.2 109.2 109.2 109.2 109.2 108.7
Education 120.0 120.0 120.0 120.0 120.0 120.4 122.0 122.0 122.0 122.0 122.0 122.0 121.0
Restaurant and Miscellaneous Goods and
Services 115.4 115.5 115.6 115.6 115.6 116.0 116.3 116.3 116.3 116.3 116.3 116.4 116.0
Source: Philippine Statistics Authority
Province / Commodity Group 2017
-
10
20
30
40
50
60
Bohol Cebu Negros Oriental Siquijor
Figure 2.4 Annual Poverty Incidence Among Families by Province2009, 2012 and 2015
2009 2012 2015
2-24

Source: Philippine Statistics Authority
0.0
0.5
1.0
1.5
2.0
2.5
3.0
3.5
4.0
4.5
106.0
108.0
110.0
112.0
114.0
116.0
118.0
Central Visayas Bohol Cebu Negros Oriental Siquijor
Infl
ati
on
Rate
(in
perc
en
t)
Co
nsu
mer
Pri
ce I
nd
ex (
2012
=100)
Figure 2.5 Consumer Price Index and Inflation Rate by Province: 2017
CPI Inflation Rate
0.0
0.5
1.0
1.5
2.0
2.5
3.0
3.5
4.0
4.5
5.0
106
107
108
109
110
111
112
113
114
115
116
2014 2015 2016 2017
Infl
ati
on
Ra
te (
in p
erc
en
t)
Co
nsu
mer
Pri
ce I
nd
ex (
2012
=100)
Figure 2.6 Consumer Price Index and Inflation RateCentral Visayas: 2014-2017
CPI Inflation Rate
2-25

Chapter 3
ECONOMIC ACCOUNTS
The economic accounts of the region, which are presented in terms of the Gross Regional
Domestic Product (GRDP), provide a comprehensive and meaningful quantitative picture of the regional economy. Specifically, the GRDP shows the levels and growth of the region's economic performance; the structure of the regional economy by industrial origin; and the sectors that
contributed to the region's growth. The accounts likewise serve as a yardstick for assessing the economic performance of the region during a given period and over a span of time. With its
usefulness in charting the socioeconomic growth path of the region, the GRDP, a macroeconomic indicator of economic performance, is necessary in planning, policy formulation and analytical exercises.
This chapter presents the GRDP on an annual basis in terms of levels, growth and indices at constant and current prices. The chapter likewise presents the Gross Regional Domestic
Expenditure and Gross Domestic Product by Industrial Origin at current and at 2000 constant prices. The series reflected in the following tables include final estimates for 2015, revised estimates for 2016 and preliminary estimates for 2017 with 2000 as the base year. The series is generated by
the Macroeconomic Accounts Services of the Philippine Statistics Authority using primary and secondary data gathered from various data producers in the country.
Highlights
• Central Visayas’ economy slowed down to 5.1 percent in 2017 from 8.6 percent in 2016. This was attributed to the slowdown of the Industry sector to 3.0 percent in 2017 from 14.1 percent in 2016.
• Services sustained the largest share in the region’s economy accounting to 56.3 percent in 2017, slightly higher than its share in 2016 at 55.6 percent. Likewise, Agriculture, Hunting,
Forestry and Fishing had a higher share with 5.5 percent in 2017 from 5.4 percent in 2016. On the other hand, Industry decreased its share to 38.2 percent in 2017 from 38.9 percent in 2016.
• Services accelerated to 6.3 percent in 2017 from 6.0 percent in 2016. Public Administration and Defense accelerated to 8.4 percent in 2017. Real Estate, Renting and Business Activities grew to 7.9 percent. Financial Intermediation expanded to 7.7 percent in 2017. Trade and Repair of Motor Vehicles, Motorcycles, Personal and Household Goods expanded by
5.2 percent in 2017. On the other hand, the growth of Other Services and Transportation, Storage and Communication slowed down to 5.8 percent and 5.2 percent, respectively.
• Industry decelerated to 3.0 percent in 2017 from 14.1 percent in 2016. The deceleration was brought about by Construction that contracted by 0.9 percent in 2017. Mining and
quarrying also suffered a decline by 5.5 percent, while Electricity, Gas and Water Supply dipped by 0.9 percent. Manufacturing, on the other hand, grew at a slower pace with 5.5
percent.
• Agriculture, Hunting, Forestry and Fishing rebounded to a growth of 7.0 percent in 2017 from a negative 0.2 percent in 2016. This was due to the turnaround of Agriculture and Forestry to 9.6 percent growth in 2017 from negative 1.0 percent in 2016. While Fishing,
contracted by 8.5 percent in 2017 from 4.7 percent in 2016.
• Service sector contributed most to the region’s overall growth rate with 3.5 percentage points followed by the Industry with 1.2 percentage points and Agriculture,
Hunting, Forestry and Fishing at 0.4 percentage point.

Contents
Highlights 3-1
STATISTICAL TABLES
Table 3.1A Gross Regional Domestic Product by Region
At Current Prices: 2015-2017 …................................................................................ 3-4
Table 3.1B Gross Regional Domestic Product by Region
At Constant 2000 Prices: 2015-2017 ……………………………………...…………………….......…. 3-4
Table 3.2A Gross Regional Domestic Product by Industrial Origin, Philippines
At Current Prices: 2015-2017 ……………………………………………………………………….......…. 3-6
Table 3.2B Gross Regional Domestic Product by Industrial Origin, Philippines
At Constant 2000 Prices: 2015-2017 …………….......……………………………………………….... 3-6
Table 3.3A Gross Regional Domestic Product by Industrial Origin, Central Visayas
At Current Prices: 2015-2017 ……………………………………………………………………….......... 3-7
Table 3.3B Gross Regional Domestic Product by Industrial Origin, Central Visayas
At Constant 2000 Prices: 2015-2017 …………………………….......…………………………………… 3-7
Table 3.4A Growth Rates of Gross Regional Domestic Product by Industrial Origin, Philippines
At Current Prices: 2015-2017 ………………………………………………………………….…….......… 3-8
Table 3.4B Growth Rates of Gross Regional Domestic Product by Industrial Origin, Philippines
At Constant 2000 Prices: 2015-2017 ………………………………………………………………........ 3-8
Table 3.5A Growth Rates of Gross Regional Domestic Product by Industrial Origin, Central Visayas
At Current Prices: 2015-2017 …………………………………………………………………………........ 3-9
Table 3.5B Growth Rates of Gross Regional Domestic Product by Industrial Origin, Central Visayas
At Constant 2000 Prices: 2015-2017 …………………………………………………………............. 3-9
Table 3.6A Per Capita Gross Regional Domestic Product by Region
At Current Prices: 2015-2017 …………………………………………………………………………........3-10
Table 3.6B Per Capita Gross Regional Domestic Product by Region
At Constant 2000 Prices: 2015-2017 ………………………………………………………..…….........3-10
Table 3.7A Expenditure on Gross Regional Domestic Product, Philippines
At Current Prices: 2015-2017 …………………………………………………………………….…….......3-11
Table 3.7B Expenditure on Gross Regional Domestic Product, Philippines
At Constant 2000 Prices: 2015-2017 ………………………………………………………………........ 3-11
Table 3.8A Expenditure on Gross Regional Domestic Product by Region
At Current Prices: 2015-2017 …………………………………………………………………….…….......3-12
Table 3.8B Expenditure on Gross Regional Domestic Product by Region
At Constant 2000 Prices: 2015-2017 ………………………………………………………………........ 3-12
Table 3.9A Expenditure on Gross Regional Domestic Product, Central Visayas
At Current Prices: 2015-2017 ………………………………………………………………….……….......3-13
3-2

Table 3.9B Expenditure on Gross Regional Domestic Product, Central Visayas
At Constant 2000 Prices: 2015-2017 ………………………………………………………………........ 3-13
Table 3.10A Per Capita, Household Final Consumption Expenditure by Region
At Current Prices: 2015-2017 ……………………………………………………………….………….......3-14
Table 3.10B Per Capita, Household Final Consumption Expenditure by Region
At Constant 2000 Prices: 2015-2017 ……………………………………………………….………....... 3-14
FIGURES
Figure 3.1 Gross Regional Domestic Product by Region
At Constant 2000 Prices: 2017 ………………………………………………………………………........ 3-5
Figure 3.2 Per Capita Gross Regional Domestic Product by Region
At Constant 2000 Prices: 2017 ………………………………………………………………………........ 3-5
3-3

Table 3.1A
GROSS REGIONAL DOMESTIC PRODUCT BY REGION
2015-2017
(In Thousand Pesos: At Current Prices)
2015 2016 2017
13,322,041,273 14,479,944,611 15,806,358,823
NCR National Capital Region 5,043,596,897 5,526,337,349 6,016,249,210
CAR Cordillera Administrative Region 234,583,094 242,868,004 272,267,998
I Ilocos Region 409,097,791 450,382,549 487,587,377
II Cagayan Valley 236,832,451 251,400,390 280,561,422
III Central Luzon 1,187,307,089 1,304,052,510 1,459,629,257
IVA CALABARZON 2,059,547,574 2,142,921,719 2,316,355,788
IVB MIMAROPA 204,848,841 210,488,352 236,468,799
V Bicol Region 282,759,855 306,539,332 331,676,579
VI Western Visayas 549,753,304 596,202,647 658,002,816
VII Central Visayas 867,162,727 964,876,064 1,032,638,985
VIII Eastern Visayas 271,914,849 311,740,923 320,964,359
IX Zamboanga Peninsula 277,208,133 295,105,827 312,492,153
X Northern Mindanao 517,648,536 576,819,708 626,475,724
XI Davao Region 565,205,235 641,245,739 728,807,009
XII SOCCSKSARGEN 355,960,468 386,407,684 426,170,149
XIII Caraga 159,038,290 167,308,819 180,934,323
ARMM
Autonomous Region in Muslim
Mindanao 99,576,138 105,246,996 119,076,875
Source: Philippine Statistics Authority
Table 3.1B
GROSS REGIONAL DOMESTIC PRODUCT BY REGION
2015-2017
(In Thousand Pesos: At Constant 2000 Prices)
2015 2016 2017
7,600,175,069 8,122,741,433 8,665,707,506
NCR National Capital Region 2,770,552,677 2,976,234,624 3,158,081,656
CAR Cordillera Administrative Region 133,848,201 136,873,913 153,411,322
I Ilocos Region 237,178,755 257,277,270 272,257,487
II Cagayan Valley 134,444,616 139,548,688 149,578,296
III Central Luzon 706,343,196 773,108,325 844,709,530
IVA CALABARZON 1,302,297,272 1,364,736,594 1,456,088,132
IVB MIMAROPA 122,258,656 125,432,256 133,228,208
V Bicol Region 155,449,066 164,065,917 172,358,884
VI Western Visayas 305,503,332 323,535,392 350,821,902
VII Central Visayas 482,898,676 524,597,384 551,179,952
VIII Eastern Visayas 153,224,685 171,610,264 174,669,515
IX Zamboanga Peninsula 157,640,786 164,866,496 168,702,094
X Northern Mindanao 283,769,262 304,952,799 323,009,662
XI Davao Region 304,412,137 333,405,134 369,797,076
XII SOCCSKSARGEN 203,183,377 213,182,370 230,598,148
XIII Caraga 96,587,795 98,511,669 102,701,036
ARMM
Autonomous Region in Muslim
Mindanao 50,582,581 50,802,338 54,514,604
Source: Philippine Statistics Authority
Region
Philippines
Region
Philippines
3-4

NCR
CAR
I
II
III
IVA
MIMAROPA
V
VI
VII
VIII
IX
X
XI
XII
XIII
ARMM
NCR
CAR
I
II
III
IVA
MIMAROPA
V
VI
VII
VIII
IX
X
XI
XII
XIII
ARMM
(500,000,000)
500,000,000
1,500,000,000
2,500,000,000
3,500,000,000
4,500,000,000
5,500,000,000
6,500,000,000
in t
ho
usa
nd p
eso
sFigure 3.1: Gross Regional Domestic Product by Region
At Constant 2000 Prices : 2017
-
500,000,000
1,000,000,000
1,500,000,000
2,000,000,000
2,500,000,000
3,000,000,000
3,500,000,000
in p
esos
Figure 3.2: Per Capita Gross Regional Domestic Product by Region
At Constant 2000 Prices : 2017
3-5

Table 3.2A
GROSS REGIONAL DOMESTIC PRODUCT BY INDUSTRIAL ORIGIN, PHILIPPINES
2015-2017
(Level in thousand pesos at current prices; Share in percent)
Level Share Level Share Level Share
I. AGRICULTURE, HUNTING, FORESTRY & FISHING 1,366,866,107 10.3 1,398,062,884 9.7 1,526,654,309 9.7
a. Agriculture and Forestry 1,173,088,126 8.8 1,212,872,372 8.4 1,329,426,300 8.4
b. Fishing 193,777,981 1.5 185,190,512 1.3 197,228,010 1.2
II. INDUSTRY SECTOR 4,116,021,570 30.9 4,452,106,965 30.7 4,813,399,511 30.5
a. Mining and Quarrying 108,109,149 0.8 114,330,493 0.8 134,513,522 0.9
b. Manufacturing 2,669,221,660 20.0 2,847,596,777 19.7 3,074,574,624 19.5
c. Construction 904,509,915 6.8 1,034,278,583 7.1 1,116,365,285 7.1
d. Electricity, Gas and Water Supply 434,180,846 3.3 455,901,114 3.1 487,946,079 3.1
III. SERVICE SECTOR 7,839,153,596 58.8 8,629,774,762 59.6 9,466,305,002 59.9
a. Transportation, Storage & Communication 856,051,091 6.4 856,051,091 5.9 962,540,134 6.1
b. Trade and Repair of Motor Vehicle
Motorcycles, Personal and Household Goods 2,412,095,615 18.1 2,652,835,187 18.3 2,919,613,012 18.5
c. Financial Intermediation 1,063,668,462 8.0 1,168,611,280 8.1 1,297,428,490 8.2
d. Real Estate, Renting & Business Activities 1,698,078,607 12.7 1,898,993,422 13.1 2,084,798,398 13.2
e. Public Administration & Defense;
Compulsory Social Security 512,992,037 3.9 575,043,310 4.0 648,403,698 4.1
f. Other Services 1,296,267,785 9.7 1,425,022,776 9.8 1,553,521,271 9.8
GROSS DOMESTIC PRODUCT 13,322,041,273 100.0 14,479,944,611 100.0 15,806,358,823 100.0
Source: Philippine Statistics Authority
Table 3.2B
GROSS REGIONAL DOMESTIC PRODUCT BY INDUSTRIAL ORIGIN, PHILIPPINES
2015-2017
(Level in thousand pesos at constant 2000 prices; Share in percent)
Level Share Level Share Level Share
I. AGRICULTURE, HUNTING, FORESTRY & FISHING 719,742,376 9.5 710,926,418 8.8 739,028,974 8.5
a. Agriculture and Forestry 591,268,953 7.8 587,579,179 7.2 616,780,431 7.1
b. Fishing 128,473,423 1.7 123,347,239 1.5 122,248,543 1.4
II. INDUSTRY SECTOR 2,545,410,569 33.5 2,750,034,213 33.9 2,947,103,474 34.0
a. Mining and Quarrying 80,499,772 1.1 83,105,755 1.0 86,221,859 1.0
b. Manufacturing 1,760,988,746 23.2 1,885,514,068 23.2 2,043,117,551 23.6
c. Construction 456,931,805 6.0 512,113,421 6.3 539,266,867 6.2
d. Electricity, Gas and Water Supply 246,990,246 3.2 269,300,970 3.3 278,497,197 3.2
III. SERVICE SECTOR 4,335,022,125 57.0 4,661,780,801 57.4 4,979,575,059 57.5
a. Transportation, Storage & Communication 581,288,961 7.6 611,902,326 7.5 636,576,523 7.3
b. Trade and Repair of Motor Vehicle
Motorcycles, Personal and Household Goods 1,270,525,752 16.7 1,367,437,718 16.8 1,467,855,231 16.9
c. Financial Intermediation 546,714,144 7.2 590,111,517 7.3 635,063,851 7.3
d. Real Estate, Renting & Business Activities 854,747,293 11.2 930,684,641 11.5 999,493,376 11.5
e. Public Administration & Defense;
Compulsory Social Security 297,448,520 3.9 318,539,990 3.9 343,251,117 4.0
f. Other Services 784,297,455 10.3 843,104,609 10.4 897,334,960 10.4
GROSS DOMESTIC PRODUCT 7,600,175,069 100.0 8,122,741,433 100.0 8,665,707,506 100.0
Source: Philippine Statistics Authority
2015 2016 2017INDUSTRY
INDUSTRY2015 2016 2017
3-6

Table 3.3A
GROSS REGIONAL DOMESTIC PRODUCT BY INDUSTRIAL ORIGIN, CENTRAL VISAYAS
2015-2017
(Level in thousand pesos at current prices; Share in percent)
Level Share Level Share Level Share
I. AGRICULTURE, HUNTING, FORESTRY & FISHING 58,494,348 6.7 59,767,485 6.2 66,858,228 6.5
a. Agriculture and Forestry 52,503,861 6.1 53,173,140 5.5 60,082,074 5.8
b. Fishing 5,990,487 0.7 6,594,345 0.7 6,776,154 0.7
II. INDUSTRY SECTOR 297,707,079 34.3 349,485,955 36.2 358,826,005 34.7
a. Mining and Quarrying 7,411,799 0.9 7,562,538 0.8 7,863,917 0.8
b. Manufacturing 186,224,377 21.5 199,882,268 20.7 207,194,900 20.1
c. Construction 89,354,676 10.3 126,679,054 13.1 128,116,850 12.4
d. Electricity, Gas and Water Supply 14,716,227 1.7 15,362,095 1.6 15,650,339 1.5
III. SERVICE SECTOR 510,961,301 58.9 555,622,624 57.6 606,954,751 58.8
a. Transportation, Storage & Communication 60,658,762 7.0 62,348,474 6.5 68,265,347 6.6
b. Trade and Repair of Motor Vehicle
Motorcycles, Personal and Household Goods 150,536,346 17.4 163,511,235 16.9 176,626,453 17.1
c. Financial Intermediation 76,571,596 8.8 82,108,569 8.5 90,989,184 8.8
d. Real Estate, Renting & Business Activities 103,594,031 11.9 115,080,255 11.9 126,929,927 12.3
e. Public Administration & Defense;
Compulsory Social Security 22,916,459 2.6 25,844,744 2.729,316,292
2.8
f. Other Services 96,684,106 11.1 106,729,347 11.1 114,827,549 11.1
GROSS DOMESTIC PRODUCT 822,442,048 100.0 867,162,727 100.0 966,897,268 100.0
Source: Philippine Statistics Authority
Table 3.3B
GROSS REGIONAL DOMESTIC PRODUCT BY INDUSTRIAL ORIGIN, CENTRAL VISAYAS
2015-2017
(Level in thousand pesos at constant 2000 prices; Share in percent)
Level Share Level Share Level Share
I. AGRICULTURE, HUNTING, FORESTRY & FISHING 28,480,498 5.9 28,424,168 5.4 30,411,538 5.5
a. Agriculture and Forestry 24,517,030 5.1 24,273,175 4.6 26,614,813 4.8
b. Fishing 3,963,468 0.8 4,150,993 0.8 3,796,725 0.7
II. INDUSTRY SECTOR 179,116,860 37.1 204,310,866 38.9 210,417,996 38.2
a. Mining and Quarrying 4,534,361 0.9 4,581,825 0.9 4,328,632 0.8
b. Manufacturing 120,736,454 25.0 127,937,791 24.4 134,934,701 24.5
c. Construction 45,234,268 9.4 62,578,022 11.9 62,023,034 11.3
d. Electricity, Gas and Water Supply 8,611,777 1.8 9,213,228 1.8 9,131,629 1.7
III. SERVICE SECTOR 275,301,318 57.0 291,862,351 55.6 310,350,418 56.3
a. Transportation, Storage & Communication 38,525,083 8.0 40,552,669 7.7 42,668,773 7.7
b. Trade and Repair of Motor Vehicle
Motorcycles, Personal and Household Goods 75,204,405 15.6 78,933,983 15.083,002,403
15.1
c. Financial Intermediation 36,446,806 7.5 37,947,557 7.2 40,885,529 7.4
d. Real Estate, Renting & Business Activities 53,967,211 11.2 57,785,522 11.0 62,326,318 11.3
e. Public Administration & Defense;
Compulsory Social Security 13,287,666 2.8 14,316,460 2.715,519,421
2.8
f. Other Services 57,870,147 12.0 62,326,159 11.9 65,947,974 12.0
GROSS DOMESTIC PRODUCT 482,898,676 100.0 524,597,384 100.0 551,179,952 100.0
Source: Philippine Statistics Authority
INDUSTRY2015 2016 2017
INDUSTRY2015 2016 2017
3-7

Table 3.4A
GROWTH RATE OF GROSS REGIONAL DOMESTIC PRODUCT BY INDUSTRIAL ORIGIN
PHILIPPINES
2015-2017
(In percent: At current prices)
INDUSTRY 2015-2016 2016-2017
I. AGRICULTURE, HUNTING, FORESTRY & FISHING 2.3 9.2
a. Agriculture and Forestry 3.4 9.6
b. Fishing (4.4) 6.5
II. INDUSTRY SECTOR 8.2 8.1
a. Mining and Quarrying 5.8 17.7
b. Manufacturing 6.7 8.0
c. Construction 14.3 7.9
d. Electricity, Gas and Water Supply 5.0 7.0
III. SERVICE SECTOR 10.1 9.7
a. Transportation, Storage & Communication 6.2 5.9
b. Trade and Repair of Motor Vehicle
Motorcycles, Personal and Household Goods10.0 10.1
c. Financial Intermediation 9.9 11.0
d. Real Estate, Renting & Business Activities 11.8 9.8
e. Public Administration & Defense;
Compulsory Social Security12.1 12.8
f. Other Services 9.9 9.0
GROSS DOMESTIC PRODUCT 8.7 9.2
Source: Philippine Statistics Authority
Table 3.4B
GROWTH RATE OF GROSS REGIONAL DOMESTIC PRODUCT BY INDUSTRIAL ORIGIN
PHILIPPINES
2015-2017
(In percent: At constant 2000 prices)
INDUSTRY 2015-2016 2016-2017
I. AGRICULTURE, HUNTING, FORESTRY & FISHING (1.2) 4.0
a. Agriculture and Forestry (0.6) 5.0
b. Fishing (4.0) (0.9)
II. INDUSTRY SECTOR 8.04 7.17
a. Mining and Quarrying 3.2 3.7
b. Manufacturing 7.1 8.4
c. Construction 12.1 5.3
d. Electricity, Gas and Water Supply 9.0 3.4
III. SERVICE SECTOR 7.5 6.8
a. Transportation, Storage & Communication 5.3 4.0
b. Trade and Repair of Motor Vehicle
Motorcycles, Personal and Household Goods7.6 7.3
c. Financial Intermediation 7.9 7.6
d. Real Estate, Renting & Business Activities 8.9 7.4
e. Public Administration & Defense;
Compulsory Social Security7.1 7.8
f. Other Services 7.5 6.4
GROSS DOMESTIC PRODUCT 6.9 6.7
Source: Philippine Statistics Authority
3-8

Table 3.5A
GROWTH RATE OF GROSS REGIONAL DOMESTIC PRODUCT BY INDUSTRIAL ORIGIN
CENTRAL VISAYAS
2015-2017
(Level in thousand pesos at current prices; Share in percent)
INDUSTRY 2015-2016 2016-2017
I. AGRICULTURE, HUNTING, FORESTRY & FISHING 2.2 11.9
a. Agriculture and Forestry 1.3 13.0
b. Fishing 10.1 2.8
II. INDUSTRY SECTOR 17.4 2.7
a. Mining and Quarrying 2.0 4.0
b. Manufacturing 7.3 3.7
c. Construction 41.8 1.1
d. Electricity, Gas and Water Supply 4.4 1.9
III. SERVICE SECTOR 8.7 9.2
a. Transportation, Storage & Communication 2.8 9.5
b. Trade and Repair of Motor Vehicle
Motorcycles, Personal and Household Goods8.6 8.0
c. Financial Intermediation 7.2 10.8
d. Real Estate, Renting & Business Activities 11.1 10.3
e. Public Administration & Defense;
Compulsory Social Security12.8 13.4
f. Other Services 10.4 7.6
GROSS DOMESTIC PRODUCT 11.3 7.0
Source: Philippine Statistics Authority
Table 3.5B
GROWTH RATE OF GROSS REGIONAL DOMESTIC PRODUCT BY INDUSTRIAL ORIGIN
CENTRAL VISAYAS
2015-2017
(Level in thousand pesos at constant 2000 prices; Share in percent)
INDUSTRY 2015-2016 2016-2017
I. AGRICULTURE, HUNTING, FORESTRY & FISHING (0.2) 7.0
a. Agriculture and Forestry (1.0) 9.6
b. Fishing 4.7 (8.5)
II. INDUSTRY SECTOR 14.1 3.0
a. Mining and Quarrying 1.0 (5.5)
b. Manufacturing 6.0 5.5
c. Construction 38.3 (0.9)
d. Electricity, Gas and Water Supply 7.0 (0.9)
III. SERVICE SECTOR 6.0 6.3
a. Transportation, Storage & Communication 5.3 5.2
b. Trade and Repair of Motor Vehicle
Motorcycles, Personal and Household Goods5.0 5.2
c. Financial Intermediation 4.1 7.7
d. Real Estate, Renting & Business Activities 7.1 7.9
e. Public Administration & Defense;
Compulsory Social Security7.7 8.4
f. Other Services 7.7 5.8
GROSS DOMESTIC PRODUCT 8.6 5.1
Source: Philippine Statistics Authority
3-9

Table 3.6A
PER CAPITA GROSS REGIONAL DOMESTIC PRODUCT BY REGION
2015-2017
(In Pesos: At current prices)
2015 2016 2017
131,171 140,251 150,649
NCR National Capital Region 398,650 432,155 465,691
CAR Cordillera Administrative Region 131,530 133,791 147,383
I Ilocos Region 79,653 86,608 92,640
II Cagayan Valley 67,707 70,880 78,029
III Central Luzon 106,975 115,769 127,734
IVA CALABARZON 145,786 148,873 158,012
IVB MIMAROPA 66,309 66,762 73,518
V Bicol Region 46,876 49,859 52,927
VI Western Visayas 71,356 76,322 83,082
VII Central Visayas 116,448 127,489 134,288
VIII Eastern Visayas 59,930 67,475 68,219
IX Zamboanga Peninsula 73,634 77,045 80,205
X Northern Mindanao 109,981 120,623 128,975
XI Davao Region 113,881 126,772 141,430
XII SOCCSKSARGEN 77,396 82,397 89,153
XIII Caraga 58,541 60,354 63,966
ARMM
Autonomous Region in Muslim
Mindanao 26,862 27,691 30,557
Source: Philippine Statistics Authority
Table 3.6B
PER CAPITA GROSS REGIONAL DOMESTIC PRODUCT BY REGION
2015-2017
(In Pesos: At current prices)
2015 2016 2017
74,833 78,676 82,592
NCR National Capital Region 218,987 232,739 244,453
CAR Cordillera Administrative Region 75,048 75,401 83,044
I Ilocos Region 46,180 49,474 51,728
II Cagayan Valley 38,436 39,344 41,600
III Central Luzon 63,641 68,634 73,921
IVA CALABARZON 92,184 94,811 99,328
IVB MIMAROPA 39,575 39,784 41,421
V Bicol Region 25,770 26,686 27,504
VI Western Visayas 39,653 41,417 44,296
VII Central Visayas 64,846 69,315 71,677
VIII Eastern Visayas 33,771 37,144 37,125
IX Zamboanga Peninsula 41,873 43,043 43,300
X Northern Mindanao 60,290 63,771 66,499
XI Davao Region 61,335 65,913 71,762
XII SOCCSKSARGEN 44,178 45,459 48,240
XIII Caraga 35,553 35,537 36,308
ARMM
Autonomous Region in Muslim
Mindanao 13,646 13,366 13,989
Source: Philippine Statistics Authority
Region
Philippines
Philippines
Region
3-10

Table 3.7A
EXPENDITURE ON GROSS REGIONAL DOMESTIC PRODUCT, PHILIPPINES
AT CURRENT PRICES
2015-2017
(In Thousand Pesos)
Type of Expenditure 2015 2016 2017
1. Household Final Consumption Expenditure 9,825,882,527 10,672,796,972 11,613,430,108
2. Government Final Consumption Expenditure 1,455,783,069 1,619,638,659 1,789,742,847
3. Gross Capital Formation 2,826,185,416 3,534,428,039 3,972,403,148
A. Fixed Capital 2,929,032,078 3,568,232,997 3,956,352,621
1. Construction 1,566,901,463 1,794,017,563 1,941,332,780
2. Durable Equipment 1,129,826,470 1,512,203,559 1,706,657,696
3. Breeding Stock & Orchard Development 172,474,216 188,838,999 216,114,412
4. Intellectual Property Products 59,829,929 73,172,875 92,247,733
B. Changes in Inventories (102,846,662) (33,804,957) 16,050,527
4. Net Exports (785,809,738) (1,346,919,059) (1,569,217,279)
GROSS REGIONAL DOMESTIC PRODUCT 13,322,041,273 14,479,944,611 15,806,358,823
Source: Philippine Statistics Authority
Table 3.7B
EXPENDITURE ON GROSS REGIONAL DOMESTIC PRODUCT, PHILIPPINES
AT CONSTANT 2000 PRICES
2015-2017
(In Thousand Pesos)
Type of Expenditure 2015 2016 2017
1. Household Final Consumption Expenditure 5,266,631,907 5,642,389,271 5,973,816,321
2. Government Final Consumption Expenditure 783,955,445 854,569,937 914,136,455
3. Gross Capital Formation 1,838,431,568 2,289,674,619 2,504,502,031
A. Fixed Capital 1,800,534,890 2,270,587,322 2,485,451,420
1. Construction 701,802,301 793,469,683 839,966,906
2. Durable Equipment 938,733,269 1,292,959,445 1,431,518,132
3. Breeding Stock & Orchard Development 99,286,460 102,844,703 106,262,312
4. Intellectual Property Products 60,712,860 81,313,491 107,704,070
B. Changes in Inventories 37,896,678 19,087,297 19,050,611
4. Net Exports (288,843,851) (663,892,394) (726,747,301)
GROSS REGIONAL DOMESTIC PRODUCT 7,600,175,069 8,122,741,433 8,665,707,506
Source: Philippine Statistics Authority
3-11

Table 3.8A
EXPENDITURE ON GROSS DOMESTIC REGIONAL PRODUCT BY REGION
AT CURRENT PRICES
2015-2017
(In Thousand Pesos)
2015 2016 2017
13,322,041,273 14,479,944,611 15,806,358,823
NCR National Capital Region 5,043,596,897 5,526,337,349 6,016,249,210
CAR Cordillera Administrative Region 234,583,094 242,868,004 272,267,998
I Ilocos Region 409,097,791 450,382,549 487,587,377
II Cagayan Valley 236,832,451 251,400,390 280,561,422
III Central Luzon 1,187,307,089 1,304,052,510 1,459,629,257
IVA CALABARZON 2,059,547,574 2,142,921,719 2,316,355,788
IVB MIMAROPA 204,848,841 210,488,352 236,468,799
V Bicol Region 282,759,855 306,539,332 331,676,579
VI Western Visayas 549,753,304 596,202,647 658,002,816
VII Central Visayas 867,162,727 964,876,064 1,032,638,985
VIII Eastern Visayas 271,914,849 311,740,923 320,964,359
IX Zamboanga Peninsula 277,208,133 295,105,827 312,492,153
X Northern Mindanao 517,648,536 576,819,708 626,475,724
XI Davao Region 565,205,235 641,245,739 728,807,009
XII SOCCSKSARGEN 355,960,468 386,407,684 426,170,149
XIII Caraga 159,038,290 167,308,819 180,934,323
ARMM
Autonomous Region in Muslim
Mindanao 99,576,138 105,246,996 119,076,875
Source: Philippine Statistics Authority
Table 3.8B
EXPENDITURE ON GROSS DOMESTIC REGIONAL PRODUCT BY REGION
AT CONSTANT 2000 PRICES
2015-2017
(In Thousand Pesos)
2015 2016 2017
7,600,175,069 8,122,741,433 8,665,707,506
NCR National Capital Region 2,770,552,677 2,976,234,624 3,158,081,656
CAR Cordillera Administrative Region 133,848,201 136,873,913 153,411,322
I Ilocos Region 237,178,755 257,277,270 272,257,487
II Cagayan Valley 134,444,616 139,548,688 149,578,296
III Central Luzon 706,343,196 773,108,325 844,709,530
IVA CALABARZON 1,302,297,272 1,364,736,594 1,456,088,132
IVB MIMAROPA 122,258,656 125,432,256 133,228,208
V Bicol Region 155,449,066 164,065,917 172,358,884
VI Western Visayas 305,503,332 323,535,392 350,821,902
VII Central Visayas 482,898,676 524,597,384 551,179,952
VIII Eastern Visayas 153,224,685 171,610,264 174,669,515
IX Zamboanga Peninsula 157,640,786 164,866,496 168,702,094
X Northern Mindanao 283,769,262 304,952,799 323,009,662
XI Davao Region 304,412,137 333,405,134 369,797,076
XII SOCCSKSARGEN 203,183,377 213,182,370 230,598,148
XIII Caraga 96,587,795 98,511,669 102,701,036
ARMM
Autonomous Region in Muslim
Mindanao 50,582,581 50,802,338 54,514,604
Source: Philippine Statistics Authority
Philippines
Philippines
Region
Region
3-12

Table 3.9A
EXPENDITURE ON GROSS REGIONAL DOMESTIC PRODUCT, CENTRAL VISAYAS
AT CURRENT PRICES
2015-2017
(In Thousand Pesos)
Type of Expenditure 2015 2016 2017
1. Household Final Consumption Expenditure 710,054,591 779,831,936 847,161,807
2. Government Final Consumption Expenditure 56,433,687 63,844,569 71,724,406
3. Gross Capital Formation 202,426,206 311,468,088 317,093,865
A. Fixed Capital 212,263,351 307,313,111 312,210,021
1. Construction 153,775,136 218,653,081 221,248,122
2. Durable Equipment 45,942,667 74,351,377 73,658,645
3. Breeding Stock & Orchard Development 11,130,133 12,518,783 14,970,156
4. Intellectual Property Products 1,415,415 1,789,870 2,333,099
B. Changes in Inventories (9,837,144) 4,154,977 4,883,843
4. Net Exports (101,751,757) (190,268,529) (203,341,093)
GROSS REGIONAL DOMESTIC PRODUCT 867,162,727 964,876,064 1,032,638,985
Source: Philippine Statistics Authority
Table 3.9B
EXPENDITURE ON GROSS REGIONAL DOMESTIC PRODUCT, CENTRAL VISAYAS
AT CONSTANT 2000 PRICES
2015-2017
(In Thousand Pesos)
Type of Expenditure 2015 2016 2017
1. Household Final Consumption Expenditure 344,689,384 369,531,797 390,608,360
2. Government Final Consumption Expenditure 30,390,171 33,686,310 36,634,254
3. Gross Capital Formation 133,187,502 218,950,027 206,292,734
A. Fixed Capital 135,680,130 214,609,379 202,698,281
1. Construction 68,865,644 96,776,803 96,320,766
2. Durable Equipment 59,751,971 109,897,805 97,204,769
3. Breeding Stock & Orchard Development 5,241,882 5,617,242 5,946,332
4. Intellectual Property Products 1,820,633 2,317,529 3,226,414
B. Changes in Inventories (2,492,629) 4,340,649 3,594,453
4. Net Exports (25,368,381) (97,570,749) (82,355,395)
GROSS REGIONAL DOMESTIC PRODUCT 482,898,676 524,597,384 551,179,952
Source: Philippine Statistics Authority
3-13

Table 3.10A
PER CAPITA, HOUSEHOLD FINAL CONSUMPTION EXPENDITURE BY REGION
2015-2017
(In Pesos: At current prices)
2015 2016 2017
96,747 103,376 110,687
NCR National Capital Region 171,995 183,152 196,388
CAR Cordillera Administrative Region 89,362 94,076 98,008
I Ilocos Region 85,237 91,301 96,550
II Cagayan Valley 77,445 82,045 88,063
III Central Luzon 110,527 120,986 131,704
IVA CALABARZON 110,825 117,022 125,583
IVB MIMAROPA 71,187 75,772 80,763
V Bicol Region 72,936 77,084 83,583
VI Western Visayas 84,006 90,197 96,666
VII Central Visayas 95,350 103,040 110,168
VIII Eastern Visayas 72,960 79,751 85,930
IX Zamboanga Peninsula 66,119 70,768 74,292
X Northern Mindanao 76,144 79,990 84,583
XI Davao Region 79,384 87,415 95,100
XII SOCCSKSARGEN 65,434 70,095 73,541
XIII Caraga 66,789 69,614 73,181
ARMM
Autonomous Region in Muslim
Mindanao 42,508 43,070 44,899
Source: Philippine Statistics Authority
Table 3.10B
PER CAPITA, HOUSEHOLD FINAL CONSUMPTION EXPENDITURE BY REGION
2015-2017
(In Pesos: At current prices)
2015 2016 2017
74,833 78,712 56,936
NCR National Capital Region 218,987 232,836 106,335
CAR Cordillera Administrative Region 75,048 75,279 51,145
I Ilocos Region 46,180 49,461 52,512
II Cagayan Valley 38,436 39,153 45,243
III Central Luzon 63,641 68,649 66,390
IVA CALABARZON 92,184 94,826 66,579
IVB MIMAROPA 39,575 39,825 43,507
V Bicol Region 25,770 26,736 41,512
VI Western Visayas 39,653 41,486 49,043
VII Central Visayas 64,846 69,390 50,796
VIII Eastern Visayas 33,771 37,261 44,416
IX Zamboanga Peninsula 41,873 43,106 36,028
X Northern Mindanao 60,290 63,874 41,073
XI Davao Region 61,335 65,837 47,477
XII SOCCSKSARGEN 44,178 45,484 39,177
XIII Caraga 35,553 35,720 32,915
ARMM
Autonomous Region in Muslim
Mindanao 13,646 13,353 20,242
Source: Philippine Statistics Authority
Region
Philippines
Region
Philippines
3-14

Chapter 4
ENVIRONMENT and
NATURAL RESOURCES
Data on the region’s natural resources and some indicators of its environmental condition are necessary in the formulation of policies and programs designed to bring about a more effective environmental protection and resource utilization. A growing awareness and national concern on
the country’s natural resources and environmental condition have been demonstrated during the past years. This resulted from the development vision long espoused by national and local leaders and the worldwide goal towards sustainable development. The said goal, now a global advocacy,
implies a balance between resource utilization and the development, protection and conservation of the country’s environment and natural resources. In this fashion, development will benefit not only
today’s generation but the future ones as well. All these concerns underscore the need for more reliable, timely and comprehensive data. The data are critical to the government, private sector and even the international community in their formulation of measures to safeguard the environment
and natural resources and to remedy the destruction and degradations in these areas.
This chapter presents data on existing/available land, forest, watershed areas of the region and/or its provinces and volume and value of mineral production. The sources of data are the Forest Management Bureau (FMB) and Mines and Geosciences Bureau (MGB) of the Department of
Environment and Natural Resources (DENR).
Highlights
• Certified alienable and disposable lands comprise 64.8 percent of the total land area.
Classified forest lands make up 30.8 percent while unclassified forest lands account for 4.4
percent. The land classification of the region remained unchanged since 2005.
• Volume of gold production reported by the MGB of the DENR decreased by 35.3 percent
from 1,050 kilograms in 2016 to 680 kilograms in 2017. On the other hand, silver production
decreased by 37.3 percent from 3,465 kilograms in 2016 to 2,172 kilograms in 2017.
• As of 2017, the six proclaimed major watersheds in Central Visayas covered an area of
229,927 hectares.
• The 2016 log production of Central Visayas has rebounded by 7.7 percent over the 2016
level.

ContentsHighlights 4-1
STATISTICAL TABLES:
Table 4.1 Status of Land Classification by Province,
Central Visayas: 2008-2017 …...………………………………………………………... 4-3
Table 4.2 Total Forest Cover by Province, Central Visayas: 2008-2017 ….………….….. 4-5
Table 4.3 Production of Selected Non-Timber Forest Products
Central Visayas: 2007-2017 …...…………………………………………………………. 4-8
Table 4.4 Volume and Value of Mineral Production, Metallic and Non-Metallic
Central Visayas: 2013-2017 ….………………………………………………….……….. 4-9
Table 4.5 Major Proclaimed Watershed by Province
As of September 29, 2017 …..…………………………………………………………… 4-13
Table 4.6 Monthly Log Production by Province, Central Visayas: 2008-2017 ….…….. 4-14
FIGURES:
Figure 4.1 Status of Land Classification, Central Visayas: 2008-2017 ….…………….….. 4-7
Figure 4.2 Land Distribution by Province, Central Visayas: 2017 ….…………………….…. 4-7
4-2

Table 4.1
STATUS OF LAND CLASSIFICATION BY PROVINCE
2008-2017
(In Hectares)
2008 2009 2010 2011 2012
CENTRAL VISAYAS
Total Land Area 1,489,077 1,489,077 1,489,077 1,489,077 1,489,077
Certified Alienable and Disposable 964,169 964,169 964,169 964,169 964,169
Unclassified Forest Lands 65,638 65,638 65,638 65,638 65,638
Classified Forest Lands 459,270 459,270 459,270 459,270 459,270
Established Forest Reserve 49,619 49,619 49,619 49,619 49,619
Established Timber Land 390,151 390,151 390,151 390,151 390,151
National Parks/Protected Areas 15,054 15,054 15,054 15,054 15,054
Fishpond 4,328 4,328 4,328 4,328 4,328
Military & Naval Reservation 4 4 4 4 4
Civil Reservation 114 114 114 114 114
Bohol
Total Land Area 411,726 411,726 411,726 411,726 411,726
Certified Alienable and Disposable 310,455 310,455 310,455 310,455 310,455
Unclassified Forest Lands
Classified Forest Lands 101,271 101,271 101,271 101,271 101,271
Established Forest Reserve 19,410 19,410 19,410 19,410 19,410
Established Timber Land 78,454 78,454 78,454 78,454 78,454
National Parks/Protected Areas - - - - -
Fishpond 3,407 3,407 3,407 3,407 3,407
Military & Naval Reservation - - - - -
Civil Reservation - - - - -
Cebu
Total Land Area 509,237 509,237 509,237 509,237 509,237
Certified Alienable and Disposable 368,146 368,146 368,146 368,146 368,146
Unclassified Forest Lands
Classified Forest Lands 141,091 141,091 141,091 141,091 141,091
Established Forest Reserve 21,427 21,427 21,427 21,427 21,427
Established Timber Land 105,578 105,578 105,578 105,578 105,578
National Parks/Protected Areas 13,148 13,148 13,148 13,148 13,148
Fishpond 820 820 820 820 820
Military & Naval Reservation 4 4 4 4 4
Civil Reservation 114 114 114 114 114
Negros Oriental
Total Land Area 540,227 540,227 540,227 540,227 540,227
Certified Alienable and Disposable 258,841 258,841 258,841 258,841 258,841
Unclassified Forest Lands 65,638 65,638 65,638 65,638 65,638
Classified Forest Lands 215,748 215,748 215,748 215,748 215,748
Established Forest Reserve 8,570 8,570 8,570 8,570 8,570
Established Timber Land 205,171 205,171 205,171 205,171 205,171
National Parks/Protected Areas 1,906 1,906 1,906 1,906 1,906
Fishpond 101 101 101 101 101
Military & Naval Reservation - - - - -
Civil Reservation - - - - -
Siquijor
Total Land Area 27,887 27,887 27,887 27,887 27,887
Certified Alienable and Disposable 26,727 26,727 26,727 26,727 26,727
Unclassified Forest Lands - - - - -
Classified Forest Lands 1,160 1,160 1,160 1,160 1,160
Established Forest Reserve 212 212 212 212 212
Established Timber Land 948 948 948 948 948
National Parks/Protected Areas - - - - -
Fishpond - - - - -
Military & Naval Reservation - - - - -
Civil Reservation - - - - -
Note: Details may not add up to total due to rounding
Source: Department of Environment and Natural Resources
Data are extracted from Philippine Forestry Statistics published by the Forest Management Bureau
Area/ Land Classification
4-3

Table 4.1 - Continued
2013 2014 2015 2016 2017
CENTRAL VISAYAS
Total Land Area 1,489,077 1,489,077 1,489,077 1,489,077 1,489,077
Certified Alienable and Disposable 964,169 964,169 964,169 964,169 964,169
Unclassified Forest Lands 65,638 65,638 65,638 65,638 65,638
Classified Forest Lands 459,270 459,270 459,270 459,270 459,270
Established Forest Reserve 49,619 49,619 49,619 49,619 49,619
Established Timber Land 390,151 390,151 390,151 390,151 390,151
National Parks/Protected Areas 15,054 15,054 15,054 15,054 15,054
Fishpond 4,328 4,328 4,328 4,328 4,328
Military & Naval Reservation 4 4 4 4 4
Civil Reservation 114 114 114 114 114
Bohol
Total Land Area 411,726 411,726 411,726 411,726 411,726
Certified Alienable and Disposable 310,455 310,455 310,455 310,455 310,455
Unclassified Forest Lands
Classified Forest Lands 101,271 101,271 101,271 101,271 101,271
Established Forest Reserve 19,410 19,410 19,410 19,410 19,410
Established Timber Land 78,454 78,454 78,454 78,454 78,454
National Parks/Protected Areas - - - - -
Fishpond 3,407 3,407 3,407 3,407 3,407
Military & Naval Reservation - - - - -
Civil Reservation - - - - -
Cebu
Total Land Area 509,237 509,237 509,237 509,237 509,237
Certified Alienable and Disposable 368,146 368,146 368,146 368,146 368,146
Unclassified Forest Lands
Classified Forest Lands 141,091 141,091 141,091 141,091 141,091
Established Forest Reserve 21,427 21,427 21,427 21,427 21,427
Established Timber Land 105,578 105,578 105,578 105,578 105,578
National Parks/Protected Areas 13,148 13,148 13,148 13,148 13,148
Fishpond 820 820 820 820 820
Military & Naval Reservation 4 4 4 4 4
Civil Reservation 114 114 114 114 114
Negros Oriental
Total Land Area 540,227 540,227 540,227 540,227 540,227
Certified Alienable and Disposable 258,841 258,841 258,841 258,841 258,841
Unclassified Forest Lands 65,638 65,638 65,638 65,638 65,638
Classified Forest Lands 215,748 215,748 215,748 215,748 215,748
Established Forest Reserve 8,570 8,570 8,570 8,570 8,570
Established Timber Land 205,171 205,171 205,171 205,171 205,171
National Parks/Protected Areas 1,906 1,906 1,906 1,906 1,906
Fishpond 101 101 101 101 101
Military & Naval Reservation - - - - -
Civil Reservation - - - - -
Siquijor
Total Land Area 27,887 27,887 27,887 27,887 27,887
Certified Alienable and Disposable 26,727 26,727 26,727 26,727 26,727
Unclassified Forest Lands - - - - -
Classified Forest Lands 1,160 1,160 1,160 1,160 1,160
Established Forest Reserve 212 212 212 212 212
Established Timber Land 948 948 948 948 948
National Parks/Protected Areas - - - - -
Fishpond - - - - -
Military & Naval Reservation - - - - -
Civil Reservation - - - - -
Area/ Land Classification
4-4

Table 4.2
TOTAL FOREST COVER BY PROVINCE
2008-2017
(Area in Hectares)
Total Closed Open Mangrove Other Land
2008
Central Visayas 74,869 2,231 43,026 11,770 17,842
Bohol 19,961 - 13,407 6,463 91
Cebu 16,762 919 6,785 3,402 5,656
Negros Oriental 38,030 1,312 22,834 1,789 12,095
Siquijor 116 116
2009
Central Visayas 74,869 2,231 43,026 11,770 17,842
Bohol 19,961 - 13,407 6,463 91
Cebu 16,762 919 6,785 3,402 5,656
Negros Oriental 38,030 1,312 22,834 1,789 12,095
Siquijor 116 116
2010
Central Visayas 74,869 2,231 43,026 11,770 17,842
Bohol 19,961 - 13,407 6,463 91
Cebu 16,762 919 6,785 3,402 5,656
Negros Oriental 38,030 1,312 22,834 1,789 12,095
Siquijor 116 116
2011
Central Visayas 74,869 2,231 43,026 11,770 17,842
Bohol 19,961 - 13,407 6,463 91
Cebu 16,762 919 6,785 3,402 5,656
Negros Oriental 38,030 1,312 22,834 1,789 12,095
Siquijor 116 116
2012
Central Visayas 62,064 11,464 35,797 14,803 -
Bohol 20,889 10,267 10,622
Cebu 14,407 8,723 2,650 3,034
Negros Oriental 25,866 2,741 22,074 1,051
Siquijor 902 806 96
Note: Details may not add up to total due to rounding
Source: Department of Environment and Natural Resources
Data are extracted from the Philippine Forestry Statistics published by the Forest Management Bureau
Region/ProvinceForest Cover
4-5
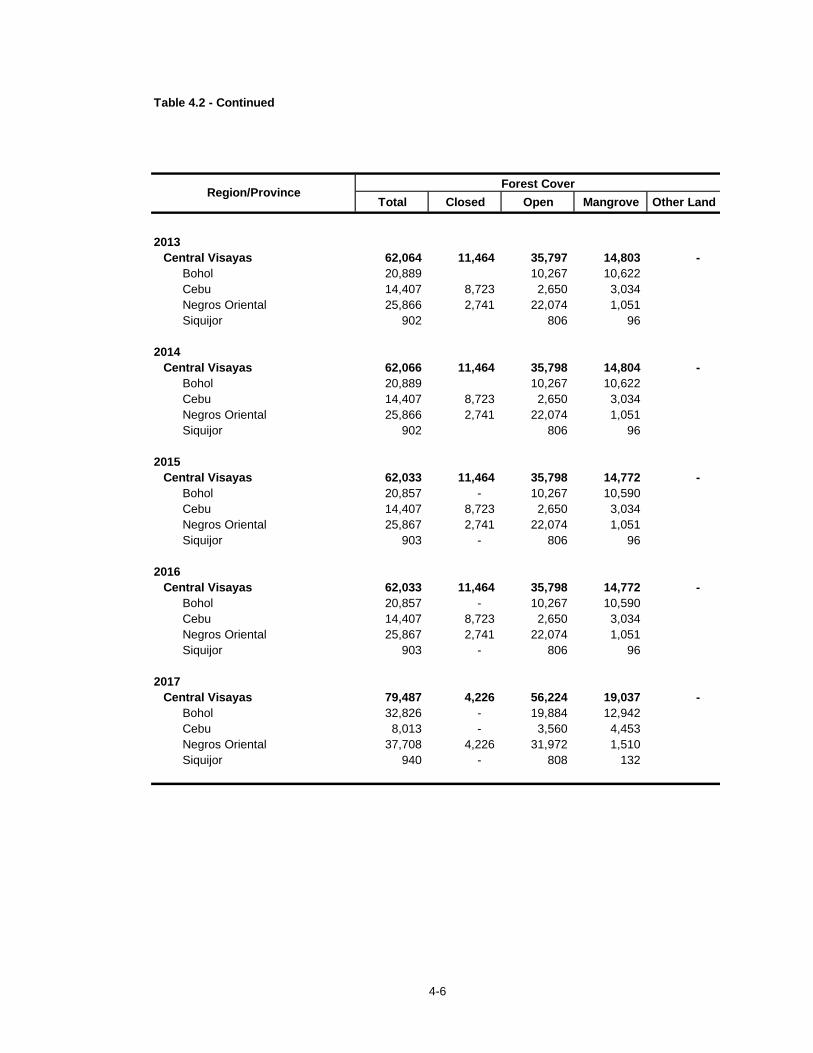
Table 4.2 - Continued
Total Closed Open Mangrove Other Land
2013
Central Visayas 62,064 11,464 35,797 14,803 -
Bohol 20,889 10,267 10,622
Cebu 14,407 8,723 2,650 3,034
Negros Oriental 25,866 2,741 22,074 1,051
Siquijor 902 806 96
2014
Central Visayas 62,066 11,464 35,798 14,804 -
Bohol 20,889 10,267 10,622
Cebu 14,407 8,723 2,650 3,034
Negros Oriental 25,866 2,741 22,074 1,051
Siquijor 902 806 96
2015
Central Visayas 62,033 11,464 35,798 14,772 -
Bohol 20,857 - 10,267 10,590
Cebu 14,407 8,723 2,650 3,034
Negros Oriental 25,867 2,741 22,074 1,051
Siquijor 903 - 806 96
2016
Central Visayas 62,033 11,464 35,798 14,772 -
Bohol 20,857 - 10,267 10,590
Cebu 14,407 8,723 2,650 3,034
Negros Oriental 25,867 2,741 22,074 1,051
Siquijor 903 - 806 96
2017
Central Visayas 79,487 4,226 56,224 19,037 -
Bohol 32,826 - 19,884 12,942
Cebu 8,013 - 3,560 4,453
Negros Oriental 37,708 4,226 31,972 1,510
Siquijor 940 - 808 132
Region/ProvinceForest Cover
4-6

Source: Department of Environment and Natural Resources
Data are extracted from Philippine Forestry Statistics published by the Forest Management Bureau
-
200,000
400,000
600,000
800,000
1,000,000
1,200,000
2008 2011 2014 2017
In H
ecta
res
Figure 4.1 Status of Land ClassificationCentral Visayas: 2008-2017
Unclassified Forest Lands Classified Forest Lands Certified A and D
Negros Oriental36%
Cebu34%
Bohol28%
Siquijor2%
Figure 4.2 Land Distribution by ProvinceCentral Visayas: 2017
4-7

Table 4.3
PRODUCTION OF SELECTED NON-TIMBER FOREST PRODUCTS IN CENTRAL VISAYAS
2008-2017
Forest Products Unit 2008 2009 2010 2011 2012
Anahaw Leaves piece - - - - -
Anahaw Poles piece - - - - -
Bamboo Crafts piece - - - - -
Bamboo Poles piece 2,600 650 400 - -
Bamboo Rolls piece - - - - -
Bamboo Split piece - - - - -
Bamboo Split bundle - - - - -
Bolts piece - - - - -
Gajo Sticks piece - - - - -
Nipa Shingles piece 957,000 1,216,000 1,239,000 860,000 -
Rattan piece - - - - -
Rattan Canes piece - - - - -
Rattan Poles lineal meter - - - - -
Rattan Poles piece - - - - -
Round Posts piece - - - - -
Slabs piece - - - - -
Split Rattan piece - - - - -
Talahib piece - - - - -
Taguisi Poles piece - - - - -
Unsplit Rattan lineal meter 16,500 - - - -
Source: Department of Environment and Natural Resources
Data are extracted from the Philippine Forestry Statistics published by the Forest Management Bureau
Table 4.3 - Continued
Forest Products Unit 2013 2014 2015 2016 2017
Anahaw Leaves piece - - - - -
Anahaw Poles piece - - - - -
Bamboo Crafts piece - - - - -
Bamboo Poles piece 813 - 11,744 6,844 6,288
Bamboo Rolls piece - - - - -
Bamboo Split piece - - - - -
Bamboo Split bundle - - - - -
Bolts piece - - - - -
Gajo Sticks piece - - - - -
Nipa Shingles piece - - 140,000 335,500 20,000
Rattan piece - - - - -
Rattan Canes piece - - - - -
Rattan Poles lineal meter - - - - -
Rattan Poles piece - - - - -
Round Posts piece - - - - -
Slabs piece - - - - -
Split Rattan piece - - - - -
Talahib piece - - - - -
Taguisi Poles piece - - - - -
Unsplit Rattan lineal meter - 54,000 - - -
4-8

Table 4.4
VOLUME AND VALUE OF MINERAL PRODUCTION, METALLIC AND NON-METALLIC
2014 - 2017
(Value in Pesos)
Quantity Value Quantity Value
1. Metallic
CENTRAL VISAYAS
Copper Concentrate DMT 178,165 10,355,655,672 172,667 9,562,304,689
Copper By-Product
Gold kg. 819 1,564,972,682 940 1,509,271,952
Silver kg. 2,983 85,144,115 2,149 335,678,700
Pyrite DMT
Manganese cu.m
Copper Ore - - - -
Cebu
Copper Concentrate DMT 178,165 10,355,655,672 172,667 9,562,304,689
Copper By-Product
Gold kg. 819 1,564,972,682 940 1,509,271,952
Silver kg. 2,983 85,144,115 2,149 335,678,700
Pyrite DMT
Bohol
Manganese cu.m - - - -
Negros Oriental
Copper Ore MT - - - -
2. Non-Metallic
CENTRAL VISAYAS
Basalt cu.m 304,904 84,781,677 300,363 89,603,789
Clay MT 341,834 44,113,490 433,793 45,343,808
Diorite cu.m 46,462 2,088,954 40,348 1,748,410
Dolomite MT 2,001,784 218,857,352 1,561,883 170,211,312
Flat Stone cu.m 51 22,950 - -
Greywacke MT 385,866 68,853,967 506,838 69,169,093
Limestone
Aggregates MT - - - -
Boulders cu.m 7,680 409,000 11,222 1,072,400
Cement MT 4,550,716 230,003,821 5,050,006 247,272,269
Filling Materials cu.m 93,668 11,756,387 232,404 20,538,862
Industrial Use MT 2,321,769 111,350,032 2,426,779 122,088,978
Marbleized MT 1,768 8,838,105 1,885 9,423,695
Mactan Stone MT 1,624 133,096 - -
Mine Waste cu.m - - 23,860 1,434,955
Rock Phosphate cu.m 89 31,200 1,112 642,859
Sand and Gravel cu.m. 729,095 130,537,326 663,785 120,608,532
Serpentinized Peridotite cu.m - -
Silica Sand MT 229,678 37,570,679 77,381 14,925,464
Weathered Andesite MT
Remarks: 1. Data provided are based on production reports submitted
2. Value of minerals differ in every province where it was produced
Source: Mines and Geosciences Bureau, Department of Environment and Natural Resources
2014 2015Province / Mineral Unit Used
4-9

Table 4.4 - Continued
Quantity Value Quantity Value
1. Metallic
CENTRAL VISAYAS
Copper Concentrate DMT 175,700 10,782,229,143 134,551 8,913,559,955
Copper By-Product
Gold kg. 1,050 1,994,658,801 680 1,454,551,135
Silver kg. 3,465 89,083,075 2,172 61,587,011
Pyrite DMT
Manganese cu.m
Copper Ore - - - -
Cebu
Copper Concentrate DMT 175,700 10,782,229,143 134,551 8,913,559,955
Copper By-Product
Gold kg. 1,050 1,994,658,801 680 1,454,551,135
Silver kg. 3,465 89,083,075 2,172 61,587,011
Pyrite DMT
Bohol
Manganese cu.m - - - -
Negros Oriental
Copper Ore MT - - - -
2. Non-Metallic
CENTRAL VISAYAS
Basalt cu.m 308,206 128,922,898 407,031 167,818,526
Clay MT 406,054 71,264,759 325,304 52,484,241
Diorite cu.m 78,622 8,291,736 65,074 7,482,003
Dolomite MT 1,893,204 211,048,416 1,584,507 175,055,072
Flat Stone cu.m - - 25 30,725
Greywacke MT 545,051 74,618,444 329,930 52,348,106
Limestone
Aggregates MT 436,160 137,475,016 466,718 159,313,846
Boulders cu.m 14,823 2,840,360 14,102 3,257,322
Cement MT 5,324,894 266,225,811 5,049,559 257,673,206
Filling Materials cu.m 356,947 41,920,617 381,316 55,837,922
Industrial Use MT 2,794,556 140,071,079 3,212,822 177,895,099
Marbleized MT 3,349 6,584,960 2,118 9,463,208
Mactan Stone MT - -
Mine Waste cu.m 35,111 4,949,700 87,530 20,411,028
Rock Phosphate cu.m 100 35,000 159 206,810
Sand and Gravel cu.m. 858,552 150,932,294 1,019,395 269,063,330
Serpentinized Peridotite cu.m 8,190 409,500 19,080 1,665,500
Silica Sand MT 124,333 30,798,260 160,508 44,740,822
Weathered Andesite MT 51,655 10,331,040 77,925 9,158,640
2016 2017Province / Mineral Unit Used
4-10

Table 4.4 - Continued
Quantity Value Quantity Value
Cebu cu.m
Basalt MT 304,904 84,781,677 300,363 89,603,789
Clay cu.m 341,834 44,113,490 433,793 45,343,808
Diorite MT 46,462 2,088,954 32,916 1,323,280
Dolomite MT 2,001,784 218,857,352 1,561,883 170,211,312
Greywacke MT 385,866 68,853,967 506,838 69,169,093
Limestone
Aggregates MT - - - -
Boulders cu.m 7,430 371,500 11,002 1,039,400
Cement MT 4,550,716 230,003,821 5,050,006 247,272,269
Filling Materials cu.m 43,483 4,228,850 157,764 9,188,556
Industrial Use MT 68,809 5,409,091 57,373 6,560,515
Marbleized MT 1,768 8,838,105 1,885 9,423,695
Mactan Stone MT 1,624 133,096 - -
Mine Waste cu.m - - 23,860 1,434,955
Rock Phosphate cu.m - - 677 490,500
Sand and Gravel cu.m 447,098 114,483,531 402,293 98,339,158
Serpentinized Peridotite cu.m - - - -
Silica Sand MT 9,303 383,479 - -
Weathered Andesite MT - - - -
Bohol
Basalt cu.m - - - -
Diorite cu.m - - 7,432 425,130
Limestone cu.m
Boulders cu.m 250 37,500 220 33,000
Filling Materials MT 50,185 7,527,537 74,641 11,350,306
Industrial Use cu.m 2,221,624 103,402,267 2,241,757 105,281,308
Sand and Gravel cu.m 28,482 4,380,100 31,904 4,932,615
Silica Sand 35,690 2,028,099 9,231 886,564
Negros Oriental
Flat Stone MT 51 22,950 - -
Limestone - Industrial Use cu.m 343 59,775 389 68,900
Rock Phosphate cu.m 89 31,200 435 152,359
Sand and Gravel cu.m. 253,515 11,673,695 229,588 17,336,760
Silica Sand cu.m 184,685 35,159,101 68,150 14,038,900
Siquijor
Limestone - Industrial Use MT 30,994 2,478,899 127,260 10,178,255
2014 2015Province / Mineral Unit Used
4-11

Table 4.4 - Continued
Quantity Value Quantity Value
Cebu cu.m
Basalt MT 301,796 127,961,398 386,037 164,669,426
Clay cu.m 406,054 71,264,759 325,304 52,484,241
Diorite MT 53,315 4,730,340 24,343 1,372,360
Dolomite MT 1,893,204 211,048,416 1,584,507 175,055,072
Greywacke MT 545,051 74,618,444 329,930 52,348,106
Limestone
Aggregates MT 436,160 137,475,016 466,718 159,313,846
Boulders cu.m 13,113 2,583,860 13,443 3,158,472
Cement MT 5,324,894 266,225,811 5,049,559 257,673,206
Filling Materials cu.m 234,766 24,798,823 234,325 33,860,144
Industrial Use MT 106,147 16,054,298 86,646 16,208,700
Marbleized MT 3,349 6,584,960 2,118 9,463,208
Mactan Stone MT - -
Mine Waste cu.m 35,111 4,949,700 87,530 20,411,028
Rock Phosphate cu.m - - 146 196,800
Sand and Gravel cu.m 567,400 118,301,227 584,333 195,503,930
Serpentinized Peridotite cu.m 8,190 409,500 19,080 1,665,500
Silica Sand MT - - - -
Weathered Andesite MT 51,655 10,331,040 77,925 9,158,640
Bohol
Basalt cu.m 6,410 961,500 20,994 3,149,100
Diorite cu.m 25,307 3,561,396 40,731 6,109,643
Limestone cu.m
Boulders cu.m 1,710 256,500 659 98,850
Filling Materials MT 122,182 17,121,794 146,991 21,977,778
Industrial Use cu.m 2,550,437 112,712,440 2,950,306 144,564,994
Sand and Gravel cu.m 35,414 6,347,542 33,982 6,084,477
Silica Sand - - - -
Negros Oriental cu.m
Flat Stone MT - - 25 30,725
Limestone - Industrial Use cu.m 323 113,050 2,302 863,780
Rock Phosphate 100 35,000 13 10,010
Sand and Gravel cu.m. 255,738 26,283,525 401,080 67,474,923
Silica Sand cu.m 124,333 30,798,260 160,508 44,740,822
Siquijor
Limestone - Industrial Use MT 137,649 11,191,291 173,568 16,257,625
2016 2017Province / Mineral Unit Used
4-12

Table 4.5
MAJOR PROCLAIMED WATERSHED AREAS BY PROVINCE
As of September 29, 2017
(Area Covered in Hectares)
No. Date
Bohol Wahig-Inabanga Watershed Pilar 52,516 468 9/26/1994
Forest Reserve Candijay
Alicia
Duero
Sierra Bullones
Carmen
Dagohoy
Danao
Inabanga
Buenavista
Jetafe
Alijawan-Cansujay-Anibongan Duero 3,630 881 3/20/1992
Watershed Forest Reserve Jagna
Loboc Watershed Forest Reserve Balilihan 19,410 450 12/23/1953
Bilar
Batuan
Carmen
Garcia Hernandez
Cebu Argao River Watershed Forest Argao 7,250 414 6/29/1994
Reserve Dalaguete
Kotkot and Lusaran River Cebu City 14,121 932 6/29/1992
Watershed Forest Reserve Danao City 1074 9/2/1997
Balamban
Compostela
Consolacion
Negros Oriental Palinpinon Geothermal Dumaguete 133,000 1413 4/8/1975
Watershed Reservation Siaton EO 223 7/16/1987
Tanjay
Source: Department of Environment and Natural Resources
Data are extracted from the Philippine Forestry Statistics published by the Forest Management Bureau
Province Name of WatershedTotal Area
Covered
Proclamation
CENTRAL VISAYAS
Municipalities
Covered
4-13

Table 4.6
MONTHLY LOG PRODUCTION BY PROVINCE
2008-2017
(In Cubic Meter)
Province Total Jan Feb Mar Apr May Jun Jul Aug Sep Oct Nov Dec
2008
CENTRAL VISAYAS 2,050 115 132 158 137 106 43 221 493 397 146 60 41
Bohol - - - - - - - - - - - - -
Cebu 575 38 10 30 49 80 24 115 85 59 37 22 24
Negros Oriental 1,475 76 121 128 88 26 19 106 408 338 109 38 17
Siquijor - - - - - - - - - - - - -
2009
CENTRAL VISAYAS 4,783 63 89 471 311 782 492 513 582 337 332 184 627
Bohol - - - - - - - - - - - - -
Cebu 2,625 41 27 260 213 312 492 252 392 187 173 150 127
Negros Oriental 2,158 22 62 211 99 470 - 261 190 150 159 34 501
Siquijor - - - - - - - - - - - - -
2010
CENTRAL VISAYAS 3,356 407 436 258 730 315 240 271 251 12 187 130 120
Bohol 95 33 43 20
Cebu 1,714 74 340 69 272 162 123 202 251 12 64 69 75
Negros Oriental 1,547 300 53 169 458 152 117 69 - - 123 61 45
Siquijor - - - - - - - - - - - - -
2011
CENTRAL VISAYAS 6,536 82 440 433 387 614 321 714 864 952 670 697 362
Bohol - - - - - - - - - - - - -
Cebu 3,214 57 273 288 255 244 321 243 290 260 326 355 302
Negros Oriental 3,322 25 167 145 132 370 - 471 574 692 343 342 60
Siquijor - - - - - - - - - - - - -
2012
CENTRAL VISAYAS 3,830 341 483 420 322 391 337 227 124 71 495 388 232
Bohol 63 - - - - - - - - - 32 31 -
Cebu 2,315 230 264 302 173 279 228 205 48 - 320 155 112
Negros Oriental 1,452 111 219 117 150 112 109 23 76 71 143 202 120
Siquijor - - - - - - - - - - - - -
Source: Department of Environment and Natural Resources
Data are extracted from the Philippine Forestry Statistics published by the Forest Management Bureau
4-14

Table 4.6 - Continued
Province Total Jan Feb Mar Apr May Jun Jul Aug Sep Oct Nov Dec
2013
CENTRAL VISAYAS 6,297 165 463 642 1,656 354 382 411 486 572 490 402 275
Bohol - - - - - - - - - - - - -
Cebu 4,121 137 414 475 223 291 274 377 402 526 406 321 275
Negros Oriental 2,176 28 48 167 1,433 62 108 34 83 46 84 81 -
Siquijor - - - - - - - - - - - - -
2014
CENTRAL VISAYAS 6,067 262 395 468 325 288 254 1,174 1,118 1,324 169 178 112
Bohol - - - - - - - - - - - - -
Cebu 3,372 262 395 468 306 288 193 411 295 464 74 130 88
Negros Oriental 2579 - - - 20 61 763 816 751 96 48 24
Siquijor 116 - - - - - - - 7 109 - - -
2015
CENTRAL VISAYAS 1,693 267 243 121 107 206 249 126 70 52 80 71 101
Bohol - - - - - - - - - - - - -
Cebu 663 94 155 33 19 22 48 25 50 31 53 71 61
Negros Oriental 1,030 173 88 88 88 184 201 101 20 21 26 - 40
Siquijor - - - - - - - - - - - - -
2016
CENTRAL VISAYAS 26,575 917 896 1,595 1,556 1,187 1,139 3,382 2,181 3,010 3,090 3,681 3,936
Bohol 18,451 695 648 1,171 1,297 871 925 1,271 1,600 2,363 2,664 2,296 2,651
Cebu 7,343 214 229 219 220 223 214 2,057 554 604 411 1,359 1,033
Negros Oriental 619 - - 187 39 48 - 46 - 43 3 - 252
Siquijor 162 8 19 18 - 45 - 8 27 - 12 26 -
2017
CENTRAL VISAYAS 28,609 2,019 2,909 3,490 2,308 2,484 2,063 2,650 2,488 2,290 1,797 2,007 2,104
Bohol 25,932 1,802 2,014 3,383 2,066 2,389 1,986 2,094 2,413 2,132 1,735 1,967 1,952
Cebu 502 46 46 58 19 94 77 43 16 28 25 11 40
Negros Oriental 1,185 128 539 a - - - 267 60 41 30 21 98
Siquijor 990 43 310 49 223 - - 245 - 89 8 8 15
4-15

Chapter 5
AGRICULTURE
Data on agriculture are vital in guiding our concerned decision-makers, administrators and
lawmakers. This is anchored on the situation where agriculture still plays a major role in the growth and stability of the region’s economy. More than half of the population is dependent on agriculture for
livelihood. Furthermore, the sector is a major source of food needed for the survival of the population. These factors then mandate the key players in government to give priority to agricultural development. Specifically, the data provide objective bases for redirecting the focus of legislations and plans for the
development of the agriculture and fishery sectors. The data also provide indicators of the successes and impacts of strategies/programs/projects in the lives of farmers and fishermen in the country side.
This chapter presents regional and provincial data on crops, livestock, poultry, fishery, number and area of farms by size. The statistics on crops, livestock, poultry and fishery are sourced from the
Philippine Statistics Authority (PSA) resulting from its various surveys. The PSA is also the source of farm data compiled using the results of the Census of Agriculture and Fisheries undertaken nationwide in 1991 and 2002.
Highlights
• Palay production increased from 231,982 metric tons in 2016 to 325,209 metric tons in 2017. But the 2017 production was still lower than 2015 which is 336,194 metric tons.
• Corn production in 2017 was 143,565 metric tons, lower than 2016 production of 154,614 metric tons.
• Livestock and Poultry production increased in 2017 compared with 2016 except for duck egg which dropped from 351 metric tons to 339 metric tons.
• Fish production in the region continuously dropped from 2011 to 2017. This also includes the
aquaculture production.

ContentsHighlights 5-1
Statistical Tables
Table 5.1 Number and Area of Farms by Size and Province
Central Visayas: 1991 and 2002 …........................................................................... 5-3
Table 5.2A Number and Area of Farms by Tenure of Farms and by Province
Central Visayas: 2002 ….......................................................................................... 5-4
Table 5.2B Number and Area of Farms by Legal Form of Organization and by Province
Central Visayas: 2002 …......................................................................................... 5-6
Table 5.3 Palay Production and Area Harvested by Province
Central Visayas: 2013-2017 …................................................................................ 5-8
Table 5.4 Corn Production and Area Harvested by Province
Central Visayas: 2013-2017 …................................................................................ 5-10
Table 5.5 Volume of Production of Livestock and Poultry by Kind and Province
Central Visayas: 2013-2017 …................................................................................. 5-12
Table 5.6 Inventory of Livestock and Poultry by Kind, Type of Farm and Province
Central Visayas: 2014-2017 …................................................................................. 5-13
Table 5.7 Livestock: Animals Slaughtered in Slaughterhouses by Animal Type and Province
Central Visayas: 2013-2017 …................................................................................. 5-17
Table 5.8 Fish Production by Type and Province
Central Visayas: 2013-2017 …................................................................................ 5-19
Table 5.9 Aquaculture Production by Type and Province
Central Visayas: 2013-2017 …................................................................................ 5-21
Figures
Figure 5.1 Palay Production By Farm Type in Central Visayas: 2014-2017 …................................ 5-9
Figure 5.2 Palay Production and Area Harvested in Central Visayas: 2014- 2017 …...................... 5-9
Figure 5.3 Inventory of Livestock by Kind in Central Visayas: 2016-2017 …................................... 5-17
Figure 5.4 Inventory of Poultry by Kind in Central Visayas: 2014-2017 …...................................... 5-18
Figure 5.5 Fish Production in Central Visayas: 2013-2017 …….................................................... 5-20
Figure 5.6 Fish Production By Type of Production in Central Visayas: 2013-2017 .......................... 5-20
5-2

Table 5.1
NUMBER AND AREA OF FARMS BY SIZE AND BY PROVINCE
1991 and 2002
(In hectares)
Number Area Number Area
CENTRAL VISAYAS 424,825 549,895 430,043 522,433
Under 1.00 hectare 254,194 104,988 266,190 105,592
1.00 - 2.99 hectares 135,566 200,671 133,201 191,935
3.00 - 4.99 hectares 21,224 74,712 18,903 65,739
5.00 - 9.99 hectares 10,216 64,330 8,601 53,402
10.00 - 24.99 hectares 2,912 40,286 2,516 34,371
25.00 hectares and over 715 64,907 632 71,393
Bohol 127,812 166,154 123,487 136,613
Under 1.00 hectare 67,592 30,370 74,327 31,339
1.00 - 2.99 hectares 47,678 74,625 40,413 60,986
3.00 - 4.99 hectares 8,658 30,833 6,239 21,869
5.00 - 9.99 hectares 3,353 21,055 2,057 12,761
10.00 - 24.99 hectares 482 6,410 373 4,795
25.00 hectares and over 50 2,861 78 4,864
Cebu 179,358 161,983 156,078 146,056
Under 1.00 hectare 128,232 49,721 111,051 41,116
1.00 - 2.99 hectares 44,159 62,391 38,434 53,282
3.00 - 4.99 hectares 4,504 15,894 3,646 12,658
5.00 - 9.99 hectares 1,900 11,885 2,071 12,650
10.00 - 24.99 hectares 432 6,129 665 9,084
25.00 hectares and over 132 15,964 211 17,265
Negros Oriental 105,554 212,303 137,141 228,833
Under 1.00 hectare 49,295 21,488 71,031 29,422
1.00 - 2.99 hectares 41,180 59,802 51,418 73,423
3.00 - 4.99 hectares 7,718 26,743 8,603 29,700
5.00 - 9.99 hectares 4,843 30,631 4,287 26,798
10.00 - 24.99 hectares 1,986 27,583 1,459 20,226
25.00 hectares and over 532 46,056 343 49,264
Siquijor 12,101 9,455 13,337 10,932
Under 1.00 hectare 9,075 3,410 9,781 3,716
1.00 - 2.99 hectares 2,549 3,853 2,936 4,245
3.00 - 4.99 hectares 344 1,241 415 1,512
5.00 - 9.99 hectares 120 759 186 1,192
10.00 - 24.99 hectares 12 165 19 266
25.00 hectares and over 1 26 - -
Note: Details may not add up to totals due to rounding.
Source: 1991 Census of Agriculture and Fisheries and 2002 Census of Agriculture
Philippine Statistics Authority
Province/Size of Farm1991 2002
5- 3

Table 5.2A
NUMBER AND AREA OF FARMS BY TENURE OF FARMS AND BY PROVINCE
(In hectares)
Number Area
CENTRAL VISAYAS
Number of Farms 432,044 524,655
Farms operated under one form of tenure 336,187 390,937
Fully Owned 148,749 224,822
Held under Certificate of Land Transfer (CLT)/ Certificate
of Land Ownership Award (CLOA) 12,262 14,045
Ownerlike Possession 54,738 48,785
Tenanted 83,726 71,893
Leased/Rented 7,772 7,207
Rent Free 20,497 13,206
Other Single forms of tenure 2,125 5,148
Not Reported 6,318 5,831
Farms operated under more than one form of tenure 95,857 133,718
Fully Owned/Ownerlike Possession and Tenanted 47,244 55,037
Fully Owned/Ownerlike Possession and Leased/Rented 8,886 16,555
Other Combinations 39,727 62,126
Bohol
Number of Farms 123,487 136,613
Farms operated under one form of tenure 84,352 87,042
Fully Owned 42,068 47,104
Held under Certificate of Land Transfer (CLT)/ Certificate
of Land Ownership Award (CLOA) 2,924 3,859
Ownerlike Possession 23,250 19,576
Tenanted 10,290 10,477
Leased/Rented 1,194 1,151
Rent Free 3,511 2,802
Other Single forms of tenure 687 1,713
Not Reported 428 360
Farms operated under more than one form of tenure 39,135 49,570
Fully Owned/Ownerlike Possession and Tenanted 20,053 23,509
Fully Owned/Ownerlike Possession and Leased/Rented 2,787 3,380
Other Combinations 16,295 22,681
Cebu
Number of Farms 156,078 146,056
Farms operated under one form of tenure 124,183 110,891
Fully Owned 53,068 56,945
Held under Certificate of Land Transfer (CLT)/ Certificate
of Land Ownership Award (CLOA) 2,855 2,117
Ownerlike Possession 10,393 7,539
Tenanted 46,185 35,137
Leased/Rented 3,556 2,932
2002Province and Tenure of Farms
2002
5-4

Table 5.2A- Continued
Number Area
Rent Free 7,276 3,941
Other Single forms of tenure 400 1,808
Not Reported 450 471
Farms operated under more than one form of tenure 31,895 35,165
Fully Owned/Ownerlike Possession and Tenanted 19,026 19,004
Fully Owned/Ownerlike Possession and Leased/Rented 1,854 2,365
Other Combinations 11,015 13,795
Negros Oriental
Number of Farms 137,141 228,833
Farms operated under one form of tenure 114,315 182,070
Fully Owned 50,303 117,608
Held under Certificate of Land Transfer (CLT)/ Certificate
of Land Ownership Award (CLOA) 6,441 8,041
Ownerlike Possession 17,903 19,527
Tenanted 25,772 25,307
Leased/Rented 2,963 3,099
Rent Free 9,489 6,389
Other Single forms of tenure 1,026 1,625
Not Reported 418 474
Farms operated under more than one form of tenure 22,826 47,033
Fully Owned/Ownerlike Possession and Tenanted 8,043 12,391
Fully Owned/Ownerlike Possession and Leased/Rented 2,366 8,992
Other Combinations 12,417 25,650
Siquijor
Number of Farms 13,337 10,932
Farms operated under one form of tenure 8,315 6,406
Fully Owned 3,310 3,165
Held under Certificate of Land Transfer (CLT)/ Certificate
of Land Ownership Award (CLOA) 42 27
Ownerlike Possession 3,192 2,142
Tenanted 1,479 972
Leased/Rented 59 24
Rent Free 221 74
Other Single forms of tenure 12 2
Farms operated under more than one form of tenure 5,022 4,526
Fully Owned/Ownerlike Possession and Tenanted 3,021 2,575
Fully Owned/Ownerlike Possession and Leased/Rented 122 133
Other Combinations 1,879 1,818
Province and Tenure of Farms2002
5-5

Table 5.2B
NUMBER AND AREA OF FARMS BY LEGAL FORM OF ORGANIZATION AND BY PROVINCE
(In hectares)
Number Area
CENTRAL VISAYAS
All Forms 430,043 522,433
Individual 419,060 463,346
Partnership 7,129 11,723
Corporation 894 39,572
Cooperative 1,038 2,960
Other Private Institution 571 815
Government Corporation/Institution 295 579
Others 1,056 3,438
BOHOL
All Forms 123,487 136,613
Individual 120,739 131,611
Partnership 1,604 2,517
Corporation 264 831
Cooperative 340 763
Other Private Institution 165 104
Government Corporation/Institution 53 58
Others 322 730
CEBU
All Forms 156,078 146,056
Individual 151,992 137,165
Partnership 3,291 4,338
Corporation 183 3,191
Cooperative 170 331
Other Private Institution 208 136
Government Corporation/Institution 50 55
Others 184 839
NEGROS ORIENTAL
All Forms 137,141 228,833
Individual 133,075 183,824
Partnership 2,209 4,805
Corporation 444 35,548
Cooperative 509 1,824
Other Private Institution 189 567
Government Corporation/Institution 192 466
Others 523 1,799
Province2002
2002
5-6

Table 5.2B- Continued
Number Area
SIQUIJOR
All Forms 13,337 10,932
Individual 13,254 10,745
Partnership 25 63
Corporation 3 3
Cooperative 19 42
Other Private Institution 9 8
Government Corporation/Institution - -
Others 27 72
Note: Details may not add up to totals due to rounding.
Data are tabulated by residence of farm operator.
Excludes parcel with area size equal to 0.001 hectare and not reported.
Source: 2002 Census of Agriculture, Philippine Statistics Authority
Province2002
5-7

Table 5.3
PALAY PRODUCTION AND AREA HARVESTED BY PROVINCE
REGION VII: 2013-2017
(Production in metric tons; Area harvested in hectares)
2013 2014 2015 2016 2017
REGION VIIa/
Production 347,697 338,822 336,194 231,982 325,209
Irrigated 223,090 215,066 217,166 166,024 216,966
Rainfed 124,607 123,756 119,028 65,958 108,243
Area Harvested 106,191 104,288 102,427 80,153 100,830
Irrigated 60,505 59,221 59,058 51,757 61,516
Rainfed 45,686 45,067 43,369 28,396 39,314
Bohol
Production
Irrigated 145,861 145,083 145,601 104,476 143,303
Rainfed 110,544 109,970 107,215 56,527 95,425
Area Harvested
Irrigated 37,592 37,728 37,205 31,429 38,613
Rainfed 40,165 39,402 38,055 23,977 33,976
Cebu
Production
Irrigated 16,493 15,695 13,763 13,135 13,786
Rainfed 1,167 1,070 528 411 728
Area Harvested
Irrigated 4,754 4,578 4,189 4,016 4,047
Rainfed 592 547 291 192 331
Negros Oriental
Production
Irrigated 58,457 52,089 55,262 46,724 57,501
Rainfed 12,716 12,523 11,131 9,020 11,804
Area Harvested
Irrigated 17,549 16,315 16,993 15,820 18,246
Rainfed 4,857 5,036 4,959 4,227 4,893
Siquijor
Production
Irrigated 2,279 2,199 2,540 1,689 2,376
Rainfed 180 193 154 0 286
Area Harvested
Irrigated 610 600 671 492 610
Rainfed 72 82 64 0 114
Source: Philippine Statistics Authority
Province
5-8

Irrigated
Rainfed
Production
215,066 217,166166,024
216,966
123,756 119,02865,958
108,243
2014 2015 2016 2017
Figure 5.1 Palay Production by Farm Type in Central Visayas: 2014-2017
Irrigated Rainfed
-
50,000
100,000
150,000
200,000
250,000
300,000
350,000
2014 2015 2016 2017
Figure 5.2 Palay Production and Area Harvested in Central Visayas: 2014-2017
Production Area Harvested
5-9

Table 5.4
CORN PRODUCTION AND AREA HARVESTED BY PROVINCE
REGION VII: 2013-2017
(Production in metric tons; Area harvested in hectares)
2013 2014 2015 2016 2017
REGION VII
Production
White 170,026 162,158 148,672 154,614 143,565
Yellow 3,199 2,039 1,379 2,115 2,905
Area Harvested
White 196,995 192,422 186,858 173,691 163,086
Yellow 946 667 438 576 681
Bohol
Production
White 12,193 11,708 11,888 11,732 10,722
Yellow 510 655 16 4 42
Area Harvested
White 13,641 13,672 13,046 12,569 12,408
Yellow 150 197 5 2 15
Cebu
Production
White 89,323 85,933 83,449 82,817 75,892
Yellow 1,736 584 851 1,529 2,317
Area Harvested
White 109,662 106,505 103,503 92,304 85,185
Yellow 460 189 209 277 428
Negros Oriental
Production
White 63,253 59,779 48,215 55,268 51,712
Yellow 696 797 503 582 546
Area Harvested
White 67,498 66,254 64,236 62,872 59,426
Yellow 257 280 221 297 238
Province
5-10

Table 5.4- Continued
2013 2014 2015 2016 2017
Siquijor
Production
White 5,257 4,738 5,120 4,797 5,239
Yellow 257 3 9 0 0
Area Harvested
White 6,194 5,991 6,073 5,946 6,067
Yellow 79 1 3 0 0
.. Data not available
Source: Philippine Statistics Authority
Province
5-11

Table 5.5
VOLUME OF PRODUCTION OF LIVESTOCK AND POULTRY BY KIND AND PROVINCE
CENTRAL VISAYAS: 2013-2017
(In metric tons)
2013 2014 2015 2016 2017
CENTRAL VISAYAS
Carabao 6,818 6,736 6,894 7,472 7,976
Cattle 24,533 24,474 24,063 24,784 25,229
Hog 156,328 156,769 163,531 175,105 192,199
Goat 9,014 9,006 9,233 9,305 9,376
Chicken 88,333 92,214 97,616 99,743 104,845
Chicken Egg 38,600 33,413 41,648 46,304 48,568
Duck 228 242 238 251 266
Duck Egg 362 338 342 351 339
Bohol
Carabao 2,575 2,666 2,769 2,954 3,195
Cattle 6,210 6,372 6,200 6,245 6,968
Hog 40,833 41,868 43,928 46,869 50,095
Goat 616 667 720 795 811
Chicken 20,815 23,464 25,304 26,226 28,477
Chicken Egg 4,486 5,243 5,932 5,804 6,360
Duck 31 34 28 22 31
Duck Egg 71 79 98 98 78
Cebu
Carabao 2,171 2,017 2,011 1,952 2,083
Cattle 12,561 12,491 12,188 11,932 11,637
Hog 81,424 79,888 83,367 88,896 97,658
Goat 5,290 5,331 5,363 5,382 5,308
Chicken 51,537 52,721 56,058 57,306 60,967
Chicken Egg 32,009 25,815 33,422 38,228 39,656
Duck 48 45 44 44 48
Duck Egg 13 5 5 6 10
Negros Oriental
Carabao 2,061 2,041 2,094 2,559 2,685
Cattle 4,849 4,720 4,832 5,772 5,822
Hog 32,280 32,815 33,798 36,340 40,886
Goat 2,922 2,817 2,945 2,937 3,047
Chicken 15,412 15,434 15,407 15,367 14,414
Chicken Egg 1,902 2,075 1,984 1,970 2,178
Duck 148 162 165 184 186
Duck Egg 277 254 239 247 250
Siquijor
Carabao 11 12 20 7 13
Cattle 913 891 842 834 803
Hog 1,791 2,198 2,438 3,000 3,560
Goat 186 191 205 190 209
Chicken 569 596 847 845 987
Chicken Egg 202 280 311 303 374
Duck 1 1 1 1 1
Duck Egg 0 0 0 0 0
0 = less than 0.50
Source: Philippine Statistics Authority
Province/Kind
5-12

Table 5.5
INVENTORY OF LIVESTOCK AND POULTRY BY KIND, TYPE OF FARM AND PROVINCE
CENTRAL VISAYAS: As of January 1, 2014-2017
(Number of Heads/Birds)
Total Backyard farm Commercial farm
CENTRAL VISAYAS
Carabao 174,501 173,953 548
Cattle 274,280 271,244 3,036
Hog 898,921 674,765 224,156
Goat 495,185 489,191 5,994
Chicken 11,735,672 .. ..
Duck 148,929 140,639 8,290
Bohol
Carabao 67,383 66,883 500
Cattle 75,693 74,527 1,166
Hog 274,543 230,015 44,528
Goat 77,328 76,985 343
Chicken 2,827,917 .. ..
Duck 26,607 26,074 533
Cebu
Carabao 47,098 47,098 ..
Cattle 113,106 112,525 581
Hog 385,190 227,410 157,780
Goat 224,660 220,460 4,200
Chicken 6,268,225 .. ..
Duck 14,414 14,414 ..
Negros Oriental
Carabao 59,199 59,151 48
Cattle 66,007 64,718 1,289
Hog 198,794 177,316 21,478
Goat 172,957 171,506 1,451
Chicken 2,151,578 .. ..
Duck 107,003 99,246 7,757
Siquijor
Carabao 821 821 ..
Cattle 19,474 19,474 ..
Hog 40,394 40,024 370
Goat 20,240 20,240 ..
Chicken 487,952 .. ..
Duck 905 905 ..
.. Data not available
Source: Philippine Statistics Authority
2014
Province/Kind
5-13

Table 5.5- Continued
Total Backyard farm Commercial farm
CENTRAL VISAYAS
Carabao 177,952 177,403 549
Cattle 273,132 270,125 3,007
Hog 939,817 702,096 237,721
Goat 490,848 484,392 6,456
Chicken 12,739,410 .. ..
Duck 143,430 133,724 9,706
Bohol
Carabao 68,522 68,014 508
Cattle 74,249 73,138 1,111
Hog 284,851 239,125 45,726
Goat 79,261 78,655 606
Chicken 3,076,710 .. ..
Duck 26,199 24,184 2,015
Cebu
Carabao 47,722 47,722 ..
Cattle 113,360 112,648 712
Hog 406,896 238,981 167,915
Goat 221,256 216,900 4,356
Chicken 6,938,874 .. ..
Duck 15,944 15,944 ..
Negros Oriental
Carabao 60,864 60,823 41
Cattle 66,369 65,185 1,184
Hog 207,629 184,060 23,569
Goat 169,907 168,413 1,494
Chicken 2,206,841 .. ..
Duck 100,378 92,687 7,691
Siquijor
Carabao 844 844 ..
Cattle 19,154 19,154 ..
Hog 40,441 39,930 511
Goat 20,424 20,424 ..
Chicken 516,985 .. ..
Duck 909 909 ..
Province/Kind
2015
5-14

Table 5.5- Continued
Total Backyard farm Commercial farm
CENTRAL VISAYAS
Carabao 181,531 181,011 520
Cattle 274,265 271,276 2,989
Hog 956,692 746,312 210,380
Goat 493,415 487,378 6,037
Chicken 13,037,027 .. ..
Duck 144,698 135,672 9,026
Bohol
Carabao 69,576 69,092 484
Cattle 73,476 72,349 1,127
Hog 306,292 261,346 44,946
Goat 82,143 81,624 519
Chicken 3,495,644 .. ..
Duck 30,828 29,470 1,358
Cebu
Carabao 48,414 48,414 ..
Cattle 114,108 113,353 755
Hog 385,336 246,101 139,235
Goat 222,750 218,704 4,046
Chicken 7,127,770 .. ..
Duck 17,432 17,432 ..
Negros Oriental
Carabao 62,664 62,628 36
Cattle 67,087 65,980 1,107
Hog 221,993 196,341 25,652
Goat 168,474 167,002 1,472
Chicken 1,821,282 .. ..
Duck 95,522 87,854 7,668
Siquijor
Carabao 877 877 ..
Cattle 19,594 19,594 ..
Hog 43,071 43,071 547
Goat 20,048 20,048 ..
Chicken 592,331 .. ..
Duck 916 916 ..
Province/Kind
2016
5-15

Table 5.5- Continued
Total Backyard farm Commercial farm
CENTRAL VISAYAS
Carabao 183,676 183,113 563
Cattle 275,012 271,954 3,058
Hog 1,012,405 780,509 231,896
Goat 500,586 494,564 6,022
Chicken 14,168,982 .. ..
Duck 152,034 143,212 8,822
Bohol
Carabao 70,057 69,583 474
Cattle 74,236 72,923 1,313
Hog 312,288 261,679 50,609
Goat 82,907 82,360 547
Chicken 3,494,575 .. ..
Duck 36,241 34,999 1,242
Cebu
Carabao 49,213 49,213 ..
Cattle 116,019 115,310 709
Hog 412,361 256,856 155,505
Goat 224,463 220,440 4,023
Chicken 8,122,380 .. ..
Duck 19,047 19,047 ..
Negros Oriental
Carabao 63,474 63,385 89
Cattle 65,103 64,067 1,036
Hog 243,301 218,003 25,298
Goat 171,524 170,072 1,452
Chicken 1,956,316 .. ..
Duck 95,690 88,110 7,580
Siquijor
Carabao 932 932 ..
Cattle 19,654 19,654 ..
Hog 44,455 43,971 484
Goat 21,692 21,692 ..
Chicken 595,711 .. ..
Duck 1,056 1,056 ..
Province/Kind
2017
5-16

Table 5.7
LIVESTOCK: ANIMALS SLAUGHTERED IN SLAUGHTERHOUSES BY ANIMAL TYPE AND PROVINCE
CENTRAL VISAYAS: 2013-2017
(In heads)
2013 2014 2015 2016 2017
CENTRAL VISAYAS
Carabao 7,750 8,040 7,115 7,087 9,189
Cattle 54,650 52,656 51,738 54,633 59,967
Goat 45,221 49,608 48,345 52,403 47,897
Swine 889,416 828,573 879,853 1,052,472 1,160,980
Bohol
Carabao 1,910 2,354 2,457 2,220 2,377
Cattle 11,596 11,952 12,672 12,591 13,436
Goat 416 348 102 237 213
Swine 94,647 97,108 100,315 108,185 116,824
Cebu
Carabao 5,547 5,327 4,068 4,370 6,245
Cattle 31,430 28,470 26,278 29,094 32,558
Goat 37,767 40,815 40,237 44,105 38,920
Swine 675,069 608,586 654,897 804,026 881,597
Negros Oriental
Carabao 289 359 585 497 567
Cattle 10,189 10,767 11,306 11,391 12,265
Goat 7,036 8,445 8,006 8,061 8,761
Swine 113,218 116,397 117,456 133,310 154,614
Siquijor
Carabao 4 .. 5 .. ..
Cattle 1,435 1,467 1,482 1,557 1,708
Goat 2 .. .. .. 3
Swine 6,482 6,482 7,185 6,951 7,945
.. Data not available
Source: Philippine Statistics Authority
Region/ Province/
Animal Type
181,531
274,265
956,692
493,415
183,676
275,012
1,012,405
500,586
Carabao Cattle Hog Goat
Figure 5.3 INVENTORY OF LIVESTOCK BY KINDCENTRAL VISAYAS: 2016-2017
2016 2017
5-17

INVENTORY OF POULTRY BY KIND
Chicken
Duck11,735,672
12,739,410 13,037,027
14,168,982
2014 2015 2016 2017
Figure 5.4 INVENTORY OF POULTRY BY KINDCENTRAL VISAYAS: 2014-2017
Chicken
148,929
143,430
144,698
152,034
2014 2015 2016 2017
Duck
5-18

Table 5.8
FISH PRODUCTION BY TYPE OF PRODUCT AND PROVINCE
CENTRAL VISARAYS: 2013-2017
(In metric tons)
Marine Inland
Central Visayas
2013 226,630.52 40,379.36 51,938.36 174.64 134,138.16
2014 193,906.21 32,090.31 48,609.27 222.93 112,983.70
2015 186,048.70 32,246.21 48,317.82 189.67 105,295.00
2016 184,072.85 30,453.91 55,336.65 170.97 98,111.32
2017 151,497.24 17,310.80 59,151.07 156.92 74,878.45
Bohol
2013 132,003.02 1,256.54 12,958.84 76.16 117,711.48
2014 114,863.10 1,225.71 10,987.80 74.73 102,574.86
2015 103,957.20 1,381.30 10,991.15 61.82 91,522.93
2016 100,966.53 2,460.09 13,466.91 52.32 84,987.21
2017 73,471.43 1,510.04 14,293.17 50.87 57,617.35
Cebu
2013 76,563.76 32,879.55 30,788.14 62.00 12,834.07
2014 61,959.85 24,360.06 30,150.41 115.53 7,333.85
2015 66,720.45 24,998.90 30,223.43 106.85 11,391.27
2016 67,149.24 22,203.68 33,953.04 72.04 10,920.48
2017 62,655.99 10,904.63 36,897.19 61.46 14,792.71
Negros Oriental
2013 14,339.94 6,243.27 4,518.18 36.48 3,542.01
2014 13,477.30 6,504.54 3,914.19 32.67 3,025.90
2015 11,847.97 5,866.01 3,611.60 21.00 2,349.36
2016 12,182.74 5,790.14 4,159.64 46.58 2,186.38
2017 11,794.76 4,896.13 4,408.92 44.59 2,445.12
Siquijor
2013 3,723.80 . 3,673.20 . 50.60
2014 3,605.93 . 3,556.87 . 49.06
2015 3,523.08 . 3,491.64 . 31.44
2016 3,774.41 . 3,757.06 0.06 17.29
2017 3,575.08 . 3,551.79 . 23.29
Source: Philippine Statistics Authority
Province / Year TotalCommercial
Fishing
Municipal FishingAquaculture
5-19

Commercial
Municipal
Aquaculture
0
20,000
40,000
60,000
80,000
100,000
120,000
140,000
160,000
2013 2014 2015 2016 2017
Figure 5.6 Fish Production by Type of Productionin Central Visayas: 2013-2017
Commercial Municipal Aquaculture
0
50,000
100,000
150,000
200,000
250,000
2013 2014 2015 2016 2017
Pro
ductio
n (
in m
etr
ic to
ns)
Figure 5.5 Fish production in Central Visayas2013-2017
5-20

Table 5.9
AQUACULTURE PRODUCTION BY TYPE OF CULTURE AND PROVINCE
Region VII: 2013-2017
(In metric tons)
2013 2014 2015
Region VII 134,138.16 112,983.70 105,295.00
Brackishwater Fishpond 8,110.84 6,150.99 6,950.39
Brackishwater Fishpen 0.20 - -
Brackishwater Cage 1.48 0.85 0.80
Freshwater Fishpond 128.19 120.31 104.43
Freshwater Pen 0.15 0.06 0.14
Freshwater Cage 8.50 6.72 4.31
Marine Pen 35.66 3.80 4.35
Marine Cage 778.39 784.34 731.24
Oyster 815.72 971.31 910.78
Mussel .. .. ..
Seaweed 124,247.38 104,943.47 96,588.56
RiceFish - 0.15 -
Small Farm Reservoir 11.65 1.70 -
Bohol 117,711.48 102,574.86 91,522.93
Brackishwater Fishpond 3,128.17 1,896.86 2,410.88
Brackishwater Fishpen - - -
Brackishwater Cage - - 0.80
Freshwater Fishpond 70.23 56.28 53.61
Freshwater Pen 0.15 0.06 0.14
Freshwater Cage 2.05 1.65 0.89
Marine Pen 13.32 2.34 3.28
Marine Cage 125.47 136.64 98.25
Oyster 313.79 726.38 582.60
Mussel .. .. ..
Seaweed 114,046.65 99,752.95 88,372.48
RiceFish - - -
Small Farm Reservoir 11.65 1.70 -
Cebu 12,834.07 7,333.85 11,391.27
Brackishwater Fishpond 2,751.95 2,233.51 2,991.73
Brackishwater Fishpen - - -
Brackishwater Cage - - -
Freshwater Fishpond 33.01 42.75 34.67
Freshwater Pen - - -
Freshwater Cage 5.63 2.30 1.71
Marine Pen 7.82 1.46 0.87
Type of Culture
5-21

Table 5.9- Continued
2013 2014 2015
Marine Cage 247.07 310.92 396.41
Oyster .. .. ..
Mussel .. .. ..
Seaweed 9,788.59 4,742.91 7,965.88
RiceFish - - -
Small Farm Reservoir - - -
Negros Oriental 3,542.01 3,025.90 2,349.36
Brackishwater Fishpond 2,227.95 2,016.82 1,544.86
Brackishwater Fishpen - - -
Brackishwater Cage 1.48 0.85 -
Freshwater Fishpond 23.51 18.13 12.80
Freshwater Pen - - -
Freshwater Cage 0.82 2.76 1.72
Marine Pen 14.53 - 0.20
Marine Cage 404.52 334.08 236.57
Oyster 501.93 244.92 328.18
Mussel .. .. ..
Seaweed 367.27 408.34 225.03
RiceFish - - -
Small Farm Reservoir - - -
Siquijor 50.60 49.06 31.44
Brackishwater Fishpond 2.76 3.80 2.92
Brackishwater Fishpen 0.20 - -
Brackishwater Cage - - -
Freshwater Fishpond 1.43 3.15 3.35
Freshwater Pen - - -
Freshwater Cage - - -
Marine Pen - - -
Marine Cage 1.33 2.70 -
Oyster .. .. ..
Mussel .. .. ..
Seaweed 44.88 39.26 25.17
RiceFish - 0.15 -
Small Farm Reservoir - - -
Source: Philippine Statistics Authority
Type of Culture
5-22

Table 5.9- Continued
2016 2017
Region VII 98,111.32 74,878.45
Brackishwater Fishpond 8,002.98 8,955.72
Brackishwater Fishpen 5.68 2.40
Brackishwater Cage 0.30 0.43
Freshwater Fishpond 113.46 168.28
Freshwater Pen - -
Freshwater Cage 2.64 9.43
Marine Pen 17.32 7.38
Marine Cage 462.56 295.69
Oyster 768.98 890.16
Mussel .. ..
Seaweed 88,737.40 64,548.96
RiceFish - -
Small Farm Reservoir - -
Bohol 84,987.21 57,617.35
Brackishwater Fishpond 3,068.57 3,162.13
Brackishwater Fishpen 4.40 2.40
Brackishwater Cage - 0.43
Freshwater Fishpond 42.09 38.77
Freshwater Pen - -
Freshwater Cage 1.87 8.88
Marine Pen 15.38 3.30
Marine Cage 99.81 93.63
Oyster 444.72 432.81
Mussel .. ..
Seaweed 81,310.37 53,875.00
RiceFish - -
Small Farm Reservoir - -
Cebu 10,920.48 14,792.71
Brackishwater Fishpond 3,625.57 4,579.46
Brackishwater Fishpen - -
Brackishwater Cage - -
Freshwater Fishpond 48.40 99.00
Freshwater Pen - -
Freshwater Cage 0.78 0.55
Marine Pen 1.94 3.12
Type of Culture
5-23

Table 5.9- Continued
2016 2017
Marine Cage 115.71 91.18
Oyster .. ..
Mussel .. ..
Seaweed 7,128.08 10,019.40
RiceFish - -
Small Farm Reservoir - -
Negros Oriental 2,186.38 2,445.12
Brackishwater Fishpond 1,306.86 1,212.02
Brackishwater Fishpen - -
Brackishwater Cage - -
Freshwater Fishpond 20.35 27.38
Freshwater Pen - -
Freshwater Cage - -
Marine Pen - -
Marine Cage 245.50 108.92
Oyster 324.27 457.35
Mussel .. ..
Seaweed 289.40 639.45
RiceFish - -
Small Farm Reservoir - -
Siquijor 17.29 23.29
Brackishwater Fishpond 1.98 2.10
Brackishwater Fishpen 1.28 -
Brackishwater Cage 0.30 -
Freshwater Fishpond 2.62 3.13
Freshwater Pen - -
Freshwater Cage - -
Marine Pen - 0.97
Marine Cage 1.56 1.97
Oyster .. ..
Mussel .. ..
Seaweed 9.55 15.12
RiceFish - -
Small Farm Reservoir - -
Type of Culture
5-24

Chapter 6
ESTABLISHMENT CHARACTERISTICS:
INDUSTRIAL SECTOR
Regional and provincial data on the industries and investments serve as a gauge of the extent of the area’s attractiveness to and capability to absorb entrepreneurial ventures. An analysis of the data on the growth of industries and the stock and flow of investments shows the enabling factors
that provide or enhance the comparative advantages enjoyed by industries and investors in the area. On the other hand, the data can give indications of the limiting factors that hinder the entry, growth and movement of industries and investments. With the data providing signals, the concerned
governmental instrumentalities can formulate policies, enforce regulations and undertake infrastructure programs and other forms of support to assist organizations and prospective investors.
Armed with the data, key decision-makers in the government and the private sectors can also forge alliances to improve the business climate and environment. Ultimately, the policies and measures implemented as well as the alliances can serve as instruments for achieving growth and providing
employment opportunities, among others, to the region’s labor force.
This chapter presents regional and provincial data, where available, on the number of establishments by major industry division, the number, floor area and value of private building construction, number of projects, total project cost and employment generated in the region. The
data sources are the Philippine Statistics Authority for the establishments and Board of Investment of the Department of Trade and Industry (DTI) for the investments statistics.
Highlights
• In 2017, Cental Visayas accounted a total of 15,069 residential buildings as compared to 19,941 in 2016.
• The number of building permit applications filed between 2016 and 2015 grew by 55.5 percent. Besides, floor area and value of construction covered by the building permit applications upturn by 63.1 percent and 74.1 percent, respectively.
• In 2016, there were 24,845 business names registered with the Board of Invenstments (BOI) of Department of Trade and Industry in Central Visayas which is 9.2 percent more than registrations in the past year.
• Granting a reversal of 42.3 percent in 2016 bringing a total of 15 projects, the corresponding total project cost of ₱27,317,357,000 increased with employment generation of 1,554.

ContentsHighlights 6-1
STATISTICAL TABLES:
Table 6.1 Number, Floor area and Value of New Building Constructions by Province by
Type: 2013-2017 …………………………………………………….....……………….…………….. 6-3
Table 6.2 Number of Approved Business Name Registration by Province: 2012-2016 …...…. 6-6
Table 6.3 Number of Registered Projects by Province in Central Visayas: 2012-2016 …...…. 6-7
FIGURES:
Figure 6.1 Floor area of New Building Constructions by Province and Type
Central Visayas: 2013-2017 …....……………………………………………………………….….. 6-6
Figure 6.2 Distribution of Business Name Registration by Province
Central Visayas: 2016 ……………………………………………………………………………....... 6-6
6-2

Table 6.1
NUMBER, FLOOR AREA AND VALUE OF NEW BUILDING CONSTRUCTIONS BY PROVINCE BY TYPE
2013-2017
(Number refers to building permits issued; Floor area in square meter; Value in thousand pesos)
Number Floor Area Value Number Floor Area Value
2013
CENTRAL VISAYAS 13,168 2,344,303 20,298,400 9,754 1,056,718 7,795,171
Bohol 3,086 311,486 2,138,952 2,507 223,419 1,401,785
Cebu 5,804 1,743,232 16,388,988 4,207 647,621 5,368,274
Negros Oriental 4,122 273,623 1,623,225 2,946 175,174 932,561
Siquijor 156 15,962 147,235 94 10,504 92,549
2014
CENTRAL VISAYAS 12,440 2,287,896 24,380,663 8,599 1,280,786 13,411,058
Bohol 5,164 352,111 2,575,367 4,283 256,437 1,641,633
Cebu 3,681 1,681,122 19,985,093 2,488 872,862 10,802,492
Negros Oriental 3,465 236,336 1,655,965 1,745 141,148 878,845
Siquijor 130 18,327 164,237 83 10,339 88,087
2015
CENTRAL VISAYAS 12,824 1,978,143 19,550,449 9,627 1,087,888 8,702,733
Bohol 4,651 354,321 2,960,412 3,764 263,134 1,960,132
Cebu 4,772 1,308,116 13,213,858 3,646 656,571 5,677,939
Negros Oriental 3,278 301,737 3,221,896 2,148 160,425 994,294
Siquijor 123 13,969 154,283 69 7,758 70,367
2016
CENTRAL VISAYAS 19,941 3,225,731 34,034,335 17,122 2,163,711 21,302,827
Bohol 7,183 455,396 4,079,425 6,527 314,909 2,249,743
Cebu 7,469 2,385,270 24,682,174 5,955 1,582,472 15,791,632
Negros Oriental 5,140 360,100 5,014,073 4,551 255,346 3,161,931
Siquijor 149 24,965 258,663 89 10,984 99,522
2017
CENTRAL VISAYAS 15,069 2,993,195 30,968,940 11,873 1,459,646 14,229,714
Bohol 4,432 452,380 4,237,672 3,758 267,756 2,091,303
Cebu 6,618 2,233,458 24,339,914 4,761 996,103 10,885,662
Negros Oriental 3,850 281,405 2,163,885 3,250 182,445 1,131,619
Siquijor 169 25,952 227,469 104 13,342 121,131
Note: Details may not add up to total due to rounding
Source: Philippine Statistics Authority
YEAR/PROVINCE
Total Residential
6-3

Table 6.1 - Continued
Number Floor Area Value Number Floor Area Value
2013
CENTRAL VISAYAS 1,751 1,256,395 11,507,743 357 31,190 255,058
Bohol 386 84,967 664,191 36 3,100 19,364
Cebu 930 1,074,047 10,202,613 154 21,564 203,360
Negros Oriental 385 91,923 593,060 167 6,526 32,332
Siquijor 50 5,458 47,877 - - -
2014
CENTRAL VISAYAS 1,176 964,103 9,668,632 589 43,007 318,320
Bohol 342 87,359 804,900 185 8,315 42,845
Cebu 560 788,793 8,235,523 126 19,467 155,870
Negros Oriental 247 80,605 570,101 268 14,583 114,901
Siquijor 27 7,346 58,107 10 642 4,702
2015
CENTRAL VISAYAS 1,328 866,237 9,757,887 258 24,018 172,055
Bohol 407 85,352 882,001 79 5,835 37,000
Cebu 640 638,628 6,757,031 83 12,917 108,615
Negros Oriental 245 136,709 2,054,728 89 4,603 21,266
Siquijor 36 5,548 64,128 7 663 5,174
2016
CENTRAL VISAYAS 1,776 1,028,084 9,592,808 184 33,936 233,957
Bohol 454 135,010 1,496,947 54 5,477 50,899
Cebu 995 777,702 7,959,826 58 25,096 153,884
Negros Oriental 275 101,787 66 2,967 25,637
Siquijor 52 13,585 136,035 6 396 3,537
2017
CENTRAL VISAYAS 2,275 1,496,635 14,373,271 110 37,699 337,876
Bohol 538 180,427 2,066,971 36 4,262 42,321
Cebu 1,272 1,208,264 11,358,342 46 29,811 179,135
Negros Oriental 406 95,596 845,427 25 3,364 114,785
Siquijor 59 12,348 102,531 3 262 1,635
Non-residential Additions
YEAR/PROVINCE
6-4

Table 6.1 - Continued
Number Value Number Value Number Value
2013
CENTRAL VISAYAS 1,306 740,428 4 2,687 53 39,513
Bohol 157 53,611 - - 12 7,821
Cebu 513 614,738 4 2,687 19 22,763
Negros Oriental 624 65,270 - - 20 4,687
Siquijor 12 6,808 - - 2 4,241
2014
CENTRAL VISAYAS 2,076 982,652 5 499 88 63,876
Bohol 354 85,987 4 459 9 5,937
Cebu 507 791,206 - - 44 40,740
Negros Oriental 1,205 92,117 1 40 27 11,099
Siquijor 10 13,340 - - 8 6,098
2015
CENTRAL VISAYAS 1,611 917,774 14 643 129 95,368
Bohol 401 81,279 - - 11 5,617
Cebu 403 670,272 1 50 84 82,614
Negros Oriental 796 151,608 - - 29 5,553
Siquijor 11 14,614 - - 5 1,585
2016
CENTRAL VISAYAS 859 1,135,480 1 50 213 139,462
Bohol 148 281,836 1 50 23 12,515
Cebu 461 776,833 - - 140 109,437
Negros Oriental 248 57,241 - - 45 16,745
Siquijor 2 19,570 - - 5 766
2017
CENTRAL VISAYAS 860 2,048,747 28 1,938 290 400,840
Bohol 102 38,012 - - 22 17,014
Cebu 586 1,936,509 28 1,938 217 317,826
Negros Oriental 169 72,054 - - 47 65,632
Siquijor 3 2,172 - - 4 368
Alterations/Repairs Demolition Street Furniture
YEAR/PROVINCE
6-5

Table 6.2
NUMBER OF APPROVED BUSINESS NAME REGISTRATION (BNR) BY PROVINCE
2012-2016
Province 2012 2013 2014 2015 2016
CENTRAL VISAYAS 20,238 15,704 21,880 22,758 24,845
Bohol 3,345 3,123 3,682 3,544 4,151
Cebu 12,445 9,366 13,770 14,920 15,588
Negros Oriental 3,969 2,733 4,085 3,997 4,429
Siquijor 479 482 343 297 677
Source: Board of Investments
-
500,000
1,000,000
1,500,000
2,000,000
2,500,000
2013 2014 2015 2016 2017
In s
qu
are
me
ters
Figure 6.1 Floor Area of New Building Construction by TypeCentral Visayas: 2017
Residential Non-residential
Cebu 62.74%
Negros Oriental 17.83%
Bohol 16.71%
Siquijor 2.72%
Figure 6.2 Distribution of Business Name RegistrationCentral Visayas: 2016
6-6

Table 6.3
NUMBER OF REGISTERED PROJECTS IN CENTRAL VISAYAS BY PROVINCE
2012-2016
2012 2013 2014 2015 2016
CENTRAL VISAYAS
Number of Projects 24 18 12 26 15
Total Project Cost ('000) 44,918,074 7,919,679 9,313,626 25,618,899 27,317,357
Employment Generated 2,058 3,382 1,415 3,545 1,554
Bohol
Number of Projects 1 2 1 4 -
Total Project Cost ('000) 1,436,705 1,014,191 70,000 1,327,700 -
Employment Generated 21 70 65 1,999 -
Cebu
Number of Projects 19 14 9 18 15
Total Project Cost ('000) 43,388,773 5,034,758 4,144,774 21,132,549 27,317,357
Employment Generated 1,983 3,056 1,266 402 1,554
Negros Oriental
Number of Projects 3 2 1 4 -
Total Project Cost ('000) 39,578 1,870,730 4,632,405 3,158,650 -
Employment Generated 3 256 63 1,144 -
Siquijor
Number of Projects 1 - 1 - -
Total Project Cost ('000) 53,018 466,447 - -
Employment Generated 51 21 - -
Source: Board of Investments
Province/ Particulars
6-7

Chapter 7
TRADE
Data on trade reflect the extent of the inward and outward flow of commodities in an area. The data likewise indicate the commodities that go into the export and import markets or are used for domestic or foreign consumption. Proprietors and the managers and executives of private businesses can use the data in identifying markets with high potentials and in making
decisions on which commodities to produce and what markets to penetrate. Leaders and implementers in the government, on the other hand, can conceptualize and initiate programs,
projects, services, and facilities designed to further stimulate trading activities in high yielding areas and/or in those sectors where a demand and supply gap exists. The data are also useful in identifying areas and products that can be improved/promoted for global competitiveness.
This chapter presents data on the volume and value of commodities handled by
the different mode of transports in the region including water, air and rail transports. The chapter also presents the value of imports and exports handle by the major ports in Central Visayas. The
Philippine Statistics Authority is the source of the data that are processed from administrative reporting forms by agencies in government involved in the collection of customs and tariff charges or administration of ports.
Highlights
• Value of commodity outflow in 2014 from Central Visayas through air transport decreased by 12.7 percent and 0.1 percent decrease in volume compared to 2013. On the other hand, the value of commodity inflow to Central Visayas increased by 1.2 percent in 2013
and 2.8 percent increase in volume.
• In 2014, the value of export in Central Visayas had increased by 24.7 percent compared in 2013. Meanwhile, the value of import had also increased by 34.0 percent.

ContentsHighlights 7-1
Statistical Tables
Table 7.1 Value and Volume of Air Trade by Commodity in Central Visayas
2009-2014 …………………………………………………………………………………... 7-3
Table 7.2 Value of Commodity Flow in Central Visayas by Mode of Transport
2009-2014 ………………………………………………………………………………...... 7-5
Table 7.3 Volume of Commodity Flow in Central Visayas by Mode of
Transport, 2009-2014 …………………………………………………………...……… 7-7
Table 7.4 Value of Exports and Imports by Port in Central Visayas: 2011-2014 ..… 7-9
Table 7.5 Quantity and Value of Domestic Trade by Region and Mode of
Transport, 2014-2017 .………………………………………………………………….. 7-11
Table 7.6 Total Value of Domestic Trade Balances in the Philippines by Mode
of Transport and Region, 2014-2017……………………………………………… 7-14
7-2

Table 7.1
Volume Value Volume Value
2009 ALL Commodities 7,924 403,196 2,903 117,942
0 Food and Live Animals 830 45,188 1,042 39,301
1 Beverage and Tobacco 12 776 4 163
2 Crude Materials, Inedible except Fuels 91 3,582 187 1,302
3 Mineral Fuels, Lubricants and Related Materials 4 222 - 14
4 Animal and Vegetable Oils, Fats and Waxes - 4 - 1
5 Chemicals and Related Products, (NES) 2,280 62,665 41 3,276
6 Manufactured Goods Classified Chiefly by Materials 498 26,230 189 12,720
7 Machinery and Transport Equipment 1,462 126,918 270 20,263
8 Miscellaneous manufactured Articles 2,609 126,321 517 18,304
9 Commodities and Transactions NES in the PSCC 138 11,290 652 22,598
2010 ALL Commodities 9,011 441,213 2,671 91,273
0 Food and Live Animals 889 50,092 835 20,880
1 Beverage and Tobacco 15 1,710 3 45
2 Crude Materials, Inedible except Fuels 142 4,159 113 721
3 Mineral Fuels, Lubricants and Related Materials 4 618 - 25
4 Animal and Vegetable Oils, Fats and Waxes 1 107 - -
5 Chemicals and Related Products, (NES) 2,383 66,891 57 3,668
6 Manufactured Goods Classified Chiefly by Materials 602 29,840 63 4,878
7 Machinery and Transport Equipment 1,634 149,170 151 14,667
8 Miscellaneous manufactured Articles 3,081 123,294 783 16,816
9 Commodities and Transactions NES in the PSCC 260 15,333 667 29,574
2011 ALL Commodities 7,222 462,685 1,919 79,968
0 Food and Live Animals 1,000 44,656 680 25,231
1 Beverage and Tobacco 20 1,209 1 11
2 Crude Materials, Inedible except Fuels 100 2,757 150 724
3 Mineral Fuels, Lubricants and Related Materials 6 635 - 1
4 Animal and Vegetable Oils, Fats and Waxes - - - -
5 Chemicals and Related Products, (NES) 1,585 55,248 21 2,457
6 Manufactured Goods Classified Chiefly by Materials 404 46,915 18 924
7 Machinery and Transport Equipment 1,971 185,146 66 4,407
8 Miscellaneous manufactured Articles 1,696 106,830 424 12,036
9 Commodities and Transactions NES in the PSCC 438 19,289 559 34,178
Note: Details may not add up to total due to rounding
Source: Commodity Flow in the Philippines; Philippine Statistics Authority
http://psa.gov.ph/statistics/administrative-based/domestic-trade-statistics
Commodity
CodeCommodity Item
Inflow Outflow
VOLUME AND VALUE OF AIR TRADE BY COMMODITY (1 DIGIT LEVEL CLASSIFICATION)
CENTRAL VISAYAS
2009-2014
(Volume on Kilograms; Value in Pesos)
7-3

Table 7.1 - Continued
Volume Value Volume Value
2012 ALL Commodities 8,491 401,800 2,071 76,397
0 Food and Live Animals 1,073 36,151 663 21,447
1 Beverage and Tobacco 47 1,395 - 2
2 Crude Materials, Inedible except Fuels 90 2,555 156 935
3 Mineral Fuels, Lubricants and Related Materials 13 946 - 20
4 Animal and Vegetable Oils, Fats and Waxes 6 99 - -
5 Chemicals and Related Products, (NES) 2,536 60,106 13 3,027
6 Manufactured Goods Classified Chiefly by Materials 341 30,724 132 642
7 Machinery and Transport Equipment 1,770 140,944 191 3,340
8 Miscellaneous manufactured Articles 2,148 108,667 358 10,475
9 Commodities and Transactions NES in the PSCC 466 20,214 557 36,508
2013 ALL Commodities 9,450 518,919 1,424 70,224
0 Food and Live Animals 1,303 39,868 273 14,314
1 Beverage and Tobacco 34 2,360 2 55
2 Crude Materials, Inedible except Fuels 73 2,933 96 1,313
3 Mineral Fuels, Lubricants and Related Materials 3 311 - 24
4 Animal and Vegetable Oils, Fats and Waxes - - - -
5 Chemicals and Related Products, (NES) 3,080 91,215 18 1,925
6 Manufactured Goods Classified Chiefly by Materials 432 96,851 20 732
7 Machinery and Transport Equipment 1,569 140,673 31 2,595
8 Miscellaneous manufactured Articles 2,718 130,215 205 10,367
9 Commodities and Transactions NES in the PSCC 238 14,492 780 38,899
2014 ALL Commodities 9,718 525,015 1,423 61,318
0 Food and Live Animals 1,346 44,752 333 13,843
1 Beverage and Tobacco 91 5,052 0 7
2 Crude Materials, Inedible except Fuels 77 2,327 196 2,458
3 Mineral Fuels, Lubricants and Related Materials - - - -
4 Animal and Vegetable Oils, Fats and Waxes - - - -
5 Chemicals and Related Products, (NES) 2,893 116,601 16 1,268
6 Manufactured Goods Classified Chiefly by Materials 503 57,498 20 706
7 Machinery and Transport Equipment 1,878 141,037 31 2,207
8 Miscellaneous manufactured Articles 2,718 142,202 175 7,671
9 Commodities and Transactions NES in the PSCC 204 14,786 652 33,046
Commodity
CodeCommodity Item
Inflow Outflow
7-4

Table 7.2
Year Region of Origin and Destination Total Air Water
2011 CENTRAL VISAYAS to other regions 83,285,002 79,968 83,205,034
NCR 5,654,348 72,210 5,582,138
CAR - - -
I - ILOCOS 1226 - 1226
II - CAGAYAN VALLEY - - -
III - CENTRAL LUZON 5 - 5
IV A - CALABARZON 219,527 - 219,527
IV B - MIMAROPA 19,535 65 19,470
V - BICOL 3,153,420 51 3,153,369
VI - WESTERN VISAYAS 5,217,080 1,865 5,215,215
VII - CENTRAL VISAYAS 22,906,773 18 22,906,755
VIII - EASTERN VISAYAS 18,239,203 648 18,238,555
IX - ZAMBOANGA PENINSULA 7,083,889 889 7,083,000
X - NORTHERN MINDANAO 14,007,437 739 14,006,698
XI - DAVAO REGION 1,416,428 3,324 1,413,104
XII - SOCCSKSARGEN 284,921 142 284,779
CARAGA 5,081,195 2 5,081,193
ARMM 15 15 -
2012 CENTRAL VISAYAS to other regions 97,781,204 76,397 97,704,808
NCR 6,032,251 74,823 5,957,428
CAR - - -
I - ILOCOS - - -
II - CAGAYAN VALLEY - - -
III - CENTRAL LUZON - - -
IV A - CALABARZON 16,750 - 16,750
IV B - MIMAROPA 219,334 - 219,334
V - BICOL 3,508,690 39 3,508,651
VI - WESTERN VISAYAS 7,112,089 255 7,111,834
VII - CENTRAL VISAYAS 26,195,190 6 26,195,184
VIII - EASTERN VISAYAS 21,812,732 84 21,812,648
IX - ZAMBOANGA PENINSULA 10,893,491 24 10,893,467
X - NORTHERN MINDANAO 15,140,956 134 15,140,822
XI - DAVAO REGION 1,566,678 987 1,565,691
XII - SOCCSKSARGEN 549,178 37 549,141
CARAGA 4,733,864 7 4,733,857
ARMM 3 3 -
Source: Commodity Flow in the Philippines; Philippine Statistics Authority
http://psa.gov.ph/statistics/administrative-based/domestic-trade-statistics
(Value in Thousand Pesos. Details may not add up to total due to rounding)
VALUE OF COMMODITY FLOW IN CENTRAL VISAYAS BY MODE OF TRANSPORT
2011-2014
7-5

Table 7.2 - Continued
Year Region of Origin and Destination Total Air Water
2013 CENTRAL VISAYAS to other regions 103,087,307 70,224 103,017,082
NCR 7,701,343 60,413 7,640,930
CAR - - -
I - ILOCOS 2,041 - 2,041
II - CAGAYAN VALLEY - - -
III - CENTRAL LUZON - - -
IV A - CALABARZON 7,327 - 7,327
IV B - MIMAROPA 37,585 - 37,585
V - BICOL 2,754,208 102 2,754,106
VI - WESTERN VISAYAS 6,737,752 3,277 6,734,475
VII - CENTRAL VISAYAS 25,835,151 16 25,835,135
VIII - EASTERN VISAYAS 22,778,301 2,553 22,775,748
IX - ZAMBOANGA PENINSULA 11,010,832 317 11,010,515
X - NORTHERN MINDANAO 17,477,078 899 17,476,179
XI - DAVAO REGION 1,676,450 2,469 1,673,981
XII - SOCCSKSARGEN 1,405,677 147 1,405,530
CARAGA 5,651,739 25 5,651,714
ARMM 11,822 7 11,815
2014 CENTRAL VISAYAS to other regions 82,777,882 61,320 82,716,562
NCR 5,541,772 58,629 5,483,143
CAR - - -
I - ILOCOS 3,784 - 3,784
II - CAGAYAN VALLEY 500 - 500
III - CENTRAL LUZON 14,587 - 14,587.00
IV A - CALABARZON 31,393 - 31,393
IV B - MIMAROPA 61,142 - 61,142
V - BICOL 1,506,342 36 1,506,306
VI - WESTERN VISAYAS 5,170,815 917 5,169,898
VII - CENTRAL VISAYAS 24,950,792 5 24,950,787
VIII - EASTERN VISAYAS 15,866,749 857 15,865,892
IX - ZAMBOANGA PENINSULA 8,824,660 133 8,824,527
X - NORTHERN MINDANAO 14,026,513 206 14,026,307
XI - DAVAO REGION 1,404,929 495 1,404,434
XII - SOCCSKSARGEN 422,055 38 422,017
CARAGA 4,933,514 - 4,933,514
ARMM 18,335 4 18,331
7-6

Table 7.3
Year Region of Origin and Destination Total Air
2011 CENTRAL VISAYAS to other regions 1,919 1,919
NCR 1,824 1,824
CAR - -
I - ILOCOS - -
II - CAGAYAN VALLEY - -
III - CENTRAL LUZON - -
IV A - CALABARZON - -
IV B - MIMAROPA - -
V - BICOL 1 1
VI - WESTERN VISAYAS 31 31
VII - CENTRAL VISAYAS - -
VIII - EASTERN VISAYAS 8 8
IX - ZAMBOANGA PENINSULA 7 7
X - NORTHERN MINDANAO 7 7
XI - DAVAO REGION 40 40
XII - SOCCSKSARGEN 1 1
CARAGA - -
ARMM - -
2012 CENTRAL VISAYAS to other regions 2,071 2,071
NCR 2,057 2,057
CAR - -
I - ILOCOS - -
II - CAGAYAN VALLEY - -
III - CENTRAL LUZON - -
IV A - CALABARZON - -
IV B - MIMAROPA - -
V - BICOL 1 1
VI - WESTERN VISAYAS 3 3
VII - CENTRAL VISAYAS - -
VIII - EASTERN VISAYAS 1 1
IX - ZAMBOANGA PENINSULA - -
X - NORTHERN MINDANAO 3 3
XI - DAVAO REGION 5 5
XII - SOCCSKSARGEN - -
CARAGA - -
ARMM - 1
Source: Commodity Flow in the Philippines; Philippine Statistics Authority
http://psa.gov.ph/statistics/administrative-based/domestic-trade-statistics
VOLUME OF COMMODITY FLOW IN CENTRAL VISAYAS BY MODE OF TRANSPORT
2011-2014
(In Kilograms)
7-7

Table 7.3 - Continued
Year Region of Origin and Destination Total Air
2013 CENTRAL VISAYAS to other regions 1,424 1,424
NCR 1,301 1,301
CAR - -
I - ILOCOS - -
II - CAGAYAN VALLEY - -
III - CENTRAL LUZON - -
IV A - CALABARZON - -
IV B - MIMAROPA - -
V - BICOL 1 1
VI - WESTERN VISAYAS 35 35
VII - CENTRAL VISAYAS - -
VIII - EASTERN VISAYAS 34 34
IX - ZAMBOANGA PENINSULA 4 4
X - NORTHERN MINDANAO 12 12
XI - DAVAO REGION 27 27
XII - SOCCSKSARGEN 7 7
CARAGA 1 1
ARMM - -
2014 CENTRAL VISAYAS to other regions 1,423 1,423
NCR 1,373 1,301
CAR - -
I - ILOCOS - -
II - CAGAYAN VALLEY - -
III - CENTRAL LUZON - -
IV A - CALABARZON - -
IV B - MIMAROPA - -
V - BICOL - 1
VI - WESTERN VISAYAS 18 35
VII - CENTRAL VISAYAS - -
VIII - EASTERN VISAYAS 12 34
IX - ZAMBOANGA PENINSULA 1 4
X - NORTHERN MINDANAO 3 12
XI - DAVAO REGION 14 27
XII - SOCCSKSARGEN 1 7
CARAGA - 1
ARMM - -
7-8

Table 7.4
Exports Imports
CENTRAL VISAYAS 2,303,546,401 2,177,755,326
Bohol 202,300 -
Garcia Hernandez 202,300 -
Cebu 2,279,243,880 2,150,188,940
Atlas Consolidated Mining & Dev't Corp Sangi, Toledo City - 6,011
Cebu City 909,844,305 1,162,073,204
Cebu Intrnational Airport 149,818,768 716,350,205
Danao City 11,963,071 37,455
LapuLapu City 752,106 270,086
Ludo & Luym Corp. Cebu City 33,237 512,295
Mactan Export Processing Zone, LapuLapu City 1,204,659,465 270,457,210
Mobil Oil Phils., LapuLapu City - 24,280
Petroleum Philis. Corp., Mandaue City 1,102 445,954
Phil. Sinter Corp. Cebu City 2,162,352 -
Shell Oil Phils., LapuLapu City 9,474 12,240
Negros Oriental 24,100,221 27,566,386
Dumaguete City 23,998,297 27,564,545
Phil-Am Timber Company, Inc., Looc Negros Oriental 101,924 1,841
Exports Imports
CENTRAL VISAYAS 4,333,872,898 2,816,715,823
Bohol 2,439,434 515
Garcia Hernandez 1,909,725 515
Tagbilaran City 529,709 -
Cebu 4,327,014,876 2,797,792,085
Caltex Phils., Inc. LapuLapu City - 199,715
Cebu City 2,151,511,755 1,637,103,233
Cebu Intrnational Airport 226,119,116 811,622,160
Danao City 254 7,591
General Milling Corp. LapuLapu City - 19,653,804
LapuLapu City 14,034 399,003
Ludo & Luym Corp. Cebu City - 660,960
Mactan Export Processing Zone, LapuLapu City 1,949,317,315 299,442,918
Petroleum Philis. Corp., Mandaue City - 175
West Cebu Inductrial Park-SEPZ (NCIP) Balamban 52,402 28,702,526
Negros Oriental 4,418,588 18,923,223
Dumaguete City 3,795,111 18,923,223
Phil-Am Timber Company, Inc., Looc Negros Oriental 623,477 -
Dash (-) - no data
0 - less than $1000
Source: Imports Volume I - Philippine Statistics Authority
Exports Volume II - Philippine Statistics Authority
VALUE OF EXPORTS AND IMPORTS BY PORT
CENTRAL VISAYAS
2011-2014
(F.O.B Value in US Dollar)
Province / Port2011
Province / Port2012
7-9

Table 7.4 - Continued
Exports Imports
CENTRAL VISAYAS 4,361,234,702 2,658,049,213
Bohol 1,121,950 -
Garcia Hernandez 1,121,950 -
Cebu 4,346,258,876 2,651,233,090
Atlas Consolidated Mining & Dev't Corp Sangi, Toledo City 13,469,725 -
Cebu City 1,482,233,278 1,712,278,716
Cebu International Airport 113,007,601 541,698,662
Danao City - 10,477
LapuLapu City 12,600 50,558
Ludo & Luym Corp. Cebu City - 58,877
Mactan Export Processing Zone, LapuLapu City 2,702,637,947 395,983,941
New Cebu Township One, Special Export Processing Zone, Naga City 33,776,419 -
Total Bulk Corp. Opao, Mandaue City - 1,136,288
West Cebu Inductrial Park-SEPZ (NCIP) Balamban 1,121,306 15,571
Negros Oriental 13,853,876 6,816,123
Dumaguete City 13,853,876 6,464,955
United Planters Sugar Milling Company, Manjuyod - 351,168
Exports Imports
CENTRAL VISAYAS 5,440,347,823 3,562,557,771
Bohol 676,400 -
Garcia Hernandez 676,400 -
Cebu 5,408,498,418 3,536,797,146
Caltex Philippines, Incorporated, Lapu-Lapu City, Cebu - 96,059
Cebu City 2,158,265,478 2,320,931,058
Cebu International Airport 32,525,154 826,005,891
LapuLapu City - 0
Ludo & Luym Corp. Cebu City - 132,085
Mactan Export Processing Zone, LapuLapu City 3,148,812,194 389,127,827
New Cebu Township One, Special Export Processing Zone, Naga City 68,895,592 -
Petroleum Philippines Corp., Mandaue City - 381,851
Total Bulk Corp. Opao, Mandaue City - 122,375
Negros Oriental 31,173,005 25,760,625
Dumaguete City 31,173,005 25,760,625
Province / Port2014
2013Province / Port
7-10

Table 7.5
QUANTITY AND VALUE OF DOMESTIC TRADE BY REGION AND BY MODE OF TRANSPORT
2014-2017
(Quantity in tons, Value in thousand pesos. Details may not add up to total due to rounding.)
Quantity Value Quantity Value Quantity Value Quantity Value
Philippines 5,129,681 169,437,881 4,867,650 170,197,626 4,119,593 144,397,341 5,269,617 136,523,030
NCR 990,293 49,546,521 965,042 57,372,635 616,699 37,256,739 557,751 28,004,198
CAR - - - - - - - -
I - Ilocos Region - - - - - - - -
II - Cagayan Valley 1 25 2 43 1 10 1 11
III - Central Luzon 1,067,641 10,337,647 1,119,142 10,815,656 1,079,519 10,447,172 1,082,157 10,508,442
IVA - CALABARZON 65,273 292,203 31,885 170,583 24,206 254,856 31,146 283,046
IVB - MIMAROPA 60,867 1,058,137 79,356 2,120,177 75,367 2,376,358 67,054 3,262,134
V - Bicol Region 84,359 2,974,814 114,702 3,424,205 163,248 3,327,196 106,660 2,372,801
VI - Western Visayas 769,881 37,996,188 624,966 29,960,509 453,145 22,430,106 593,887 19,169,481
VII - Central Visayas 5,483,335 24,515,198 341,329 15,845,429 480,929 19,865,726 1,172,142 22,551,040
VIII - Eastern Visayas 173,316 9,611,595 285,561 11,879,325 114,286 16,663,501 89,350 8,953,125
IX - Zamboanga Peninsula 35,164 1,261,588 47,811 1,860,013 2,579 1,077,040 32,870 1,324,285
X - Northern Mindanao 771,367 15,452,077 699,144 17,806,651 679,253 13,963,420 774,797 18,279,492
XI - Davao Region 264,093 5,527,419 252,141 6,585,279 133,292 3,978,528 281,943 8,530,550
XII - SOCCSKSARGEN 79,893 3,268,521 93,236 3,832,532 45,272 2,234,650 79,477 3,204,214
XIII - Caraga 189,670 6,701,196 185,434 8,788,292 200,865 10,048,778 356,975 9,148,440
ARMM 29,528 894,752 27,899 636,298 27,722 476,262 43,404 931,770
WATER 5,121,383 169,010,609 4,858,683 169,715,701 4,109,286 143,872,617 5,260,108 136,073,121
NCR 984,221 49,228,742 958,374 57,020,711 609,327 36,871,893 551,971 27,703,537
CAR - - - - - - - -
I - Ilocos Region - - - - - - - -
II - Cagayan Valley - - - - - - - -
III - Central Luzon 1,067,641 10,337,647 1,119,142 10,815,656 1,079,519 10,447,172 1,082,157 10,508,442
IVA - CALABARZON 65,273 292,203 31,885 170,583 24,206 254,856 31,146 283,046
IVB - MIMAROPA 60,571 1,055,970 79,002 2,116,067 75,178 2,368,156 66,711 3,253,560
V - Bicol Region 84,254 2,968,585 114,547 3,414,382 163,126 3,321,245 106,495 2,363,632
VI - Western Visayas 769,235 37,949,473 624,379 29,911,055 452,341 22,369,684 593,055 19,119,734
VII - Central Visayas 48,017 24,496,110 341,059 15,831,853 480,532 19,852,503 1,171,715 22,536,065
VIII - Eastern Visayas 173,291 9,611,003 285,509 11,878,086 114,273 16,662,747 89,298 8,947,954
IX - Zamboanga Peninsula 34,958 1,246,632 47,596 1,821,292 25,546 1,042,010 32,721 1,284,237
X - Northern Mindanao 771,026 15,448,646 698,881 17,803,589 678,592 13,959,385 773,681 18,271,612
XI - Davao Region 263,930 5,513,876 252,009 5,676,992 133,165 3,971,748 281,729 8,522,544
XII - SOCCSKSARGEN 79,775 326,392 92,976 3,827,992 44,946 2,230,931 79,163 3,200,710
XIII - Caraga 189,661 6,700,578 185,425 8,788,144 200,812 10,044,025 356,859 9,146,277
ARMM 29,528 894,752 27,899 636,298 27,722 476,262 43,404 931,770
AIR 8,298 427,272 8,966 481,926 10,308 524,724 9,507 449,908
NCR 6,072 317,779 6,668 351,924 7,372 384,846 5,780 300,661
CAR - - - - - - - -
I - Ilocos Region - - - - - - - -
II - Cagayan Valley 1 25 2 43 1 10 1 11
III - Central Luzon - - - - - - - -
IVA - CALABARZON - - - - - - - -
IVB - MIMAROPA 296 2,167 353 4,110 189 8,202 343 8,574
V - Bicol Region 105 6,229 155 9,823 123 5,952 165 9,169
VI - Western Visayas 646 46,715 588 49,454 804 60,422 832 49,747
VII - Central Visayas 318 19,088 270 13,576 397 13,222 424 14,975
VIII - Eastern Visayas 25 592 51 1,238 13 754 52 5,171
IX - Zamboanga Peninsula 206 14,596 215 35,721 243 35,029 150 40,048
X - Northern Mindanao 340 3,430 263 3,062 661 4,035 1,116 7,880
XI - Davao Region 163 13,543 132 8,287 128 6,780 214 8,006
XII - SOCCSKSARGEN 118 2,129 259 4,540 325 3,719 314 3,504
XIII - Caraga 9 618 10 148 53 1,752 116 2,163
ARMM - - - - - - - -
Note: Dash (-) means no transaction
Source: Philippine Statistics Authority, Trade Statistics Division
4th Quarter
2014Mode of Transport and
Region3rd Quarter2nd Quarter1st Quarter
7-11

Table 7.5 - Continued
Quantity Value Quantity Value Quantity Value Quantity Value
Philippines 5,008,719 164,359,749 3,716,516 113,933,301 3,370,239 90,404,774 4,940,814 124,728,618
NCR 676,958 38,271,936 472,528 29,032,149 140,765 10,540,312 239,608 16,336,073
CAR - - - - - - - -
I - Ilocos Region - - - - - - - -
II - Cagayan Valley - - - - 3 5 - -
III - Central Luzon 1,176,863 11,285,201 927,828 8,959,449 1,187,921 11,506,294 1,487,620 14,305,514
IVA - CALABARZON 14,200 735,318 77,307 248,470 48,328 232,537 15,209 71,547
IVB - MIMAROPA 71,790 1,251,166 10,252 396,208 40,608 445,572 58,533 960,101
V - Bicol Region 68,000 913,756 69,662 1,239,526 68,262 1,014,733 80,359 1,531,923
VI - Western Visayas 552,094 26,433,292 429,758 24,292,455 369,095 17,939,966 1,277,536 26,929,518
VII - Central Visayas 570,013 24,152,833 553,881 24,602,614 553,238 22,859,359 627,600 24,048,687
VIII - Eastern Visayas 760,931 26,501,720 43,726 590,623 70,883 650,972 99,551 10,314,184
IX - Zamboanga Peninsula 25,817 1,155,596 15,824 722,225 37,020 2,071,985 62,672 2,272,447
X - Northern Mindanao 780,295 19,747,349 790,111 10,997,731 648,562 14,915,003 659,194 15,668,567
XI - Davao Region 60,946 4,464,827 113,730 5,941,209 - - 107,791 5,017,346
XII - SOCCSKSARGEN 22,934 723,958 37,485 1,584,066 - - - -
XIII - Caraga 199,156 8,019,491 145,104 4,746,043 193,230 7,844,501 172,114 6,092,184
ARMM 28,724 403,305 29,321 580,535 12,327 383,535 53,029 1,181,527
WATER 5,001,279 163,937,003 3,710,318 113,531,147 3,359,641 89,816,795 4,929,593 124,090,111
NCR 671,522 37,990,228 468,551 28,787,123 133,645 10,118,271 231,417 15,871,344
CAR - - - - - - - -
I - Ilocos Region - - - - - - - -
II - Cagayan Valley - - - - - - - -
III - Central Luzon 1,176,863 11,285,201 927,828 8,959,449 1,187,921 11,506,294 1,487,620 14,305,514
IVA - CALABARZON 14,200 735,318 77,307 248,470 48,328 232,537 15,209 71,547
IVB - MIMAROPA 71,758 1,250,657 9,727 392,955 39,464 438,558 57,976 955,058
V - Bicol Region 67,909 906,447 69,562 1,232,957 68,151 1,009,882 80,289 1,528,145
VI - Western Visayas 551,194 26,331,765 428,938 24,165,090 367,968 17,816,460 1,276,551 26,787,094
VII - Central Visayas 569,667 24,137,350 553,649 24,593,928 552,819 22,840,086 627,299 24,035,218
VIII - Eastern Visayas 760,869 26,496,857 43,679 587,635 70,842 648,239 99,517 10,313,344
IX - Zamboanga Peninsula 25,754 1,153,208 15,737 718,923 36,841 2,067,499 62,473 2,268,870
X - Northern Mindanao 780,084 19,745,207 789,969 10,996,086 648,263 14,911,905 658,414 15,663,562
XI - Davao Region 60,806 4,459,846 113,697 5,939,809 - - 107,791 5,017,346
XII - SOCCSKSARGEN 22,887 722,787 37,279 1,582,517 - - - -
XIII - Caraga 199,044 8,018,826 145,076 4,745,670 193,072 7,843,529 172,009 6,091,541
ARMM 28,724 703,305 29,321 580,535 12,327 383,535 53,029 1,181,527
AIR 7,440 422,746 6,198 402,154 10,600 587,977 11,221 638,507
NCR 5,436 281,708 3,977 245,026 7,120 422,040 8,191 464,729
CAR - - - - - - - -
I - Ilocos Region - - - - - - - -
II - Cagayan Valley - - - - 3 5 - -
III - Central Luzon - - - - - - - -
IVA - CALABARZON - - - - - - - -
IVB - MIMAROPA 32 509 525 3,253 1,144 7,015 557 5,043
V - Bicol Region 91 7,309 100 6,569 111 4,851 70 3,778
VI - Western Visayas 900 101,527 820 127,365 1,128 123,506 985 142,424
VII - Central Visayas 346 15,483 232 8,686 418 19,273 301 12,470
VIII - Eastern Visayas 62 4,863 47 2,988 40 2,733 34 839
IX - Zamboanga Peninsula 63 2,388 87 3,302 179 4,485 198 3,577
X - Northern Mindanao 211 2,142 142 1,645 299 3,098 781 5,005
XI - Davao Region 140 4,981 33 1,400 - - - -
XII - SOCCSKSARGEN 47 1,171 206 1,549 - - - -
XIII - Caraga 112 665 28 373 158 972 105 644
ARMM - - - - - - - -
Mode of Transport and
Region
2015
1st Quarter 2nd Quarter 3rd Quarter 4th Quarter
7-12

Table 7.5 - Continued
Quantity Value Quantity Value Quantity Value Quantity Value
Philippines 5,358,628 175,451,434 4,719,361 158,705,333 4,091,312 149,142,225 6,213,829 181,639,721
NCR 369,208 25,338,898 385,428 30,998,002 397,876 33,848,418 578,132 41,546,981
CAR - - - - - - - -
I - Ilocos Region - - - - - - - -
II - Cagayan Valley - - - - - - - -
III - Central Luzon 1,407,444 13,364,594 1,335,182 12,762,295 1,317,510 13,070,747 1,275,888 12,133,349
IVA - CALABARZON 42,030 181,773 45,920 156,201 72,388 210,895 87,552 212,187
IVB - MIMAROPA 94,317 3,764,536 16,659 1,478,683 51,446 2,419,124 259,409 2,665,461
V - Bicol Region 95,359 2,593,880 114,525 2,387,695 95,355 1,954,445 934,908 1,786,802
VI - Western Visayas 979,172 30,809,937 398,441 21,671,719 524,220 31,702,573 510,404 31,550,319
VII - Central Visayas 504,986 19,020,831 346,859 21,363,871 110,947 8,412,654 884,338 37,163,111
VIII - Eastern Visayas 224,466 35,628,924 247,174 21,189,203 223,503 17,953,928 292,723 18,849,062
IX - Zamboanga Peninsula 53,692 3,216,318 46,557 2,012,839 27,032 2,026,674 44,846 1,446,748
X - Northern Mindanao 869,537 16,016,222 476,092 16,796,283 572,443 18,191,535 636,838 15,726,475
XI - Davao Region 135,009 11,057,357 965,610 11,491,546 413,074 7,003,397 389,598 4,658,449
XII - SOCCSKSARGEN 351,615 4,892,897 95,184 3,982,476 87,674 2,992,545 103,413 3,359,006
XIII - Caraga 192,430 8,853,112 202,853 11,233,026 177,586 8,381,816 166,437 8,909,155
ARMM 39,364 712,155 42,878 1,181,493 20,260 973,478 49,344 1,632,618
WATER 5,348,895 174,691,654 4,709,163 157,892,836 4,081,382 148,542,758 6,202,950 180,921,004
NCR 361,538 24,774,919 377,361 30,317,775 390,634 33,401,744 570,358 40,988,446
CAR - - - - - - - -
I - Ilocos Region - - - - - - - -
II - Cagayan Valley - - - - - - - -
III - Central Luzon 1,407,444 13,364,594 1,335,182 12,762,295 1,317,510 13,070,747 1,275,888 12,133,349
IVA - CALABARZON 42,030 181,773 49,920 156,201 72,388 210,895 87,552 212,187
IVB - MIMAROPA 94,128 3,762,033 16,373 1,475,155 51,380 2,418,451 258,785 2,657,722
V - Bicol Region 95,315 2,589,374 114,485 2,384,520 95,310 1,951,695 934,877 1,785,169
VI - Western Visayas 978,142 30,643,843 397,573 21,566,596 523,272 31,854,407 509,294 31,432,974
VII - Central Visayas 504,666 19,006,881 346,511 21,350,445 110,292 8,392,565 883,750 37,142,074
VIII - Eastern Visayas 224,404 35,627,857 247,131 21,188,764 223,435 17,956,309 292,650 18,847,772
IX - Zamboanga Peninsula 53,452 3,210,540 46,418 2,009,572 26,599 2,020,637 44,573 1,440,516
X - Northern Mindanao 869,479 16,015,694 476,044 16,795,709 572,363 18,190,619 636,758 15,725,700
XI - Davao Region 135,009 11,057,357 965,610 11,491,546 413,074 7,003,397 389,598 4,658,449
XII - SOCCSKSARGEN 351,615 4,892,897 95,184 3,982,476 87,279 2,988,999 103,087 3,354,872
XIII - Caraga 192,309 8,851,737 202,492 11,230,288 177,586 8,381,816 166,437 8,909,155
ARMM 39,364 712,155 42,878 1,181,493 20,260 973,478 49,344 1,632,618
AIR 9,733 759,780 10,199 812,496 9,931 599,468 10,879 718,720
NCR 7,670 563,979 8,067 680,227 7,242 446,674 7,774 558,535
CAR - - - - - - - -
I - Ilocos Region - - - - - - - -
II - Cagayan Valley - - - - - - - -
III - Central Luzon - - - - - - - -
IVA - CALABARZON - - - - - - - -
IVB - MIMAROPA 189 2,503 286 3,528 66 673 624 7,739
V - Bicol Region 44 4,506 40 3,175 45 2,750 31 1,633
VI - Western Visayas 1,030 166,094 868 105,123 948 118,166 1,110 117,345
VII - Central Visayas 320 13,950 348 13,426 655 20,086 588 21,037
VIII - Eastern Visayas 62 1,067 43 439 68 619 73 1,290
IX - Zamboanga Peninsula 240 5,778 139 3,267 433 6,037 273 6,232
X - Northern Mindanao 58 528 48 574 80 916 80 775
XI - Davao Region - - - - - - - -
XII - SOCCSKSARGEN - - - - 395 3,546 326 4,134
XIII - Caraga 121 1,375 361 2,738 - - - -
ARMM - - - - - - - -
Mode of Transport and
Region
2016
1st Quarter 2nd Quarter 3rd Quarter 4th Quarter
7-13

Table 7.5 - Continued
Quantity Value Quantity Value Quantity Value Quantity Value
Philippines 4,851,145 164,773,417 5,083,649 172,671,974 4,864,148 153,991,563 6,476,238 176,392,742
NCR 388,762 30,972,588 406,449 31,644,723 415,438 31,529,095 476,714 33,262,690
CAR - - - - - - - -
I - Ilocos Region - - - - - - - -
II - Cagayan Valley - - - - - - - -
III - Central Luzon 1,270,216 12,208,824 1,245,444 12,431,431 856,825 8,299,248 1,347,144 13,428,064
IVA - CALABARZON 71,297 229,217 80,756 166,254 101,360 213,710 90,972 235,833
IVB - MIMAROPA 70,555 1,045,857 84,369 1,176,992 53,313 688,282 555,174 700,689
V - Bicol Region 502,216 2,852,556 80,408 1,782,356 231,380 1,956,855 266,101 3,808,945
VI - Western Visayas 606,047 33,472,086 476,404 26,967,313 472,302 27,105,039 504,613 28,314,144
VII - Central Visayas 604,379 32,476,356 603,887 34,145,202 941,044 24,461,813 888,848 27,544,327
VIII - Eastern Visayas 240,855 21,223,479 274,503 25,739,974 263,800 24,649,359 294,320 26,112,041
IX - Zamboanga Peninsula 175,796 4,492,856 65,456 3,982,021 73,792 6,393,984 80,800 4,942,625
X - Northern Mindanao 514,354 11,704,121 1,102,293 17,911,901 787,577 15,317,901 1,422,032 16,718,042
XI - Davao Region 138,569 3,318,108 323,676 4,765,458 436,479 7,539,109 231,198 7,194,583
XII - SOCCSKSARGEN 66,775 1,899,829 65,243 1,664,614 84,619 2,194,640 136,629 5,100,501
XIII - Caraga 161,855 7,182,301 229,870 8,541,975 85,737 1,521,371 141,995 7,304,638
ARMM 39,467 1,695,241 44,891 1,751,763 60,481 2,121,157 39,697 1,725,620
WATER 4,843,397 164,459,406 5,080,490.00 172,547,862 4,856,873 153,809,126 6,472,972 176,263,420
NCR 384,047 30,833,391 406,449 31,644,723 413,670 31,493,724 476,576 33,260,980
CAR - - - - - - - -
I - Ilocos Region - - - - - - - -
II - Cagayan Valley - - - - - - - -
III - Central Luzon 1,270,216 12,208,824 1,245,444 12,431,431 856,825 8,299,248 1,347,144 13,428,064
IVA - CALABARZON 71,297 229,217 80,756 166,254 101,360 213,710 90,972 235,833
IVB - MIMAROPA 69,991 1,036,064 83,960 1,168,398 52,657 675,630 554,837 694,603
V - Bicol Region 502,187 2,850,441 80,377 1,781,544 231,311 1,956,701 265,992 3,808,772
VI - Western Visayas 605,347 33,347,685 476,127 26,896,586 471,897 27,013,093 504,150 28,229,458
VII - Central Visayas 603,484 32,447,608 602,718 34,114,634 940,204 24,452,947 888,018 27,522,325
VIII - Eastern Visayas 240,805 21,223,240 274,422 25,739,753 263,789 24,649,328 294,300 26,111,976
IX - Zamboanga Peninsula 175,602 4,489,407 65,392 3,979,690 73,757 6,393,125 80,771 4,941,799
X - Northern Mindanao 514,144 11,701,985 1,101,554 17,905,190 786,430 15,309,411 1,421,271 16,712,577
XI - Davao Region 138,569 3,318,108 323,676 4,765,458 434,750 7,524,414 231,198 7,194,583
XII - SOCCSKSARGEN 66,385 1,895,895 64,854 1,660,464 84,004 2,185,267 136,050 5,092,194
XIII - Caraga 161,855 7,182,301 229,870 8,541,975 85,737 1,521,371 141,995 7,304,638
ARMM 39,467 1,695,241 44,891 1,751,763 60,481 2,121,157 39,697 1,725,620
AIR 7,746 314,012 3,159 124,113 7,275 182,438 3,266 129,322
NCR 4,715 139,197 - - 1,768 35,371 138 1,710
CAR - - - - - - - -
I - Ilocos Region - - - - - - - -
II - Cagayan Valley - - - - - - - -
III - Central Luzon - - - - - - - -
IVA - CALABARZON - - - - - - - -
IVB - MIMAROPA 564 9,793 409 8,594 656 12,652 337 6,086
V - Bicol Region 29 2,115 31 812 69 154 109 173
VI - Western Visayas 700 124,401 277 70,727 405 91,946 463 84,686
VII - Central Visayas 895 28,748 1,169 30,568 840 8,866 830 22,002
VIII - Eastern Visayas 50 239 81 221 11 31 20 65
IX - Zamboanga Peninsula 194 3,449 64 2,331 35 859 29 826
X - Northern Mindanao 210 2,136 739 6,711 1,147 8,490 761 5,465
XI - Davao Region - - - - 1,729 14,695 - -
XII - SOCCSKSARGEN 390 3,934 389 4,150 615 9,373 579 8,307
XIII - Caraga - - - - - - - -
ARMM - - - - - - - -
Mode of Transport and
Region
2017P
1st Quarter 2nd Quarter 3rd Quarter 4th Quarter
7-14

Table 7.6
TOTAL VALUE OF DOMESTIC TRADE BALANCES IN THE PHILIPPINES BY MODE OF TRANSPORT AND REGION
2014-2017
(Value in thousand pesos. Details may not add up to total due to rounding.)
Outflow Inflow Balance Outflow Inflow Balance
Philippines 169,437,881 169,437,881 0 170,197,627 170,197,627 0
NCR 49,546,521 32,315,928 17,230,593 57,372,635 30,014,557 27,358,078
CAR - - - - - -
I - Ilocos Region - 1,320,398 (1,320,398) - 1,250,849 (1,250,849)
II - Cagayan Valley 25 106,073 (106,048) 43 70,850 (70,807)
III - Central Luzon 10,337,647 344,584 9,993,063 10,815,656 203,638 10,612,018
IVA - CALABARZON 292,203 5,876,501 (5,584,298) 170,583 6,581,467 (6,410,884)
IVB - MIMAROPA 1,058,137 4,298,057 (3,239,920) 2,120,177 5,118,868 (2,998,691)
V - Bicol Region 2,974,814 3,027,455 (52,641) 3,424,205 2,653,907 770,298
VI - Western Visayas 37,996,188 25,828,032 12,168,156 29,960,509 26,257,356 3,703,153
VII - Central Visayas 24,515,198 31,423,793 (6,908,595) 15,845,429 32,043,484 (16,198,055)
VIII - Eastern Visayas 9,611,595 10,729,365 (1,117,770) 11,879,325 10,117,797 1,761,528
IX - Zamboanga Peninsula 1,261,588 7,942,019 (6,680,431) 1,860,013 8,552,661 (6,692,648)
X - Northern Mindanao 15,452,077 20,200,578 (4,748,501) 17,806,651 20,531,904 (2,725,253)
XI - Davao Region 5,527,419 9,968,632 (4,441,213) 5,685,279 7,345,500 (1,660,221)
XII - SOCCSKSARGEN 3,268,521 3,467,389 (198,868) 3,832,532 3,394,184 438,348
XIII - Caraga 6,701,196 12,004,173 (5,302,977) 8,788,292 15,226,635 (6,438,343)
ARMM 894,752 584,904 309,848 636,298 833,968 (197,670)
WATER 169,010,609 169,010,609 0 169,715,701 169,715,701 0
NCR 49,228,742 32,214,892 17,013,850 57,020,711 29,901,231 27,119,480
CAR - - - - - -
I - Ilocos Region - 1,319,251 (1,319,251) - 1,249,034 (1,249,034)
II - Cagayan Valley - 106,064 (106,064) - 70,835 (70,835)
III - Central Luzon 10,337,647 344,584 9,993,063 10,815,656 203,638 10,612,018
IVA - CALABARZON 292,203 5,876,501 (5,584,298) 170,583 6,581,467 (6,410,884)
IVB - MIMAROPA 1,055,970 4,297,412 (3,241,442) 2,116,067 5,118,435 (3,002,368)
V - Bicol Region 2,968,585 3,027,076 (58,491) 3,414,382 2,653,513 760,869
VI - Western Visayas 37,949,473 25,767,765 12,181,708 29,911,055 26,184,348 3,726,707
VII - Central Visayas 24,496,110 31,308,285 (6,812,175) 15,831,853 31,910,618 (16,078,765)
VIII - Eastern Visayas 9,611,003 10,727,889 (1,116,886) 11,878,086 10,117,149 1,760,937
IX - Zamboanga Peninsula 1,246,632 7,941,062 (6,694,430) 1,824,292 8,551,636 (6,727,344)
X - Northern Mindanao 15,448,646 20,200,015 (4,751,369) 17,803,589 20,531,209 (2,727,620)
XI - Davao Region 5,513,876 9,899,412 (4,385,536) 5,676,992 7,280,066 (1,603,074)
XII - SOCCSKSARGEN 3,266,392 3,392,052 (125,660) 3,827,992 3,312,403 515,589
XIII - Caraga 6,700,578 12,003,843 (5,303,265) 8,788,144 15,226,450 (6,438,306)
ARMM 894,752 584,506 310,246 636,298 823,668 (187,370)
AIR 427,272 427,272 0 481,926 481,926 0
NCR 317,779 101,036 216,743 351,924 113,327 238,597
CAR - - - - - -
I - Ilocos Region - 1,147 (1,147) - 1,814 (1,814)
II - Cagayan Valley 25 9 16 43 15 28
III - Central Luzon - - - - - -
IVA - CALABARZON - - - - - -
IVB - MIMAROPA 2,167 644 1,523 4,110 433 3,677
V - Bicol Region 6,229 379 5,850 9,823 394 9,429
VI - Western Visayas 46,715 60,267 (13,552) 49,454 73,008 (23,554)
VII - Central Visayas 19,088 115,509 (96,421) 13,576 132,866 (119,290)
VIII - Eastern Visayas 592 1,476 (884) 1,238 648 590
IX - Zamboanga Peninsula 14,956 957 13,999 35,721 1,025 34,696
X - Northern Mindanao 3,430 564 ` 3,062 695 2,367
XI - Davao Region 13,543 69,220 (55,677) 8,287 65,434 (57,147)
XII - SOCCSKSARGEN 2,129 75,337 (73,208) 4,540 81,781 (77,241)
XIII - Caraga 618 330 288 148 185 (37)
ARMM - 397 (397) - 10,301 (10,301)
Note: Dash (-) means no transaction
Source: Philippine Statistics Authority, Trade Statistics Division
Mode of Transport and
Region1st Quarter 2nd Quarter
2014
7-15

Table 7.6 - Continued
Outflow Inflow Balance Outflow Inflow Balance
Philippines 144,397,341 144,397,341 0 136,523,030 136,523,030 0
NCR 37,256,739 21,784,006 15,472,733 28,003,886 26,650,738 1,353,148
CAR - - - - - -
I - Ilocos Region - 1,298,845 (1,298,845) - 1,295,557 (1,295,557)
II - Cagayan Valley 10 98,611 (98,601) 11 25,730 (25,719)
III - Central Luzon 10,447,172 204,840 10,242,332 10,508,442 101,378 10,407,064
IVA - CALABARZON 254,856 5,102,776 (4,847,920) 283,046 4,766,657 (4,483,611)
IVB - MIMAROPA 2,376,358 4,336,853 (1,960,495) 3,262,125 5,073,821 (1,811,696)
V - Bicol Region 3,327,196 2,486,364 840,832 2,372,791 2,289,202 83,589
VI - Western Visayas 22,430,106 21,947,799 482,307 19,169,423 18,652,098 517,325
VII - Central Visayas 19,865,726 24,425,862 (4,560,136) 22,551,497 25,053,217 (2,501,720)
VIII - Eastern Visayas 16,663,501 10,734,543 5,928,958 8,953,120 11,004,448 (2,051,328)
IX - Zamboanga Peninsula 1,077,040 6,044,185 (4,967,145) 1,324,243 7,162,642 (5,838,399)
X - Northern Mindanao 13,963,420 16,008,318 (2,044,898) 18,279,484 15,562,729 2,716,755
XI - Davao Region 3,978,528 5,160,712 (1,182,184) 8,530,541 4,396,919 4,133,622
XII - SOCCSKSARGEN 2,234,650 2,511,148 (276,498) 3,204,211 1,824,658 1,379,553
XIII - Caraga 10,045,778 21,441,732 (11,395,954) 9,148,438 11,969,418 (2,820,980)
ARMM 476,262 813,748 (337,486) 931,770 693,817 237,953
WATER 143,872,617 143,872,617 0 136,073,121 136,073,121 0
NCR 36,871,893 21,671,271 15,200,622 27,703,537 26,530,231 1,173,306
CAR - - - - - -
I - Ilocos Region - 1,296,174 (1,296,174) - 1,294,040 (1,294,040)
II - Cagayan Valley - 95,598 (95,598) - 25,662 (25,662)
III - Central Luzon 10,447,172 204,790 10,242,382 10,508,442 101,378 10,407,064
IVA - CALABARZON 254,856 5,102,776 (4,847,920) 283,046 4,766,657 (4,483,611)
IVB - MIMAROPA 2,368,156 4,336,351 (1,968,195) 3,253,560 5,073,094 (1,819,534)
V - Bicol Region 3,321,245 2,485,975 835,270 2,363,632 2,288,542 75,090
VI - Western Visayas 22,369,684 21,870,906 498,778 19,119,734 18,587,496 532,238
VII - Central Visayas 19,852,503 24,270,762 (4,418,259) 22,536,065 24,931,676 (2,395,611)
VIII - Eastern Visayas 1,662,747 10,734,000 (9,071,253) 8,947,954 11,004,381 (2,056,427)
IX - Zamboanga Peninsula 1,042,010 6,043,022 (5,001,012) 1,284,237 7,162,117 (5,877,880)
X - Northern Mindanao 13,959,385 16,007,803 (2,048,418) 18,271,612 15,561,115 2,710,497
XI - Davao Region 3,971,748 5,079,489 (1,107,741) 8,522,544 4,328,086 4,194,458
XII - SOCCSKSARGEN 2,230,931 2,438,483 (207,552) 3,200,710 1,775,870 1,424,840
XIII - Caraga 10,044,025 21,441,594 (11,397,569) 9,146,277 11,969,242 (2,822,965)
ARMM 476,262 793,624 (317,362) 931,770 673,535 258,235
AIR 524,724 524,724 0 449,908 449,908 0
NCR 384,846 112,734 272,112 300,349 120,507 179,842
CAR - - - - - -
I - Ilocos Region - 2,672 (2,672) - 1,517 (1,517)
II - Cagayan Valley 10 13 (3) 11 68 (57)
III - Central Luzon - 50 (50) - - -
IVA - CALABARZON - - - - - -
IVB - MIMAROPA 8,202 503 7,699 8,565 727 7,838
V - Bicol Region 5,952 389 5,563 9,159 660 8,499
VI - Western Visayas 60,422 76,892 (16,470) 49,689 64,602 (14,913)
VII - Central Visayas 13,222 155,099 (141,877) 15,432 121,541 (106,109)
VIII - Eastern Visayas 754 543 211 5,166 67 5,099
IX - Zamboanga Peninsula 35,029 1,163 33,866 40,006 525 39,481
X - Northern Mindanao 4,035 515 3,520 7,872 1,614 6,258
XI - Davao Region 6,780 81,223 (74,443) 7,997 68,833 (60,836)
XII - SOCCSKSARGEN 3,719 72,666 (68,947) 3,501 48,788 (45,287)
XIII - Caraga 1,752 138 1,614 2,161 176 1,985
ARMM - 20,124 (20,124) - 20,282 (20,282)
3rd Quarter 4th QuarterMode of Transport and
Region
2014
7-16

Table 7.6 - Continued
Outflow Inflow Balance Outflow Inflow Balance
Philippines 164,359,749 164,359,749 0 113,933,301 113,933,301 0
NCR 38,271,936 25,523,262 12,748,674 29,032,148 21,774,963 7,257,185
CAR - - - - - -
I - Ilocos Region - 1,620,411 (1,620,411) - 1,100,206 (1,100,206)
II - Cagayan Valley - 80,204 (80,204) - 79,549 (79,549)
III - Central Luzon 11,285,201 564,696 10,720,505 8,959,449 513,956 8,445,493
IVA - CALABARZON 735,318 6,352,703 (5,617,385) 248,470 3,855,393 (3,606,923)
IVB - MIMAROPA 1,251,165 4,992,536 (3,741,371) 396,208 3,121,132 (2,724,924)
V - Bicol Region 913,756 2,564,697 (1,650,941) 1,239,526 1,863,876 (624,350)
VI - Western Visayas 26,433,294 24,790,068 1,643,226 24,292,455 21,468,330 2,824,125
VII - Central Visayas 24,152,834 26,303,648 (2,150,814) 24,602,614 25,413,072 (810,458)
VIII - Eastern Visayas 26,501,720 12,938,326 13,563,394 590,623 8,645,012 (8,054,389)
IX - Zamboanga Peninsula 1,155,596 6,719,179 (5,563,583) 722,225 5,367,119 (4,644,894)
X - Northern Mindanao 19,747,349 14,543,933 5,203,416 10,997,731 11,574,046 (576,315)
XI - Davao Region 4,464,827 5,592,870 (1,128,043) 5,941,209 3,487,104 2,454,105
XII - SOCCSKSARGEN 723,957 1,532,503 (808,546) 1,584,066 1,554,233 29,833
XIII - Caraga 8,019,491 29,584,677 (21,565,186) 4,746,043 3,290,608 1,455,435
ARMM 703,305 656,039 47,266 580,535 824,700 (244,165)
WATER 163,937,003 163,937,003 0 113,531,147 113,531,147 0
NCR 37,990,228 25,389,676 12,600,552 28,787,123 21,627,543 7,159,580
CAR - - - - - -
I - Ilocos Region - 1,618,506 (1,618,506) - 1,098,803 (1,098,803)
II - Cagayan Valley - 80,199 (80,199) - 79,549 (79,549)
III - Central Luzon 11,285,201 564,696 10,720,505 8,959,449 513,956 8,445,493
IVA - CALABARZON 735,318 6,352,703 (5,617,385) 248,470 3,855,393 (3,606,923)
IVB - MIMAROPA 1,250,657 4,992,057 (3,741,400) 392,955 3,120,591 (2,727,636)
V - Bicol Region 906,447 2,563,836 (1,657,389) 1,232,957 1,863,174 (630,217)
VI - Western Visayas 26,331,765 24,717,999 1,613,766 24,165,090 21,417,100 2,747,990
VII - Central Visayas 24,137,350 26,202,448 (2,065,098) 24,593,928 25,312,556 (718,628)
VIII - Eastern Visayas 26,496,857 12,937,430 13,559,427 587,635 8,643,576 (8,055,941)
IX - Zamboanga Peninsula 1,153,208 6,718,673 (5,565,465) 718,923 5,366,105 (4,647,182)
X - Northern Mindanao 19,745,207 14,543,402 5,201,805 10,996,086 11,752,114 (756,028)
XI - Davao Region 4,459,846 5,530,506 (1,070,660) 5,939,809 3,431,210 2,508,599
XII - SOCCSKSARGEN 722,787 148,467 574,320 1,582,517 1,514,962 67,555
XIII - Caraga 8,018,826 29,584,373 (21,565,547) 4,745,670 3,289,871 1,455,799
ARMM 703,305 655,811 47,494 580,535 824,613 (244,078)
AIR 422,748 422,748 0 402,154 402,154 0
NCR 281,708 133,587 148,121 245,026 147,420 97,606
CAR - - - - 0 -
I - Ilocos Region - 1,905 (1,905) - 1403 (1,403)
II - Cagayan Valley - 5 (5) - 0 -
III - Central Luzon - - - - 0 -
IVA - CALABARZON - - - - 0 -
IVB - MIMAROPA 509 479 30 3,253 541 2,712
V - Bicol Region 7,309 862 6,447 6,569 702 5,867
VI - Western Visayas 101,529 72,069 29,460 127,365 512,320 (384,955)
VII - Central Visayas 15,483 101,199 (85,716) 8,686 100,516 (91,830)
VIII - Eastern Visayas 4,863 896 3,967 2,988 1,436 1,552
IX - Zamboanga Peninsula 2,388 506 1,882 3,302 1,014 2,288
X - Northern Mindanao 2,142 530 1,612 1,645 1,932 (287)
XI - Davao Region 4,981 62,364 (57,383) 1,400 55,894 (54,494)
XII - SOCCSKSARGEN 1,171 47,816 (46,645) 1,549 39,271 (37,722)
XIII - Caraga 665 304 361 373 737 (364)
ARMM - 227 (227) - 57 (57)
Mode of Transport and
Region1st Quarter 2nd Quarter
2015
7-17

Table 7.6 - Continued
Outflow Inflow Balance Outflow Inflow Balance
Philippines 90,404,774 90,404,774 0 124,728,618 124,728,618 0
NCR 10,540,312 14,231,240 (3,690,928) 16,336,072 22,117,971 (5,781,899)
CAR - - - - - -
I - Ilocos Region - 1,338,610 (1,338,610) - 1,819,990 (1,819,990)
II - Cagayan Valley 5 87,171 (87,166) - 70,165 (70,165)
III - Central Luzon 11,506,294 351,086 11,155,208 14,305,514 431,743 13,873,771
IVA - CALABARZON 232,537 4,528,207 (4,295,670) 71,547 5,386,342 (5,314,795)
IVB - MIMAROPA 4,455,572 2,613,854 1,841,718 960,101 2,543,537 (1,583,436)
V - Bicol Region 1,014,733 1,544,570 (529,837) 1,531,923 2,282,076 (750,153)
VI - Western Visayas 17,939,966 15,895,002 2,044,964 26,929,523 22,040,925 4,888,598
VII - Central Visayas 22,859,359 17,680,231 5,179,128 24,047,687 21,897,887 2,149,800
VIII - Eastern Visayas 650,972 9,926,240 (9,275,268) 10,314,184 10,069,929 244,255
IX - Zamboanga Peninsula 2,071,985 4,006,747 (1,934,762) 2,272,447 4,956,735 (2,684,288)
X - Northern Mindanao 14,915,003 10,851,548 4,063,455 15,668,567 13,021,644 2,646,923
XI - Davao Region - 1,792,289 (1,792,289) 5,017,346 2,363,531 2,653,815
XII - SOCCSKSARGEN - 543,524 (543,524) - 707,425 (707,425)
XIII - Caraga 7,844,501 4,103,274 3,741,227 6,092,184 13,202,128 (7,109,944)
ARMM 383,535 911,180 (527,645) 181,527 1,816,595 (1,635,068)
WATER 89,816,795 89,816,795 0 124,090,111 124,090,111 0
NCR 10,118,271 14,079,640 (3,961,369) 15,871,344 21,957,979 (6,086,635)
CAR - - - - - -
I - Ilocos Region - 1,335,819 (1,335,819) - 1,816,938 (1,816,938)
II - Cagayan Valley - 87,067 (87,067) - 70,155 (70,155)
III - Central Luzon 11,506,294 351,086 11,155,208 14,305,514 431,743 13,873,771
IVA - CALABARZON 232,537 4,528,207 (4,295,670) 71,547 5,386,342 (5,314,795)
IVB - MIMAROPA 438,558 2,613,362 (2,174,804) 955,058 2,543,261 (1,588,203)
V - Bicol Region 1,009,882 1,543,950 (534,068) 1,528,145 2,281,093 (752,948)
VI - Western Visayas 17,816,460 15,796,596 2,019,864 26,787,094 21,941,986 4,845,108
VII - Central Visayas 22,840,086 17,505,809 5,334,277 24,035,218 21,708,765 2,326,453
VIII - Eastern Visayas 648,239 9,923,676 (9,275,437) 10,313,344 10,068,525 244,819
IX - Zamboanga Peninsula 2,067,499 4,004,767 (1,937,268) 2,268,870 4,956,299 (2,687,429)
X - Northern Mindanao 14,911,905 10,848,419 4,063,486 15,663,562 13,019,156 2,644,406
XI - Davao Region - 1,700,871 (1,700,871) 5,017,346 2,248,741 2,768,605
XII - SOCCSKSARGEN - 485,488 (485,488) - 642,920 (642,920)
XIII - Caraga 7,843,529 4,100,964 3,742,565 6,091,541 13,199,793 (7,108,252)
ARMM 383,535 911,075 (527,540) 1,181,527 1,816,416 (634,889)
AIR 587,979 587,979 0 638,507 638,507 0
NCR 422,040 151,601 270,439 464,729 159,993 304,736
CAR - - - - - -
I - Ilocos Region - 2,792 (2,792) - 3,053 (3,053)
II - Cagayan Valley 5 105 (100) - 10 (10)
III - Central Luzon - - - - - -
IVA - CALABARZON - - - - - -
IVB - MIMAROPA 7,015 492 6,523 5,043 276 4,767
V - Bicol Region 4,851 620 4,231 3,778 983 2,795
VI - Western Visayas 123,506 98,406 25,100 142,428 98,939 43,489
VII - Central Visayas 19,273 174,422 (155,149) 12,470 189,122 (176,652)
VIII - Eastern Visayas 2,733 2,564 169 839 1,404 (565)
IX - Zamboanga Peninsula 4,485 1,980 2,505 3,577 436 3,141
X - Northern Mindanao 3,098 3,129 (31) 5,005 2,488 2,517
XI - Davao Region - 91,418 (91,418) - 114,790 (114,790)
XII - SOCCSKSARGEN - 58,036 (58,036) - 64,505 (64,505)
XIII - Caraga 972 2,310 (1,338) 644 2,334 (1,690)
ARMM - 105 (105) - 179 (179)
3rd Quarter 4th QuarterMode of Transport and
Region
2015
7-18

Table 7.6 - Continued
Outflow Inflow Balance Outflow Inflow Balance
Philippines 175,451,434 175,451,434 0 158,705,333 158,705,333 0
NCR 25,338,898 31,235,980 (5,897,082) 30,998,002 27,060,190 3,937,812
CAR - - - - - -
I - Ilocos Region - 2,181,241 (2,181,241) - 1,195,872 (1,195,872)
II - Cagayan Valley - 199,833 (199,833) - 94,840 (94,840)
III - Central Luzon 13,364,594 338,009 13,026,585 12,762,295 175,264 12,587,031
IVA - CALABARZON 181,773 5,139,526 (4,957,753) 156,201 4,198,339 (4,042,138)
IVB - MIMAROPA 3,764,536 4,785,646 (1,021,110) 1,478,683 3,175,322 (1,696,639)
V - Bicol Region 2,593,880 2,324,717 269,163 2,387,695 2,239,794 147,901
VI - Western Visayas 30,809,937 27,545,493 3,264,444 21,671,719 24,103,673 (2,431,954)
VII - Central Visayas 19,020,831 25,612,243 (6,591,412) 21,363,871 30,474,003 (9,110,132)
VIII - Eastern Visayas 35,628,924 10,788,562 24,840,362 21,189,203 13,537,110 7,652,093
IX - Zamboanga Peninsula 3,216,318 6,306,553 (3,090,235) 2,012,839 7,650,293 (5,637,454)
X - Northern Mindanao 16,016,222 14,074,886 1,941,336 16,796,283 15,122,210 1,674,073
XI - Davao Region 11,057,357 2,283,544 8,773,813 11,491,546 2,335,629 9,155,917
XII - SOCCSKSARGEN 4,894,272 1,429,657 3,464,615 3,985,214 2,034,824 1,950,390
XIII - Caraga 8,851,737 39,763,697 (30,911,960) 11,230,288 24,697,733 (13,467,445)
ARMM 712,155 1,441,846 (729,691) 1,181,493 610,237 571,256
WATER 174,691,654 174,691,654 0 157,892,836 157,892,836 0
NCR 24,774,919 31,054,715 (6,279,796) 30,317,775 26,937,517 3,380,258
CAR - - - - - -
I - Ilocos Region - 2,175,595 (2,175,595) - 1,190,367 (1,190,367)
II - Cagayan Valley - 199,826 (199,826) - 94,770 (94,770)
III - Central Luzon 134,364,594 338,009 134,026,585 12,762,295 175,264 12,587,031
IVA - CALABARZON 181,773 5,139,526 (4,957,753) 156,201 4,198,339 (4,042,138)
IVB - MIMAROPA 3,762,033 4,785,178 (1,023,145) 1,475,155 3,175,066 (1,699,911)
V - Bicol Region 2,589,374 2,323,775 265,599 2,384,520 2,239,009 145,511
VI - Western Visayas 30,643,843 27,430,455 3,213,388 21,566,596 23,991,083 (2,424,487)
VII - Central Visayas 19,006,881 25,439,506 (6,432,625) 21,350,445 30,094,389 (8,743,944)
VIII - Eastern Visayas 35,627,857 10,786,719 24,841,138 21,188,764 13,535,450 7,653,314
IX - Zamboanga Peninsula 3,210,540 6,305,670 (3,095,130) 2,009,572 7,649,778 (5,640,206)
X - Northern Mindanao 16,015,964 14,070,083 1,945,881 16,795,709 15,116,837 1,678,872
XI - Davao Region 11,057,357 2,075,582 8,981,775 11,491,546 2,218,053 9,273,493
XII - SOCCSKSARGEN 4,892,897 1,363,577 3,529,320 3,982,476 1,970,994 2,011,482
XIII - Caraga 8,851,737 39,761,658 (30,909,921) 11,230,288 24,695,814 (13,465,526)
ARMM 712,155 1,441,780 (729,625) 1,181,493 610,107 571,386
AIR 759,780 759,780 0 812,496 812,496 0
NCR 563,979 181,265 382,714 680,227 122,673 557,554
CAR - - - - - -
I - Ilocos Region - 5,646 (5,646) - 5,505 (5,505)
II - Cagayan Valley - 7 (7) - 70 (70)
III - Central Luzon - - - - - -
IVA - CALABARZON - - - - - -
IVB - MIMAROPA 2,503 468 2,035 3,528 256 3,272
V - Bicol Region 45,606 942 44,664 3,175 785 2,390
VI - Western Visayas 166,094 115,038 51,056 105,123 112,590 (7,467)
VII - Central Visayas 13,950 172,737 (158,787) 13,426 379,614 (366,188)
VIII - Eastern Visayas 1,067 1,843 (776) 439 1,660 (1,221)
IX - Zamboanga Peninsula 5,778 883 4,895 3,267 515 2,752
X - Northern Mindanao 528 4,803 (4,275) 574 5,373 (4,799)
XI - Davao Region - 207,962 (207,962) - 117,576 (117,576)
XII - SOCCSKSARGEN 1,375 66,080 (64,705) 2,738 63,830 (61,092)
XIII - Caraga - 2,039 (2,039) - 1,919 (1,919)
ARMM - 66 (66) - 130 (130)
Mode of Transport and
Region1st Quarter 2nd Quarter
2016
7-19

Table 7.6 - Continued
Outflow Inflow Balance Outflow Inflow Balance
Philippines 149,142,225 149,142,225 0 181,639,722 181,639,722 0
NCR 33,848,418 24,638,618 9,209,800 41,546,981 23,618,731 17,928,250
CAR - - - - - -
I - Ilocos Region - 1,274,564 (1,274,564) - 999,760 (999,760)
II - Cagayan Valley - 183,183 (183,183) - 75,075 (75,075)
III - Central Luzon 13,070,747 467,787 12,602,960 12,133,349 437,401 11,695,948
IVA - CALABARZON 210,895 6,225,340 (6,014,445) 212,187 6,187,171 (5,974,984)
IVB - MIMAROPA 2,419,124 4,533,812 (2,114,688) 2,665,461 4,624,715 (1,959,254)
V - Bicol Region 1,954,445 1,501,917 452,528 1,786,802 2,463,979 (677,177)
VI - Western Visayas 31,702,573 29,707,493 1,995,080 31,550,319 27,908,408 3,641,911
VII - Central Visayas 8,412,651 27,907,131 (19,494,480) 37,163,111 34,377,063 2,786,048
VIII - Eastern Visayas 17,953,928 7,281,620 10,672,308 18,849,062 12,822,167 6,026,895
IX - Zamboanga Peninsula 2,026,674 6,429,741 (4,403,067) 1,446,748 12,720,304 (11,273,556)
X - Northern Mindanao 18,191,535 12,941,836 5,249,699 15,726,475 20,514,876 (4,788,401)
XI - Davao Region 7,003,397 232,774 6,770,623 4,658,449 8,267,247 (3,608,798)
XII - SOCCSKSARGEN 2,992,545 1,195,322 1,797,223 3,359,006 2,161,021 1,197,985
XIII - Caraga 8,381,816 21,404,394 (13,022,578) 8,909,155 23,420,080 (14,510,925)
ARMM 973,478 1,121,694 (148,216) 1,632,618 1,041,726 590,892
WATER 148,542,758 148,542,758 0 180,921,002 180,921,002 0
NCR 33,401,744 24,500,516 8,901,228 40,988,446 23,478,694 17,509,752
CAR - - - - - -
I - Ilocos Region - 1,270,181 (1,270,181) - 996,112 (996,112)
II - Cagayan Valley - 183,176 (183,176) - 75,072 (75,072)
III - Central Luzon 13,070,747 467,787 12,602,960 12,133,349 437,401 11,695,948
IVA - CALABARZON 210,895 6,225,340 (6,014,445) 212,187 6,187,171 (5,974,984)
IVB - MIMAROPA 2,418,451 4,533,481 (2,115,030) 2,657,722 4,624,466 (1,966,744)
V - Bicol Region 1,951,695 1,500,904 450,791 1,785,169 2,462,956 (677,787)
VI - Western Visayas 31,584,407 29,594,431 1,989,976 31,432,974 27,795,243 3,637,731
VII - Central Visayas 8,392,565 27,748,798 (19,356,233) 37,142,074 34,089,771 3,052,303
VIII - Eastern Visayas 17,953,309 7,278,930 10,674,379 18,847,772 12,819,459 6,028,313
IX - Zamboanga Peninsula 2,020,637 6,429,479 (4,408,842) 1,440,516 12,719,928 (11,279,412)
X - Northern Mindanao 18,190,619 12,938,696 5,251,923 15,725,700 20,512,446 (4,786,746)
XI - Davao Region 7,003,397 2,221,753 4,781,644 4,658,449 8,151,502 (3,493,053)
XII - SOCCSKSARGEN 2,988,999 1,125,664 1,863,335 3,354,872 2,114,130 1,240,742
XIII - Caraga 8,381,816 21,402,015 (13,020,199) 8,909,155 23,415,086 (14,505,931)
ARMM 973,478 1,121,609 (148,131) 1,632,618 1,041,567 591,051
AIR 599,468 599,468 0 718,720 718,720 0
NCR 446,674 138,102 308,572 558,535 140,037 418,498
CAR - 0 - - - -
I - Ilocos Region - 4383 (4,383) - 3,648 (3,648)
II - Cagayan Valley - 7 (7) - 3 (3)
III - Central Luzon - 0 - - - -
IVA - CALABARZON - 0 - - - -
IVB - MIMAROPA 673 331 342 7,739 249 7,490
V - Bicol Region 2,750 1,013 1,737 1,633 1,023 610
VI - Western Visayas 118,166 113,065 5,101 117,345 113,165 4,180
VII - Central Visayas 20,086 158,333 (138,247) 21,037 287,292 (266,255)
VIII - Eastern Visayas 619 2,690 (2,071) 1,290 2,708 (1,418)
IX - Zamboanga Peninsula 6,037 262 5,775 6,232 376 5,856
X - Northern Mindanao 916 3,140 (2,224) 775 2,430 (1,655)
XI - Davao Region - 106,021 (106,021) - 115,745 (115,745)
XII - SOCCSKSARGEN 3,546 69,658 (66,112) 4,134 46,891 (42,757)
XIII - Caraga - 2,379 (2,379) - 4,994 (4,994)
ARMM - 85 (85) - 159 (159)
3rd Quarter 4th QuarterMode of Transport and
Region
2016
7-20

Table 7.5 - Continued
Outflow Inflow Balance Outflow Inflow Balance
Philippines 164,773,417 164,773,417 0 172,671,974 172,671,974 0
NCR 30,972,588 21,114,772 9,857,816 31,644,723 21,506,543 10,138,180
CAR - - - - - -
I - Ilocos Region - 1,553,442 (1,553,442) - 1,688,900 (1,688,900)
II - Cagayan Valley - 19,873 (19,873) - 18,102 (18,102)
III - Central Luzon 12,208,824 340,804 11,868,020 12,431,431 701,138 11,730,293
IVA - CALABARZON 229,217 7,359,718 (7,130,501) 166,254 6,962,203 (6,795,949)
IVB - MIMAROPA 1,045,857 2,781,595 (1,735,738) 1,176,992 3,027,962 (1,850,970)
V - Bicol Region 2,852,556 2,973,953 (121,397) 1,782,356 2,271,962 (489,606)
VI - Western Visayas 33,472,086 25,542,475 7,929,611 26,967,313 27,508,372 (541,059)
VII - Central Visayas 32,476,356 29,008,007 3,468,349 34,145,202 29,128,946 5,016,256
VIII - Eastern Visayas 21,223,479 11,446,171 9,777,308 25,739,974 13,278,466 12,461,508
IX - Zamboanga Peninsula 4,492,856 11,565,546 (7,072,690) 3,982,021 11,523,413 (7,541,392)
X - Northern Mindanao 11,704,121 18,586,155 (6,882,034) 17,911,901 19,391,958 (1,480,057)
XI - Davao Region 3,318,108 3,967,808 (649,700) 4,765,458 3,120,186 1,645,272
XII - SOCCSKSARGEN 1,899,829 1,047,412 852,417 1,664,614 1,501,765 162,849
XIII - Caraga 7,182,301 25,183,603 (18,001,302) 8,541,975 30,129,159 (21,587,184)
ARMM 1,695,241 2,282,085 (586,844) 1,751,763 912,901 838,862
WATER 164,459,406 164,459,406 0 172,547,862 172,547,862 0
NCR 30,833,391 20,958,217 9,875,174 31,644,723 21,405,268 10,239,455
CAR - - - - - -
I - Ilocos Region - 1,551,963 (1,551,963) - 1,687,971 (1,687,971)
II - Cagayan Valley - 19,858 (19,858) - 18,100 (18,100)
III - Central Luzon 12,208,824 340,804 11,868,020 12,431,431 701,138 11,730,293
IVA - CALABARZON 229,217 7,359,718 (7,130,501) 166,254 6,962,203 (6,795,949)
IVB - MIMAROPA 1,036,064 2,781,199 (1,745,135) 1,168,398 3,027,200 (1,858,802)
V - Bicol Region 2,850,441 2,973,271 (122,830) 1,781,544 2,270,318 (488,774)
VI - Western Visayas 33,347,685 25,512,425 7,835,260 26,896,586 27,504,934 (608,348)
VII - Central Visayas 32,447,608 28,942,666 3,504,942 34,114,634 29,123,907 4,990,727
VIII - Eastern Visayas 21,223,240 11,443,766 9,779,474 25,739,753 13,276,301 12,463,452
IX - Zamboanga Peninsula 4,489,407 11,565,216 (7,075,809) 3,979,690 11,521,924 (7,542,234)
X - Northern Mindanao 11,701,985 18,583,516 (6,881,531) 17,905,190 19,390,086 (1,484,896)
XI - Davao Region 3,318,108 3,926,475 (608,367) 4,765,458 3,117,730 1,647,728
XII - SOCCSKSARGEN 1,895,895 1,035,539 860,356 1,660,464 1,499,453 161,011
XIII - Caraga 7,182,301 25,182,803 (18,000,502) 8,541,975 30,128,514 (21,586,539)
ARMM 1,695,241 2,281,970 (586,729) 1,751,763 912,816 838,947
AIR 314,012 314,012 0 124,113 124,113 0
NCR 139,197 156,555 (17,358) - 101,275 (101,275)
CAR - - - - - -
I - Ilocos Region - 1,479 (1,479) - 929 (929)
II - Cagayan Valley - 15 (15) - 2 (2)
III - Central Luzon - - - - - -
IVA - CALABARZON - - - - - -
IVB - MIMAROPA 9,793 396 9,397 8,594 762 7,832
V - Bicol Region 2,115 682 1,433 812 1,644 (832)
VI - Western Visayas 124,401 30,050 94,351 70,727 3,438 67,289
VII - Central Visayas 28,748 65,341 (36,593) 30,568 5,039 25,529
VIII - Eastern Visayas 239 2,405 (2,166) 221 2,165 (1,944)
IX - Zamboanga Peninsula 3,449 330 3,119 2,331 1,489 842
X - Northern Mindanao 2,136 2,639 (503) 6,711 1,872 4,839
XI - Davao Region - 41,333 (41,333) - 2,456 (2,456)
XII - SOCCSKSARGEN 3,934 11,873 (7,939) 4,150 2,312 1,838
XIII - Caraga - 800 (800) - 645 (645)
ARMM - 115 (115) - 85 (85)
Mode of Transport and
Region
2017
1st Quarter 2nd Quarter
7-21

Table 7.5 - Continued
Outflow Inflow Balance Outflow Inflow Balance
Philippines 153,991,563 153,991,563 0 176,392,742 176,392,742 0
NCR 31,529,095 19,601,146 11,927,949 33,262,690 26,383,624 6,879,066
CAR - - - - - -
I - Ilocos Region - 1,096,617 (1,096,617) - 1,699,593 (1,699,593)
II - Cagayan Valley - 14,303 (14,303) - 59,172 (59,172)
III - Central Luzon 8,299,248 522,150 7,777,098 13,428,064 658,521 12,769,543
IVA - CALABARZON 213,710 5,177,387 (4,963,677) 235,833 8,191,125 (7,955,292)
IVB - MIMAROPA 688,282 3,769,422 (3,081,140) 700,689 2,273,896 (1,573,207)
V - Bicol Region 1,956,855 1,965,186 (8,331) 3,808,945 29,132,061 (25,323,116)
VI - Western Visayas 27,105,039 27,743,671 (638,632) 28,314,144 28,742,556 (428,412)
VII - Central Visayas 24,461,813 28,035,274 (3,573,461) 27,544,327 14,996,802 12,547,525
VIII - Eastern Visayas 24,649,359 7,705,749 16,943,610 26,112,041 9,204,561 16,907,480
IX - Zamboanga Peninsula 6,393,984 10,205,976 (3,811,992) 4,942,625 19,050,968 (14,108,343)
X - Northern Mindanao 15,317,901 17,505,807 (2,187,906) 16,718,042 4,180,641 12,537,401
XI - Davao Region 7,539,109 2,769,526 4,769,583 7,194,583 1,780,464 5,414,119
XII - SOCCSKSARGEN 2,194,640 992,828 1,201,812 5,100,501 1,135,532 3,964,969
XIII - Caraga 1,521,371 25,440,583 (23,919,212) 7,304,638 28,903,194 (21,598,556)
ARMM 2,121,157 1,445,941 675,216 1,725,620 31 1,725,589
WATER 153,809,126 153,809,126 0 176,263,420 176,263,420 0
NCR 31,493,724 19,469,952 12,023,772 33,260,980 26,268,814 6,992,166
CAR - - - - - -
I - Ilocos Region - 1,095,740 (1,095,740) - 1,699,018 (1,699,018)
II - Cagayan Valley - 14,300 (14,300) - 59,170 (59,170)
III - Central Luzon 8,299,248 522,150 7,777,098 13,428,064 658,521 12,769,543
IVA - CALABARZON 213,710 5,177,387 (4,963,677) 235,833 8,191,125 (7,955,292)
IVB - MIMAROPA 675,630 3,767,308 (3,091,678) 694,603 2,273,165 (1,578,562)
V - Bicol Region 1,956,701 1,963,872 (7,171) 3,808,772 29,130,606 (25,321,834)
VI - Western Visayas 27,013,093 27,735,116 (722,023) 28,229,458 28,740,564 (511,106)
VII - Central Visayas 24,452,947 28,013,358 (3,560,411) 27,522,325 14,994,074 12,528,251
VIII - Eastern Visayas 24,649,328 7,704,660 16,944,668 26,111,976 9,203,256 16,908,720
IX - Zamboanga Peninsula 6,393,125 10,205,173 (3,812,048) 4,941,799 19,050,695 (14,108,896)
X - Northern Mindanao 15,309,411 17,504,970 (2,195,559) 16,712,577 4,178,902 12,533,675
XI - Davao Region 7,524,414 2,759,884 4,764,530 7,194,583 1,777,929 5,416,654
XII - SOCCSKSARGEN 2,185,267 989,333 1,195,934 5,092,194 1,134,388 3,957,806
XIII - Caraga 1,521,371 25,439,990 (23,918,619) 7,304,638 28,903,194 (21,598,556)
ARMM 2,121,157 1,445,934 675,223 1,725,620 - 1,725,620
AIR 182,438 182,438 0 129,322 129,322 0
NCR 35,371 131,194 (95,823) 1,710 114,810 (113,100)
CAR - 0 - - - -
I - Ilocos Region - 876.902 (877) - 575 (575)
II - Cagayan Valley - 3 (3) - 2 (2)
III - Central Luzon - 0 - - - -
IVA - CALABARZON - 0 - - - -
IVB - MIMAROPA 12,652 2,114 10,538 6,086 731 5,355
V - Bicol Region 154 1,314 (1,160) 173 1,455 (1,282)
VI - Western Visayas 91,946 8,555 83,391 84,686 1,992 82,694
VII - Central Visayas 8,866 21,916 (13,050) 22,002 2,728 19,274
VIII - Eastern Visayas 31 1,089 (1,058) 65 1,305 (1,240)
IX - Zamboanga Peninsula 859 803 56 826 273 553
X - Northern Mindanao 8,490 837 7,653 5,465 1,739 3,726
XI - Davao Region 14,695 9,642 5,053 - 2,535 (2,535)
XII - SOCCSKSARGEN 9,373 3,495 5,878 8,307 1,144 7,163
XIII - Caraga - 593 (593) - - -
ARMM - 7 (7) - 31 (31)
Mode of Transport and
Region
2017
3rd Quarter 4th Quarter
7-22

Chapter 8
TOURISM
Data on tourism provide a panorama of the region as a tourist destination. The significance
of the picture presented by the data manifests the importance accorded to the tourism industry by both national and local leaders. Specifically, tourism has become a twin source of foreign exchange receipts and livelihood and employment opportunities for communities. Data on the industry are,
therefore, essential in providing vital links in the development and orchestration of campaigns aimed at providing the potentials of the region as a tourist hideaway. Local leaders can put up infrastructure programs and centers and facilities and institute policies and regulations that will
boost the inflow of visitors. Investors, on the other hand, can take the signals by developing tourist and recreational sites and putting up of establishments and amenities. In concrete terms, the data
likewise provide a quantitative measure of the results of programs that promote the area as a travelers’ destination and the industry’s contributions to the economic performance of the area.
This chapter presents regional and/or provincial/city data on the visitor arrivals and their countries of residence/origin and the number of hotels and hotel rooms. The data source is the
Department of Tourism Region 7 (DOT7).
Highlights
• Tourist arrivals in Central Visayas had increased by 17.1 percent from 5,954,603 in 2016 to 6,974,674 in 2017.
• Moreover, local tourist arrival also increased by 12.4 percent. Domestic tourists made up the 59.5 percent of the guests in the region in 2017. Meanwhile, the influx of foreign tourists had
also increased by 24.0 percent in 2017.
• Cebu is still the biggest drawer of guests in the region accounting 69.9 percent of the total tourist arrivals in 2017.

ContentsHighlights 8-1
STATISTICAL TABLES
Table 8.1 Visitor Arrivals by Country of Residence, Domestic and Foreign
Central Visayas: 2012-2017 …………………………………………………………..... 8-3
Table 8.2 Distribution of Travellers by Country of Residence and Province
2012-2017………….…………………………………………………………………………… 8-5
FIGURES
Figure 8.1 Distribution of Visitor Arrivals, Domestic and Foreign,
by Country of Residence, Central Visayas: 2017 …………………………………. 8-13
Figure 8.2 Top Ten Country of Residence of Foreign Visitor Arrivals
Central Visayas: 2017 …………………………………………………………………..…. 8-13
Figure 8.3 Visitors Arrivals by Province, Domestic and Foreign
Central Visayas: 2017 ……………………………………………………………………... 8-14
Figure 8.4 Visitor Arrivals by Type of Visitors in Central Visayas
2006-2017 …………………………………………………………………………………..… 8-14
8-2

Table 8.1
VISITOR ARRIVALS BY COUNTRY OF RESIDENCE, DOMESTIC AND FOREIGN
CENTRAL VISAYAS
2012-2017
Country of Residence 2012 2013 2014 2015 2016 2017
CENTRAL VISAYAS 2,928,079 3,491,886 4,033,391 4,609,718 5,954,603 6,974,674
Domestic 1,750,385 2,140,061 2,413,866 2,658,623 3,619,941 4,068,648
Overseas Filipinos* 16,121 8,214 11,969 15,189 11,533 24,225
Foreign 1,161,573 1,343,611 1,607,556 1,935,906 2,323,129 2,881,801
Asia 792,722 903,812 1,031,330 1,317,731 1,625,925 1,969,650
ASEAN 28,318 32,494 49,078 48,645 57,208 76,686
Brunei 279 312 968 488 1,210 2,371
Cambodia 104 133 718 547 986 2,855
Indonesia 4,359 2,729 4,572 3,855 4,271 6,634
Laos 80 115 586 536 773 1,519
Malaysia 5,258 6,416 12,105 13,221 12,592 16,058
Myanmar 107 490 1,020 562 1,225 1,880
Singapore 14,658 17,321 21,624 21,717 24,687 29,495
Thailand 2,739 4,004 5,752 5,688 8,502 11,783
Vietnam 734 974 1,733 2,031 2,962 4,091
East Asia 749,700 850,269 949,269 1,228,106 1,521,351 1,831,750
China 53,903 56,970 65,211 128,358 244,925 429,306
Hongkong 13,955 15,569 18,245 22,474 21,320 26,363
Japan 203,061 204,280 248,124 315,098 369,860 408,566
Korea 449,856 536,155 600,904 736,425 842,985 895,776
Taiwan 28,925 37,295 16,785 25,751 42,261 71,739
South Asia 7,278 10,323 14,483 18,217 17,641 25,020
Bangladesh 242 306 704 674 663 1,431
India 1/
5,391 8,333 10,380 14,034 12,114 14,704
Iran 1,034 637 1,238 1,249 1,640 3,316
Nepal 156 246 496 487 853 2,041
Pakistan 343 579 1,149 1,220 1,324 1,646
Sri Lanka 112 222 516 553 1,047 1,882
Middle East 7,426 10,726 18,500 22,763 29,725 36,194
Bahrain 286 399 1,041 833 1,101 1,632
Egypt 166 219 763 807 936 1,908
Israel 752 2,161 2,670 5,409 8,098 9,188
Jordan 299 387 913 587 902 1,596
Kuwait 906 1,103 1,429 1,530 2,047 3,091
Saudi Arabia 1/
3,806 4,487 8,281 8,892 11,572 12,163
United Arab Emirates 1,211 1,970 3,403 4,705 5,069 6,616
America 122,799 148,522 176,458 206,612 248,568 285,475
North America 121,702 146,692 172,408 202,229 241,299 271,086
Canada 16,535 26,470 30,399 35,301 35,281 43,084
Mexico 974 1,953 2,985 2,363 4,796 8,206
United States of
America 104,193 118,269 139,024 164,565 201,222 219,796
Note: * - Philippine passport holders permanently residing abroad; excludes overseas Filipino workers
Source: Department of Tourism, Region VII
8-3

Table 8.1 - Continued
Country of Residence 2012 2013 2014 2015 2016 2017
South America 1,097 1,830 4,050 4,383 7,269 14,389
Argentina 254 363 865 756 1,570 3,102
Brazil 645 937 1,646 1,891 3,461 5,216
Colombia 122 221 487 760 1,290 2,740
Peru 18 153 435 610 518 1,587
Venezuela 58 156 617 366 430 1,744
Europe 147,656 179,197 221,164 256,561 299,174 361,165
Western Europe 67,156 78,655 97,711 123,100 142,651 168,492
Austria 2,967 4,908 6,619 6,591 6,491 7,631
Belgium 3,513 4,274 5,489 5,707 8,085 9,234
France 17,474 21,629 24,591 33,545 42,961 50,257
Germany 24,590 27,121 32,847 43,576 46,918 58,432
Luxembourg 722 731 687 1,093 1,680 1,963
Netherlands 6,634 8,044 10,810 13,274 16,260 17,215
Switzerland 11,256 11,948 16,668 19,314 20,256 23,760
Northern Europe 54,185 65,965 84,003 90,125 99,852 115,403
Denmark 5,594 6,544 8,556 10,651 11,364 12,530
Finland 2,759 3,395 3,271 4,573 5,110 6,959
Ireland 2,425 2,931 4,005 5,176 7,197 10,685
Norway 14,156 16,339 15,784 15,679 16,769 16,548
Sweden 8,307 10,918 12,773 14,535 16,169 19,197
United Kingdom 20,944 25,838 39,614 39,511 43,243 49,484
Southern Europe 11,016 12,674 18,656 23,254 34,498 47,708
Greece 592 627 789 1,130 1,562 3,596
Italy 5,551 6,553 8,816 10,875 14,121 17,420
Portugal 557 459 963 1,260 2,061 3,482
Spain 4,271 4,994 7,825 9,710 16,387 20,246
Union of Serbia and
Montenegro 45 41 263 279 367 2,964
Eastern Europe 15,299 21,903 20,794 20,082 22,173 29,562
Commonwealth of
Independent States 53 184 471 278 479 1,449
Poland 1,343 2,151 2,872 4,799 6,175 8,726
Russia 13,903 19,568 17,451 15,005 15,519 19,387
Oceania 38,471 49,194 62,471 69,572 74,631 90,069
Australia 33,997 42,898 53,197 58,279 63,627 71,724
Guam 479 972 1,951 1,829 2,026 3,442
Nauru 72 59 235 220 234 1,219
New Zealand 3,566 4,282 5,239 6,856 7,643 9,812
Papua New Guinea 357 983 1,849 2,388 1,101 3,872
Africa 1,347 1,374 1,853 3,335 4,047 4,256
Nigeria 177 149 476 1,177 1,755 814
South Africa 1,170 1,225 1,377 2,158 2,292 3,442
Others and
Unspecified
Residences 58,578 61,512 114,280 82,095 70,784 171,186
8-4

Table 8.2
DISTRIBUTION OF TRAVELLERS BY COUNTRY OF RESIDENCE AND PROVINCE
2012-2017
Country of Residence 2012 2013 2014 2015 2016 2017
Bohol 356,370 389,767 455,155 602,257 1,000,186 1,131,065
Domestic 250,421 281,159 296,653 384,838 731,915 686,858
Overseas Filipinos 549 344 966 2,150 1,958 730
Foreign 105,400 108,264 157,536 215,269 266,313 443,477
Asia 68,621 58,541 81,360 118,853 142,877 299,859
ASEAN 3,318 2,306 3,581 5,066 6,423 6,746
Brunei 23 33 63 55 80 223
Cambodia 18 22 35 89 86 423
Indonesia 155 166 752 440 364 641
Laos - 5 24 111 41 45
Malaysia 661 350 677 1,118 1,228 1,336
Myanmar 16 28 56 76 173 99
Singapore 1,890 1,281 1,419 2,390 3,442 2,395
Thailand 468 328 455 601 725 1,009
Vietnam 87 93 100 186 284 575
East Asia 63,607 54,438 74,616 108,236 130,510 285,435
China 22,150 21,253 28,080 42,387 64,877 156,232
Hongkong 1,645 1,115 1,532 1,572 2,099 4,590
Japan 5,031 5,397 8,090 9,385 11,421 13,523
Korea 13,848 21,349 32,334 51,592 43,115 87,519
Taiwan 20,933 5,324 4,580 3,300 8,998 23,571
South Asia 491 714 904 1,868 1,977 1,928
Bangladesh 8 16 15 32 92 38
India 283 605 715 1,649 1,340 1,053
Iran 134 14 45 50 134 249
Nepal 17 18 18 43 109 26
Pakistan 43 46 27 51 107 113
Sri Lanka 6 15 84 43 195 449
Middle East 1,205 1,083 2,259 3,683 3,967 5,750
Bahrain 15 36 47 85 55 97
Egypt - 32 11 133 116 83
Israel 184 439 781 1,699 1,542 2,593
Jordan 59 39 121 80 192 195
Kuwait 71 44 113 115 182 400
Saudi Arabia 765 357 814 1,085 1,164 822
United Arab Emirates 111 136 372 486 716 1,560
America 13,095 12,818 17,804 24,487 31,950 34,325
North America 12,954 12,645 17,171 23,600 30,673 31,954
Canada 2,154 2,386 3,361 4,544 5,708 6,833
Mexico 136 295 338 291 1,225 1,415
United States of
America 10,664 9,964 13,472 18,765 23,740 23,706
Source: Department of Tourism
8-5

Table 8.2 - Continued
Country of Residence 2012 2013 2014 2015 2016 2017
South America 141 173 633 887 1,277 2,371
Argentina 49 33 86 142 350 721
Brazil 72 91 294 338 424 968
Colombia 10 34 46 200 329 353
Peru - 8 26 135 68 61
Venezuela 10 7 181 72 106 268
Europe 17,885 24,641 42,300 54,507 70,637 92,846
Western Europe 9,281 12,772 19,674 27,774 36,794 42,321
Austria 403 394 834 1,247 1,564 1,390
Belgium 516 539 906 1,183 2,094 2,358
France 2,576 4,199 5,451 9,553 13,111 15,726
Germany 3,731 4,539 6,514 8,204 11,029 14,038
Luxembourg 105 97 82 288 514 315
Netherlands 762 1,109 2,160 3,213 3,578 3,423
Switzerland 1,188 1,895 3,727 4,086 4,904 5,071
Northern Europe 5,729 7,205 12,463 15,972 18,316 22,526
Denmark 848 1,282 1,680 2,723 2,886 3,242
Finland 353 526 547 776 920 1,435
Ireland 351 279 619 730 1,198 1,747
Norway 1,138 1,241 2,073 1,584 2,060 2,561
Sweden 1,425 1,725 3,257 2,998 3,965 4,978
United Kingdom 1,614 2,152 4,287 7,161 7,287 8,563
Southern Europe 1,412 1,495 3,936 4,590 8,117 13,553
Greece 31 53 156 89 222 482
Italy 677 654 1,656 2,020 2,914 4,724
Portugal 35 62 243 237 407 708
Spain 649 703 1,725 2,183 4,463 6,315
Union of Serbia and
Montenegro 20 23 156 61 111 1,324
Eastern Europe 1,463 3,169 6,227 6,171 7,410 14,446
Commonwealth of
Independent
States 48 79 74 63 315 255
Poland 206 431 901 1,468 2,382 6,060
Russia 1,209 2,659 5,252 4,640 4,713 4,713
Oceania 3,470 4,279 6,187 7,240 9,329 13,995
Australia 3,051 3,736 5,262 6,165 8,078 9,680
Guam 103 213 252 192 325 423
Nauru - 10 - 11 33 40
New Zealand 299 290 604 846 768 1,679
Papua New Guinea 17 30 69 26 125 2,173
Africa 139 184 249 353 1,296 847
Nigeria 54 24 86 52 966 49
South Africa 85 160 163 301 330 798
Others and
Unspecified
Residences 2,190 7,801 9,636 9,829 102,224 6,318
8-6

Table 8.2 - Continued
Country of Residence 2012 2013 2014 2015 2016 2017
Cebu 2,230,323 2,598,250 3,018,322 3,320,949 4,172,138 4,877,047
Domestic 1,222,035 1,439,247 1,649,551 1,722,624 2,288,571 2,613,005
Overseas Filipinos 10,985 6,182 9,321 9,686 8,051 18,833
Foreign 997,303 1,152,821 1,359,450 1,588,639 1,875,516 2,245,209
Asia 710,634 828,955 929,386 1,152,650 1,389,497 1,580,480
ASEAN 24,082 28,444 43,021 40,989 46,942 66,393
Brunei 248 199 848 388 1,018 2,038
Cambodia 73 85 593 424 859 2,388
Indonesia 4,105 2,453 3,644 3,244 3,571 5,747
Laos 64 99 500 399 705 1,441
Malaysia 4,404 5,746 10,863 11,418 10,918 13,995
Myanmar 83 425 909 421 967 1,662
Singapore 12,401 15,165 19,312 18,275 19,656 25,855
Thailand 2,071 3,452 4,807 4,771 6,655 9,951
Vietnam 633 820 1,545 1,649 2,593 3,316
East Asia 674,249 782,785 859,169 1,079,028 1,305,003 1,463,534
China 28,325 31,392 31,936 59,220 108,769 203,718
Hongkong 11,860 13,703 16,186 20,205 18,181 19,727
Japan 194,432 195,230 236,170 301,281 353,823 390,796
Korea 432,270 510,963 563,483 676,570 791,777 802,298
Taiwan 7,362 31,497 11,394 21,752 32,453 46,995
South Asia 6,335 9,032 12,534 15,443 14,579 22,183
Bangladesh 232 262 636 632 526 1,378
India 4,822 7,381 9,201 11,791 10,172 13,089
Iran 756 550 792 1,038 1,192 2,885
Nepal 138 197 456 429 720 1,971
Pakistan 293 472 1,059 1,087 1,147 1,473
Sri Lanka 94 170 390 466 822 1,387
Middle East 5,968 8,694 14,662 17,190 22,973 28,370
Bahrain 258 329 964 715 968 1,468
Egypt 155 144 596 561 777 1,654
Israel 437 1,165 1,252 2,473 4,872 5,285
Jordan 233 299 642 386 620 1,347
Kuwait 816 1,007 1,225 1,370 1,703 2,527
Saudi Arabia 2,983 4,037 7,191 7,567 9,794 11,104
United Arab Emirates 1,086 1,713 2,792 4,118 4,239 4,985
America 97,702 114,924 139,123 158,087 193,068 225,166
North America 96,834 113,665 136,168 155,302 187,616 214,145
Canada 11,862 20,078 23,112 25,558 24,338 31,363
Mexico 704 1,329 2,341 1,611 3,178 6,498
United States of
America 84,268 92,258 110,715 128,133 160,100 176,284
8-7

Table 8.2 - Continued
Country of Residence 2012 2013 2014 2015 2016 2017
South America 868 1,259 2,955 2,785 5,452 11,021
Argentina 185 253 677 557 1,167 2,245
Brazil 518 642 1,203 1,226 2,769 3,762
Colombia 99 165 401 434 832 2,218
Peru 18 92 352 371 383 1,411
Venezuela 48 107 322 197 301 1,385
Europe 103,765 118,016 139,427 155,857 176,853 228,812
Western Europe 42,606 45,634 55,726 68,612 76,358 99,819
Austria 2,078 2,874 3,770 3,570 3,407 5,174
Belgium 2,282 2,542 3,102 3,193 4,409 5,683
France 9,097 10,784 12,088 14,485 19,360 23,744
Germany 16,346 16,066 19,633 27,058 27,141 36,306
Luxembourg 602 549 501 676 1,136 1,551
Netherlands 4,544 5,395 6,829 7,504 9,125 11,325
Switzerland 7,657 7,424 9,803 12,126 11,780 16,036
Northern Europe 40,228 47,558 60,008 62,228 68,527 83,678
Denmark 3,542 3,756 5,124 6,100 6,188 7,584
Finland 1,903 1,899 1,745 2,796 2,961 4,937
Ireland 1,820 1,918 2,598 3,656 4,990 8,413
Norway 11,610 13,534 12,197 12,550 13,113 12,833
Sweden 5,783 7,180 7,310 9,279 9,978 12,664
United Kingdom 15,570 19,271 31,034 27,847 31,297 37,247
Southern Europe 7,791 8,087 11,045 13,466 19,789 27,603
Greece 507 420 498 957 1,230 2,931
Italy 3,924 4,570 5,497 6,719 9,220 11,136
Portugal 352 294 465 857 1,348 2,557
Spain 2,993 2,793 4,500 4,827 7,807 9,365
Union of Serbia and
Montenegro 15 10 85 106 184 1,614
Southern Europe 13,140 16,737 12,648 11,551 12,179 17,712
Commonwealth of
Independent
States 5 96 337 137 158 1,133
Poland 1,000 1,131 1,191 2,342 2,527 4,151
Russia 12,135 15,510 11,120 9,072 9,494 12,428
Oceania 30,886 39,468 49,388 52,387 58,047 70,577
Australia 27,589 34,658 42,418 44,824 49,736 57,399
Guam 343 721 1,604 1,574 1,649 2,968
Nauru 72 45 195 188 114 1,156
New Zealand 2,548 3,107 3,585 4,746 5,736 7,366
Papua New Guinea 334 937 1,586 1,055 812 1,688
Africa 1,151 1,066 1,403 2,692 2,499 3,233
Nigeria 110 116 347 1,097 682 748
South Africa 1,041 950 1,056 1,595 1,817 2,485
Others and
Unspecified
Residences 53,165 50,392 100,723 66,966 55,552 136,941
8-8

Table 8.2 - Continued
Country of Residence 2012 2013 2014 2015 2016 2017
Negros Oriental 307,980 470,438 519,429 625,295 696,403 869,774
Domestic 259,728 401,696 444,317 517,016 554,550 716,393
Overseas Filipinos 4,587 1,688 1,682 3,353 1,524 4,662
Foreign 43,665 67,054 73,430 104,926 140,329 148,719
Asia 11,984 14,701 18,389 36,978 77,345 69,795
ASEAN 852 1,703 2,419 2,536 3,709 3,407
Brunei 8 80 57 44 112 110
Cambodia 6 26 88 34 38 44
Indonesia 99 106 174 165 329 236
Laos 16 11 62 26 27 33
Malaysia 189 316 551 668 413 693
Myanmar 8 37 55 65 85 117
Singapore 322 855 862 1,038 1,549 1,203
Thailand 193 215 482 306 1,087 774
Vietnam 11 57 88 190 69 197
East Asia 10,539 11,631 13,534 32,165 70,705 64,253
China 3,196 3,656 4,204 19,087 57,419 52,244
Hongkong 441 751 516 665 1,027 1,847
Japan 3,022 3,200 3,267 3,829 3,899 3,591
Korea 3,304 3,580 4,819 7,917 7,688 5,589
Taiwan 576 444 728 667 672 982
South Asia 432 542 1,025 857 1,047 863
Bangladesh 2 28 53 10 41 14
India 266 312 444 560 579 527
Iran 144 73 401 147 308 182
Nepal 1 31 22 15 20 44
Pakistan 7 61 63 82 69 50
Sri Lanka 12 37 42 43 30 46
Middle East 161 825 1,411 1,420 1,884 1,272
Bahrain 13 34 30 33 78 67
Egypt 11 39 154 113 43 133
Israel 42 443 472 777 791 561
Jordan 7 49 150 119 90 54
Kuwait 19 48 91 45 162 162
Saudi Arabia 55 91 275 233 606 228
United Arab Emirates 14 121 239 100 114 67
America 9,770 18,457 16,772 20,931 19,370 22,290
North America 9,699 18,067 16,314 20,249 18,905 21,353
Canada 1,910 3,447 3,199 4,450 4,071 4,082
Mexico 129 321 296 432 351 257
United States of
America 7,660 14,299 12,819 15,367 14,483 17,014
8-9

Table 8.2 - Continued
Country of Residence 2012 2013 2014 2015 2016 2017
South America 71 390 458 682 465 937
Argentina 11 69 101 51 38 133
Brazil 53 204 148 310 231 448
Colombia 7 22 38 120 108 152
Peru - 53 57 104 67 113
Venezuela - 42 114 97 21 91
Europe 17,862 26,835 29,271 34,123 35,842 25,897
Wester Europe 10,346 14,266 16,344 19,663 19,491 15,685
Austria 303 1,392 1,780 1,520 1,166 821
Belgium 489 941 1,143 1,019 1,082 700
France 3,924 4,115 4,617 6,862 7,011 6,651
Germany 2,864 4,660 4,864 5,964 5,491 4,613
Luxembourg - 84 104 105 29 89
Netherlands 860 1,018 1,299 1,662 2,013 1,148
Switzerland 1,906 2,056 2,537 2,531 2,699 1,663
Northern Europe 5,725 8,429 8,571 8,884 8,776 5,431
Denmark 723 1,104 1,167 1,268 1,354 955
Finland 309 746 778 809 1,018 404
Ireland 130 590 641 640 774 351
Norway 1,131 1,316 1,254 1,314 1,392 1,016
Sweden 608 1,443 1,670 1,710 1,505 964
United Kingdom 2,824 3,230 3,061 3,143 2,733 1,741
Southern Europe 1,282 2,361 2,767 3,833 5,722 3,562
Greece 40 137 127 76 95 175
Italy 775 1,096 1,387 1,876 1,479 1,210
Portugal 141 65 207 89 2,225 158
Spain 316 1,055 1,024 1,712 1,851 1,993
Union of Serbia and
Montenegro 10 8 22 80 72 26
Eastern Europe 509 1,779 1,589 1,743 1,853 1,219
Commonwealth of
Independent
States - 9 60 78 6 61
Poland 66 448 584 566 718 440
Russia 443 1,322 945 1,099 1,129 718
Oceania 3,242 4,546 5,990 8,901 6,067 4,252
Australia 2,613 3,780 4,766 6,416 4,750 3,521
Guam 33 38 95 61 52 51
Nauru - 4 34 21 87 23
New Zealand 590 708 901 1,096 1,014 646
Papua New Guinea 6 16 194 1,307 164 11
Africa 32 60 179 196 198 110
Nigeria 13 7 41 26 107 15
South Africa 19 53 138 170 91 95
Others and
Unspecified
Residences 775 2,455 2,829 3,797 3,507 26,375
8-10

Table 8.2 - Continued
Country of Residence 2012 2013 2014 2015 2016 2017
Siquijor 33,406 33,431 40,485 61,217 85,878 96,788
Domestic 18,201 17,959 23,345 34,145 44,905 52,392
Overseas Filipinos - - - - - -
Foreign 15,205 15,472 17,140 27,072 4,097 44,396
Asia 1,483 1,615 2,195 9,250 16,206 19,516
ASEAN 66 41 57 54 134 140
Brunei - - - 1 - -
Cambodia 7 2 3 -
Indonesia - 4 2 6 7 10
Laos - - - - - -
Malaysia 4 4 14 17 33 34
Myanmar - - - - - 2
Singapore 45 20 31 14 40 42
Thailand 7 9 8 10 35 49
Vietnam 3 4 - 6 16 3
East Asia 1,305 1,415 1,950 8,677 15,133 18,528
China 232 669 991 7,664 13,860 17,112
Hongkong 9 11 32 13 199
Japan 576 453 597 603 717 656
Korea 434 263 268 346 405 370
Taiwan 54 30 83 32 138 191
South Asia 20 35 20 49 38 46
Bangladesh - - - - 4 1
India 20 35 20 34 23 35
Iran - - - 14 6 -
Nepal - - - - 4 -
Pakistan - - - - 1 10
Sri Lanka - - - 1 - -
Middle East 92 124 168 470 901 802
Egypt - 4 2 - - 38
Israel 89 114 165 460 893 749
Jordan - - - 2 - -
Kuwait - 4 - - - 2
Saudi Arabia 3 2 1 7 8 9
United Arab Emirates - - - 1 - 4
America 2,232 2,323 2,759 3,107 4,180 3,694
North America 2,215 2,315 2,755 3,078 4,105 3,634
Canada 609 559 727 749 1,164 806
Mexico 5 8 10 29 42 36
United States of
America 1,601 1,748 2,018 2,300 2,899 2,792
8-11

Table 8.2 - Continued
Country of Residence 2012 2013 2014 2015 2016 2017
South America 17 8 4 29 75 60
Argentina 9 8 1 6 15 3
Brazil 2 - 1 17 37 38
Colombia 6 - 2 6 21 17
Peru - - - - - 2
Venezuela - - - - 2 -
Europe 8,144 9,705 10,166 12,074 17,844 18,323
Western Europe 4,923 5,983 5,967 7,051 10,008 10,667
Austria 183 248 235 254 354 246
Belgium 226 252 338 312 500 493
France 1,877 2,531 2,435 2,645 3,479 4,136
Germany 1,649 1,856 1,836 2,350 3,257 3,475
Luxembourg 15 1 - 24 1 8
Netherlands 468 522 522 895 1,544 1,319
Switzerland 505 573 601 571 873 990
Northern Europe 2,503 2,773 2,961 3,041 4,233 3,768
Denmark 481 402 585 560 936 749
Finland 194 224 201 192 211 183
Ireland 124 144 147 150 235 174
Norway 277 248 260 231 204 138
Sweden 491 570 536 548 721 591
United Kingdom 936 1,185 1,232 1,360 1,926 1,933
Southern Europe 531 731 908 1,365 2,870 2,990
Greece 14 17 8 8 15 8
Italy 175 233 276 260 508 350
Portugal 29 38 48 77 81 59
Spain 313 443 576 988 2,266 2,573
Union of Serbia and
Montenegro - - - 32 - -
Eastern Europe 187 218 330 617 733 898
Commonwealth of
Independent
States - - - - - -
Poland 71 141 196 423 550 717
Russia 116 77 134 194 183 181
Oceania 873 901 906 1,044 1,188 1,245
Australia 744 724 751 874 1,063 1,124
Guam - - - 2 - -
Nauru - - 6 - - -
New Zealand 129 177 149 168 125 121
Papua New Guinea - - - - - -
Africa 25 64 22 94 54 66
Nigeria 2 2 2 - 2
South Africa 25 62 20 92 54 64
Others and
Unspecified
Residences 2,448 864 1,092 1,503 1,501 1,552
8-12

Korea
Japan
China
USA
Australia
Germany
UK
France
Taiwan
Canada
895,776
429,306
408,566
219,796
71,739
71,724
58,432
50,257
49,484
43,084
6,950,449
Figure 8.2 Top Ten Country of Residence of Foreign Visitor Arrivals, Central Visayas: 2017
Domestic
4,068,648
Asia, 68.35%
Europe, 12.53%
America, 9.91%
Oceania,, 3.13%
Others and
Unspecified
Residences, 5.94%
Africa, 0.15%
Foreign,
2,881,801
Figure 8.1 Distribution of Visitors Arrivals, Domestic and Foreign, by Country of Residence in Central Visayas: 2017
8-13

DOMESTIC
FOREIGN
Domestic
Foreign
Overseas Filipinos
686,858
2,613,005
716,393
52,392
443,477
2,245,209
148,719 44,396
-
500,000
1,000,000
1,500,000
2,000,000
2,500,000
3,000,000
BOHOL CEBU NEGROS ORIENTAL SIQUIJOR
Figure 8.3 Visitors Arrivals by Province, Domestic and ForeignCentral Visayas: 2017
Domestic Foreign
0
5,000
10,000
15,000
20,000
25,000
30,000
0
500,000
1,000,000
1,500,000
2,000,000
2,500,000
3,000,000
3,500,000
4,000,000
4,500,000
2006 2007 2008 2009 2010 2011 2012 2013 2014 2015 2016 2017
Figure 8.4 Visitor Arrivals by Type of VisitorsCentral Visayas: 2006-2017
Domestic Foreign Overseas Filipinos
8-14

Chapter 9
VITAL, HEALTH AND NUTRITION STATISTICS
Data on vital events, health and nutrition are key inputs to programs aimed at providing the basic minimum services to the citizenry. The data provide a profile of the health status and the level, causes and patterns of the mortality and morbidity of the population. The health and nutrition status
of the people are an utmost concern of local governance. The focus of current development efforts is towards extending better services and expanding the delivery system even to the remotest rural
communities. This is anchored on the concept that no individual should be deprived of the right to health care. Furthermore, the strength and well-being of the people influence their capabilities to engage in various economic endeavors. A cross-analysis of the data with the demographic and
socioeconomic information of the target population shows the existing and potential problems in an area. The health and nutrition status of the population should therefore be a priority in public service
to truly empower the people, an objective of growth and development. These concerns and objectives necessitate the provision of data as bases in the delivery of services catering to the health and nutritional requirements of individuals.
This chapter presents statistics for the region and its provinces/cities on the registration of
vital events such as number of births, deaths and marriages, including infant and maternal deaths,
and the leading causes of mortality. The source of data is the Philippine Statistics Authority (PSA) for vital statistics that were processed using the certificates of births, deaths and marriages under the
country’s Civil Registration System. The data on mortality are sourced from the Department of Health compiled from its reporting systems.
Highlights
• The reported marriages in 2017 showed an increase of 7.6 percent from the 34,192 marriages in 2016. Among the cities in Central Visayas, Cebu City had the highest reported marriages with 4,206. The municipality of Minglanilla had the highest reported marriages with 1,535 among the municipalities in Central Visayas.
• There were more males born in 2016 compared to females. Of the total number reported births in Central Visayas in 2016, 52.1 percent were males. The total number of reported births in 2016 decreased by 4.6 as compared to 2014.
• Of the total 145,671 live births in 2016, majority were attended by the health professionals at 93.3 percent. 5.3 percent were attended by traditional birth attendant.
• The reported deaths in 2014 numbered 44,615, an increase of 766 or 1.7 percent from 43,849 deaths recorded in 2013.
• In 2017, the top leading causes of mortality was Pneumonia and the next leading cause of mortality was cardiovascular diseases. Eclampsia was the leading cause of maternal mortality while for infant mortality was Pneumonia.

ContentsHighlights 9-1
Statistical Tables
Table 9.1 Marriages by Place of Occurrence, by Province and
by City/Municipality: 2010-2017 ………………………………………………………….. 9-2
Table 9.2 Live Births by Place of Occurrence, by Sex, by Province and
by City/Municipality: 2013-2016 ………………………………………………………... 9-7
Table 9.3 Live Births by Usual Residence of Mother, by Sex, by Province
and by City/Municipality: 2014-2017 ………………………………………………….... 9-13
Table 9-4 Live Births by Place of Occurrence, by Attendant at Birth, by Province
and by City/Municipality: 2013-2016 ………………………………………………….... 9-21
Table 9-5 Deaths by Place of Occurrence, by Sex, by Province and by
City/Municipality: 2011-2014 …………………………………………………………….... 9-27
Table 9-6 Mortality, Leading Causes, Number and Rate Per 100,000 Population
Central Visayas: 2012-2017 ..………………………………………………………………. 9-33
Table 9-7 Maternal Mortality, Leading Causes, Number, Rate Per 1000
Live Births and Percent Distribution: 2012-2017 ………………………………....… 9-35
Table 9.8 Infant Mortality, Leading Causes, Number, Rate Per 1000
Live Births and Percent Distribution: 2012-2017 ………………………………….… 9-37
Table 9.8 Infant Mortality Rate by Region, Philippines (Rate Per 1000 live births)
1998, 2003, 2008 and 2013 ..……………………...……………………………………… 9-39
Table 9.8 Under-Five Mortality Rate by Region, Philippines
(Rate Per 1000 live births): 1998, 2003, 2008, and 2013 ..……………………… 9-39
Figures
Figure 9.1 Marriages in Central Visayas: 2010-2017 ………………………………………..….... 9-12
Figure 9.2 Live Birth by Sex and by Province: 2016………………………………………………….. 9-6
9-2

Table 9.1
MARRIAGES BY PLACE OF OCCURRENCE, BY PROVINCE AND BY CITY/MUNICIPALITY
CENTRAL VISAYAS
2012-2017
2012 2013 2014 2015 2016 2017*
36,273 33,483 34,149 34,343 34,192 36,776
7,094 6,023 6,256 6,136 6,512 7,046
Alburquerque 34 73 64 41 31 48
Alicia 121 111 99 99 128 136
Anda 70 86 57 44 67 75
Antequera 74 62 80 81 79 52
Baclayon 124 92 100 78 71 70
Balilihan 88 125 87 87 83 105
Batuan 77 64 59 83 66 75
Bien Unido 106 79 103 125 95 91
Bilar 100 74 82 77 71 140
Buenavista 153 158 133 167 154 142
Calape 173 126 114 97 137 146
Candijay 127 125 132 147 163 297
Carmen 288 251 315 267 354 114
Catigbian 120 122 121 121 101 135
Clarin 109 61 91 107 87 37
Corella 51 40 50 52 37 70
Cortes 52 64 42 64 97 102
Dagohoy 113 105 104 103 114 120
Danao 127 82 79 95 104 264
Dauis 278 236 213 250 240 76
Dimiao 29 55 41 42 44 87
Duero 112 64 72 114 69 143
Garcia Hernandez 126 92 114 97 79 140
Guindulman 153 228 96 130 162 282
Inabanga 232 212 237 240 170 157
Jagna 184 151 143 145 191 186
Jetafe 206 205 143 150 206 26
Lila 67 26 37 30 38 55
Loay 83 73 62 37 66 73
Loboc 78 51 112 88 63 156
Loon 163 138 135 153 170 141
Mabini 129 109 113 98 122 96
Maribojoc 85 66 84 87 84 171
Panglao 139 115 115 112 137 133
Pilar 153 145 166 106 150 87
Pres. Carlos P. Garcia 84 83 103 67 86 149
Sagbayan 163 73 91 74 110 39
San Isidro 49 37 29 40 47 160
San Miguel 158 138 153 142 160 38
Sevilla 67 45 52 44 35 137
Sierra Bullones 142 127 113 107 104 45
Sikatuna 34 24 31 31 26 768
Tagbilaran City 645 576 690 701 728 406
Talibon 430 326 286 353 369 207
Trinidad 179 149 179 132 155 203
Tubigon 214 224 189 209 246 428
Ubay 456 238 360 304 267 130
Valencia 149 117 185 118 149 108
Note: Figures are not adjusted for under-registration.
Civil registration is a continuous process, hence there is a need to establish certain cut-off period.
* The data presented herein are events occurred from January to December 2017, registered at the local
Civil Registry Offices until January 2018, and subsequently submitted to the PSA-CRS until March 2018.
Source: Vital Statistics Report, Philippine Statistics Authority
Place of Occurrence of Mother /
Province/City/Municipality
BOHOL
CENTRAL VISAYAS
9-3

Table 9.1 - Continued
2012 2013 2014 2015 2016 2017*
20,999 20,081 19,903 20,653 19,809 21,627
Alcantara 84 69 64 67 64 63
Alcoy 47 69 49 111 54 40
Alegria 125 70 148 110 127 140
Aloguinsan 135 145 116 170 133 176
Argao 298 295 297 339 288 253
Asturias 180 212 197 185 199 200
Badian 175 104 118 122 158 154
Balamban 471 633 365 346 425 329
Bantayan 417 379 262 418 315 371
Barili 382 284 358 294 362 335
Bogo 448 314 327 388 444 501
Boljoon 50 72 121 166 117 119
Borbon 148 139 144 136 114 108
Carcar 551 507 570 588 605 641
Carmen 183 163 151 142 159 179
Catmon 179 130 150 172 198 191
Cebu City 4,200 3,706 3,858 3,606 3,898 4,206
Compostela 137 163 183 190 270 287
Consolacion 444 406 516 550 555 518
Cordoba 269 395 347 333 395 413
Daanbantayan 219 195 259 248 289 417
Dalaguete 368 330 333 441 340 336
Danao City 700 691 693 709 709 709
Dumanjug 300 288 367 428 325 362
Ginatilan 48 60 58 91 60 53
Lapu-lapu City 1,574 1,622 1,673 1,584 1,482 1,840
Liloan 492 424 346 349 353 488
Madridejos 158 75 172 324 120 85
Malabuyoc 146 87 83 110 57 121
Mandaue City 1,259 1,303 1,373 1,438 1,153 1,346
Medellin 267 315 253 371 339 251
Minglanilla 1,498 1,354 1,339 1,383 1,454 1,535
Moalboal 139 80 94 71 141 118
Naga 608 442 536 506 401 482
Oslob 132 137 153 92 157 130
Pilar 36 26 29 104 26 34
Pinamungahan 280 306 313 304 303 314
Poro 85 152 86 90 77 109
Ronda 104 89 56 68 61 68
Samboan 109 71 92 78 110 82
San Fernando 240 255 226 323 234 319
San Francisco 219 209 206 172 213 176
San Remigio 184 176 152 224 232 215
Santa Fe 173 145 98 190 101 196
Santander 50 45 70 68 72 79
Sibonga 191 239 278 313 261 270
Sogod 112 89 99 97 127 136
Tabogon 184 160 181 210 194 222
Tabuelan 104 140 71 118 82 119
City of Talisay 773 827 928 821 568 807
Toledo City 1,017 1,162 700 624 598 687
Tuburan 279 255 222 237 245 255
Tudela 28 77 23 34 45 42
CEBU
Place of Occurrence of Mother /
Province/City/Municipality
9-4

Table 9.1 - Continued
2012 2013 2014 2015 2016 2017*
7,789 7,042 7,634 7,191 7,551 7,711
Amlan 193 134 122 147 109 117
Ayungon 301 241 211 239 237 239
Bacong 182 190 215 187 178 205
Bais City 462 453 479 414 483 489
Basay 124 84 101 81 129 129
City of Bayawan 555 509 518 517 601 616
Bindoy 239 256 230 227 252 256
Canlaon City 316 310 242 250 229 284
Dauin 138 119 130 105 124 93
Dumaguete City 708 636 752 695 679 673
Guihulngan 552 539 568 633 704 579
Jimalalud 221 177 163 176 226 200
La Libertad 297 259 267 221 254 274
Mabinay 710 523 573 588 705 635
Manjuyod 339 298 349 286 333 327
Pamplona 269 253 260 236 241 314
San Jose 145 114 107 68 90 98
Santa Catalina 355 345 424 404 356 402
Siaton 427 377 477 395 322 353
Sibulan 290 246 324 322 245 258
City of Tanjay 347 370 430 308 366 471
Tayasan 215 238 280 285 287 252
Valencia 80 84 108 107 124 129
Vallehermoso 207 169 167 164 170 189
Zamboanguita 117 118 137 136 107 129
391 337 356 363 320 392
Enrique Villanueva 31 24 29 17 21 15
Larena 33 44 38 46 53 45
Lazi 90 75 90 62 61 68
Maria 70 45 60 78 43 68
San Juan 59 57 53 57 59 68
Siquijor 108 92 86 103 83 128
NEGROS ORIENTAL
SIQUIJOR
Place of Occurrence of Mother /
Province/City/Municipality
9-5

Table 9.2
LIVE BIRTHS BY PLACE OF OCCURRENCE, BY SEX, BY PROVINCE AND BY CITY/MUNICIPALITY
2013-2016
Both
SexesMale Female
Both
SexesMale Female
150,927 78,639 72,288 152,761 79,507 73,254
23,921 12,542 11,379 23,786 12,361 11,425
Alburquerque 25 14 11 24 14 10
Alicia 323 177 146 288 146 142
Anda 149 75 74 143 71 72
Antequera 107 56 51 86 38 48
Baclayon 164 77 87 168 81 87
Balilihan 97 52 45 71 39 32
Batuan 133 65 68 87 40 47
Bien Unido 430 227 203 396 194 202
Bilar 221 111 110 210 111 99
Buenavista 352 180 172 266 139 127
Calape 500 260 240 592 325 267
Candijay 404 222 182 350 179 171
Carmen 1,440 761 679 1,472 782 690
Catigbian 367 193 174 232 116 116
Clarin 316 173 143 272 151 121
Corella 31 12 19 51 22 29
Cortes 150 90 60 135 75 60
Dagohoy 203 96 107 177 84 93
Danao 310 165 145 330 161 169
Dauis 610 336 274 617 336 281
Dimiao 155 83 72 143 66 77
Duero 102 60 42 75 35 40
Garcia Hernandez 192 95 97 136 83 53
Guindulman 346 188 158 313 160 153
Inabanga 709 355 354 656 332 324
Jagna 1,045 517 528 1,137 577 560
Jetafe 499 264 235 415 216 199
Lila 64 30 34 51 25 26
Loay 105 48 57 96 44 52
Loboc 110 56 54 94 41 53
Loon 516 257 259 453 242 211
Mabini 390 215 175 350 180 170
Maribojoc 142 87 55 98 55 43
Panglao 145 81 64 112 55 57
Pilar 324 159 165 276 125 151
Pres. Carlos P. Garcia 339 168 171 299 151 148
Sagbayan 140 82 58 124 68 56
San Isidro 8 4 4 3 2 1
San Miguel 662 361 301 475 264 211
Sevilla 127 75 52 115 58 57
Sierra Bullones 324 165 159 242 118 124
Sikatuna 44 26 18 50 26 24
Tagbilaran City 6,155 3,283 2,872 6,560 3,444 3,116
Source: Vital Statistics Report, Philippine Statistics Authority
2013 2014
CENTRAL VISAYAS
BOHOL
Place of Occurrence/
Province/City/ Municipality
9-6

Table 9.2 - Continued
Both
SexesMale Female
Both
SexesMale Female
148,513 77,411 71,102 145,671 76,358 69,313
22,668 11,831 10,837 22,216 11,604 10,612
Alburquerque 16 7 9 24 14 10
Alicia 210 106 104 211 104 107
Anda 155 80 75 142 73 69
Antequera 48 24 24 41 15 26
Baclayon 168 91 77 125 68 57
Balilihan 61 30 31 48 24 24
Batuan 86 44 42 45 23 22
Bien Unido 370 199 171 367 200 167
Bilar 184 95 89 175 86 89
Buenavista 170 92 78 181 100 81
Calape 569 314 255 530 281 249
Candijay 323 169 154 283 147 136
Carmen 1,309 689 620 1,041 538 503
Catigbian 325 171 154 329 184 145
Clarin 309 160 149 312 154 158
Corella 60 32 28 59 19 40
Cortes 114 62 52 104 51 53
Dagohoy 172 89 83 150 76 74
Danao 298 141 157 265 127 138
Dauis 440 238 202 534 283 251
Dimiao 132 64 68 121 61 60
Duero 87 44 43 107 51 56
Garcia Hernandez 86 38 48 64 36 28
Guindulman 270 136 134 258 135 123
Inabanga 507 269 238 420 193 227
Jagna 1,142 606 536 1,196 635 561
Jetafe 375 207 168 395 210 185
Lila 53 26 27 42 21 21
Loay 61 26 35 37 20 17
Loboc 84 43 41 69 29 40
Loon 358 171 187 273 150 123
Mabini 326 159 167 273 144 129
Maribojoc 105 48 57 81 41 40
Panglao 113 49 64 152 68 84
Pilar 194 108 86 228 128 100
Pres. Carlos P. Garcia 263 141 122 209 101 108
Sagbayan 101 50 51 67 36 31
San Isidro 8 4 4 2 1 1
San Miguel 387 183 204 319 163 156
Sevilla 84 37 47 64 38 26
Sierra Bullones 232 112 120 221 110 111
Sikatuna 29 16 13 27 17 10
Tagbilaran City 6,562 3,491 3,071 6,315 3,363 2,952
2015Place of Occurrence/
Province/City/ Municipality
CENTRAL VISAYAS
BOHOL
2016
9-7

Table 9.2 - Continued
Both
SexesMale Female
Both
SexesMale Female
Talibon 1,805 918 887 1,820 956 864
Trinidad 307 168 139 298 165 133
Tubigon 714 362 352 854 433 421
Ubay 1,696 874 822 2,180 1,141 1,039
Valencia 424 219 205 394 195 199
102,651 53,581 49,070 104,413 54,379 50,034
Alcantara 306 139 167 293 147 146
Alcoy 316 173 143 301 162 139
Alegria 404 200 204 328 163 165
Aloguinsan 363 207 156 344 192 152
Argao 1,048 552 496 1,064 548 516
Asturias 944 512 432 919 454 465
Badian 802 407 395 873 463 410
Balamban 2,018 1,101 917 2,034 1,056 978
Bantayan 1,635 826 809 1,577 819 758
Barili 1,349 685 664 1,284 666 618
Bogo 2,687 1,412 1,275 2,984 1,631 1,353
Boljoon 190 92 98 194 107 87
Borbon 430 218 212 431 232 199
Carcar 2,556 1,371 1,185 2,432 1,250 1,182
Carmen 848 444 404 813 428 385
Catmon 303 172 131 288 143 145
Cebu City 37,351 19,590 17,761 38,854 20,262 18,592
Compostela 483 227 256 435 213 222
Consolacion 1,304 695 609 1,492 775 717
Cordoba 728 362 366 718 375 343
Daanbantayan 1,477 791 686 1,604 846 758
Dalaguete 1,266 632 634 1,191 619 572
Danao City 2,750 1,409 1,341 2,731 1,432 1,299
Dumanjug 909 467 442 910 463 447
Ginatilan 168 88 80 157 90 67
Lapu-lapu City 7,933 4,132 3,801 7,828 4,042 3,786
Liloan 1,292 689 603 1,251 629 622
Madridejos 562 297 265 630 312 318
Malabuyoc 380 189 191 301 158 143
Mandaue City 8,359 4,376 3,983 8,980 4,612 4,368
Medellin 603 306 297 484 232 252
Minglanilla 1,512 814 698 1,547 755 792
Moalboal 379 206 173 396 215 181
Naga 2,789 1,475 1,314 2,567 1,330 1,237
Oslob 501 265 236 568 320 248
Pilar 159 88 71 142 69 73
Pinamungahan 1,003 521 482 1,076 561 515
Poro 196 90 106 171 85 86
Ronda 263 129 134 284 138 146
Samboan 310 165 145 291 154 137
San Fernando 998 512 486 1,014 545 469
Place of Occurrence/
Province/City/ Municipality
2013 2014
CEBU
9-8

Table 9.2 - Continued
Both
SexesMale Female
Both
SexesMale Female
Talibon 1,608 858 756 1,133 588 545
Trinidad 261 132 129 303 156 147
Tubigon 793 402 391 922 487 435
Ubay 2,726 1,409 1,317 3,660 1,905 1,755
Valencia 334 175 159 292 150 142
101,244 52,777 48,467 98,274 51,666 46,608
Alcantara 244 121 123 232 130 102
Alcoy 280 133 147 248 129 119
Alegria 344 163 181 311 160 151
Aloguinsan 241 142 99 216 113 103
Argao 1,113 555 558 1,272 661 611
Asturias 936 475 461 787 413 374
Badian 879 457 422 899 487 412
Balamban 2,025 1,032 993 2,114 1,091 1,023
Bantayan 1,694 871 823 1,668 855 813
Barili 1,421 723 698 1,251 654 597
Bogo 3,170 1,670 1,500 3,490 1,855 1,635
Boljoon 171 91 80 125 52 73
Borbon 440 231 209 387 191 196
Carcar 2,638 1,377 1,261 3,010 1,598 1,412
Carmen 695 372 323 402 211 191
Catmon 251 119 132 160 88 72
Cebu City 36,139 19,081 17,058 33,875 18,033 15,842
Compostela 394 207 187 388 196 192
Consolacion 1,806 962 844 1,820 1,007 813
Cordoba 719 378 341 560 286 274
Daanbantayan 1,768 909 859 1,521 748 773
Dalaguete 994 508 486 853 463 390
Danao City 3,323 1,736 1,587 3,606 1,939 1,667
Dumanjug 810 390 420 750 398 352
Ginatilan 153 88 65 121 55 66
Lapu-lapu City 7,610 3,962 3,648 7,472 3,894 3,578
Liloan 982 510 472 654 324 330
Madridejos 614 317 297 622 320 302
Malabuyoc 305 147 158 276 158 118
Mandaue City 8,916 4,671 4,245 10,323 5,465 4,858
Medellin 416 231 185 318 176 142
Minglanilla 1,722 897 825 1,999 1,055 944
Moalboal 365 191 174 342 167 175
Naga 2,588 1,310 1,278 2,193 1,108 1,085
Oslob 507 256 251 475 250 225
Pilar 127 71 56 143 72 71
Pinamungahan 1,038 529 509 891 458 433
Poro 112 61 51 75 39 36
Ronda 221 129 92 208 100 108
Samboan 298 146 152 242 127 115
San Fernando 978 485 493 824 439 385
2015Place of Occurrence/
Province/City/ Municipality
2016
CEBU
9-9

Table 9.2 - Continued
Both
SexesMale Female
Both
SexesMale Female
San Francisco 1,245 626 619 1,219 634 585
San Remigio 549 286 263 455 243 212
Santa Fe 313 161 152 289 151 138
Santander 160 81 79 208 106 102
Sibonga 779 401 378 805 444 361
Sogod 719 370 349 798 434 364
Tabogon 476 250 226 429 225 204
Tabuelan 402 212 190 375 194 181
City of Talisay 3,137 1,636 1,501 3,165 1,716 1,449
Toledo City 3,719 1,893 1,826 3,707 1,913 1,794
Tuburan 1,192 598 594 1,097 574 523
Tudela 86 41 45 85 52 33
22,931 11,815 11,116 23,205 12,090 11,115
Amlan 178 88 90 219 115 104
Ayungon 396 195 201 386 196 190
Bacong 266 139 127 226 121 105
Bais City 1,193 613 580 1,190 626 564
Basay 353 194 159 335 186 149
City of Bayawan 1,392 713 679 1,567 846 721
Bindoy 850 431 419 732 376 356
Canlaon City 902 470 432 896 467 429
Dauin 248 138 110 241 116 125
Dumaguete City 6,986 3,646 3,340 7,072 3,753 3,319
Guihulngan 2,194 1,108 1,086 2,177 1,120 1,057
Jimalalud 561 281 280 559 310 249
La Libertad 566 283 283 542 270 272
Mabinay 1,190 610 580 1,082 549 533
Manjuyod 443 226 217 564 276 288
Pamplona 421 220 201 405 209 196
San Jose 110 53 57 109 52 57
Santa Catalina 1,073 545 528 1,135 576 559
Siaton 1,322 702 620 1,268 658 610
Sibulan 274 134 140 248 129 119
City of Tanjay 532 277 255 637 345 292
Tayasan 496 258 238 576 280 296
Valencia 132 65 67 162 81 81
Vallehermoso 525 260 265 512 249 263
Zamboanguita 328 166 162 365 184 181
1,424 701 723 1,357 677 680
Enrique Villanueva 60 29 31 23 16 7
Larena 11 6 5 19 11 8
Lazi 220 105 115 195 91 104
Maria 92 45 47 70 35 35
San Juan 18 10 8 23 10 13
Siquijor 1,023 506 517 1,027 514 513
SIQUIJOR
NEGROS ORIENTAL
2013 2014Place of Occurrence/
Province/City/ Municipality
9-10

Table 9.2 - Continued
Both
SexesMale Female
Both
SexesMale Female
San Francisco 1,252 644 608 1,256 646 610
San Remigio 447 222 225 375 185 190
Santa Fe 276 136 140 335 165 170
Santander 141 80 61 145 75 70
Sibonga 760 404 356 708 360 348
Sogod 750 388 362 703 359 344
Tabogon 259 149 110 123 68 55
Tabuelan 309 143 166 298 134 164
City of Talisay 2,988 1,534 1,451 2,839 1,471 1,368
Toledo City 3,483 1,782 1,701 3,371 1,717 1,654
Tuburan 1,068 556 512 899 470 429
Tudela 64 35 29 99 51 48
23,351 12,171 11,180 23,906 12,429 11,477
Amlan 186 93 93 157 78 79
Ayungon 301 149 158 367 182 185
Bacong 213 130 83 185 99 86
Bais City 1,220 645 575 1,301 670 631
Basay 312 162 150 332 190 142
City of Bayawan 1,733 890 843 1,946 1,029 917
Bindoy 740 379 361 712 349 363
Canlaon City 857 440 417 778 399 379
Dauin 198 99 99 220 104 116
Dumaguete City 7,487 3,946 3,541 8,341 4,373 3,968
Guihulngan 2,339 1,219 1,120 2,129 1,110 1,019
Jimalalud 491 256 235 497 251 246
La Libertad 545 272 173 572 293 279
Mabinay 1,182 600 582 1,088 568 520
Manjuyod 538 312 226 503 247 256
Pamplona 372 198 174 316 148 168
San Jose 102 51 51 106 56 50
Santa Catalina 1,108 572 536 1,215 660 555
Siaton 1,225 625 600 1,180 601 579
Sibulan 116 52 64 95 54 41
City of Tanjay 630 336 294 431 225 206
Tayasan 528 269 259 503 270 233
Valencia 159 83 76 150 76 74
Vallehermoso 418 215 203 474 247 227
Zamboanguita 351 184 167 308 150 158
1,250 632 618 1,275 659 616
Enrique Villanueva 15 10 5 12 5 7
Larena 12 8 4 14 8 6
Lazi 109 55 54 91 52 39
Maria 68 29 39 41 22 19
San Juan 19 7 12 19 9 10
Siquijor 1,027 523 504 1,098 563 535
2015 2016Place of Occurrence/
Province/City/ Municipality
NEGROS ORIENTAL
SIQUIJOR
9-11

11,604
51,666
12,429
659 10,612
46,608
11,477
616
BOHOL CEBU NEGROS ORIENTAL SIQUIJOR
Figure 9.2: Live Biths by Sex and by Province
2016
Male Female
36,273
33,483
34,149 34,343
34,192
36,776
31,000
32,000
33,000
34,000
35,000
36,000
37,000
38,000
2012 2013 2014 2015 2016 2017
Figure 9.1: Marriages in Central Visayas
2012-2017
9-12

Table 9.3
LIVE BIRTHS BY USUAL RESIDENCE OF MOTHER, BY SEX,
BY PROVINCE AND CITY/MUNICIPALITY
2014-2017
Both
SexesMale Female
Both
SexesMale Female
152,542 79,394 73,148 148,319 77,312 71,007
24,018 12,489 11,529 22,868 11,928 10,940
Alburquerque 141 77 64 144 79 65
Alicia 466 240 226 423 217 206
Anda 237 114 123 243 131 112
Antequera 200 101 99 186 86 100
Baclayon 334 159 175 307 167 140
Balilihan 298 157 141 287 135 152
Batuan 226 105 121 228 119 109
Bien Unido 493 250 243 520 283 237
Bilar 358 186 172 287 149 138
Buenavista 559 283 276 543 291 252
Calape 570 305 265 529 293 236
Candijay 494 248 246 483 260 223
Carmen 950 509 441 903 473 430
Catigbian 399 216 183 400 227 173
Clarin 367 202 165 332 146 186
Corella 121 64 57 121 66 55
Cortes 281 152 129 258 140 118
Dagohoy 376 193 183 379 199 180
Danao 435 216 219 382 181 201
Dauis 809 442 367 736 385 351
Dimiao 246 127 119 216 120 96
Duero 301 155 146 283 146 137
Garcia Hernandez 333 186 147 353 183 170
Guindulman 543 263 280 514 268 246
Inabanga 837 428 409 779 409 370
Jagna 608 318 290 535 287 248
Jetafe 574 294 280 613 341 272
Lila 141 74 67 151 82 69
Loay 264 140 124 253 129 124
Loboc 232 113 119 225 121 104
Loon 683 365 318 667 325 342
Mabini 525 278 247 477 230 247
Maribojoc 325 178 147 283 143 140
Panglao 637 317 320 633 338 295
Pilar 527 262 265 518 270 248
Pres. Carlos P. Garcia 439 224 215 458 240 218
Source: Vital Statistics Report, Philippine Statistics Authority
20152014Usual Residence /Province/
City/Municipality
CENTRAL VISAYAS
BOHOL
9-13

Table 9.3 - Continued
Both
SexesMale Female
Both
SexesMale Female
145,550 76,288 69,262 141,833 74,022 67,811
22,420 11,707 10,713 21,823 11,373 10,450
Alburquerque 141 72 69 132 62 70
Alicia 424 230 194 402 213 189
Anda 239 117 122 230 115 115
Antequera 211 98 113 205 97 108
Baclayon 295 152 143 336 166 170
Balilihan 272 145 127 261 148 113
Batuan 213 115 98 217 117 100
Bien Unido 516 283 233 460 236 224
Bilar 301 159 142 286 159 127
Buenavista 543 276 267 518 272 246
Calape 522 284 238 523 285 238
Candijay 449 234 215 427 233 194
Carmen 875 448 427 845 416 429
Catigbian 385 224 161 374 187 187
Clarin 358 174 184 321 157 164
Corella 126 61 65 119 53 66
Cortes 256 144 112 259 145 114
Dagohoy 366 186 180 322 160 162
Danao 410 198 212 406 214 192
Dauis 805 436 369 782 398 384
Dimiao 190 106 84 196 100 96
Duero 282 138 144 290 148 142
Garcia Hernandez 300 173 127 277 158 119
Guindulman 502 262 240 507 285 222
Inabanga 754 383 371 740 385 355
Jagna 572 310 262 475 244 231
Jetafe 613 327 286 564 295 269
Lila 123 62 61 129 70 59
Loay 253 138 115 205 111 94
Loboc 218 108 110 239 118 121
Loon 618 332 286 587 311 276
Mabini 471 252 219 443 237 206
Maribojoc 274 149 125 288 136 152
Panglao 628 304 324 705 367 338
Pilar 533 281 252 470 242 228
Pres. Carlos P. Garcia 405 201 204 421 219 202
Usual Residence /Province/
City/Municipality
CENTRAL VISAYAS
BOHOL
2016 2017
9-14

Table 9.3 - Continued
Both
SexesMale Female
Both
SexesMale Female
Sagbayan 479 242 237 441 233 208
San Isidro 147 92 55 149 79 70
San Miguel 526 289 237 517 262 255
Sevilla 183 99 84 163 73 90
Sierra Bullones 488 249 239 444 230 214
Sikatuna 95 48 47 74 40 34
Tagbilaran City 1,632 831 801 1,596 831 765
Talibon 1,447 773 674 1,405 731 674
Trinidad 645 359 286 625 321 304
Tubigon 823 425 398 725 394 331
Ubay 1,751 915 836 1,638 847 791
Valencia 473 226 247 442 228 214
103,925 54,104 49,821 100,757 52,528 48,229
Alcantara 325 161 164 309 157 152
Alcoy 369 196 173 372 184 188
Alegria 427 224 203 481 234 247
Aloguinsan 588 311 277 545 304 241
Argao 1,349 701 648 1,309 652 657
Asturias 1,083 534 549 1,163 596 567
Badian 875 467 408 755 401 354
Balamban 2,211 1,180 1,031 2,031 1,047 984
Bantayan 1,474 753 721 1,451 729 722
Barili 1,608 850 758 1,640 861 779
Bogo 1,978 1,082 896 1,599 840 759
Boljoon 286 153 133 252 133 119
Borbon 711 379 332 737 378 359
Carcar 2,881 1,492 1,389 2,874 1,488 1,386
Carmen 1,224 629 595 1,173 645 528
Catmon 513 252 261 557 272 285
Cebu City 22,104 11,417 10,687 20,953 10,995 9,958
Compostela 1,014 515 499 1,006 536 470
Consolacion 2,572 1,319 1,253 2,663 1,406 1,257
Cordoba 1,311 695 616 1,313 681 632
Daanbantayan 1,860 989 871 1,916 995 921
Dalaguete 1,490 774 716 1,423 733 690
Danao City 3,227 1,695 1,532 3,306 1,754 1,552
Dumanjug 1,133 589 544 1,187 596 591
Ginatilan 217 119 98 230 128 102
Lapu-lapu City 10,179 5,239 4,940 9,812 5,163 4,649
20152014
CEBU
Usual Residence /Province/
City/Municipality
9-15

Table 9.3 - Continued
Both
SexesMale Female
Both
SexesMale Female
Sagbayan 424 232 192 423 230 193
San Isidro 133 68 65 136 66 70
San Miguel 482 255 227 450 229 221
Sevilla 173 94 79 144 70 74
Sierra Bullones 480 221 259 420 209 211
Sikatuna 88 47 41 92 42 50
Tagbilaran City 1,521 789 732 1,550 778 772
Talibon 1,299 684 615 1,288 677 611
Trinidad 677 339 338 631 345 286
Tubigon 716 385 331 706 384 322
Ubay 1,568 818 750 1,604 858 746
Valencia 416 213 203 418 226 192
97,876 51,458 46,418 96,643 50,406 46,237
Alcantara 314 168 146 306 170 136
Alcoy 319 176 143 339 174 165
Alegria 452 255 197 444 218 226
Aloguinsan 604 318 286 548 269 279
Argao 1,337 699 638 1,292 649 643
Asturias 1,083 580 503 1,029 536 493
Badian 790 438 352 808 405 403
Balamban 1,887 967 920 1,678 896 782
Bantayan 1,481 762 719 1,342 696 646
Barili 1,563 836 727 1,514 822 692
Bogo 1,561 811 750 1,528 810 718
Boljoon 245 109 136 236 129 107
Borbon 669 334 335 636 319 317
Carcar 2,763 1,475 1,288 2,762 1,410 1,352
Carmen 1,046 536 510 1,082 579 503
Catmon 545 294 251 491 256 235
Cebu City 19,941 10,499 9,442 20,144 10,452 9,692
Compostela 1,067 555 512 1,044 507 537
Consolacion 2,724 1,458 1,266 2,764 1,417 1,347
Cordoba 1,330 703 627 1,386 739 647
Daanbantayan 1,809 917 892 1,718 894 824
Dalaguete 1,403 742 661 1,333 674 659
Danao City 3,228 1,761 1,467 3,192 1,680 1,512
Dumanjug 1,145 606 539 1,074 580 494
Ginatilan 219 98 121 211 120 91
Lapu-lapu City 9,508 4,954 4,554 9,645 5,118 4,527
Usual Residence /Province/
City/Municipality
CEBU
2016 2017
9-16

Table 9.3 - Continued
Both
SexesMale Female
Both
SexesMale Female
Liloan 2,603 1,366 1,237 2,538 1,304 1,234
Madridejos 745 370 375 816 440 376
Malabuyoc 359 190 169 378 183 195
Mandaue City 8,671 4,489 4,182 8,074 4,224 3,850
Medellin 1,037 521 516 1,196 636 560
Minglanilla 2,625 1,334 1,291 2,669 1,414 1,255
Moalboal 593 306 287 592 307 285
Naga 2,708 1,444 1,264 2,722 1,407 1,315
Oslob 580 323 257 514 258 256
Pilar 179 87 92 161 96 65
Pinamungahan 1,389 707 682 1,367 708 659
Poro 342 172 170 335 173 162
Ronda 366 180 186 330 184 146
Samboan 384 207 177 368 179 189
San Fernando 1,508 811 697 1,511 786 725
San Francisco 1,153 599 554 1,122 588 534
San Remigio 1,030 556 474 1,141 583 558
Santa Fe 534 283 251 629 320 309
Santander 333 177 156 286 154 132
Sibonga 1,084 601 483 1,073 571 502
Sogod 668 355 313 620 317 303
Tabogon 713 386 327 705 386 319
Tabuelan 465 250 215 461 216 245
City of Talisay 4,964 2,623 2,341 4,538 2,321 2,217
Toledo City 4,492 2,329 2,163 4,202 2,152 2,050
Tuburan 1,243 640 603 1,226 644 582
Tudela 148 83 65 126 69 57
23,142 12,079 11,063 23,349 12,177 11,172
Amlan 429 239 190 464 237 227
Ayungon 620 315 305 613 300 313
Bacong 548 278 270 566 315 251
Bais City 1,360 723 637 1,368 718 650
Basay 436 241 195 427 225 202
City of Bayawan 1,545 826 719 1,688 866 822
Bindoy 677 353 324 656 331 325
Canlaon City 1,023 531 492 1,022 529 493
Dauin 448 226 222 442 228 214
Dumaguete City 2,389 1,277 1,112 2,275 1,192 1,083
Guihulngan 2,049 1,057 992 2,045 1,099 946
20152014
NEGROS ORIENTAL
Usual Residence /Province/
City/Municipality
9-17

Table 9.3 - Continued
Both
SexesMale Female
Both
SexesMale Female
Liloan 2,454 1,306 1,148 2,463 1,283 1,180
Madridejos 797 410 387 736 387 349
Malabuyoc 321 174 147 394 215 179
Mandaue City 7,702 4,151 3,551 7,649 4,063 3,586
Medellin 1,180 614 566 1,194 647 547
Minglanilla 2,648 1,386 1,262 2,701 1,413 1,288
Moalboal 590 302 288 595 312 283
Naga 2,656 1,392 1,264 2,674 1,401 1,273
Oslob 510 281 229 461 238 223
Pilar 176 89 87 155 71 84
Pinamungahan 1,306 673 633 1,329 691 638
Poro 362 200 162 317 150 167
Ronda 333 165 168 324 172 152
Samboan 346 178 168 346 169 177
San Fernando 1,457 752 705 1,431 735 696
San Francisco 1,039 541 498 1,033 542 491
San Remigio 1,074 549 525 1,001 504 497
Santa Fe 644 327 317 545 284 261
Santander 312 167 145 267 142 125
Sibonga 1,024 531 493 997 494 503
Sogod 661 331 330 616 319 297
Tabogon 702 390 312 643 339 304
Tabuelan 487 241 246 465 251 214
City of Talisay 4,666 2,459 2,207 4,515 2,337 2,178
Toledo City 4,151 2,148 2,003 3,974 2,079 1,895
Tuburan 1,109 581 528 1,135 577 558
Tudela 136 69 67 137 72 65
23,861 12,395 11,466 21,990 11,550 10,440
Amlan 460 240 220 439 241 198
Ayungon 623 307 316 628 314 314
Bacong 573 295 278 530 273 257
Bais City 1,424 740 684 1,318 724 594
Basay 475 265 210 435 234 201
City of Bayawan 2,001 1,069 932 1,676 902 774
Bindoy 710 355 355 680 358 322
Canlaon City 906 467 439 905 469 436
Dauin 491 241 250 422 223 199
Dumaguete City 2,164 1,147 1,017 2,095 1,159 936
Guihulngan 2,001 1,035 966 1,908 996 912
Usual Residence /Province/
City/Municipality
NEGROS ORIENTAL
2016 2017
9-18

Table 9.3 - Continued
Both
SexesMale Female
Both
SexesMale Female
Jimalalud 635 352 283 556 288 268
La Libertad 679 343 336 734 354 380
Mabinay 1,251 642 609 1,443 747 696
Manjuyod 738 364 374 717 389 328
Pamplona 671 350 321 706 367 339
San Jose 365 162 203 368 191 177
Santa Catalina 1,370 712 658 1,354 712 642
Siaton 1,477 772 705 1,475 767 708
Sibulan 936 498 438 946 511 435
City of Tanjay 1,142 634 508 1,117 607 510
Tayasan 676 333 343 660 343 317
Valencia 572 292 280 628 316 312
Vallehermoso 618 298 320 610 305 305
Zamboanguita 488 261 227 469 240 229
1,457 722 735 1,345 679 666
Enrique Villanueva 85 47 38 82 54 28
Larena 181 93 88 155 87 68
Lazi 355 173 182 348 177 171
Maria 203 100 103 174 85 89
San Juan 208 99 109 203 93 110
Siquijor 425 210 215 383 183 200
2014 2015
SIQUIJOR
Usual Residence /Province/
City/Municipality
9-19

Table 9.3 - Continued
Both
SexesMale Female
Both
SexesMale Female
Jimalalud 591 306 285 520 274 246
La Libertad 733 383 350 624 291 333
Mabinay 1,389 725 664 1,231 649 582
Manjuyod 748 369 379 684 362 322
Pamplona 684 355 329 633 327 306
San Jose 385 216 169 345 181 164
Santa Catalina 1,382 745 637 1,342 692 650
Siaton 1,487 751 736 1,401 752 649
Sibulan 979 514 465 942 478 464
City of Tanjay 1,256 639 617 1,027 535 492
Tayasan 608 325 283 562 292 270
Valencia 668 350 318 593 294 299
Vallehermoso 642 327 315 607 320 287
Zamboanguita 481 229 252 443 210 233
1,393 728 665 1,377 693 684
Enrique Villanueva 78 41 37 84 41 43
Larena 170 97 73 170 80 90
Lazi 315 175 140 345 176 169
Maria 176 89 87 188 103 85
San Juan 221 116 105 204 104 100
Siquijor 433 210 223 386 189 197
SIQUIJOR
Usual Residence /Province/
City/Municipality
2016 2017
9-20

Table 9.4
LIVE BIRTHS BY PLACE OF OCCURRENCE, BY ATTENDANT AT BIRTH
AND BY PROVINCE AND BY CITY/MUNICIPALITY
2013-2016
TotalHealth
Professional
Traditional
Birth
Attendant
Others Not
StatedTotal
Health
Professional
Traditional
Birth
Attendant
Others Not
Stated
150,927 135,476 14,413 1,033 5 152,761 138,867 12,437 1,042 415
23,921 22,711 1,193 15 2 23,786 22,813 848 7 118
Alburquerque 25 22 3 - - 24 23 1 - -
Alicia 323 317 6 - - 288 287 - - 1
Anda 149 149 - - - 143 143 - - -
Antequera 107 107 - - - 86 86 - - -
Baclayon 164 161 3 - - 168 163 - 2 3
Balilihan 97 95 2 - - 71 69 2 - -
Batuan 133 129 4 - - 87 85 2 - -
Bien Unido 430 404 26 - - 396 359 34 - 3
Bilar 221 217 3 - 1 210 210 - - -
Buenavista 352 328 23 1 - 266 246 19 - 1
Calape 500 498 2 - - 592 591 - - 1
Candijay 404 392 12 - - 350 342 6 - 2
Carmen 1,440 1,421 19 - - 1,472 1,454 11 - 7
Catigbian 367 367 - - - 232 230 2 - -
Clarin 316 272 44 - - 272 244 17 - 11
Corella 31 30 - 1 - 51 43 4 - 4
Cortes 150 149 1 - - 135 133 1 - 1
Dagohoy 203 202 1 - - 177 175 - - 2
Danao 310 310 - - - 330 330 - - -
Dauis 610 605 5 - - 617 613 - 1 3
Dimiao 155 145 10 - - 143 139 3 1 -
Duero 102 100 2 - - 75 71 2 - 2
Garcia Hernandez 192 188 4 - - 136 133 3 - -
Guindulman 346 344 2 - - 313 308 3 - 2
Inabanga 709 694 14 1 - 656 646 6 - 4
Jagna 1,045 974 71 - - 1,137 1,090 41 - 6
Jetafe 499 365 133 1 - 415 319 73 - 23
Lila 64 64 - - - 51 51 - - -
Loay 105 66 39 - - 96 49 47 - -
Loboc 110 104 6 - - 94 90 3 - 1
Loon 516 486 28 2 - 453 422 30 1 -
Mabini 390 369 20 1 - 350 340 7 - 3
Maribojoc 142 142 - - - 98 98 - - -
Panglao 145 145 - - - 112 112 - - -
Pilar 324 318 5 - 1 276 272 2 1 1
Pres. Carlos P. Garcia 339 336 3 - - 299 291 6 - 2
Sagbayan 140 76 62 2 - 124 116 7 1 -
San Isidro 8 6 2 - - 3 3 - - -
San Miguel 662 624 38 - - 475 450 25 - -
Sevilla 127 126 1 - - 115 115 - - -
Sierra Bullones 324 321 3 - - 242 242 - - -
Sikatuna 44 44 - - - 50 50 - - -
Tagbilaran City 6,155 6,145 8 2 - 6,560 6,525 3 - 32
Talibon 1,805 1,698 106 1 - 1,820 1,697 121 - 2
Source: Vital Statistics Report, Philippine Statistics Authority
CENTRAL VISAYAS
BOHOL
Place of
Occurrence/Province/
City/ Municipality
2013 2014
Attendant at Birth Attendant at Birth
9-21

Table 9.4 - Continued
TotalHealth
Professional
Traditional
Birth
Attendant
Others Not
StatedTotal
Health
Professional
Traditional
Birth
Attendant
Others Not
Stated
148,513 137,582 9,824 906 201 145,671 135,965 7,710 953 1,043
22,668 22,046 530 26 66 22,216 21,716 259 36 205
Alburquerque 16 13 3 - - 24 24 - - -
Alicia 210 209 1 - - 211 207 1 1 2
Anda 155 155 - - - 142 141 1 - -
Antequera 48 48 - - - 41 41 - - -
Baclayon 168 163 2 3 - 125 124 - 1 -
Balilihan 61 58 3 - - 48 43 4 1 -
Batuan 86 86 - - - 45 43 1 1 -
Bien Unido 370 351 19 - - 367 337 30 - -
Bilar 184 184 - - - 175 173 1 - 1
Buenavista 170 162 5 - 3 181 180 1 - -
Calape 569 568 1 - - 530 530 - - -
Candijay 323 319 3 1 - 283 283 - - -
Carmen 1,309 1,303 5 - 1 1,041 1,026 4 5 6
Catigbian 325 320 2 - 3 329 327 - 2 -
Clarin 309 304 5 - - 312 311 1 - -
Corella 60 59 - - 1 59 58 - - 1
Cortes 114 114 - - - 104 103 1 - -
Dagohoy 172 169 - - 3 150 150 - - -
Danao 298 297 1 - - 265 265 - - -
Dauis 440 435 - - 5 534 533 - - 1
Dimiao 132 126 6 - - 121 120 1 - -
Duero 87 81 2 - 4 107 103 1 - 3
Garcia Hernandez 86 86 - - - 64 64 - - -
Guindulman 270 266 4 - - 258 258 - - -
Inabanga 507 502 5 - - 420 405 3 - 12
Jagna 1,142 1,103 32 1 6 1,196 1,028 19 2 147
Jetafe 375 343 27 - 5 395 362 26 - 7
Lila 53 53 - - - 42 42 - - -
Loay 61 34 26 - 1 37 30 7 - -
Loboc 84 82 1 - 1 69 69 - - -
Loon 358 347 5 6 - 273 263 1 8 1
Mabini 326 319 7 - - 273 269 3 - 1
Maribojoc 105 104 1 - - 81 78 3 - -
Panglao 113 112 1 - - 152 152 - - -
Pilar 194 190 1 2 1 228 222 - 6 -
Pres. Carlos P. Garcia 263 254 2 - 7 209 204 1 - 4
Sagbayan 101 93 3 4 1 67 60 2 4 1
San Isidro 8 8 - - - 2 2 - - -
San Miguel 387 378 3 5 1 319 316 2 - 1
Sevilla 84 81 2 - 1 64 64 - - -
Sierra Bullones 232 230 2 - - 221 212 1 3 5
Sikatuna 29 29 - - - 27 27 - - -
Tagbilaran City 6,562 6,541 4 - 17 6,315 6,308 - - 7
Talibon 1,608 1,499 106 2 1 1,133 1,089 42 - 2
Source: Vital Statistics Report, Philippine Statistics Authority
2015 2016
Attendant at Birth Attendant at BirthPlace of
Occurrence/Province/
City/ Municipality
CENTRAL VISAYAS
BOHOL
9-22

Table 9.4 - Continued
TotalHealth
Professional
Traditional
Birth
Attendant
Others Not
StatedTotal
Health
Professional
Traditional
Birth
Attendant
Others Not
Stated
Trinidad 307 216 91 - - 298 261 37 - -
Tubigon 714 707 6 1 - 854 853 1 - -
Ubay 1,696 1,337 358 1 - 2,180 1,857 322 - 1
Valencia 424 396 27 1 - 394 387 7 - -
102,651 94,720 7,164 764 3 104,413 97,707 5,726 700 280
Alcantara 306 206 100 - - 293 204 89 - -
Alcoy 316 252 63 1 - 301 266 35 - -
Alegria 404 296 97 11 - 328 260 63 4 1
Aloguinsan 363 357 6 - - 344 340 4 - -
Argao 1,048 940 105 3 - 1,064 971 86 2 5
Asturias 944 872 18 54 - 919 860 9 48 2
Badian 802 798 4 - - 873 858 15 - -
Balamban 2,018 1,695 322 1 - 2,034 1,875 159 - -
Bantayan 1,635 1,502 31 101 1 1,577 1,451 23 80 23
Barili 1,349 1,122 175 52 - 1,284 1,148 85 45 6
Bogo 2,687 2,662 25 - - 2,984 2,934 33 - 17
Boljoon 190 190 - - - 194 193 1 - -
Borbon 430 416 10 4 - 431 418 3 3 7
Carcar 2,556 2,546 10 - - 2,432 2,419 12 1 -
Carmen 848 652 187 9 - 813 646 118 42 7
Catmon 303 295 1 7 - 288 282 1 4 1
Cebu City 37,351 36,854 432 65 - 38,854 38,164 586 44 60
Compostela 483 352 131 - - 435 332 103 - -
Consolacion 1,304 1,087 214 3 - 1,492 1,382 95 3 12
Cordoba 728 536 189 3 - 718 604 112 - 2
Daanbantayan 1,477 1,259 46 172 - 1,604 1,425 32 135 12
Dalaguete 1,266 1,080 183 3 - 1,191 1,062 119 3 7
Danao City 2,750 2,493 74 183 - 2,731 2,489 66 172 4
Dumanjug 909 842 62 5 - 910 882 27 1 -
Ginatilan 168 159 9 - - 157 156 1 - -
Lapu-lapu City 7,933 7,686 242 5 - 7,828 7,624 188 11 5
Liloan 1,292 1,272 17 3 - 1,251 1,235 13 2 1
Madridejos 562 548 8 6 - 630 603 11 11 5
Malabuyoc 380 372 8 - - 301 296 2 2 1
Mandaue City 8,359 7,558 783 18 - 8,980 8,363 602 6 9
Medellin 603 591 8 4 - 484 439 32 8 5
Minglanilla 1,512 1,509 2 1 - 1,547 1,535 7 1 4
Moalboal 379 371 8 - - 396 381 12 2 1
Naga 2,789 2,636 137 16 - 2,567 2,466 67 29 5
Oslob 501 447 54 - - 568 526 42 - -
Pilar 159 157 2 - - 142 141 1 - -
Pinamungahan 1,003 921 71 11 - 1,076 981 72 15 8
Poro 196 174 22 - - 171 147 23 - 1
Ronda 263 261 2 - - 284 282 - 1 1
Samboan 310 310 - - - 291 290 - - 1
San Fernando 998 674 324 - - 1,014 733 277 - 4
San Francisco 1,245 975 266 4 - 1,219 938 231 4 46
2013 2014
Attendant at Birth Attendant at Birth
CEBU
Place of
Occurrence/Province/
City/ Municipality
9-23

Table 9.4 - Continued
TotalHealth
Professional
Traditional
Birth
Attendant
Others Not
StatedTotal
Health
Professional
Traditional
Birth
Attendant
Others Not
Stated
Trinidad 261 228 32 1 - 303 291 8 2 2
Tubigon 793 792 - - 1 922 922 - - -
Ubay 2,726 2,522 201 1 2 3,660 3,575 84 - 1
Valencia 334 326 7 - 1 292 282 10 - -
101,244 96,460 4,054 619 111 98,274 93,993 2,928 663 690
Alcantara 244 172 72 - - 232 190 42 - -
Alcoy 280 231 45 4 - 248 225 21 1 1
Alegria 344 292 49 3 - 311 272 32 5 2
Aloguinsan 241 240 1 - - 216 214 1 1 -
Argao 1,113 1,018 93 1 1 1,272 1,186 78 4 4
Asturias 936 894 14 28 - 787 756 3 28 -
Badian 879 871 8 - - 899 887 11 1 -
Balamban 2,025 2,019 3 3 - 2,114 2,113 - - 1
Bantayan 1,694 1,594 17 79 4 1,668 1,575 4 83 6
Barili 1,421 1,328 48 43 2 1,251 1,179 14 48 10
Bogo 3,170 3,117 38 8 7 3,490 3,455 19 11 5
Boljoon 171 171 - - - 125 125 - - -
Borbon 440 434 4 - 2 387 380 1 1 5
Carcar 2,638 2,634 1 1 2 3,010 2,950 4 5 51
Carmen 695 593 57 38 7 402 386 5 10 1
Catmon 251 246 1 4 - 160 152 - 8 -
Cebu City 36,139 35,668 413 55 3 33,875 33,103 269 82 421
Compostela 394 305 89 - - 388 337 50 1 -
Consolacion 1,806 1,761 43 2 - 1,820 1,786 25 3 6
Cordoba 719 544 174 - 1 560 462 95 - 3
Daanbantayan 1,768 1,625 17 123 3 1,521 1,355 25 132 9
Dalaguete 994 888 90 14 2 853 707 116 9 21
Danao City 3,323 3,198 44 81 - 3,606 3,527 8 68 3
Dumanjug 810 773 31 4 2 750 698 41 8 3
Ginatilan 153 149 4 - - 121 115 5 - 1
Lapu-lapu City 7,610 7,436 162 4 8 7,472 7,420 19 23 10
Liloan 982 969 9 2 2 654 647 4 - 3
Madridejos 614 579 8 24 3 622 592 2 25 3
Malabuyoc 305 288 3 14 - 276 275 - 1 -
Mandaue City 8,916 8,422 479 8 7 10,323 9,981 314 4 24
Medellin 416 402 10 4 - 318 312 1 3 2
Minglanilla 1,722 1,713 8 1 - 1,999 1,994 3 1 1
Moalboal 365 353 8 1 3 342 332 6 - 4
Naga 2,588 2,488 69 31 - 2,193 2,125 53 13 2
Oslob 507 493 13 1 - 475 454 7 14 -
Pilar 127 127 - - - 143 142 - - 1
Pinamungahan 1,038 990 36 12 - 891 836 23 28 4
Poro 112 89 23 - - 75 59 16 - -
Ronda 221 221 - - - 208 207 1 - -
Samboan 298 298 - - - 242 242 - - -
San Fernando 978 927 50 1 - 824 720 97 2 5
San Francisco 1,252 968 264 2 18 1,256 966 273 1 16
Place of
Occurrence/Province/
City/ Municipality
CEBU
2015 2016
Attendant at Birth Attendant at Birth
9-24

Table 9.4 - Continued
TotalHealth
Professional
Traditional
Birth
Attendant
Others Not
StatedTotal
Health
Professional
Traditional
Birth
Attendant
Others Not
Stated
San Remigio 549 324 225 - - 455 330 125 - -
Santa Fe 313 305 8 - - 289 282 4 2 1
Santander 160 158 2 - - 208 208 - - -
Sibonga 779 771 8 - - 805 797 7 - 1
Sogod 719 673 45 1 - 798 743 53 1 1
Tabogon 476 150 324 2 - 429 221 208 - -
Tabuelan 402 283 119 - - 375 329 44 - 2
City of Talisay 3,137 2,731 397 9 - 3,165 2,775 382 8 -
Toledo City 3,719 2,148 1,566 5 - 3,707 2,266 1,433 7 1
Tuburan 1,192 1,173 15 2 2 1,097 1,074 10 2 11
Tudela 86 79 7 - - 85 81 3 1 -
22,931 16,630 6,047 254 - 23,205 16,993 5,860 335 17
Amlan 178 151 27 - - 219 166 53 - -
Ayungon 396 103 292 1 - 386 122 254 10 -
Bacong 266 251 7 8 - 226 219 5 2 -
Bais City 1,193 789 404 - - 1,190 744 430 15 1
Basay 353 230 123 - - 335 267 67 - 1
City of Bayawan 1,392 914 475 3 - 1,567 1,096 454 13 4
Bindoy 850 613 229 8 - 732 539 184 9 -
Canlaon City 902 533 301 68 - 896 480 333 83 -
Dauin 248 223 25 - - 241 237 4 - -
Dumaguete City 6,986 6,926 50 10 - 7,072 6,992 56 21 3
Guihulngan 2,194 1,401 783 10 - 2,177 1,429 724 22 2
Jimalalud 561 112 449 - - 559 99 459 1 -
La Libertad 566 456 110 - - 542 416 126 - -
Mabinay 1,190 805 385 - - 1,082 682 396 3 1
Manjuyod 443 168 274 1 - 564 293 269 2 -
Pamplona 421 225 196 - - 405 146 256 2 1
San Jose 110 71 34 5 - 109 63 40 6 -
Santa Catalina 1,073 538 511 24 - 1,135 631 479 25 -
Siaton 1,322 718 533 71 - 1,268 729 478 59 2
Sibulan 274 178 96 - - 248 178 70 - -
City of Tanjay 532 320 202 10 - 637 425 205 6 1
Tayasan 496 45 451 - - 576 150 424 1 1
Valencia 132 103 29 - - 162 135 27 - -
Vallehermoso 525 437 53 35 - 512 396 62 54 -
Zamboanguita 328 320 8 - - 365 359 5 1 -
1,023 1,020 3 - - 1,027 1,027 - - -
Enrique Villanueva 1,424 1,415 9 - - 1,357 1,354 3 - -
Larena 60 60 - - - 23 22 1 - -
Lazi 11 11 - - - 19 19 - - -
Maria 220 216 4 - - 195 193 2 - -
San Juan 92 91 1 - - 70 70 - - -
Siquijor 18 17 1 - - 23 23 - - -
SIQUIJOR
2013 2014
Attendant at Birth Attendant at BirthPlace of
Occurrence/Province/
City/ Municipality
NEGROS ORIENTAL
9-25

Table 9.4 - Continued
TotalHealth
Professional
Traditional
Birth
Attendant
Others Not
StatedTotal
Health
Professional
Traditional
Birth
Attendant
Others Not
Stated
San Remigio 447 435 12 - - 375 366 5 - 4
Santa Fe 276 274 - - 2 335 332 - - 3
Santander 141 139 2 - - 145 144 - 1 -
Sibonga 760 759 - - 1 708 706 2 - -
Sogod 750 716 24 3 7 703 659 27 2 15
Tabogon 259 151 108 - - 123 113 8 - 2
Tabuelan 309 295 14 - - 298 286 6 4 2
City of Talisay 2,988 2,703 272 11 2 2,839 2,621 199 12 7
Toledo City 3,483 2,366 1,108 4 5 3,371 2,383 979 4 5
Tuburan 1,068 1,032 14 5 17 899 852 12 14 21
Tudela 64 62 2 - - 99 92 2 2 3
23,351 17,829 5,237 261 24 23,906 18,983 4,521 254 148
Amlan 186 156 30 - - 157 146 11 - -
Ayungon 301 125 166 10 - 367 142 206 18 1
Bacong 213 204 3 6 - 185 179 2 3 1
Bais City 1,220 861 349 6 4 1,301 898 326 5 72
Basay 312 242 68 2 - 332 270 61 - 1
City of Bayawan 1,733 1,230 489 10 4 1,946 1,477 442 14 13
Bindoy 740 521 218 1 - 712 522 188 1 1
Canlaon City 857 493 298 65 1 778 454 276 48 -
Dauin 198 178 20 - - 220 208 12 - -
Dumaguete City 7,487 7,426 39 17 5 8,341 8,291 32 13 5
Guihulngan 2,339 1,688 648 2 1 2,129 1,516 598 6 9
Jimalalud 491 113 378 - - 497 206 288 - 3
La Libertad 545 446 99 - - 572 478 92 - 2
Mabinay 1,182 750 431 - 1 1,088 783 304 1 -
Manjuyod 538 292 242 2 2 503 277 221 - 5
Pamplona 372 149 218 3 2 316 123 185 2 6
San Jose 102 64 31 7 - 106 67 32 6 1
Santa Catalina 1,108 761 313 34 - 1,215 921 266 25 3
Siaton 1,225 706 462 56 1 1,180 771 339 62 8
Sibulan 116 53 63 - - 95 42 52 - 1
City of Tanjay 630 422 200 5 3 431 243 171 9 8
Tayasan 528 126 402 - - 503 150 349 - 4
Valencia 159 137 22 - - 150 128 22 - -
Vallehermoso 418 340 43 35 - 474 388 43 41 2
Zamboanguita 351 346 5 - - 308 303 3 - 2
1,250 1,247 3 - - 1,275 1,273 2 - -
Enrique Villanueva 15 15 - - - 12 12 - - -
Larena 12 12 - - - 14 14 - - -
Lazi 109 109 - - - 91 91 - - -
Maria 68 66 2 - - 41 41 - - -
San Juan 19 19 - - - 19 18 1 - -
Siquijor 1,027 1,026 1 - - 1,098 1,097 1 - -
Place of
Occurrence/Province/
City/ Municipality
NEGROS ORIENTAL
SIQUIJOR
2015 2016
Attendant at Birth Attendant at Birth
9-26

Table 9.5
DEATHS BY PLACE OF OCCURRENCE, BY SEX, BY PROVINCE
AND CITY/MUNICIPALITY
2011-2014
Both
SexesMale Female
Both
SexesMale Female
40,952 23,112 17,840 41,818 23,172 18,646
7,592 4,286 3,306 7,869 4,382 3,487
Alburquerque 66 39 27 64 28 36
Alicia 102 66 36 130 68 62
Anda 81 46 35 82 49 33
Antequera 97 43 54 94 51 43
Baclayon 118 56 62 114 53 61
Balilihan 66 36 30 94 52 42
Batuan 64 43 21 77 43 34
Bien Unido 84 48 36 85 41 44
Bilar 96 53 43 92 56 36
Buenavista 111 51 60 118 61 57
Calape 173 92 81 167 94 73
Candijay 160 99 61 145 87 58
Carmen 234 145 89 236 128 108
Catigbian 106 63 43 132 86 46
Clarin 121 60 61 124 70 54
Corella 33 22 11 38 24 14
Cortes 85 47 38 76 42 34
Dagohoy 65 35 30 65 36 29
Danao 60 31 29 70 39 31
Dauis 180 94 86 155 100 55
Dimiao 71 39 32 74 45 29
Duero 92 44 48 93 53 40
Garcia Hernandez 115 52 63 126 69 57
Guindulman 201 113 88 213 112 101
Inabanga 171 105 66 158 90 68
Jagna 267 150 117 246 124 122
Jetafe 121 67 54 149 85 64
Lila 61 34 27 62 39 23
Loay 95 54 41 68 40 28
Loboc 103 68 35 96 60 36
Loon 265 118 147 239 112 127
Mabini 139 74 65 155 82 73
Maribojoc 106 66 40 114 66 48
Panglao 118 65 53 142 73 69
Pilar 112 70 42 127 70 57
Pres. Carlos P. Garcia 84 46 38 101 53 48
Sagbayan 75 33 42 81 43 38
San Isidro 46 25 21 53 22 31
San Miguel 113 65 48 142 78 64
Sevilla 56 35 21 63 36 27
Sierra Bullones 105 68 37 134 77 57
Sikatuna 38 20 18 41 26 15
Tagbilaran City 1,633 962 671 1,780 1,016 764
Source: Vital Statistics Report; Philippine Statistics Authority
BOHOL
CENTRAL VISAYAS
Place of
Occurrence/Province/ City/
Municipality
2011 2012
9-27

Table 9.5 - Continued
Both
SexesMale Female
Both
SexesMale Female
43,849 24,433 19,416 44,615 24,788 19,827
8,166 4,546 3,620 8,105 4,507 3,598
Alburquerque 56 29 27 64 42 22
Alicia 102 54 48 113 62 51
Anda 79 36 43 74 34 40
Antequera 110 46 64 96 52 44
Baclayon 115 54 61 98 50 48
Balilihan 100 57 43 97 51 46
Batuan 72 33 39 64 42 22
Bien Unido 90 53 37 96 49 47
Bilar 81 58 23 71 38 33
Buenavista 99 62 37 113 58 55
Calape 181 111 70 183 100 83
Candijay 171 89 82 139 74 65
Carmen 231 130 101 241 132 109
Catigbian 133 68 65 104 56 48
Clarin 125 66 59 96 51 45
Corella 45 28 17 39 19 20
Cortes 79 40 39 91 38 53
Dagohoy 69 42 27 69 46 23
Danao 74 37 37 59 40 19
Dauis 178 95 83 197 105 92
Dimiao 86 58 28 88 50 38
Duero 95 54 41 105 52 53
Garcia Hernandez 131 85 46 141 83 58
Guindulman 187 115 72 199 116 83
Inabanga 173 82 91 159 90 69
Jagna 239 121 118 261 141 120
Jetafe 109 57 52 111 53 58
Lila 49 21 28 61 36 25
Loay 77 36 41 93 50 43
Loboc 106 53 53 95 54 41
Loon 319 156 163 233 117 116
Mabini 147 80 67 150 85 65
Maribojoc 116 51 65 107 60 47
Panglao 138 85 53 133 72 61
Pilar 125 64 61 110 61 49
Pres. Carlos P. Garcia 95 51 44 77 45 32
Sagbayan 80 37 43 79 41 38
San Isidro 58 32 26 54 29 25
San Miguel 126 80 46 140 89 51
Sevilla 57 37 20 63 28 35
Sierra Bullones 114 68 46 132 74 58
Sikatuna 37 21 16 53 36 17
Tagbilaran City 2,034 1,193 841 2,071 1,179 892
20142013Place of
Occurrence/Province/ City/
Municipality
BOHOL
CENTRAL VISAYAS
9-28

Table 9.5 - Continued
Both
SexesMale Female
Both
SexesMale Female
Talibon 422 231 191 388 215 173
Trinidad 104 60 44 114 75 39
Tubigon 276 149 127 259 141 118
Ubay 326 196 130 306 162 144
Valencia 175 108 67 187 110 77
25,588 14,422 11,166 25,443 13,967 11,476
Alcantara 50 27 23 62 29 33
Alcoy 66 37 29 65 34 31
Alegria 165 91 74 149 72 77
Aloguinsan 98 51 47 115 60 55
Argao 439 252 187 365 209 156
Asturias 227 122 105 241 130 111
Badian 248 136 112 291 156 135
Balamban 393 220 173 417 225 192
Bantayan 477 277 200 468 243 225
Barili 403 210 193 373 191 182
Bogo 575 302 273 561 330 231
Boljoon 105 52 53 97 53 44
Borbon 148 89 59 154 91 63
Carcar 552 310 242 567 325 242
Carmen 211 117 94 225 125 100
Catmon 168 91 77 171 90 81
Cebu City 9,300 5,389 3,911 9,357 5,225 4,132
Compostela 210 115 95 200 103 97
Consolacion 311 190 121 306 167 139
Cordoba 202 108 94 192 103 89
Daanbantayan 464 252 212 451 261 190
Dalaguete 398 242 156 359 189 170
Danao City 594 346 248 656 372 284
Dumanjug 185 93 92 217 129 88
Ginatilan 93 45 48 77 38 39
Lapu-lapu City 1,486 859 627 1,502 822 680
Liloan 367 195 172 379 206 173
Madridejos 125 55 70 137 67 70
Malabuyoc 137 73 64 124 70 54
Mandaue City 1,302 722 580 1,185 642 543
Medellin 289 155 134 317 178 139
Minglanilla 504 259 245 425 227 198
Moalboal 110 65 45 137 88 49
Naga 547 328 219 580 296 284
Oslob 190 87 103 195 92 103
Pilar 62 27 35 64 40 24
Pinamungahan 319 163 156 307 158 149
Poro 86 51 35 104 56 48
Ronda 115 52 63 120 61 59
Samboan 132 67 65 110 52 58
CEBU
Place of
Occurrence/Province/ City/
Municipality
2011 2012
9-29

Table 9.5 - Continued
Both
SexesMale Female
Both
SexesMale Female
Talibon 391 218 173 366 201 165
Trinidad 96 56 40 103 58 45
Tubigon 246 133 113 236 135 101
Ubay 352 200 152 383 223 160
Valencia 193 114 79 198 110 88
26,995 15,032 11,963 27,795 15,391 12,404
Alcantara 58 27 31 62 37 25
Alcoy 66 38 28 94 56 38
Alegria 135 66 69 129 66 63
Aloguinsan 111 62 49 127 65 62
Argao 402 213 189 431 228 203
Asturias 242 135 107 250 145 105
Badian 273 134 139 261 132 129
Balamban 439 240 199 469 236 233
Bantayan 496 285 211 519 304 215
Barili 374 200 174 390 186 204
Bogo 628 347 281 640 328 312
Boljoon 115 63 52 89 52 37
Borbon 168 89 79 148 88 60
Carcar 514 299 215 557 303 254
Carmen 203 112 91 219 122 97
Catmon 147 78 69 167 83 84
Cebu City 10,426 5,863 4,563 10,685 6,028 4,657
Compostela 200 111 89 169 83 86
Consolacion 350 195 155 443 269 174
Cordoba 190 102 88 233 129 104
Daanbantayan 489 270 219 485 264 221
Dalaguete 384 225 159 391 205 186
Danao City 676 392 284 708 367 341
Dumanjug 232 127 105 241 136 105
Ginatilan 86 44 42 92 50 42
Lapu-lapu City 1,466 802 664 1,371 791 580
Liloan 416 235 181 370 189 181
Madridejos 132 86 46 125 59 66
Malabuyoc 131 69 62 138 73 65
Mandaue City 1,266 741 525 1,325 766 559
Medellin 288 142 146 320 165 155
Minglanilla 476 265 211 500 267 233
Moalboal 133 67 66 157 94 63
Naga 601 355 246 606 352 254
Oslob 171 95 76 168 92 76
Pilar 75 39 36 74 41 33
Pinamungahan 303 169 134 276 150 126
Poro 115 64 51 126 79 47
Ronda 143 61 82 128 68 60
Samboan 109 47 62 104 58 46
2014
CEBU
2013Place of
Occurrence/Province/ City/
Municipality
9-30

Table 9.5 - Continued
Both
SexesMale Female
Both
SexesMale Female
San Fernando 270 154 116 254 130 124
San Francisco 253 149 104 295 158 137
San Remigio 226 119 107 231 124 107
Santa Fe 109 64 45 133 74 59
Santander 99 52 47 98 49 49
Sibonga 246 129 117 196 109 87
Sogod 203 106 97 185 102 83
Tabogon 185 91 94 192 117 75
Tabuelan 128 73 55 141 74 67
City of Talisay 812 472 340 815 439 376
Toledo City 843 500 343 755 418 337
Tuburan 318 168 150 280 141 139
Tudela 43 23 20 46 27 19
7,091 4,044 3,047 7,841 4,461 3,380
Amlan 120 74 46 114 59 55
Ayungon 153 88 65 181 94 87
Bacong 144 81 63 165 96 69
Bais City 317 171 146 405 221 184
Basay 72 41 31 85 45 40
City of Bayawan 468 274 194 579 356 223
Bindoy 231 133 98 220 127 93
Canlaon City 247 142 105 271 156 115
Dauin 186 106 80 160 87 73
Dumaguete City 2,010 1,137 873 2,222 1,274 948
Guihulngan 451 249 202 490 279 211
Jimalalud 103 59 44 120 65 55
La Libertad 131 70 61 155 83 72
Mabinay 278 162 116 317 170 147
Manjuyod 144 83 61 153 91 62
Pamplona 161 88 73 169 93 76
San Jose 103 47 56 91 44 47
Santa Catalina 260 161 99 295 181 114
Siaton 330 204 126 360 206 154
Sibulan 234 130 104 239 144 95
City of Tanjay 358 209 149 427 238 189
Tayasan 136 71 65 140 88 52
Valencia 138 78 60 111 67 44
Vallehermoso 172 94 78 191 92 99
Zamboanguita 144 92 52 181 105 76
681 360 321 665 362 303
Enrique Villanueva 42 16 26 45 21 24
Larena 65 35 30 74 39 35
Lazi 136 74 62 133 80 53
Maria 95 47 48 67 36 31
San Juan 73 40 33 67 30 37
Siquijor 270 148 122 279 156 123
NEGROS ORIENTAL
SIQUIJOR
Place of
Occurrence/Province/ City/
Municipality
2011 2012
9-31

Table 9.5 - Continued
Both
SexesMale Female
Both
SexesMale Female
San Fernando 246 136 110 251 141 110
San Francisco 257 134 123 276 148 128
San Remigio 232 133 99 297 170 127
Santa Fe 121 69 52 126 67 59
Santander 93 50 43 111 57 54
Sibonga 225 128 97 249 129 120
Sogod 226 126 100 226 110 116
Tabogon 180 98 82 199 115 84
Tabuelan 129 70 59 130 84 46
City of Talisay 931 508 423 877 489 388
Toledo City 778 441 337 874 463 411
Tuburan 290 154 136 327 173 154
Tudela 58 31 27 65 39 26
7,959 4,464 3,495 7,927 4,460 3,467
Amlan 126 64 62 113 59 54
Ayungon 176 114 62 166 99 67
Bacong 186 100 86 181 102 79
Bais City 346 206 140 401 229 172
Basay 77 33 44 93 51 42
City of Bayawan 546 302 244 543 318 225
Bindoy 228 129 99 207 122 85
Canlaon City 236 135 101 285 173 112
Dauin 175 107 68 197 108 89
Dumaguete City 2,344 1,325 1,019 2,350 1,314 1,036
Guihulngan 434 247 187 398 224 174
Jimalalud 99 52 47 71 43 28
La Libertad 158 79 79 147 76 71
Mabinay 293 170 123 289 164 125
Manjuyod 179 86 93 176 94 82
Pamplona 184 103 81 175 100 75
San Jose 103 62 41 98 50 48
Santa Catalina 342 196 146 352 187 165
Siaton 353 204 149 338 204 134
Sibulan 249 133 116 267 143 124
City of Tanjay 436 249 187 418 229 189
Tayasan 168 84 84 125 72 53
Valencia 161 89 72 149 85 64
Vallehermoso 187 96 91 193 105 88
Zamboanguita 173 99 74 195 109 86
729 391 338 788 430 358
Enrique Villanueva 43 23 20 41 18 23
Larena 78 48 30 66 37 29
Lazi 143 76 67 157 80 77
Maria 84 49 35 98 50 48
San Juan 91 41 50 111 65 46
Siquijor 290 154 136 315 180 135
20142013
NEGROS ORIENTAL
SIQUIJOR
Place of
Occurrence/Province/ City/
Municipality
9-32

Table 9.6
Mortality, Leading Causes, Number and Rate Per 100,000 Population in Central Visayas
Rank Number Rate
Pneumonia 1 9,083 118.12
Cardiovascular Disease 2 4,866 63.28
Cancer 3 2,361 30.70
Essential (Primary) Hypertension 4 1,209 15.72
Diabetes Mellitus 5 1,150 14.96
Sepsis 6 913 11.87
Cerebrovascular Diseases 7 669 8.70
Respiratory Tuberculosis 8 599 7.79
Renal Diseases 9 419 5.45
Gastroenteritis 10 369 4.80
Rank Number Rate
Other Heat Diseases 1 5,117 68.81
Cancer 2 3,746 50.37
Pneumonia 3 3,362 45.21
Ischemic Heart Disease 4 2,392 32.17
Hypertensive Heart Disease 5 2,187 29.41
Cerebrovascular Disease 6 2,161 29.06
Chronic lower Resporatory Diseases 7 1,247 16.77
Septecemia 8 1,233 16.58
Renal Diseases 9 961 12.92
Respiratory Tuberculosis 10 518 6.97
Rank Number Rate
Pneumonia 1 2,672 35.93
Cardiovascular Disease 2 2,595 34.90
Neoplasm Malignancy 3 1,612 21.68
Myocardial Infarction 4 1,345 18.09
Pulmonary Tuberculosis 5 991 13.33
Bronchopneumonia Unspecified 6 654 8.79
Hypertension 7 615 8.27
Diabetes Mellitus 8 517 6.95
Sespis Generalized 9 424 5.70
Cerebrovalcular Accident 10 273 3.67
Source : FHSIS A3 ; Department of Health Region VII
2012-2017
Causes2016
Causes2015
Causes2017
9-33

Table 9.6 - Continued
Rank Number Rate
Diseases of the Heart & Circulatory System 1 5,459 74.69
Pneumonia 2 4,617 63.17
Cancer 3 4,109 56.22
Hypertensive Disease 4 1,955 26.75
Cerebrovascular Diseases 5 1,928 26.38
Sepsis 6 1,143 15.64
Chronic Lower Respiratory Diseases 7 1,181 16.16
Diabetes Mellitus 8 997 13.64
Renal Diseases 9 883 12.08
Pulmonary Tuberculosis 10 844 11.55
Rank Number Rate
Diseases of the Heart & Circulatory System 1 5,788 80.57
Pneumonia 2 4,175 58.11
Cancer 3 2,475 34.45
Cerebrovascular Diseases 4 2,268 31.57
Diseases of the Genitourinary System 5 1,067 14.85
Diabetes Mellitus 6 850 11.83
Pulmonary Tuberculosis 7 788 10.97
Sepsis 8 741 10.31
Injuries 9 532 7.41
Bronchial Asthma 10 465 6.47
Rank Number Rate
Diseases of the Heart & Circulatory System 1 5,981 84.71
Pneumonia 2 4,782 67.73
Cancer 3 2,764 39.15
Cerebrovascular Diseases 4 1,551 21.97
Sepsis 5 1,162 16.46
Chronic Lower Respiratory Diseases 6 1,135 16.07
Renal Diseases 7 1,089 15.42
Hypertensive Diseases 8 1,073 15.20
Diabetes Mellitus 9 839 11.88
Pulmonary Tuberculosis 10 601 8.51
Causes2012
Causes2014
Causes2013
9-34

Table 9.7
Maternal Mortality, Leading Causes, Number, Rate Per 100,000 Livebirths
and Percent Distribution
2012-2017
Rank Number Rate% of Maternal
Deaths
Eclampsia 1 24 14.15 47.06
Postpartum Eclampsia 2 8 4.72 15.69
Postpartum Hemorrhage 3 7 4.13 13.73
Amniotic Fluid Embolism 4 3 1.77 5.88
Uterine Atony 5 3 1.77 5.88
Postpartum Sepsis 6 2 1.18 3.92
Abruptio Placenta 7 1 0.59 1.96
Placenta Retention 8 1 0.59 1.96
Ectopic Pregnancy 9 1 0.59 1.96
Anemia in Pregnancy 10 1 0.59 1.96
Rank Number Rate% of Maternal
Deaths
Eclampsia 1 15 9.49 -
Postpartum Eclampsia 2 11 6.96 -
Hemorrhage Postpartum 3 7 4.43 -
Amniotic Fluid Embolism 4 3 1.90 -
Abruptio Placenta 5 2 1.25 -
Uterine Atony 6 2 1.26 -
Placenta Retention 7 2 1.26 -
Ectopic Pregnancy 8 2 1.26 -
Prolonged Labor 9 1 0.63 -
Breech Delivery 10 1 0.63 -
Rank Number Rate% of Maternal
Deaths
Postpartum Eclampsia 1 21 12.65 20.39
Eclampsia 2 18 10.85 17.48
Hemorrhage Postpartum 3 12 7.23 11.65
Sepsis 4 9 5.42 8.74
Amniotic Fluid Embolism 5 5 3.01 4.84
Abruptio Placenta 6 3 1.81 2.91
Prolonged Labor 7 1 0.60 0.97
Uterine Atony 8 1 0.60 0.97
Placenta Accreta 9 1 0.60 0.97
Placenta Retention 10 1 0.60 0.97
Source : FHSIS A3 ; Department of Health Region VII
Causes
2017
Causes
2016
Causes
2015
9-35

Table 9.7 - Continued
Rank Number Rate% of Maternal
Deaths
Postpartum Eclampsia 1 21 0.12 16.15
Eclampsia 2 18 0.11 13.85
Hemorrhage Postpartum 3 12 0.07 9.23
Sepsis 4 9 0.05 6.92
Amniotic Fluid Embolism 5 5 0.03 3.85
Abruptio Placenta 6 3 0.02 2.31
Prolonged Labor 7 1 0.01 0.77
Uterine Atony 8 1 0.01 0.77
Placenta Accreta 9 1 0.01 0.77
Placenta Retention 10 1 0.01 0.77
Rank Number Rate% of Maternal
Deaths
Pre-Eclampsia 1 37 24.14 -
Eclampsia 2 10 6.52 -
Uterine Atony 3 6 3.91 -
Hypertension in Pregnancy 4 4 2.61 -
Sepsis 5 3 1.96 -
Abruptio Placenta 6 2 1.30 -
Prolonged Labor 7 2 1.30 -
Hemorrhage Postpartum 8 2 1.30 -
Placenta Previa 9 2 1.30 -
Placenta Retention 10 1 0.65 -
Rank Number Rate% of Maternal
Deaths
Postpartum Bleeding Unspecified 1 17 11.14 -
Eclampsia 2 14 9.18 -
Abruptio Placenta 3 4 2.62 -
Uterine Atony 4 3 1.97 -
Placenta Accreta 5 3 1.97 -
Breech Delivery 6 3 1.97 -
Pre-Eclampsia 7 2 1.31 -
Hypertension in Pregnancy 8 2 1.31 -
Sepsis 9 2 1.31 -
Placenta Retention 10 1 0.66 -
Causes
2014
Causes
2013
Causes
2012
9-36

Table 9.8
Rank Number Rate% of Infant
Deaths
Pneumonia 1 249 1.47 21.03
Sepsis 2 117 0.69 9.88
Prematurity 3 91 0.54 7.69
Respiratory Distress Syndrome 4 61 0.36 5.15
Gastroenteritis 5 59 0.35 4.98
Asphyxia 6 32 0.19 2.70
Cord Complication 7 19 0.11 1.60
Congenital Anomaly 8 18 0.11 1.52
Sudden Infant Death Syndrome 9 15 0.09 1.27
Utero Placental 10 8 0.05 0.68
Rank Number Rate% of Infant
Deaths
Sepsis 1 124 0.78 11.19
Prematurity 2 119 0.75 10.74
Intrauterine Hypoxia & Birth Asphyxia 3 68 0.43 6.14
Respiratory Distress Syndrome 4 62 0.39 5.60
Congenital Deformities 5 42 0.70 3.79
Diarrhea 6 40 0.25 3.61
Aspiration 7 35 0.22 3.16
Cord Complication 8 32 0.20 2.89
Pneumonia 9 27 0.17 2.44
Fetus & Newborn Affected by Maternal 10 23 0.15 2.08
Rank Number Rate% of Infant
Deaths
Pneumonia 1 180 1.07 9.54
Sepsis Newborn NEC 2 74 0.44 3.92
Intrauterine Hypoxia & Birht Asphyxia 3 45 0.27 2.38
Gastoenteritis 4 29 0.17 1.54
Prematurity 5 24 0.14 1.27
Respiratory Distress Syndrome 6 20 0.12 1.06
Congenital Anomaly Unspecified 7 15 0.09 0.79
Aspiration 8 14 0.08 0.74
Hyaline Membrane 9 8 0.05 0.42
Cardiorespiratory Arrest 10 6 0.04 0.32
Source : FHSIS A3 ; Department of Health Region VII
Infant Mortality, Leading Causes, Number, Rate Per 1000 Livebirths
and Percentage Distribution
2012-2017
Causes
2016
Causes
2015
Causes
2017
9-37

Table 9.8 - Continued
Rank Number Rate% of Infant
Deaths
Pneumonia 1 223 1.32 11.82
Prematurity 2 128 0.76 6.78
Sepsis 3 92 0.55 4.88
Intrauterine Hypoxia & Birth Asphyxia 4 87 0.52 4.61
Congenital Deformities 5 40 0.24 2.12
Diarrhea 6 37 0.22 1.96
Respiratory Distress Syndrome 7 30 0.18 1.59
Fetus & Newborn Affected by Maternal Factors & by
Complications of Pregnancy, Labour & Delivery8 28 0.17 1.48
Haemorrhagic & Haematological Disorders of Fetus
& Newborn9 14 0.08 0.74
Aspiration 10 10 0.06 0.53
Source : FHSIS A3 ; Department of Health Region VII
Rank Number Rate% of Infant
Deaths
Pneumonia 1 189 1.27 17.39
Sepsis 2 132 0.89 12.14
Prematurity 3 70 0.47 6.44
Respiratory Distress Syndrome 4 68 0.46 6.26
Diarrhea 5 56 0.38 5.15
Congenital Anomaly 6 48 0.32 4.42
Asphyxia 7 45 0.30 4.14
Congestive Heart Failure 8 22 0.15 2.02
Sudden Infant Death Syndrome 9 18 0.12 1.66
Aspiration 10 9 0.06 0.83
Rank Number Rate% of Infant
Deaths
Pneumonia 1 144 0.97 13.25
Prematurity 2 121 0.81 11.13
Congenital Deformities 3 115 0.77 10.58
Sepsis 4 84 0.56 7.73
Diarrhea 5 54 0.36 4.97
Sudden Infant Death Syndrome 6 37 0.25 3.40
Respiratory Distress Syndrome 7 26 0.17 2.39
Asphyxia 8 15 0.10 1.38
Cord Complications 9 12 0.08 1.10
Aspiration 10 11 0.07 1.01
Causes
2012
Causes
2014
Causes
2013
9-38

Table 9.10
INFANT MORTALITY RATE BY REGION, PHILIPPINES
1998, 2003, 2008 and 2013
(Rate per 1,000 live births)
1998 2003 2013
Philippines 36.0 30.0 23.0
NCR National Capital Region 23.7 24.0 16.0
CAR Cordillera Administrative Region 42.7 14.0 16.0
I Ilocos Region 41.5 29.0 23.0
II Cagayan Valley 37.1 28.0 20.0
III Central Luzon 28.7 25.0 23.0
IV-A CALABARZON .. 25.0 19.0
IV-B MIMAROPA .. 44.0 36.0
V Bicol Region 31.4 28.0 21.0
VI Western Visayas 26.0 39.0 25.0
VII Central Visayas 23.3 28.0 26.0
VIII Eastern Visayas 60.8 36.0 19.0
IX Zamboanga Peninsula 44.6 27.0 27.0
X Northern Mindanao 41.0 38.0 25.0
XI Davao Region 40.9 38.0 26.0
XII SOCCSKSARGEN 48.4 27.0 37.0
XIII Caraga 53.2 35.0 33.0
ARMM Autonomous Region in Muslim Mindanao 55.1 41.0 32.0
Source: National Demographic and Health Survey, Philippine Statistics Authority
Table 9.11
UNDER-FIVE MORTALITY RATE BY REGION, PHILIPPINES
1998, 2003, 2008 and 2013
(Rate per 1,000 live births)
1998 2003 2013
Philippines 54.9 42.0 34.0 31.0
NCR National Capital Region 38.6 31.0 24.0 22.0
CAR Cordillera Administrative Region 52.4 34.0 31.0 a/
25.0
I Ilocos Region 51.3 39.0 26.0 26.0
II Cagayan Valley 52.6 35.0 46.0 a/
21.0
III Central Luzon 39.4 31.0 29.0 31.0
IV-A CALABARZON .. 31.0 28.0 23.0
IV-B MIMAROPA .. 68.0 49.0 43.0
V Bicol Region 52.5 43.0 34.0 33.0
VI Western Visayas 41.6 50.0 43.0 30.0
VII Central Visayas 38.4 39.0 35.0 34.0
VIII Eastern Visayas 85.6 57.0 64.0 32.0
IX Zamboanga Peninsula 74.9 43.0 31.0 35.0
X Northern Mindanao 64.8 49.0 27.0 49.0
XI Davao Region 61.2 47.0 44.0 37.0
XII SOCCSKSARGEN 75.9 37.0 34.0 52.0
XIII Caraga 82.5 49.0 30.0 39.0
ARMM Autonomous Region in Muslim Mindanao 97.6 72.0 94.0 55.0
a/ Rates are based on 250-499 unweighted children
Source: National Demographic and Health Survey, Philippine Statistics Authority
31.0
Region
Region 2008
2008
25.0
22.0
29.0
24.0
38.0
24.0
20.0
37.0
19.0
39.0
56.0
45.0
14.0
19.0
34.0
23.0
21.0
9-39

Chapter 10
EDUCATION
Data on the country’s educational system are essential in the planning, implementation and
supervision of programs in this field. The primary goal of the programs is to develop a meaningful
and efficient educational system in the country. This is a priority thrust of the government today. A specific objective of programs and systems put in place is to update the quality of our educational
system at all its levels. Education is indispensable in bringing about the desired behavioral and attitudinal changes in the population to effect socio-economic development. The far reaching and enduring effects of a literate citizenry on individual and societal growth and progress call for serious
efforts to continuously improve and promote the accessibility of our educational facilities and services to the people. More so, the responsiveness of our educational system to changes in the
socio-economic spheres and the demands of development initiatives pose a challenge to our decision-makers and educators. To address these challenges in the most efficient and effective fashion, an adequate and timely supply of data focusing on the levels and state of resources and
facilities and the accomplishments of our educational system is indeed vital. This chapter presents data on important aspects of the educational system at the regional
down to the division level. The statistics presented include enrolment and graduates in tertiary level in government or private institutions. This chapter also shows data on the literacy rate and highest
grade completed of the population and the school-going age population, performance indicators in government elementary and secondary schools and enrolment in government and private schools. The basic sources of data are the Department of Education (DepEd), the PSA and data on the
tertiary level were obtained from the Commission on Higher Education (CHED).
Highlights
As the population 10 years and over increases every five years for both male and female,
the basic literacy rate for both sexes also increases, that is, from 92.4 percent in 2003 to
95.1 percent in 2008 and to 96.2 percent in 2013.
However, the basic literacy rate was higher and evident among females with a less number
of population (2.637M in 2008 and 2.814M in 2013) as it surged by 1.4 percent in 2013
while the rate of males was up by only 1.0 percent with a greater number of population
(2.647M in 2008 and 2.841M in 2013).
Similarly, functional literacy rate of population 10 to 64 years old in Central Visayas grew by
0.7 percent for both sexes, from 86.6 percent in 2008 to 87.3 percent in 2013.
Elementary completion rate in the region increased from 91.4 percent in SY 2015-2016 to
95.1 percent in SY 2016-2017. Siquijor recorded the highest elementary completion rate
among provinces for SY 2016-2017 at 99.8 percent.
Enrolment in the tertiary institutions in Central Visayas dropped by 28.0 percent between AY
2015-2016 and AY 2016-2017 with 317,514 and 228,673 enrollees, respectively. Despite the
large number enrolled in Business Administration and related courses, the number of

10-2
students declined by 23.2 percent, from 60,667 to 46,131. Home Economics and Natural
Science dwindled by 100.0 percent and 48.6 percent, respectively.
Graduates of Higher Education Institutions (HEIs) in Central Visayas decreased by 10.7
percent in AY 2016-2017 over AY 2015-2016. Substantial decreased in graduates were
noted in Maritime (66.8 percent), Home Economics (58.3 percent) and Humanities (41.1
percent). On the contrary, large increased were recorded in Trade, Craft and Industrial
(157.6 percent), Religion and Theology (102.6 percent), and Master’s Degree (53.3
percent).

ContentsHighlights 10-1
STATISTICAL TABLES:
Table 10.1A Basic Literacy Rate of Population 10 Years Old and Over by Sex and Age Group
Central Visayas: 2003, 2008 and 2013…………………………………………………………… 10-4
Table 10.1B Functional Literacy Rate of Population 10 to 64 Years Old by Sex and Age Group
Central Visayas: 2003, 2008 and 2013…………………………………………………………… 10-5
Table 10.2A Basic Literacy Rate of Population 10 Years Old and Over by Highest
Educational Attainment in Central Visayas: 2003, 2008 and 2013……………………… 10-6
Table 10.2B Functional Literacy Rate of Population 10 Years Old and Over by Highest
Educational Attainment in Central Visayas: 2003, 2008 and 2013……………………… 10-6
Table 10.3A Enrolment in Tertiary Education by Discipline
Central Visayas: AY 2014-2015 to AY 2015-2017……………………………………………. 10-7
Table 10.3B Graduates in Tertiary Education by Discipline
Central Visayas: AY 2014-2015 to AY 2015-2017……………………………………………. 10-8
Table 10.4 Enrolment in Government and Private Schools by Level of Education and by
Province/City in Central Visayas: SY 2016-2017………………………………………………. 10-9
Table 10.5 Performance Indicator in Government Elementary and Secondary Schools
by Province in Central Visayas: SY 2007-2008 to SY 2016-2017……………………….. 10-11
10-3

Table 10.1A
BASIC LITERACY RATE OF POPULATION 10 YEARS OLD AND OVER BY SEX AND AGE GROUP
Years 2003, 2008, and 2013*
Both Sexes Male Female Both Sexes Male Female
Central Visayas
2003 4,599 2,314 2,285 92.4 91.5 93.2
10 - 14 719 368 351 94.6 92.2 97.1
15 - 19 631 304 328 95.9 93.8 97.9
20 - 24 558 267 291 95.5 93.3 97.6
25 - 29 480 250 230 93.2 92.9 93.5
30 - 39 798 413 385 94.0 92.6 95.4
40 - 49 616 327 289 94.2 93.5 95.0
50 - 59 379 193 185 87.1 88.5 85.7
60 and over 418 193 225 77.0 79.9 74.5
2008 5,283 2,647 2,637 95.1 94.6 95.6
10 - 14 842 442 400 96.4 95.1 97.9
15 - 19 807 397 410 97.8 96.7 98.8
20 - 24 560 292 268 97.5 97.6 97.4
25 - 29 522 272 249 96.8 96.0 97.8
30 - 39 910 451 459 94.9 93.5 96.4
40 - 49 693 346 347 96.0 95.3 97.0
50 - 59 467 228 239 94.2 94.5 93.8
60 and over 483 218 265 83.4 84.7 82.4
2013 5,656 2,841 2,814 96.2 95.5 96.9
10 - 14 743 384 359 98.9 98.3 99.4
15 - 19 742 382 360 99.1 99.0 99.1
20 - 24 671 342 329 97.3 95.7 98.8
25 - 29 575 294 282 98.1 97.6 98.6
30 - 39 963 489 474 96.3 94.8 97.7
40 - 49 780 395 385 94.6 93.6 95.6
50 - 59 579 287 292 95.6 95.8 95.3
60 and over 603 269 333 88.7 87.3 89.7
Note: *The Functional Literacy, Education and Mass Media Survey is conducted every five years
Source: 2003, 2008 and 2013 Functional Literacy, Education and Mass Media Surveys,
Philippine Statistics Authority
Population 10 Years and Over
(In thousands)Year
Basic Literacy Rate
(In percent)
10-4

Table 10.1B
FUNCTIONAL LITERACY RATE OF POPULATION 10 TO 64 YEARS OLD BY SEX AND AGE GROUP
Years 2003, 2008, and 2013*
Both Sexes Male Female Both Sexes Male Female
Central Visayas
2003 4,294 2,161 2,133 81.7 79.8 83.6
10 - 14 719 368 351 76.0 71.7 80.6
15 - 19 631 304 328 87.6 84.5 90.4
20 - 24 556 267 290 88.2 84.4 91.7
25 - 29 472 247 226 84.4 83.4 85.5
30 - 39 786 404 382 82.8 80.4 85.3
40 - 49 604 317 287 82.3 82.1 82.6
50 - 59 375 192 184 75.5 76.5 74.4
60 and over 150 64 86 59.6 66.5 54.4
2008 4,948 2,499 2,449 86.6 84.4 88.8
10 - 14 842 442 400 82.8 79.0 86.9
15 - 19 838 419 419 91.2 90.8 91.6
20 - 24 529 270 259 93.9 92.3 95.6
25 - 29 506 260 246 92.5 89.0 96.2
30 - 39 931 470 461 85.4 81.7 89.3
40 - 49 679 332 347 84.0 82.3 85.5
50 - 59 476 236 240 80.2 79.6 80.8
60 and over 147 70 77 75.2 77.1 73.5
2013 5,252 2,667 2,585 87.3 84.8 89.8
10 - 14 743 384 359 81.7 80.2 83.4
15 - 19 742 382 360 93.2 90.9 95.7
20 - 24 671 342 329 94.3 92.3 96.3
25 - 29 575 294 282 92.8 91.3 94.3
30 - 39 963 489 474 86.2 82.1 90.5
40 - 49 780 395 385 83.8 80.9 86.8
50 - 59 579 287 292 83.2 82.3 84.1
60 and over 199 95 103 76.6 69.4 83.2
Note: *The Functional Literacy, Education and Mass Media Survey is conducted every five years
Source: 2003, 2008 and 2013 Functional Literacy, Education and Mass Media Surveys,
Philippine Statistics Authority
Year
Population 10 to 64 Years Old
(In thousands)
Functional Literacy Rate
(In percent)
10-5

Table 10.2A
BASIC LITERACY RATE OF POPULATION 10 YEARS OLD AND OVER BY HIGHEST EDUCATIONAL ATTAINMENT
Years 2003, 2008, and 2013*
2003 2008 2013
CENTRAL VISAYAS
No Grade Completed/ Preschool 3.8 5.1 8.1
Elementary Level 87.5 92.3 92.4
Elementary Graduate 99.3 99.8 100.0
High School Level 100.0 100.0 100.0
High School Graduate 100.0 100.0 100.0
Post Secondary Level/ Graduate 100.0 100.0 100.0
College Level 99.8 100.0 100.0
College Graduate/ Higher 100.0 100.0 100.0
*The Functional Literacy, Education and Mass Media Survey is conducted every five years
Source:2003, 2008 and 2013 Functional Literacy, Education and Mass Media Surveys, Philippine
Statistics Authority
Table 10.2B
FUNCTIONAL LITERACY RATE OF POPULATION 10 TO 64 YEARS OLD BY HIGHEST EDUCATIONAL ATTAINMENT
Years 2003, 2008, and 2013*
2003 2008 2013
CENTRAL VISAYAS
Functional Literacy Rate of Population 10-64 years old 81.7 86.6 87.3
No Grade Completed/ Preschool 0.8 2.3 5.4
Elementary Level 64.6 70.6 68.8
Elementary Graduate 81.9 84.7 85.2
High School Level 88.1 91.0 87.6
High School Graduate/ Higher 100.0 100.0 100.0
*The Functional Literacy, Education and Mass Media Survey is conducted every five years
Source:2003, 2008 and 2013 Functional Literacy, Education and Mass Media Surveys, Philippine
Statistics Authority
Note: Sample size limitation implies that a 100 percent rate means very high literacy rate; not complete absence of illiteracy.
Highest Educational Attainment
Sample size limitation implies that a 100 percent rate means very high literacy rate; not complete absence of illiteracy.Note:
Highest Educational Attainment
10-6

Table 10.3A
ENROLMENT IN TERTIARY EDUCATION BY DISCIPLINE
AY 2014-2015 TO AY 2016-2017
Male Female Total Male Female Total Male Female Total
Central Visayas 131,636 155,886 287,522 144,330 173,184 317,514 102,136 126,537 228,673
Agricultural, Forestry, and Fisheries 2,046 2,219 4,265 2,436 3,056 5,492 1,496 2,093 3,589
Architectural and Town-Planning 2,104 2,187 4,291 1,728 1,551 3,279 1,477 1,308 2,785
Business Administration And Related 19,118 42,591 61,709 18,408 41,659 60,067 14,756 31,375 46,131
Education Science and Teacher Training 8,639 37,973 46,612 11,140 39,093 50,233 6,754 31,060 37,814
Engineering 31,438 14,009 45,447 33,196 19,141 52,337 24,213 11,010 35,223
Fine and Applied Arts 221 117 338 709 941 1,650 419 666 1,085
General 520 797 1,317 1,006 2,461 3,467 504 1,674 2,178
Home Economics 112 350 462 - 4 4 - - -
Humanities 634 1,478 2,112 586 1,057 1,643 411 903 1,314
IT-Related 11,313 9,151 20,464 12,986 10,293 23,279 9,477 7,411 16,888
Law and Jurisprudence 8,276 3,848 12,124 1,135 1,390 2,525 788 987 1,775
Maritime 26,929 634 27,563 27,590 655 28,245 16,837 439 17,276
Mass Communication and Documentation 417 1,442 1,859 265 847 1,112 173 529 702
Mathematics 156 223 379 177 279 456 118 196 314
Medical and Allied 5,883 13,717 19,600 5,468 14,272 19,740 3,456 8,247 11,703
Natural Science 935 1,492 2,427 1,059 1,200 2,259 452 710 1,162
Other Disciplines 241 386 627 7,275 4,240 11,515 6,499 3,366 9,865
Religion and Theology 196 168 364 174 94 268 104 57 161
Service Trades 702 3,798 4,500 2,286 7,322 9,608 1,662 4,985 6,647
Social and Behavioral Sciences 2,070 4,843 6,913 1,666 4,365 6,031 1,196 2,993 4,189
Trade, Craft and Industrial 2,144 1,718 3,862 1,796 1,977 3,773 1,551 1,065 2,616
Pre and Post-Baccalaureate 4,356 5,715 10,071 8,820 7,937 16,757 5,281 5,169 10,450
Masters 2,559 5,914 8,473 3,601 7,994 11,595 3,564 8,778 12,342
Doctoral 627 1,116 1,743 823 1,356 2,179 948 1,516 2,464
Source: Commission on Higher Education Regional Office VII
AY 2016-2017AY 2015-2016Discipline Group
AY 2014-2015
10-7

Table 10.3B
GRADUATES IN TERTIARY EDUCATION BY DISCIPLINE
AY 2014-2015 TO AY 2016-2017
Male Female Total Male Female Total Male Female Total
Central Visayas 16,705 20,406 37,111 25,187 27,275 53,582 22,176 25,695 47,871
Agricultural, Forestry, and Fisheries 199 128 327 320 276 596 194 260 454
Architectural and Town-Planning 67 57 124 139 120 259 143 125 268
Business Administration And Related 2,641 5,316 7,957 2,693 6,923 9,616 2,338 6,324 8,662
Education Science and Teacher Training 968 4,914 5,882 1,273 5,250 6,523 835 4,679 5,514
Engineering 3,257 1,307 4,564 4,005 2,273 6,278 3,479 1,680 5,159
Fine and Applied Arts 26 11 37 37 76 113 42 92 134
General 51 109 160 151 392 543 98 489 587
Home Economics 4 28 32 6 6 12 - 5 5
Humanities 98 238 336 83 165 248 51 95 146
IT-Related 1,466 1,463 2,929 1,644 1,599 3,243 1,319 1,224 2,543
Law and Jurisprudence 831 317 1,148 135 150 285 107 140 247
Maritime 4,036 47 4,083 5,685 481 6,166 2,001 48 2,049
Mass Communication and Documentation 53 271 324 32 201 233 37 115 152
Mathematics 29 52 81 18 36 54 24 41 65
Medical and Allied 902 2,399 3,301 873 2,193 3,066 636 1,406 2,042
Natural Science 162 184 346 181 167 348 153 234 387
Other Disciplines 35 42 77 852 540 1,392 677 479 1,156
Religion and Theology 45 62 107 28 11 39 40 39 79
Service Trades 59 471 530 331 11 1,462 252 817 1,069
Social and Behavioral Sciences 174 543 717 269 635 904 167 547 714
Trade, Craft and Industrial 748 666 1,414 692 360 1,052 1,555 1,155 2,710
Pre and Post-Baccalaureate 97 172 269 4,672 3,595 8,267 5,230 4,371 9,601
Masters 185 479 664 883 1,530 2,413 2,641 1,057 3,698
Doctoral 572 1,130 1,702 185 285 470 157 273 430
Source: Commission on Higher Education Regional Office VII
AY 2016-2017AY 2014-2015 AY 2015-2016Discipline Group
10-8

Table 10.4
ENROLMENT IN GOVERNMENT AND PRIVATE SCHOOLS BY LEVEL OF EDUCATION AND BY PROVINCE/CITY
SY 2016-2017
Total Male Female Total Male Female Total Male Female
Central Visayas
Elementary 978,933 513,656 465,277 907,563 476,769 430,794 71,370 36,887 34,483
Kindergarten 100,344 52,210 48,134 90,062 46,840 43,222 10,282 5,370 4,912
Grade 1 133,589 70,576 63,013 123,155 65,067 58,088 10,434 5,509 4,925
Grade 2 140,309 73,717 66,592 129,895 68,370 61,525 10,414 5,347 5,067
Grade 3 143,020 74,953 68,067 132,953 69,700 63,253 10,067 5,253 4,814
Grade 4 145,359 76,863 68,496 135,347 71,692 63,655 10,012 5,171 4,841
Grade 5 169,337 90,041 79,296 158,528 84,557 73,971 10,809 5,484 5,325
Grade 6 146,975 75,296 71,679 137,623 70,543 67,080 9,352 4,753 4,599
Secondary 469,774 233,782 235,992 391,636 194,515 197,121 78,138 39,267 38,871
Grade 7 135,397 70,088 65,309 114,937 59,749 55,188 20,460 10,339 10,121
Grade 8 122,440 61,517 60,923 102,487 51,303 51,184 19,953 10,214 9,739
Grade 9 110,081 53,924 56,157 91,178 44,414 46,764 18,903 9,510 9,393
Grade 10 101,856 48,253 53,603 83,034 39,049 43,985 18,822 9,204 9,618
Grade 11 - - - - - - - - -
Grade 12 - - - - - - - - -
Bohol
Elementary 210,343 110,998 99,345 199,209 105,139 94,070 11,134 5,859 5,275
Kindergarten 21,368 11,164 10,204 19,067 9,912 9,155 2,301 1,252 1,049
Grade 1 27,195 14,255 12,940 25,511 13,368 12,143 1,684 887 797
Grade 2 28,448 14,813 13,635 26,910 14,007 12,903 1,538 806 732
Grade 3 29,845 15,763 14,082 28,363 14,988 13,375 1,482 775 707
Grade 4 31,063 16,458 14,605 29,674 15,740 13,934 1,389 718 671
Grade 5 38,775 21,092 17,683 37,389 20,367 17,022 1,386 725 661
Grade 6 33,649 17,453 16,196 32,295 16,757 15,538 1,354 696 658
Secondary 108,264 54,187 54,077 85,599 42,721 42,878 22,665 11,466 11,199
Grade 7 30,913 16,135 14,778 24,849 12,971 11,878 6,064 3,164 2,900
Grade 8 27,947 14,173 13,774 22,066 11,146 10,920 5,881 3,027 2,854
Grade 9 25,048 12,364 12,684 19,841 9,746 10,095 5,207 2,618 2,589
Grade 10 24,356 11,515 12,841 18,843 8,858 9,985 5,513 2,657 2,856
Grade 11 - - - - - - - - -
Grade 12 - - - - - - - - -
Cebu
Elementary 755,661 395,878 359,783 696,000 365,136 330,864 59,661 30,742 28,919
Kindergarten 77,588 40,345 37,243 69,763 36,297 33,466 7,825 4,048 3,777
Grade 1 104,622 55,419 49,203 95,935 50,828 45,107 8,687 4,591 4,096
Grade 2 110,000 57,954 52,046 101,187 53,449 47,738 8,813 4,505 4,308
Grade 3 111,340 58,216 53,124 102,832 53,775 49,057 8,508 4,441 4,067
Grade 4 112,426 59,412 53,014 103,871 54,993 48,878 8,555 4,419 4,136
Grade 5 128,484 67,837 60,647 119,139 63,122 56,017 9,345 4,715 4,630
Grade 6 111,201 56,695 54,506 103,273 52,672 50,601 7,928 4,023 3,905
Secondary 354,213 175,863 178,350 300,565 149,045 151,520 53,648 26,818 26,830
Grade 7 102,531 52,913 49,618 88,566 45,982 42,584 13,965 6,931 7,034
Grade 8 92,624 46,395 46,229 79,008 39,447 39,561 13,616 6,948 6,668
Grade 9 83,258 40,643 42,615 70,039 34,014 36,025 13,219 6,629 6,590
Grade 10 75,800 35,912 39,888 62,952 29,602 33,350 12,848 6,310 6,538
Grade 11 - - - - - - - - -
Grade 12 - - - - - - - - -
Source: Department of Eduation Region VII
Data are based on the following:
a) Total number of Schools: 658
b) Total number of Schools Submitted: 480
c) Total number of Schools Validated: 451
of which 72.95% submitted and 68.54% validated
Data generated on January 19, 2018
SY 2016-2017
Total Government PrivateProvince/City
Level of Education
10-9

Table 10.4 - Continued
Total Male Female Total Male Female Total Male Female
Negros Oriental
Elementary - - - - - - - - -
Kindergarten - - - - -
Grade 1 - - - - -
Grade 2 - - - - -
Grade 3 - - - - -
Grade 4 - - - - -
Grade 5 - - - - -
Grade 6 - - - - -
Secondary - - - - - - - - -
Grade 7 - - - - -
Grade 8 - - - - -
Grade 9 - - - - -
Grade 10 - - - - -
Grade 11 - - - - -
Grade 12 - - - - -
Siquijor
Elementary 12,929 6,780 6,149 12,354 6,494 5,860 575 286 289
Kindergarten 1,388 701 687 1,232 631 601 156 70 86
Grade 1 1,772 902 870 1,709 871 838 63 31 32
Grade 2 1,861 950 911 1,798 914 884 63 36 27
Grade 3 1,835 974 861 1,758 937 821 77 37 40
Grade 4 1,870 993 877 1,802 959 843 68 34 34
Grade 5 2,078 1,112 966 2,000 1,068 932 78 44 34
Grade 6 2,125 1,148 977 2,055 1,114 941 70 34 36
Secondary 7,297 3,732 3,565 5,472 2,749 2,723 1,825 983 842
Grade 7 1,953 1,040 913 1,522 796 726 431 244 187
Grade 8 1,869 949 920 1,413 710 703 456 239 217
Grade 9 1,775 917 858 1,298 654 644 477 263 214
Grade 10 1,700 826 874 1,239 589 650 461 237 224
Grade 11 - - - - - - - - -
Grade 12 - - - - - - - - -
Province/City
Level of Education
SY 2016-2017
Total Government Private
10-10

Table 10.5
PERFORMANCE INDICATORS IN GOVERNMENT ELEMENTARY AND
SECONDARY SCHOOLS BY PROVINCE
SY 2007-2008 TO 2016-2017
Elementary Secondary Elementary Secondary Elementary Secondary
Central Visayas
SY 2007-2008 93.36% 88.66% 80.45% 75.04% 77.97% 72.03%
SY 2008-2009 93.16% 88.69% 80.15% 74.07% 77.77% 70.79%
SY 2009-2010 93.57% 90.05% 82.45% 77.73% 79.50% 74.29%
SY 2010-2011 92.71% 82.23% 78.83% 63.52% 75.66% 60.66%
SY 2011-2012 … … 84.67% 80.23% 82.77% 77.22%
SY 2012-2013 … … 84.17% 75.88% 82.38% 73.12%
SY 2013-2014 … … 89.51% 80.13% 87.86% 77.66%
SY 2014-2015 … … 91.58% 81.42% 90.36% 79.72%
SY 2015-2016 … … 92.51% 80.56% 91.37% 79.15%
SY 2016-2017 74.33% 70.76% 95.62% 83.77% 95.12% 82.06%
Bohol
SY 2007-2008 93.22% 90.33% 81.22% 78.18% 78.24% 75.70%
SY 2008-2009 93.93% 90.67% 83.99% 78.57% 81.40% 76.11%
SY 2009-2010 94.44% 90.13% 85.31% 76.78% 80.70% 73.30%
SY 2010-2011 94.11% 91.11% 82.07% 79.60% 78.86% 77.90%
SY 2011-2012 … … 88.08% 73.48% 86.13% 70.81%
SY 2012-2013 … … 87.56% 75.62% 85.82% 73.71%
SY 2013-2014 … … 93.20% 81.95% 91.81% 80.13%
SY 2014-2015 … … 90.10% 79.81% 88.91% 78.33%
SY 2015-2016 … … 95.84% 79.11% 95.18% 78.11%
SY 2016-2017 99.07% 93.62% 97.45% 83.70% 97.32% 82.60%
Cebu
SY 2007-2008 93.55% 86.39% 79.79% 69.39% 77.28% 65.90%
SY 2008-2009 93.77% 87.53% 81.93% 74.78% 79.29% 70.40%
SY 2009-2010 93.30% 88.64% 78.24% 75.85% 75.75% 72.55%
SY 2010-2011 92.20% 89.29% 79.52% 77.37% 77.63% 73.86%
SY 2011-2012 … … 80.01% 72.52% 77.30% 69.15%
SY 2012-2013 … … 81.82% 80.09% 79.88% 76.80%
SY 2013-2014 … … 89.48% 78.45% 87.71% 75.25%
SY 2014-2015 … … 85.65% 80.74% 83.97% 77.65%
SY 2015-2016 … … 89.02% 80.67% 87.64% 78.84%
SY 2016-2017 98.07% 91.56% 96.56% 82.99% 95.95% 81.07%
Negros Oriental
SY 2007-2008 89.96% 87.62% 69.83% 73.17% 67.85% 68.64%
SY 2008-2009 90.07% 87.17% 70.53% 68.84% 68.23% 64.70%
SY 2009-2010 90.19% 88.22% 74.47% 74.79% 72.07% 70.38%
SY 2010-2011 90.57% 87.76% 73.14% 74.52% 71.16% 69.02%
SY 2011-2012 … … 71.79% 74.91% 69.84% 68.93%
SY 2012-2013 … … 74.93% 73.02% 72.55% 70.20%
SY 2013-2014 … … 79.45% 75.97% 77.82% 73.20%
SY 2014-2015 … … 92.63% 76.49% 91.12% 74.45%
SY 2015-2016 … … 87.91% 76.46% 86.37% 75.00%
SY 2016-2017 0.00% 0.00% 88.70% 72.28% 87.46% 70.43%
Source: Department of Education Region VII
Division/
School Year
Retention Rate Cohort Survival Rate Completion Rate
10-11

Table 10.5 - Continued
Elementary Secondary Elementary Secondary Elementary Secondary
Siquijor
SY 2007-2008 96.71% 90.30% 90.97% 79.43% 88.49% 77.87%
SY 2008-2009 94.86% 89.38% 84.14% 74.10% 82.16% 71.93%
SY 2009-2010 96.35% 93.19% 91.78% 83.48% 89.48% 80.92%
SY 2010-2011 93.95% 60.77% 80.59% 22.57% 74.99% 21.86%
SY 2011-2012 … … 98.79% 100.00% 97.79% 100.00%
SY 2012-2013 … … 92.38% 74.79% 91.28% 71.75%
SY 2013-2014 … … 95.91% 84.15% 94.09% 82.07%
SY 2014-2015 … … 97.92% 88.64% 97.43% 88.46%
SY 2015-2016 … … 97.27% 86.01% 96.29% 84.65%
SY 2016-2017 100.18% 97.86% 99.76% 96.09% 99.76% 94.12%
Elementary Secondary Elementary Secondary
Siquijor
SY 2007-2008 0.39% 4.84% 101.13% 79.53%
SY 2008-2009 0.51% 3.97% 93.77% 69.72%
SY 2009-2010 0.45% 3.66% 96.73% 73.54%
SY 2010-2011 0.44% 7.81% 95.37% 46.26%
SY 2011-2012 0.28% 3.55% … 81.60%
SY 2012-2013 0.26% 2.83% … …
SY 2013-2014 0.09% 1.18% … 78.85%
SY 2014-2015 0.69% 1.60% … 79.96%
SY 2015-2016 0.40% 1.90% … …
SY 2016-2017 … … 99.25% 80.82%
Division/
School Year
Drop-Out Rate Transition Rate
Division/
School Year
Retention Rate Cohort Survival Rate Completion Rate
10-12

Table 10.5 - Continued
Elementary Secondary Elementary Secondary
Central Visayas
SY 2007-2008 2.38% 6.50% 96.62% 93.96%
SY 2008-2009 2.01% 6.24% 94.87% 82.59%
SY 2009-2010 1.59% 5.70% 95.28% 85.81%
SY 2010-2011 1.29% 5.30% 94.60% 85.83%
SY 2011-2012 1.11% 5.21% … 85.50%
SY 2012-2013 1.02% 4.61% … …
SY 2013-2014 0.56% 3.39% … 85.56%
SY 2014-2015 1.41% 4.28% … 87.10%
SY 2015-2016 0.98% 4.08% … …
SY 2016-2017 … … 64.90% 55.67%
Bohol
SY 2007-2008 2.42% 5.53% 97.80% 85.35%
SY 2008-2009 2.29% 5.83% 97.23% 77.86%
SY 2009-2010 1.89% 5.58% 97.30% 80.89%
SY 2010-2011 1.48% 4.90% 96.44% 79.83%
SY 2011-2012 1.06% 4.56% … 79.74%
SY 2012-2013 0.74% 3.52% … …
SY 2013-2014 0.41% 2.85% … 80.82%
SY 2014-2015 0.72% 3.49% … 81.59%
SY 2015-2016 0.48% 2.62% … …
SY 2016-2017 … … 98.30% 79.88%
Cebu
SY 2007-2008 2.68% 8.03% 97.60% 103.28%
SY 2008-2009 2.30% 6.95% 95.30% 87.45%
SY 2009-2010 2.04% 6.25% 95.04% 90.24%
SY 2010-2011 1.94% 6.66% 94.07% 91.49%
SY 2011-2012 1.65% 6.65% … 89.23%
SY 2012-2013 1.26% 5.65% … …
SY 2013-2014 0.74% 3.75% … 90.09%
SY 2014-2015 2.05% 5.04% … 90.18%
SY 2015-2016 1.19% 4.86% … …
SY 2016-2017 … … 96.40% 87.13%
Negros Oriental
SY 2007-2008 2.03% 5.95% 94.47% 93.24%
SY 2008-2009 1.43% 5.93% 92.07% 82.45%
SY 2009-2010 0.83% 5.26% 93.51% 86.31%
SY 2010-2011 0.45% 4.33% 93.28% 86.16%
SY 2011-2012 0.63% 4.42% … 87.52%
SY 2012-2013 1.05% 4.67% … …
SY 2013-2014 0.53% 3.58% … 85.76%
SY 2014-2015 1.45% 4.31% … 89.53%
SY 2015-2016 1.28% 4.76% … …
SY 2016-2017 … … 0.00% 0.00%
Transition RateDrop-Out RateDivision/
School Year
10-13

11-1
Chapter 11
LABOR and EMPLOYMENT
Data on labor and employment are critical inputs in the formulation of policies aimed at
providing adequate employment opportunities and productive activities to the country’s labor force. The labor force is the backbone of the economy. This single factor alone speaks of a vital sector that plays a crucial role in the development of the nation and the upliftment of the economic well-being of the people. Data on the situation obtained in the workplace are also necessary in enhancing policies and programs of government towards promoting harmonious labor relations and productivity. The generation of adequate, timely and reliable data is an imperative need of the formulators and implementors of our laws, policies and decisions. This chapter presents data on the number and employment status of labor force at the regional and/or provincial levels. The data presented on employed persons include the number of hours worked, the major industry and occupation group, and class of worker. On the other hand, the data on unemployed persons contained in this chapter include the highest grade completed. The chapter also presents the labor turnover rates such as the accession and separation rates. The basic sources of data were the Philippine Statistics Authority (PSA) and the Department of Labor and Employment (DOLE). The PSA generates data on labor force and its employment status using the results of its quarterly Labor Force Survey (LFS).
Highlights
▪ The household population 15 years old and over who are in the labor force decreased by 0.68 percent in 2017 compared to 2016.
▪ In 2017 LFS Annual Estimates, the unemployment rate for the region was recorded at 4.5
percent. Labor force participation rate (LFPR) for the same reference period was 65.1 percent. ▪ In 2017, wage and salary workers made up about 60.3 percent of all classes of workers, self-
employed with 30.9 percent, employer with 2.0 percent, and unpaid family workers with 6.8 percent.
▪ Of the total labor force as of 2017, 28.3 percent were agricultural, hunting, fishing and forestry
workers, 17.5 percent were wholesale and retail trade; repair of motor vehicles and motorcycles workers, 9.4 percent were manufacturing workers, and the rest were workers of other occupation groups.
▪ In terms of the major occupation group, elementary occupations made up 24.3 percent of the
total labor force in 2017. Skilled agricultural, forestry, and fishery workers made up 16.9 percent, and managers made up 13.3 percent.

ContentsHighlights 11-1
STATISTICAL TABLES:
Table 11.1 Labor Force and Employment Status of Household Population
15 Years and Over by Sex in Central Visayas: 2014-2017 ….................................11-4
Table 11.2 Labor Force and Employment Status of Household Population
15 Years and Over, Number and Rate by Sex
Central Visayas: 2014-2017 …...............................................................................11-5
Table 11.3 Employed Persons by Class of Worker and Sex
Central Visayas: 2014-2017 …...............................................................................11-8
Table 11.4 Employed Persons by Sex and Major Industry Group
Central Visayas: 2014-2017 …...............................................................................11-12
Table 11.5 Employed Persons by Sex and Major Occupation Group
Central Visayas: 2014-2017 …...............................................................................11-21
Table 11.6 Employed Persons by Highest Grade Completed and by Sex
Central Visayas: October 2014-2017 …................................................................11-25
Table 11.7A Percentage Distribution of Overseas Filipino Workers by Sex
and by Region: 2014-2017 …................................................................................11-28
Table 11.7B Percentage Distribution of Overseas Contract Workers by Sex
and by Region: 2014-2017 …................................................................................11-28
Table 11.8A Establishments Resorting to Permanent Closure and
Workers Displaced by Industry in Central Visayas: 2010-2015 …..........................11-30
Table 11.8B Establishments Resorting to Reduction of Workforce/ Retrenchment
and Workers Displaced by Industry in Central Visayas: 2010-2015 ….................. 11-30
Table 11.9 Number and Membership of Existing Private Sector
Labor Unions/Organization in Central Visayas: 2000-2015 …............................... 11-31
Table 11.10 Strike/Lockout Notices Handled, Filed, Disposed, Rate of Disposition
and Workers Involved in Central Visayas: 2000-2015 ….......................................11-31
11-2

ContentsFIGURES:
Figure 11.1 Labor Force and Employment Status in Central VisayasOctober 2014-2017 …...........................................................................................11-7
Figure 11.2 Labor Force Participation Rate, Employment Rate
and Unemployment Rate in Central Visayas: October 2014-2017 …..................... 11-7
Figure 11.3 Distribution of Employed Persons by Major Industry Group and SexCentral Visayas: October 2017 …..........................................................................11-23
Figure 11.4 Distribution of Employed Persons by Major Occupation Group and Sex
Central Visayas: October 2017 …..........................................................................11-23
Figure 11.5 Distribution of Employed Persons by Highest Grade Completed and Sex Central Visayas: October 2017 …..........................................................................11-27
Figure 11.6 Number and Membership of Existing Private Sector
Labor Unions/Organizations in Central Visayas: 2000-2015 …...............................11-27
11-3

Table 11.1
LABOR FORCE AND EMPLOYMENT STATUS OF HOUSEHOLD POPULATION
15 YEARS AND OVER BY SEX
CENTRAL VISAYAS
2014-2017
(In Thousands)
JAN APR JUL OCT JAN APR JUL OCT ANNUAL
CENTRAL VISAYAS
Population 15 Years and Over 4,945 4,962 4,974 4,998 5,058 5,055 5,087 5,094 5,074
In the Labor Force 3,168 3,322 3,305 3,284 3,442 3,495 3,323 3,411 3,418
Employed 2,959 3,126 3,109 3,106 3,221 3,274 3,135 3,228 3,215
Unemployed 209 197 195 178 221 221 187 183 203
Not in the Labor Force 1,777 1,639 1,669 1,713 1,616 1,560 1,764 1,683 1,656
MALE
Population 15 Years and Over 2,438 2,441 2,452 2,459 2,504 2,492 2,508 2,514 2,507
In the Labor Force 1,831 1,870 1,890 1,875 1,972 1,975 1,901 1,947 1,948
Employed 1,690 1,741 1,769 1,761 1,823 1,833 1,771 1,832 1,816
Unemployed 141 127 119 116 147 143 127 115 133
Not in the Labor Force 610 569 564 584 530 518 609 567 556
FEMALE
Population 15 Years and Over 2,507 2,521 2,522 2,539 2,554 2,563 2,579 2,580 2,567
In the Labor Force 1,337 1,452 1,415 1,409 1,470 1,520 1,422 1,464 1,470
Employed 1,269 1,385 1,340 1,345 1,398 1,441 1,364 1,396 1,399
Unemployed 68 70 76 62 74 78 60 68 70
Not in the Labor Force 1,167 1,070 1,105 1,129 1,086 1,042 1,155 1,116 1,100
Source: Labor Force Survey, Philippine Statistics Authority
Table 11.1 - continued
LABOR FORCE AND EMPLOYMENT STATUS OF HOUSEHOLD POPULATION
15 YEARS AND OVER BY SEX
CENTRAL VISAYAS
2014-2017
(In Thousands)
JAN APR JUL OCT ANNUAL JAN APR JUL OCT ANNUAL
CENTRAL VISAYAS
Population 15 Years and Over 5,148 5,060 5,114 4,134 5,083 4,189 5,176 5,212 5,210 5,193
In the Labor Force 3,335 3,442 3,340 2,814 3,401 2,721 3,481 3,290 3,316 3,378
Employed 3,146 3,287 3,183 2,674 3,234 2,596 3,307 3,141 3,179 3,224
Unemployed 189 155 157 141 167 125 175 150 137 154
Not in the Labor Force 1,813 1,618 1,774 1,320 1,683 1,468 1,694 1,921 1,894 1,815
MALE
Population 15 Years and Over 2,543 2,515 2,547 2,055 2,531 2,081 2,572 2,610 2,587 2,588
In the Labor Force 1,918 2,000 1,991 1,610 1,983 1,618 2,039 1,930 1,931 1,987
Employed 1,781 1,899 1,891 1,524 1,869 1,526 1,935 1,833 1,837 1,884
Unemployed 138 102 101 86 111 92 104 96 95 103
Not in the Labor Force 622 515 555 445 550 464 533 680 656 601
FEMALE
Population 15 Years and Over 2,605 2,545 2,567 2,079 2,552 2,108 2,604 2,602 2,623 2,605
In the Labor Force 1,417 1,442 1,349 1,204 1,418 1,103 1,442 1,361 1,385 1,391
Employed 1,364 1,388 1,293 1,150 1,365 1,070 1,371 1,308 1,343 1,340
Unemployed 51 53 56 55 56 33 71 53 42 51
Not in the Labor Force 1,191 1,103 1,219 875 1,133 1,005 1,162 1,241 1,238 1,214
Source: Labor Force Survey, Philippine Statistics Authority
EMPLOYMENT STATUS
EMPLOYMENT STATUS2016 2017
20152014
11-4

Table 11.2
LABOR FORCE AND EMPLOYMENT STATUS OF HOUSEHOLD POPULATION
15 YEARS AND OVER, NUMBER AND RATE BY SEX
CENTRAL VISAYAS
2014-2017
(Number in Thousands; Rate in Percent)
Number Rate Number Rate Number Rate
CENTRAL VISAYAS
Population 15 Years and Over 4,945 4,962 4,974
In the Labor Force 3,168 64.1 3,322 66.9 3,305 66.4
Employed 2,959 93.4 3,126 94.1 3,109 94.1
Unemployed 209 6.6 197 5.9 195 5.9
Not in the Labor Force 1,777 35.9 1,639 33.0 1,669 33.6
MALE
Population 15 Years and Over 2,438 2,441 2,452
In the Labor Force 1,831 75.1 1,870 76.6 1,890 77.1
Employed 1,690 92.3 1,741 93.1 1,769 93.6
Unemployed 141 7.7 127 6.8 119 6.3
Not in the Labor Force 610 25.0 569 23.3 564 23.0
FEMALE
Population 15 Years and Over 2,507 2,521 2,522
In the Labor Force 1,337 53.3 1,452 57.6 1,415 56.1
Employed 1,269 95.0 1,385 95.4 1,340 94.7
Unemployed 68 5.1 70 4.8 76 5.4
Not in the Labor Force 1,167 46.6 1,070 42.5 1,105 43.8
Number Rate Number Rate Number Rate
CENTRAL VISAYAS
Population 15 Years and Over 5,058 5,055 5,087
In the Labor Force 3,442 68.1 3,495 69.1 3,323 65.3
Employed 3,221 93.6 3,274 93.7 3,135 94.3
Unemployed 221 6.4 221 6.3 187 5.6
Not in the Labor Force 1,616 31.9 1,560 30.9 1,764 34.7
MALE
Population 15 Years and Over 2,504 2,492 2,508
In the Labor Force 1,972 78.8 1,975 79.2 1,901 75.8
Employed 1,823 92.4 1,833 92.8 1,771 93.2
Unemployed 147 7.5 143 7.2 127 6.7
Not in the Labor Force 530 21.2 518 20.8 609 24.3
FEMALE
Population 15 Years and Over 2,554 2,563 2,579
In the Labor Force 1,470 57.5 1,520 59.3 1,422 55.1
Employed 1,398 95.1 1,441 94.8 1,364 95.9
Unemployed 74 5.0 78 5.1 60 4.2
Not in the Labor Force 1,086 42.5 1,042 40.7 1,155 44.8
Source: Labor Force Survey, Philippine Statistics Authority
JAN JULAPREMPLOYMENT STATUS
EMPLOYMENT STATUS
2014
2015
JULJAN APR
11-5

Table 11.2 - continued
LABOR FORCE AND EMPLOYMENT STATUS OF HOUSEHOLD POPULATION
15 YEARS AND OVER, NUMBER AND RATE BY SEX
CENTRAL VISAYAS
2014-2017
(Number in Thousands; Rate in Percent)
Number Rate Number Rate Number Rate Number Rate
CENTRAL VISAYAS
Population 15 Years and Over 5,148 5,060 5,114 4,134
In the Labor Force 3,335 64.8 3,442 68.0 3,340 65.3 2,814 68.1
Employed 3,146 94.3 3,287 95.5 3,183 95.3 2,674 95.0
Unemployed 189 5.7 155 4.5 157 4.7 141 5.0
Not in the Labor Force 1,813 35.2 1,618 32.0 1,774 34.7 1,320 31.9
MALE
Population 15 Years and Over 2,543 2,515 2,547 2,055
In the Labor Force 1,918 75.4 2,000 79.5 1,991 78.2 1,610 78.3
Employed 1,781 92.9 1,900 95.0 1,891 95.0 1,524 94.7
Unemployed 138 7.2 102 5.1 101 5.1 86 5.3
Not in the Labor Force 622 24.5 515 20.5 555 21.8 445 21.7
FEMALE
Population 15 Years and Over 2,605 2,545 2,567 2,079
In the Labor Force 1,417 54.4 1,442 56.7 1,349 52.6 1,204 57.9
Employed 1,365 96.3 1,387 96.2 1,292 95.8 1,150 95.5
Unemployed 51 3.6 53 3.7 56 4.2 55 4.6
Not in the Labor Force 1,191 45.7 1,103 43.3 1,219 47.5 875 42.1
Number Rate Number Rate Number Rate Number Rate
CENTRAL VISAYAS
Population 15 Years and Over 4,189 5,176 5,212 5,210
In the Labor Force 2,721 65.0 3,481 67.3 3,290 63.1 3,316 63.6
Employed 2,596 95.4 3,307 95.0 3,141 95.5 3,179 95.9
Unemployed 125 4.6 175 5.0 150 4.6 137 4.1
Not in the Labor Force 1,468 35.0 1,694 32.7 1,921 36.9 1,894 36.4
MALE
Population 15 Years and Over 2,081 2,572 2,610 2,587
In the Labor Force 1,618 77.7 2,039 79.3 1,930 73.9 1,931 74.7
Employed 1,526 94.3 1,935 94.9 1,833 95.0 1,837 95.1
Unemployed 92 5.7 104 5.1 96 5.0 95 4.9
Not in the Labor Force 464 22.3 533 20.7 680 26.1 656 25.3
FEMALE
Population 15 Years and Over 2,108 2,604 2,602 2,623
In the Labor Force 1,103 52.3 1,442 55.4 1,361 52.3 1,385 52.8
Employed 1,070 97.0 1,371 95.1 1,308 96.1 1,343 96.9
Unemployed 33 3.0 71 4.9 53 3.9 42 3.1
Not in the Labor Force 1,005 47.7 1,162 44.6 1,241 47.7 1,238 47.2
Source: Labor Force Survey, Philippine Statistics Authority
JAN
EMPLOYMENT STATUS
EMPLOYMENT STATUS APR
2016
JUL OCT
2017
JAN APR
JUL OCT
11-6

11-7

Table 11.3
EMPLOYED PERSONS BY CLASS OF WORKER AND SEX
CENTRAL VISAYAS
2014-2017
(In Thousands)
SEX / CLASS OF WORKER JAN APR JUL OCT
2014
BOTH SEXES
In the Labor Force 3,168 3,322 3,305 3,284
Total Employed 2,959 3,126 3,109 3,106
Wages and Salary Workers 1,651 1,757 1,797 1,736
Worked for Private Household 172 188 193 171
Worked for Private Establishment 1,231 1,335 1,374 1,317
Worked for Government/Government Corporation 243 225 221 242
Worked with Pay on Own Family-Operated Farm or
Business 6 9 12 9
Self-Employed without any Paid Employee 911 938 948 947
Employer in Own Family-Operated Farm or Business 41 38 50 22
Worked Without Pay on Family-Operated Farm or
Business 358 394 314 401
MALE
In the Labor Force 1,831 1,870 1,890 1,875
Total Employed 1,688 1,742 1,771 1,761
Wages and Salary Workers 977 1,024 1,073 1,032
Worked for Private Household 35 33 30 37
Worked for Private Establishment 842 890 933 881
Worked for Government/Government Corporation 98 98 104 109
Worked with Pay on Own Family-Operated Farm or
Business 2 3 5 5
Self-Employed without any Paid Employee 542 535 549 560
Employer in Own Family-Operated Farm or Business 25 24 32 14
Worked Without Pay on Family-Operated Farm or
Business 143 159 117 153
FEMALE
In the Labor Force 1,337 1,452 1,415 1,409
Total Employed 1,271 1,383 1,339 1,345
Wages and Salary Workers 675 733 726 703
Worked for Private Household 136 156 162 135
Worked for Private Establishment 389 444 441 434
Worked for Government/Government Corporation 145 129 116 133
Worked with Pay on Own Family-Operated Farm or
Business 4 6 7 1
Self-Employed without any Paid Employee 369 402 400 387
Employer in Own Family-Operated Farm or Business 14 12 17 8
Worked Without Pay on Family-Operated Farm or
Business 214 234 197 245
Source: Labor Force Survey, Philippine Statistics Authority
11-8

Table 11.3 - continued
EMPLOYED PERSONS BY CLASS OF WORKER AND SEX
CENTRAL VISAYAS
2014-2017
(In Thousands)
SEX / CLASS OF WORKER JAN APR JUL OCT
2015
BOTH SEXES
In the Labor Force 3,442 3,495 3,323 3,411
Total Employed 3,221 3,274 3,135 3,228
Wages and Salary Workers 1,810 1,833 1,887 1,815
Worked for Private Household 177 196 204 175
Worked for Private Establishment 1,379 1,375 1,433 1,382
Worked for Government/Government Corporation 242 255 241 249
Worked with Pay on Own Family-Operated Farm or
Business 13 7 9 9
Self-Employed without any Paid Employee 973 1,015 912 1,017
Employer in Own Family-Operated Farm or Business 35 26 38 40
Worked Without Pay on Family-Operated Farm or
Business 406 399 301 356
MALE
In the Labor Force 1,972 1,975 1,901 1,947
Total Employed 1,824 1,833 1,773 1,832
Wages and Salary Workers 1,056 1,085 1,122 1,084
Worked for Private Household 26 29 37 30
Worked for Private Establishment 928 938 965 941
Worked for Government/Government Corporation 95 115 113 107
Worked with Pay on Own Family-Operated Farm or
Business 9 2 7 5
Self-Employed without any Paid Employee 573 557 521 582
Employer in Own Family-Operated Farm or Business 24 16 23 28
Worked Without Pay on Family-Operated Farm or
Business 171 176 106 139
FEMALE
In the Labor Force 1,470 1,520 1,422 1,464
Total Employed 1,396 1,441 1,362 1,396
Wages and Salary Workers 752 749 764 731
Worked for Private Household 152 166 166 144
Worked for Private Establishment 451 438 467 441
Worked for Government/Government Corporation 147 140 128 142
Worked with Pay on Own Family-Operated Farm or
Business 3 6 3 4
Self-Employed without any Paid Employee 399 460 391 435
Employer in Own Family-Operated Farm or Business 11 10 14 12
Worked Without Pay on Family-Operated Farm or
Business 233 223 193 217
Source: Labor Force Survey, Philippine Statistics Authority
11-9

Table 11.3 - continued
EMPLOYED PERSONS BY CLASS OF WORKER AND SEX
CENTRAL VISAYAS
2014-2017
(In Thousands)
SEX / CLASS OF WORKER JAN APR JUL OCT
2016
BOTH SEXES
In the Labor Force 3,335 3,442 3,340 2,814
Total Employed 3,146 3,287 3,183 2,674
Wages and Salary Workers 1,900 1,959 1,788 1,534
Worked for Private Household 214 181 180 155
Worked for Private Establishment 1,438 1,525 1,386 1,214
Worked for Government/Government Corporation 242 240 219 163
Worked with Pay on Own Family-Operated Farm or
Business 9 13 3 1
Self-Employed without any Paid Employee 938 963 1,056 828
Employer in Own Family-Operated Farm or Business 41 36 31 37
Worked Without Pay on Family-Operated Farm or
Business 267 325 308 276
MALE
In the Labor Force 1,918 2,000 1,991 1,610
Total Employed 1,781 1,899 1,891 1,523
Wages and Salary Workers 1,124 1,225 1,146 927
Worked for Private Household 32 30 26 23
Worked for Private Establishment 987 1,082 1,024 829
Worked for Government/Government Corporation 102 106 93 73
Worked with Pay on Own Family-Operated Farm or
Business 5 4 3 1
Self-Employed without any Paid Employee 536 518 594 474
Employer in Own Family-Operated Farm or Business 25 25 25 30
Worked Without Pay on Family-Operated Farm or
Business 94 131 126 93
FEMALE
In the Labor Force 1,417 1,442 1,349 1,204
Total Employed 1,364 1,388 1,293 1,150
Wages and Salary Workers 773 736 642 606
Worked for Private Household 181 151 155 132
Worked for Private Establishment 449 444 362 384
Worked for Government/Government Corporation 140 132 125 90
Worked with Pay on Own Family-Operated Farm or
Business 4 8 - 0
Self-Employed without any Paid Employee 402 447 463 354
Employer in Own Family-Operated Farm or Business 15 12 6 7
Worked Without Pay on Family-Operated Farm or
Business 173 193 182 183
Source: Labor Force Survey, Philippine Statistics Authority
11-10

Table 11.3 - continued
EMPLOYED PERSONS BY CLASS OF WORKER AND SEX
CENTRAL VISAYAS
2014-2017
(In Thousands)
SEX / CLASS OF WORKER JAN APR JUL OCT
2017
BOTH SEXES
In the Labor Force 2,721 3,481 3,290 3,316
Total Employed 2,596 3,307 3,141 3,179
Wages and Salary Workers 1,515 1,981 2,010 1,979
Worked for Private Household 140 190 194 187
Worked for Private Establishment 1,181 1,575 1,581 1,529
Worked for Government/Government Corporation 187 216 228 252
Worked with Pay on Own Family-Operated Farm or
Business 7 2 7 11
Self-Employed without any Paid Employee 821 1,001 952 946
Employer in Own Family-Operated Farm or Business 42 65 48 79
Worked Without Pay on Family-Operated Farm or
Business 218 260 131 175
MALE
In the Labor Force 1,618 2,039 1,930 1,931
Total Employed 1,526 1,935 1,833 1,837
Wages and Salary Workers 928 1,200 1,239 1,217
Worked for Private Household 23 22 32 37
Worked for Private Establishment 837 1,086 1,104 1,073
Worked for Government/Government Corporation 64 91 98 101
Worked with Pay on Own Family-Operated Farm or
Business 4 1 5 7
Self-Employed without any Paid Employee 492 584 525 513
Employer in Own Family-Operated Farm or Business 30 47 27 51
Worked Without Pay on Family-Operated Farm or
Business 76 104 42 55
FEMALE
In the Labor Force 1,103 1,442 1,361 1,385
Total Employed 1,070 1,371 1,308 1,343
Wages and Salary Workers 587 782 771 762
Worked for Private Household 117 167 161 150
Worked for Private Establishment 344 489 477 457
Worked for Government/Government Corporation 123 124 130 151
Worked with Pay on Own Family-Operated Farm or
Business 3 1 3 4
Self-Employed without any Paid Employee 330 417 427 433
Employer in Own Family-Operated Farm or Business 12 17 20 28
Worked Without Pay on Family-Operated Farm or
Business 141 156 90 120
Source: Labor Force Survey, Philippine Statistics Authority
11-11

Table 11.4
EMPLOYED PERSONS BY SEX AND MAJOR INDUSTRY GROUP
CENTRAL VISAYAS
2014-2017
(In Thousands)
JAN APR JUL OCT
BOTH SEXES 2,959 3,126 3,109 3,106
Agriculture
Agriculture, Hunting and Forestry 781 838 790 795
Fishing 104 94 87 112
Industry
Mining and Quarrying 15 16 9 9
Manufacturing 311 350 320 329
Electricity, Gas, Steam, and Air Conditioning Supply 6 6 6 6
Water Supply; Sewage, Waste Management and Remediation
Activities 3 3 3 6
Construction 228 241 258 252
Services
Wholesale and Retail Trade; Repair of Motor Vehicles,
Motorcycles and Personal and Household Goods 491 560 553 578
Transportation, Storage 186 153 174 183
Accommodation and Food service Activities 101 128 134 137
Information and Communication 30 31 40 19
Financial and Insurance Activities 38 28 37 31
Real Estate Activities 9 9 9 3
Professional, Scientific and technical Activities 12 13 19 12
Administrative and Support Service Activities 101 106 124 102
Public Administration and Defense; Compulsory Social Security 148 141 149 158
Education 112 106 93 102
Health and Social Work Activities 36 34 28 37
Arts, entertainment and recreation 18 25 22 19
Other service activities 53 184 193 180
Activities of households as employees; undifferentiated goods and
services-producing activities of households for own use - 56 56 34
Activities of extraterritorial organizations and bodies 781 - - -
MALE 1,688 1,742 1,771 1,761
Agriculture
Agriculture, Hunting and Forestry 491 507 499 475
Fishing 89 85 80 100
Industry
Mining and Quarrying 14 14 9 7
Manufacturing 169 190 179 166
Electricity, Gas, Steam, and Air Conditioning Supply 5 5 5 5
Water Supply; Sewage, Waste Management and Remediation
Activities 2 2 4 4
Construction 219 240 255 248
Services
Wholesale and Retail Trade; Repair of Motor Vehicles,
Motorcycles and Personal and Household Goods 176 195 197 218
Transportation, Storage 179 150 165 176
Accommodation and Food service Activities 54 57 67 60
Information and Communication 17 17 23 9
Source: Labor Force Survey, Philippine Statistics Authority
SEX / MAJOR INDUSTRY GROUP 2014
11-12

Table 11.4 - continued
EMPLOYED PERSONS BY SEX AND MAJOR INDUSTRY GROUP
CENTRAL VISAYAS
2014-2017
(In Thousands)
JAN APR JUL OCT
BOTH SEXES 3,221 3,274 3,135 3,228
Agriculture
Agriculture, Hunting and Forestry 821 805 709 823
Fishing 97 108 100 126
Industry
Mining and Quarrying 19 13 16 13
Manufacturing 325 340 342 339
Electricity, Gas, Steam, and Air Conditioning Supply 10 7 6 6
Water Supply; Sewage, Waste Management and Remediation
Activities 3 3 3 6
Construction 248 262 251 245
Services
Wholesale and Retail Trade; Repair of Motor Vehicles,
Motorcycles and Personal and Household Goods 596 612 583 610
Transportation, Storage 184 193 198 187
Accommodation and Food service Activities 142 144 157 129
Information and Communication 35 39 25 32
Financial and Insurance Activities 39 36 28 32
Real Estate Activities 6 13 13 6
Professional, Scientific and technical Activities 13 13 13 10
Administrative and Support Service Activities 119 111 122 113
Public Administration and Defense; Compulsory Social Security 151 160 166 168
Education 113 111 100 103
Health and Social Work Activities 35 36 34 32
Arts, entertainment and recreation 23 16 16 19
Other service activities 187 196 - -
Activities of households as employees; undifferentiated goods and
services-producing activities of households for own use 55 49 257 226
Activities of extraterritorial organizations and bodies - - - -
MALE 1,824 1,833 1,773 1,832
Agriculture
Agriculture, Hunting and Forestry 525 493 443 498
Fishing 91 95 90 112
Industry
Mining and Quarrying 16 11 12 11
Manufacturing 173 191 179 189
Electricity, Gas, Steam, and Air Conditioning Supply 7 4 4 7
Water Supply; Sewage, Waste Management and Remediation
Activities 2 2 2 5
Construction 241 257 248 236
Services
Wholesale and Retail Trade; Repair of Motor Vehicles,
Motorcycles and Personal and Household Goods 223 200 220 231
Transportation, Storage 175 191 190 180
Accommodation and Food service Activities 73 64 73 55
Information and Communication 20 20 14 18
Source: Labor Force Survey, Philippine Statistics Authority
2015SEX / MAJOR INDUSTRY GROUP
11-13

Table 11.4 - continued
EMPLOYED PERSONS BY SEX AND MAJOR INDUSTRY GROUP
CENTRAL VISAYAS
2014-2017
(In Thousands)
JAN APR JUL OCT
BOTH SEXES 3,146 3,287 3,183 2,674
Agriculture
Agriculture, Hunting and Forestry 698 838 824 565
Fishing 104 108 153 117
Industry
Mining and Quarrying 9 20 13 14
Manufacturing 327 319 261 267
Electricity, Gas, Steam, and Air Conditioning Supply 3 7 12 4
Water Supply; Sewage, Waste Management and Remediation
Activities 3 3 4 2
Construction 267 309 337 274
Services
Wholesale and Retail Trade; Repair of Motor Vehicles,
Motorcycles and Personal and Household Goods 604 634 529 591
Transportation, Storage 208 184 224 144
Accommodation and Food service Activities 138 128 130 90
Information and Communication 31 33 20 14
Financial and Insurance Activities 22 30 35 24
Real Estate Activities 9 7 6 10
Professional, Scientific and technical Activities 16 10 15 16
Administrative and Support Service Activities 113 118 115 129
Public Administration and Defense; Compulsory Social Security 164 161 151 112
Education 104 82 97 61
Health and Social Work Activities 28 36 28 21
Arts, entertainment and recreation 22 23 8 23
Other service activities 271 230 222 194
Activities of households as employees; undifferentiated goods and
services-producing activities of households for own use - - - -
Activities of extraterritorial organizations and bodies - - - -
MALE 1,781 1,899 1,891 1,523
Agriculture
Agriculture, Hunting and Forestry 449 505 508 321
Fishing 89 95 142 104
Industry
Mining and Quarrying 9 15 10 12
Manufacturing 176 177 147 150
Electricity, Gas, Steam, and Air Conditioning Supply 4 4 12 4
Water Supply; Sewage, Waste Management and Remediation
Activities 4 2 3 2
Construction 265 308 331 273
Services
Wholesale and Retail Trade; Repair of Motor Vehicles,
Motorcycles and Personal and Household Goods 224 243 180 239
Transportation, Storage 199 177 216 138
Accommodation and Food service Activities 68 63 60 39
Information and Communication 16 21 14 10
Source: Labor Force Survey, Philippine Statistics Authority
2016SEX / MAJOR INDUSTRY GROUP
11-14

Table 11.4 - continued
EMPLOYED PERSONS BY SEX AND MAJOR INDUSTRY GROUP
CENTRAL VISAYAS
2014-2017
(In Thousands)
JAN APR JUL OCT
Financial and Insurance Activities 12 12 12 19
Real Estate Activities 5 5 5 2
Professional, Scientific and technical Activities 5 7 7 5
Administrative and Support Service Activities 64 66 78 72
Public Administration and Defense; Compulsory Social Security 83 77 83 85
Education 25 23 21 28
Health and Social Work Activities 7 14 5 9
Arts, entertainment and recreation 14 16 14 16
Other service activities 51 54 58 53
Activities of households as employees; undifferentiated goods and
services-producing activities of households for own use 7 5 4 4
Activities of extraterritorial organizations and bodies - - - -
FEMALE 1,271 1,383 1,339 1,345
Agriculture
Agriculture, Hunting and Forestry 290 329 292 317
Fishing 14 8 7 9
Industry
Mining and Quarrying - 1 1 1
Manufacturing 140 162 142 163
Electricity, Gas, Steam, and Air Conditioning Supply 1 - - 1
Water Supply; Sewage, Waste Management and Remediation
Activities - - 1 3
Construction 6 1 4 4
Services
Wholesale and Retail Trade; Repair of Motor Vehicles,
Motorcycles and Personal and Household Goods 315 362 359 360
Transportation, Storage 8 3 11 7
Accommodation and Food service Activities 48 72 66 78
Information and Communication 13 12 16 8
Financial and Insurance Activities 25 17 24 12
Real Estate Activities 4 4 5 3
Professional, Scientific and technical Activities 8 6 11 7
Administrative and Support Service Activities 38 41 46 32
Public Administration and Defense; Compulsory Social Security 67 62 67 75
Education 88 86 72 73
Health and Social Work Activities 27 21 21 30
Arts, entertainment and recreation 5 10 8 4
Other service activities 127 130 135 128
Activities of households as employees; undifferentiated goods and
services-producing activities of households for own use 46 51 52 31
Activities of extraterritorial organizations and bodies - - - -
SEX / MAJOR INDUSTRY GROUP 2014
11-15

Table 11.4 - continued
EMPLOYED PERSONS BY SEX AND MAJOR INDUSTRY GROUP
CENTRAL VISAYAS
2014-2017
(In Thousands)
JAN APR JUL OCT
Financial and Insurance Activities 16 16 11 16
Real Estate Activities 4 4 7 2
Professional, Scientific and technical Activities 9 7 9 5
Administrative and Support Service Activities 69 73 67 68
Public Administration and Defense; Compulsory Social Security 75 92 98 88
Education 26 27 23 27
Health and Social Work Activities 9 13 7 9
Arts, entertainment and recreation 16 13 12 15
Other service activities 51 53 - -
Activities of households as employees; undifferentiated goods and
services-producing activities of households for own use 5 4 64 59
Activities of extraterritorial organizations and bodies - - - -
FEMALE 1,396 1,441 1,362 1,396
Agriculture
Agriculture, Hunting and Forestry 297 311 264 325
Fishing 6 13 11 13
Industry
Mining and Quarrying 1 1 4 1
Manufacturing 152 151 161 151
Electricity, Gas, Steam, and Air Conditioning Supply 1 1 1 1
Water Supply; Sewage, Waste Management and Remediation
Activities 1 3 1 -
Construction 7 4 3 8
Services
Wholesale and Retail Trade; Repair of Motor Vehicles,
Motorcycles and Personal and Household Goods 374 412 365 380
Transportation, Storage 8 3 7 7
Accommodation and Food service Activities 70 81 83 75
Information and Communication 15 19 11 13
Financial and Insurance Activities 22 19 16 15
Real Estate Activities 3 7 4 4
Professional, Scientific and technical Activities 4 6 4 6
Administrative and Support Service Activities 49 37 54 45
Public Administration and Defense; Compulsory Social Security 77 71 71 80
Education 87 84 79 75
Health and Social Work Activities 28 24 26 24
Arts, entertainment and recreation 7 4 3 6
Other service activities 137 143 - -
Activities of households as employees; undifferentiated goods and
services-producing activities of households for own use 47 48 193 168
Activities of extraterritorial organizations and bodies - - - -
2015SEX / MAJOR INDUSTRY GROUP
11-16

Table 11.4 - continued
EMPLOYED PERSONS BY SEX AND MAJOR INDUSTRY GROUP
CENTRAL VISAYAS
2014-2017
(In Thousands)
JAN APR JUL OCT
Financial and Insurance Activities 7 15 18 10
Real Estate Activities 7 4 2 4
Professional, Scientific and technical Activities 5 6 10 7
Administrative and Support Service Activities 68 84 76 74
Public Administration and Defense; Compulsory Social Security 84 87 85 56
Education 23 21 14 22
Health and Social Work Activities 9 11 7 4
Arts, entertainment and recreation 20 13 5 14
Other service activities 57 51 51 40
Activities of households as employees; undifferentiated goods and
services-producing activities of households for own use - - - -
Activities of extraterritorial organizations and bodies - - - -
FEMALE 1,364 1,388 1,362 1,150
Agriculture
Agriculture, Hunting and Forestry 251 330 333 243
Fishing 15 14 11 13
Industry
Mining and Quarrying 1 3 3 2
Manufacturing 150 143 120 117
Electricity, Gas, Steam, and Air Conditioning Supply - 1 - 0
Water Supply; Sewage, Waste Management and Remediation
Activities 1 3 1 0
Construction 3 1 6 1
Services
Wholesale and Retail Trade; Repair of Motor Vehicles,
Motorcycles and Personal and Household Goods 379 393 368 352
Transportation, Storage 8 7 9 6
Accommodation and Food service Activities 72 67 74 50
Information and Communication 15 12 6 5
Financial and Insurance Activities 16 15 18 14
Real Estate Activities 4 3 4 6
Professional, Scientific and technical Activities 8 4 5 9
Administrative and Support Service Activities 44 33 41 55
Public Administration and Defense; Compulsory Social Security 80 75 70 56
Education 80 62 88 39
Health and Social Work Activities 20 26 22 18
Arts, entertainment and recreation 3 11 3 9
Other service activities 211 180 180 155
Activities of households as employees; undifferentiated goods and
services-producing activities of households for own use - - - -
Activities of extraterritorial organizations and bodies - - - -
2016SEX / MAJOR INDUSTRY GROUP
11-17

Table 11.4 - continued
EMPLOYED PERSONS BY SEX AND MAJOR INDUSTRY GROUP
CETNTRAL VISAYAS: 2014-2017
(In thousands)
Jan Apr Jul Oct
TOTAL 2,596 3,307 3,141 3,179
Agriculture
Agriculture, Hunting and Forestry 509 845 639 671
Fishing 165 146 150 103
Industry
Mining and Quarrying 10 14 12 10
Manufacturing 250 311 332 293
Electricity, Gas, Steam, and Air Conditioning Supply 9 9 7 5
Water Supply; Sewage, Waste Management and Remediation
Activities 13 4 6 6
Construction 268 319 338 331
Services
Wholesale and Retail Trade; Repair of Motor Vehicles, Motorcycles
and Personal and Household Goods 498 562 571 560
Transportation and storage 182 249 223 265
Accommodation and food service activities 92 134 110 149
Information and communication 19 25 30 32
Financial and insurance activities 23 33 33 35
Real estate activities 9 4 6 8
Professional, scientific and technical activities 10 6 14 14
Administrative and support service activities 119 125 134 136
Public administration and defense; compulsory social security 112 145 166 203
Education 88 91 89 69
Human health and social work activities 22 29 27 30
Arts, entertainment and recreation 14 24 12 21
Other service activities including Activities of households as
employers; undifferentiated goods and services-producing activities
of households for own use 183 231 241 237
Activities of extraterritorial organizations and bodies - - - -
MALE 1,526 1,935 1,833 1,837
Agriculture
Agriculture, Hunting and Forestry 325 542 404 394
Fishing 136 128 138 94
Industry
Mining and Quarrying 10 12 12 9
Manufacturing 133 153 180 146
Electricity, Gas, Steam, and Air Conditioning Supply 9 9 3 5
Water Supply; Sewage, Waste Management and Remediation
Activities 10 4 6 6
Construction 267 314 330 327
Services
Wholesale and Retail Trade; Repair of Motor Vehicles, Motorcycles
and Personal and Household Goods 186 195 195 203
Transportation and storage 180 241 214 259
Accommodation and food service activities 45 70 51 74
Information and communication 12 15 13 15
Sex/ Major Industry Group2017
11-18

Financial and insurance activities 10 15 14 15
Real estate activities 5 2 3 1
Professional, scientific and technical activities 4 5 7 7
Administrative and support service activities 75 76 82 85
Public administration and defense; compulsory social security 51 71 86 91
Education 17 26 24 16
Human health and social work activities 5 7 9 13
Arts, entertainment and recreation 11 11 7 18
Other service activities including Activities of households as
employers; undifferentiated goods and services-producing activities
of households for own use 37 38 54 60
Activities of extraterritorial organizations and bodies - - - -
FEMALE 1,070 1,371 1,308 1,343
Agriculture
Agriculture, Hunting and Forestry 184 304 235 277
Fishing 28 17 12 9
Industry
Mining and Quarrying - 3 0 2
Manufacturing 117 158 152 148
Electricity, Gas, Steam, and Air Conditioning Supply - - 5 -
Water Supply; Sewage, Waste Management and Remediation
Activities 3 - - 0
Construction 2 5 8 4
Services
Wholesale and Retail Trade; Repair of Motor Vehicles, Motorcycles
and Personal and Household Goods 313 367 376 357
Transportation and storage 2 8 9 6
Accommodation and food service activities 47 64 59 75
Information and communication 8 10 17 17
Financial and insurance activities 13 18 19 21
Real estate activities 4 3 3 7
Professional, scientific and technical activities 6 1 7 7
Administrative and support service activities 44 48 52 51
Public administration and defense; compulsory social security 61 73 81 112
Education 71 65 64 53
Human health and social work activities 17 21 17 17
Arts, entertainment and recreation 3 13 5 2
Other service activities including Activities of households as
employers; undifferentiated goods and services-producing activities
of households for own use 146 193 187 177
Activities of extraterritorial organizations and bodies - - - -
Source: Labor Force Survey, Philippine Statistics Authority
11-19

Male
Agri
Industry
Services
0% 20% 40% 60% 80% 100%
Managers
Professionals
Technicians and associate professionals
Clerical support workers
Service and sales workers
Skilled agricultural, forestry and fishery workers
Craft and related trade workers
Plant and machine operators and assemblers
Elementary occupations
Armed forces occupations, nongainful activities and specialoccupations
Figure 11.4: Distribution of Employed Persons by Major Occupation Group and Sex in Central Visayas: October 2017
Male Female
Figure 11.3: Distribution of Employed Persons by Major Industry Group and SexCentral Visayas: October 2017
Male Female
Agriculture26.59 %
Industry26.79 %
Services46.61 %
Services67.18 %
Agriculture21.31 %
Industry11.47 %
11-20

Table 11.5
EMPLOYED PERSONS BY SEX AND MAJOR OCCUPATION GROUP
CENTRAL VISAYAS
2014-2017
(In Thousands)
January April July October
BOTH SEXES 2,959 3,126 3,109 3,106
Officials of Government and Special Interest Organizations,
Corporate Executives, Managers, Managing Proprietors, and
Supervisors 408 416 435 388
Professionals 130 153 140 143
Technicians and Associate Professionals 80 84 81 71
Clerks 195 194 221 214
Service Workers and Shop and Market Sales Workers 376 425 410 444
Farmers, Forestry Workers, and Fishermen 485 500 497 494
Traders and Related Workers 290 319 317 323
Plant and Machine Operators and Assemblers 148 128 162 177
Laborers and Unskilled Workers 840 907 843 854
Special Occupations 3 3 3 -
MALE 1,688 1,742 1,771 1,761
Officials of Government and Special Interest Organizations,
Corporate Executives, Managers, Managing Proprietors, and
Supervisors 214 214 218 201
Professionals 34 49 44 46
Technicians and Associate Professionals 34 40 37 33
Clerks 64 71 81 88
Service Workers and Shop and Market Sales Workers 179 192 200 201
Farmers, Forestry Workers, and Fishermen 360 352 367 359
Traders and Related Workers 243 260 273 261
Plant and Machine Operators and Assemblers 116 101 131 134
Laborers and Unskilled Workers 441 463 420 438
Special Occupations 3 2 2 -
FEMALE 1,271 1,383 1,339 1,345
Officials of Government and Special Interest Organizations,
Corporate Executives, Managers, Managing Proprietors, and
Supervisors 194 202 217 188
Professionals 98 105 95 97
Technicians and Associate Professionals 46 44 46 38
Clerks 132 122 139 124
Service Workers and Shop and Market Sales Workers 196 232 212 245
Farmers, Forestry Workers, and Fishermen 126 149 131 133
Traders and Related Workers 47 58 44 62
Plant and Machine Operators and Assemblers 32 28 31 42
Laborers and Unskilled Workers 400 443 423 414
Special Occupations - - 1 -
Note: * less than 500
1/ Exludes Negros Oriental
Source: Labor Force Survey, Philippine Statistics Authority
SEX / MAJOR OCCUPATION GROUP
2014
11-21

Table 11.5 - continued
EMPLOYED PERSONS BY SEX AND MAJOR OCCUPATION GROUP
CENTRAL VISAYAS
2014-2017
(In Thousands)
January April July October
BOTH SEXES 3,221 3,274 3,135 3,228
Officials of Government and Special Interest Organizations,
Corporate Executives, Managers, Managing Proprietors, and
Supervisors 432 452 455 426
Professionals 139 167 138 155
Technicians and Associate Professionals 87 82 91 81
Clerks 229 229 229 229
Service Workers and Shop and Market Sales Workers 461 435 417 436
Farmers, Forestry Workers, and Fishermen 502 507 414 562
Traders and Related Workers 325 334 301 310
Plant and Machine Operators and Assemblers 158 154 179 165
Laborers and Unskilled Workers 886 913 906 865
Special Occupations 3 3 3 3
MALE 1,824 1,833 1,773 1,832
Officials of Government and Special Interest Organizations,
Corporate Executives, Managers, Managing Proprietors, and
Supervisors 213 236 241 218
Professionals 40 53 43 44
Technicians and Associate Professionals 40 42 48 40
Clerks 82 90 80 86
Service Workers and Shop and Market Sales Workers 206 185 195 213
Farmers, Forestry Workers, and Fishermen 372 345 303 396
Traders and Related Workers 274 279 254 247
Plant and Machine Operators and Assemblers 120 121 142 137
Laborers and Unskilled Workers 474 480 465 451
Special Occupations 2 2 4 2
FEMALE 1,396 1,441 1,362 1,396
Officials of Government and Special Interest Organizations,
Corporate Executives, Managers, Managing Proprietors, and
Supervisors 216 216 214 208
Professionals 99 112 94 110
Technicians and Associate Professionals 46 39 44 40
Clerks 147 140 150 142
Service Workers and Shop and Market Sales Workers 254 249 223 225
Farmers, Forestry Workers, and Fishermen 131 163 110 165
Traders and Related Workers 52 56 46 61
Plant and Machine Operators and Assemblers 39 33 38 28
Laborers and Unskilled Workers 410 431 443 416
Special Occupations - - - 1
Note: * less than 500
1/ Exludes Negros Oriental
Source: Labor Force Survey, Philippine Statistics Authority
SEX / MAJOR OCCUPATION GROUP
2015
11-22

Table 11.5 - continued
EMPLOYED PERSONS BY SEX AND MAJOR OCCUPATION GROUP
CENTRAL VISAYAS
2014-2017
(In Thousands)
January April July October1/
BOTH SEXES 3,146 3,287 3,183 2,674
Officials of Government and Special Interest Organizations,
Corporate Executives, Managers, Managing Proprietors, and
Supervisors 457 449 455 370
Professionals 135 130 132 105
Technicians and Associate Professionals 96 90 68 73
Clerks 221 166 145 168
Service Workers and Shop and Market Sales Workers 418 521 516 503
Farmers, Forestry Workers, and Fishermen 448 513 587 423
Traders and Related Workers 293 356 355 298
Plant and Machine Operators and Assemblers 184 175 161 135
Laborers and Unskilled Workers 891 882 761 598
Special Occupations 2 4 3 2
MALE 1,781 1,899 1,494 1,524
Officials of Government and Special Interest Organizations,
Corporate Executives, Managers, Managing Proprietors, and
Supervisors 242 212 201 185
Professionals 39 46 34 39
Technicians and Associate Professionals 43 40 37 34
Clerks 77 80 66 68
Service Workers and Shop and Market Sales Workers 186 248 233 230
Farmers, Forestry Workers, and Fishermen 317 332 410 309
Traders and Related Workers 247 296 301 256
Plant and Machine Operators and Assemblers 147 136 135 105
Laborers and Unskilled Workers 481 505 472 297
Special Occupations 2 3 3 2
FEMALE 1,364 1,388 1,014 1,150
Officials of Government and Special Interest Organizations,
Corporate Executives, Managers, Managing Proprietors, and
Supervisors 215 237 254 185
Professionals 96 84 98 66
Technicians and Associate Professionals 53 50 31 38
Clerks 144 86 80 100
Service Workers and Shop and Market Sales Workers 232 273 283 273
Farmers, Forestry Workers, and Fishermen 130 181 177 114
Traders and Related Workers 46 59 55 42
Plant and Machine Operators and Assemblers 37 39 26 30
Laborers and Unskilled Workers 410 377 289 301
Special Occupations - 1 * *
Note: * less than 500
1/ Exludes Negros Oriental
Source: Labor Force Survey, Philippine Statistics Authority
SEX / MAJOR OCCUPATION GROUP
2016
11-23

Table 11.5
EMPLOYED PERSONS BY SEX AND MAJOR OCCUPATION GROUP
CENTRAL VISAYAS
2007-2017
(In Thousands)
January April July October
BOTH SEXES 2,596 3,307 3,141 3,179
Managers 374 523 370 382
Professionals 131 128 154 143
Technicians and associate professionals 77 91 90 86
Clerical support workers 120 181 190 180
Service and sales workers 458 494 486 575
Skilled agricultural, forestry and fishery workers 443 487 512 517
Craft and related trade workers 288 318 349 366
Plant and machine operators and assemblers 143 230 226 224
Elementary occupations 561 851 761 702
Armed forces occupations, nongainful activities
and special occupations - 1 3 4
MALE 1,526 1,935 1,833 1,837
Managers 178 264 143 172
Professionals 37 42 52 38
Technicians and associate professionals 33 53 49 45
Clerical support workers 43 62 78 66
Service and sales workers 206 220 192 256
Skilled agricultural, forestry and fishery workers 339 340 353 339
Craft and related trade workers 244 274 296 315
Plant and machine operators and assemblers 111 162 178 195
Elementary occupations 334 518 489 407
Armed forces occupations, nongainful activities
and special occupations - 1 3 4
FEMALE 1,070 1,371 1,308 1,343
Managers 196 260 227 210
Professionals 95 86 101 105
Technicians and associate professionals 44 39 42 41
Clerical support workers 77 119 112 114
Service and sales workers 251 274 293 319
Skilled agricultural, forestry and fishery workers 104 147 158 178
Craft and related trade workers 44 44 53 51
Plant and machine operators and assemblers 33 68 48 30
Elementary occupations 227 334 273 295
Armed forces occupations, nongainful activities
and special occupations - - 0 0
Source: Labor Force Survey, Philippine Statistics Authority
2017
SEX / MAJOR OCCUPATION GROUP
11-24

Table 11.6
EMPLOYED PERSONS BY HIGHEST GRADE COMPLETED AND BY SEX
CENTRAL VISAYAS
2014-2017
(In Thousands)
2016
3,106 3,228 3,234
36 46 38
Undergraduate 639 663 692
Graduate 487 472 452
Undergraduate 390 396 457
Graduate 736 778 791
Undergraduate 15 14 7
Graduate 68 79 74
Undergraduate 267 278 285
Graduate 469 503 438
1,761 1,834 1,870
18 29 25
Undergraduate 419 435 447
Graduate 281 277 258
High School
Undergraduate 241 255 295
Graduate 403 415 449
Post Secondary
Undergraduate 8 7 4
Graduate 29 40 34
College
Undergraduate 151 157 160
Graduate 211 219 197
1,345 1,394 1,363
18 17 13
Undergraduate 220 228 245
Graduate 206 195 194
Undergraduate 149 141 161
Graduate 333 363 342
Undergraduate 7 7 2
Graduate 39 39 41
Undergraduate 116 121 125
Graduate 258 284 240
Source: Labor Force Survey , Philippine Statistics Authority
Post Secondary
College
No Grade Completed
Elementary
FEMALE
No Grade Completed
Elementary
High School
MALE
2014
No Grade Completed
Elementary
High School
Post Secondary
College
2015
BOTH SEXES
HIGHEST GRADE COMPLETED
11-25

Table 11.6 - continued
EMPLOYED PERSONS BY HIGHEST GRADE COMPLETED AND BY SEX
CENTRAL VISAYAS
2014-2017
(In Thousands)
2017
3,224
45
Undergraduate 754
Graduate 405
Undergraduate 446
Graduate 772
Undergraduate 7
Graduate 0
Undergraduate 8
Graduate 73
Undergraduate 296
Graduate* 418
1,884
25
Undergraduate 505
Graduate 248
Undergraduate 292
Graduate 439
Undergraduate 3
Graduate 0
Undergraduate 4
Graduate 34
Undergraduate 159
Graduate* 174
1,340
20
Undergraduate 249
Graduate 158
Undergraduate 154
Graduate 333
Undergraduate 4
Graduate 0
Undergraduate 3
Graduate 39
Undergraduate 137
Graduate* 243
Notes: The use of the average estimates of the four-quarter rounds
of the LFS data was based on PSA Board Resolution No. 01,Series of 2017-151 - Approving and Adopting the Official
Methodology for Generating Annual Labor and Employment Estimates. * Includes post baccalaureate undergraduates and graduates.
** Includes SPED Details may not add up to totals due to rounding.
Source: Labor Force Survey , Philippine Statistics Authority
Senior High School
BOTH SEXES
HIGHEST GRADE COMPLETED
No Grade Completed
Elementary**
Junior High School
Post Secondary
Post Secondary
College
College
Senior High School
Junior High School
Senior High School
Post Secondary
No Grade Completed
Elementary**
FEMALE
College
MALE
No Grade Completed
Elementary**
Junior High School
11-26

No Grade Completed
Elementary Undergraduate
Elementary Graduate
Junior High School Undergraduate
Junior High School Graduate
Senior High School Undergraduate
Senior High School Graduate
Post Secondary Undergraduate
Post Secondary Graduate
College Undergraduate
College Graduate
0
500
1000
1500
2000
2500
3000
3500
4000
4500
5000
0
5
10
15
20
25
30
35
2000 2001 2002 2003 2004 2005 2006 2007 2008 2009 2010 2011 2012 2013 2014 2015
Me
mb
ers
hip
Lab
or
Un
ion
s
Figure 11.6: Number and Membership of Existing Private Sector Labor Unions/Organizations in Central Visayas: 2000-2015
Labor Unions Membership
0% 10% 20% 30% 40% 50% 60% 70% 80% 90% 100%
No Grade Completed
Elementary Undergraduate
Elementary Graduate
Junior High School Undergraduate
Junior High School Graduate
Senior High School Undergraduate
Senior High School Graduate
Post Secondary Undergraduate
Post Secondary Graduate
College Undergraduate
College Graduate
Figure 11.5: Distribution of Employed Persons by Highest Grade Completed and Sex in Central Visayas: October 2017
11-27

Table 11.7A
PECENTAGE DISRIBUTION OF OVERSEAS FILIPINO WORKERS BY SEX AND BY REGION
2014-2017
(In Percent)
Both Sexes Male Female Both Sexes Male Female
Philippines (In Thousands) 2,320 1,149 1,170 2,447 1,197 1,250
Total 100.0 100.0 100.0 100.0 100.0 100.0
National Capital Region 10.5 12.5 8.6 11.0 13.0 9.0
Cordillera Administrative Region 2.2 1.6 2.9 2.3 1.4 3.1
I - Ilocos Region 8.2 6.4 9.9 9.5 7.9 10.9
II - Cagayan Valley 6.7 3.9 9.5 6.0 3.6 8.3
III - Central Luzon 15.5 18.6 12.4 15.1 17.5 12.7
IVA - CALABARZON 17.9 20.7 15.1 17.9 20.4 15.5
IVB - MIMAROPA 2.1 2.5 1.6 1.8 2.2 1.5
V - Bicol Region 3.4 3.3 3.6 3.1 2.9 3.3
VI - Western Visayas 8.6 8.4 8.7 8.7 8.0 9.4
VII - Central Visayas 6.5 8.8 4.4 6.3 8.0 4.7
VIII - Eastern Visayas 1.1 1.2 1.1 2.6 3.1 2.1
IX - Zamboanga Peninsula 2.6 2.3 2.9 2.3 2.1 2.5
X - Northern Mindanao 3.4 3.3 3.6 2.8 2.8 2.8
XI - Davao Region 2.7 1.5 3.9 3.1 2.0 4.1
XII - SOCCSKSARGEN 4.6 2.3 6.9 4.4 2.5 6.2
XIII - Caraga 2.0 1.8 2.1 1.7 1.7 1.8
Autonomous Region of Muslim Mindanao 1.8 1.0 2.7 1.5 0.9 2.1
Negros Island Region
Note: * - Established through EO No. 183 signed on 29 May 2015
** - Dissolved through EO No. 38 signed on 09 August 2017
Source: Survey on Overseas Filipinos, Philippine Statistics Authority
Table 11.7B
PERCENTAGE DISTRIBUTION OF OVERSEAS CONTRACT WORKERS BY SEX AND BY REGION
2014-2017
(In Percent)
Both Sexes Male Female Both Sexes Male Female
Philippines (In Thousands) 2,228 1,107 1,121 2,377 1,168 1,209
Total 100.0 100.0 100.0 100.0 100.0 100.0
National Capital Region 10.6 12.8 8.6 10.9 13.1 8.8
Cordillera Administrative Region 2.3 1.6 2.9 2.3 1.4 3.1
I - Ilocos Region 8.3 6.4 10.2 9.6 8.0 11.2
II - Cagayan Valley 7.0 3.9 9.9 6.1 3.6 8.5
III - Central Luzon 15.3 18.5 12.2 15.3 17.9 12.9
IVA - CALABARZON 17.7 20.9 14.6 17.8 20.3 15.4
IVB - MIMAROPA 2.1 2.5 1.7 1.9 2.3 1.5
V - Bicol Region 3.5 3.3 3.8 3.2 2.9 3.4
VI - Western Visayas 8.8 8.6 9.0 8.8 8.2 9.4
VII - Central Visayas 6.7 9.0 4.5 6.2 7.9 4.5
VIII - Eastern Visayas 1.2 1.2 1.1 2.6 3.1 2.1
IX - Zamboanga Peninsula 2.2 1.7 2.6 2.0 1.7 2.4
X - Northern Mindanao 3.4 3.2 3.5 2.7 2.7 2.8
XI - Davao Region 2.7 1.5 4.0 3.0 1.9 4.1
XII - SOCCSKSARGEN 4.5 2.2 6.7 4.4 2.5 6.3
XIII - Caraga 2.0 1.9 2.2 1.8 1.7 1.8
Autonomous Region of Muslim Mindanao 1.6 0.7 2.6 1.4 0.7 2.0
Negros Island Region
Notes: Details may not add up to totals due to rounding.
The estimates cover overseas Filipinos whose departure occurred within the last five years and who are working or had worked
abroad during the past six months (April to September) of the survey period.
Note: * - Established through EO No. 183 signed on 29 May 2015
** - Dissolved through EO No. 38 signed on 09 August 2017
Source: Survey on Overseas Filipinos, Philippine Statistics Authority
2014 2015
2014
Region
Region
2015
11-28
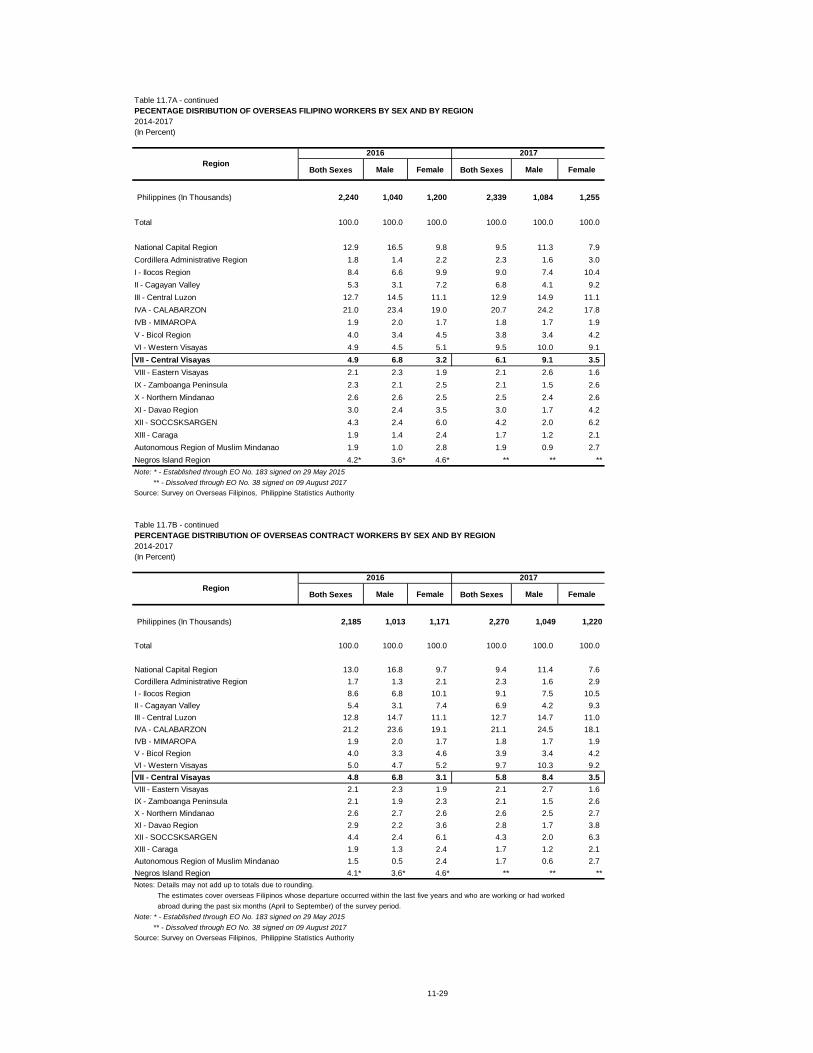
Table 11.7A - continued
PECENTAGE DISRIBUTION OF OVERSEAS FILIPINO WORKERS BY SEX AND BY REGION
2014-2017
(In Percent)
Both Sexes Male Female Both Sexes Male Female
Philippines (In Thousands) 2,240 1,040 1,200 2,339 1,084 1,255
Total 100.0 100.0 100.0 100.0 100.0 100.0
National Capital Region 12.9 16.5 9.8 9.5 11.3 7.9
Cordillera Administrative Region 1.8 1.4 2.2 2.3 1.6 3.0
I - Ilocos Region 8.4 6.6 9.9 9.0 7.4 10.4
II - Cagayan Valley 5.3 3.1 7.2 6.8 4.1 9.2
III - Central Luzon 12.7 14.5 11.1 12.9 14.9 11.1
IVA - CALABARZON 21.0 23.4 19.0 20.7 24.2 17.8
IVB - MIMAROPA 1.9 2.0 1.7 1.8 1.7 1.9
V - Bicol Region 4.0 3.4 4.5 3.8 3.4 4.2
VI - Western Visayas 4.9 4.5 5.1 9.5 10.0 9.1
VII - Central Visayas 4.9 6.8 3.2 6.1 9.1 3.5
VIII - Eastern Visayas 2.1 2.3 1.9 2.1 2.6 1.6
IX - Zamboanga Peninsula 2.3 2.1 2.5 2.1 1.5 2.6
X - Northern Mindanao 2.6 2.6 2.5 2.5 2.4 2.6
XI - Davao Region 3.0 2.4 3.5 3.0 1.7 4.2
XII - SOCCSKSARGEN 4.3 2.4 6.0 4.2 2.0 6.2
XIII - Caraga 1.9 1.4 2.4 1.7 1.2 2.1
Autonomous Region of Muslim Mindanao 1.9 1.0 2.8 1.9 0.9 2.7
Negros Island Region 4.2* 3.6* 4.6* ** ** **
Note: * - Established through EO No. 183 signed on 29 May 2015
** - Dissolved through EO No. 38 signed on 09 August 2017
Source: Survey on Overseas Filipinos, Philippine Statistics Authority
Table 11.7B - continued
PERCENTAGE DISTRIBUTION OF OVERSEAS CONTRACT WORKERS BY SEX AND BY REGION
2014-2017
(In Percent)
Both Sexes Male Female Both Sexes Male Female
Philippines (In Thousands) 2,185 1,013 1,171 2,270 1,049 1,220
Total 100.0 100.0 100.0 100.0 100.0 100.0
National Capital Region 13.0 16.8 9.7 9.4 11.4 7.6
Cordillera Administrative Region 1.7 1.3 2.1 2.3 1.6 2.9
I - Ilocos Region 8.6 6.8 10.1 9.1 7.5 10.5
II - Cagayan Valley 5.4 3.1 7.4 6.9 4.2 9.3
III - Central Luzon 12.8 14.7 11.1 12.7 14.7 11.0
IVA - CALABARZON 21.2 23.6 19.1 21.1 24.5 18.1
IVB - MIMAROPA 1.9 2.0 1.7 1.8 1.7 1.9
V - Bicol Region 4.0 3.3 4.6 3.9 3.4 4.2
VI - Western Visayas 5.0 4.7 5.2 9.7 10.3 9.2
VII - Central Visayas 4.8 6.8 3.1 5.8 8.4 3.5
VIII - Eastern Visayas 2.1 2.3 1.9 2.1 2.7 1.6
IX - Zamboanga Peninsula 2.1 1.9 2.3 2.1 1.5 2.6
X - Northern Mindanao 2.6 2.7 2.6 2.6 2.5 2.7
XI - Davao Region 2.9 2.2 3.6 2.8 1.7 3.8
XII - SOCCSKSARGEN 4.4 2.4 6.1 4.3 2.0 6.3
XIII - Caraga 1.9 1.3 2.4 1.7 1.2 2.1
Autonomous Region of Muslim Mindanao 1.5 0.5 2.4 1.7 0.6 2.7
Negros Island Region 4.1* 3.6* 4.6* ** ** **
Notes: Details may not add up to totals due to rounding.
The estimates cover overseas Filipinos whose departure occurred within the last five years and who are working or had worked
abroad during the past six months (April to September) of the survey period.
Note: * - Established through EO No. 183 signed on 29 May 2015
** - Dissolved through EO No. 38 signed on 09 August 2017
Source: Survey on Overseas Filipinos, Philippine Statistics Authority
2016
2016
Region
Region
2017
2017
11-29

Table 11.8A
ESTABLISHMENTS RESORTING TO PERMANENT CLOSURE
AND WORKERS DISPLACED BY INDUSTRY IN CENTRAL VISAYAS
2010-2015
Industry 2010 2011 2012 2013 2014 2015
Establishments Reporting
TOTAL 61 94 60 35 16 5
Agriculture, Fishery and Forestry - - - - - -
Industry 10 19 11 5 - -
Mining and Quarrying - - 2 - - -
Manufaturing 10 17 7 5 - -
Construction - 2 - - - -
Electricity, Gas and Water - - 2 - - -
Services 51 75 49 30 16 5
Wholesale and Retail Trade, Transportation, Communication and Storage 18 24 16 12 2 5
Financing, Insurance, Real Estate and Business Services 18 27 32 10 11 -
Community, Social and Personal Services 15 24 1 8 3 -
Displaced Workers
TOTAL 1,035 1,755 2,121 799 304 47
Agriculture, Fishery and Forestry - - - - - -
Industry 221 504 1,027 163 - -
Mining and Quarrying - - 216 - - -
Manufaturing 221 499 787 163 - -
Construction - 5 - - - -
Electricity, Gas and Water - - 24 - - -
Services 814 1,251 1,094 636 304 47
Wholesale and Retail Trade, Transportation, Communication and Storage 246 433 227 67 46 47
Financing, Insurance, Real Estate and Business Services 226 429 860 507 182 -
Community, Social and Personal Services 342 389 7 62 76 -
Source: Department of Labor and Employment Region VII
Table 11.8B
ESTABLISHMENTS RESORTING TO REDUCTION OF WORKFORCE/ RETRENCHMENT
AND WORKERS DISPLACED BY INDUSTRY IN CENTRAL VISAYAS
2010-2015
Industry 2010 2011 2012 2013 2014 2015
Establishments Reporting
TOTAL 200 330 212 290 222 247
Agriculture, Fishery and Forestry - - - - - -
Industry 69 149 77 80 78 84
Mining and Quarrying - 18 1 4 2 3
Manufaturing 65 104 66 71 73 76
Construction 3 23 6 1 - 4
Electricity, Gas and Water 1 4 4 4 3 1
Services 131 181 135 210 144 163
Wholesale and Retail Trade, Transportation, Communication and Storage 41 53 29 61 36 44
Financing, Insurance, Real Estate and Business Services 73 95 90 120 87 89
Community, Social and Personal Services 17 33 16 29 21 30
Displaced Workers
TOTAL 2,572 3,502 2,006 5,010 2,664 3,110
Agriculture, Fishery and Forestry - - - - - -
Industry 424 2,209 1,125 2,849 1,102 1,683
Mining and Quarrying - 875 2 50 10 4
Manufaturing 412 1,285 860 2,254 1,080 1,664
Construction 9 23 7 1 - 14
Electricity, Gas and Water 3 26 256 544 12 1
Services 2,148 1,293 881 2,161 1,562 1,427
Wholesale and Retail Trade, Transportation, Communication and Storage 214 614 237 472 254 424
Financing, Insurance, Real Estate and Business Services 1,753 498 580 1,478 1,106 747
Community, Social and Personal Services 181 181 64 211 202 256
Source: Department of Labor and Employment Region VII
11-30

Table 11.9
NUMBER AND MEMBERSHIP OF EXISTING PRIVATE SECTOR
LABOR UNIONS/ORGANIZATION
CENTRAL VISAYAS
2000-2015
Number Membership
CENTRAL VISAYAS
2000 20 277
2001 19 418
2002 27 2,472
2003 32 3,177
2004 16 1,375
2005 27 921
2006 17 662
2007 19 748
2008 15 656
2009 14 517
2010 10 213
2011 12 1,084
2012 12 1,267
2013 9 1,401
2014 9 4,573
2015 11 441
Source: Department of Labor and Employment, Region 7
Table 11.10
STRIKE/LOCKOUT NOTICES HANDLED, FILED, DISPOSED, RATE OF DISPOSITION
AND WORKERS INVOLVED
CENTRAL VISAYAS
2000-2015
Year/ProvinceStrike/ Lockout
Notices Handled
New Strike/
Lockout Notices
Files
Cases
Disposed
Settlement
Rate (%)
Rate of
Disposition
(%)
Workers
Involved
CENTRAL VISAYAS
2000 47 42 44 61.70 93.62 5,339
2001 35 32 32 51.00 91.43 4,886
2002 31 28 27 51.61 87.10 3,762
2003 33 29 26 51.52 78.79 4,677
2004 44 37 37 47.73 84.09 7,359
2005 24 17 20 50.00 83.33 7,593
2006 22 18 22 77.27 100.00 2,946
2007 24 24 20 66.67 83.33 3,271
2008 26 22 24 65.38 92.31 3,058
2009 28 26 27 71.43 96.43 4,748
2010 14 13 14 64.29 100.00 2,143
2011 24 24 23 95.83 95.83 2,380
2012 21 20 19 71.43 90.48 8,632
2013 19 17 15 73.68 78.95 4,305
2014 22 18 19 77.27 86.36 9,969
2015 12 9 11 75.00 91.67 1,073
Source: Department of Labor and Employment, Region 7
Year Private Sector Unions
11-31

Chapter 12
SOCIAL SERVICES
Data on social welfare serve as indicators of the results and impacts of goals, policies and
programs on human development. This universal concern emphasizes people's empowerment and the care, protection and rehabilitation of the disadvantaged and special sectors of society. These
sectors are the primary target clienteles of our social welfare policies and programs. The objective is to place the disadvantaged sectors of society in the mainstream of productive and economic processes. Specifically, this entails converting the disadvantaged groups into active agents and
partners in development. In this manner, the fruits of growth and progress will pervade all sectors of society and the disadvantaged sectors will become beneficiaries of development. The government's Social Reform Agenda (SRA) redirects the thrusts and focus and widens the target
beneficiaries of the package of programs and other interventions implemented by government, private and non-governmental institutions. In contributing to the goals of social welfare and
development, the generation of data and relevant indicators is therefore of utmost necessity. The SRA, for one, underscores the need to strengthen and improve existing systems for generating data.
This chapter presents data at the regional, provincial and Highly Urbanized City levels on the number of disabled persons and type of difficulty. This chapter also contains data on the number of senior citizens. The PSA was the source of these data based on the results of the
2010 Census of Population and Housing.
Highlights
• Of the total household population with disability in the Philippines, 7.2 percent were from Central Visayas. 3.7 percent of these disabled persons are males, while 3.5 percent are females.
• There were more females than males among those with functional difficulty. Of the total household population five years old and over in Central Visayas, 53.1 percent of females have functional difficulty. Majority of this is the difficulty in seeing even if wearing
eyeglasses with 44.4 percent.
• Senior citizens constitute 7.8 percent of the 6.8 million household population in Central Visayas. Among the total senior citizens in Central Visayas, 4.3 percent are females and 3.5 percent males. .

Contents
Highlights 12-1
Statistical Tables:
Table 12.1 Household Population with Disability by Sex and by Age Group
Census Year : 2010 …………………………………………………………………..…. 12-3
Table 12.2 Household Population Five (5) Years Old and Over by Sex,
by Type of Funtional Difficulty and by Province: Census Year 2010 ….... 12-6
Table 12.3 Household Population Sixty (60) Years Old and Over by Sex
Census Year 2010 ………………………………………………………………………... 12-8
12-2
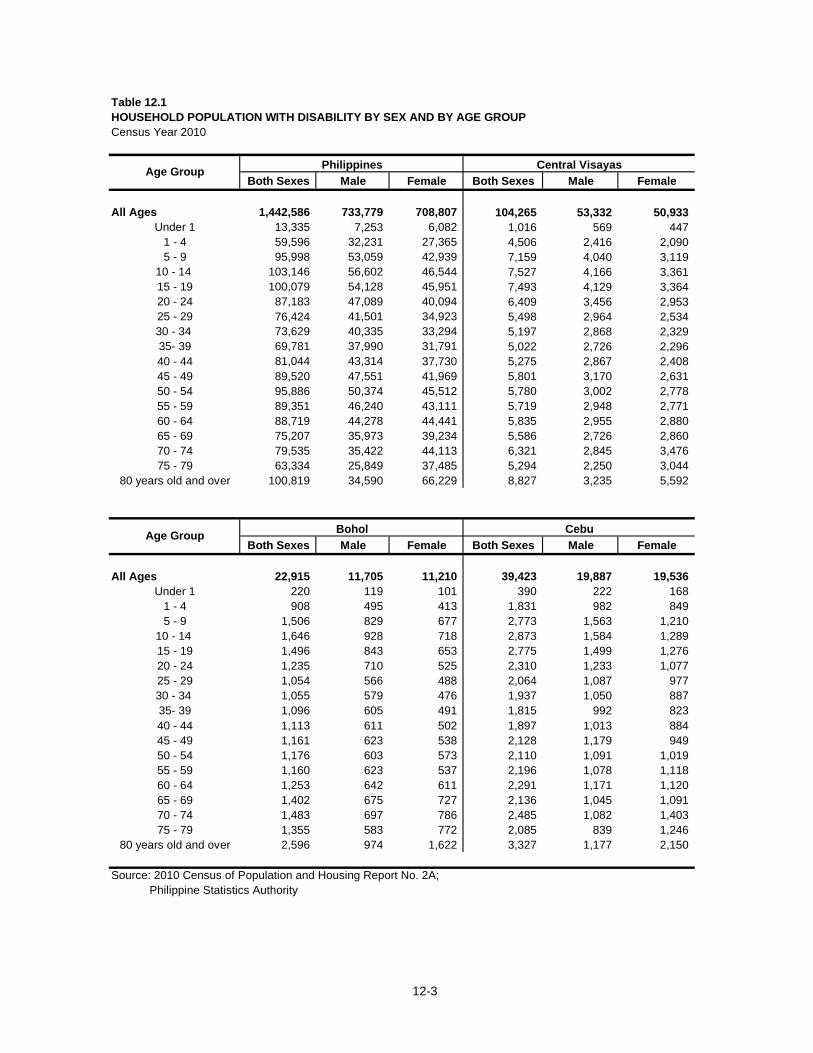
Table 12.1
Both Sexes Male Female Both Sexes Male Female
All Ages 1,442,586 733,779 708,807 104,265 53,332 50,933
Under 1 13,335 7,253 6,082 1,016 569 447
1 - 4 59,596 32,231 27,365 4,506 2,416 2,090
5 - 9 95,998 53,059 42,939 7,159 4,040 3,119
10 - 14 103,146 56,602 46,544 7,527 4,166 3,361
15 - 19 100,079 54,128 45,951 7,493 4,129 3,364
20 - 24 87,183 47,089 40,094 6,409 3,456 2,953
25 - 29 76,424 41,501 34,923 5,498 2,964 2,534
30 - 34 73,629 40,335 33,294 5,197 2,868 2,329
35- 39 69,781 37,990 31,791 5,022 2,726 2,296
40 - 44 81,044 43,314 37,730 5,275 2,867 2,408
45 - 49 89,520 47,551 41,969 5,801 3,170 2,631
50 - 54 95,886 50,374 45,512 5,780 3,002 2,778
55 - 59 89,351 46,240 43,111 5,719 2,948 2,771
60 - 64 88,719 44,278 44,441 5,835 2,955 2,880
65 - 69 75,207 35,973 39,234 5,586 2,726 2,860
70 - 74 79,535 35,422 44,113 6,321 2,845 3,476
75 - 79 63,334 25,849 37,485 5,294 2,250 3,044
80 years old and over 100,819 34,590 66,229 8,827 3,235 5,592
Both Sexes Male Female Both Sexes Male Female
All Ages 22,915 11,705 11,210 39,423 19,887 19,536
Under 1 220 119 101 390 222 168
1 - 4 908 495 413 1,831 982 849
5 - 9 1,506 829 677 2,773 1,563 1,210
10 - 14 1,646 928 718 2,873 1,584 1,289
15 - 19 1,496 843 653 2,775 1,499 1,276
20 - 24 1,235 710 525 2,310 1,233 1,077
25 - 29 1,054 566 488 2,064 1,087 977
30 - 34 1,055 579 476 1,937 1,050 887
35- 39 1,096 605 491 1,815 992 823
40 - 44 1,113 611 502 1,897 1,013 884
45 - 49 1,161 623 538 2,128 1,179 949
50 - 54 1,176 603 573 2,110 1,091 1,019
55 - 59 1,160 623 537 2,196 1,078 1,118
60 - 64 1,253 642 611 2,291 1,171 1,120
65 - 69 1,402 675 727 2,136 1,045 1,091
70 - 74 1,483 697 786 2,485 1,082 1,403
75 - 79 1,355 583 772 2,085 839 1,246
80 years old and over 2,596 974 1,622 3,327 1,177 2,150
Source: 2010 Census of Population and Housing Report No. 2A;
Philippine Statistics Authority
HOUSEHOLD POPULATION WITH DISABILITY BY SEX AND BY AGE GROUP
Census Year 2010
Age GroupPhilippines Central Visayas
Age GroupBohol Cebu
12-3

Table 12.1 - Continued
Both Sexes Male Female Both Sexes Male Female
All Ages 11,653 6,017 5,636 4,333 2,145 2,188
Under 1 102 61 41 69 44 25
1 - 4 521 284 237 242 120 122
5 - 9 825 488 337 397 212 185
10 - 14 891 485 406 360 184 176
15 - 19 995 533 462 352 176 176
20 - 24 915 486 429 363 178 185
25 - 29 781 418 363 305 157 148
30 - 34 679 376 303 297 150 147
35- 39 681 357 324 247 125 122
40 - 44 656 374 282 251 120 131
45 - 49 677 374 303 226 119 107
50 - 54 671 380 291 216 116 100
55 - 59 612 312 300 187 103 84
60 - 64 617 299 318 181 92 89
65 - 69 474 223 251 174 78 96
70 - 74 490 207 283 162 71 91
75 - 79 410 156 254 117 32 85
80 years old and over 656 204 452 187 68 119
Both Sexes Male Female Both Sexes Male Female
All Ages 3,775 2,002 1,773 24,300 12,630 11,670
Under 1 51 29 22 242 131 111
1 - 4 209 111 98 980 512 468
5 - 9 336 205 131 1,577 871 706
10 - 14 330 179 151 1,679 935 744
15 - 19 307 189 118 1,807 1,003 804
20 - 24 358 178 180 1,481 798 683
25 - 29 309 170 139 1,182 662 520
30 - 34 281 151 130 1,163 657 506
35- 39 207 112 95 1,134 616 518
40 - 44 187 94 93 1,321 720 601
45 - 49 207 116 91 1,523 826 697
50 - 54 190 101 89 1,506 770 736
55 - 59 178 96 82 1,446 763 683
60 - 64 143 74 69 1,412 706 706
65 - 69 127 60 67 1,318 657 661
70 - 74 127 60 67 1,567 721 846
75 - 79 86 33 53 1,184 561 623
80 years old and over 142 44 98 1,778 721 1,057
Age GroupCebu City Lapulapu City
Age GroupMandaue City Negros Oriental
12-4

Table 12.1 - Continued
Both Sexes Male Female
All Ages 2,199 1,091 1,108
Under 1 11 7 4
1 - 4 57 32 25
5 - 9 142 84 58
10 - 14 108 55 53
15 - 19 113 62 51
20 - 24 110 51 59
25 - 29 108 61 47
30 - 34 82 55 27
35- 39 89 44 45
40 - 44 101 55 46
45 - 49 105 52 53
50 - 54 127 57 70
55 - 59 127 76 51
60 - 64 119 63 56
65 - 69 129 66 63
70 - 74 169 78 91
75 - 79 174 78 96
80 years old and over 328 115 213
Age GroupSiquijor
12-5

Table 12.2
Province / Type of Disability Both Sexes Male Female
Philippines
Household Population 5 years and over with at least one
type of functional difficulty 3,805,394 1,772,353 2,033,041
Difficulty in Seeing, Even if Wearing Eyeglasses 1,792,461 804,100 988,361
Difficulty in Hearing, Even if Using a Hearing Aid 520,850 246,381 274,469
Difficulty in Walking or Climbing Steps 600,079 290,514 309,565
Difficulty in Remembering or Concentrating 354,375 161,789 192,586
Difficulty in Self-Caring (Bathing or Dressing) 250,433 120,164 130,269
Difficulty in Communicating 287,196 149,405 137,791
Central Visayas
Household Population 5 years and over with at least one
type of functional difficulty 296,133 71,457 157,238
Difficulty in Seeing, Even if Wearing Eyeglasses 127,017 26,156 69,807
Difficulty in Hearing, Even if Using a Hearing Aid 43,491 10,956 22,773
Difficulty in Walking or Climbing Steps 49,973 12,933 25,866
Difficulty in Remembering or Concentrating 31,158 8,376 16,674
Difficulty in Self-Caring (Bathing or Dressing) 21,514 6,142 11,192
Difficulty in Communicating 22,980 6,894 10,926
Bohol
Household Population 5 years and over with at least one
type of functional difficulty 63,182 29,608 33,304
Difficulty in Seeing, Even if Wearing Eyeglasses 21,301 9,383 11,648
Difficulty in Hearing, Even if Using a Hearing Aid 11,175 5,245 5,930
Difficulty in Walking or Climbing Steps 11,919 5,852 6,067
Difficulty in Remembering or Concentrating 8,255 3,781 4,474
Difficulty in Self-Caring (Bathing or Dressing) 5,097 2,457 2,640
Difficulty in Communicating 5,435 2,890 2,545
Cebu*
Household Population 5 years and over with at least one
type of functional difficulty 107,440 49,757 57,683
Difficulty in Seeing, Even if Wearing Eyeglasses 46,431 20,602 25,829
Difficulty in Hearing, Even if Using a Hearing Aid 15,898 7,499 8,399
Difficulty in Walking or Climbing Steps 17,996 8,450 9,546
Difficulty in Remembering or Concentrating 11,226 5,251 5,975
Difficulty in Self-Caring (Bathing or Dressing) 7,790 3,724 4,066
Difficulty in Communicating 8,099 4,231 3,868
Cebu City
Household Population 5 years and over with at least one
type of functional difficulty 33,718 15,292 18,426
Difficulty in Seeing, Even if Wearing Eyeglasses 17,149 7,456 9,693
Difficulty in Hearing, Even if Using a Hearing Aid 3,732 1,664 2,068
Difficulty in Walking or Climbing Steps 5,028 2,372 2,656
Difficulty in Remembering or Concentrating 2,868 1,326 1,542
Difficulty in Self-Caring (Bathing or Dressing) 2,443 1,158 1,285
Difficulty in Communicating 2,498 1,316 1,182
Note: * - Except Cebu City, Mandaue City and Lapu-Lapu City
Source: 2010 Census of Population and Housing Report No. 2A; Philippine Statistics Authority
HOUSEHOLD POPULATION 5 YEARS AND OVER BY SEX,
BY TYPE OF FUNCTIONAL DIFFICULTY AND BY PROVINCE
Census Year 2010
12-6

Table 12.2 - Continued
Province / Type of Disability Both Sexes Male Female
Mandaue City
Household Population 5 years and over with at least one
type of functional difficulty 8,524 3,961 4,563
Difficulty in Seeing, Even if Wearing Eyeglasses 4,054 1,790 2,264
Difficulty in Hearing, Even if Using a Hearing Aid 958 442 516
Difficulty in Walking or Climbing Steps 1,424 689 735
Difficulty in Remembering or Concentrating 727 344 383
Difficulty in Self-Caring (Bathing or Dressing) 648 314 334
Difficulty in Communicating 713 382 331
Lapu-Lapu City
Household Population 5 years and over with at least one
type of functional difficulty 9,227 4,162 5,065
Difficulty in Seeing, Even if Wearing Eyeglasses 4,212 1,778 2,434
Difficulty in Hearing, Even if Using a Hearing Aid 1,201 561 640
Difficulty in Walking or Climbing Steps 1,462 712 750
Difficulty in Remembering or Concentrating 855 371 484
Difficulty in Self-Caring (Bathing or Dressing) 707 343 364
Difficulty in Communicating 790 397 393
Negros Oriental
Household Population 5 years and over with at least one
type of functional difficulty 69,138 33,584 35,554
Difficulty in Seeing, Even if Wearing Eyeglasses 32,654 15,392 17,262
Difficulty in Hearing, Even if Using a Hearing Aid 9,684 4,881 4,803
Difficulty in Walking or Climbing Steps 11,167 5,587 5,580
Difficulty in Remembering or Concentrating 6,437 3,054 3,383
Difficulty in Self-Caring (Bathing or Dressing) 4,278 2,090 2,188
Difficulty in Communicating 4,918 2,580 2,338
Siquijor
Household Population 5 years and over with atleast one
type of functional difficulty 4,904 2,261 2,643
Diffuculty in Seeing, Even if Wearing Eyeglasses 1,216 539 677
Difficulty in Hearing, Even if Using a Hearing Aid 843 426 417
Difficulty in Walking or Climbing Steps 977 445 532
Difficulty in Remembering or Concentrating 790 357 433
Difficulty in Self-Caring (Bathing or Dressing) 551 236 315
Difficulty in Communicating 527 258 269
12-7

Table 12.3
Male Female Male Female
60 years old and
over530,198 235,464 294,734 127,690 56,599 71,091
60 45,492 21,877 23,615 8,799 4,229 4,570
61 35,839 17,154 18,685 7,617 3,639 3,978
62 33,196 15,666 17,530 7,265 3,428 3,837
63 31,321 14,820 16,501 6,822 3,243 3,579
64 27,509 12,940 14,569 6,618 3,080 3,538
65 28,580 13,142 15,438 6,830 3,120 3,710
66 25,421 11,556 13,865 6,379 2,855 3,524
67 27,658 12,507 15,151 7,030 3,158 3,872
68 24,754 11,318 13,436 6,003 2,795 3,208
69 23,694 10,827 12,867 5,904 2,739 3,165
70 24,130 10,661 13,469 5,611 2,520 3,091
71 20,113 8,760 11,353 5,116 2,257 2,859
72 20,395 8,956 11,439 5,072 2,299 2,773
73 18,803 8,123 10,680 4,528 1,979 2,549
74 17,870 7,438 10,432 4,483 1,851 2,632
75 15,921 6,548 9,373 3,855 1,577 2,278
76 14,568 6,026 8,542 3,738 1,593 2,145
77 13,311 5,595 7,716 3,488 1,433 2,055
78 10,446 4,368 6,078 2,742 1,145 1,597
79 10,672 4,321 6,351 2,871 1,166 1,705
80 10,339 4,126 6,213 2,730 1,108 1,622
81 7,482 2,903 4,579 2,111 836 1,275
82 7,193 2,837 4,356 2,058 846 1,212
83 5,983 2,324 3,659 1,682 650 1,032
84 5,550 2,056 3,494 1,550 566 984
85 4,926 1,739 3,187 1,357 478 879
86 3,619 1,330 2,289 1,060 399 661
87 3,227 1,138 2,089 961 357 604
88 2,489 955 1,534 728 276 452
89 2,572 928 1,644 738 273 465
90 2,041 724 1,317 545 192 353
91 1,065 392 673 314 122 192
92 984 359 625 283 111 172
93 732 270 462 226 84 142
94 568 187 381 144 48 96
95 449 145 304 125 45 80
96 319 96 223 88 21 67
97 292 101 191 72 27 45
98 209 77 132 42 19 23
99 117 45 72 32 11 21
100 106 36 70 26 8 18
101 years old and
over 243 93 150 47 16 31
Source: 2010 Census of Population and Housing Report No. 2A; Philippine Statistics Authority
HOUSEHOLD POPULATION 60 YEARS OLD AND OVER BY SEX
Census Year 2010
Age Central Visayas Sex
Bohol Sex
12-8

Table 12.3 - Continued
Male Female Male Female Male Female
199,416 88,353 111,063 106,888 49,522 57,366 11,811 5,183 6,628
17,237 8,316 8,921 9,620 4,713 4,907 814 406 408
13,322 6,430 6,892 7,332 3,578 3,754 613 270 343
12,543 5,938 6,605 6,421 3,143 3,278 645 300 345
12,222 5,829 6,393 5,756 2,771 2,985 571 271 300
10,357 4,925 5,432 5,050 2,440 2,610 585 277 308
10,926 5,000 5,926 5,494 2,573 2,921 613 286 327
9,558 4,400 5,158 4,898 2,301 2,597 593 288 305
10,216 4,623 5,593 5,618 2,605 3,013 678 299 379
9,239 4,172 5,067 5,151 2,460 2,691 523 261 262
8,847 4,083 4,764 4,885 2,312 2,573 554 255 299
8,956 3,900 5,056 5,528 2,528 3,000 541 244 297
7,405 3,171 4,234 4,161 1,913 2,248 482 194 288
7,702 3,393 4,309 4,281 1,906 2,375 513 230 283
7,147 3,054 4,093 4,044 1,854 2,190 429 181 248
6,731 2,755 3,976 3,763 1,678 2,085 404 153 251
6,012 2,439 3,573 3,427 1,527 1,900 384 166 218
5,474 2,200 3,274 3,045 1,375 1,670 324 137 187
5,031 2,085 2,946 2,697 1,291 1,406 400 147 253
4,028 1,672 2,356 1,951 880 1,071 298 131 167
3,959 1,555 2,404 2,191 1,000 1,191 251 94 157
3,848 1,490 2,358 2,213 965 1,248 214 83 131
2,850 1,123 1,727 1,380 562 818 169 67 102
2,705 1,053 1,652 1,300 523 777 209 78 131
2,222 862 1,360 1,139 474 665 137 52 85
2,129 764 1,365 998 418 580 161 59 102
1,827 651 1,176 991 377 614 157 49 108
1,330 485 845 678 253 425 88 37 51
1,174 408 766 575 215 360 92 28 64
904 346 558 412 157 255 74 30 44
931 327 604 472 180 292 91 38 53
744 263 481 410 161 249 51 16 35
384 140 244 181 65 116 32 16 16
365 141 224 172 62 110 41 17 24
236 84 152 144 54 90 23 9 14
218 72 146 110 37 73 18 5 13
160 47 113 102 40 62 8 1 7
107 33 74 71 29 42 8 3 5
121 32 89 54 25 29 9 3 6
81 26 55 44 23 21 4 1 3
41 22 19 24 8 16 4 - 4
33 12 21 35 11 24 1 1 -
94 32 62 70 35 35 5 - 5
HOUSEHOLD POPULATION 60 YEARS OLD AND OVER BY SEX
Census Year 2010
Sex Negros
Oriental
Sex Cebu Siquijor
Sex
12-9

Table 12.3 - Continued
Male Female Male Female Male Female
54,143 22,822 31,321 15,090 6,405 8,685 15,160 6,580 8,580
5,695 2,606 3,089 1,639 785 854 1,688 822 866
4,365 2,056 2,309 1,295 592 703 1,295 589 706
4,038 1,828 2,210 1,154 522 632 1,130 507 623
3,735 1,681 2,054 1,109 484 625 1,106 541 565
3,145 1,426 1,719 872 380 492 882 412 470
2,944 1,347 1,597 873 390 483 900 426 474
2,499 1,071 1,428 757 327 430 737 314 423
2,583 1,140 1,443 766 340 426 767 342 425
2,498 1,024 1,474 678 296 382 662 310 352
2,217 940 1,277 648 251 397 639 247 392
2,286 953 1,333 633 272 361 575 244 331
1,914 806 1,108 505 190 315 530 229 301
1,837 740 1,097 478 195 283 512 193 319
1,731 667 1,064 474 206 268 450 182 268
1,616 625 991 433 183 250 440 193 247
1,477 557 920 366 124 242 400 158 242
1,280 472 808 393 146 247 314 103 211
1,137 429 708 281 97 184 277 113 164
949 352 597 230 87 143 248 101 147
936 323 613 234 93 141 230 90 140
882 319 563 232 87 145 220 74 146
667 224 443 162 51 111 143 40 103
598 227 371 153 50 103 170 60 110
537 183 354 132 47 85 134 56 78
485 159 326 107 49 58 120 41 79
417 132 285 70 20 50 107 32 75
298 99 199 84 27 57 81 30 51
282 88 194 67 21 46 76 21 55
238 99 139 56 17 39 77 30 47
232 77 155 48 19 29 60 14 46
170 51 119 58 18 40 63 23 40
102 29 73 20 8 12 32 12 20
80 14 66 24 7 17 19 7 12
70 24 46 15 10 5 18 5 13
50 14 36 11 6 5 17 5 12
31 7 24 12 2 10 11 3 8
31 5 26 7 1 6 7 4 3
27 11 16 1 1 - 8 2 6
25 4 21 6 1 5 7 3 4
11 3 8 3 1 2 2 - 2
8 2 6 1 1 - 2 1 1
20 8 12 3 1 2 4 1 3
Sex Cebu City
Sex LapuLapu
City
Sex Mandaue
City
12-10

Chapter 13
TRANSPORTATION AND
COMMUNICATION
Data on the extent and coverage of the transportation and communication networks of an area are essential. The data provide the planners and decision makers in the government and in entrepreneurial ventures with a sound basis to improve the state of their infrastructures.
Specifically, planners use the data in the formulation of strategies that will link the locality with its neighbors within and outside the country. The different modes of transportation and channels and
media for communication are vital in the economic, social and cultural lives of peoples and institutions in the community. A well- developed transportation system ensures fast and efficient transfer of goods and services between traders, households and other institutions within and
outside the geographical limits of the community. Similarly, breakthrough in the communication system accelerates the flow of information. This era of information technology enables a faster
access to and dissemination of news, events and developments in the domestic and international scene. The business community receives vital information that can expand the market for their products and services. The continuous provision of data on the transportation and communication
systems of an area therefore becomes indispensable in charting the course towards socioeconomic development and cultural encouragement of the area.
This chapter presents data on all modes of transportation at the regional and provincial
levels. On transportation, data include registration of motor vehicles by classification and fuel used, number of permits/licenses issued, road length, number and length of bridges, aircraft movement,
volume of sea and air passengers and cargo handled. On communication, data include number of licensed radio stations. Data sources are Land Transportation Office (LTO), Department of Works and Highways (DPWH), Civil Aviation Authority of the Philippines (CAAP), Mactan Cebu International
Airport (MCIAA), Philippine Ports Authority (PPA), Cebu Ports Authority (CPA) National Telecommunication Commission (NTC).
Highlights
• The number of motor vehicles registered in Central Visayas rose by 1.5 percent in 2016. As to the type of registration, motorcycles/tricycles have the highest number comprising
64.3 percent of the total registered vehicles in 2016. Utility vehicle came second with 19.7 percent. Other type of registered vehicles like cars, sports utility vehicles, trucks,
buses and trailers comprised 16.0 percent from the total registered vehicles in 2016. More than 93.3 percent of the vehicles registered in 2016 were private vehicles. New registrations accounted for 22.5 percent of the total registrations.
• The number of permits/licenses issued by the Land Transportation Office (LTO) is increasing each year from 2011 to 2016. Of the total number of permits/licenses issued in 2016, 5.9 percent was contributed by professional licenses, 33.5 percent was from non-professional licenses, 30.5 percent shared by student permits and 0.2 percent for conductors permits.
• Of the total number of vehicles registered in Central Visayas, 84.7 percent used gasoline.

13-2
• In 2017, 1,438.03 kilometers of the 2,304.510 kilometers of national roads in Central Visayas were concrete paved and 854.32 kilometers were asphalted. Central Visayas also has a total of 557 bridges consisting of 450 concrete bridges, 105 steel bridges and 2 temporary bridges.
• In 2016, MCIAA catered 71,543 in-coming and out-going flights in the Domestic and International flights. These flights are more than 15.0 percent higher than 2016. The volume
number of passengers in 2016 increased by 13.6 percent but the volume of cargo decreased by 27.9 percent.
• 1n 2016, volume of cargo throughput recorded 38,881,680 metric tons. This was 7.41 percent higher than the recorded 36,198,791 metric tons in 2015.

Contents
Highlights 13-1
Statistical Tables
Table 13.1 Number of Motor Vehicles Registered by Classification and Province
2011-2016 …………..………………………………………………………………….. 13-4
Table 13.2 Number of Motor Vehicles Registered by Type and Province
2011-2016 ……………………………………………………………………….…….. 13-5
Table 13.3 Number of Motor Vehicles Registered by Mode of Registration and Province: 2012-2016 ……………………………………………………........ 13-6
Table 13.4 Number of Permits/Licenses Issued by Province: 2009-2016 …………. 13-9
Table 13.5 Number of Motor Vehicles Registered by Classification and Type
of Fuel Used: 2011-2016 ………………………………………………………..... 13-10
Table 13.6 Existing National Road Length by Surface Type and Province
2011-2017 ……………………………………………………………………………... 13-13
Table 13.7 Number and Length of Existing National Bridges by Province
2011-2017 ……………………………………………………………………………... 13-14
Table 13.8 Aircraft Movement, Passengers Carried and Volume of Cargo by
Airport: 2010-2016 ………………………………………………………………….. 13-15
Table 13.9 Total Shipping Statistics by Port in Central Visayas: 2013-2016 ……... 13-17
Table 13.10 Number of License Radio Stations by Type of Station
2010-2016 ……………………………………………………………………………... 13-21
FIGURES
Figure 13.1 Number of Motor Vehicles Registered by Type in Central Visayas
2016 …………………………………………………………………………………….... 13-22
Figure 13.2 Number of Permits/Licenses Issued in Central Visayas: 2016 ……….... 13-22
13-3

Table 13.1
NUMBER OF MOTOR VEHICLES REGISTERED BY CLASSIFICATION AND PROVINCE
Province / Classification 2011 2012 2013 2014 2015 2016
CENTRAL VISAYAS 574,623 625,489 652,927 680,932 715,016 726,028
Private 515,074 560,771 589,763 629,273 660,226 677,863
Government 6,639 9,479 8,876 6,106 5,996 5,805
Diplomatic - - - 1 - 2
For Hire 52,910 55,239 54,288 45,532 48,784 42,356
Exempt - - - 20 10 2
BOHOL 79,814 81,369 87,610 83,453 74,056 87,458
Private 72,962 74,268 80,833 76,354 66,980 75,744
Government 653 804 560 682 547 805
Diplomatic - - - - - -
For Hire 6,199 6,297 6,217 6,417 6,529 10,909
Exempt - - - - - -
CEBU 399,471 432,607 455,665 503,480 551,856 544,472
Private 357,552 384,714 408,881 467,535 513,128 517,163
Government 4,517 6,902 6,573 4,131 4,094 3,576
Diplomatic - - - 1 - -
For Hire 37,402 40,991 40,211 31,793 34,624 23,731
Exempt - - - 20 10 2
NEGROS ORIENTAL 86,873 101,822 99,642 85,623 80,797 84,707
Private 76,613 92,672 90,643 77,581 72,411 76,184
Government 1,369 1,670 1,640 1,186 1,250 1,316
Diplomatic - - - - - 2
For Hire 8,891 7,480 7,359 6,856 7,136 7,205
Exempt - - - - - -
SIQUIJOR 8,465 9,691 10,010 8,376 8,307 9,391
Private 7,947 9,117 9,406 7,803 7,707 8,772
Government 100 103 103 107 105 108
Diplomatic - - - - - -
For Hire 418 471 501 466 495 511
Exempt - - - - - -
Source: Land Transportation Office, Region 7
2011-2016
13-4

Table 13.2
Province / Type 2011 2012 2013 2014 2015 2016
CENTRAL VISAYAS 574,623 625,489 652,927 680,933 715,016 726,028
Cars 48,150 51,553 51,612 52,291 55,493 54,298
Utility Vehicle 150,131 151,292 152,195 154,936 149,938 143,043
Sports Utility Vehicles 18,080 20,161 22,773 24,139 25,776 28,836
Trucks 32,539 34,833 36,140 32,779 31,459 28,449
Buses 2,071 2,651 2,986 1,220 1,249 1,767
Motorcycles/Tricycles 321,560 360,311 381,709 412,540 448,116 466,823
Trailers 2,092 4,688 5,512 3,028 2,985 2,812
BOHOL 79,814 81,369 87,610 83,453 74,056 87,458
Cars 2,533 2,466 2,444 2,778 2,691 3,379
Utility Vehicle 14,566 15,078 16,962 18,619 16,300 20,603
Sports Utility Vehicles 1,154 1,150 1,492 1,790 1,813 2,048
Trucks 3,631 3,382 3,607 4,444 4,003 5,772
Buses 292 267 214 262 345 820
Motorcycles/Tricycles 57,494 58,830 62,651 55,189 48,508 54,372
Trailers 144 196 240 371 396 464
CEBU 399,471 432,607 455,665 503,480 551,856 544,472
Cars 42,285 45,776 45,478 46,206 49,273 47,177
Utility Vehicle 119,041 115,470 116,385 118,377 115,896 106,101
Sports Utility Vehicles 14,814 16,596 19,109 20,186 21,506 24,024
Trucks 23,090 25,837 26,538 22,785 22,119 16,814
Buses 1,507 2,292 2,640 840 757 687
Motorcycles/Tricycles 196,922 222,323 240,535 292,628 339,939 347,577
Trailers 1,812 4,313 4,980 2,458 2,366 2,092
NEGROS ORIENTAL 86,873 101,822 99,642 85,624 80,797 84,707
Cars 3,171 3,143 3,517 3,146 3,350 3,562
Utility Vehicle 15,450 19,505 17,608 16,723 16,639 15,151
Sports Utility Vehicles 2,032 2,325 2,079 2,055 2,344 2,636
Trucks 5,648 5,425 5,815 5,381 5,167 5,695
Buses 259 83 125 109 139 251
Motorcycles/Tricycles 60,178 71,163 70,207 58,012 52,937 57,157
Trailers 135 178 291 198 221 255
SIQUIJOR 8,465 9,691 10,010 8,376 8,307 9,391
Cars 161 168 173 161 179 180
Utility Vehicle 1,074 1,239 1,240 1,217 1,103 1,188
Sports Utility Vehicles 80 90 93 108 113 128
Trucks 170 189 180 169 170 168
Buses 13 9 7 9 8 9
Motorcycles/Tricycles 6,966 7,995 8,316 6,711 6,732 7,717
Trailers 1 1 1 1 2 1
Source: Land Transportation Office, Region 7
NUMBER OF MOTOR VEHICLES REGISTERED BY TYPE AND PROVINCE
2011-2016
13-5

Table 13.3
NUMBER OF MOTOR VEHICLES REGISTERED BY MODE OF REGISTRATION
AND PROVINCE
2011-2016
New Renewal Total New Renewal Total
CENTRAL VISAYAS 89,383 485,240 574,623 93,948 531,541 625,489
Private 88,844 426,230 515,074 93,390 467,381 560,771
Government 481 6,158 6,639 510 8,969 9,479
Diplomatic - - - - - -
For Hire 58 52,852 52,910 48 55,191 55,239
Exempt - - - - - -
BOHOL 11,138 68,676 79,814 11,224 70,145 81,369
Private 11,130 61,832 72,962 11,214 63,054 74,268
Government 8 645 653 10 794 804
Diplomatic - - - - - -
For Hire - 6,199 6,199 - 6,297 6,297
Exempt - - - - - -
CEBU 64,895 334,576 399,471 64,156 368,451 432,607
Private 64,409 293,143 357,552 63,713 321,001 384,714
Government 455 4,062 4,517 427 6,475 6,902
Diplomatic - - - - - -
For Hire 31 37,371 37,402 16 40,975 40,991
Exempt - - - - -
NEGROS ORIENTAL 12,201 74,672 86,873 17,432 84,390 101,822
Private 12,157 64,456 76,613 17,327 75,345 92,672
Government 17 1,352 1,369 73 1,597 1,670
Diplomatic - - - - - -
For Hire 27 8,864 8,891 32 7,448 7,480
Exempt - - - - - -
SIQUIJOR 1,149 7,316 8,465 1,136 8,555 9,691
Private 1,148 6,799 7,947 1,136 7,981 9,117
Government 1 99 100 - 103 103
Diplomatic - - - - - -
For Hire - 418 418 - 471 471
Exempt - - - - - -
Source: Land Transportation Office, Region 7
Province /
Classification
2011 2012
13-6

Table 13.3 - Continued
New Renewal Total New Renewal Total
CENTRAL VISAYAS 109,963 542,964 652,927 125,780 555,152 680,932
Private 109,229 480,534 589,763 125,103 504,170 629,273
Government 413 8,463 8,876 243 5,863 6,106
Diplomatic - - - - 1 1
For Hire 321 53,967 54,288 415 45,117 45,532
Exempt - - - 19 1 20
BOHOL 14,819 72,791 87,610 6,998 76,455 83,453
Private 14,750 66,083 80,833 6,991 69,363 76,354
Government 60 500 560 7 675 682
Diplomatic - - - - - -
For Hire 9 6,208 6,217 - 6,417 6,417
Exempt - - - - - -
CEBU 76,728 378,937 455,665 113,503 389,977 503,480
Private 76,154 332,727 408,881 112,855 354,680 467,535
Government 289 6,284 6,573 223 3,908 4,131
Diplomatic - - - - 1 1
For Hire 285 39,926 40,211 406 31,387 31,793
Exempt - - 19 1 20
NEGROS ORIENTAL 16,906 82,736 99,642 4,825 80,798 85,623
Private 16,816 73,827 90,643 4,803 72,778 77,581
Government 63 1,577 1,640 13 1,173 1,186
Diplomatic - - - - - -
For Hire 27 7,332 7,359 9 6,847 6,856
Exempt - - - - - -
SIQUIJOR 1,510 8,500 10,010 454 7,922 8,376
Private 1,509 7,897 9,406 454 7,349 7,803
Government 1 102 103 - 107 107
Diplomatic - - - - - -
For Hire - 501 501 - 466 466
Exempt - - - - - -
Source: Land Transportation Office, Region 7
2014Province /
Classification
2013
13-7

Table 13.3 - Continued
New Renewal Total New Renewal Total
CENTRAL VISAYAS 154,924 560,092 715,016 163,587 562,441 726,028
Private 154,274 505,952 660,226 163,007 514,856 677,863
Government 649 5,347 5,996 580 5,225 5,805
Diplomatic - - - - 2 2
For Hire - 48,784 48,784 - 42,356 42,356
Exempt 1 9 10 - 2 2
BOHOL - 74,056 74,056 - 87,458 87,458
Private - 66,980 66,980 - 75,744 75,744
Government - 547 547 - 805 805
Diplomatic - - - - - -
For Hire - 6,529 6,529 - 10,909 10,909
Exempt - - - - -
CEBU 154,924 396,932 551,856 163,587 380,885 544,472
Private 154,274 358,854 513,128 163,007 354,156 517,163
Government 649 3,445 4,094 580 2,996 3,576
Diplomatic - - - - 0 -
For Hire - 34,624 34,624 - 23,731 23,731
Exempt 1 9 10 - 2 2
NEGROS ORIENTAL - 80,797 80,797 - 84,707 84,707
Private - 72,411 72,411 - 76,184 76,184
Government - 1,250 1,250 - 1,316 1,316
Diplomatic - - - - 0 -
For Hire - 7,136 7,136 - 7,205 7,205
Exempt - - - - 2 2
SIQUIJOR - 8,307 8,307 - 9,391 9,391
Private - 7,707 7,707 - 8,772 8,772
Government - 105 105 - 108 108
Diplomatic - - - - - -
For Hire - 495 495 - 511 511
Exempt - - - - - -
2015Province /
Classification
2016
13-8

Table 13.4
Province 2011 2012 2013 2014 2015 2016
CENTRAL VISAYAS 339,030 364,132 372,980 389,125 428,551 438,046
Student Permits 101,418 111,204 111,674 119,222 134,187 133,492
Conductors Permit 396 552 630 633 668 736
Non-Professional 104,917 115,974 122,027 127,696 145,064 146,588
Professional 132,299 136,402 138,649 141,574 148,632 157,230
BOHOL 49,269 50,360 52,478 52,216 54,272 57,784
Student Permits 18,066 18,544 17,610 18,860 20,523 18,373
Conductors Permit 2 33 172 81 65 109
Non-Professional 10,964 10,806 13,077 11,031 12,388 14,833
Professional 20,237 20,977 21,619 22,244 21,296 24,469
CEBU 232,471 253,944 260,585 276,494 307,440 313,532
Student Permits 65,660 74,586 77,518 83,427 93,932 95,067
Conductors Permit 228 295 336 392 401 269
Non-Professional 75,888 85,396 88,567 96,073 110,030 110,141
Professional 90,695 93,667 94,164 96,602 103,077 108,055
NEGROS ORIENTAL 53,316 55,014 55,389 56,343 62,352 61,467
Student Permits 16,266 16,503 15,172 15,699 18,470 18,602
Conductors Permit 166 224 122 160 202 358
Non-Professional 16,821 18,114 18,728 19,035 20,858 19,445
Professional 20,063 20,173 21,367 21,449 22,822 23,062
SIQUIJOR 3,974 4,814 4,528 4,072 4,487 5,263
Student Permits 1,426 1,571 1,374 1,236 1,262 1,450
Conductors Permit - - - - - -
Non-Professional 1,244 1,658 1,655 1,557 1,788 2,169
Professional 1,304 1,585 1,499 1,279 1,437 1,644
Source: Land Transportaion Office Region VII
NUMBER OF PERMITS/LICENSES ISSUED BY PROVINCE
2009-2016
13-9

Table 13.5
NUMBER OF MOTOR VEHICLES REGISTERED BY CLASSIFICATION AND BY TYPE OF FUEL USED
2011-2016
Gas Diesel CNG LPG Others Gas Diesel CNG LPG Others
2011
CENTRAL VISAYAS 462,796 105,939 36 3,758 2 423,756 89,397 27 8 2
BOHOL 68,830 10,835 5 - - 63,543 9,270 5 - -
CEBU 312,485 81,383 31 3,758 2 287,671 68,224 22 8 2
NEGROS ORIENTAL 73,590 13,148 - - - 65,086 11,413 - - -
SIQUIJOR 7,891 573 - - - 7,456 490 - - -
2012
CENTRAL VISAYAS 499,447 116,152 114 5,081 7 460,652 97,239 111 2 7
BOHOL 68,402 12,771 - - - 64,295 9,777 - - -
CEBU 337,491 85,602 114 5,080 7 310,620 71,557 111 1 7
NEGROS ORIENTAL 84,523 17,121 - - - 77,194 15,333 - - -
SIQUIJOR 9,031 658 - 1 - 8,543 572 - 1 -
2013
CENTRAL VISAYAS 520,594 122,208 - 4,613 - 481,023 105,947 - - -
BOHOL 73,287 14,083 - - - 67,867 12,726 - - -
CEBU 352,301 93,771 - 4,613 - 326,044 80,451 - - -
NEGROS ORIENTAL 85,681 13,670 - - - 78,306 12,171 - - -
SIQUIJOR 9,325 684 - - - 8,806 599 - - -
2014
CENTRAL VISAYAS 546,135 131,745 1 20 4 507,322 119,160 - 6 4
BOHOL 70,113 12,968 - 1 - 64,214 11,774 - 1 -
CEBU 396,707 104,292 1 18 4 371,062 94,219 - 4 4
NEGROS ORIENTAL 71,617 13,809 - - - 64,836 12,576 - - -
SIQUIJOR 7,698 676 - 1 - 7,210 591 - 1 -
2015
CENTRAL VISAYAS 596,936 115,090 - 3 2 554,839 102,599 - - 2
BOHOL 61,119 12,541 - - - 55,113 11,484 - - -
CEBU 462,522 86,964 - 3 1 434,072 76,847 - - 1
NEGROS ORIENTAL 65,662 14,913 - - 1 58,537 13,680 - - 1
SIQUIJOR 7,633 672 - - - 7,117 588 - - -
2016
CENTRAL VISAYAS 612,788 110,286 - 1 141 576,325 98,740 - 1 141
BOHOL 70,696 16,297 - 1 - 62,238 13,058 - 1 -
CEBU 464,445 77,794 - - 141 444,088 70,956 - - 141
SIQUIJOR 8,650 740 - - - 8,116 655 - - -
NEGROS ORIENTAL 68,997 15,455 - - - 61,883 14,071 - - -
Source: Land Transportaion Office Region VII
Year / ProvinceTOTAL PRIVATE
13-10

Table 13.5 - Continued
Gas Diesel CNG LPG Others Gas Diesel CNG LPG Others
2011
CENTRAL VISAYAS 35,288 13,670 6 3,749 - 3,752 2,872 3 1 -
BOHOL 4,955 1,244 - - - 332 321 - - -
CEBU 22,164 11,305 6 3,749 - 2,650 1,854 3 1 -
NEGROS ORIENTAL 7,783 1,089 - - - 721 646 - - -
SIQUIJOR 386 32 - - - 49 51 - - -
2012
CENTRAL VISAYAS 34,774 15,081 1 5,078 - 4,021 3,832 2 1 -
BOHOL 3,771 2,526 - - - 336 468 - - -
CEBU 23,941 11,691 1 5,078 - 2,930 2,354 2 1 -
NEGROS ORIENTAL 6,623 832 - - - 706 956 - - -
SIQUIJOR 439 32 - - - 49 54 - - -
2013
CENTRAL VISAYAS 36,177 12,779 - 4,613 - 3,394 3,482 - - -
BOHOL 5,198 1,019 - - - 222 338 - - -
CEBU 23,983 11,021 - 4,613 - 2,274 2,299 - - -
NEGROS ORIENTAL 6,523 711 - - - 852 788 - - -
SIQUIJOR 473 28 - - - 46 57 - - -
2014
CENTRAL VISAYAS 35,456 9,819 1 14 - 3,356 2,745 - - -
BOHOL 5,411 1,000 - - - 488 194 - - -
CEBU 23,426 8,144 1 14 - 2,218 1,909 - - -
NEGROS ORIENTAL 6,178 650 - - - 603 582 - - -
SIQUIJOR 441 25 - - - 47 60 - - -
2015
CENTRAL VISAYAS 38,686 9,899 - 3 - 3,405 2,588 - - -
BOHOL 5,600 916 - - - 406 141 - - -
CEBU 26,128 8,338 - 3 - 2,316 1,775 - - -
NEGROS ORIENTAL 6,485 623 - - - 640 610 - - -
SIQUIJOR 473 22 - - - 43 62 - - -
2016
CENTRAL VISAYAS 33,097 9,106 - - - 3,362 2,440 - - -
BOHOL 7,898 2,994 - - - 560 245 - - -
CEBU 18,257 5,363 - - - 2,098 1,475 - - -
SIQUIJOR 485 26 - - - 49 59 - - -
NEGROS ORIENTAL 6,457 723 - - - 655 661 - - -
FOR HIRE GOVERNMENTYear / Province
13-11

Table 13.5 - Continued
TRL
Gas Diesel CNG LPG Others Gas Diesel CNG LPG Others
2011
CENTRAL VISAYAS - - - - - - - - - - 2,092
BOHOL - - - - - - - - - - 144
CEBU - - - - - - - - - - 1,812
NEGROS ORIENTAL - - - - - - - - - - 135
SIQUIJOR - - - - - - - - - - 1
2012
CENTRAL VISAYAS - - - - - - - - - - 4,688
BOHOL - - - - - - - - - - 196
CEBU - - - - - - - - - - 4,313
NEGROS ORIENTAL - - - - - - - - - - 178
SIQUIJOR - - - - - - - - - - 1
2013
CENTRAL VISAYAS - - - - - - - - - - 5,512
BOHOL - - - - - - - - - - 240
CEBU - - - - - - - - - - 4,980
NEGROS ORIENTAL - - - - - - - - - - 291
SIQUIJOR - - - - - - - - - - 1
2014
CENTRAL VISAYAS - 2 - - - 1 19 - - - 3,028
BOHOL - - - - - - - - - - 371
CEBU - 1 - - - 1 19 - - - 2,458
NEGROS ORIENTAL - 1 - - - - - - - - 198
SIQUIJOR - - - - - - - - - - 1
2015
CENTRAL VISAYAS - - - - - 6 4 - - - 2,985
BOHOL - - - - - - - - - - 396
CEBU - - - - - 6 4 - - - 2,366
NEGROS ORIENTAL - - - - - - - - - - 221
SIQUIJOR - - - - - - - - - - 2
2016
CENTRAL VISAYAS 2 - - - - 2 - - - - 2,812
BOHOL - - - - - - - - - - 464
CEBU - - - - - 2 - - - - 2,092
SIQUIJOR - - - - - - - - - - 1
NEGROS ORIENTAL 2 - - - - - - - - - 255
Year / ProvinceDIPLOMATIC EXEMPT
13-12

Table 13.6
EXISTING NATIONAL ROAD LENGTH BY SURFACE TYPE AND PROVINCE
2012-2017
(In Kilometers)
2012 2013 2014 2015 2016 2017
CENTRAL VISAYAS
Concrete 1133.8928 1167.017 1204.542 980.244 1397.557 1,438.03
Asphalt 898.217 928.262 942.26 716.817 848.024 854.32
Gravel 141.93623 180.54 134.534 37.376 50.495 8.93
Earth 17.822 17.822 17.822 3.125 8.428 3.23
Bohol
Concrete 494.0098 505.653 530.572 569.177 104.798 587.55
Asphalt 113.232 126.157 123.11 104.585 577.778 102.48
Gravel 84.87223 60.304 38.432 18.172 9.048 1.59
Earth .. .. .. .. .. ..
Cebu
Concrete 342.062 333.859 339.667 381.53 536.823 396.46
Asphalt 533.174 570.062 578.888 546.534 401.057 556.16
Gravel 41.786 37.83 28.713 19.204 15.305 3.69
Earth 3.125 3.125 3.125 3.125 3.125 ..
Negros Oriental
Concrete 267.63 300.065 310.016 .. 385.353 413.33
Asphalt 187.348 164.829 169.895 .. 144.682 141.29
Gravel 91.741 81.825 66.808 .. 26.142 3.64
Earth 14.697 14.697 14.697 .. 5.303 3.23
Siquijor
Concrete 30.191 27.44 24.287 29.537 61.721 40.68
Asphalt 64.463 67.214 70.367 65.698 33.369 54.41
Gravel 0.581 0.581 0.581 .. .. -
Earth .. .. .. .. .. ..
Source: Department of Public Works and Highways, Region Office VII
Province / Surface TypeYear
13-13

Table 13.7
Number Length Number Length Number Length Number Length
2011
CENTRAL VISAYAS 543 21,741 479 18,676 33 2,320 29 486 2 58
Bohol 178 4,383 154 3,726 13 445 11 212 0 -
Cebu 215 12,252 183 10,401 12 1,319 18 274 2 58
Siquijor 9 148 9 148 - - 0 - 0 -
Negros Oriental 141 4,958 133 4,401 8 556 0 - 0 -
2012
CENTRAL VISAYAS 547 22,063 468 18,808 52 3,008 25 459 2 58
Bohol 178 4,590 140 3,311 31 1,092 7 185 0 -
Cebu 216 12,271 183 10,852 13 1,359 18 274 2 58
Siquijor 10 154 10 154 - - 0 - 0 -
Negros Oriental 143 5,048 135 4,491 8 556 0 - 0 -
2013
CENTRAL VISAYAS 540 21,434 455 16,734 75 4,426 9 271 0 -
Bohol 180 4,671 142 3,380 32 1,119 6 173 0 -
Cebu 214 11,616 176 8,764 35 2,751 3 98 0 -
Siquijor 13 180 13 180 - - 0 - 0 -
Negros Oriental 133 4,967 124 4,410 8 556 0 - 0 -
2014
CENTRAL VISAYAS 540 21,434 442 16,554 75 4,426 9 271 0 -
Bohol 180 4,671 142 3,380 32 1,119 6 173 0 -
Cebu 214 11,616 176 8,764 35 2,751 3 98 0 -
Siquijor 13 180 0 - 0 -
Negros Oriental 133 4,967 124 4,410 8 556 0 - 0 -
2015
CENTRAL VISAYAS 546 22,332 429 16,410 98 5,510 6 230 0 -
Bohol 180 4,691 144 3,446 31 1,091 5 155 0 -
Cebu 223 12,551 178 9,415 44 3,059 1 75 0 -
Siquijor 0 - 0 -
Negros Oriental 130 4,910 107 3,549 23 1,360 0 - 0 -
2016
CENTRAL VISAYAS 554 23,185 446 17,130 107 5,857 1 75 0 -
Bohol 179 4,716 140 3,391 39 1,325 0 - 0 -
Cebu 227 13,134 182 9,826 44 3,233 1 75 0 -
Siquijor 14 189 13 159 1 30 0 - 0 -
Negros Oriental 134 5,147 111 3,878 23 1,269 0 - 0 -
2017
CENTRAL VISAYAS 557 23,064 450 17,262 105 5,765 2 37 0 -
Bohol 183 4,764 142 3,298 39 1,429 2 37 0 -
Cebu 226 12,949 183 9,761 43 3,188 0 - 0 -
Siquijor 14 189 13 159 1 30 0 - 0 -
Negros Oriental 134 5,162 112 4,044 22 1,118 0 - 0
Note: Details may not add up to total due to rounding.
Source: Department of Public Works and Highways, Region VII
Total
Length
Permanent Bridges
Concrete Steel
Temporary Bridges
Bailey Timber
NUMBER AND LENGTH OF EXISTING NATIONAL BRIDGES BY PROVINCE
2011-2016
(Length in Lineal Meters)
Province Number
13-14

Table 13.8
AIRCRAFT MOVEMENT, PASSENGERS CARRIED AND VOLUME OF CARGO BY AIRPORT
Outgoing Incoming Outgoing Incoming Outgoing Incoming Outgoing Incoming
Tagbilaran Airport, Tagbilaran City Bohol
2010 585 238
2011 1,089 197
2012 853 162
2013 562 346
2014 3,078 378
2015 512 78
2016 870,814 - 575 - 4,137,783 -
Mactan Cebu International Airport, Lapu-Lapu City, Cebu
2010 35,926 14,424
2011 - -
2012 - -
2013* 2,688,173 2,681,756 819,637 806,546 - - 18,207,743 28,340,299 7,945,055 7,241,365
2014* 2,574,919 2,585,190 837,548 842,192 - - 15,139,703 23,941,983 7,707,058 7,341,541
2015* 2,868,501 2,900,603 1,011,245 1,000,890 - - 28,446,942 36,931,782 9,619,420 9,734,079
2016* 3,163,945 3,230,338 1,226,605 1,209,750 48,548 - 17,640,870 32,335,958 9,412,548 7,536,459
Dumaguete Airport, Dumaguete City, Negros Oriental
2010 459 11
2011 731 461
2012 583 126
2013 785 291
2014 386 752
2015 504 187
2016 544,965 - 617 154 4,285,547 -
Bantayan Airport
2010 - -
2011 743
2012 1,512
2013 - -
2014 - -
2015 - -
2016 - - 4,009 25 - -
Siquijor Airport
2010 86 -
2011 344 -
2012 379 -
2013 122 -
2014 - -
2015 - -
2016 - - 91 -
Note: * - Mactan-Cebu International Aiport Authority
Source: Civil Aviation Authority of the Philippines
-
-
-
-
-
Volume of Cargo
-
-
-
-
-
-
-
-
-
16,913,024
15,330,491
-
-
-
International
-
-
-
-
-
- -
-
-
- -
- -
- -
- -
- -
- -
- -
-
- -
-
- -
-
-
-
-
-
-
-
-
362,551 -
410,165 -
450,403 -
463,896 -
450,657 -
509,625 -
1,313,871
4,320,130
33,036,522
36,392,752
42,900,710
4,035,800
5,195,125 1,517,168
4,206,651 1,203,064
4,582,241 1,468,323
-
-
-
620,661 -
572,476 -
601,111
Airport
/ Year
Passenger Traffic
Domestic General
AviationMilitary
4,790,866
4,482,188
-
-
-
13,525,067
754,911
3,273,177
3,082,660
3,433,003
3,604,304 775,844
733,192
2010-2016
(Volume in Kilograms)
DomesticInternational
- -
- -
4,067,736
-
- 4,301,175
1,542,979
13-15

Table 13.8 - Continued
Outgoing Incoming Outgoing Incoming
Tagbilaran Airport, Tagbilaran City Bohol
2010 - - 1,160 54
2011 - - 492 60
2012 - - 1,206 40
2013 400 930 264
2014 67 - 1,284 50
2015 - - 1,028 50
2016 - - 5,860 - 1,104 34
Mactan Cebu International Airport, Lapu-Lapu City, Cebu
2010 - - 34,243 3,681
2011 - - 17,529 1,219
2012 - - - -
2013* - - 27,012 26,942 5,534 5,457 - -
2014* - - 22,297 22,354 5,822 5,808 - -
2015* - - 24,258 24,592 6,683 6,680 - -
2016* - - 27,745 28,059 7,850 7,889 8,791 8,664
Dumaguete Airport, Dumaguete City, Negros Oriental
2010 2,504 - 3,048 - 2,152 12
2011 8,551 - 3,530 - 2,962 74
2012 5,679 108,000 4,174 - 1,206 78
2013 3,274 - 3,656 - 2,174 134
2014 5,405 - 3,434 - 4,728 140
2015 9,816 - 3,924 - 5,770 90
2016 - - 4,152 - 4,530 104
Bantayan Airport
2010 - - - - - - -
2011 82 - - - - - -
2012 664 - - - - - -
2013 - - - - - - -
2014 - - - - - - -
2015 - - - - - - -
2016 - - - - - - 910 3
Siquijor Airport
2010 - - 170 - - -
2011 - - 732 - - -
2012 - - 428 - - -
2013 - - 150 - - -
2014 - - - - - -
2015 - - - - - -
2016 - - - 379 - - -
-
-
Airport
/ Year
Volume of Cargo
-
-
-
-
38,397
-
6,126 -
4,672 -
4,842 -
5,686 -
19,292
8,027
84,559 18,077
69,992
4,664 -
6,512
General
Aviation
Flights
Domestic International General
AviationMilitaryMilitary
13-16

Table 13.9
TOTAL SHIPPING STATISTICS BY PORT IN CENTRAL VISAYAS
2013-2016
(Cargo Throughput in Metric Tons)
Inbound Outbound Import Export Inbound Outbound
2013
Total, All Ports 31,495,248 10,312,646 11,560,665 5,904,027 3,330,990 - -
Bohol 4,289,558 1,319,837 2,199,069 - 770,652 - -
Base Port 1,142,671 1,056,640 86,031 - - - -
Terminal Port 179,519 101,595 77,924 - - - -
Other Government Port 814,171 161,597 652,574 - - - -
Private Ports 2,153,197 5 1,382,540 - 770,652 - -
Cebu 25,372,433 8,026,012 8,581,239 5,893,629 2,484,633 - -
PMO1 - Cebu International Port
(CIP) - Container Terminal 3,706,841 269,395 85,085 2,501,372 850,989 - -
PMO2 - 5th St. - Terminal 3 6,598,675 3,455,026 3,135,787 7,863 - - -
PMO3 - Pier 3 - Terminal 2 1,202,702 605,510 588,964 8,228 - - -
PMO4 - Pier 1 2,179,774 692,412 1,459,232 28,131 - - -
PMO5 Mandaue 2,763,364 1,739,219 719,502 268,742 35,901 - -
PMO6 Danao 171,675 63,293 31,522 76,860 - - -
PMO7 Sta. Fe 150,222 110,116 40,106 - - - -
PMO8 Toledo 1,890,042 580,941 88,731 1,039,833 180,537 - -
PMO9 Argao 6,709,139 510,101 2,432,312 1,962,600 1,417,206 - -
Negros Oriental/Siquijor 1,833,257 966,797 780,357 10,398 75,705 - -
Base Port 504,028 347,490 156,538 - - - -
Terminal Port 55,754 44,204 11,550 - - - -
Other Government Port 9,838 9,122 716 - - - -
Private Ports 1,263,637 565,981 611,553 10,398 75,705 - -
2014
Total, All Ports 31,979,329 10,325,415 11,393,658 6,713,338 3,546,918 - -
Bohol 3,929,391 1,473,839 1,535,044 - 920,508 - -
Base Port 1,286,778 1,177,898 108,880 - - - -
Terminal Port 303,227 215,104 88,123 - - - -
Other Government Port 91,843 80,837 11,006 - - - -
Private Ports 2,247,543 - 1,327,035 - 920,508 - -
Cebu 26,316,119 8,034,670 9,046,025 6,667,867 2,567,557 - -
PMO1 - Cebu International Port
(CIP) - Container Terminal 4,059,040 227,360 65,537 2,755,361 1,010,783 - -
PMO2 - 5th St. - Terminal 3 7,142,167 3,635,322 3,495,998 10,847 - - -
PMO3 - Pier 3 - Terminal 2 1,296,122 602,452 678,492 15,179 - - -
PMO4 - Pier 1 2,339,816 622,192 1,590,384 127,239 - - -
PMO5 Mandaue 3,211,089 1,892,699 852,829 407,807 57,753 - -
PMO6 Danao 364,044 157,391 27,278 179,374 - - -
PMO7 Sta. Fe 94,698 73,668 21,030 - - - -
PMO8 Toledo 1,785,904 409,547 91,963 1,094,037 190,357 - -
PMO9 Argao 6,023,240 414,040 2,222,513 2,078,023 1,308,664 - -
Negros Oriental/Siquijor 1,733,819 816,906 812,589 45,471 58,853 - -
Base Port 552,909 383,319 169,590 - - - -
Terminal Port 46,911 39,048 7,863 - - - -
Other Government Port 6,437 6,344 93 - - - -
Private Ports 1,127,562 388,195 635,043 45,471 58,853 - -
Sources:Philippine Ports Authority
Cebu Ports Authority
Year / PortRORO
Cargo Throughput
TotalDomestic Foreign
13-17

Table 13.9 - Contined
2013
Total, All Ports 55,777,533 10,399,792 169,811 1,003 12,313,853 11,463,007
Bohol 6,798,068 972,096 24,521 94 2,109,883 1,928,501
Base Port 3,476,841 22,770 6,726 50 862,544 733,793
Terminal Port 2,133,433 - 12,028 - 1,040,957 1,004,051
Other Government Port 506,077 - 5,367 - 206,382 190,657
Private Ports 681,717 949,326 400 44 - -
Cebu 41,132,242 9,337,682 105,954 893 8,301,834 7,816,442
PMO1 - Cebu International Port
(CIP) - Container Terminal 473,799 5,253,807 58 405 770 769
PMO2 - 5th St. - Terminal 3 17,390,660 12,356 8,562 1 1,509,117 1,549,502
PMO3 - Pier 3 - Terminal 2 2,375,180 5,761 29,976 2 3,281,987 3,278,592
PMO4 - Pier 1 5,456,881 109,115 8,254 20 1,247,522 1,082,457
PMO5 Mandaue 6,470,246 442,479 28,385 85 639,782 618,031
PMO6 Danao 882,846 174,126 4,233 40 269,728 298,429
PMO7 Sta. Fe 3,627,259 - 13,223 2 727,494 732,483
PMO8 Toledo 1,500,810 969,316 2,818 95 293,018 191,540
PMO9 Argao 2,954,562 2,370,722 10,445 243 332,416 64,639
Negros Oriental/Siquijor 7,847,223 90,014 39,336 16 1,902,136 1,718,064
Base Port 3,129,023 6,431 6,748 2 570,735 433,297
Terminal Port 1,275,781 - 6,095 - 162,126 149,719
Other Government Port 876,948 - 14,352 - 750,688 757,570
Private Ports 2,565,471 83,583 12,141 14 418,587 377,478
2014
Total, All Ports 57,851,883 12,572,813 270,284 1,105 13,332,592 11,532,403
Bohol 6,354,127 1,106,674 24,761 78 1,917,666 1,758,549
Base Port 3,367,723 2,465 7,331 31 748,946 657,855
Terminal Port 2,245,150 - 12,258 - 998,472 950,566
Other Government Port 155,888 - 4,784 - 170,248 150,128
Private Ports 585,366 1,104,209 388 47 - -
Cebu 42,746,783 11,318,552 207,223 1,001 9,414,912 7,950,509
PMO1 - Cebu International Port
(CIP) - Container Terminal 403,925 5,055,196 89 409 1,226,587 -
PMO2 - 5th St. - Terminal 3 18,089,947 36,220 7,644 5 1,227,011 1,274,368
PMO3 - Pier 3 - Terminal 2 2,145,910 7,104 26,130 5 2,723,726 2,752,461
PMO4 - Pier 1 6,208,879 301,936 113,893 38 1,915,449 1,640,521
PMO5 Mandaue 6,775,682 652,160 24,603 85 401,806 391,741
PMO6 Danao 1,421,311 217,142 6,016 14 518,050 527,524
PMO7 Sta. Fe 3,237,489 - 11,540 - 599,637 596,683
PMO8 Toledo 1,428,162 2,374,061 5,676 170 459,670 432,695
PMO9 Argao 3,035,478 2,674,733 11,632 275 342,976 334,516
Negros Oriental/Siquijor 8,750,973 147,587 38,300 26 2,000,014 1,823,345
Base Port 3,946,603 - 6,386 - 616,873 480,600
Terminal Port 1,263,824 - 6,065 - 163,481 143,982
Other Government Port 856,842 - 13,599 - 779,526 792,480
Private Ports 2,683,704 147,587 12,250 26 440,134 406,283
Shipcalls Passenger TrafficShipping Tonnage
Disembarking EmbarkingDomestic Foreign Domestic ForeignYear / Port
13-18

Table 13.9 - Contined
Inbound Outbound Import Export Inbound Outbound
2015r
Total, All Ports 36,198,791 11,741,578 13,146,226 7,860,979 3,454,160 - -
Bohol 4,225,329 1,622,952 1,760,840 24,346 817,191 - -
Base Port 1,371,228 1,230,573 116,309 24,346 - - -
Terminal Port 337,289 246,947 90,342 - - - -
Other Government Port 166,658 144,025 22,633 - - - -
Private Ports 2,350,154 1,407 1,531,556 - 817,191 - -
Cebu 29,980,125 9,122,342 10,635,933 7,772,715 2,453,287 - -
PMO1 - Cebu International Port
(CIP) - Container Terminal4,879,494 308,777 80,875 3,271,265 1,218,578 - -
PMO2 - 5th St. - Terminal 3 7,726,802 3,953,302 3,773,500 - - - -
PMO3 - Pier 3 - Terminal 2 1,449,720 646,042 760,162 43,516 - - -
PMO4 - Pier 1 2,486,792 686,411 1,651,624 148,758 - - -
PMO5 Mandaue 3,293,823 2,013,803 828,596 438,425 13,000 - -
PMO6 Danao 514,059 56,892 101,687 355,480 - - -
PMO7 Sta. Fe 207,143 163,639 43,504 - - - -
PMO8 Toledo 2,308,080 572,404 198,409 1,330,760 210,658 - -
PMO9 Argao 7,114,211 721,073 3,197,576 2,184,511 1,011,051 - -
Negros Oriental 1,993,337 996,284 749,453 63,918 183,682 - -
Base Port 664,440 462,458 201,982 - - - -
Terminal Port 105,688 50,157 55,531 - - - -
Other Government Port 17,956 17,357 599 - - - -
Private Ports 1,205,253 466,312 491,341 63,918 183,682 - -
2016 7.41
Total, All Ports 38,881,860 12,405,771 13,355,294 9,760,157 4,146,737 382,986 451,646
Bohol 4,714,981 1,702,975 1,385,777 79,374 1,546,855 43,735 59,478
Base Port 1,448,244 1,282,358 112,180 53,706 - 6,222 12,569
Terminal Port 431,907 309,759 96,480 25,668 - 37,513 46,909
Other Government Port 115,742 110,388 5,354 - - - -
Private Ports 2,719,088 470 1,171,763 - 1,546,855 - -
Cebu 32,100,715 9,591,179 11,028,008 9,667,745 2,599,882 280,507 334,238
PMO1 - Cebu International Port
(CIP) - Container Terminal 6,116,627 556,006 85,833 4,231,046 1,243,743 - -
PMO2 - 5th St. - Terminal 3 7,494,617 3,979,597 3,966,567 3,364 - 36,826 50,086
PMO3 - Pier 3 - Terminal 2 1,208,644 643,067 546,002 19,575 - 1,349 1,291
PMO4 - Pier 1 2,854,536 738,846 1,784,651 331,038 - 19,983 26,203
PMO5 Mandaue 3,594,172 2,322,616 833,374 438,182 - 39,348 29,519
PMO6 Danao 36,798 94,779 47,361 225,846 - 54,518 54,498
PMO7 Sta. Fe 235,658 188,821 46,837 - - 52,903 62,440
PMO8 Toledo 2,528,791 617,496 251,727 1,449,549 210,019 44,661 51,000
PMO9 Argao 8,030,872 449,951 3,465,656 2,969,145 1,146,120 30,919 59,201
Negros Oriental/Siquijor 2,066,164 1,111,617 941,509 13,038 - 58,744 57,930
Base Port 690,524 476,706 200,780 13,038 - 34,081 33,766
Terminal Port 149,642 61,135 88,507 - - 2,313 2,422
Other Government Port 17,353 14,975 2,378 - - 22,350 21,742
Private Ports 1,208,645 558,801 649,844 - - - -
ForeignYear / Port
Cargo ThroughputRORO
TotalDomestic
13-19

Table 13.9 - Contined
2015r
Total, All Ports 63,565,191 18,015,842 172,727 1,161 14,785,170 13,243,473
Bohol 7,115,744 612,982 24,085 63 3,300,720 2,066,877
Base Port 4,114,627 65,313 7,958 44 982,909 856,079
Terminal Port 2,257,358 - 10,679 - 2,115,456 1,028,757
Other Government Port 205,876 - 4,877 - 202,355 182,041
Private Ports 537,883 547,669 571 19 - -
Cebu 46,707,428 17,125,478 107,806 1,070 9,002,081 8,838,798
PMO1 - Cebu International Port
(CIP) - Container Terminal525,531 6,662,697 160 453 - -
PMO2 - 5th St. - Terminal 3 18,246,294 - 6,074 - 1,072,208 1,195,750
PMO3 - Pier 3 - Terminal 2 2,044,152 41,917 25,013 11 2,722,772 2,808,114
PMO4 - Pier 1 7,008,427 625,466 17,058 53 2,565,155 2,224,268
PMO5 Mandaue 7,147,996 810,283 22,234 99 369,836 348,738
PMO6 Danao 1,939,196 268,030 7,085 19 656,926 660,732
PMO7 Sta. Fe 4,016,762 - 13,306 - 861,768 865,888
PMO8 Toledo 1,790,302 6,362,371 4,312 184 351,016 363,536
PMO9 Argao 3,988,768 2,354,713 12,564 251 402,400 371,772
Negros Oriental 9,742,019 277,382 40,836 28 2,482,369 2,337,798
Base Port 4,549,329 - 7,498 - 716,029 591,464
Terminal Port 611,466 - 3,476 - 122,287 88,754
Other Government Port 1,338,944 - 15,345 - 1,125,768 1,152,217
Private Ports 3,242,280 277,382 14,517 28 518,285 505,363
Total, All Ports 53,091,147 15,764,786 5,489,764 5,006,487 15,607,946 14,960,119
Bohol 28,033 97 28,033 97 2,666,399 2,467,760
Base Port 9,551 36 9,551 36 1,211,741 1,056,376
Terminal Port 17,891 6 17,891 6 1,452,886 1,409,756
Other Government Port 185 - 185 - 1,772 1,628
Private Ports 406 55 406 55 - -
Cebu 53,018,434 15,764,646 125,645 1,163 10,243,827 9,954,795
PMO1 - Cebu International Port
(CIP) - Container Terminal 510,676 8,576,599 76 563 - -
PMO2 - 5th St. - Terminal 3 18,466,187 15,959 5,695 2 969,517 1,165,676
PMO3 - Pier 3 - Terminal 2 2,686,679 12,712 28,900 5 3,057,858 3,183,089
PMO4 - Pier 1 8,233,138 964,696 18,451 81 2,838,748 2,249,662
PMO5 Mandaue 8,096,322 553,562 23,315 103 451,519 440,492
PMO6 Danao 2,191,822 238,992 8,716 34 739,312 743,557
PMO7 Sta. Fe 4,263,802 - 13,451 - 986,010 995,314
PMO8 Toledo 3,025,091 2,282,944 9,631 183 657,953 655,128
PMO9 Argao 5,544,717 3,119,182 17,410 192 542,910 521,877
Negros Oriental 11,632,049 597,526 44,680 43 2,697,720 2,537,564
Base Port 5,475,998 8,091 8,823 3 881,990 677,045
Terminal Port 479,679 - 1,840 - 96,752 98,611
Other Government Port 1,739,827 - 17,537 - 1,104,790 1,143,354
Private Ports 3,936,545 589,435 16,480 40 614,188 618,554
Embarking
Shipping Tonnage Shipcalls Passenger Traffic
Domestic ForeignDomestic Foreign DisembarkingYear / Port
13-20

Table 13.10
Type of Station 2010 2011 2012 2013 2014 2015 2016
GOVERNMENT
GOVERNMENT REPEATER STATION 21 28 29 30 39 45 46
GOVERNMENT FX STATION 156 163 188 188 188 188 195
GOVERNMENT FB STATION 199 217 249 254 273 278 287
GOVERNMENT FX/FB STATION - - - - 1 27 33
GOVERNMENT ML STATION 199 203 224 224 234 235 262
GOVERNMENT PORTABLE STATION 1,367 2,103 2,580 2,691 3,125 3,560 4,140
PRIVATE
Broadcast Radio Station
AM Broadcast 22 22 22 22 22 22 59
FM Broadcast 41 42 51 57 67 68 33
BC Transmitter Translator 4 4 4 4 4 4 -
Television Station 14 14 14 14 14 14 17
Cable TV 6 6 6 6 9 10 66
TV Receive Only 98 107 119 119 122 122 65
Repeater Station (CV) 169 181 178 177 186 196 202
Fixed Pont to Point Sation (CV) 450 522 520 517 579 606 673
Land Base Radio Station (CV) 651 680 696 707 725 692 699
Land Mobile Radio Station (CV) 561 626 787 813 802 946 945
Portable Radio Station (CV) 10,147 11,721 13,795 14,531 16,394 17,868 19,378
Land Base Personal Radio Service 82 82 84 90 92 93 94
Land Mobile Personal Radio Service 26 26 35 39 40 43 43
Portable Personal Radio Service 199 241 284 323 337 367 382
Amateur Radio Station 452 509 511 562 671 798 891
Radio Training Station 1 1 1 1 1 1 1
Fixed Aeronautical Station 1 1 1 1 1 7 11
Aircraft Radio Station 82 100 101 104 106 114 130
Coastal Station 49 57 57 58 59 59 59
Ship Radio Station 922 1,125 1,138 1,186 1,281 1,456 1,631
Fishing Vessel Station 236 1,297 1,298 1,323 1,337 1,379 1,418
Fixed Pont to Point Station (CP) 2,193 2,033 2,023 1,903 1,899 1,920 1,920
Cellular Base Station (CP) 5,884 6,678 6,669 6,667 5,421 5,517 5,517
VSAT Service Provider 18 18 18 18 18 18 18
Trunk Base 12 12 12 12 12 12 12
Source: National Telecommunications Communication, Regional Office VII
NUMBER OF LICENSE RADIO STATIONS BY TYPE OF STATION
2010-2016
13-21

Type of Motor Vehicles Registered
Motorcycles/Tricycles
Utility Vehicle
Cars
Sports Utility Vehicles
Trucks
Others
Trailers
Buses
Number of Permits/Licenses issued
Professional
Non-Professional
Student Permits
Conductors Permit
64.3%19.7%
7.5%
4.0%
3.9%
0.4%
Table 13.1 Number of Motor Vehicles Registered by Type in
Central Visyas: 2016
Motorcycles/Tricycles
Utility Vehicle
Cars
Sports Utility Vehicles
Trucks
Others
35.9%
33.5%
30.5%
0.2%
Figure 13.2 Number of Permits/Licenses Issued in Central Visayas:
2016
Professional
Non-Professional
Student Permits
Conductors Permit
13-22

Chapter 14
ENERGY AND WATER RESOURCES
Data on energy and water resources are vital inputs to national and local programs of government. The business/industry sector also uses the data in the preparation of feasibility studies and in investment planning. The importance of these resources in countryside development
is recognized in many ways. Energy and water are essential resources in stimulating the growth of businesses and other institutions operating in the locality. Industries and agriculture, the major contributors to the region's economy, are highly dependent on these resources. These
resources are also vital in the day-to-day lives of individuals residing in the community. Considering the multifarious uses of these resources, the data on the level, extent, sources and utilization of
energy and water provide signals on the potentials of the area to achieve growth and development. The data also serve as indicators of the standard of living of families comprising the community.
This chapter presents regional and provincial data on power and water. Specifically,
the data on power distributed, energy sales, and service connections by the electric cooperatives.
The data on water includes production, unit cost and value. The data sources are the National Electrification Administration (NEA), Local Water Utilities and Administration and Department of
Energy.
Highlights
• Power distribution of the Central Visayas increased by 12.2 percent, from 1,194,590,388 kilowatt-hour (KwH) in 2015 to 1,340,766,391 in 2016. BANELCO posted the highest increase of energy sold at 19.4 percent in 2016.
• Residential consumers have the highest consumption of electric power in the region utilizing 45.5 percen t of the total power distributed by local electric cooperatives. Commercial use
of electric power account for 25.6 percent of the total power distributed.
• Residential, government building and commercial and accounted for 91.7, 5.3 and 1.4 percent, respectively to the total number of consumers of electric cooperatives in 2016.
Contents
Highlights 14-1
Statistical Tables
Table 14.1 Power Distribution by Electric Cooperative: 2012-2016 ...................14-3
Table 14.2 Energy Sales per Type of Consumer: 2010-2016 …...........................14-5
Table 14.3 Connection per Type of Consumer: 2010-2016 ….............................14-7
Table 14.4 Production Data of Water Districts: 2011-2016 …..............................14-9
Table 14.5 Sub-grid Generation by Type: 2012-2017 …......................................14-11
Figures
Figure 14.1 Energy Sold by Province in Central Visayas: 2016 …..................... 14-4
Figure 14.2 Energy Sales by Type of Consumers in Central Visayas: 2016 ….......14-4
Figure 14.3 Water Production in Central Visayas: 2011-2016 …...........................14-10
Figure 14.4 Sub-grid Energy Generation in Central Visayas: 2017 …....................14-10
14-2

Table 14.1
POWER DISTRIBUTION BY ELECTRIC COOPERATIVE
2012-2016
Electric Cooperative 2012 2013 2014 2015 2016
BOHOL
BOHECO I
Operating Revenue (in PHP) 1,052,706,605 993,816,836 1,052,336,569 1,181,976,625 1,278,819,237
Enegy Purchased/Generated (in KwH) 131,416,803 128,437,002 133,110,101 154,245,787 181,411,357
Enegry Sold (in Kwh) 121,537,040 120,664,461 126,072,887 144,933,884 170,394,855
BOHECO II
Operating Revenue (in PHP) 612,103,637 640,119,209 718,644,679 795,971,890 907,334,905
Enegy Purchased/Generated (in KwH) 80,603,509 81,579,524 87,062,442 95,495,666 108,675,136
Enegry Sold (in Kwh) 71,890,508 73,087,660 78,073,455 86,404,739 98,502,071
CEBU
BANELCO
Operating Revenue (in PHP) 186,309,578 203,491,158 175,549,814 234,096,932 270,942,993
Enegy Purchased/Generated (in KwH) 21,889,485 21,239,664 18,331,034 24,546,837 29,320,627
Enegry Sold (in Kwh) 19,978,112 19,442,623 16,764,378 22,453,152 26,801,488
CEBECO I
Operating Revenue (in PHP) 1,061,207,906 1,210,858,890 1,319,237,495 1,412,414,266 1,508,338,812
Enegy Purchased/Generated (in KwH) 151,287,652 166,765,396 172,481,705 182,531,133 209,848,502
Enegry Sold (in Kwh) 138,663,803 151,504,014 155,882,543 164,393,956 189,857,863
CEBECO II
Operating Revenue (in PHP) 1,863,159,262 2,098,680,848 2,227,606,733 2,416,318,603 2,791,457,511
Enegy Purchased/Generated (in KwH) 262,080,832 278,805,544 307,592,626 342,283,334 388,313,049
Enegry Sold (in Kwh) 238,332,207 253,256,712 279,577,200 309,922,745 348,280,357
CEBECO III
Operating Revenue (in PHP) 766,092,934 789,463,031 826,827,676 942,944,573 1,007,061,215
Enegy Purchased/Generated (in KwH) 132,922,415 142,825,245 148,336,874 152,965,130 156,809,670
Enegry Sold (in Kwh) 124,330,989 131,877,012 138,019,668 140,788,700 142,607,471
CELCO
Operating Revenue (in PHP) 98,327,372 93,337,088 100,748,162 115,128,174 134,804,696
Enegy Purchased/Generated (in KwH) 8,716,575 8,825,017 9,542,677 11,261,226 13,268,155
Enegry Sold (in Kwh) 7,805,146 8,018,682 8,691,582 10,381,783 12,309,970
NEGROS ORIENTAL
NORECO I
Operating Revenue (in PHP) 389,825,178 431,266,651 474,564,221 506,358,894 532,634,094
Enegy Purchased/Generated (in KwH) 49,467,694 55,024,382 57,382,247 61,082,831 69,413,478
Enegry Sold (in Kwh) 43,117,612 48,034,814 49,707,829 52,942,544 59,350,631
NORECO II
Operating Revenue (in PHP) 1,758,109,570 2,279,084,193 2,329,901,257 2,265,318,169 2,416,502,352
Enegy Purchased/Generated (in KwH) 211,451,324 267,554,067 273,950,374 287,257,177 314,095,185
Enegry Sold (in Kwh) 178,686,646 224,439,329 231,531,001 245,216,126 272,520,259
SIQUIJOR
PROSIELCO
Operating Revenue (in PHP) 160,832,670 158,114,332 167,546,202 180,834,168 218,341,743
Enegy Purchased/Generated (in KwH) 14,821,521 15,872,699 16,698,860 18,909,417 22,197,900
Enegry Sold (in Kwh) 13,276,801 14,278,169 14,923,594 17,152,759 20,141,426
Source: National Electrification Administration
14-3

Energy Sold by Province
Cebu
Negros Oriental
Bohol
Siquijor
Energy Sales by Type of Consumers
Residential
Industrial
Commercial
Public Bldg
Others
Cebu
Negros Oriental
Bohol
Siquijor
- 200,000,000 400,000,000 600,000,000 800,000,000
1
Energy Sold (in KwH)
Pro
vim
ceFigure 14.1 Enegry Sold by Province in Central Visayas: 2016
610,796
344,251
294,511
69,104
22,103
Residential
Industrial
Commercial
Public Bldg
Others
Energy Sales in (MwH)
Figure 14.2 Energy Sales by Type of Consumers in Central
Visayas: 2016
14-4

Table 14.2
ENERGY SALES PER TYPE OF CONSUMER
2010-2016
(In Megawatt-hour)
Electric Cooperative/
Type of Consumer2010 2011 2012 2013 2014 2015 2016
BOHOL
BOHECO I
Residential 55,700 57,644 60,728 60,947 64,840 72,605 86,573
Commercial 33,070 34,474 37,413 29,608 30,066 33,943 38,036
Industrial 12,951 15,031 15,531 22,375 23,125 29,373 35,933
Public Bldg 5,800 6,191 6,556 6,417 6,638 7,573 8,348
Others 1,094 4,851 1,309 1,317 1,404 1,440 1,505
Total 108,615 118,191 121,537 120,664 126,073 144,934 170,395
BOHECO II
Residential 38,949 40,771 45,368 46,056 49,500 55,208 63,889
Commercial 8,324 8,671 19,655 27,032 28,507 31,139 34,457
Industrial 7,978 8,952 4,609
Public Bldg 5,274 5,648 2,019
Others 687 675 240 66 156
Total 61,212 64,717 71,891 73,088 78,073 86,347 98,502
CEBU
BANELCO
Residential 9,074 9,497 10,675 10,334 9,071 12,396 14,709
Commercial 5,069 4,950 5,237 5,088 4,458 5,817 6,617
Industrial 2,314 2,928 3,284 3,248 2,734 3,530 4,561
Public Bldg 584 583 647 658 495 701 906
Others 159 138 135 114 6 9 8
Total 17,200 18,096 19,978 19,442 16,764 22,453 26,801
CEBECO I
Residential 60,355 60,556 65,377 70,324 73,707 80,693 92,086
Commercial 26,835 27,301 29,940 32,758 34,028 35,765 41,814
Industrial 22,917 28,263 31,125 35,465 34,903 33,530 39,415
Public Bldg 9,416 9,399 10,456 11,028 11,402 12,568 14,596
Others 1,665 1,691 1,766 1,929 1,843 1,838 1,947
Total 121,188 127,210 138,664 151,504 155,883 164,394 189,858
CEBECO II
Residential 70,598 71,601 74,152 76,493 79,286 90,326 101,466
Commercial 40,589 41,881 43,129 44,820 49,132 219,596 65,118
Industrial 109,294 114,082 111,672 122,181 140,946 168,347
Public Bldg 6,478 6,727 7,139 7,564 8,400 11,402
Others 2,078 2,149 2,240 2,199 1,813 1,947
Total 229,037 236,440 238,332 253,257 279,577 309,922 348,280
CEBECO III
Residential 41,676 43,619 48,071 52,784 56,029 60,143 66,782
Commercial 17,831 20,350 26,317 45,379 24,025 27,088 30,478
Source: National Electrification Administration
14-5

Table 14.2 - Continued
Electric Cooperative/
Type of Consumer2010 2011 2012 2013 2014 2015 2016
Industrial 51,424 49,629 49,943 33,714 46,968 41,892 32,821
Public Bldg 6,709 7,212 8,567 9,290 10,205
Others 2,319 2,392 2,431 2,376 2,321
Total 119,959 123,202 124,331 131,877 138,020 140,789 144,623
CELCO
Residential 4,271 4,071 4,633 4,729 5,125 6,285 7,628
Commercial 2,060 1,905 2,069 2,139 2,204 2,445 2,674
Industrial 118 105 375 453 601 720 868
Public Bldg 729 663 654 624 681 845 1,027
Others 83 81 74 74 80 87 113
Total 7,261 6,825 7,805 8,019 8,691 10,382 12,310
NEGROS ORIENTAL
NORECO I
Residential 24,288 25,847 26,217 29,064 29,842 32,477 37,442
Commercial 5,443 5,655 5,675 6,281 6,502 6,184 6,861
Industrial 5,460 4,686 4,838 5,789 6,363 7,292 7,528
Public Bldg 4,638 5,011 4,983 5,503 5,670 5,629 6,148
Others 1,901 1,438 1,404 1,398 1,331 1,361 1,372
Total 41,730 42,637 43,117 48,035 49,708 52,943 59,351
NORECO II
Residential 95,778 15,720 81,851 101,328 103,655 111,805 129,701
Commercial 50,899 8,177 41,883 52,713 54,428 58,176 65,249
Industrial 40,689 6,993 37,189 48,118 50,224 52,447 54,240
Public Bldg 11,041 1,956 10,031 12,305 12,320 12,500 13,736
Others 8,304 1,455 7,733 9,975 10,904 10,288 9,594
Total 206,711 34,301 178,687 224,439 231,531 245,216 272,520
SIQUIJOR
PROSIELCO
Residential 6,391 6,595 6,740 7,322 7,648 8,783 10,520
Commercial 1,999 2,104 2,200 2,333 2,381 2,749 3,207
Industrial 364 372 379 498 523 510 538
Public Bldg 1,806 1,776 1,780 1,925 1,965 2,432 2,736
Others 1,940 2,056 2,178 2,200 2,407 2,679 3,140
Total 12,500 12,903 13,277 14,278 14,924 17,153 20,141
14-6

Table 14.3
CONNECTION PER TYPE OF CONSUMER
2010-2016
Electric Cooperative/
Type of Consumer2010 2011 2012 2013 2014 2015 2016
BOHOL
BOHECO I
Residential 109,999 115,362 118,797 122,771 127,403 132,168 136,012
Commercial 5,529 5,518 5,599 5,384 5,469 5,625 5,756
Industrial 30 29 30 34 36 42 46
Public Bldg 2,507 2,608 2,668 2,487 2,661 2,710 2,934
Others 7,732 8,081 8,381 8,579 8,831 9,278 9,658
Total 125,797 131,598 135,475 139,255 144,400 149,823 154,406
BOHECO II
Residential 86,181 91,629 97,174 103,532 110,389 117,534 122,208
Commercial 3,935 4,035 9,490 9,576 9,701 9,765 10,045
Industrial 255 280 4
Public Bldg 1,904 1,932
Others 2,782 2,764
Total 95,057 100,640 106,668 113,108 120,090 127,299 132,253
CEBU
BANELCO
Residential 15,050 15,736 17,454 18,550 20,418 22,782 25,071
Commercial 1,602 1,668 1,773 1,834 1,722 1,815 1,837
Industrial 32 33 38 37 30 29 30
Public Bldg 323 338 351 372 295 342 372
Others 38 33 33 32 3 3 2
Total 17,045 17,808 19,649 20,825 22,468 24,971 27,312
CEBECO I
Residential 86,371 92,145 98,061 105,039 112,237 121,479 128,570
Commercial 7,996 7,910 7,979 8,076 8,125 8,145 8,322
Industrial 30 30 31 31 31 34 30
Public Bldg 2,451 2,552 2,668 2,803 2,929 3,029 3,195
Others 318 361 402 447 506 546 639
Total 97,166 102,998 109,141 116,396 123,828 133,233 140,756
CEBECO II
Residential 106,616 111,371 116,803 123,917 129,071 137,259 143,232
Commercial 7,494 7,708 7,895 7,190 8,065 11,788 8,933
Industrial 86 53 51 53 52 51
Public Bldg 2,131 2,210 2,294 1,842 2,342 2,536
Others 653 687 751 445 649 778
Total 116,980 122,029 127,794 133,447 140,179 149,047 155,530
CEBECO III
Residential 62,882 66,308 71,485 76,075 80,597 85,168 90,902
Commercial 4,070 4,073 4,118 5,266 4,123 4,301 4,395
Source: National Electrification Administration
14-7

Table 14.3 - Continued
Electric Cooperative/
Type of Consumer2010 2011 2012 2013 2014 2015 2016
Industrial 31 22 20 2 21 28 29
Public Bldg 773 826 868 1,008 1,086 1,160
Others 188 190 191 206 207 214
Total 67,944 71,419 76,682 81,343 85,955 90,790 98,716
CELCO
Residential 11,822 12,562 13,566 15,011 16,232 17,965 19,875
Commercial 914 787 778 782 738 779 806
Industrial 16 20 21 20 29 27 22
Public Bldg 425 440 454 463 473 471 504
Others 45 46 48 50 52 50 59
Total 13,222 13,855 14,867 16,326 17,524 19,292 21,266
NEGROS ORIENTAL
NORECO I
Residential 50,469 53,424 56,404 60,345 63,818 68,819 75,254
Commercial 1,297 1,326 1,645 1,688 1,711 1,791 1,896
Industrial 322 513 269 269 276 304 316
Public Bldg 881 887 911 925 948 961 986
Others 210 201 209 210 216 215 214
Total 53,179 56,351 59,438 63,437 66,969 72,090 78,666
NORECO II
Residential 103,264 108,142 112,580 118,423 124,360 130,335 137,991
Commercial 7,979 7,922 8,143 8,215 8,272 8,414 8,606
Industrial 160 136 139 140 144 146 143
Public Bldg 1,417 1,428 1,450 1,485 1,499 1,545 1,596
Others 488 472 525 523 557 569 583
Total 113,308 118,100 122,837 128,786 134,832 141,009 148,919
SIQUIJOR
PROSIELCO
Residential 15,639 16,288 17,169 18,430 19,435 20,668 21,906
Commercial 1,531 1,577 1,624 1,708 1,765 1,828 1,931
Industrial 144 150 165 162 160 167 168
Public Bldg 609 629 640 660 665 700 716
Others 322 334 355 386 398 428 497
Total 18,245 18,978 19,953 21,346 22,423 23,791 25,218
14-8

Table 14.4
(Production in cubic meter, Unit Cost per cubic meter, Value in Peso)
WATER
DISTRICT Indicator 2011 2012 2013 2014 2015 2016
Clarin Production - 883,344.00 645,726.00 802,667.86 822,182.40 697,248.00
Unit Cost - 1.17 0.91 1.22 1.56 1.13
Value - 1,031,779.76 590,607.00 980,382.15 1,285,211.47 791,346.01
Talibon Production 683,084.00 587,248.00 644,744.00 678,848.00 765,155.00 788,834.00
Unit Cost 4.95 4.91 4.50 4.51 4.65 4.79
Value 3,381,924.70 2,885,077.03 2,900,769.69 3,060,411.43 3,557,248.97 3,779,266.30
Balamban Production - 2,703,549.99 2,846,451.26 2,929,842.14 3,090,702.00 3,820,755.82
Unit Cost - 4.59 4.95 2.61 3.81 3.76
Value - 12,405,946.66 14,078,516.96 7,633,587.18 11,766,998.61 14,367,860.10
Bogo City Production 1,097,123.15 1,157,609.08 1,400,694.00 1,640,617.60 1,646,390.80 1,904,509.70
Unit Cost 6.16 7.70 7.17 7.07 7.13 5.41
Value 6,760,435.36 8,912,879.50 10,040,846.02 11,591,303.69 11,742,486.14 10,298,308.85
Carcar City Production 2,993,842.00 3,239,336.00 3,311,747.00 3,426,245.00 3,482,261.00 4,228,107.00
Unit Cost 1.98 2.20 2.15 2.25 2.31 2.20
Value 5,927,807.16 7,123,941.82 7,120,036.66 7,719,109.00 8,044,022.91 9,292,022.47
Dalaguete Production - 1,068,691.00 852,976.00 1,232,364.00 1,601,856.00 2,172,192.00
Unit Cost - 2.83 3.39 3.84 3.64 3.40
Value - 3,026,235.84 2,890,652.84 4,728,722.35 5,835,060.71 7,386,215.01
Metro Cebu Production 65,744,912.00 68,650,892.00 71,149,588.00 73,462,290.00 77,643,374.00 78,358,638.00
Unit Cost 25.87 26.20 26.17 26.64 27.86 26.39
Value 1,700,820,873.44 1,798,653,370.40 1,861,984,717.96 1,957,035,405.60 2,163,144,399.64 2,067,884,456.82
Pinamungajan Production 916,838.00 916,838.00 1,050,097.00 1,162,971.08 1,275,698.00 1,471,746.32
Unit Cost 4.75 6.91 5.92 8.83 8.93 6.08
Value 4,354,980.50 6,334,817.72 6,219,430.59 10,271,757.89 11,391,983.14 8,949,439.50
Tabuelan Production 509,865.00 551,636.00 517,557.00 641,566.00 692,566.00 959,217.00
Unit Cost 13.11 13.78 17.05 15.16 16.23 11.64
Value 6,684,330.15 7,601,544.08 8,824,346.85 9,726,140.56 11,240,346.18 11,165,826.69
Toledo City Production - 4,002,774.00 3,693,491.00 4,602,392.00 4,978,396.00 4,952,467.00
Unit Cost - 5.89 4.66 4.51 4.41 4.46
Value - 23,567,191.70 17,230,010.46 20,776,435.46 21,958,071.80 22,086,792.74
Dumaguete City Production - 10,881,250.00 10,978,570.00 11,735,678.00 10,740,137.00 10,781,234.00
Unit Cost - 5.63 6.19 5.73 5.34 5.00
Value - 61,283,701.40 67,934,490.21 67,254,243.86 57,390,287.18 53,875,285.80
Ayungon Production - 480,750.00 540,518.00 619,074.00 597,182.00 643,105.00
Unit Cost - 0.72 0.56 0.69 1.00 0.67
Value - 345,670.65 301,373.60 428,603.16 595,396.72 430,146.19
Bais City Production 985,551.15 1,061,235.50 1,095,115.91 1,199,470.35 1,299,934.13 1,325,526.00
Unit Cost 23.80 23.80 23.80 23.80 23.80 9.36
Value 23,456,117.37 25,257,404.90 26,063,758.66 28,547,394.33 30,938,432.29 12,410,127.66
Bayawan Production - 822,910.00 1,139,457.00 1,264,171.20 1,217,309.60 1,332,167.40
Unit Cost - 5.65 4.34 4.66 2.78 3.43
Value - 4,653,483.39 4,950,637.97 5,889,025.08 3,379,390.69 4,570,432.14
Sibulan Production 1,448,179.00 1,297,322.70 1,757,417.10 1,901,353.00 1,782,982.00 1,975,101.00
Unit Cost 4.29 4.82 2.83 2.65 2.65 2.36
Value 6,212,687.91 6,253,095.41 4,973,490.39 5,038,585.45 4,724,902.30 4,661,238.36
Tanjay Production - 905,011.00 2,048,570.00 2,256,365.00 2,075,442.00 2,075,442.00
Unit Cost - 0.81 0.83 1.13 0.98 1.10
Value - 736,422.94 1,696,023.01 2,543,162.60 2,033,933.16 2,274,702.40
Metro Siquijor Production - 737,800.31 2,048,457.00 2,415,713.95 2,564,858.00 897,700.00
Unit Cost - 8.32 3.62 3.62 3.93 3.91
Value - 6,137,547.79 7,409,137.18 8,737,481.94 10,079,891.94 3,509,114.39
Source : Local Water Utilities Administration
SIQUIJOR
PRODUCTION DATA OF WATER DISTRICTS IN CENTRAL VISAYAS
2011-2016
NEGROS ORIENTAL
CEBU
BOHOL
14-9

2011
74379394.3
0
20,000,000
40,000,000
60,000,000
80,000,000
100,000,000
120,000,000
140,000,000
2011 2012 2016 2014 2015
Figure 14.3 Water Production in CentralVisayas
2011-2016
Bohol
1%
Cebu
65%
Negros Oriental
34%
Figure 14.4 Sub-grid Enegry Generation in Central
Visayas: 2016
14-10

Table 14.5
Sub-grid Generation by Type
2012-2017
(in MWh)
Province / Type 2012 2013 2014 2015 2016 2017
Bohol 44,833 38,236 42,941 45,339 40,538 67,913
Coal - - - - -
Oil-based 5,530 6,229 11,943 11,441 16,327 21,969
Diesel 5,530 6,229 11,943 11,441 16,327 21,969
Gas Turbine - - - - -
Oil Thermal - - - - -
Natural Gas - - - - -
Renewable Energy (RE) 39,303 32,007 30,998 33,898 24,211 45,944
Geothermal - - - - -
Hydro 39,303 32,007 30,998 33,898 24,211 45,944
Biomass - - - - -
Solar - - - - -
Wind - - - - -
Cebu 4,158,028 4,196,518 3,810,883 4,154,062 4,208,895 4,559,900
Coal 3,674,317 3,652,379 3,354,078 3,867,724 3,914,736 4,191,500
Oil-based 476,853 531,562 448,060 281,861 252,862 285,821
Diesel 256,954 263,873 296,725 281,861 252,862 285,821
Gas Turbine - - - - -
Oil Thermal 219,899 267,689 151,335 - -
Natural Gas - 7,815 4,269 - -
Renewable Energy (RE) 6,858 4,762 4,476 4,476 41,297 82,579
Geothermal - - - - -
Hydro 6,858 4,762 4,476 4,476 3,481 5,032
Biomass - - - - -
Solar - - - - -
Wind - - - - -
Negros Oriental 1,572,127 1,490,746 1,672,198 1,809,053 2,203,559 2,446,029
Coal - - - - -
Oil-based - - - - 8,642 14,254
Diesel - - - - 8,642 14,254
Gas Turbine - - - - -
Oil Thermal - - - - -
Natural Gas - - - - -
Renewable Energy (RE) 1,572,127 1,490,746 1,672,198 1,809,053 2,194,917 2,431,775
Geothermal 1,572,127 1,490,579 1,657,158 1,766,642 1,796,784 1,611,544
Hydro - 167 - - 7,980 3,946
Biomass - - - - - 371,558
Solar - - 15,040 42,411 390,153 444,728
Wind - - - - -
Source: Department of Enegry
14-11

Chapter 15
PUBLIC FINANCE
Data on the levels, patterns and distribution of the income and expenditures of local government units (LGUs) are essential in measuring their capabilities to provide public service to
their constituents. Specifically, the level of income serves as a criterion in the classification of LGUs. The classification, on the other hand, provides a yardstick in the allocation of resources and other forms of assistance. Furthermore, the data provide a sound and logical basis in the choice of
alternative options aimed at balancing the sources and disposition of resources. The data are also useful in identifying priority program areas and localities in the community.
This chapter presents data on the annual income and expenditures of provincial and city LGUs. This also includes data pertaining to statement of income of provincial and city government
by type of taxes. The source of data on the classification of provinces, cities and municipalities, statement of receipts and expenditures, and the Internal Revenue Allotment (IRA) dependency is the Bureau of Local Government Finance (BLGF) of the Department of Finance (DOF).
Highlights
• The 2016 annual regular income of Central Visayas went up by 8.9 percent which is
equivalent to 589.50 million pesos compared to 2015.
• Real property tax of the region was up by 19.44 percent from 319.43 million pesos in 2016
to 381.51 million pesos in 2017. However, Internal Revenue Allotment (IRA) dependency of
the region is still the same at 86.0 percent in 2016.
• As the operating income increased by 10.0 percent, the non-income receipts decreased by
74.4 percent. An increased on the operating expenditures with 2.5 percent and 13.0
percent, respectively, were also noted. The increase was allocated for economic and social
services whereas the government services dropped.
• Tax and non-tax revenues of the provinces in Central Visayas grew by 12.34 percent
between 2016 and 2017.

ContentsHighlights 15-1
STATISTICAL TABLES:
Table 15.1 Annual Regular Income by Province in Central Visayas
2013-2016 ...…………………………………………………………………………….. 15-3
Table 15.2 Annual Regular Income by City in Central Visayas
2013-2016 ..……………………………………………………………………………… 15-3
Table 15.3 Annual Regular Income by Municipality
Central Visayas: 2013-2016 ..…………………………………………………….. 15-4
Table 15.4 Internal Revenue Allotment Dependency by Province
Central Visayas: 2013-2016 ..…………………………………………………….. 15-7
Table 15.5 Internal Revenue Allotment Dependency by City
Central Visayas: 2013-2016 ..…………………………………………………….. 15-7
Table 15.6 Internal Revenue Allotment Dependency by Municipality
Central Visayas: 2013-2016 ..…………………………………………………….. 15-8
Table 15.7 Real Property Tax by Fund and by Province
Central Visayas: 2013-2016 ..…………………………………………………….. 15-12
Table 15.8 Real Property Tax by Fund and by City
Central Visayas: 2013-2016 ..…………………………………………………….. 15-12
Table 15.9 Real Property Tax by Fund and by Municipality
Central Visayas: 2013-2016 ..…………………………………………………….. 15-14
Table 15.10 Income Classification by Province
as of May 04, 2016 ...………………………………………………………………… 15-18
Table 15.11 Income Classification by City
as of May 04, 2015 ...………………………………………………………………… 15-18
Table 15.12 Income Classification by Municipality
as of May 04, 2015 ...………………………………………………………………… 15-19
Table 15.13 Local Collections of LGUs by Province
Central Visayas: 2014-2017 ..…………………………………………………….. 15-21
Table 15.14 Statement of Expenditures of LGUs by Province
Central Visayas: 2014-2017 ..…………………………………………………….. 15-24
Table 15.15 Summary of Receipts and Expenditures of LGUs by Province
Central Visayas: 2013-2017 ..…………………………………………………….. 15-25
15-2

Table 15.1
ANNUAL REGULAR INCOME BY PROVINCE
Central Visayas, CY: 2013 - 2016
(In Php 0.00)
Province 2013 2014 2015 2016
CENTRAL VISAYAS 5,158,309,768.69 5,702,480,465.68 6,591,213,271.67 7,180,718,742.70
Bohol 1,234,282,082.44 1,408,515,272.39 1,616,114,122.37 1,752,864,883.59
Cebu 2,209,380,437.90 2,414,594,998.57 2,775,218,466.21 3,068,242,643.24
Negros Oriental 1,399,999,159.65 1,531,590,554.27 1,791,030,570.23 1,910,571,458.64
Siquijor 314,648,088.70 347,779,640.45 408,850,112.86 449,039,757.23
Source: Bureau of Local Government Finance
Table 15.2
ANNUAL REGULAR INCOME BY CITY
Central Visayas, CY: 2013 - 2016
(In Php 0.00)
LGU Name / City 2013 2014 2015 2016
Bais City 372,714,933.47 417,086,225.77 477,222,651.67 559,484,254.45
Bayawan City (Tulong) 564,947,984.28 635,093,148.14 726,418,678.14 798,033,459.85
Bogo City 272,421,703.55 306,223,353.76 348,181,687.06 384,325,949.38
Canlaon City 263,546,408.30 296,668,817.28 340,374,313.47 374,698,110.35
Carcar City 323,685,009.13 364,114,187.43 412,067,429.93 459,824,796.59
Cebu City 3,226,594,056.84 3,346,089,818.20 3,836,021,392.93 4,386,168,199.41
Danao City 380,757,676.70 444,545,886.01 479,858,162.28 535,357,539.82
Dumaguete City 465,385,530.07 517,279,192.17 576,361,709.57 634,949,796.09
Guihulngan City 391,882,853.10 444,532,439.35 506,207,360.89 556,025,049.36
Lapu-Lapu City 1,164,745,262.09 1,449,618,982.02 1,627,970,398.97 1,709,494,781.42
Mandaue City 1,138,338,018.66 1,229,098,709.63 1,426,475,997.97 1,589,626,010.75
Naga City (Cebu) 409,287,695.98 380,472,282.26 432,159,835.97 463,120,652.25
Tagbilaran City 440,742,565.41 499,760,361.46 558,771,448.14 627,439,067.41
Talisay City (Cebu) 501,167,921.99 556,258,500.84 632,179,976.85 566,367,767.90
Tanjay City 340,969,377.31 381,712,665.80 434,451,993.99 480,946,201.04
Toledo City 703,165,110.47 730,458,632.76 860,111,273.53 1,018,371,490.39
Source: Bureau of Local Government Finance
15-3

Table 15.3
ANNUAL REGULAR INCOME BY MUNICIPALITY
CY: 2013 - 2016
(In Php 0.00)
LGU Name/Municipality 2013 2014 2015 2016
CENTRAL VISAYAS
Bohol
Alburquerque 35,183,233.96 39,821,166.00 44,693,926.51 48,652,857.32
Alicia 53,070,442.06 61,829,383.83 67,876,860.61 75,012,399.32
Anda 47,561,649.25 52,885,786.61 60,523,628.72 66,438,086.12
Antequera 49,157,108.64 53,235,586.38 60,749,563.44 70,421,976.30
Baclayon 48,019,359.74 54,165,280.55 61,553,534.08 69,770,872.84
Balilihan 53,743,304.20 60,359,956.11 68,108,753.26 74,472,034.99
Batuan 36,622,011.57 42,065,360.70 46,435,046.98 51,547,299.68
Bien Unido … 54,690,424.29 62,393,272.68 67,518,671.70
Bilar 51,517,756.46 57,289,716.97 65,157,817.72 71,850,254.62
Buenavista 64,070,221.64 72,382,077.47 85,015,330.19 93,742,754.33
Calape 68,568,006.48 76,210,696.59 92,466,056.04 100,984,244.84
Candijay 61,356,304.16 70,083,169.53 80,313,953.86 91,170,941.92
Carmen 110,935,602.01 114,076,038.75 147,506,683.96 170,653,601.98
Catigban 56,931,552.60 62,855,759.75 71,317,240.57 78,366,634.15
Clarin 45,314,743.85 51,118,486.77 58,598,947.77 63,656,820.56
Corella 35,115,285.63 41,704,197.99 44,065,628.31 48,851,238.22
Cortes 41,445,779.49 46,182,908.72 53,297,980.01 59,319,386.06
Dagohoy 45,385,853.95 51,762,422.48 59,704,716.94 66,161,971.86
Danao 64,308,969.47 61,408,706.84 72,629,685.41 80,280,553.32
Dauis 77,393,370.95 91,867,534.00 101,571,959.90 112,297,233.67
Dimiao 47,234,176.68 16,691,552.04 60,770,313.54 66,145,120.93
Duero 46,570,456.53 52,685,410.41 59,702,863.86 65,793,545.56
Garcia Hernandez 58,564,787.09 66,146,181.77 76,479,848.97 83,548,424.76
Getafe 64,333,825.62 72,669,802.18 84,345,499.33 90,971,295.81
Guindulman 63,777,303.90 71,827,545.53 62,751,399.52 90,149,420.54
Inabanga 79,584,726.99 90,034,552.46 104,265,438.87 113,960,963.82
Jagna 78,185,818.91 88,967,851.57 100,295,216.17 109,668,652.10
Lila 34,624,712.21 40,009,435.15 44,989,402.00 49,539,114.30
Loay 48,129,157.46 53,521,363.04 58,945,999.32 63,756,029.07
Loboc 85,938,389.99 70,248,828.42 93,773,713.50 126,168,255.54
Loon 88,941,205.18 96,373,543.35 107,759,936.95 118,142,876.45
Mabini 56,156,485.25 64,498,576.98 73,104,541.97 79,706,914.95
Maribojoc 48,944,606.60 55,872,996.45 66,114,792.15 73,236,575.78
Panglao 91,893,313.43 100,281,094.98 117,938,589.04 128,505,879.05
Pilar 57,694,724.69 65,100,311.72 74,387,956.36 82,903,072.27
1/ Bogo, Cebu converted into city under Republic Act (RA) No. 9390 ratified on June 16, 2007 wherein Bogo and 15
other cities lost their city status on November 2008 and regain it on April of 2011.
3/ Naga, Cebu converted into city under Republic Act (RA) No. 9491 ratified on September 5, 2007. (Same as above)
4/ Guihulngan, Negros Oriental converted into city under amended Republic Act No. 9409 ratified on July 2007.
(Same as above)
Source: Bureau of Local Government Finance
2/ Carcar, Cebu converted into city
under Republic Act (RA) No. 9436
15-4

Table 15.3 - Continued
LGU Name/Municipality 2013 2014 2015 2016
Pres. Carlos P. Garcia (Pitogo) 46,878,521.59 53,039,574.26 60,163,755.92 65,952,733.40
Sagbayan (Borja) 50,118,232.47 59,057,397.81 68,300,239.78 84,247,945.43
San Isidro 34,156,730.30 37,895,824.81 43,691,881.96 47,911,054.31
San Miguel 62,500,841.75 74,566,337.83 82,248,402.22 89,992,996.05
Sevilla 42,587,964.71 46,835,482.49 53,099,083.48 59,780,687.96
Sierra Bullones 64,408,526.55 74,623,800.43 84,421,480.26 95,061,145.20
Sikatuna 30,266,764.05 34,067,912.92 38,969,497.63 43,672,792.69
Talibon 116,255,234.16 131,903,146.30 147,571,266.73 162,866,197.15
Trinidad 82,883,184.86 91,826,025.79 121,226,739.56 133,419,626.29
Tubigon 120,620,701.06 129,739,055.37 143,483,918.74 162,054,193.55
Ubay 128,889,038.94 146,175,588.81 164,790,741.73 181,608,793.67
Valencia 68,691,155.41 75,212,230.09 85,680,568.70 95,583,491.86
Cebu
Alcantara 35,569,247.68 40,248,374.49 45,592,246.65 49,407,240.28
Alcoy 48,125,367.02 53,230,847.29 59,538,189.01 62,914,416.84
Alegria 52,479,923.07 59,437,445.60 67,895,357.85 74,029,156.11
Aloguinsan 51,384,485.98 60,162,350.73 67,408,041.30 74,289,485.03
Argao 114,748,826.53 140,218,619.75 147,448,773.19 160,648,091.03
Asturias 84,198,063.72 97,686,358.26 113,218,767.68 128,664,158.29
Badian 69,093,880.51 76,664,215.69 87,845,865.23 75,394,095.19
Balamban 270,046,635.80 279,246,580.23 219,837,941.65 309,906,408.00
Bantayan 118,418,074.31 131,758,741.55 154,331,844.21 171,234,667.17
Barili 98,727,564.96 115,762,851.21 130,582,324.72 145,272,827.87
Bogo1/
- - - -
Boljoon 45,869,313.17 51,959,960.28 58,145,944.78 64,105,986.59
Borbon 62,244,042.70 69,895,430.67 79,845,858.18 84,927,773.90
Carcar2/
- - - -
Carmen 80,902,514.12 90,509,074.94 105,294,482.83 117,895,753.46
Catmon 60,816,887.92 67,673,305.81 79,202,764.72 86,076,371.02
Compostela 75,457,250.05 85,859,862.09 101,392,961.57 114,646,081.41
Consolacion 200,301,213.91 230,546,542.72 271,902,825.70 300,974,038.69
Cordova 77,796,161.50 91,394,523.21 120,921,601.19 130,062,371.57
Daanbantayan 113,262,105.42 127,287,084.73 146,067,703.41 158,572,254.44
Dalaguete 107,394,072.07 120,933,355.45 141,376,485.89 155,117,637.74
Dumanjug 82,865,987.59 94,211,151.55 106,939,927.48 126,080,016.34
Ginatilan 40,850,164.76 46,196,683.68 52,319,753.14 57,545,949.08
Liloan 155,886,615.19 179,562,529.23 205,876,037.10 226,110,226.09
Madridejos 65,628,383.70 76,402,536.40 88,079,523.48 97,319,068.79
Malabuyoc 45,576,817.36 50,960,346.80 57,514,457.73 63,913,104.91
Medellin 94,423,725.51 104,869,413.46 114,254,760.64 122,874,207.87
Minglanilla 181,636,078.94 211,256,458.55 239,854,759.93 266,403,577.84
Moalboal 83,789,609.50 92,000,765.98 103,527,923.08 110,298,289.45
Naga3/
- - - -
Oslob 87,124,640.76 134,910,524.58 148,275,669.11 188,164,597.56
Pilar 33,551,056.45 37,523,019.06 42,868,666.67 46,686,755.44
Source: Bureau of Local Government Finance
15-5

Table 15.3 - Continued
LGU Name/Municipality 2013 2014 2015 2016
Pinamungahan 86,081,258.71 98,478,565.04 113,099,841.80 126,849,798.20
Poro 54,050,305.90 60,712,257.35 69,330,508.11 74,621,570.91
Ronda 44,070,441.74 51,483,428.82 56,312,305.37 62,258,066.06
Samboan 46,077,023.68 52,834,378.37 60,025,844.36 65,289,776.73
San Fernando 108,980,313.47 122,738,347.92 145,354,066.26 156,384,328.48
San Francisco 81,723,502.55 92,835,768.63 106,575,800.65 116,862,176.33
San Remegio 82,728,604.80 93,866,934.25 108,533,491.18 129,864,366.92
Santa Fe 54,486,264.68 59,288,103.06 70,622,330.93 77,746,630.49
Santander 45,603,448.21 51,958,140.70 58,276,902.84 64,759,952.78
Sibonga 82,917,200.36 92,762,005.21 108,611,144.07 118,466,280.69
Sogod 65,659,747.20 75,259,648.69 83,929,913.66 92,312,499.93
Tabogon 66,535,695.58 75,492,173.21 66,618,971.41 92,718,609.13
Tabuelan 60,341,225.22 67,438,623.59 77,967,301.19 85,901,394.94
Tuburan 101,841,199.63 117,366,018.56 141,102,152.55 150,746,533.48
Tudela 32,186,596.47 37,037,375.85 42,045,482.66 46,170,877.52
NEGROS ORIENTAL
Amlan 58,048,931.54 63,277,311.18 72,141,575.15 80,834,703.92
Ayungon 87,001,316.54 98,093,880.71 112,986,557.11 124,399,314.37
Bacong 65,703,328.63 71,986,004.10 84,250,179.70 91,715,678.37
Basay 58,366,562.13 65,388,459.37 74,068,654.25 81,577,084.96
Bindoy (Payabon) 76,756,020.13 86,348,206.37 97,220,092.10 106,550,968.00
Dauin 62,312,383.75 71,447,821.51 81,737,310.31 95,899,421.58
Guihulngan4/
- - - -
Jimalalud 59,197,991.44 66,915,937.68 76,127,246.19 86,004,882.49
La Libertad 76,112,781.29 83,957,992.23 94,335,943.16 103,504,377.30
Mabinay 125,021,290.47 142,556,507.09 164,043,742.14 180,342,413.34
Manjuyod 86,592,973.67 96,878,957.90 109,649,954.89 119,900,605.93
Pamplona 70,624,776.88 79,544,400.24 92,769,518.29 101,558,090.24
San Jose 44,521,333.01 50,232,681.48 57,915,016.90 63,177,349.33
Santa Catalina 140,056,421.39 158,005,356.25 178,680,682.32 196,015,787.22
Siaton 122,985,562.31 139,413,105.19 161,328,346.69 176,902,633.02
Sibulan 102,496,352.63 115,011,997.73 131,736,840.36 144,587,520.76
Tayasan 68,834,354.60 76,830,379.78 87,367,774.64 95,941,141.00
Valencia ( Luzurriaga) 136,892,225.60 148,659,301.68 172,628,516.02 172,669,014.63
Vallehermoso 65,954,838.82 73,996,962.07 84,257,278.67 91,556,978.50
Zamboanguita 61,186,171.57 67,378,185.17 76,736,895.38 82,913,715.53
SIQUIJOR
Enrique Villanueva 27,716,369.49 30,928,573.10 35,279,514.68 38,728,222.63
Larena 44,778,092.32 51,564,948.19 59,010,936.59 65,415,094.70
Lazi 46,591,118.21 53,119,197.28 61,147,253.78 66,417,923.30
Maria 38,026,042.83 42,923,629.60 50,054,675.78 55,237,035.66
San Juan 38,978,367.61 43,791,735.31 50,417,985.37 56,272,803.06
Siquijor 58,534,665.36 65,873,423.81 75,019,444.08 83,663,990.65
Source: Bureau of Local Government Finance
15-6

Table 15.4
INTERNAL REVENUE ALLOTMENT DEPENDENCY BY PROVINCE
CY: 2013 - 2016
LGU Name/Province 2013 2014 2015 2016
CENTRAL VISAYAS 86% 88% 86% 86%
Bohol 89% 88% 87% 88%
Cebu 81% 84% 83% 82%
Negros Oriental 83% 86% 83% 86%
Siquijor 92% 94% 90% 90%
Source: Bureau of Local Government Finance
Table 15.5
INTERNAL REVENUE ALLOTMENT DEPENDENCY BY CITY
Central Visayas, CY: 2013 - 2016
LGU Name/City 2013 2014 2015 2016
CENTRAL VISAYAS
Bais City 89% 89% 89% 83%
Bayawan City (Tulong) 95% 95% 95% 95%
Bogo City 85% 85% 86% 85%
Canlaon City 92% 92% 92% 91%
Carcar City 84% 84% 85% 83%
Cebu City 34% 37% 36% 35%
Danao City 74% 70% 75% 73%
Dumaguete City 54% 54% 55% 55%
Guihulngan City 97% 96% 96% 96%
Lapu-Lapu City 41% 37% 38% 39%
Mandaue City 39% 40% 40% 39%
Naga City (Cebu) 64% 77% 77% 79%
Tagbilaran City 52% 52% 53% 51%
Talisay City (Cebu) 65% 66% 66% 61%
Tanjay City 93% 93% 94% 93%
Toledo City 52% 56% 55% 50%
Source: Bureau of Local Government Finance
15-7

Table 15.6
INTERNAL REVENUE ALLOTMENT DEPENDENCY BY MUNICIPALITY
CY: 2013 - 2016
LGU Name/Municipality 2013 2014 2015 2016
CENTRAL VISAYAS
Bohol
Alburquerque 84% 84% 85% 86%
Alicia 91% 88% 92% 91%
Anda 81% 83% 82% 83%
Antequera 85% 88% 87% 83%
Baclayon 79% 79% 80% 77%
Balilihan 83% 84% 84% 85%
Batuan 92% 91% 93% 93%
Bien Unido 0% 92% 92% 94%
Bilar 87% 89% 89% 89%
Buenavista 82% 82% 79% 79%
Calape 76% 78% 73% 73%
Candijay 87% 86% 86% 83%
Carmen 71% 78% 69% 66%
Catigban 86% 87% 88% 88%
Clarin 91% 91% 90% 92%
Corella 80% 76% 82% 82%
Cortes 83% 84% 83% 82%
Dagohoy 92% 91% 90% 90%
Danao 75% 89% 86% 85%
Dauis 75% 71% 74% 73%
Dimiao 92% 74% 92% 93%
Duero 91% 91% 92% 91%
Garcia Hernandez 86% 86% 85% 85%
Getafe 92% 92% 90% 92%
Guindulman 91% 91% 89% 91%
Inabanga 91% 91% 90% 91%
Jagna 75% 74% 75% 76%
Lila 93% 91% 93% 93%
Loay 77% 79% 81% 83%
Loboc 45% 62% 52% 43%
Loon 76% 80% 81% 81%
Mabini 94% 92% 93% 94%
Maribojoc 84% 83% 80% 80%
Panglao 53% 55% 53% 53%
Pilar 92% 92% 92% 91%
Pres. Carlos P. Garcia (Pitogo) 94% 94% 95% 95%
Sagbayan (Borja) 84% 81% 80% 71%
San Isidro 92% 94% 93% 93%
Source: Bureau of Local Government Finance
15-8

Table 15.6 - Continued
LGU Name/Municipality 2013 2014 2015 2016
San Miguel 80% 76% 78% 79%
Sevilla 88% 90% 91% 89%
Sierra Bullones 89% 87% 88% 86%
Sikatuna 90% 90% 90% 88%
Talibon 76% 76% 77% 77%
Trinidad 74% 75% 65% 65%
Tubigon 55% 58% 60% 58%
Ubay 85% 85% 86% 86%
Valencia 78% 75% 80% 79%
Cebu
Alcantara 94% 94% 94% 96%
Alcoy 76% 78% 79% 83%
Alegria 87% 87% 87% 88%
Aloguinsan 95% 91% 93% 93%
Argao 86% 87% 86% 88%
Asturias 90% 87% 86% 83%
Badian 90% 92% 91% 88%
Balamban 42% 46% 66% 51%
Bantayan 80% 81% 79% 78%
Barili 90% 87% 88% 87%
Bogo … … … …
Bojoon 91% 91% 92% 92%
Borbon 92% 93% 93% 96%
Carcar … … … …
Carmen 82% - 81% 80%
Catmon 88% 90% 87% 88%
Compostela 82% 81% 79% 77%
Consolacion 64% 63% 61% 61%
Cordova 84% - 70% 72%
Daanbantayan 84% 85% 84% 85%
Dalaguete 83% 84% 82% 82%
Dumanjug 82% 82% 82% 77%
Ginatilan 93% 93% 94% 94%
Liloan 73% 72% 72% 72%
Madridejos 80% 77% 0% 76%
Malabuyoc 90% 91% 92% 91%
Medellin 75% 76% 80% 82%
Minglanilla 71% 69% 69% 69%
Moalboal 64% 66% 67% 70%
Naga … … … …
15-9

Table 15.6 - Continued
LGU Name/Municipality 2013 2014 2015 2016
Oslob 61% 45% 46% 40%
Pilar 94% 95% 94% 95%
Pinamungahan 94% 93% 92% 91%
Poro 83% 84% 84% 86%
Ronda 91% 88% 91% 91%
Samboan 85% 83% 84% 85%
San Fernando 73% 74% 71% 73%
San Francisco 87% 87% 86% 86%
San Remegio 89% 89% 88% 81%
Santa Fe 82% 85% 82% 82%
Santander 77% 77% 78% 77%
Sibonga 84% … 83% 84%
Sogod 86% 85% 87% 87%
Tabogon 86% 86% 83% 88%
Tabuelan 84% 85% 84% 83%
Tuburan 90% 88% 84% 87%
Tudela 94% 92% 92% 92%
Negros Oriental
Amlan 84% 86% 86% 85%
Ayungon 96% 96% 95% 95%
Bacong 78% 81% 79% 80%
Basay 94% 95% 96% 96%
Bindoy (Payabon) 90% 91% 92% 93%
Dauin 82% 81% 81% 76%
Guihulngan … … … …
Jimalalud 96% 96% 96% 94%
La Libertad 87% 89% 90% 91%
Mabinay 92% 91% 90% 90%
Manjuyod 91% 92% 92% 93%
Pamplona 96% 97% 94% 95%
San Jose 91% 91% 90% 91%
Santa Catalina 94% 94% 95% 95%
Siaton 93% 93% 92% 92%
Sibulan 78% 79% 78% 79%
Tayasan 92% 93% 93% 94%
Valencia ( Luzurriaga) 44% 46% 45% 49%
Vallehermoso 93% 94% 93% 95%
Zamboanguita 80% 82% 82% 83%
15-10

Table 15.6 - Continued
LGU Name/Municipality 2013 2014 2015 2016
Siquijor
Enrique Villanueva 95% 96% 96% 95%
Larena 78% 77% 75% 75%
Lazi 94% 92% 90% 91%
Maria 93% 93% 91% 90%
San Juan 89% 89% 88% 87%
Siquijor 85% 85% 85% 84%
15-11

Table 15.7
REAL PROPERTY TAX BY FUND BY PROVINCE
FYs 2010 - 2016
(In Php 0.00)
General FundSpecial
Education FundGeneral Fund
Special
Education Fund
CENTRAL VISAYAS 105,833,083.22 151,057,724.50 256,890,807.72 113,255,743.07 158,641,746.64 271,897,489.71
Bohol 32,249,957.02 45,939,609.03 78,189,566.05 32,896,606.95 44,031,757.01 76,928,363.96
Cebu 54,702,345.28 78,218,654.22 132,920,999.50 59,786,000.57 85,274,184.76 145,060,185.33
Negros Oriental 16,907,792.24 24,088,778.21 40,996,570.45 17,619,598.53 25,155,289.45 42,774,887.98
Siquijor 1,972,988.68 2,810,683.04 4,783,671.72 2,953,537.02 4,180,515.42 7,134,052.44
Source: Bureau of Local Government Finance
Table 15.8
REAL PROPERTY TAX BY FUND BY CITY
FYs 2013 - 2016
(In Php 0.00)
General FundSpecial
Education FundGeneral Fund
Special
Education Fund
CENTRAL VISAYAS
Bais City 10,076,414.95 9,597,435.41 19,673,850.36 10,516,130.83 9,994,132.11 20,510,262.94
Bayawan City (Tulong) 5,937,445.02 5,934,225.93 11,871,670.95 7,014,160.48 7,084,178.27 14,098,338.75
Bogo City 4,253,583.39 6,154,761.25 10,408,344.64 2,823,511.15 4,111,800.89 6,935,312.04
Canlaon City 2,436,082.37 2,177,945.70 4,614,028.07 2,846,633.20 2,514,422.94 5,361,056.14
Carcar City 5,757,118.18 8,224,454.54 13,981,572.72 2,929,138.34 4,184,483.36 7,113,621.70
Cebu City 329,316,782.42 235,213,292.15 564,530,074.57 377,368,623.27 268,543,062.83 645,911,686.10
Danao City 7,817,685.91 11,168,122.72 18,985,808.63 8,753,322.91 12,504,747.01 21,258,069.92
Dumaguete City 25,723,822.63 26,192,100.22 51,915,922.85 22,111,428.34 22,907,070.99 45,018,499.33
Guihulngan City 1,404,452.40 2,006,360.57 3,410,812.97 1,285,703.82 1,836,719.75 3,122,423.57
Lapu-Lapu City 83,557,873.95 72,773,694.54 156,331,568.49 211,706,346.70 185,816,619.64 397,522,966.34
Mandaue City 97,031,941.24 109,452,039.66 206,483,980.90 111,867,014.57 122,979,176.35 234,846,190.92
Naga City (Cebu) 71,888,733.87 102,698,189.22 174,586,923.09 2,367,439.22 3,382,053.69 5,749,492.91
Tagbilaran City 20,362,204.95 24,215,361.87 44,577,566.82 26,849,935.34 32,622,823.51 59,472,758.85
Talisay City (Cebu) 28,639,808.75 40,912,890.68 69,552,699.43 30,629,087.91 43,798,653.05 74,427,740.96
Tanjay City 3,319,075.81 4,741,516.26 8,060,592.07 3,437,035.69 4,909,864.12 8,346,899.81
Toledo City 64,330,732.28 46,101,506.42 110,432,238.70 66,037,520.99 47,504,756.38 113,542,277.37
Source: Bureau of Local Government Finance
2013
2013 Total
2014
2013
2014 Total
2014 Total
2013 Total
2014
Province
LGU Name/City
15-12

Table 15.7 - Continued
REAL PROPERTY TAX BY FUND BY PROVINCE
FYs 2010 - 2016
(In Php 0.00)
General FundSpecial
Education FundGeneral Fund
Special
Education Fund
CENTRAL VISAYAS 123,001,774.95 175,504,857.31 298,506,632.26 131,705,895.63 187,728,965.95 319,434,861.58
Bohol 33,401,976.75 48,210,457.82 81,612,434.57 37,250,879.44 53,437,002.93 90,687,882.37
Cebu 66,324,361.50 94,751,702.64 161,076,064.14 71,685,951.14 102,411,609.47 174,097,560.61
Negros Oriental 20,490,817.23 28,372,906.51 48,863,723.74 19,109,825.06 27,277,149.41 46,386,974.47
Siquijor 2,784,619.47 4,169,790.34 6,954,409.81 3,659,239.99 4,603,204.14 8,262,444.13
Table 15.8 - Continued
REAL PROPERTY TAX BY FUND BY CITY
FYs 2013 - 2016
(In Php 0.00)
General FundSpecial
Education FundGeneral Fund
Special
Education Fund
CENTRAL VISAYAS
Bais City 10,627,361.62 10,086,424.13 20,713,785.75 16,075,145.58 15,329,042.81 31,404,188.39
Bayawan City (Tulong) 7,348,120.95 7,233,023.46 14,581,144.41 7,770,799.66 7,783,659.81 15,554,459.47
Bogo City 2,724,142.20 3,950,291.87 6,674,434.07 3,069,453.42 4,463,147.04 7,532,600.46
Canlaon City 2,267,370.03 2,113,690.01 4,381,060.04 6,677,714.00 6,325,682.73 13,003,396.73
Carcar City 3,071,765.88 4,388,236.97 7,460,002.85 3,061,631.68 4,373,759.55 7,435,391.23
Cebu City 382,700,264.80 273,357,641.15 656,057,905.95 409,847,874.63 292,748,401.53 702,596,276.16
Danao City 9,283,151.09 13,261,644.40 22,544,795.49 10,348,135.27 14,783,050.38 25,131,185.65
Dumaguete City 22,783,723.79 23,484,487.72 46,268,211.51 24,633,779.72 25,264,332.92 49,898,112.64
Guihulngan City 1,228,967.95 1,557,927.83 2,786,895.78 1,301,441.15 1,812,542.37 3,113,983.52
Lapu-Lapu City 153,072,130.90 132,957,011.92 286,029,142.82 171,993,524.48 148,667,258.11 320,660,782.59
Mandaue City 109,916,944.02 120,783,801.46 230,700,745.48 121,398,545.60 133,399,465.58 254,798,011.18
Naga City (Cebu) 8,082,166.85 11,545,950.58 19,628,117.43 3,498,173.76 4,997,388.95 8,495,562.71
Tagbilaran City 31,228,647.68 38,236,406.93 69,465,054.61 33,699,984.64 41,259,300.05 74,959,284.69
Talisay City (Cebu) 28,399,032.87 40,570,047.00 68,969,079.87 32,831,177.25 46,901,681.69 79,732,858.94
Tanjay City 3,754,920.72 5,059,423.71 8,814,344.43 4,404,882.91 5,444,769.67 9,849,652.58
Toledo City 65,773,897.40 47,328,592.92 113,102,490.32 94,269,787.45 67,592,016.12 161,861,803.57
Province
LGU Name/City
2016
2016 Total
2016
2016 Total
2015
2015 Total
2015 Total
2015
15-13

Table 15.9
REAL PROPERTY TAX BY MUNICIPALITY
FYs 2013-2016
(In Php 0.00)
General FundSpecial
Education FundGeneral Fund
Special
Education Fund
CENTRAL VISAYAS
Bohol 37,585,291.40 46,944,614.23 84,529,905.63 38,765,737.91 48,239,191.44 87,004,929.35
Alburquerque 536,765.60 670,957.01 1,207,722.61 433,841.08 542,301.35 976,142.43
Alicia 744,142.41 930,178.71 1,674,321.12 703,514.81 879,394.03 1,582,908.84
Anda 544,759.51 680,949.38 1,225,708.89 408,351.33 510,439.17 918,790.50
Antequera 476,365.50 595,439.41 1,071,804.91 592,004.00 740,004.72 1,332,008.72
Baclayon 1,118,810.49 1,382,371.27 2,501,181.76 977,120.93 1,196,560.38 2,173,681.31
Balilihan 480,027.42 599,870.30 1,079,897.72 567,426.22 709,144.21 1,276,570.43
Batuan 377,638.96 473,148.86 850,787.82 412,011.80 412,010.43 824,022.23
Bien Unido … … … 382,297.90 476,317.70 858,615.60
Bilar 674,636.59 606,687.85 1,281,324.44 576,948.07 721,131.63 1,298,079.70
Buenavista 968,528.17 1,159,642.75 2,128,170.92 487,281.44 609,101.81 1,096,383.25
Calape 1,000,931.30 1,251,164.18 2,252,095.48 822,166.53 1,027,697.95 1,849,864.48
Candijay 597,944.20 747,301.37 1,345,245.57 692,188.53 863,545.48 1,555,734.01
Carmen 3,065,737.37 3,829,951.61 6,895,688.98 1,251,001.01 1,563,751.27 2,814,752.28
Catigban 614,219.97 767,663.58 1,381,883.55 529,817.91 662,272.41 1,192,090.32
Clarin 357,998.54 447,498.17 805,496.71 431,679.94 539,599.93 971,279.87
Corella 441,408.38 551,773.18 993,181.56 295,646.85 369,290.06 664,936.91
Cortes 668,286.12 835,357.63 1,503,643.75 707,095.41 883,869.27 1,590,964.68
Dagohoy 815,923.23 1,019,661.88 1,835,585.11 680,415.32 850,470.90 1,530,886.22
Danao 251,170.92 313,963.66 565,134.58 508,991.97 636,239.97 1,145,231.94
Dauis 836,956.43 1,046,195.55 1,883,151.98 3,659,356.54 4,496,629.82 8,155,986.36
Dimiao 404,294.46 529,079.84 933,374.30 313,751.63 392,189.66 705,941.29
Duero 522,865.08 653,581.29 1,176,446.37 568,548.80 710,438.69 1,278,987.49
Garcia Hernandez 1,170,911.31 1,463,639.16 2,634,550.47 1,170,200.14 1,462,750.18 2,632,950.32
Getafe 456,013.20 570,016.50 1,026,029.70 455,611.60 569,514.50 1,025,126.10
Guindulman 682,473.32 853,091.57 1,535,564.89 741,315.28 926,644.40 1,667,959.68
Inabanga 1,002,748.08 1,244,461.62 2,247,209.70 559,359.39 696,401.95 1,255,761.34
Jagna 818,062.93 1,022,578.68 1,840,641.61 808,014.70 1,010,018.39 1,818,033.09
Lila 212,958.48 266,198.11 479,156.59 177,288.28 220,932.83 398,221.11
Loay 403,193.36 504,060.65 907,254.01 551,961.46 689,951.84 1,241,913.30
Loboc 583,389.08 729,236.36 1,312,625.44 532,472.50 665,590.63 1,198,063.13
Loon 681,237.71 851,547.15 1,532,784.86 695,133.56 868,931.96 1,564,065.52
Mabini 890,800.26 1,113,500.38 2,004,300.64 1,018,442.78 1,273,053.52 2,291,496.30
Maribojoc 495,419.28 618,974.08 1,114,393.36 573,048.50 716,216.83 1,289,265.33
Panglao 2,174,746.25 2,718,340.19 4,893,086.44 2,522,576.90 3,153,241.11 5,675,818.01
Pilar 1,234,800.56 1,543,500.71 2,778,301.27 1,489,637.37 1,863,031.09 3,352,668.46
Pres. Carlos P. Garcia (Pitogo) 385,237.10 481,546.39 866,783.49 448,337.94 560,347.57 1,008,685.51
Sagbayan (Borja) 437,122.33 1,004,636.04 1,441,758.37 399,442.88 499,303.61 898,746.49
San Isidro 474,415.53 593,019.43 1,067,434.96 315,076.50 393,845.62 708,922.12
San Miguel 979,443.64 1,224,304.55 2,203,748.19 736,897.29 921,121.61 1,658,018.90
Sevilla 685,101.56 856,842.39 1,541,943.95 712,209.34 890,118.23 1,602,327.57
Sierra Bullones 799,870.12 999,837.66 1,799,707.78 1,179,332.34 1,474,165.43 2,653,497.77
Sikatuna 511,999.49 569,526.29 1,081,525.78 274,072.06 337,630.64 611,702.70
Talibon 2,119,175.73 2,644,407.55 4,763,583.28 1,645,532.06 2,056,082.30 3,701,614.36
Trinidad 1,050,081.39 1,312,601.75 2,362,683.14 1,364,618.41 1,705,773.03 3,070,391.44
Tubigon 1,273,856.80 1,462,780.48 2,736,637.28 1,289,711.38 1,612,139.26 2,901,850.64
Ubay 2,074,580.26 2,593,225.33 4,667,805.59 2,546,340.80 3,182,926.02 5,729,266.82
Valencia 488,242.98 610,303.73 1,098,546.71 557,646.43 697,058.05 1,254,704.48
Cebu 62,861,587.50 78,745,967.49 141,607,554.99 71,611,175.15 88,022,789.63 159,633,964.78
Alcantara 192,703.94 240,879.87 433,583.81 440,176.69 550,220.90 990,397.59
Alcoy 1,343,207.77 1,679,009.72 3,022,217.49 941,729.09 1,177,161.38 2,118,890.47
Alegria 288,340.33 360,425.43 648,765.76 318,835.25 398,544.08 717,379.33
Aloguinsan 337,895.97 407,495.30 745,391.27 790,680.00 988,350.55 1,779,030.55
Argao 1,243,352.90 1,554,191.11 2,797,544.01 2,665,518.99 3,331,898.71 5,997,417.70
Asturias 1,031,305.09 1,286,656.96 2,317,962.05 3,349,665.76 3,695,271.95 7,044,937.71
Badian 452,155.27 564,860.95 1,017,016.22 477,937.71 593,421.63 1,071,359.34
Balamban 3,548,940.88 4,436,172.97 7,985,113.85 5,374,483.44 6,718,100.83 12,092,584.27
Bantayan 1,253,435.18 1,566,793.99 2,820,229.17 1,389,129.67 1,736,412.06 3,125,541.73
Barili 653,401.38 816,751.59 1,470,152.97 823,902.25 1,029,877.28 1,853,779.53
Bojoon 434,634.97 543,293.44 977,928.41 403,660.50 504,580.13 908,240.63
Borbon 620,921.45 776,151.81 1,397,073.26 721,881.74 744,716.10 1,466,597.84
Carmen 995,297.89 1,314,009.18 2,309,307.07 … … …
Catmon 570,161.77 712,702.23 1,282,864.00 422,352.30 527,940.38 950,292.68
Compostela 2,777,652.53 3,472,065.59 6,249,718.12 2,898,284.09 3,633,696.56 6,531,980.65
Souce: Bureau of Local Government Finance
2014
2014 TotalLGU Name/Municipality
2013
2013 Total
15-14

Table 15.9 - Continued
General FundSpecial
Education FundGeneral Fund
Special
Education Fund
CENTRAL VISAYAS
Bohol 40,018,663.30 50,088,817.28 90,107,480.58 43,549,282.65 54,350,008.36 97,899,291.01
Alburquerque 502,125.80 627,657.25 1,129,783.05 569,904.91 712,381.14 1,282,286.05
Alicia 673,443.88 841,804.85 1,515,248.73 778,426.90 973,033.63 1,751,460.53
Anda 461,414.95 576,768.69 1,038,183.64 423,774.00 529,717.50 953,491.50
Antequera 420,688.74 525,860.93 946,549.67 602,299.42 752,874.29 1,355,173.71
Baclayon 1,284,939.58 1,606,174.50 2,891,114.08 1,097,182.41 1,371,478.03 2,468,660.44
Balilihan 626,589.70 783,207.06 1,409,796.76 723,429.66 904,246.40 1,627,676.06
Batuan 384,219.35 484,490.80 868,710.15 376,486.66 470,600.86 847,087.52
Bien Unido 482,987.52 605,061.85 1,088,049.37 374,528.28 440,035.27 814,563.55
Bilar 583,500.47 729,375.60 1,312,876.07 629,686.34 785,607.93 1,415,294.27
Buenavista 376,242.93 470,303.66 846,546.59 384,040.32 480,050.42 864,090.74
Calape 951,538.66 1,189,423.33 2,140,961.99 1,038,281.82 1,297,852.28 2,336,134.10
Candijay 981,809.36 1,227,261.70 2,209,071.06 1,080,261.85 1,350,327.31 2,430,589.16
Carmen 1,925,124.50 2,406,405.62 4,331,530.12 2,161,801.57 2,702,251.98 4,864,053.55
Catigban 564,375.55 705,469.45 1,269,845.00 670,027.95 837,436.49 1,507,464.44
Clarin 422,055.09 527,568.86 949,623.95 408,362.00 510,452.50 918,814.50
Corella 374,152.83 467,691.04 841,843.87 363,871.50 454,839.38 818,710.88
Cortes 835,060.44 1,026,153.75 1,861,214.19 802,166.27 1,002,707.81 1,804,874.08
Dagohoy 986,915.68 1,259,083.38 2,245,999.06 1,590,926.75 1,934,206.21 3,525,132.96
Danao 363,667.62 454,584.51 818,252.13 461,999.48 577,499.35 1,039,498.83
Dauis 1,360,646.14 1,700,807.67 3,061,453.81 1,666,053.10 2,082,566.37 3,748,619.47
Dimiao 351,750.03 439,687.56 791,437.59 321,985.31 402,481.54 724,466.85
Duero 523,737.08 654,574.36 1,178,311.44 613,012.90 766,266.13 1,379,279.03
Garcia Hernandez 1,242,280.15 1,554,395.49 2,796,675.64 1,537,365.60 1,921,707.02 3,459,072.62
Getafe 718,520.07 898,150.10 1,616,670.17 542,323.29 677,904.11 1,220,227.40
Guindulman 1,235,150.50 1,543,943.01 2,779,093.51 861,896.99 1,077,360.76 1,939,257.75
Inabanga 717,503.65 890,148.59 1,607,652.24 693,849.86 866,156.31 1,560,006.17
Jagna 792,434.74 990,543.44 1,782,978.18 944,617.62 1,180,772.02 2,125,389.64
Lila 464,397.28 580,496.60 1,044,893.88 257,488.19 321,860.26 579,348.45
Loay 434,021.99 542,527.39 976,549.38 512,433.38 640,540.04 1,152,973.42
Loboc 545,424.98 681,781.22 1,227,206.20 760,445.18 950,556.47 1,711,001.65
Loon 831,998.14 1,039,997.69 1,871,995.83 690,615.43 863,269.34 1,553,884.77
Mabini 1,306,832.00 1,633,540.01 2,940,372.01 1,227,711.34 1,534,639.19 2,762,350.53
Maribojoc 402,439.35 502,962.05 905,401.40 539,274.85 673,813.00 1,213,087.85
Panglao 3,016,099.33 3,770,124.17 6,786,223.50 3,836,647.80 4,795,809.76 8,632,457.56
Pilar 1,329,845.31 1,662,306.63 2,992,151.94 1,257,620.09 1,572,025.10 2,829,645.19
Pres. Carlos P. Garcia (Pitogo) 417,320.00 521,649.99 938,969.99 480,739.12 600,923.93 1,081,663.05
Sagbayan (Borja) 593,309.58 804,798.73 1,398,108.31 679,976.99 849,971.24 1,529,948.23
San Isidro 362,571.43 453,214.30 815,785.73 369,563.72 461,954.28 831,518.00
San Miguel 700,454.34 875,568.23 1,576,022.57 761,701.67 952,127.08 1,713,828.75
Sevilla 728,842.26 910,884.93 1,639,727.19 617,141.72 771,295.89 1,388,437.61
Sierra Bullones 1,113,326.15 1,391,657.70 2,504,983.85 2,398,508.16 2,998,135.21 5,396,643.37
Sikatuna 316,304.54 390,421.24 706,725.78 416,030.89 520,038.61 936,069.50
Talibon 1,362,275.17 1,702,386.23 3,064,661.40 1,307,535.39 1,633,629.02 2,941,164.41
Trinidad 1,692,901.58 2,116,126.99 3,809,028.57 1,290,210.34 1,612,762.94 2,902,973.28
Tubigon 1,342,445.95 1,678,057.47 3,020,503.42 1,508,994.21 1,886,242.18 3,395,236.39
Ubay 2,239,898.73 2,799,868.44 5,039,767.17 2,337,956.33 2,922,445.42 5,260,401.75
Valencia 675,080.18 843,850.22 1,518,930.40 580,125.09 725,156.36 1,305,281.45
Cebu 79,670,373.64 101,111,910.06 180,782,283.70 85,321,621.76 106,593,735.10 191,915,356.86
Alcantara 282,221.67 294,151.88 576,373.55 255,540.13 319,425.18 574,965.31
Alcoy 1,419,802.98 1,774,753.69 3,194,556.67 353,743.81 442,093.10 795,836.91
Alegria 957,271.13 738,966.99 1,696,238.12 442,809.78 553,511.53 996,321.31
Aloguinsan 311,375.69 389,219.63 700,595.32 385,667.80 482,084.75 867,752.55
Argao 1,683,579.19 2,104,474.00 3,788,053.19 980,800.44 1,226,000.53 2,206,800.97
Asturias 1,395,358.93 1,704,281.06 3,099,639.99 1,326,953.79 1,658,691.52 2,985,645.31
Badian 711,407.09 894,929.14 1,606,336.23 559,127.13 697,882.27 1,257,009.40
Balamban 4,254,160.41 5,317,697.05 9,571,857.46 5,487,601.78 6,859,500.36 12,347,102.14
Bantayan 1,533,018.81 1,916,273.52 3,449,292.33 1,562,900.30 1,953,625.39 3,516,525.69
Barili 857,268.22 1,071,585.20 1,928,853.42 910,592.10 1,138,240.12 2,048,832.22
Bojoon 447,679.54 559,599.76 1,007,279.30 415,155.77 518,944.74 934,100.51
Borbon 1,024,078.34 791,197.43 1,815,275.77 605,504.49 756,880.62 1,362,385.11
Carmen 1,098,755.72 1,373,444.56 2,472,200.28 777,753.28 972,191.51 1,749,944.79
Catmon 528,356.42 578,244.77 1,106,601.19 609,545.85 761,932.33 1,371,478.18
Compostela 3,143,104.58 3,928,895.56 7,072,000.14 3,814,199.32 4,767,748.98 8,581,948.30
2016 Total
20162015
LGU Name/Municipality 2015 Total
15-15

Table 15.9 - Continued
General FundSpecial
Education FundGeneral Fund
Special
Education Fund
Consolacion 8,995,225.57 11,244,031.83 20,239,257.40 9,990,438.98 12,488,048.41 22,478,487.39
Cordova 1,909,426.19 2,410,913.97 4,320,340.16 … … …
Daanbantayan 903,142.58 1,128,922.47 2,032,065.05 1,027,575.66 1,290,823.89 2,318,399.55
Dalaguete 808,382.41 1,010,478.02 1,818,860.43 690,475.91 863,094.88 1,553,570.79
Dumanjug 900,162.20 1,125,202.76 2,025,364.96 988,606.67 1,235,758.33 2,224,365.00
Ginatilan 377,528.76 472,000.95 849,529.71 395,689.83 494,612.29 890,302.12
Liloan 10,855,222.87 13,568,263.32 24,423,486.19 11,420,162.97 14,249,235.71 25,669,398.68
Madridejos 505,407.32 631,756.51 1,137,163.83 383,638.19 479,545.28 863,183.47
Malabuyoc 230,124.49 287,655.63 517,780.12 297,643.05 372,053.83 669,696.88
Medellin 1,926,869.78 2,408,587.10 4,335,456.88 2,598,057.91 3,247,572.71 5,845,630.62
Minglanilla 4,399,510.00 5,499,387.50 9,898,897.50 4,668,321.60 5,835,402.01 10,503,723.61
Moalboal 846,351.76 1,057,939.71 1,904,291.47 1,069,825.96 1,337,282.46 2,407,108.42
Oslob 627,391.97 784,239.98 1,411,631.95 516,750.66 645,938.31 1,162,688.97
Pilar 212,186.13 264,551.14 476,737.27 203,017.58 253,771.76 456,789.34
Pinamungahan 502,877.08 628,596.36 1,131,473.44 933,019.50 1,166,310.83 2,099,330.33
Poro 478,266.90 597,833.63 1,076,100.53 398,351.03 497,938.79 896,289.82
Ronda 415,871.23 519,839.05 935,710.28 2,428,406.40 2,590,292.83 5,018,699.23
Samboan 365,567.90 456,959.91 822,527.81 388,945.04 486,431.18 875,376.22
San Fernando 3,923,223.26 4,820,868.20 8,744,091.46 4,774,949.46 5,968,686.83 10,743,636.29
San Francisco 573,480.56 716,850.71 1,290,331.27 592,064.10 740,080.13 1,332,144.23
San Remegio 1,070,464.47 1,338,076.66 2,408,541.13 1,760,510.67 2,051,898.73 3,812,409.40
Santa Fe 540,555.32 675,693.96 1,216,249.28 691,944.75 864,930.74 1,556,875.49
Santander 329,678.33 480,242.92 809,921.25 470,020.81 587,525.52 1,057,546.33
Sibonga 2,684,061.13 3,355,076.31 6,039,137.44 … … …
Sogod 789,973.41 1,098,342.03 1,888,315.44 1,704,052.06 1,460,472.74 3,164,524.80
Tabogon 595,842.17 744,802.72 1,340,644.89 484,628.79 1,029,322.22 1,513,951.01
Tabuelan 450,453.32 561,228.63 1,011,681.95 486,375.46 607,668.75 1,094,044.21
Tuburan 618,229.57 772,785.99 1,391,015.56 939,177.46 1,185,039.43 2,124,216.89
Tudela 282,703.50 353,379.38 636,082.88 290,287.17 362,858.50 653,145.67
Negros Oriental 23,014,981.38 24,294,113.83 47,309,095.21 24,233,247.46 30,220,364.41 54,453,611.87
Amlan 283,348.69 354,185.87 637,534.56 487,074.08 608,842.60 1,095,916.68
Ayungon 482,500.70 603,125.90 1,085,626.60 533,146.20 666,432.82 1,199,579.02
Bacong 1,633,817.87 2,042,272.31 3,676,090.18 1,742,719.39 2,178,400.71 3,921,120.10
Basay 219,129.62 273,532.21 492,661.83 281,581.43 351,913.05 633,494.48
Bindoy (Payabon) 235,762.33 295,348.15 531,110.48 526,893.74 658,459.05 1,185,352.79
Dauin 823,834.28 1,029,792.86 1,853,627.14 1,193,983.49 1,432,115.11 2,626,098.60
Jimalalud 206,799.69 258,499.54 465,299.23 237,997.88 297,497.28 535,495.16
La Libertad 230,277.80 287,847.26 518,125.06 228,900.83 286,126.05 515,026.88
Mabinay 669,833.46 825,230.64 1,495,064.10 588,404.23 722,260.96 1,310,665.19
Manjuyod 2,077,318.86 2,596,603.33 4,673,922.19 2,368,974.21 2,961,234.78 5,330,208.99
Pamplona 558,062.26 697,057.52 1,255,119.78 572,594.59 715,494.29 1,288,088.88
San Jose 336,887.73 416,299.02 753,186.75 251,748.44 314,629.65 566,378.09
Santa Catalina 1,008,162.89 1,260,190.50 2,268,353.39 961,550.70 1,201,937.65 2,163,488.35
Siaton 695,584.27 867,272.33 1,562,856.60 605,567.64 754,535.17 1,360,102.81
Sibulan 1,638,779.85 2,048,474.82 3,687,254.67 1,680,974.87 2,101,218.60 3,782,193.47
Tayasan 214,357.83 267,923.08 482,280.91 238,395.78 297,591.27 535,987.05
Valencia ( Luzurriaga) 10,865,306.41 9,126,337.04 19,991,643.45 10,918,898.85 13,648,623.58 24,567,522.43
Vallehermoso 242,614.80 303,229.55 545,844.35 207,039.83 258,645.32 465,685.15
Zamboanguita 592,602.04 740,891.90 1,333,493.94 606,801.28 764,406.47 1,371,207.75
Siquijor 2,209,109.17 2,747,915.07 4,957,024.24 3,339,528.90 4,139,649.91 7,479,178.81
Enrique Villanueva 114,193.58 142,741.97 256,935.55 151,437.84 189,297.30 340,735.14
Larena 368,204.20 460,255.26 828,459.46 675,466.53 844,333.16 1,519,799.69
Lazi 708,255.58 872,799.92 1,581,055.50 1,015,066.89 1,237,499.13 2,252,566.02
Maria 190,466.55 238,083.19 428,549.74 346,956.14 433,695.16 780,651.30
San Juan 321,138.37 400,471.88 721,610.25 448,857.46 557,646.10 1,006,503.56
Siquijor 506,850.89 633,562.85 1,140,413.74 701,744.04 877,179.06 1,578,923.10
2013
2013 Total
2014
2014 TotalLGU Name/Municipality
15-16

Table 15.9 - Continued
General FundSpecial
Education FundGeneral Fund
Special
Education Fund
Consolacion 10,227,959.85 12,784,949.59 23,012,909.44 11,266,244.59 14,084,305.63 25,350,550.22
Cordova 5,247,174.76 6,558,968.01 11,806,142.77 3,266,619.64 4,033,274.49 7,299,894.13
Daanbantayan 1,036,211.22 1,295,261.89 2,331,473.11 1,173,246.49 1,466,557.32 2,639,803.81
Dalaguete 777,628.99 972,036.24 1,749,665.23 730,297.78 912,872.22 1,643,170.00
Dumanjug 689,293.34 861,616.69 1,550,910.03 1,016,061.54 1,270,076.94 2,286,138.48
Ginatilan 413,911.82 508,181.18 922,093.00 386,748.46 483,411.40 870,159.86
Liloan 12,161,769.88 15,234,400.14 27,396,170.02 15,032,524.11 18,809,990.29 33,842,514.40
Madridejos 516,506.08 645,631.89 1,162,137.97 430,841.61 538,551.99 969,393.60
Malabuyoc 265,488.12 331,860.31 597,348.43 304,417.19 380,521.50 684,938.69
Medellin 1,717,284.57 2,146,605.51 3,863,890.08 1,224,951.99 1,531,189.99 2,756,141.98
Minglanilla 6,972,201.76 8,715,252.32 15,687,454.08 9,479,978.46 11,849,973.12 21,329,951.58
Moalboal 1,372,521.05 1,715,651.32 3,088,172.37 1,276,407.68 1,595,509.61 2,871,917.29
Oslob 554,568.80 693,211.00 1,247,779.80 660,514.66 825,643.32 1,486,157.98
Pilar 319,521.95 399,402.16 718,924.11 347,489.44 434,361.67 781,851.11
Pinamungahan 739,391.16 917,665.48 1,657,056.64 655,225.04 818,734.06 1,473,959.10
Poro 491,259.11 614,073.90 1,105,333.01 512,794.80 640,993.51 1,153,788.31
Ronda 387,789.48 484,736.86 872,526.34 485,710.34 607,137.94 1,092,848.28
Samboan 396,428.43 495,339.41 891,767.84 397,446.46 496,662.83 894,109.29
San Fernando 6,010,081.41 7,512,583.65 13,522,665.06 7,277,315.20 9,096,643.97 16,373,959.17
San Francisco 820,381.64 1,025,477.06 1,845,858.70 1,015,090.03 1,268,862.54 2,283,952.57
San Remegio 1,306,383.79 4,272,855.27 5,579,239.06 3,325,915.48 3,601,979.12 6,927,894.60
Santa Fe 745,521.86 932,473.60 1,677,995.46 729,653.17 912,066.32 1,641,719.49
Santander 654,955.35 818,694.18 1,473,649.53 442,410.72 569,607.25 1,012,017.97
Sibonga 2,852,032.90 3,565,042.06 6,417,074.96 1,987,338.31 2,484,172.87 4,471,511.18
Sogod 841,438.13 1,051,797.62 1,893,235.75 1,010,868.05 1,395,855.38 2,406,723.43
Tabogon 567,107.29 730,320.07 1,297,427.36 595,855.30 1,121,578.48 1,717,433.78
Tabuelan 566,407.07 677,756.47 1,244,163.54 391,485.66 491,606.63 883,092.29
Tuburan 1,031,738.23 1,289,673.01 2,321,411.24 1,084,301.29 1,355,376.16 2,439,677.45
Tudela 339,976.88 422,678.93 762,655.81 325,972.50 407,465.62 733,438.12
Negros Oriental 30,684,853.96 37,891,714.85 68,576,568.81 22,379,845.19 27,674,812.91 50,054,658.10
Amlan 414,532.79 439,799.26 854,332.05 618,569.34 773,211.70 1,391,781.04
Ayungon 547,471.02 678,695.83 1,226,166.85 606,706.69 758,383.37 1,365,090.06
Bacong 1,866,765.10 2,333,456.34 4,200,221.44 1,668,575.69 1,985,929.71 3,654,505.40
Basay 234,939.65 293,657.02 528,596.67 278,013.41 346,790.21 624,803.62
Bindoy (Payabon) 614,405.46 765,807.34 1,380,212.80 499,678.54 622,380.07 1,122,058.61
Dauin 1,161,469.58 1,451,836.97 2,613,306.55 1,211,898.62 1,514,873.28 2,726,771.90
Jimalalud 224,850.16 281,062.10 505,912.26 297,412.35 371,755.40 669,167.75
La Libertad 255,148.51 318,935.56 574,084.07 235,204.71 294,005.91 529,210.62
Mabinay 806,171.76 1,009,096.76 1,815,268.52 826,905.94 1,035,495.21 1,862,401.15
Manjuyod 2,228,317.36 2,784,445.90 5,012,763.26 2,212,400.92 2,760,496.48 4,972,897.40
Pamplona 1,498,903.39 1,498,620.46 2,997,523.85 1,150,882.34 1,248,193.26 2,399,075.60
San Jose 338,499.65 423,124.58 761,624.23 309,900.29 387,375.37 697,275.66
Santa Catalina 1,007,747.19 1,259,684.90 2,267,432.09 1,164,234.71 1,455,292.53 2,619,527.24
Siaton 651,461.85 810,934.88 1,462,396.73 641,880.49 800,110.81 1,441,991.30
Sibulan 2,270,414.44 2,838,018.05 5,108,432.49 2,030,061.37 2,537,576.71 4,567,638.08
Tayasan 224,964.49 280,705.66 505,670.15 220,899.73 274,667.93 495,567.66
Valencia ( Luzurriaga) 15,192,162.48 18,990,203.10 34,182,365.58 7,575,527.40 9,469,409.26 17,044,936.66
Vallehermoso 448,563.22 560,594.75 1,009,157.97 150,766.63 188,458.16 339,224.79
Zamboanguita 698,065.86 873,035.39 1,571,101.25 680,326.02 850,407.54 1,530,733.56
Siquijor 4,176,918.28 5,180,797.72 9,357,716.00 4,359,751.84 6,344,230.05 10,703,981.89
Enrique Villanueva 230,666.52 288,333.15 518,999.67 176,769.51 220,961.71 397,731.22
Larena 564,000.10 705,000.12 1,269,000.22 741,698.98 927,123.74 1,668,822.72
Lazi 1,768,528.91 2,169,834.69 3,938,363.60 1,080,421.48 2,248,401.11 3,328,822.59
Maria 339,455.04 424,318.82 763,773.86 375,654.11 469,592.63 845,246.74
San Juan 536,919.02 671,625.74 1,208,544.76 835,417.42 1,040,913.95 1,876,331.37
Siquijor 737,348.69 921,685.20 1,659,033.89 1,149,790.34 1,437,236.91 2,587,027.25
2016 Total
2015
LGU Name/Municipality
2016
2015 Total
15-17

Table 15.10
INCOME CLASSIFICATION BY PROVINCE
Updated as of June 29, 2018
CENTRAL VISAYAS
Bohol 1st
Cebu 1st
Negros Oriental 1st
Siquijor 5th
Note: Per Department of Finance Order No. 23-08, dated July 29, 2008
Source: Bureau of Local Government Finance
Table 15.11
INCOME CLASSIFICATION BY CITY
Updated as of May 04, 2015
CENTRAL VISAYAS
Bais City 3rd
Bayawan City (Tulong) 2nd
Bogo City 6th
Canlaon City 4th
Carcar City 5th
Cebu City 1st
Danao City 3rd
Dumaguete City 3rd
Guihulngan City 5th
Lapu-Lapu City 1st
Mandaue City 1st
Naga City (Cebu) 5th
Tagbilaran City 3rd
Talisay City (Cebu) 3rd
Tanjay City 4th
Toledo City 3rd
Note: Per Department of Finance Order No. 23-08, dated July 29, 2008
Source: Bureau of Local Government Finance
LGU Name/Province Income Classification
LGU Name/Province Income Classification
15-18

Table 15.12
INCOME CLASSIFICATION BY MUNICIPALITY
Updated as of May 4, 2016
CENTRAL VISAYAS Pres. Carlos P. Garcia 4th
Sagbayan (Borja) 4th
Bohol San Isidro 5th*
Alburquerque 5th San Miguel 4th
Alicia 4th Sevilla 5th
Anda 5th Sierra Bullones 3rd
Antequera 4th Sikatuna 5th
Baclayon 4th Pres. Carlos P. Garcia 1st
Balilihan 4th Trinidad 3rd
Batuan 5th Tubigon 1st
Bien Unido 4th Ubay 1st
Bilar 4th Valencia 4th
Buenavista 4th
Calape 3rd Cebu
Candijay 4th Alcantara 5th
Carmen 1st Alcoy 5th
Catigban 4th Alegria 4th
Clarin 5th Aloguinsan 4th
Corella 5th Argao 1st
Cortes 5th Asturias 3rd
Dagohoy 5th Badian 3rd
Danao 4th* Balamban 1st
Dauis 4th Bantayan 1st
Dimiao 4th Barili 2nd
Duero 4th Bojoon 5th
Garcia Hernandez 4th Borbon 4th*
Getafe 3rd Carmen 3rd
Guindulman 4th Catmon 4th
Inabanga 3rd Compostela 3rd
Jagna 3rd Consolacion 1st
Lila 5th Cordova 3rd
Loay 5th Daanbantayan 1st
Loboc 4th Dalaguete 1st
Loon 2nd Dumanjug 3rd
Mabini 4th Ginatilan 5th
Maribojoc 4th Liloan 1st
Panglao 4th Madridejos 4th
Pilar 4th Malabuyoc 5th
* - not re-classified under Department Order No.
23-08 due to incomplete income data but the
classification as stated is taken from the latest
re-classification preceding this reclass.
Note: Per Department of Finance Order No. 23-08,
dated July 29, 2008
Source: Bureau of Local Government Finance
LGU Name/MunicipalityIncome
ClassificationLGU Name/Municipality
Income
Classification
15-19

Table 15.12 - Continued
Medellin 2nd Vallehermoso 3rd
Minglanilla 1st Zamboanguita 4th
Moalboal 4th
Oslob 4th Siquijor
Pilar 5th Enrique Villanueva 5th
Pinamungahan 2nd Larena 5th
Poro 4th Lazi 4th
Ronda 5th* Maria 5th
Samboan 5th San Juan 5th
San Fernando 2nd Siquijor 4th
San Francisco 3rd
San Remegio 3rd
Santa Fe 4th
Santander 4th
Sibonga 3rd
Sogod 4th*
Tabogon 3rd
Tabuelan 4th
Tuburan 2nd
Tudela 5th
Negros Oriental
Amlan 4th
Ayungon 2nd
Bacong 4th
Basay 4th
Bindoy (Payabon) 3rd
Dauin 4th
Jimalalud 4th
La Libertad 3rd
Mabinay 1st
Manjuyod 2nd
Pamplona 3rd
San Jose 5th
Santa Catalina 1st
Siaton 1st
Sibulan 2nd
Tayasan 3rd
Valencia ( Luzurriaga) 1st
LGU Name/MunicipalityIncome
ClassificationLGU Name/Municipality
Income
Classification
15-20

Table 15.13
LOCAL COLLECTIONS OF LOCAL GOVERNMENT UNITS, BY PROVINCE
2014-2017
(In Million Pesos)
2014 2015 2016 2017
CENTRAL VISAYAS
Provinces
Local Sources 999.65 1,214.62 1,322.46 1,485.64
Tax Revenue
Real Property Tax 271.90 298.51 319.43 381.52
Business Tax 53.24 62.66 67.65 62.12
Other Local Taxes 33.01 38.98 39.85 66.05
Total Tax Revenue 358.14 400.14 426.94 509.69
Non Tax Revenue
Regulatory Fees 9.91 10.76 17.64 34.68
Service Income 355.56 463.54 668.74 738.49
Business Income 203.56 262.13 100.72 106.72
Other Income/ Receipts 72.48 78.05 108.42 96.06
Total Non Tax Revenue 641.51 814.48 895.52 975.95
External Sources: 5,067.43 5,936.98 6,275.66 6905.94
Internal Revenue Allotment 4,919.17 5,602.15 6,111.35 6888.93
Other Share from National Tax Collection 14.07 15.64 15.64 16.10
Extraordinary Receipts 13.99 4.48 68.21 0.92
Extraordinary Gains and Premiums - - - -
Inter-local Transfer 7.83 - - -
Capital/Investment Receipts 0.05 2.81 0.11
Receipts from Loans and Borrowings 112.33 311.89 80.35 84.71
TOTAL RECEIPTS 6,067.08 7,151.60 7,598.12 8,476.30
Bohol
Province
Local Sources 152.24 186.59 297.64 354.21
Tax Revenue
Real Property Tax 76.93 81.61 90.69 119.71
Business Tax 4.67 5.40 5.89 6.29
Other Local Taxes 4.34 5.24 4.40 13.73
Total Tax Revenue 85.94 92.25 100.97 139.74
Non Tax Revenue
Regulatory Fees - - - -
Service Income 119.45 151.87 148.73 162.97
Business Income - - - -
Other Income/ Receipts 28.44 29.48 47.94 51.50
Total Non Tax Revenue 147.90 181.35 196.67 214.47
External Sources: 1,241.80 1,421.33 1,551.55 1717.53
Internal Revenue Allotment 1,239.82 1,419.22 1,549.24 1713.52
Other Share from National Tax Collection 1.98 2.11 2.31 4.01
Extraordinary Receipts - - - -
Extraordinary Gains and Premiums - - - -
Inter-local Transfer - - - -
Capital/Investment Receipts - - - -
Receipts from Loans and Borrowings - - - -
TOTAL RECEIPTS 1,475.63 1,694.94 1,849.19 2,071.74
Source: Bureau of Local Government Finance
Local Government Unit/ Particulars
15-21

Table 15.13 - Continued
2014 2015 2016 2017
Cebu
Province
Local Sources 497.38 575.74 661.70 721.54
Tax Revenue
Real Property Tax 145.06 161.08 174.10 185.30
Business Tax 46.49 54.70 59.16 51.48
Other Local Taxes 24.77 29.57 29.98 41.23
Total Tax Revenue 216.32 245.34 263.24 278.01
Non Tax Revenue
Regulatory Fees 7.33 5.88 11.81 27.00
Service Income 160.11 203.89 262.61 302.01
Business Income 82.26 86.08 91.64 93.08
Other Income/ Receipts 31.36 34.54 32.40 21.44
Total Non Tax Revenue 281.06 330.39 398.46 443.53
External Sources: 2917.25
Internal Revenue Allotment 2,033.32 2,312.70 2,524.20 2911.10
Other Share from National Tax Collection 6.34 6.13 6.53 5.46
Extraordinary Receipts 8.88 4.01 67.87 0.69
Extraordinary Gains and Premiums - - - -
Inter-local Transfer 7.83 - -
Capital/Investment Receipts 0.05 2.81 0.11
Receipts from Loans and Borrowings 59.74 101.34 - 81.00
TOTAL RECEIPTS 2,613.54 3,002.73 3,260.39 3,719.79
Negros Oriental
Province
Local Sources 241.28 321.60 311.66 348.03
Tax Revenue
Real Property Tax 42.77 48.86 46.39 66.16
Business Tax 1.59 1.97 2.16 3.74
Other Local Taxes 3.71 3.84 5.28 10.74
Total Tax Revenue 48.07 54.68 53.82 80.64
Non Tax Revenue
Regulatory Fees 2.38 4.67 5.67 7.54
Service Income 64.56 83.49 226.58 238.35
Business Income 115.75 167.77 - -
Other Income/ Receipts 10.53 10.99 25.59 21.49
Total Non Tax Revenue 193.21 266.92 257.84 267.39
External Sources: 1819.29
Internal Revenue Allotment 1,319.25 1,499.22 1,634.92 1812.85
Other Share from National Tax Collection 5.55 7.26 6.67 6.43
Extraordinary Receipts 5.00 - - -
Extraordinary Gains and Premiums - - - -
Inter-local Transfer - - - -
Capital/Investment Receipts - - - -
Receipts from Loans and Borrowings 52.58 210.55 80.35 3.71
TOTAL RECEIPTS 1,623.66 2,038.63 2,033.60 2,171.02
Local Government Unit/ Particulars
15-22

Table 15.13 - Continued
2014 2015 2016 2017
Siquijor
Province
Local Sources 27.16 43.69 51.46 61.86
Tax Revenue
Real Property Tax 7.13 6.95 8.26 10.34
Business Tax 0.49 0.59 0.45 0.61
Other Local Taxes 0.19 0.34 0.19 0.35
Total Tax Revenue 7.82 7.88 8.90 11.30
Non Tax Revenue
Regulatory Fees 0.20 0.21 0.16 0.34
Service Income 11.44 24.28 30.82 35.16
Business Income 5.55 8.28 9.08 13.64
Other Income/ Receipts 2.15 3.04 2.50 1.62
Total Non Tax Revenue 19.34 35.81 42.56 50.56
External Sources: 451.88
Internal Revenue Allotment 326.78 371.02 402.99 451.46
Other Share from National Tax Collection 0.20 0.13 0.14 0.19
Extraordinary Receipts 0.11 0.47 0.34 0.23
Extraordinary Gains and Premiums - - - -
Inter-local Transfer - - - -
Capital/Investment Receipts - - - -
Receipts from Loans and Borrowings - - - -
TOTAL RECEIPTS 354.25 415.30 454.93 513.74
Local Government Unit/ Particulars
15-23

Table 15.14
STATEMENT OF EXPENDITURES OF LOCAL GOVERNMENT UNITS BY PROVINCE
2014-2017
(In Million Pesos)
2014 2015 2016 2017
CENTRAL VISAYAS 4,107.80 4,642.15 4,758.27 5,564.35
General Services 1,919.53 2,511.51 2,327.82 2,584.07
Economic Services 655.95 647.91 712.39 823.07
Social Services 1,528.13 1,477.13 1714.08 2142.96
Others 4.19 5.61 3.98 14.23
Bohol 1,037.71 1,245.67 1,021.82 1,421.04
General Services 409.53 708.66 393.35 535.92
Economic Services 166.21 158.95 137.69 266.19
Social Services 460.99 372.57 486.86 618.93
Others 0.98 5.49 3.92 -
Cebu 1,881.25 2,190.53 2,519.83 2,693.02
General Services 1,056.73 1,329.43 1,503.36 1,649.70
Economic Services 278.54 297.58 367.09 308.03
Social Services 545.98 563.52 649.38 735.14
Others - - - 0.15
Negros Oriental 978.43 1,058.79 1,054.79 1,178.55
General Services 376.30 407.76 376.78 304.23
Economic Services 156.77 159.60 175.54 192.98
Social Services 442.54 491.42 502.48 667.26
Others 2.81 - - 14.08
Siquijor 210.42 147.16 161.83 271.74
General Services 76.97 65.65 54.34 94.22
Economic Services 54.43 31.78 32.07 55.88
Social Services 78.61 49.62 75.37 121.64
Others 0.40 0.11 0.05 -
Source: Bureau of Local Government Finance
LGU/ Particulars
15-24

Table 15.15
SUMMARY OF RECEIPTS AND EXPENDITURES OF LGUs BY PROVINCE
2013-2017
(In Million Pesos)
2013 2014 2015 20162017
(Preliminary)
CENTRAL VISAYAS
Total Financial Resources 7,322.30 8,721.65 10,748.32 13,082.69 15,238.93
Total Receipts 5,627.85 6,067.08 7,151.60 7,832.04 8,952.31
Beginning Balance 1,694.45 2,654.56 3,596.71 5,250.65 6,286.61
Total Expenditures 4,058.24 4,107.80 4,642.15 4,758.27 5,564.33
Ending Balance 1,982.69 3,597.00 4,694.14 6,345.78 7,633.41
Bohol
Total Financial Resources 1,304.71 2,265.15 2,535.40 3,256.17 3,663.51
Total Receipts 1,292.76 1,475.63 1,694.94 1,849.19 2,071.74
Beginning Balance 11.95 789.51 840.46 1,406.98 1,591.77
Total Expenditures 953.60 1,037.71 1,245.67 1,021.82 1,421.04
Ending Balance 306.87 840.46 850.47 1,650.93 1,773.05
Cebu
Total Financial Resources 2,967.30 3,263.46 4,222.39 5,298.89 6,257.35
Total Receipts 2,531.26 2,613.54 3,002.73 3,397.74 4,084.42
Beginning Balance 436.04 649.92 1,219.66 1,901.15 2,172.93
Total Expenditures 1,892.67 1,881.25 2,190.53 2,519.83 2,693.01
Ending Balance 643.16 1,219.66 1,901.15 2,172.93 2,750.94
Negros Oriental
Total Financial Resources 2,488.39 2,603.92 3,238.11 3,536.86 4,232.72
Total Receipts 1,451.93 1,623.66 2,038.63 2,033.61 2,258.97
Beginning Balance 1,036.45 980.27 1,199.48 1,503.25 1,973.75
Total Expenditures 965.49 978.43 1,058.79 1,054.79 1,178.54
Ending Balance 799.44 1,199.48 1,503.25 1,973.75 2,447.76
Siquijor
Total Financial Resources 561.91 589.12 752.42 990.77 1085.35
Total Receipts 351.90 354.25 415.30 551.50 537.18
Beginning Balance 210.01 234.87 337.11 439.27 548.17
Total Expenditures 246.48 210.42 147.16 161.83 271.74
Ending Balance 233.21 337.40 439.27 548.17 661.67
Source: Bureau of Local Government Finance
Province/ Particulars
15-25

BANK Chapter 16
MONEY and BANKING
Data pertaining to the operations of financial institutions provide indicators of the area’s
economy. The growth in the number of banking institutions operating in a certain locality gives
insights on the pace at which business and trade grows. Data on loans granted by banks provide a picture of the level and nature of investments put up over time. Statistics on loans outstanding of
financial institutions, on the other hand, serve as signals of the rate of turnover of investments. The money and banking sector plays a vital role in the development of productive activities by proprietors or corporate institutions in the area. The presence and accessibility of establishments
providing these services to existing and prospective investors contribute to the realization of programs and projects aimed at industrial and entrepreneurial advancement.
This chapter presents data on the number of offices of the financial system in the region, outstanding loans of financial institutions and loans granted by banks. The source of data is the
Bangko Sentral ng Pilipinas (BSP).
Highlights
• In 2016, a total of 18 offices were added to the banking system in the region bringing the total to 720. The universal and commercial banks as well as the rural and cooperative banks had increased in number of offices while thrift banks decreased.
• Total deposit of banking institutions in the region reached 582.73 billion pesos as of end of December 2017, which grew by 6.23 percent. All institutional groups recorded increases in deposit liabilities.
• The loan portfolio of banking offices in the region increased by 16.42 percent from 222.50 billion pesos to 265.62 billion pesos in 2017.

ContentsHighlights 16-1
STATISTICAL TABLES:
Table 16.1 Regional Distribution of Banking Offices: 2011- 2016 ...……………………….. 16-3
Table 16.2 Number of Banking Offices by Institutional Group in Central Visayas
2011 - 2016 ..…………………………………………………………………………………. 16-9
Table 16.3 Number of Banking Offices by Province in Central Visayas
2011-2016 ...…………………………………………………………………………………… 16-9
Table 16.4 Banking Statistics: Loans and Receivables-Others, Net by
Institutional Group: 2012-2017 ...………………………………………………………. 16-10
Table 16.5 Banking Statistics: Loans and Receivables-Others, Net by Province
2011-2016 ...…………………………………………………………………………………… 16-10
Table 16.6 Banking Statistics: Total Assets by Province: 2011-2016 …..………………….. 16-11
Table 16.7 Banking Statistics: Total Operating Expense by Province: 2011-2016 …..… 16-11
Table 16.8 Banking Statistics: Total Operating Income by Province: 2011-2016 …..…. 16-11
Table 16.9 Banking Statistics: Total Interest Expense by Province: 2011-2016 …..…… 16-12
Table 16.10 Banking Statistics: Total Interest Income by Province: 2011-2016 …..……. 16-12
Table 16.11 Banking Statistics: Deposit Liabilities by Province: 2011-2016 ...…………….. 16-12
Table 16.12 Banking Statistics: Deposit Liabilities by Institutional Group
2013-2017 ..……………………………………………………………………………………. 16-13
FIGURES:
Figure 16.1 Number of Banking Offices by Institutional Group
Central Visayas: 2012-2016 ...…………………………………………………………… 16-9
Figure 16.2 Distribution of Loan Portfolio by Institutional Group
Central Visayas: 2016 ….…………………………………………………………………… 16-10
Figure 16.3 Deposit Liabilities by Institutional Group
Central Visayas:2013-2017 ...………………………………………………………...….. 16-13
16-2

Table 16.1
REGIONAL DISTRIBUTION OF BANKING OFFICES
2011-2016
TotalHead
Office
Other
OfficesTotal
Head
Office
Other
Offices
TOTAL BANKING SYSTEM
National Capital Region (NCR) 2,892 88 2,804 2,993 84 2,909
Region I (Ilocos Region) 401 50 351 413 45 368
Region II (Cagayan Valley) 272 34 238 286 34 252
Region III (Central Luzon) 940 96 844 975 94 881
Region IV-A (CALABARZON) 1,350 135 1,215 1,406 128 1,278
Region IV-B (MIMAROPA) 189 25 164 206 24 182
Region V (Bicol Region) 281 34 247 315 34 281
Region VI (Western Visayas)1/
531 67 464 543 61 482
Region VII (Central Visayas)2/
584 46 538 627 47 580
Region VIII (Eastern Visayas) 172 25 147 174 23 151
Region IX (Zamboanga Peninsula) 181 16 165 190 17 173
Region X (Northern Mindanao) 328 39 289 328 36 292
Region XI (Davao Region) 338 16 322 355 16 339
Region XII (SOCCSKSARGEN) 192 15 177 195 14 181
Region XIII (Caraga) 199 19 180 201 18 183
Cordillera Administrative Region (CAR) 146 19 127 148 19 129
Autonomous Region in Muslim Mindanao (ARMM) 19 2 17 20 2 18
Nationwide 9,015 726 8,289 9,375 696 8,679
UNIVERSAL AND COMMERCIAL BANKS
National Capital Region (NCR) 2,273 37 2,236 2,400 36 2,364
Region I (Ilocos Region) 164 - 164 172 - 172
Region II (Cagayan Valley) 87 - 87 95 - 95
Region III (Central Luzon) 403 - 403 432 - 432
Region IV-A (CALABARZON) 521 - 521 553 - 553
Region IV-B (MIMAROPA) 44 - 44 53 - 53
Region V (Bicol Region) 102 - 102 111 - 111
Region VI (Western Visayas)1/
243 - 243 250 - 250
Region VII (Central Visayas)2/
309 - 309 337 - 337
Region VIII (Eastern Visayas) 82 - 82 86 - 86
Region IX (Zamboanga Peninsula) 86 1 85 89 1 88
Region X (Northern Mindanao) 127 - 127 131 - 131
Region XI (Davao Region) 162 - 162 171 - 171
Region XII (SOCCSKSARGEN) 100 - 100 104 - 104
Region XIII (Caraga) 43 - 43 46 - 46
Cordillera Administrative Region (CAR) 60 - 60 63 - 63
Autonomous Region in Muslim Mindanao (ARMM) 16 - 16 17 - 17
Nationwide 4,822 38 4,784 5,110 37 5,073
1/ Data includes Negros Occidental
2/ Data includes Negros Oriental
Source: Supervisory Data Center, Bangko Sentral ng Pilipinas
Particulars
2011 2012
16-3

Table 16.1 - Continued
TotalHead
Office
Other
OfficesTotal
Head
Office
Other
Offices
THRIFT BANKS
National Capital Region (NCR) 532 30 502 515 29 486
Region I (Ilocos Region) 59 1 58 64 1 63
Region II (Cagayan Valley) 42 2 40 43 2 41
Region III (Central Luzon) 171 10 161 178 9 169
Region IV-A (CALABARZON) 274 12 262 317 12 305
Region IV-B (MIMAROPA) 29 2 27 37 2 35
Region V (Bicol Region) 40 1 39 48 1 47
Region VI (Western Visayas)1/
80 5 75 97 5 92
Region VII (Central Visayas)2/
114 6 108 122 6 116
Region VIII (Eastern Visayas) 21 - 21 25 - 25
Region IX (Zamboanga Peninsula) 17 - 17 19 - 19
Region X (Northern Mindanao) 36 - 36 40 - 40
Region XI (Davao Region) 37 1 36 54 1 53
Region XII (SOCCSKSARGEN) 20 1 19 24 1 23
Region XIII (Caraga) 8 - 8 24 1 23
Cordillera Administrative Region (CAR) 10 - 10 11 - 11
Autonomous Region in Muslim Mindanao (ARMM) 1 - 1 1 - 1
Nationwide 1,491 71 1,420 1,619 70 1,549
RURAL AND COOPERATIVE BANKS
National Capital Region (NCR) 87 21 66 78 19 59
Region I (Ilocos Region) 178 49 129 177 44 133
Region II (Cagayan Valley) 143 32 111 148 32 116
Region III (Central Luzon) 366 86 280 365 85 280
Region IV-A (CALABARZON) 555 123 432 536 116 420
Region IV-B (MIMAROPA) 116 23 93 116 22 94
Region V (Bicol Region) 139 33 106 156 33 123
Region VI (Western Visayas)1/
208 62 146 196 56 140
Region VII (Central Visayas)2/
161 40 121 168 41 127
Region VIII (Eastern Visayas) 69 25 44 63 23 40
Region IX (Zamboanga Peninsula) 78 15 63 82 16 66
Region X (Northern Mindanao) 165 39 126 157 36 121
Region XI (Davao Region) 139 15 124 130 15 115
Region XII (SOCCSKSARGEN) 72 14 58 67 13 54
Region XIII (Caraga) 148 19 129 131 17 114
Cordillera Administrative Region (CAR) 76 19 57 74 19 55
Autonomous Region in Muslim Mindanao (ARMM) 2 2 2 2 -
Nationwide 2,702 617 2,085 2,646 589 2,057
Particulars
2011 2012
16-4

Table 16.1 - Continued
TotalHead
Office
Other
OfficesTotal
Head
Office
Other
Offices
TOTAL BANKING SYSTEM
National Capital Region (NCR) 3,141 83 3,058 3,275 83 3,192
Region I (Ilocos Region) 436 45 391 456 43 413
Region II (Cagayan Valley) 310 34 276 329 33 296
Region III (Central Luzon) 998 92 906 1,033 87 946
Region IV-A (CALABARZON) 1,509 124 1,385 1,566 119 1,447
Region IV-B (MIMAROPA) 220 24 196 234 24 210
Region V (Bicol Region) 353 33 320 380 31 349
Region VI (Western Visayas)1/
572 59 513 600 58 542
Region VII (Central Visayas)2/
653 46 607 683 46 637
Region VIII (Eastern Visayas) 183 20 163 186 16 170
Region IX (Zamboanga Peninsula) 199 17 182 201 16 185
Region X (Northern Mindanao) 347 34 313 368 33 335
Region XI (Davao Region) 388 14 374 396 13 383
Region XII (SOCCSKSARGEN) 197 12 185 214 12 202
Region XIII (Caraga) 207 16 191 218 14 204
Cordillera Administrative Region (CAR) 150 18 132 155 18 137
Autonomous Region in Muslim Mindanao (ARMM) 21 2 19 21 2 19
Nationwide 9,884 673 9,211 10,315 648 9,667
UNIVERSAL AND COMMERCIAL BANKS
National Capital Region (NCR) 2,515 35 2,480 2,644 35 2,609
Region I (Ilocos Region) 184 - 184 201 - 201
Region II (Cagayan Valley) 102 - 102 109 - 109
Region III (Central Luzon) 457 - 457 490 - 490
Region IV-A (CALABARZON) 584 - 584 627 - 627
Region IV-B (MIMAROPA) 63 - 63 67 - 67
Region V (Bicol Region) 120 - 120 134 - 134
Region VI (Western Visayas)1/
265 - 265 282 - 282
Region VII (Central Visayas)2/
358 - 358 389 - 389
Region VIII (Eastern Visayas) 95 - 95 105 - 105
Region IX (Zamboanga Peninsula) 95 1 94 98 1 97
Region X (Northern Mindanao) 142 - 142 154 - 154
Region XI (Davao Region) 193 - 193 213 - 213
Region XII (SOCCSKSARGEN) 106 - 106 117 - 117
Region XIII (Caraga) 50 - 50 73 - 73
Cordillera Administrative Region (CAR) 64 - 64 67 - 67
Autonomous Region in Muslim Mindanao (ARMM) 17 - 17 17 - 17
Nationwide 5,410 36 5,374 5,787 36 5,751
Particulars
2013 2014
16-5

Table 16.1 - Continued
TotalHead
Office
Other
OfficesTotal
Head
Office
Other
Offices
THRIFT BANKS
National Capital Region (NCR) 545 29 516 544 28 516
Region I (Ilocos Region) 74 1 73 81 1 80
Region II (Cagayan Valley) 57 2 55 61 2 59
Region III (Central Luzon) 189 9 180 211 9 202
Region IV-A (CALABARZON) 382 13 369 395 12 383
Region IV-B (MIMAROPA) 41 2 39 45 2 43
Region V (Bicol Region) 56 1 55 64 1 63
Region VI (Western Visayas)1/
106 4 102 111 4 107
Region VII (Central Visayas)2/
125 6 119 131 6 125
Region VIII (Eastern Visayas) 27 - 27 31 - 31
Region IX (Zamboanga Peninsula) 35 - 35 36 - 36
Region X (Northern Mindanao) 65 1 64 68 1 67
Region XI (Davao Region) 60 1 59 63 1 62
Region XII (SOCCSKSARGEN) 25 1 24 29 1 28
Region XIII (Caraga) 27 1 26 35 1 34
Cordillera Administrative Region (CAR) 13 - 13 14 - 14
Autonomous Region in Muslim Mindanao (ARMM) 1 - 1 1 - 1
Nationwide 1,828 71 1,757 1,920 69 1,851
RURAL AND COOPERATIVE BANKS
National Capital Region (NCR) 81 19 62 87 20 67
Region I (Ilocos Region) 178 44 134 174 42 132
Region II (Cagayan Valley) 151 32 119 159 31 128
Region III (Central Luzon) 352 83 269 332 78 254
Region IV-A (CALABARZON) 543 111 432 544 107 437
Region IV-B (MIMAROPA) 116 22 94 122 22 100
Region V (Bicol Region) 177 32 145 182 30 152
Region VI (Western Visayas)1/
201 55 146 207 54 153
Region VII (Central Visayas)2/
170 40 130 163 40 123
Region VIII (Eastern Visayas) 61 20 41 50 16 34
Region IX (Zamboanga Peninsula) 69 16 53 67 15 52
Region X (Northern Mindanao) 140 33 107 146 32 114
Region XI (Davao Region) 135 13 122 120 12 108
Region XII (SOCCSKSARGEN) 66 11 55 68 11 57
Region XIII (Caraga) 130 15 115 110 13 97
Cordillera Administrative Region (CAR) 73 18 55 74 18 56
Autonomous Region in Muslim Mindanao (ARMM) 3 2 1 3 2 1
Nationwide 2,646 566 2,080 2,608 543 2,065
2013
Particulars
2014
16-6

Table 16.1 - Continued
TotalHead
Office
Other
OfficesTotal
Head
Office
Other
Offices
TOTAL BANKING SYSTEM
National Capital Region (NCR) 3,379 84 3,295 3,504 83 3,421
Region I (Ilocos Region) 486 39 447 520 38 482
Region II (Cagayan Valley) 347 33 314 358 31 327
Region III (Central Luzon) 1,088 87 1,001 1,146 85 1,061
Region IV-A (CALABARZON) 1,621 114 1,507 1,665 104 1,561
Region IV-B (MIMAROPA) 246 24 222 267 24 243
Region V (Bicol Region) 397 28 369 428 28 400
Region VI (Western Visayas)1/
426 43 383 455 41 414
Region VII (Central Visayas)2/
620 32 588 720 42 678
Region VIII (Eastern Visayas) 200 16 184 210 16 194
Region IX (Zamboanga Peninsula) 215 16 199 220 16 204
Region X (Northern Mindanao) 376 32 344 383 30 353
Region XI (Davao Region) 408 12 396 424 12 412
Region XII (SOCCSKSARGEN) 222 12 210 232 11 221
Region XIII (Caraga) 218 12 206 208 10 198
Cordillera Administrative Region (CAR) 159 17 142 165 16 149
Autonomous Region in Muslim Mindanao (ARMM) 21 2 19 19 2 17
Nationwide 10,710 632 10,078 10,924 589 10,335
UNIVERSAL AND COMMERCIAL BANKS
National Capital Region (NCR) 2,760 39 2,721 2,760 39 2,721
Region I (Ilocos Region) 210 - 210 210 - 210
Region II (Cagayan Valley) 112 - 112 112 - 112
Region III (Central Luzon) 510 - 510 510 - 510
Region IV-A (CALABARZON) 659 - 659 659 - 659
Region IV-B (MIMAROPA) 70 - 70 70 - 70
Region V (Bicol Region) 137 - 137 137 - 137
Region VI (Western Visayas)1/
164 - 164 291 - 291
Region VII (Central Visayas)2/
354 - 354 399 - 399
Region VIII (Eastern Visayas) 107 - 107 107 - 107
Region IX (Zamboanga Peninsula) 104 1 103 104 1 103
Region X (Northern Mindanao) 156 - 156 156 - 156
Region XI (Davao Region) 220 - 220 220 - 220
Region XII (SOCCSKSARGEN) 120 - 120 120 - 120
Region XIII (Caraga) 74 - 74 74 - 74
Cordillera Administrative Region (CAR) 71 - 71 71 - 71
Autonomous Region in Muslim Mindanao (ARMM) 17 - 17 17 - 17
Nationwide 6,014 40 5,974 6,017 40 5,977
20162015
Particulars
16-7

Table 16.1 - Continued
TotalHead
Office
Other
OfficesTotal
Head
Office
Other
Offices
THRIFT BANKS
National Capital Region (NCR) 544 27 517 544 27 517
Region I (Ilocos Region) 102 1 101 102 1 101
Region II (Cagayan Valley) 76 2 74 76 2 74
Region III (Central Luzon) 232 9 223 232 9 223
Region IV-A (CALABARZON) 436 12 424 436 12 424
Region IV-B (MIMAROPA) 53 2 51 53 2 51
Region V (Bicol Region) 76 1 75 76 1 75
Region VI (Western Visayas)1/
82 3 79 122 4 118
Region VII (Central Visayas)2/
124 5 119 136 6 130
Region VIII (Eastern Visayas) 36 - 36 36 - 36
Region IX (Zamboanga Peninsula) 42 - 42 42 - 42
Region X (Northern Mindanao) 76 1 75 76 1 75
Region XI (Davao Region) 67 1 66 67 1 66
Region XII (SOCCSKSARGEN) 31 1 30 31 1 30
Region XIII (Caraga) 38 1 37 38 1 37
Cordillera Administrative Region (CAR) 16 - 16 16 - 16
Autonomous Region in Muslim Mindanao (ARMM) 1 - 1 1 - 1
Nationwide 2,086 68 2,018 2,084 68 2,016
RURAL AND COOPERATIVE BANKS
National Capital Region (NCR) 75 18 57 75 18 57
Region I (Ilocos Region) 174 38 136 174 38 136
Region II (Cagayan Valley) 159 31 128 159 31 128
Region III (Central Luzon) 346 78 268 346 78 268
Region IV-A (CALABARZON) 526 102 424 526 102 424
Region IV-B (MIMAROPA) 123 22 101 123 22 101
Region V (Bicol Region) 184 27 157 184 27 157
Region VI (Western Visayas)1/
180 40 140 212 54 158
Region VII (Central Visayas)2/
142 27 115 185 36 149
Region VIII (Eastern Visayas) 57 16 41 57 16 41
Region IX (Zamboanga Peninsula) 69 15 54 69 15 54
Region X (Northern Mindanao) 144 31 113 144 31 113
Region XI (Davao Region) 121 11 110 121 11 110
Region XII (SOCCSKSARGEN) 71 11 60 71 11 60
Region XIII (Caraga) 106 11 95 106 11 95
Cordillera Administrative Region (CAR) 72 17 55 72 17 55
Autonomous Region in Muslim Mindanao (ARMM) 3 2 1 3 2 1
Nationwide 2,610 524 2,086 2,627 520 2,107
2015 2016
Particulars
16-8

Table 16.2
NUMBER OF BANKING OFFICES IN CENTRAL VISAYAS BY INSTITUTIONAL GROUP
2011-2016
Institutional Group 2011 2012 2013 2014 20151/
20161/
All Banks 584 627 653 683 702 720
Universal and Commercial Banks
Head Offices 0 0 0 0 0 0
Branches 309 337 358 389 396 399
Thrift Banks
Head Offices 6 6 6 6 6 6
Branches 108 116 119 125 132 130
Rural and Cooperative Banks
Head Offices 40 41 40 40 40 36
Branches 121 127 130 123 128 149
Note: 1/ Includes Negros Oriental
Source: Bangko Sentral ng Pilipinas
Table 16.3
NUMBER OF BANKING OFFICES IN CENTRAL VISAYAS BY PROVINCE
2011-2016
Province 2011 2012 2013 2014 2015 2016
Central Visayas 584 627 653 683 702 720
Bohol 68 75 79 83 89 90
Cebu 450 481 496 516 523 530
Negros Oriental 61 66 73 79 82 92
Siquijor 5 5 5 5 8 8
Source: Supervisory Data Center, Bangko Sentral ng Pilipinas
0
50
100
150
200
250
300
350
400
450
2012 2013 2014 2015 2016
Figure 16.1 Number of Banking Offices in Central Visayas by Institutional Group: 2012-2016
Universal and Commercial Banks Thrift Banks Rural and Cooperative Banks
16-9

Table 16.4
BANKING STATISTICS: LOANS AND RECEIVABLES-OTHERS, NET BY PROVINCE
2012-2017
In billion pesos
Province 2012 2013 2014 2015 2016 2017
Central Visayas 86.04 133.01 165.09 193.73 222.50 265.62
Bohol 4.89 5.56 7.20 7.69 8.63 9.53
Cebu 76.94 121.60 150.84 178.65 205.56 246.76
Negros Oriental 4.11 5.74 6.90 7.23 8.11 9.06
Siquijor 0.09 0.11 0.14 0.15 0.20 0.27
Source: Supervisory Data Center, Bangko Sentral ng Pilipinas
Table 16.5
BANKING STATISTICS: LOANS AND RECEIVABLES-OTHERS, NET BY INSTITUTIONAL GROUP
2011-2016
In billion pesos
Institutional Group 2011 2012 2013 2014 20151/
20161/
All Banks 62.06 86.04 133.01 165.09 193.73 222.50
Universal and Commercial Banks 46.74 65.83 110.39 138.80 162.95 183.64
Thrift Banks 11.32 15.59 17.43 19.88 25.49 32.62
Rural and Cooperative Banks 4.00 4.62 5.19 6.41 5.29 6.23
Note: 1/ Includes Negros Oriental
Source: Bangko Sentral ng Pilipinas
Universal and Commercial Banks
84.11%
Thrift Banks 13.16%
Rural and Cooperative Banks,
2.73%
Figure 16.2 Distribtution of Loan Portfolio by Institutional GroupCentral Visayas: 2016
16-10

Table 16.6
BANKING STATISTICS: TOTAL ASSETS BY PROVINCE
2011-2016
In billion pesos
Province 2011 2012 2013 2014 2015 2016
Central Visayas 266.77 247.81 302.36 371.07 447.74 459.68
Bohol 17.71 18.95 20.72 25.91 31.83 31.77
Cebu 230.78 201.06 258.69 308.28 371.18 378.04
Negros Oriental 17.22 26.77 21.80 35.48 42.94 47.69
Siquijor 1.06 1.03 1.15 1.41 1.80 2.18
Note: For 2008 onwards, the total assets is inclusive of Due from Head Office/Branches/Agencies (Philippine
branch of a Foreign bank)
Source: Supervisory Data Center, Bangko Sentral ng Pilipinas
Table 16.7
BANKING STATISTICS: TOTAL OPERATING EXPENSE BY PROVINCE
2011-2016
In billion pesos
Province 2011 2012 2013 2014 2015 2016
Central Visayas 10.06 9.98 9.93 11.16 12.27 13.05
Bohol 0.98 1.04 1.00 1.10 1.22 1.23
Cebu 7.95 8.10 8.06 9.13 10.14 10.75
Negros Oriental 0.81 0.81 0.84 0.89 0.87 1.02
Siquijor 0.32 0.04 0.04 0.04 0.06 0.05
Source: Supervisory Data Center, Bangko Sentral ng Pilipinas
Table 16.8
BANKING STATISTICS: TOTAL OPERATING INCOME BY PROVINCE
2011-2016
In billion pesos
Province 2011 2012 2013 2014 2015 2016
Central Visayas 5.92 5.26 9.74 9.07 12.23 15.88
Bohol 0.69 0.79 0.86 0.89 0.98 1.06
Cebu 4.60 3.83 8.06 7.31 10.36 13.73
Negros Oriental 0.62 0.61 0.80 0.84 0.86 1.05
Siquijor 0.02 0.02 0.02 0.03 0.03 0.03
Source: Supervisory Data Center, Bangko Sentral ng Pilipinas
16-11

Table 16.9
BANKING STATISTICS: TOTAL INTEREST EXPENSE BY PROVINCE
2011-2016
In billion pesos
Province 2011 2012 2013 2014 2015 2016
Central Visayas 4.60 4.37 3.68 4.11 4.66 4.80
Bohol 0.32 0.32 0.30 0.31 0.37 0.38
Cebu 3.96 3.76 3.14 3.57 4.06 4.16
Negros Oriental 0.31 0.28 0.23 0.22 0.22 0.25
Siquijor 0.01 0.01 0.01 0.01 0.01 0.01
Source: Supervisory Data Center, Bangko Sentral ng Pilipinas
Table 16.10
BANKING STATISTICS: TOTAL INTEREST INCOME BY PROVINCE
2011-2016
In billion pesos
Province 2011 2012 2013 2014 2015 2016
Central Visayas 4.36 4.96 5.92 6.95 8.20 9.49
Bohol 0.55 0.63 0.66 0.69 0.74 0.76
Cebu 3.34 3.84 4.70 5.63 6.82 7.99
Negros Oriental 0.45 0.47 0.54 0.60 0.61 0.72
Siquijor 0.02 0.02 0.02 0.03 0.03 0.03
Source: Supervisory Data Center, Bangko Sentral ng Pilipinas
Table 16.11
BANKING STATISTICS: DEPOSIT LIABILITIES BY PROVINCE
2011-2016
In billion pesos
Province 2011 2012 2013 2014 2015 2016
Central Visayas 261.64 280.70 368.15 430.71 498.41 546.41
Bohol 19.20 20.89 25.06 31.13 35.90 39.26
Cebu 220.30 235.99 315.06 368.06 425.52 463.60
Negros Oriental 21.01 22.65 26.80 29.98 34.89 41.02
Siquijor 1.13 1.17 1.24 1.54 2.11 2.54
Source: Supervisory Data Center, Bangko Sentral ng Pilipinas
16-12

Table 16.12
BANKING STATISTICS: DEPOSIT LIABILITIES BY INSTITUTIONAL GROUP
2013-2017
In billion pesos
Institutional Group 2013 2014 2015 1\
20161\ 2017
All Banks 368.15 430.71 498.41 546.41 582.73
Universal and Commercial Banks 317.32 377.51 427.00 467.54 512.24
Thrift Banks 45.90 47.98 66.34 72.90 63.80
Rural and Cooperative Banks 4.93 5.23 5.07 5.97 6.70
Note: 1\ Includes Negros Oriental
Source: Bangko Sentral ng Pilipinas
Source: Bangko Sentral ng Pilipinas
0.00
100.00
200.00
300.00
400.00
500.00
600.00
2013 2014 2015 2016 2017
In b
illi
on
pe
so
s
Figure 16.3 Deposit Liabilities by Institutional GroupCentral Visayas: 2013-2017
Universal and Commercial Banks Thrift Banks Rural and Cooperative Banks
16-13

Chapter 17
PUBLIC ORDER, SAFETY and
JUSTICE
Data on public order, safety and justice reflect the effectivity, efficiency and fairness in the administration and enforcement of laws. The basic goal of the government is to establish a peaceful, stable and just environment conducive to national growth and development. A society
where peace, order and law prevail is not only a goal or a vision. It forms one of the pillars of man’s basic rights. Development that is not coupled with order, safety and justice contribute to the
degradation of society. The effects of public order, safety and justice in national well-being and in every fiber of the social and economic lives of individuals are priority concerns of governance. In this light, an information system that generates timely and reliable data becomes a necessary tool
in the administration of justice and enforcement of laws as well as to aid legislation.
This chapter presents regional/provincial/city data on crimes, inmates/prisoners and police force. The sources of data are the Philippine National Police (PNP) for data on crimes; the Bureau of Fire Protection (BFP) for number of firemen and fire incidence; and the Bureau of Jail
Management and Penology (BJMP) for data on inmates and crimes.
Highlights
• Crime incidence in the region reached 64,437 cases in 2015 and these crimes include reported crimes taken from the barangay blotter.
• A total of eleven percent increase in the crime solution efficiency was also recorded, from 45.17 percent in 2014 to 56.70 in 2015.
• The 2015 police force at 6,738 of Central Visayas was 4.2 percent thinner compared to the 7,030 men in 2014.
• In 2017, the total number of insular prisoners in Central Visayas significantly increased from 95 in 2016 to 203 prisoners which is equivalent to 53.20 percent.

ContentsHighlights 17-1
STATISTICAL TABLES:
Table 17.1 Data on Inmates with Drug Cases (RA 9165) by Classification by Province
in Central Visayas, 2013-2017 …...................................................................17-3
Table 17.2 Data on Insular Prisoners by Province
in Central Visayas, 2014-2017 …...................................................................17-4
Table 17.3 Data on Index and Non-index Crimes by Province
in Central Visayas, 2014-2017 …....................................................................17-4
Table 17.4 Data on Index and Non-index Crimes by Type and by Province
in Central Visayas, 2014-2017 …....................................................................17-5
Table 17.5 Data on Inmates by Age Bracket by Province
in Central Visayas, 2014-2017 …....................................................................17-7
Table 17.6 Data on Inmates with Drug Cases (RA 9165) by Age by Province
in Central Visayas, 2012-2017 …....................................................................17-9
Figure 17.1 Number of Crime Incidence and Crime Solution Efficiency Rate by Province
in Central Visayas, 2005 - 2015 …..................................................................17-10
Figure 17.2 Number of Policemen by Province
in Central Visayas, 2006 - 2015 ......................................................................17-11
17-2

Table 17.1
DATA ON INMATES WITH DRUG CASES (RA 9165) BY CLASSIFICATION BY PROVINCE
2013-2017
Province and
Classification2013 2014 2015 2016 2017
BOHOL 174 357 595 1,191 1,427
Sentenced 3 - - - -
Adult 3 - - - -
CICL* - - - - -
Detained 171 357 595 1,191 1,427
Adult 171 357 595 1,191 1,427
CICL - - - - -
CEBU 3,217 3,770 4,691 8,137 11,685
Sentenced 69 94 99 91 123
Adult 69 94 99 91 123
CICL - - - - -
Detained 3,148 3,676 4,592 8,046 11,562
Adult 3,078 3,676 4,522 7,947 11,561
CICL 70 - 70 99 1
NEGROS ORIENTAL 365 581 725 1,015 1,181
Sentenced 13 12 6 32 39
Adult 13 12 6 32 39
CICL - - - - -
Detained 352 569 719 983 1,142
Adult 351 568 719 983 1,142
CICL 1 1 - - -
SIQUIJOR 36 55 54 58 49
Sentenced - - - 1 -
Adult - - - 1 -
CICL - - - - -
Detained 36 55 54 57 49
Adult 36 55 54 57 49
CICL - - - - -
Note: * CICL-Children in Conflict with the Law
… No Data Available
Source: Bureau of Jail Management and Penology
17-3

Table 17.2
DATA ON INSULAR PRISONERS BY PROVINCE
2014-2017
Province 2014 2015 2016 2017
CENTRAL VISAYAS 262 223 95 203
BOHOL 28 16 6 11
CEBU 175 163 84 111
NEGROS ORIENTAL 54 42 0 78
SIQUIJOR 5 2 5 3
Source: Bureau of Jail Management and Penology
Table 17.3
DATA ON INDEX AND NON-INDEX CRIMES BY PROVINCE
2014-2017
Province 2014 2015 2016 2017
Central Visayas 10,040 11,383 14,287 18,922
Index 3,054 2,981 3,054 3,090
Non-Index 6,986 8,402 11,233 15,832
BOHOL 711 1,006 1,711 1,898
Index 307 306 431 293
Non-Index 404 700 1,280 1,605
CEBU 8,053 8,995 12,477 14,909
Index 2,273 2,215 2,598 2,154
Non-Index 5,780 6,780 9,879 12,755
NEGROS ORIENTAL 1,186 1,298 - 2,021
Index 446 439 - 612
Non-Index 740 859 - 1,409
SIQUIJOR 90 84 99 94
Index 28 21 25 31
Non-Index 62 63 74 63
Source: Bureau of Jail Management and Penology
17-4

Table 17.4
DATA ON INDEX AND NON-INDEX CRIMES BY TYPE AND BY PROVINCE
2014-2017
Province 2014 2015 2016 2017
BOHOL 711 1,006 1,583 1,810
Index 307 306 303 205
Murder 149 135 137 113
Homicide 44 48 48 16
Physical Injury 11 6 9 6
Robbery 53 66 62 42
Theft 50 51 47 28
Non-Index 404 700 1,280 1,605
RA 9165 Violation 325 599 1191 1427
Other Crimes 79 101 89 178
CEBU 8,053 8,995 11,366 14,506
Index 2,273 2,215 2,045 1,751
Murder 818 737 856 763
Homicide 143 153 140 83
Physical Injury 26 41 25 46
Robbery 677 665 553 488
Theft 609 619 471 371
Non-Index 5,780 6,780 9,321 12,755
RA 9165 Violation 4,303 5,174 8,137 11,685
Other Crimes 1,477 1,606 1,184 1,070
NEGROS ORIENTAL 1,186 1,298 1,745 1,876
Index 446 439 447 467
Murder 283 284 296 337
Homicide 85 87 87 76
Physical Injury 4 2 - 2
Robbery 32 27 36 31
Theft 42 39 28 21
Non-Index 740 859 1,298 1,409
RA 9165 Violation 582 720 1015 1181
Other Crimes 158 139 283 228
17-5

SIQUIJOR 90 84 88 82
Index 28 21 14 19
Murder 11 8 5 8
Homicide 8 5 2 5
Physical Injury 0 0 0 0
Robbery 5 5 5 4
Theft 4 3 2 2
Non-Index 62 63 74 63
RA 9165 Violation 55 54 58 49
Other Crimes 7 9 16 14
Source: Bureau of Jail Management and Penology
17-6

Table 17.5
DATA ON INMATES BY AGE BRACKET BY PROVINCE
2014-2017
Province 2014 2015 2016 2017
Central Visayas 9,099 10,795 15,351 16,558
Bohol 816 1,100 1,863 -
Undetermined … - -
17-Below - - -
18-25 174 228 384
26-32 176 278 420
33-39 180 247 438
40-46 139 176 358
47-53 74 95 155
54-59 30 32 57
60-65 24 22 24
66-70 11 11 17
70-Above 8 11 10
Cebu 6,939 8,191 11,390 14,471
Undetermined - - - -
17-Below 197 194 218 2
18-25 2,058 2,307 2,613 3,507
26-32 1,755 2,143 2,977 3,825
33-39 1,261 1,571 2,534 3,317
40-46 925 1,101 1,679 2,115
47-53 457 536 891 1,083
54-59 180 230 312 408
60-65 72 75 109 142
66-70 21 22 35 42
70-Above 13 12 22 30
Negros Oriental 1,258 1,418 2,006 2,006
Undetermined - - - -
17-Below 3 - 2 2
18-25 260 294 452 452
26-32 298 345 436 436
33-39 256 291 474 474
40-46 214 249 333 333
47-53 137 152 177 177
54-59 53 50 80 80
60-65 19 20 36 36
66-70 10 12 12 12
70-Above 8 5 4 4
17-7

Siquijor 86 86 92 81
Undetermined - - - -
17-Below - - - -
18-25 24 28 17 21
26-32 12 12 16 15
33-39 25 21 20 17
40-46 17 16 19 15
47-53 5 4 12 6
54-59 - 3 5 5
60-65 2 2 3 2
66-70 - - - -
70-Above 1 - - -
Source: Bureau of Jail Management and Penology
17-8

Table 17.6
DATA ON INMATES WITH DRUG CASES (RA 9165) BY AGE BY PROVINCE
2012-2017
Province / Age 2012 2013 2014 2015 2016 2017
Central Visayas 3,027 3,842 4,843 6,053 9,388 14,342
Bohol 167 174 363 595 1,191 1,427
17-Below … - - - - -
18-21 9 11 25 52 142 130
22-39 125 112 236 398 758 894
40-59 30 48 99 137 277 389
60-Above 3 3 3 8 14 14
Cebu 2,504 3,217 3,844 4,681 8,139 11,685
17-Below 47 78 74 70 103 1
18-21 302 378 495 538 1,075 1,184
22-39 1,549 2,040 2,359 2,928 4,947 6,530
40-59 562 691 893 1,103 1,892 3,749
60-Above 44 30 23 42 122 221
Negros Oriental 323 413 581 717 - 1,181
17-Below - 1 1 - - 1
18-21 39 23 38 48 - 125
22-39 208 297 386 472 - 746
40-59 74 86 151 190 - 291
60-Above 2 6 5 7 - 18
Siquijor 33 38 55 60 58 49
17-Below - - - - - -
18-21 1 - - - 1 -
22-39 21 19 29 30 33 28
40-59 11 19 26 29 23 21
60-Above - - - 1 1 -
Source: Bureau of Jail Management and Penology
17-9

Figure 17.1
Crime Incidence by Type of Crime by Province
2015
Province Bohol Cebu Negros Oriental Siquijor
Index 306 2,215 439 21
Non-Index 700 6,780 859 63
-
1,000
2,000
3,000
4,000
5,000
6,000
7,000
8,000
Bohol Cebu Negros Oriental Siquijor
Cri
me In
cid
en
ce
Figure 17.1 Crime Incidence by Type of Crime by ProvinceCentral Visayas, 2015
Index Non-Index
17-10

Figure 17.2
Distribution of of Police and Firemen by Province
2015
Particulars Bohol Cebu Negros Oriental Siquijor
Policemen 1,464 3,686 1,367 221
Firemen 329 978 195 49
-
500
1,000
1,500
2,000
2,500
3,000
3,500
4,000
Bohol Cebu Negros Oriental Siquijor
Figure 17.2 Distribution of Policemen and Firemen by ProvinceCentral Visayas, 2015
Policemen Firemen
17-11


Appendix - 1
APPENDIX

Appendix - 2
Glossary of Terms
AGRICULTURE Agricultural Production- the growing field crops, fruits, nuts, seeds, tree nurseries (except those of forest trees), bulb vegetables and flowers, both in the open and under glass; and the production of coffee, tea, cocoa, rubber; and the production of livestock and livestock products, honey rabbits, fur-bearing animals, silkworm, cocoons, etc. Forestry and fishery activities carried on as an ancillary activity on an agricultural holding is also considered as agricultural production. (Philippine Statistics Authority) Aquaculture – sector of fisheries that includes the rearing or raising under controlled conditions of aquatic products such as fish, oysters, mussels, sea weeds and other aquatic resources in sea, lakes and rivers. Examples are fishponds, fish pens and fish cages. (Philippine Statistics Authority)
Commercial Fishing – sector of fisheries that includes the catching of fish in marine waters with the use of fishing boat of more than three (3) gross tons. (Philippine Statistics Authority) Municipal Fishing – sector of fisheries that includes the catching of fish in marine and inland waters with the use of fishing boat of three (3) gross tons or less, or using gear not requiring the use of boats. (Philippine Statistics Authority) BANKING AND FINANCE
Assets - are economic resources that are controlled by the company/entity and whose cost at the time of acquisition could be objectively measured. Capital and Financial Account – divided into two main categories: the capital account and the financial account. The capital account covers all transactions that involve the receipt/payment of capital transfers and acquisition/disposal of non-produced, non-financial assets. The financial account covers all transactions associated with changes of ownership in the foreign financial assets and liabilities of the economy. Such changes include the creation and liquidation of claims on, or by, the rest of the world. Commercial Banks - any corporation which, in addition to the general powers incident to corporations, shall have all such powers as shall be necessary to carry on the business of commercial banking, by accepting drafts and issuing letters of credits, by discounting and negotiating promissory notes, drafts, bills of exchange, and other evidences of debts, by receiving deposits, by buying and selling foreign exchange and gold or silver bullion, and by lending money against
securities consisting of personal property or first mortgage on improved real estates and the insured improvements thereon. Extraordinary Income - collections derived from the repayment of loans and advances made by the government as well as from other non-recurring sources. Investments - amount of money or other resources measured in terms of money placed on activities or other forms of assets for the purpose of earning profits. Rural Banks - government-sponsored/assisted banks which are privately managed and largely privately owned that provide credit facilities to farmers and merchants, or to cooperatives of such farmers or merchants at reasonable terms and in general; to the people of the rural community.
Savings Deposits - these include all interest-bearing deposits which are withdrawals upon presentation of an accomplished withdrawal slip together with the passbook. These are subdivided into savings deposits of private firms, individuals, banks, the government and trust department of banks.
Services – include transactions involving the performance of services such as freight, insurance, travel, including labor services provided by Filipino workers abroad. Also included are receipts/payments of interest, profits and dividends.

Appendix - 3
Transfers – refer to unilateral transfers or donations. The two main categories are Private and Central Government transfers Private transfers cover personal and institutional remittances from abroad including donations to voluntary relief agencies, migrants’ transfers and taxes paid to the Philippine government by Filipino residents abroad. Central Government transfers refer to the U.S. Veterans Administration pensions, aids and grants received from the U.S. Agency for International Development (USAID), UN agencies and other foreign governments. Outflows represent the Philippines’ contributions to various international organizations and its counterpart funding for foreign assistance programs. ECONOMIC ACCOUNTS Constant Prices (at constant prices) – valuation of transactions, wherein the influence of price changes from the base year to the current year has been removed. Current Prices (at current prices) – the value based on prices during the reference year, nominal value.
Gross Domestic Product – the value of all goods and services produced domestically; the sum of gross value added of all resident institutional units engaged in production (plus any taxes, and minus any subsidies, on products not included in the values of their outputs). Gross Regional Domestic Product - aggregate of the gross value added or income from each industry or economic activity of the regional economy. Gross Value Added – the difference between gross output and intermediate inputs. Gross outputs of a production unit during a given period is equal to the gross value of the goods and services produced during the period and recorded at the moment they are produced, regardless of whether or not there is a change of ownership. Intermediate inputs refer to the value of goods and services used in the production process during the accounting period. Implicit Price Index – represents an overall view of the price movement in the economy and is as such the most comprehensive price index. It is derived by dividing the GNP/GRDP/GDP series in current prices by the corresponding series in constant prices. EDUCATION AND MANPOWER DEVELOPMENT Basic or Simple Literacy - the ability to read and write with understanding simple messages in any language or dialect. (National Statistics Office) Cohort Survival Rate ****** – the percentage of enrolees at the beginning grade or year in a given school year who reached the final grade or year of the elementary of secondary level. Elementary Education - the first stage of free and compulsory, formal education primarily concerned with providing basic education and usually corresponding to six and seven grades. Elementary education can likewise be attained through alternative learning system. Enrolment ****** - total number of pupils/students who register/enlist in a school year. Formal Education – the systematic and deliberate process of hierarchically structured and sequential learning corresponding to the general concept of elementary and secondary level of schooling. At the end of each level, the learner needs a certification in order to enter or advance to the next level. Functional Literacy - represents a significantly higher level literacy which includes not only reading and writing skills
but also numeracy skills. This skill must be sufficiently advanced to enable the individual to participate fully and
effectively in activities commonly occurring in his life situation that require a reasonable capability of communicating
by written language. (Philippine Statistics Authority)

Appendix - 4
Higher Education - the stage of formal education requiring secondary and post-secondary education covering the programs on: (a) all courses of study leading to bachelor’s degree and (b) all degree courses of study beyond bachelor’s degree level. Literacy rate, Simple/Basic ****** - the percentage of the population 10 years old and over, who can read, write and understand simple messages in any language or dialect. Participation Rate ****** - the ratio of the enrolment for the age group corresponding to the official school age in the elementary/secondary level to the population of the same age group in a given year. Also known as Net Enrolment Ratio (NER).
Post-Secondary/Non -Degree Education - the stage of formal education following the secondary level covering non-degree programs that have varying duration from three (3) months to three (3) years, concerned primarily with developing strong and appropriately trained middle-level skilled manpower possessing capabilities supportive of national development.
Pre-School - a school that admits students who are not old enough to enter the first level of education. These pupils are usually from 4 to 5 years of age. (Department of Education) Primary School - a school primarily concerned with providing basic education and usually corresponding to the first four grades of elementary education. (Department of Education)
Private Institutions/Schools - educational institutions maintained and administered by private individuals or groups. Public Institutions/Schools – educational institutions established by law and administered by the government.
Secondary School - an educational institution offering secondary education usually consisting of a four-year general secondary curricula. (Department of Education) Secondary Education - the stage of formal education following the elementary level concerned primarily with continuing basic education and expanding it to include the learning of employable gainful skills, usually corresponding to four years of high school. School Year - the prescribed period of time, when schools offer daily instruction broken by short intermission periods (e.g., Christmas and summer vacations and holidays).
ENERGY AND WATER RESOURCES Distribution of Electricity - Refers to the conveyance or delivery of electricity by a distribution utility to end-users. Distribution Utility - Refers to any electric cooperative, private corporation, government-owned utility or existing local government unit which has an exclusive franchise to operate a distribution system in accordance with the Electricity Industry Reform Act of 2000.
Electric Cooperative - Refers to a cooperative or corporation authorized to provide electric service pursuant to Presidential Decree No. 269, as amended, or Republic Act No. 6938. Electricity Sales - Refers to the sales proceeds derived by the power producer from the actual generation of the energy-generating facility net of station own use and losses. Generation of Electricity - Refers to the production of electricity by a generation or co-generation facility. National Electrification Administration (NEA) - Refers to the government agency created under Presidential Decree No. 269, to act as a catalyst for the development of electric distribution utilities (EDUs) by providing world-class financial intermediation institutional and technical services.

Appendix - 5
ENVIRONMENT AND NATURAL RESOURCES
Charcoal – solid product obtained from the destructive distillation and/or thermal degradation of wood. (Forest Management Bureau) Forest* – refers to land with an area of more than 0.5 hectare and tree crown cover (or equivalent stocking level) of more than 10 percent. The trees should be able to reach a minimum height of 5 meters at maturity in situ. It consists either of closed forest formations where trees of various storeys and undergrowth cover a high proportion of the ground or open forest formations with a continuous vegetation cover in which tree crown cover exceeds 10 percent. Young natural stands and all plantations established for forestry purposes, which have yet to reach a crown density of more than 10 percent or tree height of 5 meters are included under forest. These are normally forming part of the forest area, which are temporarily unstocked as a result of human intervention or natural causes but which are expected to revert to forest. It includes forest nurseries and seed orchards that constitute an integral part of the forest; forest roads, cleared tracts, firebreaks and other small open areas; forest within protected areas; windbreaks and shelter belts of trees with an area of more than 0.5 hectare and width of more than 20 meter; plantations primarily used for forestry purposes, including rubber wood plantations. It also includes bamboo, palm and fern formations (except coconut and oil palm). (Reference: Food and Agriculture Organization, 2000)
Forest Land – includes the public forest, the permanent forest or forest reserves, and forest reservations. (Forest Management Bureau) Forest Product - all usable raw materials yielded by the forest including the associated water, fish, game, scenic, historical, recreational and geologic resources. (Forest Management Bureau) Log - felled trees bucked into convenient length of at least 1.5 meters, with at least 15 cm. in diameter. It may either be
poles, piles, pulpwood, sawlog or veneer log. (Forest Management Bureau) Lumber - solid wood not further manufactured other than sawing, resawing and passing lengthwise through a standard planing machine crosscut to length. (Forest Management Bureau) National Park – refers to a forest reservation essentially of primitive or wilderness character which has been withdrawn from settlement or occupancy and set aside as such exclusively to preserve the scenery, the natural and historic objects and the wild animals or plants therein, and to provide enjoyment of these features in such a manner as will leave them unimpaired for future generations. (Protected Areas and Wildlife Bureau)
Non-Timber Forest Product - includes all forest products except timber; also known as minor forest product. (Forest Management Bureau) Plywood - an assembled product made of layers of veneer held together by an adhesive, the chief characteristic of which is the alternate cross layers, distributing the longitudinal wood strength. It consists of three or more layers of veneer, firmly glued together with the grain direction of the middle layer at right angles to that of the two parallel outer layers. (Forest Management Bureau) Poles and Piles – logs for use as electric post, pier piling, railroad ties, sleepers and the like. (Forest Management Bureau) Pulpwood – any wood commercially used for the manufacture of any type of pulp. (Forest Management Bureau) Roundwood - wood in its natural state as felled or otherwise harvested, with or without bar, round, split roughly squared or other forms (e.g. roots, stumps). It may also be impregnated (e.g. telegraph poles) or roughly shaped or pointed. It comprises all wood obtained from the forest such as sawlogs/veneer logs, pulpwood, fuelwood and other industrial roundwood. (Forest Management Bureau)
Timberland – refers to land of the public domain which has been the subject of the present system of land classification determined to be needed for forest purposes. Eventually, these lands will be proclaimed as forest reserves by the President. (Forest Management Bureau) Upland – highland; ground elevation above the lowlands along rivers or between hills. (Forest Management
Bureau)

Appendix - 6
Veneer - thin sheets of wood of uniform thickness, rotary cut, sliced or sawn for use in the manufacture of plywood. (Forest Management Bureau) TRADE
Balance of Trade - the difference between the export earnings and import payments of all goods or merchandise trade transacted by a country. (Philippine Statistics Authority) Domestic Export - export for goods grown, mined, cultured or manufactured in the Philippines. (Bangko Sentral ng Pilipinas) Export - all goods leaving the country which are properly cleared through the Customs. (Philippine Statistics Authority)
Free on Board (F.O.B.) Value - the value of the goods free on board the carrier at the frontier of the exporting country. It includes inland freight, export duty and other expenses. Ocean freight, insurance and consular fee are, however, excluded. (Philippine Statistics Authority) Import - all goods entering any of the seaports or airports of entry of the Philippines properly cleared through the
Customs or remaining under Customs control, whether the goods are for direct consumption, for merchanting, for
warehousing or for further processing. (Philippine Statistics Authority) Traditional Exports - export goods whose value exceed US$5 million in 1968 and which have undergone a significant degree of processing. (Bangko Sentral ng Pilipinas)
INCOME AND PRICES
Consumer Price Index (CPI) *** – Indicator of the change in the average prices of a fixed basket of goods and services commonly purchased by households relative to a base year. Core Inflation** - is a measure of inflation that aims to capture the permanent component of the inflationary process that can be influenced by monetary policy. Family – is a group of persons usually living together and composed of the head and other persons related to the head by blood, marriage and adoption. A single person living alone is considered a separate family. (2000 FIES, Philippine Statistics Authority) Family Expenditures – refers to the expenses or disbursements made by the family purely for personal consumption during the reference period. They exclude all expenses in relation to farm or business operations, investment ventures, purchase of real property and other disbursements which do not involve personal consumption. Gifts, support, assistance or relief in goods and services received by the family from friends, relatives, etc. and consumed during the reference period are included in the family expenditures. Value consumed from net share of crops, fruits and vegetables produced or livestock raised by other households, family sustenance and entrepreneurial activities are also considered as family expenditures. (2000 FIES, Philippine Statistics Authority) Family Income – includes primary income and receipts from other sources received by all family members during the calendar year as participants in any economic activity or as recipients of transfers, pensions, grants, etc. (2000 FIES, Philippine Statistics Authority) Primary income includes:
• Salaries and wages from employment. • Commissions, tips, bonuses, family and clothing allowance, transportation and representation
allowance and honoraria.
• Other forms of compensation and net receipts derived from the operation of family-operated enterprises/activities and the practice of profession or trade.
Income from other sources include:
• Imputed rental values of owner-occupied dwelling units.

Appendix - 7
• Interests. • Rentals including land owner’s share of agricultural products
• Pensions
• Support and value of food and non-food items received as gifts by the family (as well as the imputed value of services rendered free of charge to the family).
• Receipts from family sustenance activities, which are not considered as family operated enterprise. Food Threshold (FT) ******* – the minimum income/expenditure required for a family/individual to meet the basic food needs, which satisfies the nutritional requirements for economically necessary and socially desirable physical activities.
Gini Ratio ******* - the ratio of the area between the Lorenz curve and the diagonal (the line of perfect equality) to the area below the diagonal.
Notes: It is a measure of the extent to which the distribution of income/ expenditure among families/individuals deviates from a perfectly equal distribution, with limits 0 for perfect equality and 1 for perfect inequality.
Headline Inflation** - measures changes in the cost of living based on movements in the prices of a specified basket of major commodities. It refers to the annual rate of change or the year-on-year change in the Consumer Price Index (CPI).
Income Gap – is the average income shortfall (expressed in proportion to the poverty line) of those below the threshold. (1997 Philippine Poverty Statistics, Philippine Statistics Authority) Inflation Rate - the annual rate of change or the year-on-year change in the Consumer Price Index.
Magnitude of the Poor - the number of families or the population whose annual per capita income falls below the poverty threshold. Poverty Gap (PG) ******* – the total income/ expenditure shortfall (expressed in proportion to the poverty threshold) of families/ individuals with income/ expenditure below the poverty threshold, divided by the total number of families/ individuals.
Poverty Incidence (PI) ******* - the proportion of families/individuals with per capita income / expenditure less than the per capita poverty threshold to the total number of families/individuals. Poverty Threshold (PT) ******* – the minimum income/expenditure required for a family/individual to meet the basic food and non-food requirements.
Notes: Basic food requirements are currently based on 100% adequacy for the Recommended Energy and Nutrient Intake (RENI) for protein and energy equivalent to an average of 2000 kilocalories per capita, and 80% adequacy for other nutrients. On the other hand, basic non-food requirements, indirectly estimated by obtaining the ratio of food to total basic expenditures from a reference group of families, cover expenditure on: 1) clothing and footwear; 2) housing; 3) fuel, light, water; 4) maintenance and minor repairs; 5) rental of occupied dwelling units; 6) medical care; 7) education; 8) transportation and communication; 9) non-durable furnishings; 10) household operations; and 11) personal care & effects.
Producer Price Index (PPI)*** - statistical measure of the average changes in average prices of a basket of goods as they leave the establishment of the producers relative to a base period. Producer Price Index (PPI) for Agriculture*** - statistical measure of the average changes in average farmgate prices of a basket of goods relative to a base period. Purchasing Power of the Peso*** - a measure of the real value of the peso in a given period relative to a chosen reference period. It is computed by getting the reciprocal of the CPI and multiplying the result by 100 Retail Price*** - the price at which a commodity is sold for spot in small quantities for consumption.
Retail Price Index (RPI) *** – statistical measure of the changes in the prices at which retailers dispose of their goods to consumers or end-users relative to a base year.

Appendix - 8
Severity of Poverty (SP) ******* – the total of the squared income/expenditure shortfall (expressed in proportion to the poverty threshold) of families/ individuals with income/expenditure below the poverty threshold, divided by the total number of families/ individuals.
Notes: This is equal to the Foster-Greer-Thorbecke (FGT) family of measures with alpha = 2. It is a poverty measure, which is sensitive to the income/ expenditure distribution among the poor – the worse this distribution is, the more severe poverty is.
Subsistence Incidence (S) ******* - the proportion of families/individuals with per capita income/ expenditure less than the per capita food threshold to the total number of families/ individuals. Wholesale Price*** – the average price of a commodity transacted in bulk for further resale or processing. Wholesale Price Index (WPI) *** - statistical measure of average changes over time in the wholesale prices of commodities relative to a base year.
INDUSTRY
Capital Investment – the amount of capital invested by a newly registered organization whether a corporation, partnership or single proprietorship. (Bangko Sentral ng Pilipinas) Cost - all expenses whether paid or payable incurred during the year including interest expenses and indirect taxes and other charges. Valuation is usually at market price, net of discounts, rebates, returns and allowances. (Philippine Statistics Authority)
Establishment – an economic unit which engages in one or predominantly one kind of economic activity at a fixed single physical location. (Philippine Statistics Authority) Investments - amount of money or other resources measured in terms of money placed on activities or other forms of assets for the purpose of earning profits. (Board of Investment) Total Receipt (Revenue/Sales) – includes the value/cash received and receivables for products shipped, goods sold and transferred and industrial and non-industrial services rendered to others. (Philippine Statistics Authority) Value of Output - represents the total value of products sold, receipts from contract work and industrial services done for others, receipts from goods bought and sold in same conditions, fixed assets produced on own-account and change in inventories (ending less beginning of finished products, work-in process and goods for release). (Philippine Statistics Authority) LABOR AND EMPLOYMENT
Employed - include all those who, during the reference period are 15 years old and over as of their last birthday and are reported either:
At work. Those who do any work even for one hour during the reference period for pay or profit, or work without pay on the farm or business enterprise operated by a member of the same household related by blood, marriage or adoption; or
With a job but not at work. Those who have a job or business but are not at work because of temporary illness/injury, vacation or other reasons. Likewise, persons who expect to report for work or to start operation of a farm or business enterprise within two weeks from the date of the enumerator’s visit, are considered employed. (Philippine Statistics Authority)
Employment Rate - proportion in percent of the total number of employed persons to the total number of persons in the labor force. (Philippine Statistics Authority)

Appendix - 9
Household – an aggregate of persons, generally but not necessarily bound by ties of kinship, which live together under the same roof and eat together or share in common the household food. Members comprise the head of the household, relatives living with him and other persons who share the community life for reasons of work or other consideration. A person who lives alone is considered a separate household. (Philippine Statistics Authority) Labor Force – the population 15 years old and over whether employed or unemployed who contribute to the production of goods and services in the country. (Philippine Statistics Authority) Labor Force Participation Rate – proportion in percent of the total number of persons in the labor force to the total population 15 years old and over. (Philippine Statistics Authority) Overseas Contract Workers (OCW) - any individual who was or presently engaged in gainful employment in a foreign country, covered by a specific “contract of employment” defining the terms and conditions of that employment and the employer-employee relationship, provided that the herein referred contract was approved for implementation/application by the Philippine Overseas Employment Administration (POEA) and the deployment/mobilization having been authorized by the POEA and provided further that the corresponding Welfare Fund Contribution having been paid at the time of employment processing at POEA or at any time thereafter as in the case of legitimized overseas contract worker, the latter gaining recognition thru the process of latent legitimacy in accordance with applicable rules and policies in applicable case/s. The OCW may be landbased or seabased Overseas Filipino Worker (OFW) – a Filipino worker who is to be engaged, is engaged, or has been engaged in a remunerated activity in a country of which he/she is not a legal resident. (Philippine Statistics Authority)
Rural Area – an area not falling under any of the classifications of an urban area. (Philippine Statistics Authority) Underemployed – include all employed persons who express the desire to have additional hours of work in their present job or an additional job, or to have a new job with longer working hours. (National Statistics Office) Underemployment Rate – proportion in percent of the total number of underemployed persons to the total number of employed persons. (Philippine Statistics Authority) Unemployed**** - include all persons who are 15 years old and over as of their last birthday and are reported as:
without work , i.e., had no job or business during the basic survey reference period; AND
currently available for work , i.e., were available and willing to take up work in paid employment or self-employment during the basic survey reference period, and/or would be available and willing to take up work in paid employment or self-employment within two weeks after the interview date; AND
seeking work, i.e., had taken specific steps to look for a job or establish a business during the basic survey reference period; OR not seeking workdue to the following reasons: (a) tired/believe no work available, i.e., the discouraged workers who looked for work within the last six months prior to the interview date; (b) awaiting results of previous job application; (c) temporary illness/disability; (d) bad weather; and (e) waiting for rehire/job recall.
Unemployment Rate – proportion in percent of the total number of unemployed persons to the total number of persons in the labor force. (Philippine Statistics Authority) Union – any registered group or association of employees that exist in whole or in part for the purpose of collective bargaining or of dealing with employers concerning terms and conditions of employment. A union may be formed in the private or public sector. (Philippine Statistics Authority)
Visibly Underemployed Persons - those who worked for less than 40 hours during the reference period and want additional hours of work
POPULATION AND HOUSING

Appendix - 10
Household3 - a social unit consisting of a person living alone or a group of persons who sleep in the same housing unit
and have a common arrangement in the preparation and consumption of food. Housing Unit3 - a structurally separate and independent place of abode which, by the way it has been constructed, converted or arranged is intended for habitation by one household. Structures or parts of structures which are not intended for habitation such as commercial, industrial, and cultural buildings or natural and man-made shelters such as caves, boats, abandoned trucks, culverts, and others, but which are used as living quarters by households. Human Development Index3 - a measure of how well a country has performed, not only in terms of real income growth, but also in terms of social indicators of people’s ability to lead a long and healthy life, to acquire knowledge and skills, and to have access to the resources needed to afford a decent standard of living. Life Expectancy3 – represents the average number of years remaining to a person who survives to the beginning of a given age or age interval x. Life Expectancy at Birth3 – is defined as the number of years a newborn child can be expected to live under a given mortality condition of an area in a given year Marital Status3 - status of an individual in relation to marriage, classified as follows: a) Single - A person who has never been married; b) Married - A couple living together as husband and wife, legally or consensually; c) Divorced - A person whose bond of matrimony has been dissolved legally and who therefore can remarry; d) Separated - A person separated legally or not from his/her spouse because of marital discord or misunderstanding; and e) Widowed - A person whose bond of matrimony has been dissolved by death of his/her spouse. Medium Assumption - moderate fertility decline and moderate mortality decline
Migration3 - the movement of people across a specific boundary for the purpose of establishing a new or semi-permanent residence. Two distinct types are international migration (migration between countries) and internal migration (migration within a country). Population3 - total number of individuals in a territory at a specified time. It covers both nationals and aliens, native and foreign-born persons, internees, refugees and any other group physically present within the borders of a country at a specified time. In assembling national demographic statistics for publication, the basic aim has been to obtain data for the physically present (or “de facto”) population rather than for the legally established resident (or “de jure”) inhabitants. Population Density3 - refers to the number of persons per unit of land area (usually in square kilometers). This measure is more meaningful if given as population per unit of arable land. Population Distribution3 - the patterns of settlement and dispersal of a population.
Population Growth Rate3 – indicates how fast a population increases or decreases as a result of the interplay of births, deaths, and migration during a given period of time. Where the population is closed, meaning no migration, the population growth rate is the same as the rate of natural increase, i.e., the difference between the number of births and the number of deaths during a specified period of time. The three methods for computing the rate of growth based on the assumption with respect to the change are: arithmetic change, geometric change and exponential change. Population Projections3 - computation of future changes in population numbers, given certain assumptions about future trends in the rates of fertility, mortality and migration. Demographers often publish high, medium, and low projections of the same population based on different assumptions of how these rates will change in the future. Sex Ratio3 - the number of males per 100 females in a population.
Total Fertility Rate3 – the average number of children that would be born alive to a woman (or group of women) during her lifetime if she were to pass through her childbearing years conforming to the age specific fertility rates of a given time period.

Appendix - 11
PUBLIC ADMINISTRATION Capital Revenue - resources realized from the sale of fixed or capital assets, such as building, equipment, machine and intangibles City - there are three classes of cities in the Philippines: the highly urbanized, the independent component cities which are independent of the province, and the component cities which are part of the provinces where they are located and subject to their administrative supervision.
Debt Service - the sum of loan repayments, interest payments, commitment fees and other charges on foreign and domestic borrowings.
Extraordinary Income - collections derived from the repayment of loans and advances made by the government as well as from other non-recurring sources. Financing Account - means of funding government expenditure consisting of domestic and external borrowing less amortization and changes in government holding of cash to cover the differences between total revenue and total expenditures of the national government. General Public Services - this covers expenditures for services which are indispensable to the existence of an organized state and cannot be allocated to specific sectors or subsectors. This includes executive and legislative services; overall financial and fiscal services; civil services; planning; conduct of foreign affairs; general research, public order and safety and centralized services. Municipality – is a political corporate body which is endowed with the facilities of a municipal corporation, exercised by and through the municipal government in conformity with law. It is a subsidiary of the province which consists of a number of barangays within its territorial boundaries, one of which is the seat of government found at the town proper (poblacion). Net Lending - advances by the national government for the servicing of government guaranteed corporate debt during the year, net of repayments on such advances. Includes loans outlays or proceeds from program loans relent to government corporations. Non-Tax Revenue - revenue collected from sources other than compulsory tax levies. Includes those collected in exchange for direct services rendered by government agencies to the public, or those arising from the government’s regulatory and investment activities.
Personal Services - provisions for the payment of salaries, wages and other compensation (e.g., merit, salary increase, cost of living allowances, honoraria and commutable allowances) of permanent, temporary, contractual and casual employees of the government. Province - the largest unit in the political structure of the Philippines. It consists, in varying numbers, of municipalities and, in some cases, of component cities. Its functions and duties in relation to its component cities and municipalities are generally coordinative and supervisory. Public Sector - consists of the National Government, local governments, government-owned or controlled corporations and government monetary institutions Revenue - a cash inflow which does not increase the liability of the government.
Sectoral Allocation of Expenditures - this categorize the purpose of government expenditure. The classification focuses on the purposes for which outlays are made, irrespective of the agency of government through which they were made
Taxes on Property - taxes imposed on the ownership of wealth or immovable properties and on the transfer of real or personal properties, both tangible and intangible. Source: Department of Budget and Management

Appendix - 12
PUBLIC ORDER, SAFETY AND JUSTICE
Crime - is an act in violation of penal law. For statistical purposes, only crimes reported to authorities are covered. Index Crimes - refer to those violations of the penal code considered to have socio-economic significance, and occur
with sufficient regularity to be meaningful. These include crimes versus person (murder, homicide, physical injury and
rape), and crimes versus property (robbery and theft). Non-Index Crimes - refer to all other crimes not classified as index crimes. These are mostly composed of victimless offenses (e.g., crimes against national security, crimes against the fundamental laws of the state, crimes against public order, crimes against public morals, and violations of special laws).
Crime Rate - is the number of reported crimes per 100,000 population. Drug/Substance Abuse - is the misuse of any chemical, licit or illicit, which results in an individual’s physical, mental/emotional or social impairment.
SOCIAL SERVICES
Difficulty – is usually manifested when a person is doing an activity with increased effort, discomfort or pain, slowness, or changes in the way he/she does the activity.
Seeing – refers to an individual using his/her eyes and vision capacity in order to perceive or observe what is happening around him/her. Hearing – refers to individual using his/her ears and auditory (or hearing) capacity in order to know what is being said to him/her or the sounds of activity, including danger that is happening around him/her. Walking – refers to an individual using his/her legs in such a way as to propel himself/herself over the ground to get them from one point or place to another. Remembering – refers to an individual using his/her memory capacity in order to recall what has happened around him/her. It means the individual can bring to mind or think again about something that has taken place in the past (either the recent past of further back). In connection with younger people, remembering is often associated with storing facts learned in school and being able to retreieve them when needed. Concentrating – refers to an individual using his/her mental ability to accomplish some tasks such as reading, calculating numbers, and learning something. It is associated with focusing on the task at hand in order to complete it. It is the act of directing one’s full attention to subject or to focus without distraction on one thing. Bathing – refers to the process of cleaning one’s entire body (usually with a soap and water). The washing activity includes cleaning hair and feet, as well as gathering any necessary items for bathing such as soap or shampoo, a washcloth, or water. Dressing – refers to all aspects of putting clothing or garments on the upper and lower body, including the feet. Gathering clothing from storage areas (such as closet or dressers), securing buttons, tying knots, zipping and others, should be considered part of the dressing activity. Communicating – refers to and individual exchanging information or ideas with other people through the use of language.
Disability – refers to any restriction or lack of ability (resulting from an impairment) to perform an activity in the manner or within the range considered normal for a human being. Impairments associated with disabilities may

Appendix - 13
be physical, mental, or sensory motor impairment such as partial or total blindness and deafness, muteness, speech defect, orthopaedic handicaps, and mental retardation. Functioning – is an umbrella term for body functions, body structures, activities and participation. (International Classification of Functioning, Disability, and Health of the World Health Organization) Person with difficulty in functioning – means difficulties an individual may have in executing activities. Health conditions – refer to diseases or illnesses, other health problems that may be short or long lasting, injuries, mental or emotional problems, and problems with alcohol and drugs.
TOURISM Country of Residence – consists of the country where she/he has lived for most of the past year (12 months), or for a shorter period if she/he intends to return within 12 months to live there. Tourism3 - Comprises the activities of persons traveling to and staying in places outside their usual environment for not more than one consecutive year for leisure, business and other purposes not related to the exercise of an activity remunerated from within the place visited.
Tourist3 - visitor who stays one or more nights in the place visited. Visitor3 - any person traveling to a place other than that of his/her usual environment for less than 12 months and whose main purpose of trip is other than the exercise of an activity remunerated from within the place visited. Visitor Arrivals – includes tourist, excursionists, aliens entering the country for a temporary stay not exceeding one year and for purposes other than immigration, permanent residence or employment for remuneration in the country and Filipino nationals residing permanently abroad on temporary stay in the Philippines not exceeding one year. This excludes the following: a) transit visitors and change-plan passengers who remain in the premises of the port of entry terminal; b) aliens with pre-arranged employment for remuneration in the Philippines, even if length of stay is less than 59 days; c) Filipinos living abroad, regardless of length of stay overseas who are not permanent residents abroad; d) immigrants or aliens with permanent residence in the Philippines; e) Filipino overseas contract workers on home visits; and f) returning residents of the Philippines.
TRANSPORTATION AND COMMUNICATIONS Port - a sheltered harbor where marine terminal facilities are provided, consisting of piers or wharves at which ships berth/dock while loading or unloading cargo, transit sheds and other storage areas where ships may discharge incoming cargo, and warehouses where goods may be stored for longer periods while awaiting distribution or sailing. Radio Stations - one or more transmitters or receivers or a combination of transmitters and receivers including the accessory equipment, necessary at one location for carrying on a radio communication service. Each station shall be classified by the service in which it operates permanently or temporarily. VITAL, HEALTH AND NUTRITION Child Mortality Rate (CMR)5 - the probability of dying between exact age one and age five, expressed as the number of deaths of children from exact age one to less than age five during a given period per 1,000 children surviving to age 12 months at the beginning of the period. Infant Mortality Rate (IMR)5 – the probability of dying between birth and age one, expressed as the number of infant deaths or deaths occurring before reaching 12 months of life in a given period per 1,000 live births.

Appendix - 14
Maternal Mortality Ratio (MMR)5 – the ratio between the number of women who died (for reasons of pregnancy, childbirth and puerperium) to the number of reported livebirths in a given year, expressed as the number of maternal deaths per 100,000 live births Footnotes:
1 PSA Board Resolution No. 01, Series of 2017-112 - Approving and Adopting the Official Concepts and Definitions for Statistical Purposes of the Selected Sectors: Agriculture, Fishery and Forestry, Foreign Direct Investments, and Tourism
2 PSA Board Resolution No. 01, Series of 2017-096 - Official Definition of Core Inflation
3 PSA Board Resolution No. 01, Series of 2017-100 - Approving and Adopting the Official Concepts and
Definitions for Statistical Purposes of the Selected Sectors: Prices, Population and Housing, and Tourism
4 PSA Board Resolution No. 01, Series of 2017-113 - Adoption of a New Official Definition of
Unemployment
5 PSA Board Resolution No. 01, Series of 2017-123 - Approving and Adopting the Official Concepts and Definitions for Statistical Purposes for the Health and Nutrition Sector
6 PSA Board Resolution No. 01, Series of 2017-129 - Approving and Adopting Six Formulas on the Official Concepts and Definitions for Statistical Purposes for the Education Sector
7 PSA Board Resolution No. 01, Series of 2017-130 - Approving and Adopting the Official Concepts and Definitions for Statistical Purposes for the Poverty Sector

Appendix - 15