Region 4 Ecological Risk Assessment Supplemental Guidance · Table 2b Region 4 Sediment Screening...
98
EPA United States Environmental Protection Agency Scientific Support Section Superfund Division EPA Region 4 March 2018 Update Region 4 Ecological Risk Assessment Supplemental Guidance Supplemental Guidance to ERAGS: Region 4, Ecological Risk Assessment. Originally published November 1995 and updated March 2018 Region 4 Risk Assessment Resources – https://www.epa.gov/risk/region-4-risk-assessment-contacts
Transcript of Region 4 Ecological Risk Assessment Supplemental Guidance · Table 2b Region 4 Sediment Screening...

EPA United States Environmental Protection Agency
Scientific Support Section
Superfund Division EPA Region 4
March 2018 Update
Region 4 Ecological Risk Assessment Supplemental Guidance
Supplemental Guidance to ERAGS: Region 4, Ecological Risk Assessment. Originally published November 1995 and updated March 2018 Region 4 Risk Assessment Resources – https://www.epa.gov/risk/region-4-risk-assessment-contacts

Region 4 Supplemental Guidance Scientific Support Section Table of Contents Superfund Division
TC-1 Last updated March 2018
Contents
Page No: Acronyms and Abbreviations ...................................................................................... AA-1 1.0 Overview .............................................................................................................. 1-1
1.1 Introduction and Purpose ......................................................................... 1-1 1.2 Coordination with Stakeholders ............................................................... 1-2
2.0 Screening Level Ecological Risk Assessment ..................................................... 2-1 2.1 Step 1: Screening-level Problem Formulation and Ecological Effects Evaluation ............................................................................................................ 2-1 2.2 Step 2: Screening-level Preliminary Exposure Estimate and Risk Calculation ........................................................................................................... 2-2 2.3 SLERA Uncertainties and Data Gaps ...................................................... 2-5 2.4 SLERA Report ......................................................................................... 2-5 2.5 Scientific/Management Decision Point .................................................. 2-10
3.0 Baseline Problem Formulation ............................................................................ 3-1 3.1 Refinement of Preliminary Chemicals of Potential Concern (Step 3a) ... 3-2
3.1.1 Conservative Mean Exposure Estimates and Refinement Screening Values……………. ................................................................ 3-3 3.1.2 Background Concentrations ......................................................... 3-4 3.1.3 Nutrients and Dietary Considerations .......................................... 3-4 3.1.4 Frequency, Magnitude, and Pattern of Detected Chemicals ........ 3-5 3.1.5 Mode of Toxicity and Potential for Bioaccumulation ................. 3-5 3.1.6 Multiple Contaminant Effects ...................................................... 3-6 3.1.7 Exposure Considerations ............................................................. 3-7 3.1.8 COPC Refinement Table ............................................................. 3-8 3.1.9 Uncertainties in the Refinement Screening Process .................. 3-11 3.1.10 Step 3a – Scientific/Management Decision Point ...................... 3-12
3.2 Baseline Problem Formulation Step 3b – Planning and Scoping of the Risk Assessment .................................................................................... 3-12 3.2.1 Known Ecological Effects of COPCs ........................................ 3-13 3.2.2 Contaminant Fate and Transport, Ecosystems Potentially at Risk, and Complete Exposure Pathways ......................................................... 3-13 3.2.3 Assessment Endpoints ............................................................... 3-15 3.2.4 Conceptual Model and Risk Questions ...................................... 3-15 3.2.5 Scientific/Management Decision Point ...................................... 3-17
4.0 Study Design ........................................................................................................ 4-1 4.1 Establishing Measurement Endpoints ...................................................... 4-1 4.2 Scientific/Management Decision Point .................................................... 4-3

Region 4 Supplemental Guidance Scientific Support Section Table of Contents Superfund Division
TC-2 Last updated March 2018
5.0 Additional Steps in the Ecological Risk Assessment Process ............................. 5-1 6.0 Ecological Screening Values ............................................................................... 6-1
6.1 Surface Water Screening Levels .............................................................. 6-1 6.1.1 Water Quality Criteria and Great Lakes Initiative Tier 2 Values 6-2 6.1.2 State Surface Water Standards, Other Tier 2 Values and Canadian Water Quality Guidelines ........................................................................ 6-2 6.1.3 Surface Water Toxicity Modelled by Structure Activity Relationships ............................................................................................ 6-3 6.1.4 Surface Water Toxicity Data in EPA Knowledgebase ................ 6-3 6.1.5 Other Considerations for Surface Water Screening ..................... 6-3 6.1.6 Equilibrium Partitioning and Target Lipid Modeling to Derive Surface Water ESVs ................................................................................ 6-4
6.2 Sediment Screening Values ..................................................................... 6-7 6.2.1 Sediment ESVs based on Effect Ranges ...................................... 6-8 6.2.2 Sediment ESVs Based on Equilibrium Partitioning .................. 6-10 6.2.3 Sediment ESVs based on Narcotic Mode of Toxicity ............... 6-12 6.2.4 PAH Mixtures – Refinement Screening Values ........................ 6-12
6.3 Soil Screening Values ............................................................................ 6-14 6.4 Wildlife Screening Values ..................................................................... 6-15 6.5 Groundwater Screening Values ............................................................. 6-16
7.0 References ............................................................................................................ 7-1 Tables Table 1a Region 4 Surface Water Screening Values for Hazardous Waste Sites Table 1b Conversion Factors (CF) and Hardness-Dependent Equations Table 1c Example Freshwater Screening Values for Varying Degrees of Water
Hardness Table 2a Region 4 Sediment Screening Values for Hazardous Waste Sites for
Non-Narcotic Modes of Action Table 2b Region 4 Sediment Screening Values for Hazardous Waste Sites for
Narcotic Mode of Action Table 2c Region 4 Step 3a Sediment Screening Values for Polycyclic Aromatic
Hydrocarbons (PAHs) at Hazardous Waste Sites Table 3 Region 4 Soil Screening Values for Hazardous Waste Sites

Region 4 Supplemental Guidance Scientific Support Section Table of Contents Superfund Division
AA-1 Last updated March 2018
Acronyms and Abbreviations
% percent ΣTU Sum Toxic Unit ACR acute to chronic ratio ARAR applicable or relevant and appropriate requirement BAF bioaccumulation factor BERA Baseline Ecological Risk Assessment BLM Biotic Ligand Model BSV background screening value CaCO3 calcium carbonate CCC Criteria Continuous Concentration CERCLA Comprehensive Environmental Response, Compensation, and Liability Act CF conversion factor CLP Contract Laboratory Program cm3 cubic centimeter CMC Criteria Maximum Concentration COPCs chemicals of potential concern CS Confirmation Sampling CSM conceptual site model CTLBB critical lipid body burden DDD dichlorodiphenyldichloroethane DDE dichlorodiphenyldichloroethylene DDT dichlorodiphenyltrichloroethylene DoD Department of Defense DOI U.S. Department of Interior DQO data quality objective dw dry weight EBS environmental baseline survey EcoSSL Ecological Soil Screening Level ECOSAR Ecological Structure Activity Relationships EPA U.S. Environmental Protection Agency EPC exposure point concentration EPI Estimation Program Interface

Region 4 Supplemental Guidance Scientific Support Section Table of Contents Superfund Division
AA-2 Last updated March 2018
Acronyms and Abbreviations (continued) EqP equilibrium partitioning ERA Ecological Risk Assessment ERAGS Ecological Risk Assessment Guidance for Superfund ER-L effects range-low ER-M effects range-median ESB EqP sediment benchmark ESI Expanded Site Investigation ESV ecological screening value FDEP Florida Department of Environmental Protection g/cm3 grams per cubic centimeter GERA Guidelines for Ecological Risk Assessment GLI Great Lakes Initiative HMW-PAH high molecular weight polycyclic aromatic hydrocarbon HQ hazard quotient Kow partition coefficient LANL Los Alamos National Laboratory LMW-PAH low molecular weight polycyclic aromatic hydrocarbon LOAEL Lowest Observed Adverse Effect Level L/kg liters per kilogram mg/kg milligrams per kilogram mg/L milligrams per liter mmol/L millimoles per liter µmol/g micrograms per gram µg/kg micrograms per kilogram µg/L micrograms per liter NCP National Oil and Hazardous Substances Pollution Contingency Plan NOAA National Oceanic and Atmospheric Administration NOAEL No Observed Adverse Effect Level NWQC National Water Quality Criteria OC organic carbon OLEM Office of Land and Emergency Management ORNL Oak Ridge National Laboratory PA/SI Preliminary Assessment/Site Inspection PBT persistent, bioaccumulative and toxic

Region 4 Supplemental Guidance Scientific Support Section Table of Contents Superfund Division
AA-3 Last updated March 2018
Acronyms and Abbreviations (continued) PAH polycyclic aromatic hydrocarbon PCB polychlorinated biphenyl PCOPC preliminary chemical of potential concern PEC probable effect concentration PEL probable effect level pH hydrogen ion concentration PRGs preliminary remedial goals RCRA Resource Conservation and Recovery Act of 1976 RFA Resource Conservation and Recovery Act Facility Assessment RFI Resource Conservation and Recovery Act facility investigation RI remedial investigation RPM remedial project manager ROD Record of Decision RSV refinement screening value SAP Sampling and Analysis Plan SI Site Investigation SLERA Screening-Level Ecological Risk Assessment SMDP scientific/management decision point SSS Scientific Support Section SVOC semi-volatile organic compound TEC threshold effect concentration TEL threshold effect level TLM target lipid model TOC total organic carbon TRV toxicity reference value UCL upper confidence limit VOC volatile organic compound WQB water quality benchmark

Region 4 Supplemental Guidance Scientific Support Section Table of Contents Superfund Division
1-1 Last updated March 2018
1.0 Overview 1.1 Introduction and Purpose The role of an Ecological Risk Assessment (ERA) is to: (1) determine whether unacceptable risks are posed to ecological receptors from chemical stressors, (2) derive chemical levels that would not pose unacceptable risks, and (3) provide the information necessary to make a risk management decision concerning the practical need and extent of remedial action. The purpose of this supplemental guidance is to provide regional direction for implementation of the U.S. Environmental Protection Agency (EPA) Ecological Risk Assessment Guidance for Superfund (ERAGS; EPA, 1997). This guidance is appropriate for Superfund sites under the authority of the Comprehensive Environmental Response, Compensation, and Liability Act (CERCLA) and regulated by the Office of Land and Emergency Management (OLEM). The Guidelines for Ecological Risk Assessment (GERA; EPA, 1998) published by the Risk Assessment Forum provide agency-wide guidance. This supplemental guidance clarifies the National ERAGS guidance as appropriate at both Resource Conservation and Recovery Act (RCRA) and Superfund sites. The ERA process as outlined in ERAGS consists of eight steps and five scientific/management decision points (SMDPs). These steps are:
1) Screening-level Problem Formulation and Ecological Effects Evaluation, 2) Screening-level Exposure Estimate and Risk Calculation 3) Baseline Problem Formulation, 4) Study Design and Data Quality Objectives (DQO) Process, 5) Field Verification of Sampling Design, 6) Site Investigation and Data Analysis, 7) Risk Characterization, and 8) Risk Management.
The decision points follow Steps 2 - 5, and 8. The decision points provide an opportunity to reach agreement between the risk manager for the site (e.g. the remedial project manager [RPM]), the risk assessment review team and any other stakeholders in the process. Exhibit I-2 from ERAGS provides a flow chart for the process.

Region 4 Supplemental Guidance Scientific Support Section Table of Contents Superfund Division
1-2 Last updated March 2018
ERAGS and this supplemental guidance provide a logical approach for evaluating ecological risks and documenting ecological concerns for remedial decision making. Project managers are guided in balancing the scope of the risk assessment against the hazards posed by the site conditions. Interaction among risk managers, risk assessors, and appropriate stakeholders is vital to all stages of the process. This guidance also promotes flexibility on a case-by-case basis regarding completion of an ERA with appropriate expenditure of effort and resources. Additional resources may be found on the EPA’s Waste and Cleanup Risk Assessment website, particularly in the ECO Update Bulletin Series issued by OLEM. This supplemental guidance contains a focused discussion of elements and topics related to CERCLA and RCRA ERAs. The guidance and direction contained in this supplemental guidance can be somewhat broad; therefore approval of specific ERA approaches that may depart from this guidance should be obtained from the EPA Region 4 Scientific Support Section (SSS). The EPA Region 4 Supplemental Guidance is a dynamic document. Sections will be updated and new ones added as questions are posed and regional practices are developed. This guidance does not constitute rulemaking by the Agency, and may not be relied on to create a substantive or procedural right enforceable by any other person. Region 4 reserves the right to take action that is at variance with this guidance. The intent of this guidance is to aid in the development of high-quality, single draft risk assessments consistent with the criteria of the SSS in its oversight role. 1.2 Coordination with Stakeholders The National Oil and Hazardous Substances Pollution Contingency Plan (NCP) requires the lead agency to seek to coordinate investigations with stakeholders. Stakeholders in the ERA process include state and federal regulatory and scientific personnel, and natural resource trustees. These stakeholders should be notified early in the ERA process if ecological concerns exist at a site. The public is also a stakeholder, and members of the public should be included in the decision process during those times normally arranged for public input, such as the public comment period of the CERCLA proposed plan or the RCRA statement of basis. Natural resource trustees are representatives of federal agencies, state and/or tribes that share responsibility with the EPA in protecting the natural resources of the United States,

Region 4 Supplemental Guidance Scientific Support Section Table of Contents Superfund Division
1-3 Last updated March 2018
including “land, fish, wildlife, biota, air, water, ground water, drinking water supplies, and other such resources.” Trustees may include representatives of other federal agencies such as the Department of Interior (DOI), Department of Defense (DoD), the National Oceanic and Atmospheric Administration (NOAA), state and/or tribal officials designated by the governor of the state, as well as private and non-profit conservation organizations. Federal and state trustees in EPA Region 4 are listed under Contacts in Section 1.3. The failure of an identified trustee or stakeholder to participate should not delay completion of these steps. Any questions regarding the stakeholder involvement should be directed to the Region 4 SSS.

Region 4 Supplemental Guidance Scientific Support Section Table of Contents Superfund Division
2-1 Last updated March 2018
2.0 Screening Level Ecological Risk Assessment The Screening-level Ecological Risk Assessment (SLERA) represents the first two steps in the ERAGS process and is intended to allow a rapid determination by the risk assessment team and risk managers whether a waste site poses no or negligible ecological risk, or to identify which contaminants and exposure pathways require further evaluation. SLERA activities can commence as soon as ecological concerns are identified and appropriate chemical analytical data are available for a given site. Often, limited environmental chemical data are available. Data from Preliminary Assessment/Site Inspection (PA/SI) reports in the CERCLA process, or a RCRA Facility Assessment (RFA) or Confirmation Sampling (CS) in the RCRA process or data from an Environmental Baseline Survey (EBS) can be used. The SLERA is recommended to begin upon completion of an Expanded Site Investigation (ESI) in the Superfund program or completion of a RFA in the RCRA program. If there are concerns about the potential for ecological risk at a site, ecological risk assessors can be consulted before these investigations have been performed, to obtain input that may be useful even for the initial investigations on a site. Waiting until a remedial investigation (RI) or a RCRA Facility investigation (RFI) data are available to begin the SLERA may result in additional data collection that may be costly and potentially redundant. However, the SLERA can be iterated as new data become available. Details of how to handle phased projects should be worked out with the risk managers. Please direct any questions regarding the scope of a process and timing of an ERA or about technical issues in ERA to SSS. 2.1 Step 1: Screening-level Problem Formulation and
Ecological Effects Evaluation The screening-level problem formulation explains important environmental aspects in defining risk management decisions at the site and includes review of existing information on the following:
• Environmental setting and contaminants known or suspected at the site; • Contaminant fate and transport mechanisms that may exist; • The mechanisms of ecotoxicity associated with contaminants and likely affected
receptors;

Region 4 Supplemental Guidance Scientific Support Section Table of Contents Superfund Division
2-2 Last updated March 2018
• Identification of complete exposure pathways; • Selection of endpoints to screen for ecological risk; and • A preliminary ecological effects evaluation that should include screening
ecotoxicity values based on conservative thresholds such as chronic no-observed-adverse-effect-levels (NOAELs).
This information and a description of complete and potentially complete exposure pathways present at the site should be presented in a preliminary conceptual site model (CSM). Potentially complete exposure pathways refer to exposure pathways that are not currently complete but might become complete in the future. Potentially complete exposure pathways should be retained in Steps 1 and 2. Incomplete exposure pathways should also be identified and discussed. The screening-level problem formulation can contain maps, figures, and color photographs of the site and surrounding area, if available. Completion of the Checklist for Ecological Assessment/Sampling (Appendix B – ERAGS) is highly recommended. Site visits by review personnel are strongly encouraged. 2.2 Step 2: Screening-level Preliminary Exposure Estimate and
Risk Calculation The screening-level exposure estimate and risk calculation provide a conservative risk estimate to ensure that sites with unacceptable risk will be recommended for further evaluation. The maximum concentrations of chemicals in each medium are compared to ecological screening values (ESVs) to determine preliminary chemicals of potential concern (PCOPCs). Ecological screening values are based on chemical concentrations associated with a low probability of unacceptable risks to ecological receptors. A detailed discussion of the ESV development for EPA Region 4 is provided in Section 6. Tables 1a – 1e, 2a – 2c, and 3 list the chemical ESVs in surface water, sediment and soil, respectively. Since the ESVs are based on conservative endpoints and sensitive ecological effects data, they represent a preliminary screening of site chemical concentrations to determine if there is a need to conduct further investigations at the site. ESVs are not recommended as remediation levels. Exceedance of the ESVs may indicate the need for further evaluation of the potential ecological risks posed by the site. To perform the screening level risk calculation, the

Region 4 Supplemental Guidance Scientific Support Section Table of Contents Superfund Division
2-3 Last updated March 2018
maximum detected concentration (or if not detected, a surrogate concentration based on one-half the detection limit) of a given chemical in a medium is divided by the Region 4 ESV for that medium. The result is the Hazard Quotient (HQ). There are a minimum of four (4) categories of PCOPCs as defined by the following criteria:
1. HQ≥1. The maximum detected concentration was greater than or equal to the ESV.
2. The chemical was detected, but no ESV was available. 3. The chemical was not detected, but the surrogate concentration was greater than
or equal to the ESV. (HQ≥1) 4. The chemical was not detected, and no ESV was available.
For Category 2 and Category 4 chemicals that have no available ESVs, it is possible that these chemicals could cause an adverse effect depending on the detected concentration or the adequacy of the analytical detection limit. These circumstances would be identified as uncertainties and these chemicals would be included as PCOPCs and carried forward to into Step 3a of the Baseline Problem Formulation. There should be very few PCOPCs in Categories 2 and 4 because ESVs can be generated for chemicals that are not on the screening tables, as described in Section 6 of this document. It is recognized for surface water ESVs that States have water quality standards for aquatic life protection that may be lower than the ESVs in Table 1a. Therefore, it is highly recommended that the State standards be reviewed and incorporated into the site-specific screening tables if they are more conservative than the ESVs. In this Step 2, local or regional background concentrations should not be used. For screening of polycyclic aromatic hydrocarbons (PAHs) in sediment (Table 2b) and soil (Table 3), the sum total of low molecular weight PAHs (LMW-PAHs) or high molecular weight PAHs (HMW-PAHs) screening values are to be used. Tables summarizing the ecological screening for chemicals at the site should be constructed to aid project managers with decision making processes. The presence or absence of each chemical, for all media of concern, should be listed with descriptive data such as the frequency of detection, range of detection, location(s) of maximum detection, screening criteria, and screening outcome. See the example table at the end of this subsection for screening chemicals in soil. In addition, the flowchart located at the end of

Region 4 Supplemental Guidance Scientific Support Section Table of Contents Superfund Division
2-4 Last updated March 2018
this section provides an organization of the screening process used in Steps 1 through 3. The Region 4 ESVs consider direct toxicity as well as bioaccumulative effects on organisms, and the lowest protective value is chosen as the ESV. The term “direct” toxicity refers to adverse effects associated with exposure to a chemical dissolved in or incorporated into an environmental medium through immediate contact with the medium. For screening, the exposure point concentration (EPC) for direct toxicity to sessile organisms is the maximum detected concentrations in the habitat where these organisms live or could potentially live. In addition to direct toxicity, there are chemicals that substantially bioaccumulate into upper trophic level receptors and many of the ESVs are protective of these receptors. For example, some of the National Recommended Water Quality Criteria for pesticides such as dichlorodiphenyltrichloroethylene (DDT) and chlordane are based on bioaccumulation and wildlife exposures. DDT is based on protection of aquatic-dependent wildlife – namely the brown pelican. In addition, the more conservative mercury number of 0.012 micrograms per liter (µg/L) accounts for bioaccumulation in piscivorous birds. Other chemicals such as PAHs and polychlorinated biphenyls (PCBs) also have benchmarks protective of upper trophic receptors. In the surface water and sediment screening tables, bioaccumulative chemicals are presented in red color. Organic bioaccumulative chemicals were identified with the EPA’s Estimation Program Interface (EPI) suite, bioconcentration factor (BCF) module. Chemicals estimated to have a log Arnot-Gobas model, upper trophic level fish BCF greater than 4 were considered bioaccumulative. The soil screening table includes those receptors that are protected by the benchmark value. In some cases, there are two screening values represented in Table 1a for bioaccumulative chemicals. Where this occurs, the maximum detected concentration is compared to the wildlife-based screening benchmark in addition to the direct contact benchmark. Detected bioaccumulative chemicals that do not have a wildlife-based ESV should automatically be retained as PCOPCs in Step 2. A food-chain model can be used in Step 3 to further screen bioaccumulative chemicals using Region 4 default food-chain model assumptions and toxicity reference values (see Section 3.1.5). Non-detected bioaccumulative chemicals that do not have a wildlife-based ESV are not retained as PCOPCs.

Region 4 Supplemental Guidance Scientific Support Section Table of Contents Superfund Division
2-5 Last updated March 2018
2.3 SLERA Uncertainties and Data Gaps An important part of a SLERA is identifying data gaps and uncertainties. This is especially true at sites with limited data. Uncertainty may occur in the degree of site characterization or in the potential for complete exposure pathways. Identification of data gaps and questions will guide future assessment steps. It is important to distinguish what is unknown from conclusions drawn regarding screening-level risks. 2.4 SLERA Report The format of the SLERA may depend on whether environmental monitoring data are collected in a single phase or as multiple phases. A SLERA performed as part of the site inspection can eliminate from consideration those portions of a site that pose no threat to the environment. In cases where potential threat to the environment cannot be eliminated, the SLERA becomes a part of the planning and scoping for Step 3 – Problem Formulation. While a baseline ecological risk assessment (BERA) would typically contain an extensive discussion of all of the risk elements, the degree of emphasis in the SLERA on particular elements is adjusted as necessary to support project-specific decision-making and planning. In general, the more detailed information that is presented in Step 1, the easier it will be to develop Step 3, if needed. The SLERA should be submitted for review to the regulatory project manager as a technical memorandum or as part of a Site Investigation (SI) report or a similar level report. Review personnel may include both the EPA staff and the EPA contractors. SSS provides oversight.

Region 4 Supplemental Guidance Scientific Support Section Table of Contents Superfund Division
2-6 Last updated March 2018
Example Table Depicting Ecological Screening for Chemicals in Soils CHEMICAL
Freq
. of
Det
ectio
n
Ran
ge o
f D
etec
tion
L
imits
Ran
ge o
f D
etec
ted
Con
c.
Loc
atio
n of
M
axim
um
Det
ecte
d C
onc.
EPA
Reg
ion
4 Sc
reen
ing
Val
ue
Max
Haz
ard
Quo
tient
(H
Q)
Freq
. E
xcee
ding
E
SV
PCO
PC
(Y/N
) Bas
is
Volatile Organic Compounds, µg/kg
1,2-Dichlorobenzene 2/10 4.9 – 6.4 3.5 - 100 SS-06 90 1.1 1/10 Yes/E Tetrachloroethene 10/10 4.8 - 9 10 – 210 SS-06 60 3.5 3/10 Yes/E 1,1,2-Trichloroethene 0/10 4.9 - 12 NA NA 180 NA 0/10 No/C Cyclohexane 0/10 4.9 - 12 NA NA NA NA 0/10 No/B
Semi-volatile Organic Compounds, µg/kg
2-Chlorophenol 0/10 5-20 NA NA 40 NA NA Yes/D 3-Chlorophenol 0/10 5-20 NA NA 7,000 NA NA Yes/D Pentachlorobenzene 2/10 79-120 40-2,200 SS-03 500 4.4 1/10 Yes/E Polycyclic Aromatic Hydrocarbons (PAHs), µg/kg
Low Molecular Weight Polycyclic Aromatic Hydrocarbons (LMW-PAHs)
Acenaphthene 2/10 220 - 360 24-54 SS-08 F NA NA No/F Fluorene 2/10 220 - 360 41-91 SS-08 F NA NA No/F Phenanthrene 3/10 220 - 350 23-120 SS-08 F NA NA No/F Naphthalene 1/10 220 - 360 ND-73 SS-08 F NA NA No/F Total LMW-PAHs1 4/10 220 - 350 70 - 265 SS-08 29,000 0.009 0/10 No/A
High Molecular Weight PAHs (HMW-PAHs), µg/kg
Benzo(a)anthracene 4/10 220 - 360 19 - 640 SS-09 F NA NA No/F Benzo(a)pyrene 2/10 220 - 350 20 - 590 SS-09 F NA NA No/F Benzo(b)fluoranthene 2/10 220 - 360 28 - 120 SS-09 F NA NA No/F Chrysene 1/10 220 - 350 21 - 130 SS-09 F NA NA No/F Dibenz(a,h)anthracene 1/10 220 - 350 ND - 46 SS-09 F NA NA No/F Indeno(1,2,3-cd)pyrene 5/10 220 - 350 21 - 54 SS-09 F NA NA No/F Pyrene 3/10 220 - 350 26 - 300 SS-09 F NA NA No/F

Region 4 Supplemental Guidance Scientific Support Section Table of Contents Superfund Division
2-7 Last updated March 2018
Example Table Depicting Ecological Screening for Chemicals in Soils CHEMICAL
Freq
. of
Det
ectio
n
Ran
ge o
f D
etec
tion
L
imits
Ran
ge o
f D
etec
ted
Con
c.
Loc
atio
n of
M
axim
um
Det
ecte
d C
onc.
EPA
Reg
ion
4 Sc
reen
ing
Val
ue
Max
Haz
ard
Quo
tient
(H
Q)
Freq
. E
xcee
ding
E
SV
PCO
PC
(Y/N
) Bas
is
Total HMW-PAHs2 5/10 220 - 350 21 – 1,800 SS-09 1,100 1.6 1/10 Yes/E
Pesticides, µg/kg
4,4’-DDD 7/10 4.9 – 5.2 2.8 - 25 SS-07 6.3 4 0/10 Yes/E 4,4’-DDE 6/10 4.9 – 5.2 2.4 - 49 SS-07 110 0.4 0/10 No/A 4,4’-DDT 6/10 4.9 – 5.2 2.5 - 110 SS-07 1.7 65 1/10 Yes/E Total DDT 7/10 4.9 – 5.2 18.3 - 184 SS-07 21 8.8 5/10 Yes/E Heptachlor 1/10 2.7 – 4.7 ND - 140 SS-07 59 2.4 2/10 Yes/E
Inorganic Compounds, mg/kg
Copper 9/10 1 - 1.3 10.4 - 66 SS-07 28 2.4 3/10 Yes/E Manganese 10/10 1 - 3 44 - 1,020 SS-06 220 4.6 6/10 Yes/E Sodium 3/10 61.3 – 70.6 2,550 SS-06 NA NA NA Yes/G Vanadium 10/10 1 - 3 12.1 - 54 SS-07 7.8 6.9 10/10 Yes/E
Footnotes: PCOPC = Preliminary Chemical of Potential Concern (yes/no) 1 = Total of low molecular weight PAHs includes acenaphthene, fluorene, phenanthrene, and naphthalene, 2 = Total of high molecular weight PAHs includes benzo(a)anthracene, benzo(a)pyrene, benzo(b)fluoranthene, chrysene, dibenz(a,h)anthracene, indeno(1,2,3-cd)pyrene, and pyrene A = Maximum detected concentration is less than the screening value. B = Chemical lacks a Region 4 screening value and was not detected in any sample. C = Maximum detection limit is less than screening value for a chemical not detected in any sample. D = Maximum detection limit exceeds screening value for a chemical not detected in any sample. E = Maximum detected concentration exceeds screening value. F = Chemical is a member of a class of compounds and the total concentration is screened against the screening value for the total compound in that class. G = Chemical was detected and no Region 4 ESV was available.

Region 4 Supplemental Guidance Scientific Support Section Table of Contents Superfund Division
2-8 Last updated March 2018
Step 1: Screening-level Baseline Problem Formulation & Maximum Exposure EstimatesStep 2: Ecological Screening Values, Risk Calculation, & Scientific and Management Decision Point
• Ecological Screening Values (ESVs) in Tables 1a-1c, 2a, & 3
Step 3: Baseline Problem Formulation & Conservative Mean Exposure Estimates
Max < ESV
Max ≥ ESV
Data GapsExit process
Continue To Step 3a• 95% UCLs• Refinement Screening Values (RSVs) in Tables 1d, 2b-2c, & 3
• Site-specific Background Screening Values (BSVs)
Max < BSV
Exit process
• Half Detection Limit for Non-detects
Yes No• Fortify Data Gaps
95% UCL < RSL
Yes
Yes
No
Execute Multiple Lines of Evidence

Region 4 Supplemental Guidance Scientific Support Section Table of Contents Superfund Division
2-9 Last updated March 2018
Step 3a: Refinement of Preliminary Chemicals of Potential Concern & Scientific and Management Decision Point • Multiple Lines of Evidence
• Background Concentrations • Nutrients & Dietary Considerations • Frequency, Magnitude, & Pattern of Detection • Mode of Toxicity & Potential for Bioaccumulation • Multiple Contaminant Effect & Sum Toxic Units for Organic
Chemicals in a Mixture • Exposure Considerations
• Step 3 Scientific & Management Decision Point • Chemicals of Potential Concern (COPCs) • Refined Exposure Pathways
Step 3b: Baseline Problem Formulation ‒ Planning & Scoping of Risk Assessment

Region 4 Supplemental Guidance Scientific Support Section Table of Contents Superfund Division
2-10 Last updated March 2018
2.5 Scientific/Management Decision Point Documentation of the activities in SLERA Steps 1 and 2 should be provided to all stakeholders prior to discussions associated with the SMDP. The first SMDP occurs after Step 2. The purpose of this SMDP is to determine the best course of action for the site. There are three outcomes of the Step 2 SMDP.
1. There is adequate information to conclude that ecological risks are negligible and therefore no need for remediation on the basis of ecological risk.
This first case covers the situation where one of three conditions are met: the site passed the screen, there are no complete or potentially complete exposure pathways to ecological receptors, or weight of evidence suggests ecological risks are relatively low and other risk management considerations apply, such as cleanup to protect human health will effectively address ecological risks. When the SLERA indicates that no potentially complete exposure pathways exist for a site and no further risk assessment is warranted, the site can exit the ERA at the end of Step 2. Note that sites with minimal habitat (e.g., industrial sites, mowed lawns and ditches) can exit the process in Step 2 if adequate justification is provided such as a habitat survey. The results of the SLERA are described in Step 8 (Risk Management) and included for the final RI or RFI report. Documentation must be included regarding why each of the subsequent steps (Steps 3 through 7) of the ERA is not needed. Steps 1 & 2, while abbreviated, are a complete risk assessment.
2. The information is not adequate to decide at this point, and the ERA process will continue to Step 3.
Generally, sites with Screening-Level HQs greater than 1 or with chemicals present that have no screening values are carried into Step 3 (Refinement of Preliminary COPCs and Baseline Problem Formulation).
3. The information indicates a potential for adverse ecological effects, and a more thorough assessment is warranted.
Data collected during the SLERA can be used to identify and prioritize areas within a site for potential need of interim removal actions. The SLERA results may also be useful at this point when considering other early risk management

Region 4 Supplemental Guidance Scientific Support Section Table of Contents Superfund Division
2-11 Last updated March 2018
options, such as focusing potential future investigations on key exposure pathways and receptors.
Region 4 Supplemental Guidance Scientific Support Section Table of Contents Superfund Division
3-1 Last updated March 2018
3.0 Baseline Problem Formulation Baseline Problem Formulation, or Step 3 of the EPA’s eight-step ERA process, is made up of three basic components:
1. Providing risk managers with sufficient information to determine which of the PCOPCs identified during the SLERA may need additional site-specific investigation and, which under more realistic exposure scenarios, may not require additional investigation;
2. Identifying all the potentially complete exposure pathways; and
3. Developing assessment endpoints that will be used to focus the remaining investigation to protect receptors of concern.
Baseline problem formulation is an opportunity to present additional information to help address any data gaps that may have been identified during the Step 2 SMDP and focus the remaining steps of the ERA process. Step 3 refines the screening-level problem formulation and, with input from the trustees and other involved parties, expands on the ecological issues that may require additional work at a site. This process includes the following activities:
• Refining preliminary chemicals of potential concern; • Further characterizing ecological effects of chemicals; • Reviewing and refining information on chemical fate and transport, complete
exposure pathways and ecosystems potentially at risk; • Developing assessment endpoints; • Developing a conceptual model with working hypotheses or questions that the site
investigation will address; and • Dividing the site into habitats for separate exposure groups, as appropriate.
When Baseline Problem Formulation is complete, a SMDP is required, resulting ideally in agreement on the basic components among the risk assessors, risk managers, and potentially other stakeholders.

Region 4 Supplemental Guidance Scientific Support Section Table of Contents Superfund Division
3-2 Last updated March 2018
3.1 Refinement of Preliminary Chemicals of Potential Concern (Step 3a)
An important activity defined in ERAGS (EPA 1997) is the refinement of PCOPCs. This supplemental guidance defines this activity as Step 3a. The goal of PCOPC refinement is to review the conservative assumptions used in the SLERA and determine if any of the PCOPCs would pose negligible risk if more realistic conservative assumptions were used. This helps to focus the ERA on identifying a realistic list of chemicals of potential concern (COPCs) that are more likely to pose risk to ecological receptors. The most important aspect of the refining process is the use of multiple lines of evidence to support a decision to drop a chemical from further investigation and providing adequate justification. Refinement screening values (RSVs) are screening values from other sources or are modifications to screening values to reflect site-specific conditions. Consistent with the Eco Update entitled “The Role of Screening-Level Risk Assessments and Refining Contaminants of Concern in Baseline Ecological Risk Assessments”, the refinement process should address chemicals based on the following criteria:
• Background concentrations; • Nutrients and dietary considerations; • Frequency, magnitude, and pattern of detected chemicals; • Mode of toxicity and potential for bioaccumulation; • Multiple contaminant effects; • Exposure considerations.
The COPC refinement should use more than one line of evidence to support decisions and should provide justification. The criteria listed above should be applied as a discussion rather than a simple pass-fail process. For example, if a contaminant is detected in less than 5 percent (%) of samples, it still may need to be retained as a refined COPC if site characterization is inadequate. The pattern of detection is important because all of the samples with concentrations above the RSV might be located adjacent to each other. The size of the impacted area could also be an indication of potential unacceptable risk if it is greater than the home range of a local area receptor.

Region 4 Supplemental Guidance Scientific Support Section Table of Contents Superfund Division
3-3 Last updated March 2018
Refer to the flowchart in Section 2.2. Each of these criteria is discussed in detail in the following sections. 3.1.1 Conservative Mean Exposure Estimates and Refinement Screening
Values
Chemicals that had site-wide maximum concentrations above the ESVs in Step 2 or those that lacked ESVs are carried into Step 3. At this point the maximum detected concentration should be replaced with the 95% upper confidence of the arithmetic mean (95% upper confidence limit [UCL]) as the EPC. Sites with multiple habitats can have more than one EPC for each chemical to reflect the averaging of samples from various exposure units within the site.
Refinement screening values will need to be developed for those chemicals that lacked tabulated ESVs in Step 2. The first column (chronic) of Tables 1a, 2a, 2b and the recommended screening value from Table 3 is used as ESVs for screening in Step 2. These ESVs are based on chronic effect values for aquatic organisms or based primarily on NOAELs. The second column of Tables 1a, 1e, 2a and 2b may be used as RSVs in Step 3a. These RSVs are based on less conservative values or lowest observed adverse effect level (LOAEL)-based effects. Other values in Table 3 may also be considered as RSVs depending on receptors of interest.
Many of the RSVs for organic chemicals were based on equilibrium partitioning and that a Sum Toxic Unit (ΣTU) approach by mode of action for screening for direct toxicity should be used as discussed in Section 3.1.6.
Acute surface water screening values can be used as refinement values for surface water. However, if the values are based on the National Recommended Water Quality Criterion or are State water quality standards, then the exposure durations relevant to the numerical criteria or standard will apply. Chemical-specific applicable or relevant and appropriate requirements (ARARs) such as State standards automatically become preliminary remedial goals (PRGs). Therefore, chemicals that were detected at concentrations above the ARAR will automatically become COPCs and cannot screen out by less restrictive RSVs.
For soils, an RSV other than the recommended soil screening value (which is the most conservative value among all possible receptors) can be selected for other receptors that are present or likely to be exposed to the site.

Region 4 Supplemental Guidance Scientific Support Section Table of Contents Superfund Division
3-4 Last updated March 2018
Refer to Section 6.1 for recommendations for using models to develop RSVs for chemicals lacking ESVs. Benchmarks from other sources can be provided for information but cannot be used to narrow the list of COPCs without an analysis of what the benchmark represents and whether it is appropriate. 3.1.2 Background Concentrations
Chemicals exceeding the screening values in the SLERA but determined to be at concentrations equal to or below the background screening value (BSV) generally do not require additional data collection or evaluation in the BERA. Details are found in the OLEM Directive “Role of Background in the CERCLA Program” (EPA, 2002a). The default BSV is conservatively set to twice the average concentration in the reference stations and compared to the site-wide maximum detected concentration. The chemical can be eliminated as a COPC if it is less than 2 times the average background level. If a chemical is not detected in the background yet detected at the site, then it is considered to exceed background. This process is a policy-based screening that recognizes that statistically-based background data sets may not be available. However, where background samples have been collected using a statistically valid approach, the Guidance for Comparing Background and Chemical Concentrations in Soil for CERCLA Sites (EPA, 2002b) can be applied on a site-specific basis. Background evaluations should also incorporate lines of evidence as presented in Sections 3.1.2 through 3.1.7 as well as the chemicals expected to be present at the site based on the site history. If a chemical is detected above background and above the refinement screening value, it goes into the weight of evidence consideration that can include the magnitude above background. 3.1.3 Nutrients and Dietary Considerations
Chemicals that are (1) essential nutrients, (2) present at low concentrations (i.e., only slightly elevated above background concentrations), and (3) toxic only at very high doses (i.e., much higher than those that could be associated with contact with the site) need not be considered further in the quantitative risk assessment. In general, only essential nutrients present at low concentrations (i.e., only slightly elevated above background) should be eliminated to help ensure that chemicals present at potentially toxic concentrations are evaluated in the quantitative risk assessment.

Region 4 Supplemental Guidance Scientific Support Section Table of Contents Superfund Division
3-5 Last updated March 2018
Essential nutrients that can be excluded include calcium, magnesium, sodium, and potassium. Iron should never be screened out purely on the basis of dietary considerations. Iron can be toxic at concentrations consistent with naturally occurring background concentrations under conditions of low hydrogen ion concentration (pH). 3.1.4 Frequency, Magnitude, and Pattern of Detected Chemicals
Chemicals that are infrequently detected may be artifacts in the data due to sampling, analytical, or other problems, and therefore may not be related to site operations or disposal practices. However, chemicals detected at concentrations significantly above the RSVs in one or a small number of samples should not be screened out, but rather be identified as hotspot contamination for resolution by risk managers and scientists at the Step 3a SMDP. Chemicals present at high concentrations over a small area might be acting as a contaminant source. Consider the chemical as a candidate for exclusion from the quantitative risk assessment if: (1) it is detected infrequently (i.e., < 5% of the samples) at low concentrations in one or perhaps two environmental media, (2) it is not detected in any other sampled medium or at high concentrations in any medium sampled, and (3) there is no reason to believe that the chemical should be present at the site. 3.1.5 Mode of Toxicity and Potential for Bioaccumulation
This refinement criterion evaluates the likelihood that chemicals could exert adverse effects on higher trophic level organisms. The assessment of chemicals that may bioaccumulate, bioconcentrate, or biomagnify will benefit from quantitative risk assessment using food-chain modeling. Chemicals retained from the SLERA that do not bioaccumulate still need to be screened for direct toxicity. For those chemical PCOPCs retained from Step 2 whose effects may be expressed via uptake through the food web, especially bioaccumulative/biomagnifying chemicals, simple food chain models can be presented as evidence to eliminate a chemical as a potential contaminant to wildlife. As mentioned in Section 2.2, the Estimation Program Interface (EPI) suite BCF module was used to identify organic bioaccumulative chemicals. The food chain models can be conducted for both aquatic and terrestrial pathways by selecting sensitive receptors (e.g., insectivorous mammals or avians) that are representative of the most sensitive endpoints such as reproductive effects. Since, at this stage in the 8-Step process, little is typically known about site-specific conditions, the

Region 4 Supplemental Guidance Scientific Support Section Table of Contents Superfund Division
3-6 Last updated March 2018
food chain model selected to evaluate effects via dietary/bioaccumulation exposure should be generic and conservative. The Region 4 SSS has developed basic food chain model assumptions and toxicity reference values (TRVs) that can be used in the refinement screening. These models and TRVs may also be used as a starting point for evaluating bioaccumulation in the BERA. The EPC for bioaccumulative chemicals and mobile organism exposure through contamination in their food supply is the 95% UCL on the arithmetic mean concentration within a defined spatial exposure unit. The 95% UCL concentration may be calculated by using ½ the sample quantitation limit for each sample where the chemical was not detected. For details and guidance on treating non-detected data see the ProUCL program website. Note that there may be more than one exposure unit within a site. The refinement process can be a tool to narrow the list of COPCs to certain spatial areas of a site. For media screening in this stage, the 95% UCL for a bioaccumulative chemical is compared to the same wildlife-based screening benchmark in Step 2. 3.1.6 Multiple Contaminant Effects
Contamination at many sites involve various chemical mixtures such as PAHs that are typically found at sites that released petroleum-based compounds into the environment, or halogenated aliphatic compounds (e.g., trichloroethylene, tetrachloroethylene) released from former dry cleaning sites. PAHs and many aliphatic and aromatic compounds generally share the same mode of narcosis toxicity to aquatic organisms. A protective advantage of using the common narcosis endpoint for these types of chemical mixtures is that it allows for the direct summation of the effects from each of the narcotic compounds detected in the particular medium. The refinement screening for these chemical mixtures in water, sediment and soil should apply the ΣTU approach as discussed below. To derive the narcosis ΣTU for a sample containing multiple narcotic chemicals (Tables 1 d and e for surface water and Tables 2b and 2c for sediment), the concentration of each detected narcotic contaminant is divided by its individual ESV. Then the toxic units for each of the chemicals are added together to obtain the ΣTU. If the ΣTU is >1.0, then a potential for narcotic toxicity exists to the organisms. Similarly, Table 2a, lists those chemicals that share the same toxic mode of action (e.g., many chlorinated pesticides are classified as central nervous system seizure agents). For those detected chemicals that

Region 4 Supplemental Guidance Scientific Support Section Table of Contents Superfund Division
3-7 Last updated March 2018
share the same toxic mode of action, the ΣTU approach should be used. See the example table below for screening of PAHs in sediment to protect benthic organisms and refer to Section 6.2.4. Note that none of the individual PAHs in the example table exceeded their final chronic values; however, when they are summed as contributing to narcosis, the PAHs collectively suggest a chronic risk to benthic organisms. Example Table Depicting Refinement Screening of PAHs as Chemicals of Potential Concern
in Sediment using Sum Toxic Unit Approach
CHEMICAL
Freq
. of D
etec
tion
Max
imum
Con
c.
mg/
kg d
ry w
t.
Max
imum
Con
c.
mg/
kg 1
% O
C
Fina
l Chr
onic
V
alue
(mg/
kg O
C)
ESB
TU
FCV
i
CO
PC (Y
/N)
Acenaphthene 6/10 0.18 J 18 491 0.037 See total Acenaphthylene 2/10 0.19 J 19 452 0.042 See total Anthracene 4/10 1.1 110 594 0.185 See total Fluorene 6/10 0.22 22 538 0.041 See total Naphthalene 2/10 0.13 J 13 385 0.034 See total Phenanthrene 9/10 0.82 82 596 0.138 See total Benzo(a)anthracene 4/10 1.12 112 841 0.133 See total Benzo(a)pyrene 2/10 0.69 69 965 0.072 See total Benzo(b)fluoranthene 2/10 0.21 21 979 0.021 See total Benzo(k)fluoranthene 0/10 0.1 U 5 981 0.005 See total Benzo(g,h,i)perylene 2/10 0.34 34 1,095 0.031 See total Chrysene 8/10 1.47 147 844 0.174 See total Dibenz(a,h)anthracene 0/10 0.1 U 5 1,123 0.004 See total Indeno(1,2,3-cd)pyrene 0/10 0.1 U 5 1,115 0.004 See total Pyrene 9/10 1.7 170 697 0.243 See total Σ ESBTU FCV, TOT 1.164 YES ESBTUFCVi = Equilibrium partitioning sediment benchmark toxic unit final chronic value = Maximum Conc. @ 1% Organic Carbon ÷ Final Chronic Value OC. See Section 6.2.4 for detailed discussion of PAH ΣTU. Besides the narcosis mode of action, multiple contaminant mixtures may include metals, pesticides or PCBs that exhibit different toxic modes of action and these should be briefly discussed in Step 3a when there may be multiple contaminant effects. 3.1.7 Exposure Considerations
In addition to the above discussions on refinement of COPC, exposure evaluations may assist in determining if a chemical may pose a threat to receptors. If there is supportable rationale that receptors are unlikely to be exposed to risk-related concentrations of a

Region 4 Supplemental Guidance Scientific Support Section Table of Contents Superfund Division
3-8 Last updated March 2018
COPC due to physical inaccessibility, extremely unfavorable habitat conditions where the COPC occurs, or some similar exposure consideration, then a COPC could potentially be screened out based on this rationale. If less conservative assumptions are used due to lack of sensitive habitat or receptors, justification should be provided, such as a habitat survey conducted by a trained biologist. 3.1.8 COPC Refinement Table
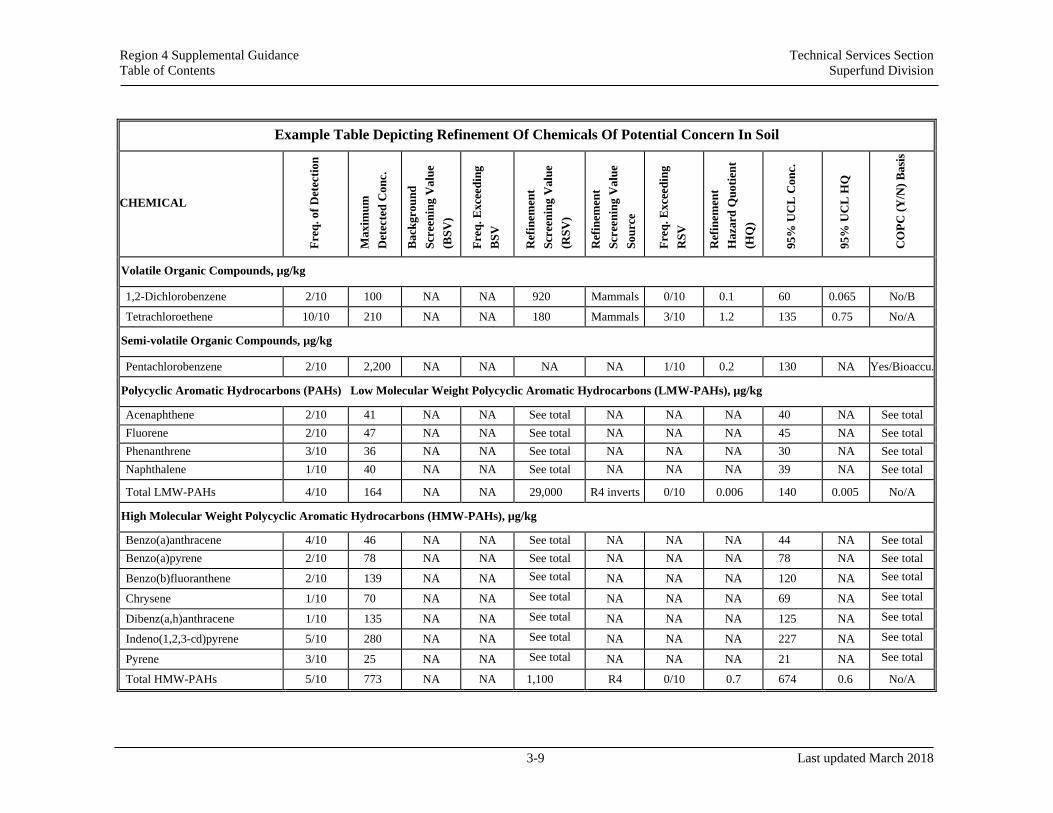
COPC refinement provides the risk manager with additional information about the magnitude and distribution of chemicals on site and the likelihood of adverse effects to receptors. This is accomplished by providing a COPC refinement table for each affected media. An example refinement table is included below. In addition to providing a summary of the information included in the screening-level risk characterization table (such as the frequency of detection, range of detections, location of maximum detection, and frequency of exceeding ESV), the refinement of COPCs table should include the mean concentration, background screening value, refinement screening value, refinement screening value source, refinement HQ, frequency of exceeding the RSV, frequency of exceeding the BSV, and COPC category. Chemicals that were previously screened out in the SLERA are not included in the refinement table. The following discussion briefly describes the content in each column of the refinement table. Background Screening Value (BSV). This column should present the site-specific reference values, or background values, that are being used for the ERA. Frequency Exceeding BSV. This column should indicate the number of sample locations whose concentration exceeds the reference concentration (background screening concentrations). Refinement Screening Value (RSV). This column should indicate the single refinement screening value agreed to by the risk manager, the Region 4 SSS and the trustees involved in the risk management decisions for the site. RSV Source. This column will most likely be for footnotes that will be included in detail at the bottom of each table to detail the source for each RSV included in the table.
Region 4 Supplemental Guidance Technical Services Section Table of Contents Superfund Division
3-9 Last updated March 2018
Example Table Depicting Refinement Of Chemicals Of Potential Concern In Soil
CHEMICAL
Freq
. of D
etec
tion
Max
imum
D
etec
ted
Con
c.
Bac
kgro
und
Scre
enin
g V
alue
(B
SV)
Freq
. Exc
eedi
ng
BSV
Ref
inem
ent
Scre
enin
g V
alue
(R
SV)
Ref
inem
ent
Scre
enin
g V
alue
So
urce
Freq
. Exc
eedi
ng
RSV
Ref
inem
ent
Haz
ard
Quo
tient
(H
Q)
95%
UC
L C
onc.
95%
UC
L H
Q
CO
PC (Y
/N) B
asis
Volatile Organic Compounds, µg/kg
1,2-Dichlorobenzene 2/10 100 NA NA 920 Mammals 0/10 0.1 60 0.065 No/B
Tetrachloroethene 10/10 210 NA NA 180 Mammals 3/10 1.2 135 0.75 No/A
Semi-volatile Organic Compounds, µg/kg
Pentachlorobenzene 2/10 2,200 NA NA NA NA 1/10 0.2 130 NA Yes/Bioaccu.
Polycyclic Aromatic Hydrocarbons (PAHs) Low Molecular Weight Polycyclic Aromatic Hydrocarbons (LMW-PAHs), µg/kg
Acenaphthene 2/10 41 NA NA See total NA NA NA 40 NA See total Fluorene 2/10 47 NA NA See total NA NA NA 45 NA See total Phenanthrene 3/10 36 NA NA See total NA NA NA 30 NA See total Naphthalene 1/10 40 NA NA See total NA NA NA 39 NA See total
Total LMW-PAHs 4/10 164 NA NA 29,000 R4 inverts 0/10 0.006 140 0.005 No/A
High Molecular Weight Polycyclic Aromatic Hydrocarbons (HMW-PAHs), µg/kg
Benzo(a)anthracene 4/10 46 NA NA See total NA NA NA 44 NA See total Benzo(a)pyrene 2/10 78 NA NA See total NA NA NA 78 NA See total
Benzo(b)fluoranthene 2/10 139 NA NA See total NA NA NA 120 NA See total
Chrysene 1/10 70 NA NA See total NA NA NA 69 NA See total
Dibenz(a,h)anthracene 1/10 135 NA NA See total NA NA NA 125 NA See total
Indeno(1,2,3-cd)pyrene 5/10 280 NA NA See total NA NA NA 227 NA See total
Pyrene 3/10 25 NA NA See total NA NA NA 21 NA See total
Total HMW-PAHs 5/10 773 NA NA 1,100 R4 0/10 0.7 674 0.6 No/A

Region 4 Supplemental Guidance Technical Services Section Table of Contents Superfund Division
3-10 Last updated March 2018
Example Table Depicting Refinement Of Chemicals Of Potential Concern In Soil
CHEMICAL
Freq
. of D
etec
tion
Max
imum
D
etec
ted
Con
c.
Bac
kgro
und
Scre
enin
g V
alue
(B
SV)
Freq
. Exc
eedi
ng
BSV
Ref
inem
ent
Scre
enin
g V
alue
(R
SV)
Ref
inem
ent
Scre
enin
g V
alue
So
urce
Freq
. Exc
eedi
ng
RSV
Ref
inem
ent
Haz
ard
Quo
tient
(H
Q)
95%
UC
L C
onc.
95%
UC
L H
Q
CO
PC (Y
/N) B
asis
Pesticides, µg/kg
4,4’-DDD 7/10 25 NA NA NA NA NA NA 16 D Yes/C 4,4’-DDE 6/10 49 NA NA NA NA NA NA 25 D Yes/C 4,4’-DDT 6/10 110 NA NA NA NA NA NA 94 D Yes/C Total DDT 7/10 184 NA NA NA NA NA NA 135 6.4 Yes/C Heptachlor 1/10 140 NA NA NA NA NA NA 67 NA Yes/Bioaccu
Inorganic Compounds, mg/kg
Copper 9/10 66 13 1/10 NA NA NA NA 11.4 0.4 No/E Manganese 10/10 1,020 1,579 0/10 NA NA NA NA 275 1.4 No/F Sodium 3/10 2,550 634 2/10 NA NA NA NA 1,670 NA No/G Vanadium 10/10 81.3 59 3/10 NA NA NA NA 38.1 4.9 Yes/H
Footnotes: COPC = Chemical of Potential Concern (yes/no) A = Chemical was infrequently detected above RSV and 95% UCL HQ is less than 1. B = Chemical was not detected or infrequently detected and refinement HQ is less than 1. C = Chemical was frequently detected and 95% UCL HQ was greater than 1. D = Chemical is a member of a class of compounds. The total concentration is screened against the RSV for the total compound in that class. E = 95% UCL hazard quotient was less than 1 and concentration was less than background screening value. F = Chemical was detected below background screening value. G = Chemical is an essential nutrient. H = Chemical was frequently detected above background and mean hazard quotient was greater than 1.

Region 4 Supplemental Guidance Scientific Support Section Table of Contents Superfund Division
3-11 Last updated March 2018
Frequency Exceeding RSV. This column should indicate the number of sample locations that exceeded the RSV. These locations should be clearly identified and presented in a figure(s) that are included with the report. Refinement HQ. This column should indicate the refinement HQ (maximum concentration / RSV). 95% UCL Concentration. This column should indicate the 95% UCL on the arithmetic mean concentration of each screening COPC. 95% UCL HQ. This column should indicate the 95% UCL concentration divided by the RSV from Step 3a. Refinement COPC Category. This column should indicate which category each chemical falls into based on the example description found at the bottom of the COPC Refinement table. Upon completion of the refinement table, the final list of Step 3a COPCs should be identified. The table and supporting text should give the risk managers a clearer picture of the chemicals and exposure pathways that require additional investigation or those chemicals and pathways that do not warrant further investigation. Any chemicals detected above the RSVs that screened out because they were below BSVs should be mentioned. In addition, figures should be presented in the Baseline Problem Formulation showing areas of concern so that risk managers will have a better idea of the spatial area of contaminated medium potentially causing adverse effects. 3.1.9 Uncertainties in the Refinement Screening Process
Multiple aspects of uncertainty may occur in Step 3a. These can include what is unknown about non-detected chemicals, adequacy of site characterization, chemicals lacking screening values, extent of exposure to the site by ecological receptors (e.g., multiple exposure units based on habitat types), presence of sensitive ecological receptors, and data quality issues.
Any data gaps that will be important to decide whether the site poses unacceptable risk or to refine preliminary remedial goals should be identified. Some sites, in early investigation phases, may not be characterized sufficiently to delineate the extent of
Region 4 Supplemental Guidance Scientific Support Section Table of Contents Superfund Division
3-12 Last updated March 2018
contamination or may lack basic information that precludes reaching a decision about certain exposure pathways or COPCs. These types of uncertainties should also be documented.
3.1.10 Step 3a – Scientific/Management Decision Point
An SMDP meeting between the risk managers, risk assessors and stakeholders is needed to discuss the outcome of the Step 3a process for finalizing which contaminants and likely exposure pathways will be carried forward into Step 3b. A summary of the refinement screening process for the site should be presented that includes the refinement screening table. Some judgments will be required for chemicals, slightly over background, having low hazard quotients or detected in limited areas of the site. It is important that a weight of evidence approach is used based on multiple lines of evidence and that the basis for decisions is documented along with any major sources of uncertainty. A summary table that presents the multiple lines of evidence for each chemical in each environmental medium is desired. Figures of maps showing the distribution of the concentrations of COPCs are recommended to present the data. The possible decisions to be made by risk managers at the end of Step 3a are:
• There is adequate information to conclude that ecological risks are negligible; • The available information is not adequate to conclude that ecological risks are
negligible; or • The available information indicates a potential for adverse ecological effects.
If the SMDP team decides that ecological risk is negligible, the site can exit the process at Step 3a. Typically this occurs when all chemicals screen out, when a habitat survey indicates that the site does not provide habitat to ecological receptors, or when it is concluded that there are no completed exposure pathways at the site. Sites that do not exit the process at Step 3a can combine the Step 3a SMDP with the SMDP for Step 3b in Section 3.2.5.
3.2 Baseline Problem Formulation Step 3b – Planning and Scoping of the Risk Assessment
Sites reaching this point in the ERA process are here because critical information was

Region 4 Supplemental Guidance Scientific Support Section Table of Contents Superfund Division
3-13 Last updated March 2018
lacking to decide whether the site posed unacceptable ecological risk or because the site potentially posed unacceptable ecological risk and requires a BERA to further evaluate the potential for ecological risk and/or develop PRGs. Step 3b is an important part of the planning process for the BERA. At this point, the PRGs for COPCs are the RSVs. In cases where Step 3a evaluations included food-chain modeling, the PRGs derived used conservative assumptions for contaminant bioavailability, conservative toxicity reference values, and assumed 100% site use. A limited amount of site-specific information is typically available at this stage of the assessment. The planning process of data collection that occurs during Step 3b is primarily focused on necessary steps to refine the PRGs. The Baseline Problem Formulation summarizes what is known about the exposure profile and potential effects of COPCs. Thus, the Step 3b effort compiles and presents information in a manner that helps frame the risk evaluation in Step 4 and reduce the number of exposure pathways that need to be evaluated for each chemical. The sections below summarize the information that should be presented to help risk managers make these decisions. 3.2.1 Known Ecological Effects of COPCs
A narrative description of the known ecological effects for the main chemical groups of COPCs, and those specific COPCs that are expected to be major risk drivers, should be presented. The descriptions can be relatively concise at this point in the problem formulation stage. Details of specific toxicity endpoints and/or toxicological reference values for the COPCs will be developed in Section 4.1. 3.2.2 Contaminant Fate and Transport, Ecosystems Potentially at Risk,
and Complete Exposure Pathways
Contaminant Fate and Transport. This section of the report should summarize the primary ways that site chemicals can be transported or transformed in the environment physically, chemically, and biologically. This information is used to identify the exposure pathways that might lead to significant ecological effects. Although most of this information was presented in the SLERA; there may be a need for additional evaluation of certain chemical fate and transport mechanisms based on the list of the final COPCs for a site. For example, site-specific information on potential bioavailability of COPCs would be helpful if it is available. The discussion in this section would build on the chemical fate and transport mechanisms identified during the SLERA and the known

Region 4 Supplemental Guidance Scientific Support Section Table of Contents Superfund Division
3-14 Last updated March 2018
ecological effects identified for each COPC. This effort may involve compiling additional information on:
• The potential bioavailability of the COPCs to various ecological receptors; • The habitat types and potential receptors along the exposure pathways; and • The magnitude and extent of contamination, including its spatial and temporal
variability relative to the receptors potentially exposed. Ecosystems Potentially at Risk. It is important for the risk assessor to identify the ecosystems (or habitats) potentially at risk based on the information provided in the site ecological checklist completed during the SLERA. Additional site setting information is not typically necessary to complete this portion of baseline problem formulation; however, all ecosystems should be identified in this section of the report. After each ecosystem has been identified, they can typically be focused during this stage of the risk assessment based on the known ecological effects of the COPCs. The refinement conducted during this stage of the process involves attempting to identify the habitats that are at greatest risk of exposure based on the chemical fate and transport mechanisms present at a site. This may involve identifying species that are highly sensitive to particular COPCs or species that have greater potential for exposure based on the habitats they utilize. In addition, there may be areas with minimal habitat quality or wildlife usage such as drainage ditches, lawns and maintained fields that should be discussed. Complete Exposure Pathways. While the SLERA should have presented every complete and potentially complete exposure pathway present, they should be refined by this point in the Baseline Problem Formulation process. This may result in adding exposure pathways identified through additional information gathered at the site, but the primary goal of this section is to focus any remaining investigation on the exposure pathways present at the site where the greatest potential for unacceptable risks is present. It should be noted that this exercise may not focus solely on areas of ideal habitat, but rather in areas where exposure to COPCs is likely. At many sites this includes areas that may not be considered adequate habitat to support a community of ecological receptors (i.e. drainage ditches, maintained grassy areas); however, the potential for exposure is present in these areas and justification with documentation should be provided to support a conclusion of minimal ecological exposure in these habitat types, especially when exposure occurs via trophic transfer through the food chain.

Region 4 Supplemental Guidance Scientific Support Section Table of Contents Superfund Division
3-15 Last updated March 2018
3.2.3 Assessment Endpoints
As defined in national EPA guidance (EPA, 1997), an assessment endpoint is “an explicit expression of the environmental value that is to be protected.” Since it is not practical to directly evaluate all the individual components of an ecosystem, assessment endpoints should focus the BERA on the components of the ecosystem that could most likely be adversely affected by the COPCs at a site. The assessment endpoint is an expression of an ecological entity and the value of that entity to be protected. Assessment endpoints are site-specific and will depend on the habitats present. The process of selecting assessment endpoints for a site should be based on the following information as previously evaluated above:
• Refined list of COPCs for the site; • Toxic mechanisms of the COPCs; • Relevant receptor groups that are potentially sensitive and/or highly exposed to
the COPCs; and • Complete exposure pathways present at the site.
Input from applicable trustees/stakeholders for a site is crucial during the development of the assessment endpoints to help ensure that the risk managers have all the potentially pertinent information available for making risk management decisions. 3.2.4 Conceptual Model and Risk Questions
In addition to providing the final list of refined COPCs, Step 3b of the ERA includes a refinement of the screening-level CSM. This refinement of the CSM typically relies on a literature search on known ecological effects, a description of chemical fate and transport, and refinement of the complete and potentially complete exposure pathways identified in Step 2. The refinement to the CSM is the most important outcome of Step 3. The CSM is a tool or concept that describes the relationships between target populations and exposure routes/areas in such a manner as to facilitate predictions about nature, extent, risk, and risk reduction strategies. An accurate CSM will delineate populations of chemicals, receptors, exposure pathways, sources, and bioavailability, for which the decisions or outcomes will differ across the site. The CSM is a simplified construct of complexities at the site to aid in correct decision making.

Region 4 Supplemental Guidance Scientific Support Section Table of Contents Superfund Division
3-16 Last updated March 2018
Scope, boundaries, and scale are important considerations in the CSM. The scope and boundaries of the CSM should reflect the scope and boundaries of the decision. Target populations and boundaries are explained in the EPA’s Guidance on Systematic Planning Using the Data Quality Objectives Process. In addition to the exposure pathways and chemical populations of interest, the CSM should present the geographic scales of risk management decisions and time frames for critical exposures, if applicable. The spatial pattern of contaminant distribution provides evidence of how the chemical may be related to chemical releases, migration pathways, or degradation. Distribution may also indicate which exposure pathways will require additional evaluation. The risk evaluation can only support correct decisions at appropriate spatial scales. The EPA prefers to target cleanup decisions to source areas and to specific migration pathways. The subdivision of a larger site into operable units, solid waste management units, or exposure units should support decisions targeted to specific sources or pathways. The CSM may be simplified to focus on the most important chemicals. A smaller set of signature chemicals may be identified that appear to explain the behavior of many site-related chemicals and the majority of the risk. This does not mean that other COPCs would not be evaluated further. Their uncertainty might be addressed by an alternate method rather than designing a field study specifically for minor risk-contributing chemicals. Often a field study targeted toward one chemical will gather information that can serve to assess several other chemicals, because chemicals often co-occur in site media. The risk questions included in baseline problem formulation should be linked to risk management objectives. The purpose of the risk questions is to outline the basis of the study design (Step 4) and the methods to be used to evaluate the results of any site-specific investigations that may be recommended for the site. Risk questions should be based on the relationship of the assessment endpoints and the predicted response when exposed to the chemicals present at a site. It is helpful if a single chemical or class of chemicals can be identified in the risk questions; however, at some Superfund sites this is not possible. The risk questions asked should lead toward developing a range of measurement endpoints for each assessment endpoint. This is typically done by including a comparison in the risk question of site conditions to (1) concentrations of a chemical that, based on literature searches are known to be toxic to receptors associated with the assessment endpoint; and/or (2) comparing areas of contamination with

Region 4 Supplemental Guidance Scientific Support Section Table of Contents Superfund Division
3-17 Last updated March 2018
reference sites. 3.2.5 Scientific/Management Decision Point
The conclusion of Step 3b of the BERA has a SMDP that consists of agreement on:
• The COPCs; • Habitats and environmental media of potential concern; • Receptors of concern; • Exposure pathways; • Assessment endpoints; and • Risk questions.
Each of these components should be summarized in the refined CSM and on other figures or charts. Agreement by risk assessors and risk managers on these key aspects of the CSM will facilitate development of the site study design (Step 4).

Region 4 Supplemental Guidance Scientific Support Section Table of Contents Superfund Division
4-1 Last updated March 2018
4.0 Study Design The study design (Step 4 of the ERA) is part of the DQO process. Therefore, many of the same components of the DQO process apply in this step. Details of the DQO process are found in the EPA’s Guidance on Systematic Planning Using the Data Quality Objectives Process. 4.1 Establishing Measurement Endpoints At the end of Step 3 of the ERA process, the assessment endpoints as described in Section 3.2.3 have been selected for a site. A measurement endpoint is defined as a measurable characteristic related to the value to be protected of the entity described by the assessment endpoint. Measurement endpoints can include measurements of exposure and effects. For example, concentrations in sediment samples as well as measures of effects (direct toxicity testing to benthic organisms) provide ways to evaluate potential risks. Measurement endpoints are site-specific and reflect the ecological functions provided by the habitats in question. The relationship of the measurement endpoints to the assessment endpoint should be clearly presented. Following assessment and measurement endpoint selection and development of the CSM and risk questions, a study plan is designed to ensure that adequate data are collected to support the ecological component of the BERA. There are a limited number of fundamental approaches for conducting site specific investigations on ecological impacts of hazardous substances. Further soil/water/sediment sampling, tissue residue studies, toxicity testing, and population or community evaluations are the four methodologies most commonly used. The appropriate methodology will depend on the assessment and measurement endpoints selected in the previous steps. Food-chain models and toxicity reference values. Measurement endpoints involving prediction of the risk to wildlife receptors typically rely on food-chain models of the daily intake of chemicals in dietary items consumed by wildlife for estimation of a daily dose. When planning to use food-chain models in the BERA, the EPA Region 4 requests that Step 4 provide tables including all of the assumptions that will be made for the food-chain model calculations. These assumptions include items such as the intake rates and body weights of model receptors and the toxicity reference values that will be used to characterize the risk. It is recommended that the EPA Region 4 risk assessment web site

Region 4 Supplemental Guidance Scientific Support Section Table of Contents Superfund Division
4-2 Last updated March 2018
be consulted for exposure assumption and TRVs. This link has values that can be used in most food chain models. If studies other than the recommended values are used or there are no recommended values on the EPA website, then a justification should be provided that contains a review of the pertinent toxicity information for the chemical. This should include 1) a summary of potential effects from chemicals when present in aquatic and terrestrial environments, and 2) a summary of the NOAEL and LOAEL chosen for each chemical as reported in the literature. These data should also present the literature citation and a brief description of the study conducted so that an evaluation can be made as to how applicable the study results are to hazardous waste sites. The description should include the setting of the study (laboratory or field), length of exposure, type of exposure, effects measured, the date of the study, and the results of the study. If receptors other than the ones provided on the EPA table of recommended exposure assumptions are used, the baseline problem formulation report should include a section describing the characteristics of the receptors and how the parameters were obtained. Alternate TRVs may be used; however the preference is to use EPA Region 4 values when they are available. If the EPA Region 4 values are used, then the original citations and the information requested above is not necessary to include. Toxicity tests. Toxicity testing is most commonly employed to determine potential risk via direct contact with contaminated surface water, soil or sediment. Toxicity testing must be carefully designed to ensure that the proper test species are used for the environmental medium being evaluated. For example, a benthic macroinvertebrate such as Hyalella should be used as a test subject in freshwater sediment toxicity tests rather than free-swimming organisms such as Ceriodaphnia. Community assessments. Community or population evaluations involve floral or faunal field surveys and the computation of species diversity and richness indices as measurement endpoints. These types of studies should be used with caution in a BERA because the various diversity and richness indices were not developed to measure ecological impacts of hazardous materials in the environment. Natural variability in population and community structure (e.g., spatial and seasonal effects), lack of sensitivity of some species to certain chemicals and impacts to population/community structure from non-chemical stressors make the interpretation of these studies difficult in the context of

Region 4 Supplemental Guidance Scientific Support Section Table of Contents Superfund Division
4-3 Last updated March 2018
distinguishing between these effects and those from hazardous substances. Therefore, comparison of biological community metrics between the site and reference areas should not be considered a primary or robust line of evidence with a high degree of confidence. When using community metrics in a BERA, the experimental design and statistical analysis methods should be well documented so as to evaluate whether conclusions based on community surveys can be supported. In addition, presentation of survey results should also be accompanied by a detailed uncertainty discussion. Other considerations. If there are multiple habitats at the site the Study Design should discuss the data groupings and the boundaries of the habitat areas. If there are bioaccumulative chemicals among the COPCs, the summary of available data should include any biological tissue data available for estimating site-specific bioaccumulation. The pairing of tissue data with abiotic data for estimation of bioaccumulation factors (BAFs) can also be discussed. For complex sites, the work plan should present the manner in which the BAFs are derived from the site-specific tissue data collection prior to the initiation of the risk assessment. 4.2 Scientific/Management Decision Point At the end of Step 4, the ecological risk assessor and the ecological risk manager should come to agreement on the contents of the Work Plan and the Sampling Analysis Plan (SAP). The Step 4 SMDP should summarize the existing categories of data available to support the BERA. The SMDP should summarize what is known about the site, the CSM, available data, the need to collect site-specific information to refine risk assessment assumptions and to close data gaps. Specifically, this SMDP should result in agreement between the ecological risk assessor and the risk manager on the following:
• Site measurement endpoints selected as lines of evidence to evaluate the assessment endpoints;
• Exposure assumptions and toxicity reference values; • Field investigations, specific DQOs, and laboratory methods to be conducted; and • Selection of data reduction and interpretation techniques.

Region 4 Supplemental Guidance Scientific Support Section Table of Contents Superfund Division
4-4 Last updated March 2018
This SMDP is essentially an agreement by the project team on the elements of the BERA and the parameter assumptions in the equations that will be used to estimate the risk.
Region 4 Supplemental Guidance Scientific Support Section Table of Contents Superfund Division
5-1 Last updated March 2018
5.0 Additional Steps in the Ecological Risk Assessment Process
Following Step 4 (study design), there are four more steps to complete the ERA process. These steps are described in detail in ERAGS and are described briefly here for reference, although no specific EPA Region 4 guidance is offered on these steps. Step 5 – Field Verification of Sampling Plan. This is an optional step to visit the site prior to a field sampling event to verify the feasibility of the sampling plan. Step 5 is recommended for sites where complex field studies are planned. Complex sites that require a field visit to select reference stations or to conduct field reconnaissance to determine what species of biota are available to collect may require another step to finalize the work plan. Sites that skip the field verification step do not require a Step 5 SMDP. Step 6 – Site Investigation and Analysis Phase. Step 6 is straightforward in that in involves implementation of the site investigation and study design according to plans. Ecological exposures and effects are evaluated based on the information gathered in the previous steps including any site-specific information obtained during the site investigation. A data summary report can be prepared to present the results. Sites with complex data may require an intermediate step to evaluate laboratory data before the data can be incorporated into the BERA. Many sites provide a RI report to present the data and its interpretation. It is possible, in the case of extensive ecological investigations that data with interpretations for the BERA may need to be prepared as separate reports. For example, benthic community analyses interpretations, toxicity testing data may need to be fit to dose-response models to estimate PRGs for the BERA, and development of BAFs from biological tissue data should be provided as appendices in support of the BERA. Step 7 – Risk Characterization. As explained in ERAGS, Step 7 is the final step in the ERA process. It includes risk estimation and risk description. The risk characterization phase should use a multiple lines of evidence approach that considers:
• Strength of association between the assessment and measurement endpoints;

Region 4 Supplemental Guidance Scientific Support Section Table of Contents Superfund Division
5-2 Last updated March 2018
• Study Design; and • Data Quality.
This Step should also foster a systematic and balanced consideration of the strengths and weaknesses of the lines of evidence. The ERA should conclude with a statement of whether there was a risk or not to the receptors for each exposure pathway evaluated. In addition, information should be presented on the nature and likelihood of risk. The uncertainty analysis, a critical element in this step, should clarify what is known and unknown about the risks for the benefit of risk managers. Remedial Action Objectives (RAOs) and PRGs. The process to develop RAOs begins in the early stages of the remedial investigation and is completed in the feasibility study (EPA 2005). The RAOs should specify:
• the contaminants of concern, • exposure routes and receptors, and • an acceptable contaminant level or range of levels for each exposure medium (i.e.,
a PRG).
The RAOs are simple statements in the screening ecological risk assessment that include each of the three elements above. During the early stages of the remedial investigation, the acceptable contaminant level or range of levels for each exposure medium (i.e., PRG) is a readily available ESV, RSV or a state standard. The COPCs, exposure routes, receptors and PRGs are refined in the subsequent risk assessment steps culminating in Step 7 where PRGs are set for those media that pose unacceptable risk. Although PRGs are developed in Step 7 of the BERA, they may be developed under separate cover depending on specific project decisions. PRGs should be developed in Step 7 of the BERA, although they may be developed under separate cover depending on specific project decisions. PRGs for protection of wildlife are compiled from the food-chain models that should be back calculated to obtain the media concentrations representing a HQ of 1 for the NOAEL and LOAEL toxicity reference values for the chemicals posing unacceptable risk. From Step 6, site-specific toxicity thresholds are compiled for direct toxicity to plants and soil invertebrates (in the case of soils) or toxicity to the benthic macroinvertebrate community (in the case of sediment). These thresholds are assembled into a table for each environmental medium

Region 4 Supplemental Guidance Scientific Support Section Table of Contents Superfund Division
5-3 Last updated March 2018
from which a range of PRGs is selected in the SMDP to inform Step 8, risk management. As more site-specific information is generated during the RI/FS process, the PRGs should be replaced with site-specific remedial goals (in Step 8) that are developed through iterative discussions between the project manager, risk assessor, and other appropriate members of the team. Step 8 – Risk Management. The risk management decision that includes remedial goals is finalized in the Record of Decision (ROD) for a CERCLA site or in the Statement of Basis for a RCRA site. The user is recommended to consult ERAGS and guidance documents for Superfund risk assessments.

Region 4 Supplemental Guidance Scientific Support Section Table of Contents Superfund Division
6-1 Last updated March 2018
6.0 Ecological Screening Values ESVs are based on chemical concentrations associated with a low probability of unacceptable risks to ecological receptors. The SSS has developed the attached tables for use at Region 4 hazardous waste sites. Since these numbers are based on conservative endpoints and sensitive ecological effects data, they represent a preliminary screening of site chemical concentrations to determine the need to conduct further investigations at the site. ESVs are not recommended for use as remediation levels. Preliminary screening values for chemicals which lack Region 4 ESVs can be proposed and submitted to the SSS for approval. If at all possible these ESVs should be based on ecotoxicological information from the scientific literature, computer databases, and other sources. As information is submitted to the SSS for review or as new information becomes available, these Region 4 ESVs may be modified or additional screening values added. Users are encouraged to consult Region 4 ecological risk assessors or the website for further information and updates. 6.1 Surface Water Screening Levels The surface water screening-level hierarchy for freshwater is as follows:
• National Recommended Surface Water Criteria • Tier 2 values or equivalent
o Great Lakes Initiative Tier 2 Values (freshwater) o State Surface Water Standards for freshwater o Suter and Tsao (1996) Tier 2 Values
• Canadian Water Quality Values • Minimum value from either the Target Lipid Model or ECOSAR (Ecological
Structure Activity Relationships) model. • Office of Pesticide Programs Aquatic Life Benchmarks. • Minimum of chronic toxicity observed as recorded in ECOTOX database.
The hierarchy for saltwater values is the same except that the GLI and Suter and Tsao values are not used for saltwater and instead state surface water standards for marine water are used. The following sections provide details for the screening values derived for each hierarchy level.

Region 4 Supplemental Guidance Scientific Support Section Table of Contents Superfund Division
6-2 Last updated March 2018
6.1.1 Water Quality Criteria and Great Lakes Initiative Tier 2 Values
The surface water screening-level hierarchy for freshwater and saltwater starts with the Current Recommended National Water Quality Criteria (NWQC). For the NWQC, The chronic ambient water quality criteria value for the protection of aquatic life, (i.e., the Criterion 2 Continuous Concentration [CCC]), is used as the screening value for surface water. The Criteria Maximum Concentration (CMC) is an estimate of the highest concentration of a chemical in surface water averaged over a one-hour period to which an aquatic community can be exposed briefly without resulting in an unacceptable effect (Stephen et al., 1985). The CCC is an estimate of the highest concentration of a chemical in surface water to which an aquatic community can be exposed indefinitely without resulting in an unacceptable effect. Aquatic organisms can safely be exposed to concentrations between the CMC (acute) and CCC (chronic) screening values as long as the 4-day average concentration is below the chronic surface water screening value. In some cases, dissolved (filtered samples) have been collected to assess exposures particularly for metals. In these cases, the dissolved concentrations may also be used in the screening process (see also Table 1b for certain metals). The Great Lakes Initiative (GLI) Clearinghouse database was used when a nationally recommended water quality criterion was unavailable. For many chemicals in the GLI database, there are several Tier 2 value from the Great Lakes states. In general, the most conservative and/or most recent value was selected as the ESV. 6.1.2 State Surface Water Standards, Other Tier 2 Values and Canadian
Water Quality Guidelines
Each state has developed water quality standards or criteria that may be lower than those in Table 1a which show the National Recommended Water Quality Criteria as the first tier in the hierarchy for generality. However, if a state standard for a particular state in Region 4 is available, it becomes the first tier and should be used as the ESV. For those chemicals in Table 1a that did not have a GLI value, then other state standards were used, especially for marine ESVs. If a chemical had more than one standard, then the most conservative state standard was selected as the ESV. The surface water Tier 2 freshwater benchmarks in Suter and Tsao (1996) were then used in the hierarchy followed by the Canadian water quality guidelines.

Region 4 Supplemental Guidance Scientific Support Section Table of Contents Superfund Division
6-3 Last updated March 2018
6.1.3 Surface Water Toxicity Modelled by Structure Activity Relationships
The EPA’s Ecological Structure Activity Relationships (ECOSAR) Predictive Model was used to estimate aquatic toxicity for organic compounds, Canadian Water Quality Guidelines and state standards. The ECOSAR model predicts acute and chronic toxicity for freshwater fish, daphnids, green algae, saltwater fish, and mysids for over 70 classes of chemicals including nonpolar organic compounds. The ECOSAR model is updated annually with new data. The minimum chronic value among the available classes of organisms was used as the screening value. An acute to chronic ratio of 8.3 (Raimondo et al. 2007) was used to convert acute toxicity to chronic toxicity for fish, daphnids, and mysids when no chronic toxicity data was available. For algae the acute to chronic toxicity ratio was assumed to be 4 after the recommendations in the ECOSAR help files.
6.1.4 Surface Water Toxicity Data in EPA Knowledgebase
Available surface water toxicity data for the five ECOSAR classes of organisms was retrieved from the EPA’s ECOTOXicology knowledgebase (ECOTOX) to check model predictions. When models were unavailable for a certain compound or the compound had an octanol water partition coefficient greater than the range of values used to calibrate the model, the minimum chronic toxicity among the classes of organisms evaluated by ECOSAR was used in replace of a modelled value.
6.1.5 Other Considerations for Surface Water Screening
Screening values such as the ambient surface water quality criteria are intended to protect 95% of the species, 95% of the time. If there is reason to believe that a more sensitive species is present at the site, such that surface water chemical concentrations below the chronic ambient water quality values may pose unacceptable risks, more protective site-specific surface water screening values may be developed. The surface water screening values listed in Table 1a assume a hardness of 50 milligrams per liter (mg/L) as calcium carbonate (CaCO3) for those metals whose freshwater criteria depend on hardness, such as cadmium, chromium III, copper, lead, nickel, silver, and zinc. Table 1a includes supporting Tables 1b and 1c. Table 1b provides the conversion factors (CFs) and hardness-dependent equations. The CFs are used to calculate surface water criteria for dissolved metals and can be used to convert criteria for dissolved metals into total metals criteria. CFs were applied to freshwater and saltwater National recommended criteria, which apply to dissolved metals, to obtain the screening values in Table 1a for total metals. Hardness-specific freshwater screening values (for total

Region 4 Supplemental Guidance Scientific Support Section Table of Contents Superfund Division
6-4 Last updated March 2018
metals) are provided in Table 1c for hardness concentrations of 25, 50, 100, and 200 mg/L as CaCO3. A recent change to the national recommended water quality criteria no longer requires that if the site-specific surface water hardness is less than 25 mg/L CaCO3 that one should fix the hardness at 25 mg/L as CaCO3. Therefore, where site-specific hardness information is available, surface water ESVs for hardness-dependent metals should be adjusted accordingly. Typically, copper is screened against the federal or state standard. The Biotic Ligand Model (BLM) for copper can be used to fine tune the ESV provided site-specific data is sufficient to run the BLM to estimate a chronic value. This can be done in the SLERA or as a part of the refinement screen in Step 3a. 6.1.6 Equilibrium Partitioning and Target Lipid Modeling to Derive Surface
Water ESVs
For organic chemicals that do not have any available water quality benchmarks (WQBs), the surface water ESV can be calculated using two methods:
1) The combined equilibrium partitioning and target lipid model (TLM) approach. The TLM developed by Di Toro, et al. (2000) and Di Toro and McGrath (2000) is used and is applied to both freshwater and saltwater ESVs for nonpolar organic chemicals with narcotic toxicity.
2) The ECOSAR model within the EPA’s Estimation Program Interface (EPI) suite. ECOSAR predicts acute and chronic effect concentrations to several organisms (e.g., fish, daphnids, algae) and the lowest predicted chronic value is selected as the ESV. ECOSAR is different from the TLM in that it has algorithms for various classes of chemicals and thus can be more versatile. However, the ECOSAR values are for typical species and do not account for sensitive species.
Since both models predict chronic and acute effects, the most conservative or lowest predicted effect from the two models was used as the ESV. For many nonpolar organic compounds, the octanol-water partition coefficient (Kow) is a useful surrogate of how nonpolar organic compounds will accumulate in lipids of animal tissue. The Kow is the ratio that describes the partitioning of a compound between water and octanol. Kows are available for many common organic compounds although values may be somewhat different between reference sources. The Kows used in this document

Region 4 Supplemental Guidance Scientific Support Section Table of Contents Superfund Division
6-5 Last updated March 2018
were obtained from the EPI Suite program. The TLM is used for nonionic (neutral) organic compounds and is based on the assumption that the aqueous concentration for an acute toxic endpoint can be predicted from the critical target lipid body burden (CTLBB) in an organism. The CTLBB is the chemical concentration in the organism lipid needed to cause 50% mortality. The following TLM equation from Di Toro et al. (2000); McGrath and Di Toro (2009); Redman et al. (2014) predicts the critical acute aqueous concentration:
log𝐶𝐶𝑤𝑤∗ 𝑎𝑎𝑎𝑎𝑎𝑎𝑎𝑎𝑎𝑎 = 𝑚𝑚 × 𝑙𝑙𝑙𝑙𝑙𝑙𝐾𝐾𝑂𝑂𝑂𝑂 + 𝑙𝑙𝑙𝑙𝑙𝑙𝐶𝐶𝐿𝐿∗ + �𝑙𝑙𝑙𝑙𝑙𝑙∆𝐶𝐶𝐿𝐿,𝑗𝑗
− 𝑘𝑘𝑧𝑧�𝑉𝑉𝑠𝑠𝑠𝑠𝑠𝑠𝑠𝑠𝑠𝑠 × (𝑙𝑙𝑙𝑙𝑙𝑙 𝐾𝐾𝑂𝑂𝑂𝑂)2 + 𝑉𝑉log𝐶𝐶𝐶𝐶𝐿𝐿𝐶𝐶𝐶𝐶 − log(2)
Where: C*w = Critical aqueous concentration (millimoles per liter [mmol/L])
Kow = Octanol-water partitioning coefficient (liters per kilogram [L/kg])
C*L = Critical target lipid body burden (micromoles per gram [µmol/g] octanol) m = universal slope (-0.936) for chemicals other than PAHs (McGrath and Di
Toro 2009). Slope m of -0.945 should be used for non-halogenated PAHs (Di Torro et. al., 2000).
log ΔcL = chemical class correction factors (mmol/kg-lipid) from McGrath and Di Toro (2009):
alkanes, alcohols, aliphatics, ethers and ketones – 0 halogenated chemicals – -0.339 non-halogenated PAHs – -0.352 halogenated PAHs – -0.691 monoaromatic hydrocarbons – -0.109. kz = Statistical parameter for estimating lower confidence limit of model
prediction = 2.3, Vslope = Variance in the slope = 0.000225 V log CTLBB = Variance in the critical lipid body burden = 0.112 (McGrath
and Di Toro 2009). Consistent with the derivation of the methodology for deriving the criterion maximum concentration (EPA 1985), the estimated final acute value is divided by a factor of 2. For chronic toxicity of non-PAHs, the TLM uses an acute to chronic ratio (ACR) methodology which simply is the acute effect concentration divided by the chronic effect concentration. The chronic effect concentrations are those that cause an adverse effect on

Region 4 Supplemental Guidance Scientific Support Section Table of Contents Superfund Division
6-6 Last updated March 2018
long-term endpoints such as growth and reproduction. Therefore, the equation for chronic effects is similar to Equation 1:
log𝐶𝐶𝑤𝑤∗ 𝑎𝑎ℎ𝑟𝑟𝑙𝑙𝑟𝑟𝑟𝑟𝑎𝑎= 𝑚𝑚 × 𝑙𝑙𝑙𝑙𝑙𝑙𝐾𝐾𝑂𝑂𝑂𝑂 − log (𝐴𝐴𝐶𝐶𝐴𝐴) + 𝑙𝑙𝑙𝑙𝑙𝑙𝐶𝐶𝐿𝐿∗ + �𝑙𝑙𝑙𝑙𝑙𝑙∆𝐶𝐶𝐿𝐿,𝑗𝑗
− 𝑘𝑘𝑧𝑧�𝑉𝑉𝑠𝑠𝑠𝑠𝑠𝑠𝑠𝑠𝑠𝑠 × (𝑙𝑙𝑙𝑙𝑙𝑙 𝐾𝐾𝑂𝑂𝑂𝑂)2 + 𝑉𝑉log𝐴𝐴𝐶𝐶𝐴𝐴 + 𝑉𝑉log𝐶𝐶𝐶𝐶𝐿𝐿𝐶𝐶𝐶𝐶
The ACR for nonpolar organic chemicals was determined to be 3.83 (McGrath and Di Toro [2009] and Redman et al [2014]) based on the geometric mean of 29 paired data sets for aliphatic hydrocarbons. The variance on the ACR estimated by McGrath and Di Toro (2009) was 0.105. To convert the critical aqueous concentration (mmol/L) to mg/L one has to take the antilog of the equation answer and multiply by the molecular weight. The following represents an example calculation for a chronic value for 1,2,4,5-tetrachlorobenzene:
log(C*w chronic) = -0.936 × 4.571 + log(119/3.83) – Σ(0.339+0.109) – 2.3 × √(0.000225 × 4.5712 + 0.105 + 0.112)
= -4.278 + 1.492 – 0.448 – (2.3 × 0.471) = -4.317
Taking the antilog of –4.317 and multiplying by the molecular weight of 1,2,4,5-tetrachlorobenzene (215.89 g/mol) yields 0.0104 mg/L as the chronic WQB. This value is higher than the ESV (0.0083 mg/L) listed in Table 1a that is based on a GLI value. The above example applies to non-polar organic compounds that are not PAHs. The TLM equation from EPA (2003) was used to estimate the surface water toxicity for PAHs and PAH-like compounds. The GLI methodology requires several studies of chronic toxicity for the same chemical, without which a conservative default ACR is mandated. The TLM, on the other hand, uses an average ACR for all narcotic chemicals. Differences in Kow values used in the equations also contribute to variability in the calculations.

Region 4 Supplemental Guidance Scientific Support Section Table of Contents Superfund Division
6-7 Last updated March 2018
The textbox provides the equations for estimating TLM acute and chronic surface water benchmarks for PAHs. As described in Section 3.1.6, when assessing potential toxicity to aquatic organisms from mixtures of chemicals with a similar mode of action, the ΣTU approach should be used. To generate screening values that are not on Table 1a, the ECOSAR model may be used. ECOSAR uses chemical class-specific algorithms to estimate toxicity to representative freshwater and saltwater species from the Kow. The lowest predicted ECOSAR chronic value among the species is selected as the ESV. For acute values, the lowest ECOSAR predicted acute concentration from the species is selected and then divided by 2. As previously noted, the values from ECOSAR are for typical species and do not account for sensitive species. Also, caution that ECOSAR should not be used for chemicals that are not a member of a chemical class for which an ECOSAR model was developed. 6.2 Sediment Screening Values Numerous efforts to develop suitable sediment quality benchmarks for classifying sediment as toxic or non-toxic have been published in the scientific literature. In order to best protect aquatic resources, many of the Region 4 sediment ESVs (Tables 2a and 2b) are derived from statistical interpretation of effects databases obtained from the literature, as reported in publications from states such as Florida and Washington, and from other agencies. These benchmarks are generally based on observations of direct toxicity to benthic organisms. The following represents the Step 2 ESV hierarchy for both freshwater and marine sediments:
Equations for Estimating Target Lipid Model Surface Water
Benchmarks for PAHs
Acute
𝑙𝑙𝑙𝑙𝑙𝑙�𝐶𝐶𝑤𝑤,𝑎𝑎𝑎𝑎𝑎𝑎𝑎𝑎𝑠𝑠∗ � = 𝑚𝑚 × 𝑙𝑙𝑙𝑙𝑙𝑙(𝐾𝐾𝑂𝑂𝑂𝑂)
+ 𝑙𝑙𝑙𝑙𝑙𝑙�𝐶𝐶𝐿𝐿,5%∗ �
+ 𝑙𝑙𝑙𝑙𝑙𝑙�∆𝐶𝐶𝑠𝑠,𝑃𝑃𝐴𝐴𝑃𝑃�− log (2)
Chronic
𝑙𝑙𝑙𝑙𝑙𝑙�𝐶𝐶𝑤𝑤,𝑎𝑎ℎ𝑟𝑟𝑠𝑠𝑟𝑟𝑟𝑟𝑎𝑎∗ � = 𝑚𝑚 × 𝑙𝑙𝑙𝑙𝑙𝑙(𝐾𝐾𝑂𝑂𝑂𝑂)
+ 𝑙𝑙𝑙𝑙𝑙𝑙�𝐶𝐶𝐿𝐿,5%∗ �
− log(𝐴𝐴𝐶𝐶𝐴𝐴)+ 𝑙𝑙𝑙𝑙𝑙𝑙�∆𝐶𝐶𝑠𝑠,𝑃𝑃𝐴𝐴𝑃𝑃�
Where,
C*w, acute = Acute screening value in mmol/L for PAHs
C*w, chronic = Chronic screening value in mmol/L for PAHs
ΔCL,PAH =Chemical class correction for PAHs = 0.549
m = Universal slope = -0.945 (Di Toro et al. 2000)
C*L(5%) = Critical lipid body burden for PAHs = 16.98[µmol/g]
ACR = Acute to chronic ratio for PAHs = 4.16.

Region 4 Supplemental Guidance Scientific Support Section Table of Contents Superfund Division
6-8 Last updated March 2018
• Threshold effect levels (TELs) or threshold effect concentrations (TECs) such as those provided in MacDonald et al., (2003) for other than PAHs;
• Modeled equilibrium partitioning values for organic chemicals from surface water benchmarks;
• Other effect ranges such as effects range-low values and Washington State sediment quality objectives.
Each of the sediment screening tables (Tables 2a, 2b, and 2c) contain different chemicals. Table 2a includes metals, phenols, energetic compounds, and pesticides/herbicides and other polar (ionic) chemicals. The chemicals in Table 2b are predominantly nonpolar chemicals that are considered to have a narcotic mode of toxic action. Table 2c pertains only to PAHs and their narcotic toxicity. Step 2 sediment data should be screened against the first column in Table 2a. If the chemical is not found on Table 2a, then screen against the first column in Table 2b. The ΣTU from the values in the first column will also be conservative as an added layer of protection for multiple chemicals sharing the same mode of toxic action. In Step 3a for refinement of sediment screening values, the value in the second column of Table 2a or 2b can be used as the RSV. If there is no RSV, then an ECOSAR derived value for 1% organic carbon (OC) may be derived for Table 2a. A RSV for Table 2b can be derived by using the more conservative WQB from the McGrath and Di Toro (2009) methodology (Equation 2 below) or from ECOSAR. The RSVs could also be used for the ΣTU approach as part of refinement. For sites with many organic chemicals, it is possible that the ΣTU approach in the refinement could be more conservative than the single compound screening in Step 2. The refinement for PAHs would use the ΣTU approach from the values in Table 2c. Specific discussion of the methods used to develop the sediment ESVs and for deriving sediment RSVs are provided in the subsections below. 6.2.1 Sediment ESVs based on Effect Ranges
Sediment ESVs for most of the inorganic chemicals, butyl tins and bulk petroleum hydrocarbons presented in Table 2a are based on a range of effect levels and measured in milligrams per kilogram (mg/kg) dry weight. Several organic chemical ESVs are also listed on a dry weight basis as indicated by the gray shaded cells in Tables 2a and 2b. The effects range-low (ER-L) is the concentration of a chemical in sediment at the low

Region 4 Supplemental Guidance Scientific Support Section Table of Contents Superfund Division
6-9 Last updated March 2018
end of the range at which adverse biological effects on aquatic organisms were observed (Long and Morgan, 1991). The ER-L is the lower 10th percentile in the distribution of biological effects data from matching biological and chemical laboratory data or field surveys. The effects range-median (ER-M) is the approximate midway in the range of concentrations where adverse biological effects were observed. The ER-M is the median of the distribution of effects values. The TEL is the threshold effects level below which adverse biological effects on aquatic organisms are unlikely. It is calculated as the geometric mean of the 15th percentile of the effects data set and the 50th percentile of the no effects data set. If the chemical concentration in sediment is below the TEL adverse effects are expected to occur infrequently. The probable effect level (PEL) represents a second threshold value, above which adverse effects are frequently observed. The PEL is the lower limit of the probable effects range. It is calculated as the geometric mean of the 50th percentile of the effects data set and the 85th percentile of the no effects data set. When sediment concentrations fall between the TEL and the PEL, adverse biological effects may be possible; but the severity and magnitude of potential effects can be difficult to gauge. A weight of evidence approach is used in cases where the concentrations at the site fall between the TEL and PEL, as described in Section 3. The TEC is a consensus value which identifies COPC concentrations below which harmful effects on sediment-dwelling organisms are unlikely to be observed. The TECs were developed by the Florida Department of Environmental Protection (FDEP) by taking the geometric mean of ER-L and TEL values from various sources (MacDonald et al., 2003). The probable effect concentration (PEC) is a consensus value formed by taking the geometric mean of ER-M and PEL values from various sources. When concentrations of COPCs are between the TEC and the PEC, adverse biological effects on sediment-dwelling organisms are possible. The TEC and PEC values in MacDonald et al. (2003) are nearly identical to the values found in MacDonald et al. (2000). The TEL, TEC, or ER-L is used for screening in the SLERA. For the Step 2 Screening, the PAH ESVs are based on the sum total of LMW-PAHs and HMW-PAHs from MacDonald (1994) and total PAHs from MacDonald et al. (2003). These ESVs for PAHs (shown in Table 2b) are measured in micrograms per kilogram (µg/kg) dry weight (dw). If PAHs exceed the ESV, then Step 3 refinement will be necessary as discussed in Section 6.2.4.

Region 4 Supplemental Guidance Scientific Support Section Table of Contents Superfund Division
6-10 Last updated March 2018
6.2.2 Sediment ESVs Based on Equilibrium Partitioning
The equilibrium partitioning (EqP) methodology is well-documented in the scientific literature (Di Toro et al., 2000; U.S. EPA, 2003a; U.S. EPA, 2008; McGrath and Di Toro, 2009; Burgess et al., 2013; Redman et al., 2014). The EPA (2002) reported that adverse biological effects from the concentration of nonionic organic contaminants (such as PAHs, PCBs, certain organochlorine and organophosphate insecticides, etc.) in sediment are not correlated with bulk concentration of the contaminants in sediment; however, they can be correlated with the concentration of the contaminant in interstitial pore water. This suggests that the toxicity of many organic chemicals to sediment-dwelling organisms is proportional to their concentration that is dissolved in the interstitial water of the sediment. The EqP theory is based on the principle that organic contaminants (primarily non-ionic compounds) in sediment will partition between the OC fraction in sediment and the sediment interstitial water in a relatively constant ratio. This ratio can be used to predict the fraction of a contaminant that is freely dissolved in interstitial pore water from the concentration in sediment. The ratio is referred to as the OC partitioning coefficient, or Koc. A chemical may have different Kocs depending on the OC in the sediment and for different types of OC such as humic and fulvic acids, soot or black carbon. In general, the higher the Koc of an organic compound, the stronger the contaminant will adsorb to the OC content in the sediment. When more OC is present in sediment, the concentration of an organic contaminant freely dissolved in the interstitial water will be smaller, and therefore, the sediment contamination will exhibit proportionally less toxicity to aquatic organisms. The Koc values used in this document were derived from the KOCWIN™ model in the EPA Estimation Program Interface (EPI) suite. In most cases, the KOCWIN™ model estimates Koc two different ways using either an estimate from log Kow or from a molecular connectivity index model. To be conservative, the lower of the two Koc estimates is used to develop the sediment ESV. An EqP-based sediment ESV for an organic contaminant is derived by multiplying a WQB by its Koc:
ESVSed = WQB × [Koc × foc + (ϴm/pw)]

Region 4 Supplemental Guidance Scientific Support Section Table of Contents Superfund Division
6-11 Last updated March 2018
Where: ESVSed = normalized to 1% organic carbon (µg/kg 1% OC) WQB = water quality benchmark (µg/L)
Koc = organic carbon partitioning coefficient (L/kg) foc = fraction of organic carbon (0.01 for 1% OC)
ϴm = 0.3 (assumed 30% moisture of sediment by mass) pw = 0.9982 density of water at 20˚C. The WQB for this model is obtained from the values in Table 1a. If there were no Table 1a values, then the lowest WQB from the following three models was used:
1. ECOSAR; 2. EPA (2008) model; 3. McGrath and Di Torro (2009);
As mentioned in Section 6.1.4, the ECOSAR program predicts a final chronic value and is used for non-neutral organic chemicals. For neutral organics, either the EPA (2008) sediment benchmark or the McGrath and Di Toro (2009) model was used (Equation 2 in Section 6.1.4). Since most measurements of organic chemicals are in µg/kg, the modeled values have been converted to µg/kg at 1% OC in Table 2a. In addition, because measurements of total organic carbon (TOC) are typically not available for screening purposes in the SLERA, a default TOC of 1% is used and is reflected in Equation 3 and in Table 2a. Region 4 highly recommends collecting TOC measurements in sediment and soil concurrent with analyses of volatile organic compounds (VOCs) and semi-volatile organic compounds (SVOCs) including PAHs. This will provide for more accuracy in the screening process. Table 2a also lists chemicals that share the same toxic mode of action, based on the work of Russom, et al., (1997). For those detected chemicals that share the same toxic mode of action, the ΣTU approach should be used. For example, a number of pesticides listed in Table 2a share the same toxic mode of action as central nervous system seizure agents, as identified by the symbol “C”. Detected concentrations of these pesticides should be evaluated using the ΣTU approach. Except where noted on Table 2a as “wildlife based”, the sediment ESVs provide

Region 4 Supplemental Guidance Scientific Support Section Table of Contents Superfund Division
6-12 Last updated March 2018
protection to benthic organisms from direct toxicity. The wildlife based ESV should be used in the Step 2 screening and if the site concentration exceeds the wildlife based ESV, then a food chain model will be needed in Step 3a. See also Sections 2.1 and 3.1.5 for discussion of bioaccumulative chemicals. It is important to determine if there are any State regulatory sediment benchmarks. If so, then the State sediment regulatory values are used if they are more conservative than the equilibrium partitioning values derived from surface water benchmarks. The screening values do not consider the antagonistic, additive or synergistic effects of other sediment contaminants in combination with other mixtures or the potential for bioaccumulation and trophic transfer to aquatic life or wildlife. Such potential effects of identified COPCs would likely be discussed in the BERA. 6.2.3 Sediment ESVs based on Narcotic Mode of Toxicity
The predominant mode of toxicity for each of the chemicals in Table 2b is narcosis. Most of the ESVs in Table 2b are based on EqP of neutral (nonionic) organic chemicals. With the exception of PAHs and a few other chemicals that are measured on a dry weight basis (highlighted in gray color on Table 2b) the concentrations are expressed in µg/kg at 1% OC. When screening chemicals using the ESVs in ERA Step 2, the ESVs in Table 2a and Table 2b are applied as in units of µg/kg dry weight, as recommended by MacDonald et al. (2000). The site-specific total organic carbon content of the sediment is factored into the calculation of the sum toxic unit using the RSVs in EPA Step 3a. The ΣTU approach should be used in the screening process to identify COPCs that may collectively contribute narcotic effects to sediment-dwelling organisms. The same methodology described in the previous section (Equation 3) was used for deriving the ESVs, except for PAHs which are discussed below. 6.2.4 PAH Mixtures – Refinement Screening Values
The EqP methodology presented in this section provides a means to estimate the ΣTU concentrations for PAHs that may be present in sediment for protection of benthic organisms from adverse effects. The refinement screening values for PAHs are derived from the methodology developed in the EPA (2003a) guidance document and incorporate the ΣTU approach for narcosis as

Region 4 Supplemental Guidance Scientific Support Section Table of Contents Superfund Division
6-13 Last updated March 2018
discussed in Section 3.1.6. The methodology and equations are similar to the EqP discussion in Section 6.2.2. Based on this EPA (2003a) approach and terminology, the quotient for a specific OC normalized PAH concentration (COC, PAHi) and the sediment OC normalized PAH final chronic value (COC, PAHi, FCVi) in sediments is termed the equilibrium partitioning sediment benchmark toxic unit (ESBTUFCVi). Thus, the EqP sediment benchmark (ESB) for the mixture of PAHs is the sum of the ESBTUFCVi for all of the PAHs in the particular sediment as reflected below:
ΣESBTUFCV = Σi COC,PAHi, / COC,PAHi,FCVi Table 2c provides the sediment COC, PAHi, FCVi for various PAHs. The 34 PAHs are bolded in the Table. Other individual PAH benchmark values may be found in Table 3.4 of the EPA (2003a) guidance document. Note that these values are expressed as µg/kg OC (direct from the guidance) and have not been normalized to 1% OC. This approach specifies that the sum of 34 individual PAHs be used for protection of benthic organisms. If the ΣESBTUFCV is <1.0 for the 34 PAHs, then sensitive benthic organisms are considered not to be adversely affected. It is recognized that most analytical methods do not measure the suggested 34 PAHs. In general, EPA’s Contract Laboratory Program (CLP) does not provide such analyses and many other laboratories do not have the capability. Typically, non-alkylated PAHs are identified through the semi-volatile analysis methods (e.g., EPA SW-846 Method 8270C), that usually provide results for approximately 16 individual PAHs. For screening purposes, if there are less than 34 PAHs, then the EPA (2003a) guidance document should be consulted to determine an appropriate multiplying factor to account for the potential contribution of the alkylated PAHs to benthic organism toxicity. The EPA (2003a) guidance document states that the FCVs and resulting sediment benchmarks are acceptable for saltwater sediments. Consequently, the freshwater sediment RSVs for PAHs are the same for marine sediment. These RSVs also do not consider the antagonistic, additive or synergistic effects of other sediment contaminants in combination with PAH mixtures or the potential for bioaccumulation and trophic transfer of PAH mixtures to aquatic life or wildlife. At sites with PAH contamination, certain chemicals that are not technically PAHs are

Region 4 Supplemental Guidance Scientific Support Section Table of Contents Superfund Division
6-14 Last updated March 2018
often present, such as dibenzofuran, carbazole, benzaldehyde, and 1,1-biphenyl. These chemicals should be considered for inclusion in the ΣTU for PAHs. 6.3 Soil Screening Values The hierarchy for soil benchmarks for protection of plants, soil invertebrates, mammals and avians is as follows:
• EPA Ecological Soil Screening levels (EcoSSLs); • Department of Energy Laboratories i.e., Los Alamos National Laboratory
(LANL) and Oak Ridge National laboratory (ORNL). • EqP modeled values for organic chemicals.
The Region 4 soil screening values (Table 3) include the EPA Ecological Soil Screening Values (EcoSSLs). Table 3 indicates the ecological entity that the soil screening value is intended to protect. Soil screening values that protect plants, soils invertebrates, avian wildlife or mammalian wildlife are reported from various sources. The Region 4 soil screening values typically address toxicity through direct exposure (e.g., toxicity to soil invertebrates such as earthworms and plants). For those chemicals that biomagnify, screening values may be back-calculated to derive screening values for avian or mammalian wildlife by considering trophic transfers from the abiotic medium to prey items. The EcoSSLs provide screening values for avian and mammalian wildlife by this method. Where there are no EcoSSLs, the LANL values followed by the ORNL benchmarks are used. For organic compounds that don’t have conventional screening benchmarks, Table 3 also includes screening benchmarks for invertebrates based on EqP theory similar to the sediment model. The following equation is used:
ESVSoil Inverts = WQB × [foc × Koc + θw/ρb + (θa/ρb)*H']
Where: ESVSoil Inverts = screening value (mg/kg) WQB = water quality benchmark from ECOSAR (mg/L) foc = fraction of OC assumed to be 1% (dimensionless) Koc = OC partitioning coefficient (L/kg) θw = volumetric water content of soil (0.198 cubic centimeter
[cm3]/cm3) θa = aeration porosity of soil (0.284 cm3/cm3)

Region 4 Supplemental Guidance Scientific Support Section Table of Contents Superfund Division
6-15 Last updated March 2018
ρb = soil bulk density (1.37 grams per cubic centimeter [g/cm3]) Hʹ = Henry’s Law constant (dimensionless)
Although the θw, θa, and ρb parameters depend on soil texture, for screening purposes, the default values for each of these are based on the silty clay loam texture classification consistent with the Johnson and Ettinger (1991) Vapor Intrusion Model. Therefore, the above equation can be simplified to:
ESVSoil Inverts = WQB × [Koc + 0.145 + (0.207 * H')] This model assumes that the WQBs protective of aquatic invertebrates in interstitial pore water are also protective of terrestrial invertebrates in soil. Recent research by Redman et al. (2014) suggests that a target lipid model for soil organisms may also be combined with the EqP model. Research to test their combined model is needed and will likely be forthcoming in the near future. For bioaccumulative chemicals in soil, as highlighted in red font on Table 3, priority was given to mammalian or avian ESVs over the soil invertebrate benchmarks to reflect effects to the upper trophic level receptors. In addition, for those bioaccumulatives that did not have benchmarks from the listed soil hierarchy, then EPA (2003b) Region 5 ecological screening levels were used. Although there are no refinement values (RSVs) for soils, the risk assessor may use the other benchmark values on Table 3 as RSVs, depending on the receptors exposed. Other sources may also be used provided justification is included for the soil RSV. 6.4 Wildlife Screening Values Currently there is limited information concerning tissue chemical screening levels which would pose minimal or no toxic effects to predatory ecological receptors. Consequently, no screening-level tissue residue values have been proposed at this time for use in the SLERA. As mentioned in Section 3.2, dietary and bioaccumulation modeling is not recommended in the SLERA and should be reserved for Step 3a and beyond. There are TRVs for various wildlife that serve to indicate if a dietary contaminant dose may pose potential risk to a predatory ecological receptor. The chemical exposure is generally expressed as a daily dietary exposure with the units in mg/kg body weight of the receptor per day (mg/kg-BW/day). Site-specific wildlife screening values that are based on

Region 4 Supplemental Guidance Scientific Support Section Table of Contents Superfund Division
6-16 Last updated March 2018
ecotoxicological information from sources such as the scientific literature, computer databases, etc., may be submitted during the Step 3a Refinement Screen or later in the BERA. The EPA Region 4 SSS have TRVs and wildlife exposure parameters that are preferred for use in ecological risk assessments conducted in Region 4. Please contact the SSS for their latest updated values. 6.5 Groundwater Screening Values If the initial CSM suggests the potential for impacts of contaminated groundwater on ecological receptors, either directly (e.g., cave-dwelling ecological receptors if present) or indirectly through existing or potential discharge to sediments, seeps, and surface water, then these pathways should be considered in the SLERA. The maximum groundwater chemical concentrations should be compared to the surface water screening values as a conservative scenario (e.g., no attenuation, dilution, etc.). The ΣTU approach for PAHs and other potentially narcotic chemicals in groundwater should be used as described in Section 3.1.5.

Region 4 Supplemental Guidance Scientific Support Section Table of Contents Superfund Division
7-1 Last updated March 2018
7.0 References Burgess, R.M., Berry, W.J., Mount, D.R., and D.M. Di Toro. 2013. Mechanistic sediment quality guidelines based on contaminant bioavailability: Equilibrium partitioning sediment benchmarks. Environ. Toxicol. Chem. 32:102-114. Di Toro, D.M., McGrath, J.A., and D.J. Hansen. 2000. Technical basis for narcotic chemicals and polycyclic aromatic hydrocarbon criteria. I. Water and Tissue. Environ. Toxicol. Chem. 19:1951-1970. Johnson, P.C, and R.A. Ettinger. 1991. Heuristic model for predicting the intrusion rate of contaminant vapors in buildings. Environ. Sci. Technol. 25: 1445-1452. Long, E. R. and L. G. Morgan. 1991. The Potential for Biological Effects of Sediment-Sorbed Contaminants Tested in the National Status and Trends Program. NOAA Technical Memorandum NOS OMA 52. National Oceanic and Atmospheric Administration. MacDonald, D.D., Ingersoll, C.G, Smorong, D.E., Lindskoog, R.A., Sloane, G., and T. Biernacki. 2003. Development and Evaluation of Numerical Sediment Quality Assessment Guidelines for Florida Inland Waters. Prepared for Florida Department of Environmental Protection, Tallahassee, Florida. https://floridadep.gov/dear/watershed-monitoring-section/documents/development-and-evaluation-numerical-sediment-quality MacDonald, D.D., Ingersoll, C.G., and T.A. Berger. 2000. Development and evaluation of consensus-based sediment quality guidelines for freshwater ecosystems. Arch. Environ. Contam. Toxicol. 39:20-31. McGrath, J.A. and D.M. Di Toro. 2009. Validation of the target lipid model for toxicity assessment of residual petroleum constituents: Monocyclic and polycyclic aromatic hydrocarbons. Environ. Toxicol. Chem. 28:1130-1148. Raimondo S, Montague B, Barron MG. 2007. Determinants of variability in acute to chronic toxicity ratios for aquatic invertebrates and fish. Environ. Toxicol. Chem. 26(9):2019-2023.

Region 4 Supplemental Guidance Scientific Support Section Table of Contents Superfund Division
7-2 Last updated March 2018
Redman, A.D., Parkerton, T.F., Paumen, M.L., and J.A. McGrath. 2014. Extension and validation of the target lipid model for deriving predicted no-effect concentrations for soils and sediments. Environ. Toxicol. Chem. 33:2679-2687. Stephen, C.E., Mount, D.I., Hansen, D.J., Gentile, J.R., Chapman, G.A., and W.A. Brungs. Guidelines for Deriving Numerical National Water Quality Criteria for the Protection of Aquatic Organisms and Their Uses. U.S. Environmental Protection Agency, Office of Research and Development. PB85-227049. https://www.epa.gov/sites/production/files/2016-02/documents/guidelines-water-quality-criteria.pdf Suter, G.W. II, and C.L Tsao. 1996. Toxicological benchmarks for screening potential contaminants of concern for effects on aquatic biota: 1996 Revision. U.S. Department of Energy, Oak Ridge, Tennessee. ES/ER/TM-96/R2. https://rais.ornl.gov/documents/tm96r2.pdf, Swartjes, F.A., Rutgers, M., Lijzen, J.P.A., Janssen, P.J.C.M., Otte, P.F., Wintersen, A., Brand, E., and L. Posthuma. 2012. State of the art of contaminated site management in The Netherlands: Policy framework and risk assessment tools. Sci. Tot. Environ. 427-428: 1-10. United States Environmental Protection Agency (U.S. EPA). 2008. Procedures for the Derivation of Equilibrium Partitioning Sediment Benchmarks (ESBs) for the Protection of Benthic Organisms: Compendium of Tier 2 Values for Nonionic Organics. EPA-600-R-02-016. Office of Research and Development, Washington, D.C. U.S. EPA. 2006. Guidance on Systematic Planning Using the Data Quality Objectives Process, EPA QA/G-4. Office of Environmental Information, Washington, D.C. EPA/240/B-06/001. February 2006. https://www.epa.gov/sites/production/files/documents/guidance_systematic_planning_dqo_process.pdf U.S. EPA. 2005. Contaminated Sediment Remediation Guidance for hazardous Waste Sites. Office of Solid Waste and Emergency Response 9355.0-85. EPA-540-R-05-102, December 2005. https://clu-in.org/download/contaminantfocus/sediments/contaminated-sediment-remediation-EPA-guidance.pdf

Region 4 Supplemental Guidance Scientific Support Section Table of Contents Superfund Division
7-3 Last updated March 2018
U.S. EPA. 2003. Procedures for the Derivation of Equilibrium Partitioning Sediment Benchmarks (ESBs) for the Protection of Benthic Organisms: PAH Mixtures. EPA-600-R-02-013. Office of Research and Development, Washington, D.C. https://clu-in.org/conf/tio/porewater1/resources/EPA-ESB-Procedures-PAH-mixtures.pdf U.S. EPA. 2002a. Role of Background in the CERCLA Cleanup Program. Office of Solid Waste and Emergency Response, Washington, D.C., OSWER 9285.6-07P. April 2002. https://rais.ornl.gov/documents/bkgpol_jan01.pdf U.S. EPA. 2002b. Guidance for Comparing Background and Chemical Concentrations in Soil for CERCLA Sites. Office of Emergency and Remedial Responses, Washington, D.C. EPA 540-R-01-003. September 2002. https://www.epa.gov/risk/guidance-comparing-background-and-chemical-concentrations-soil-cercla-sites U.S. EPA. 2001. Eco Update. The Role of Screening-Level Risk Assessments and Refining Contaminants of Concern in Baseline Ecological Risk Assessments. Office of Solid Waste and Emergency Response, Washington, D.C. Publication 9345.0-14. EPA 540/F-01/014. June 2001. https://www.epa.gov/sites/production/files/2015-09/documents/slera0601.pdf U.S. EPA. 1998. Guidelines for Ecological Risk Assessment. Risk Assessment Forum, Washington, DC, EPA/630/R095/002F, 1998. https://www.epa.gov/risk/guidelines-ecological-risk-assessment U.S. EPA. 1997. Ecological Risk Assessment Guidance for Superfund: Process for Designing and Conducting Ecological Risk Assessments - Interim Final. OSWER Directive 9285.7-25 EPA/540/R-97/006. https://semspub.epa.gov/work/11/157941.pdf U.S. EPA. 1995. Final Water Quality Guidance for the Great Lakes System. 60 Federal Register: 15365 (March 23, 1995). Table 6. https://www.gpo.gov/fdsys/granule/FR-1995-03-23/95-6671/content-detail.html U.S. EPA. 1993. Wildlife Exposure Factors Handbook, U.S. Environmental Protection Agency, Office of Research and Development, Washington, D.C. EPA/600/R-93/187a,b. December 1993. https://cfpub.epa.gov/ncea/risk/recordisplay.cfm?deid=2799
https://www.epa.gov/risk/guidance-comparing-background-and-chemical-concentrations-soil-cercla-sites

Region 4 Supplemental Guidance Scientific Support Section Table of Contents Superfund Division
7-4 Last updated March 2018
U.S. EPA. 1992. Framework for Ecological Risk Assessment. Risk Assessment Forum, Washington, D.C. EPA/630/R-92/011. February 1992. https://www.epa.gov/risk/framework-ecological-risk-assessment U.S. EPA. 1985. Guidelines for Deriving Numerical National Water Quality Criteria for the Protection of Aquatic Organisms and their Uses. Office of Research and Development, Environmental Research Laboratories. PB85-227049. https://www.epa.gov/wqc/guidelines-deriving-numerical-national-water-quality-criteria-protection-aquatic-organisms-and

Region 4 Ecological Risk Assessment
Supplemental Guidance
MARCH 2018 UPDATE
Screening Values

Surface Water Screening Values

Table 1aRegion 4 Surface Water Screening Values for Hazardous Waste Sites
Chronic Acute Source Chronic Acute Source
Aluminum (pH 6.5 -9.0) 7429-90-5 87 750 a 1,500 dAntimony 7440-36-0 190 900 b 4,300 dArsenic (filtered and unfiltered) ^ 7440-38-2 150 340 a 36 69 aArsenic III (unfiltered) ^ 22541-54-4 148 340 b 36 69 fBarium 7440-39-3 220 2,000 b 4 110 aBeryllium 7440-41-7 11 93 b 0.13 dBoron 7440-42-8 7,200 34,000 b 1,000 lCadmium (filtered) ^ * 7740-43-9 0.45 0.94 a 7.9 33 aCalcium 7440-70-2 116,000 cChromium III (filtered) ^ * 16065-83-1 42 323 a 103 515 sChromium VI (filtered) ^ 18540-29-9 11 16 a 50 1,100 aCobalt 7440-48-4 19 120 bCopper (filtered) ^ * 7740-50-8 4.95 7.0 a 3.1 4.8 aIron 7439-89-6 1,000 a 300 dLead (filtered) ^ * 7439-92-1 1.25 30.1 a 8.1 210 aLithium 7439-93-2 440 910 bMagnesium 7439-95-4 82,000 cManganese 7439-96-5 93 1,680 b 100 dMercury ( filtered & unfiltered) ^ (aquatic) 7439-97-6 0.77 1.4 a 0.94 1.8 aMercury (wildlife based) 7439-97-6 0.0013 0.012 b, a 0.94 1.8 aMethylmercury (aquatic life) 22967-92-6 0.0028 0.099 cMolybdenum 7439-98-7 800 7,200 bNickel (filtered) ^ * 7440-02-0 28.9 260 a 8.2 74 aPhosphorus (elemental) 7723-14-0 1,000 m 100 dPotassium 7440-09-7 53,000 cSelenium (unfiltered) ^ (aquatic) ** 7782-49-2 5 20 a, aa 71 290 aSilver (filtered) ^ * 7740-22-4 0.06 0.98 b, a 0.1 1.9 e, aSodium 7440-23-5 680,000 cStrontium 7440-24-6 5,300 48,000 bThallium 7440-28-0 6 54 b 6.3 710 d, gTin 7440-31-5 180 1,600 bUranium 7440-61-1 2.6 46 cVanadium 7440-62-2 27 79 bZinc (filtered) ^ * 7740-66-6 66 66 a 81 90 aZirconium 7440-67-7 17 310 c
Chloride 16887-00-6 230,000 860,000 a, aChlorine 7782-50-5 11 19 a, a 7.5 13 a, aCyanide (free) 57-12-5 5.2 22 a, a 1 1 a, aFluoride 16984-48-8 2,700 9,800 b, b 5,000 dHydrogen sulfide (S2-, HS-) 7783-06-4 2 3.2 a, n 2 aSulfite 14265-45-3 200 b
1,1,1,2-Tetrachloroethane 630-20-6 85 770 b, b 360 1,376 i, i1,1,2,2-Tetrachloroethane 79-34-5 200 910 b, b 10.8 902 d, s1,1,1-Trichloroethane 71-55-6 76 690 b, b 1,560 3,120 s, s1,1,2-Trichloroethane 79-00-5 730 3,200 b, b 2,097 8,026 i, i1,1-Dichloroethane 75-34-3 410 3,700 b, b 2,692 10,310 i, i1,2-Dichloroethane 107-06-2 2,000 8,200 b, b 5,650 11,300 s, s1,2-Dichloropropane 78-87-5 520 3,300 b, b 1,064 3,400 i, gBromoform (tribromomethane) 75-25-2 230 1,100 b, b 360 1,790 d, sBromomethane (methyl bromide) 74-83-9 16 38 b, b 265 1,100 u, u
Metals
Chemical CASFreshwater Screening Values (µg/L) Saltwater Screening Values (µg/L)
Inorganic Compounds
Other Inorganics
Volatile Organic Compounds (VOCs)Chlorinated and Brominated Alkanes
Page 1 of 6 3/19/2018

Table 1aRegion 4 Surface Water Screening Values for Hazardous Waste Sites
Chronic Acute Source Chronic Acute SourceChemical CAS
Freshwater Screening Values (µg/L) Saltwater Screening Values (µg/L)
Dibromochloromethane 124-48-1 320 2,900 b, b 34 13,416 d, uDichlorobromomethane 75-27-4 340 3,100 b, b 3,510 14,567 u, uDichloromethane (Methylene chloride) 75-09-2 1,500 8,500 b, b 1,580 25,600 d, sHexachloroethane 67-72-1 12 210 c, c 33 310 j, gTrichloromethane (Chloroform) 67-66-3 140 1,300 b, b 471 8,150 d, sTetrachloromethane (Carbon tetrachloride) 56-23-5 77 690 b, b 4.4 15,000 d, s
1,1-Dichloroethene (1,1-Dichloroethylene) 75-35-4 130 1,200 b, b 3.2 22,400 d, s1,2-Dichloroethene (1,2-Dichloroethylene) 540-59-0 970 8,800 b, b 818 3,393 u, u1,2-cis-Dichloroethyene 156-59-2 620 5,500 b, b 1,629 6,236 i, i1,2-trans-Dichloroethylene 156-60-5 558 10,046 b, b 1,629 6,236 i, i1,3-Dichloropropene (cis and trans) 542-75-6 1.7 15 b, b 39.5 79 s, s1,1,2,2-Tetrachloroethylene (PCE) 127-18-4 53 430 b, b 8.85 1,020 d, s1,1,2-Trichloroethylene (TCE) 79-01-6 220 2,000 b, b 81 200 d, sChloroethene (Vinyl chloride) 75-01-4 930 8,400 b, b 2,276 8,717 i, i
Chlorobenzene 108-90-7 25 220 b, b 25 1,360 h, i1,2-Dichlorobenzene 95-50-1 23 130 b, b 42 660 h, g1,3-Dichlorobenzene 541-73-1 22 79 b, b 390 660 e, g1,4-Dichlorobenzene 106-46-7 9.4 57 b, b 115 660 i, g1,2,3-Trichlorobenzene 87-61-6 8 134 h, i 5 134 l, i1,2,4-Trichlorobenzene 120-82-1 130 420 b, b 5.4 134 h, i1,3,5-Trichlorobenzene 108-70-3 5 134 l, i 5 134 l, iTrichlorobenzene (mixed isomers) 12002-48-1 5 134 b, i 5 134 l, i
1,2,4-Trimethylbenzene 95-63-6 15 140 b, b 56 366 j, i1,3,5-Trimethylbenzene 108-67-8 26 230 b, b 56 366 j, iBenzene 71-43-2 160 700 b, b 110 1,700 h, gCymene, p- (4-Isopropyltoluene) 99-87-6 16 150 b, b 21 187 j, iEthylbenzene 100-41-4 61 550 b, b 25 8,760 h, sIsopropylbenzene (Cumene) 98-82-8 4.8 43 b, b 98 547 j, iStyrene (vinyl benzene) 100-42-5 32 290 b, b 412 1,575 i, iToluene 108-88-3 62 560 b, b 215 950 h, sXylenes (total) 1330-20-7 27 240 b, b 260 1,057 j, i
Acetonitrile 75-05-8 12,000 100,000 b, b 73,429 217,936 j, jAcrylonitrile 107-13-1 78 650 b, b 391 858 j, j1,2-Diphenylhydrazine 122-66-7 1.1 10 b, b 30 110 j, jHydrazine 302-01-2 2 16 b, b 34 140 u, u
2-Butanone (methyl ethyl ketone) 78-93-3 22,000 200,000 b, b 65,695 201,828 j, j2-Hexanone (methyl butyl ketone) 591-78-6 99 1,800 c, c 16,871 58,590 j, j2-Octanone (methyl hexyl ketone) 111-13-7 8.3 150 c, c 2,807 10,740 i, i4-Methyl-2-pentanone (MIBK) 108-10-1 170 2,200 c, c 19,142 65,872 j, jAcetone 67-64-1 1,700 15,000 b, b 117,629 355,606 j, j
1-Pentanol 71-41-0 110 2,000 c, c 12,637 44,404 j, j2-Propanol 67-63-0 7.5 130 c, c 52,874 162,854 j, jEthylene glycol 107-21-1 140,000 1,300,000 b, b 4,200 1,768,104 u, jMethanol 67-56-1 330 3,000 b, b 112,652 369,551 j, jPropylene glycol 57-55-6 71 640 b, b 329,329 1,114,122 j, j
1,4-Dioxane 123-91-1 22,000 200,000 n, n 200,733 617,500 j, jAcetaldehyde 75-07-0 130 1,200 b, b 20 1,680 u, uAcrolein 107-02-8 3 3 a, a 1.8 7.6 u, u
Chlorinated Alkenes
Chlorobenzenes
Monoaromatic Hydrocarbons
Energetic VOCs
Ketones
Alcohols
Other VOCs
Page 2 of 6 3/19/2018

Table 1aRegion 4 Surface Water Screening Values for Hazardous Waste Sites
Chronic Acute Source Chronic Acute SourceChemical CAS
Freshwater Screening Values (µg/L) Saltwater Screening Values (µg/L)
Carbon disulfide 75-15-0 15 130 b, b 253 1,050 u, uCyclohexane 110-82-7 158 890 j, i 158 890 j, iHexane 110-54-3 0.6 10 c, c 115 715 j, iMethylcyclohexane 108-87-2 52 421 j, i 52 421 j, iMethylamine 74-89-5 860 7,700 b, b 1,727 14,164 j, jMethyl tert-butyl ether (MTBE) 1634-04-4 730 6,500 b, b 5,000 38,037 h, jVinyl acetate 108-05-4 16 280 c, c 2,892 12,000 u, u
4-Chloroaniline 106-47-8 0.8 24 u, u 0.8 24 u, u2,4-Dichloroaniline 554-00-7 15 575 j, j 15 575 j, jPentachloroaniline 527-20-8 5 88 j, i 5 88 j, i
1,2,3,4-Tetrachlorobenzene 634-66-2 3 18 b, b 6 39 j, i1,2,4,5-Tetrachlorobenzene 95-94-3 8.3 75 b, b 6 39 j, iHexachlorobenzene (aquatic only) 118-74-1 0.15 2.8 j, u 0.15 2.8 j, uHexachlorobenzene (wildlife based) 118-74-1 0.0003 nPentachlorobenzene (aquatic only) 608-93-5 3.1 16 b, b 1 11 j, iPentachlorobenzene (wildlife based) 608-93-5 0.02 n
2-Chlorophenol 95-57-8 18 160 b, b 400 1,037 d, u2,4-Dichlorophenol 120-83-2 11 92 b, b 790 1,352 d, j2,4,5-Trichlorophenol 95-95-4 1.9 17 b, b 12 259 o, o2,4,6-Trichlorophenol 88-06-2 4.9 39 b, b 6.5 414 d, i2,3,4,6-Tetrachlorophenol 58-90-2 1 11 h, n 32 120 i, i3-Methyl-4-Chlorophenol 59-50-7 1 67 h, n 241 1,000 u, uPentachlorophenol # (aquatic) 87-86-5 15 19 a, a 7.9 13 a, a
2-Methylphenol (Cresol, o-) 95-48-7 67 600 b, b 995 2,615 j, j3-Methylphenol (Cresol, m-) 108-39-4 62 560 b, b 995 2,615 j, j4-Methylphenol (Cresol, p-) 106-44-5 53 480 b, b 405 1,680 u, u2,3-Dimethylphenol 526-75-0 120 1,100 n, n 550 1,446 j, j2,4-Dimethylphenol 105-67-9 15 140 b, b 193 800 u, u2-Nitrophenol 88-75-5 73 650 b, b 900 4,101 u, j4-Nitrophenol 100-02-7 58 530 b, b 600 3,585 u, u2,4-Dinitrophenol 51-28-5 71 379 b, b 14 2,425 d, u2,4,6-Tribromophenol 118-79-6 5.6 50 b, b 37 140 i, iNonylphenol (branched) 84852-15-3 1 6 h, j 0.7 6 h, jPhenol 108-95-2 160 4,700 b, b 58 300 p, p
2-Amino-4,6-dinitrotoluene 35572-78-2 18 160 b, b 20 175 k4-Amino-2,6-dinitrotoluene 19406-51-0 11 98 b, b 27 707 j, j1,3-Dinitrobenzene (DNB) 99-65-0 22 100 b, b 20 108 k2,3-Dinitrotoluene 602-01-7 2.3 21 b, b 36 295 j, u2,4-Dinitrotoluene 121-14-2 44 390 b, b 9.1 200 d, g2,5-Dinitrotoluene 619-15-8 5.6 50 b, b 36 367 j, j2,6-Dinitrotoluene 606-20-2 81 730 b, b 36 200 j, g3,5-Dinitrotoluene 618-85-9 95 860 b, b 36 367 j, j3,5-Dinitroanaline (DNA) 618-87-1 70 210 b, b 60 230 kHMX (Octahydro-tetranitro-1,3,5,7-tetrazocine) 2691-41-0 220 1,200 b, b 330 1,875 kNitroglycerine 55-63-0 18 160 b, b 239 991 u, u2-Nitrotoluene 88-72-2 71 640 b, b 1,185 4,919 u, u3-Nitrotoluene 99-08-1 42 380 b, b 1,384 5,745 u, u4-Nitrotoluene 99-99-0 46 410 b, b 1,438 5,969 u, uRDX (Hexahydro-1,3,5-trinitro-1,3,5-triazine) 121-82-4 79 520 b, b 190 700 k
ChloroanilinesSemivolatile Organic Compounds
Chlorobenzenes
Chlorophenols
Other Phenols
Energetic SVOAs
Page 3 of 6 3/19/2018

Table 1aRegion 4 Surface Water Screening Values for Hazardous Waste Sites
Chronic Acute Source Chronic Acute SourceChemical CAS
Freshwater Screening Values (µg/L) Saltwater Screening Values (µg/L)
1,3,5-Trinitrobenzene (TNB) 99-35-4 11 27 b, b 11 36 k2,4,6-Trinitrotoluene (TNT) 118-96-7 13 120 b, b 54 252 j, u
bis(2-Ethylhexyl) Phthalate 117-81-7 8 1,100 b, b 6 605 u, uButylbenzyl Phthalate 85-68-7 23 130 b, b 18 38 i, iDiethyl Phthalate 84-66-2 220 980 b, b 59 2,139 u, uDimethyl Phthalate 131-11-3 1,100 3,200 b, b 3,295 16,500 j, uDi-n-Butyl Phthalate 84-74-2 19 34 b, b 27 102 i, iDi-n-Octyl Phthalate 117-84-0 215 893 u, u 215 893 u, u
1-Methylnaphthalene 90-12-0 6.1 109 b, b 52 157 j, i2-Methylnaphthalene 91-57-6 4.7 42 b, b 52 150 j, iAcenaphthene 83-32-9 15 19 b, b 15 320 j, gAcenaphthylene 208-96-8 13 120 b, b 28 291 j, jAnthracene 120-12-7 0.02 0.18 b, b 0.43 1.8 u, uBenz(a)anthracene 56-55-3 4.7 42 b, b 0.35 4.6 j, iBenzo(a)pyrene 50-32-8 0.06 0.54 b, b 0.02 0.64 u, uBenzo(b)fluoranthene 205-99-2 2.6 23 b, b 0.06 1.4 j, iBenzo(g,h,i)perylene 191-24-2 0.012 0.19 j, u 0.012 0.19 j, uBenzo(k)fluoranthene 207-08-9 0.06 1.3 j, i 0.06 1.3 j, iChrysene 218-01-9 4.7 42 b, b 0.35 4.2 j, iDibenz(a,h)anthracene 53-70-3 0.012 0.28 j, j 0.01 0.28 j, jFluoranthene 206-44-0 0.8 3.7 b, b 0.82 3.4 u, uFluorene 86-73-7 19 110 b, b 24 82 j, iIndeno(1,2,3-cd)pyrene 193-39-5 0.012 0.27 j, j 0.012 0.27 j, jNaphthalene 91-20-3 21 170 b, b 1.4 780 h, gPhenanthrene 85-01-8 2.3 31 b, b 4.6 7.7 o, oPyrene 129-00-0 4.6 42 b, b 0.11 0.45 u, u
1,1-Biphenyl 92-52-4 6.5 26 b, b 49 198 j, uCarbazole 86-74-8 4.0 36 n, n 112 465 u, uDibenzofuran 132-64-9 4.0 36 b, b 61 242 j, iQuinoline 91-22-5 3.4 5,682 h, i 1,634 5,682 u, iTetrahydrofuran 109-99-9 11,000 74,000 b, b 19,606 68,203 i, j
2,2-Dibromo-3-nitrilopropionamide 10222-01-2 20 50 b, b 10 40 u, j3,3'-Dichlorobenzidine 91-94-1 4.5 41 n, n 13 505 j, i4-Bromophenyl Phenyl Ether 101-55-3 1.5 12 c, i 2 12 j, iAniline 62-53-3 4.1 30 b, b 10 76 u, uBenzaldehyde 100-52-7 143 592 u, u 143 592 u, uBenzidine 92-87-5 1.5 14 b, b 23 660 j, jBenzoic Acid 65-85-0 42 740 c, c -- -- --Benzyl alcohol 100-51-6 8.6 150 c, c 1,205 5,000 u, uDecane 124-18-5 49 880 c, c 4 17 i, iHexachlorobutadiene (Aquatic Life) 87-68-3 1 10 b, b 0.3 1.6 l, sHexachlorobutadiene (Wildlife Based) 87-68-3 1 10 b, b 0.3 1.6 l, sHexachlorocyclopentadiene 77-47-4 0.45 4.5 b, b 0.07 0.7 l, lHydroquinone 123-31-9 2.2 4.4 b, b 6 25 u, uIsodecyl diphenyl phosphate 29761-21-5 1.7 22 b, b -- -- --Isophorone 78-59-1 920 7,500 b, b 996 4,300 i, gN-Nitrosodiphenylamine 86-30-6 25 220 b, b 48 283 u, j2-Nitroaniline 88-74-4 17 494 j, j 17 494 j, jNitrobenzene 98-95-3 230 1,000 b, b 1,046 2,000 u, gTriphenyl phosphate 115-86-6 4 40 b, b -- -- --
Phthalates
Polycyclic Aromatic Hydrocarbons (PAHs)
PAH-like Compounds
Other SVOCs
Page 4 of 6 3/19/2018

Table 1aRegion 4 Surface Water Screening Values for Hazardous Waste Sites
Chronic Acute Source Chronic Acute SourceChemical CAS
Freshwater Screening Values (µg/L) Saltwater Screening Values (µg/L)
4,4'-DDT (Aquatic Life Only) 50-29-3 0.001 1.1 a, a 0.01 0.13 j, a4,4'-DDT (Wildlife-Based) 50-29-3 0.001 1.1 a, a 0.01 0.13 j, a4,4'-DDE 72-55-9 0.3 1.3 u, u 0.14 0.7 s, s4,4'-DDD 72-54-8 0.01 0.19 c, c 0.084 0.35 u, uAcephate 30560-19-1 150 550 r, r 1.5 28 j, jAldrin 309-00-2 0.04 3.0 b, a 0.0001 1.3 d, aAtrazine 1912-24-9 0.03 0.05 u, u -- -- --Azinphos-methyl (Guthion) 86-50-0 0.01 0.08 a, r 0.01 0.19 a, uBHC (alpha) 319-84-6 0.01 -- h 0.046 -- dBHC (beta) 319-84-6 0.01 -- h 0.046 -- dBHC-gamma (Lindane) (Aquatic Life) 58-89-9 0.11 0.95 b, a 0.02 0.16 u, aBHC-gamma (Lindane) (Wildlife Based) 58-89-9 0.11 0.95 b, a 0.02 0.16 u, aCarbaryl 63-25-2 0.2 0.85 h, r 0.29 1.6 h, aCarbofuran 1563-66-2 0.75 1.1 r, r 0.29 1.2 u, uChlordane 57-74-9 0.004 2.4 a, a 0.004 0.09 a, aChloropyrifos 2921-88-2 0.04 0.08 a, a 0.006 0.011 a, aCyanazine 21725-46-2 18.2 328 b, b -- 61 j, jDemeton 126-75-0 0.10 5.2 a, j 0.1 5.2 a, jDiazinon 333-41-5 0.17 0.17 a, a 0.82 0.82 a, aDieldrin (Aquatic Life) 60-57-1 0.06 0.24 a 0.002 0.71 a, aDieldrin (Wildlife Based) 60-57-1 0.06 0.24 a 0.002 0.71 a, aDimethoate 60-51-5 0.50 22 r, r -- 2 j, jEndosulfan (alpha + beta) 115-29-7 0.06 0.22 a, a 0.009 0.03 a, aEndosulfan Sulfate 1031-07-8 0.06 1.9 p, r 0.009 0.03 p, pEndrin 72-20-8 0.04 0.09 a, a 0.002 0.04 a, aHeptachlor 76-44-8 0.004 0.5 a, a 0.004 0.05 a, aHeptachlor Epoxide 1024-57-3 0.004 0.5 a, a 0.004 0.05 a, aMalathion 121-75-5 0.1 0.3 a, r 0.1 1 a, uMethoxychlor 72-43-5 0.03 0.7 a, r 0.03 -- aMirex (Aquatic Life) 2385-85-5 0.001 0.001 a, b 0.001 0.001 a, lMirex (Wildlife Based) 2385-85-5 0.001 0.001 a, b 0.001 0.001 a, lParathion 56-38-2 0.01 0.065 a, a 0.04 0.06 d, uToxaphene 8001-35-2 0.0002 0.73 a, a 0.0002 0.21 a, a
2,4-D 94-75-7 79.2 130 r, r 70 -- f, iCaptan 133-06-2 16.5 13 r, r 18 30 j, jChlorothalonil 1897-45-6 0.6 1.8 r, r 0.36 16 h, uDicamba 1918-00-9 14.7 61 b, r -- -- --Dinoseb 88-85-7 0.48 4.8 n -- -- --Diquat 2764-72-9 6 54 b, b 11 21 u, uMCPA (2-methyl-4-chlorophenoxyacetic acid) 94-74-6 2.6 90 h, r 4.2 40 h, uMetolachlor 51218-45-2 7.8 110 h, n 0.6 2 j, jSilvex (2,4,5-TP) 93-72-1 30 270 n 50 -- f, iSimazine 122-34-9 9 -- b, r 57 j, jTrifluralin 1582-09-8 0.48 8.6 b, b 3 12 j, i
2,3,7,8-TCDD (Dioxin) (Wildlife Based) 1746-01-6 3.10E-09 bTotal PCBs (Aquatic Life) 1336-36-3 0.014 0.014 a, d 0.03 0.03 aTotal PCBs (Wildlife Based) 1336-36-3 0.00012 b 0.03 a
Alkalinity - 20,000 -- a -- -- --Ammonia ^^ 7664-41-7 Varies Varies a varies varies a, aFormaldehyde 50-00-0 180 790 b 216 826 u, jNitrite (warm water) 14797-65-0 20 100 b -- -- --
Other
Pesticides
Herbicides, Fungicides
Polychlorinated Biphenyls (PCBs) and Dioxin/Furans
Page 5 of 6 3/19/2018

Table 1aRegion 4 Surface Water Screening Values for Hazardous Waste Sites
Chronic Acute Source Chronic Acute SourceChemical CAS
Freshwater Screening Values (µg/L) Saltwater Screening Values (µg/L)
pH - 20,000 -- a -- -- --Selenate 14124-68-6 9 13 b -- -- --Selenite 14124-67-5 28 186 b -- -- --Tributyltin 688-73-3 0.072 0.46 a 0.0074 0.42 a, aUrea 57-13-6 17,000 150,000 b -- -- --
Table 1a Notes:Red font indicates a bioaccumulative chemical.
# - Freshwater criteria for pentachlorophenol are pH Dependent. Values displayed are for a pH of 7.8. ^^ - Criteria for ammonia are pH, temperature, and lifestage dependent.** - Selenium concentrations in water do not reflect dietary sources to aquatic life and screening against these numbers may not be adequately protective.
Table 1a Sources:a - National Recommended Water Quality Criteria http://water.epa.gov/scitech/swguidance/standards/criteria/current/index.cfm
aa - Tier 2 value.
k - Talmadge et al. (1999)l - New York Ambient Water Quality Criteria and Guidance Values: http://www.dec.ny.gov/docs/water_pdf/togs111.pdf
o - Texas Surface Water Quality Standards: https://www.tceq.texas.gov/waterquality/standards/2014standards.html
i - McGrath and Di Toro (2009) Model - See text Section 6.1.4 Equation 1. Model. May be used for freshwater and saltwater.
^ - Screening value is for filtered (dissolved) metals. A conversion factor (CF) was used to convert the screening value for total metals in surface water to a screening value for dissolved metals in surface water. CMC (dissolved) = CMC (total) × CF. See Table 1c for screening values for total (unfiltered) metals.
* - The freshwater screening value is hardness dependent. The screening value shown in Table 1a is for dissolved metals assuming a hardness of 50 mg/L as CaCO3. A correction for site-specific hardness was based on equations listed in Tables 1b and 1c. If hardness data are unavailable hardness may be estimated as: H = 2.497 × Ca (mg/L) + 4.118 × Mg (mg/L).
a~ - Per the NRWQC, when comparing the maximum detected value, the higher number should be used; but if comparing to an average or 95%UCL, the lower number should be used.
b - Great Lakes Initiative (GLI) Clearinghouse resources Tier II criteria revised 2013 http://www2.epa.gov/gliclearinghouse/c - Suter, G.W. II, and Tsao, C.L. 1996. Toxicological benchmarks for screening potential contaminants of concern for effects on aquatic biota: 1996 Revision. ES/ER/TM-96/R2. https://rais.ornl.gov/documents/tm96r2.pdfd - Florida State Criteria for Surface Water Quality Classifications http://www.dep.state.fl.us/legal/Rules/shared/62-302/302-Table.pdfe - North Carolina Water Quality Standards https://www.epa.gov/sites/production/files/2014-12/documents/nc-classifications-wqs.pdff - Georgia Department of Natural Resources (GADNR) Water Use Classifications and Water Quality Standards https://epd.georgia.gov/georgia-water-quality-standardsg - Hawaii Department of Health (HDOH) Environmental Action Levels, Chronic and Acute Surface Water (Aquatic Habitat) Standards http://eha-web.doh.hawaii.gov/eha-cma/Leaders/HEER/environmental-hazard-evaluation-and-environmental-action-levelsh - CCME (Canadian Council of Ministers of the Environment). 2003. Canadian Environmental Quality Guidelines: Summary Table December 2003. Canadian Council of Ministers of the Environment, Winnipeg, Manitoba. Available at: http://www.ccme.ca/en/resources/canadian_environmental_quality_guidelines/index.html
s - Louisiana DEQ Water Quality Standards: http://deq.louisiana.gov/page/water-quality
j - ECOSAR program predicted lowest chronic or acute value. See Section 6.1.4 in text. Model may be used for freshwater or saltwater.
m - New Jersey Department of Environmental Protection (NJDEP) Ecological Screening Criteria http://www.nj.gov/dep/srp/guidance/ecoscreening/esc_table.pdfn - Michican Water Quality Values - Rule 57: http://www.michigan.gov/deq/0,4561,7-135-3313_3686_3728-11383--,00.html
p - Mississippi Water Quality Standards: https://www.epa.gov/sites/production/files/2014-12/documents/ms-wqs.pdfq - U.S. EPA. 2003a. Procedures for the Derivation of Equilibrium Partitioning Sediment Benchmarks (ESBs) for the Protection of Benthic Organisms: PAH Mixtures. Office of Research and Development, Washington, DC. EPA/600/R-02/013. Available at: http://www.udel.edu/udaily/2010/jun/images/PAHESB.pdf r - Office of Pesticide Programs (OPP) Aquatic Life Benchmarks: http://www.epa.gov/pesticide-science-and-assessing-pesticide-risks/aquatic-life-benchmarks-pesticide-registration
Page 6 of 6 3/19/2018

Table 1bConversion Factors (CF) and Hardness-Dependent Equations
m C b C CF m A b A CF CF - Chronic CF - AcuteArsenic 1 1 1 1Beryllium ^ 1.609 -5.017 1.609 -2.874Cadmium 0.7977 -3.909 1.101672-0.041838(lnH) 0.9789 -3.866 1.136672-0.041838 (lnH) 0.994 0.994Chromium III 0.819 0.6848 0.86 0.819 3.7256 0.316 NA NAChromium VI 0.962 0.982 0.993 0.993Copper 0.8545 -1.702 0.96 0.9422 -1.7 0.96 0.83 0.83Lead 1.273 -4.705 1.46203-0.145712(lnH) 1.273 -1.46 1.46203-0.145712 (lnH) 0.951 0.951Mercury 0.85 0.85 0.85 0.85Nickel 0.846 0.0584 0.997 0.846 2.255 0.998 0.99 0.99Selenium 0.998 0.998Silver 1.72 -6.59 0.85 0.85Zinc 0.8473 0.884 0.986 0.8473 0.884 0.978 0.986 0.978
Notes:* - Saltwater values do not have a hardness correction Filtered Chronic Screening Value = exp{mC[ln(H)]+bC} [CF]^ - Hardness-based Great Lakes Tier 2 equation Filtered Acute Screening Value = exp{mA[ln(H)]+bA} [CF]CF - Conversion FactorInH - natural log of Hardness
ChemicalFreshwater Saltwater *
Chronic Values Acute values Conversion Factors
Page 1 of 1 3/19/2018

Table 1c Example Freshwater Screening Values for Varying Degrees of Water Hardness
Chronic Acute
25 50 100 200 25 50 100 200Beryllium 1.2 3.6 11 33 10 30.6 93 285 - -Cadmium 0.26 0.46 0.79 1.37 0.49 0.96 1.8 3.75 8.9 40.2Chromium III 27.7 48.8 86 152 579 1,022 1,803 3,180 - -Copper 2.85 5.16 9.3 16.9 3.8 7.3 14 27 3.6 5.6Lead 0.55 1.32 3.2 7.7 14 33.8 82 197 8.5 220Nickel 16.1 29 52 94 145 261 469 843 8.3 75Silver - - - - 0.35 1.15 3.8 12.5 - 2.2Zinc 32.7 67 120 216 37 67 120 216 82 92
Notes:
Saltwater UnfilteredChronic Values (µg/L) Acute Values (µg/L)
Hardness (mg/kg CaCO3) Hardness (mg/kg CaCO3)No hardness correction
CaCO3 - calcium carbonateµg/L - micrograms per litermg/kg- milligrams per kilogram
Chemical
Freshwater Total (Unfiltered) Samples
Page 1 of 1 3/19/2018

Table 1dRegion 4 Surface Water Screening Values for Narcotic Mode of Action
Chronic Acute
1,1,1,2-Tetrachloroethane 630-20-6 360 1,376 i, i1,1,2,2-Tetrachloroethane 79-34-5 1,784 6,827 i, i1,1,1-Trichloroethane 71-55-6 496 1,896 i, i1,1,2-Trichloroethane 79-00-5 2,097 8,026 i, i1,1-Dichloroethane 75-34-3 2,692 10,310 i, i1,2-Dichloroethane 107-06-2 2,294 8,786 i, i1,2-Dichloropropane 78-87-5 1,064 4,071 i, iDichloromethane (Methylene chloride) 75-09-2 5,697 21,832 i, iHexachloroethane 67-72-1 33 178 j, iTrichloromethane (Chloroform) 67-66-3 5,417 20,756 i, iTetrachloromethane (Carbon tetrachloride) 56-23-5 955 3,651 i, i
1,1-Dichloroethene (1,1-Dichloroethylene) 75-35-4 1,217 4,657 i, i1,2-Dichloroethene (1,2-Dichloroethylene) 540-59-0 1,629 6,236 i, i1,2-cis-Dichloroethyene 156-59-2 1,629 6,236 i, i1,2-trans-Dichloroethylene 156-60-5 1,629 6,236 i, i1,1,2,2-Tetrachloroethylene (PCE) 127-18-4 332 1,269 i, i1,1,2-Trichloroethylene (TCE) 79-01-6 763 2,916 i, iChloroethene (Vinyl chloride) 75-01-4 2,276 8,717 i, i
Chlorobenzene 108-90-7 356 1,360 i, i1,2-Dichlorobenzene 95-50-1 115 440 i, i1,3-Dichlorobenzene 541-73-1 115 440 i, i1,4-Dichlorobenzene 106-46-7 115 440 i, i1,2,3-Trichlorobenzene 87-61-6 35 134 j, i1,2,4-Trichlorobenzene 120-82-1 35 134 j, i1,3,5-Trichlorobenzene 108-70-3 35 134 j, iTrichlorobenzene (mixed isomers) 12002-48-1 35 134 j, i
1,2,4-Trimethylbenzene 95-63-6 56 366 j, i1,3,5-Trimethylbenzene 108-67-8 56 366 j, iBenzene 71-43-2 2,173 8,317 i, iCymene, p- (4-Isopropyltoluene) 99-87-6 21 187 j, iEthylbenzene 100-41-4 308 1,196 j, iIsopropylbenzene (Cumene) 98-82-8 98 547 j, iStyrene (vinyl benzene) 100-42-5 412 1,575 i, iToluene 108-88-3 786 3,005 i, iXylenes (total) 1330-20-7 260 1,057 j, i
Chlorinated Alkenes
Chlorobenzenes
Monoaromatic hydrocarbons
Chemical CASFreshwater & Saltwater Screening Value (µg/L) Source
Volatile Organic Compounds (VOCs) - µg/LChlorinated and Brominated Alkanes
Page 1 of 3 3/19/2018

Table 1dRegion 4 Surface Water Screening Values for Narcotic Mode of Action
Chronic Acute
Chemical CASFreshwater & Saltwater Screening Value (µg/L) Source
2-Butanone (methyl ethyl ketone) 78-93-3 65,695 201,828 j, j2-Hexanone (methyl butyl ketone) 591-78-6 16,871 58,590 j, j2-Octanone (methyl hexyl ketone) 111-13-7 2,807 10,740 i, i4-Methyl-2-pentanone (MIBK) 108-10-1 19,142 65,872 j, jAcetone 67-64-1 117,629 355,606 j, j
1-Pentanol 71-41-0 12,637 44,404 j, j2-Propanol 67-63-0 52,874 162,854 j, jEthylene Glycol 107-21-1 479,638 1,768,104 j, jMethanol 67-56-1 112,652 369,551 j, jPropylene glycol 57-55-6 329,329 1,114,122 j, j
Acetonitrile 75-05-8 424,883 813,650 i, iMethyl tert-butyl ether (MTBE) 1634-04-4 30,618 58,634 i, i
1,2,3,4-Tetrachlorobenzene 634-66-2 6 39 j, i1,2,4,5-Tetrachlorobenzene 95-94-3 6 39 j, iPentachlorobenzene (aquatic only) 608-93-5 1 11 j, i
2-Chlorophenol 95-57-8 1,041 2,738 j, j2,4-Dichlorophenol 120-83-2 361 1,352 i, j2,4,6-Tribromophenol 118-79-6 37 140 i, i2,3,4,6-Tetrachlorophenol 58-90-2 32 120 i, iNonylphenol 84852-15-3 1.1 4 i, j
2-Nitrotoluene 88-72-2 1,733 6,631 i, i3-Nitrotoluene 99-08-1 1,733 6,631 i, i4-Nitrotoluene 99-99-0 1,733 6,631 i, i
Butylbenzyl Phthalate 85-68-7 18 38 i, iDiethyl Phthalate 84-66-2 819 4,648 j, jDimethyl Phthalate 131-11-3 3,295 19,747 j, jDi-n-Butyl Phthalate 84-74-2 27 102 i, i
1,1-Biphenyl 92-52-4 49 202 j, iDibenzofuran 132-64-9 61 242 j, iQuinoline 91-22-5 2,731 5,682 i, iTetrahydrofuran 109-99-9 19,606 68,203 i, j
Semi-volatile Organic Compounds (SVOCs) Chlorobenzenes
Phenols
Energetic SVOCs
Phthalates
PAH-like Compounds
Ketones
Alcohols
Other VOCs
Page 2 of 3 3/19/2018

Table 1dRegion 4 Surface Water Screening Values for Narcotic Mode of Action
Chronic Acute
Chemical CASFreshwater & Saltwater Screening Value (µg/L) Source
4-Bromophenyl Phenyl Ether 101-55-3 2.0 11.7 j, iBenzoic Acid 65-85-0 4,392 16,818 i, iBenzyl alcohol 100-51-6 15,538 24,156 j, jIsophorone 78-59-1 996 3,807 i, iN-Nitrosodiphenylamine 86-30-6 84 283 j, jNitrobenzene 98-95-3 5,084 19,470 i, iPropylene glycol 57-55-6 329,329 1,114,122 j, j
Table 1d Sources:i - McGrath and Di Toro (2009) Model - See text Section 6.1.4 Equation 1.j - ECOSAR program predicted lowest chronic or acute value. See Section 6.1.4 in text.
Other SVOCs µg/L
Page 3 of 3 3/19/2018

Table 1eRegion 4 Step 3a Surface Water Screening Values for Polycyclic Aromatic Hydrocarbons (PAHs)
Chronic Acute
Naphthalene 91-20-3 194 402 a1-Methylnaphthalene 90-12-0 75 157 a2-Methylnaphthalene 91-57-6 72 150 aC1-Naphthalenes - 82 170 a2,6-Dimethylnaphthalene 581-42-0 26 - aC2-Naphthalenes - 30 63 a2,3,5-Trimethylnaphthalene 2245-38-7 10 - aC3-Naphthalenes - 11 23 aC4-Naphthalenes - 4.0 8.4 aAcenaphthylene 208-96-8 307 640 aAcenaphthene 83-32-9 56 116 aFluorene 86-73-7 39 82 aC1-Fluorenes - 14 29 aC2-Fluorenes - 5.3 11 aC3-Fluorenes - 1.9 4 aAnthracene 120-12-7 21 43 aPhenanthrene 85-01-8 19 40 a1-Methylphenanthrene 832-69-9 7.49 - aC1-Phenatherene/anthracenes - 7.4 16 aC2-Phenatherene/anthracenes - 3.2 6.7 aC3-Phenatherene/anthracenes - 1.3 2.6 aC4-Phenatherene/anthracenes - 0.56 1.2 a
Benzothiophene 11095-43-5 450 937 bDibenzothiophene 132-65-0 48 100 bC1-Dibenzothiophenes - 16 33 bC2-Dibenzothiophenes - 5.1 11 bC3-Dibenzothiophenes - 1.7 3.4 bC4-Dibenzothiophenes - 0.5 1.1 bNaphthothiophene 233-02-3 48 100 b
Fluoranthene 206-44-0 7.1 15 aPyrene 129-00-0 10 21 aC1-Fluoranthene/pyrenes - 4.9 10 aC2-Fluoranthene/pyrenes 1.1 2.3 bC3-Fluoranthene/pyrenes 0.6 1.3 bC4-Fluoranthene/pyrenes 0.2 0.3 bBenzo(a)anthracene 56-55-3 2.2 4.6 aChrysene 218-01-9 2.0 4.2 aC1-Benzanthracene/chrysenes - 0.86 1.8 a
High Molecular Weight PAHs (HMW-PAHs)
Chemical CASFreshwater and Saltwater
ScreeningValues (µg/L) Source
Low Molecular Weight PAHs (LMW-PAHs)
Thiophenes
Page 1 of 2 3/19/2018

Table 1eRegion 4 Step 3a Surface Water Screening Values for Polycyclic Aromatic Hydrocarbons (PAHs)
Chronic Acute
Chemical CASFreshwater and Saltwater
ScreeningValues (µg/L) Source
C2-Benzanthracene/chrysenes - 0.48 1.0 aC3-Benzanthracene/chrysenes - 0.17 0.35 aC4-Benzanthracene/chrysenes - 0.07 0.15 aPerylene 198-55-0 0.90 1.9 aBenzo(b)fluoranthene 205-99-2 0.68 1.4 aBenzo(k)fluoranthene 207-08-9 0.64 1.3 aBenzo(a)pyrene 50-32-8 0.96 2.0 aBenzo(e)pyrene 192-97-2 0.90 1.9 aBenzo(g,h,i)perylene 191-24-2 0.44 0.91 aIndeno(1,2,3-cd)pyrene 193-39-5 0.28 0.57 aDibenz(a,h) anthracene 53-70-3 0.28 0.59 a
Table Notes:
a - U.S. EPA. 2003. Procedures for the Derivation of Equilibrium Partitioning Sediment Benchmarks (ESBs) for the Protection of Benthic Organisms: PAH Mixtures. EPA-600-R-02-013. Office of Research and Development, Washington, D.C. https://clu-in.org/conf/tio/porewater1/resources/EPA-ESB-Procedures-PAH-mixtures.pdf
b - Calculated using equations in EPA (2003) using log octanol-water partition coefficient from KOWWIN.
Page 2 of 2 3/19/2018

Sediment Screening Values

Table 2aRegion 4 Sediment Screening Values for Hazardous Waste Sites
Non-Narcotic Modes of Action
ESV RSV ESV RSV
Aluminum 7429-90-5 25,000 58,000 iAntimony 7440-36-0 2 25 a 2 25 aArsenic 7440-38-2 9.8 33 b 7.24 41.6 cBarium 7440-39-3 20 60 bCadmium 7440-43-9 1 5 b 0.68 4.21 cChromium (Total) 7440-47-3 43.4 111 b 52.3 160 cCobalt 7440-48-4 50 bCopper 7440-50-8 31.6 149 b 18.7 108 cIron 7439-89-6 20,000 40,000 gLead 7439-92-1 35.8 128 b 30.2 112 cManganese 7439-96-5 460 1,100 gMercury (inorganic - aquatic life) 7439-97-6 0.18 1.1 b 0.13 0.7 cMercury (inorganic - wildlife based) 7439-97-6 0.17 0.17 iMethylmercury (wildlife based) 22967-92-6 0.00045 0.0045 iNickel 7440-02-0 22.7 48.6 b 15.9 42.8 cSelenium 7782-49-2 0.72 2.9 iSelenium (wildlife) 7782-49-2 0.8 1.2 iSilver 7440-22-4 1 2.2 b 0.73 1.77 cUranium 7440-61-1 100 1,000 iZinc 7440-66-6 121 459 b 124 271 c
Ammonia 7664-41-7 230 300 hSulfides (Total) 18946-25-8 39 61 h
Acetaldehyde R 75-07-0 40 1,291 d, e 6.2 1,291 d, eAcrolein 107-02-8 0.93 3.4 d, e 0.6 3.4 d, eAcrylonitrile R 107-13-1 30 151 d, e 151 eBromoform (tribromomethane) 75-25-2 142 d 223 dBromomethane (methyl bromide) 74-83-9 6.5 d 108 dCyclohexane 110-82-7 278 e 278 e1,3-Dichloropropene (cis and trans) 542-75-6 1.5 75 d, e 34.7 75 d, e1,2-Diphenylhydrazine R 122-66-7 3.9 106 d, e 106 eDibromochloromethane 124-48-1 198 d 21 dDichlorobromomethane 75-27-4 210 d 2,172 dHexane 110-54-3 0.94 186 d, e 186 eHydrazine R 302-01-2 0.87 d 14.6 dMethylamine R 74-89-5 292 586 d, e 586 eVinyl acetate N3 108-05-4 5.7 2,230 d, e 1,030 2,230 d, e
2-Chlorophenol N2 95-57-8 55 550 i, i 885 2,302 d, e2-Methylphenol (o-cresol) N2 95-48-7 119 1,773 d, e 63 1,773 h, d2,3-Dimethylphenol N2 526-75-0 385 1,765 d, e 1,765 e2,4-Dimethylphenol N2 105-67-9 39 1,437 d, e 29 504 h, d3-Methylphenol (Cresol, m-) N2 108-39-4 112 1,792 d, e 1,792 e4-Methylphenol (p-Cresol) N2 106-44-5 93 260 d, h 670 714 h, d2-Nitrophenol N2 88-75-5 168 3,589 d, e 2,070 3,589 d, e
Chemical CASFreshwater Sediment
Screening Value Marine/Estuarine Sediment
Screening Value
Inorganic Compounds - mg/kg dry weight
SourceSource
Metals - mg/kg dw
Other Inorganics - mg/kg dw
Semi-volatile Organic Compounds (SVOCs)Phenols - µg/kg @1% OC unless denoted by shading
Volatile Organic Compounds (VOCs) - µg/kg @1% OC
Page 1 of 9 3/19/2018

Table 2aRegion 4 Sediment Screening Values for Hazardous Waste Sites
Non-Narcotic Modes of Action
ESV RSV ESV RSV
Chemical CASFreshwater Sediment
Screening Value Marine/Estuarine Sediment
Screening Value SourceSource
4-Nitrophenol N2 100-02-7 153 4,105 d, e 1,579 4,105 d, e2,4-Dinitrophenol U 51-28-5 223 2,961 d, e 45 2,961 d, e2-Methyl-4,6-Dinitrophenol U 534-52-1 1,477 2,304 d, e 1,477 2,304 d, e2,4,5-Trichlorophenol N2 95-95-4 34 1,964 d, f 217 1,964 d, f2,4,6-Trichlorophenol N2 88-06-2 89 1,964 d, f 117 1,964 d, f3-Methyl-4-Chlorophenol N2 59-50-7 5 2,035 d, f 1,257 2,035 d, fPentachlorophenol (aquatic life) U 87-86-5 10 1,200 i, h 360 394 h, dPentachlorophenol (wildlife based) U 87-86-5 65 lPhenol N2 108-95-2 175 210 d, h 63 420 d, h
2-Amino-4,6-dinitrotoluene U 35572-78-2 47 140 d, e 52 140 d, e4-Amino-2,6-dinitrotoluene U 19406-51-0 28 70 d, e 70 e3,5-Dinitroanaline (DNA) 618-87-1 126 140 d, e 120 126 d, e1,3-Dinitrobenzene (DNB) U 99-65-0 40 105 d, e 37 105 d, e2,3-Dinitrotoluene R 602-01-7 8 122 d, e 122 e2,4-Dinitrotoluene R 121-14-2 290 2,900 i, i 29 114 d, e2,5-Dinitrotoluene R 619-15-8 22 144 d, e 144 e2,6-Dinitrotoluene R 606-20-2 296 131 d, e 131 e3,5-Dinitrotoluene R 618-85-9 381 144 d, e 144 eHMX (Octahydro-tetranitro-1,3,5…) C 2691-41-0 108 64,709 d, f 162 64,709 d, fNitroglycerine R 55-63-0 10 12,704 d, f 133 12,704 d, fRDX (Hexahydro-1,3,5-trinitro-1,3,5...) R 121-82-4 65 312 d, e 155 312 d, e1,3,5-Trinitrobenzene (TNB) R 99-35-4 15 116 d, e 15 116 d, e2,4,6-Trinitrotoluene (TNT) R 118-96-7 27 112 d, f 112 e
4-Chloroaniline N2 106-47-8 0.9 21 d, e 0.9 21 d, e2,4-Dichloroaniline N2 554-00-7 32 e 32 ePentachloroaniline U 527-20-8 621 e 621 e2,2-Dibromo-3-nitrilopropionamide R 10222-01-2 7.1 e 3.4 7.1 d, e3,3'-Dichlorobenzidine N2 91-94-1 31 90 d, e 90 eAniline N2 62-53-3 2.3 12 d, e 5.6 12 d, eBenzaldehyde R 100-52-7 59 580 d, e 59 580 d, eBenzidine N2 92-87-5 1.1 17 d, e 17 ebis(2-Chloroethyl) Ether R 111-44-4 8,163 f 8,163 fDecane N2 124-18-5 726 d 65 dHexachlorobenzene * 118-74-1 20 240 f, b 10 23 f, hHexachlorocyclopentadiene (aquatic life) R 77-47-4 6.5 810 d, l 1 130 d, lHexachlorocyclopentadiene (wildlife based) R 77-47-4 69 lHydroquinone R 123-31-9 1.5 8.2 d, e 4.1 8.2 d, e
4,4'-DDD * C 72-54-8 3.5 8.5 j, j 1.2 8 c, cTotal DDD * C DDD 4.9 28 b, b 13 e4,4'-DDE * C 72-55-9 1.4 6.8 j, j 2.1 374 c, cTotal DDE * C DDE 3.2 31 b, b 13 e4,4'-DDT (aquatic life) C 50-29-3 1.0 7 a, a 5 cTotal DDT * C DDT 4.2 63 b, b 0.7 52 c, cDDT/DDE/DDD (total) * C DDTR 5.3 572 b, b 44 lTotal DDTs (Wildlife based) C DDTR 10 b
Pesticides - µg/kg @ 1% OC unless denoted by shading
Energetic SVOAs - µg/kg @ 1% OC unless denoted by shading
Other SVOCs - µg/kg @ 1% OC
Page 2 of 9 3/19/2018

Table 2aRegion 4 Sediment Screening Values for Hazardous Waste Sites
Non-Narcotic Modes of Action
ESV RSV ESV RSV
Chemical CASFreshwater Sediment
Screening Value Marine/Estuarine Sediment
Screening Value SourceSource
Acephate A 30560-19-1 50 dAcrolein 107-02-8 0.9 3.4 d, e 0.6 3 d, eAldrin (aquatic life) C 309-00-2 29 80 d, g 0.1 48 d, eAldrin (wildlife based) C 309-00-2 42 210 i, iAtrazine 1912-24-9 0.3 89 b, eBHC (alpha) C 319-84-6 0.3 6 d, g 1.3 567 d, eBHC (beta) (aquatic life) C 319-85-7 5.0 7.2 i, h 567 eBHC (beta) (wildlife based) C 319-85-7 300 1,500 iBHC-gamma (Lindane) (aquatic life) C 58-89-9 2.4 5 b, b 0.6 0.99 c, cBHC-gamma (Lindane) (wildlife based) C 58-89-9 10 100 iCarbaryl A 63-25-2 0.3 6 d, l 0.5 1 d, lCarbofuran A 1563-66-2 0.9 4 d, l 0.4 20 d, eChlordane * C 57-74-9 3.2 18 b, b 2.7 5 c, cChlordane (Wildlife based) C 57-74-9 0.06 1,700 b, iChloropyrifos A 2921-88-2 3 12 d, l 0.4 8 d, lCyanazine H 21725-46-2 30 117 d, eDemeton A 126-75-0 0.2 0.35 d, e 0.2 0.35 d, eDiazinon A 333-41-5 0.4 9 b, l 18 91 d, lDieldrin * C 60-57-1 1.9 62 b, b 0.1 4.3 c, cDieldrin (Wildlife based) C 60-57-1 7.7 10 b, iDimethoate A 60-51-5 0.2 1.7 d, eEndosulfan C 115-29-7 0.01 1 i, l 0.1 3 l, lEndosulfan-beta C 33213-65-9 0.9 d 0.14 dEndosulfan Sulfate C 1031-07-8 0.7 d 0.11 dEndrin C 72-20-8 2.2 207 b, b 0.12 6 a, lEndrin (wildlife based) C 72-20-8 8.0 18 b, iGuthion A 86-50-0 0.06 b 0.008 0.1 d, lHeptachlor * C 76-44-8 0.6 75 j, l 1.5 71 d, lHeptachlor epoxide C 1024-57-3 2.5 16 b, b 0.14 15 d, lMalathion A 121-75-5 0.67 b 0.06 0.42 d, lMethoxychlor * C 72-43-5 30 59 i, l 2.1 59 d, lMirex (aquatic life) C 2385-85-5 3.6 120 d, l 3.6 120 d, lMirex (wildlife based) C 2385-85-5 37 b 3.6 120 d, lParathion A 56-38-2 0.2 1.2 d, e 0.6 1.2 d, eToxaphene * C 8001-35-2 0.1 32 b, b 0.15 54 d, l
2,4-D H 94-75-7 47 436 d, f 42 436 d, fCaptan F 133-06-2 47 51 d, e 51 eChlorothalonil R 1897-45-6 6.4 62 d, l 3.9 4 d, lDicamba H 1918-00-9 8.4 180 d, l 630 lDinoseb H 88-85-7 15 1,817 d, e 1,817 eDiquat H 2764-72-9 25 2,498 d, f 43 2,498 d, fMCPA (2-methyl-4-chlorophenoxyacetic acid) H 94-74-6 1.6 d 2.5 dMetolachlor H 51218-45-2 22 240 d, l 290 lSilvex (2,4,5-TP) H 93-72-1 62 184 d, f 103 184 d, fSimazine H 122-34-9 0.3 72 b, e 72 eTrifluralin H 1582-09-8 79 493 d, e 493 e
Herbicides, Fungicides - µg/kg @ 1% OC
Page 3 of 9 3/19/2018

Table 2aRegion 4 Sediment Screening Values for Hazardous Waste Sites
Non-Narcotic Modes of Action
ESV RSV ESV RSV
Chemical CASFreshwater Sediment
Screening Value Marine/Estuarine Sediment
Screening Value SourceSource
Total PCBs E 1336-36-3 59.8 676 b, b 21.6 189 b, bTotal PCBs (wildlife based) E 1336-36-3 14 b 14 bDioxins/Furans E 1746-01-6 0.0025 0.025 k, k 0.0025 0.025 k, k2,3,7,8-TCDD (Dioxin) (aquatic life) E 1746-01-6 0.0005 0.0085 I, i 0.0005 l2,3,7,8-TCDD (Dioxin) (wildlife based) E 1746-01-6 0.002 0.0022 b, i
Butyltins - mg/kg dwMonobutyltin 78763-54 -9 0.54 4.8 hDibutyltin 818-08-6 0.91 130 hTributyltin 688-73-3 0.047 0.32 hTetrabutyltin 1461-25-2 0.097 0.097 h
Total Petroleum Hydrocarbons - Diesel 68334-30-5 340 510 hTotal Petroleum Hydrocarbons - Residual 68476-53-9 3,600 4,400 h
Table 2a Notes:Red font indicates a bioaccumulative chemical.* - indicates protective of aquatic and wildlife receptors.Shaded gray cells indicate units in µg/kg dry weight.
ESV - Ecological Screening Value for Step 2RSV - Refinement Screening Value for Step 3a
Table 2a Sources:
A - Acetylcholinesterase inhibitorsC - Central nervous system seizure agentsH - HerbicidesU - Oxidative phosphorylation uncouplersN3 - DiestersN2 - Polar NarcosisR - Reactive electrophiles/proelectrophiles
CAS = chemical abstract service registry number
l - NYDEC (2014) Screening and Assessment of Contaminated Sediment, New York State Department of Environmental Conservation, Division of Fish, Wildlife and Marine Resources, Bureau of Habitat, June 24, 2014. (µg/kg dw). Wildlife number is µg/kg @ 1% OC.
k - USEPA. 1993. Interim Report on Data and Methods for Assessment of 2,3,7,8 - Tetrachlorodibenzo-p-dioxin Risks to Aquatic Life and Associated Wildlife. EPA/600/R-93/055. Available from the National Service Center for Environmental Publications (NSCEP) Document Number 600R93055. http://www.epa.gov/nscep/
i - Los Alamos National Laboratory ECORISK Database. September 2017. http://www.lanl.gov/environment/protection/eco-risk-assessment.php (µg/kg dw)j - CCME (Canadian Council of Ministers of the Environment). 2003. Canadian Environmental Quality Guidelines: Summary Table December 2003. Canadian Council of Ministers of the Environment, Winnipeg, Manitoba. (µg/kg dw)
h - Washington State Sediment Management Standards, Cleanup Objectives. http://www.ecy.wa.gov/programs/tcp/smu/sed_standards.htm (µg/kg dw)
e - Region 4 Sediment Model based on: (ECOSAR minimum chronic value). See text. (µg/kg @ 1% OC)
c - MacDonald, D.D. 1994. Approach to the Assessment of Sediment Quality in Florida Coastal Waters. Florida Department of Environmental Protection. 1994 Florida Sediment Quality Assessment Guidelines for Florida Coastal Waters. (µg/kg dw)
g - Persaud, D., R. Jaagumagi and A. Hayton. 1993. Guidelines for the protection and management of aquatic sediment quality in Ontario. Ontario Ministry of the Environment. Queen’s Printer of Ontario. (µg/kg @ 1% OC)
Other - mg/kg dw
b - MacDonald, D.D.; Ingersoll, C.G.; Smorong, D.E.; Lindskoog, R.A.; Sloane, G; and T. Biernacki. 2003. Development and Evaluation of Numerical Sediment Quality Assessment Guidelines for Florida Inland Waters. Florida Department of Environmental Protection, Tallahassee, FL. Development and Evaluation of Numerical Sediment Quality Assessment Guidelines for Florida Inland Waters. Used threshold effect concentration (TEC) for the ESV and probable effect concentration (PEC) for the RSV. (µg/kg dw)
a - Long, Edward R., and Lee G. Morgan. 1991. The Potential for Biological Effects of Sediment-Sorbed Contaminants Tested in the National Status and Trends Program. NOAA Technical Memorandum NOS OMA 52. Used effects range low (ER-L) for chronic and effecs range medium (ER-M) for acute. (µg/kg dw)
Polychlorinated Biphenyls (PCBs) and Dioxins/Furans - µg/kg @ 1% OC unless denoted by shading
Bulk Petroleum Hydrocarbons - mg/kg dw
f - Region 4 Sediment Model based on: (lowest predicted surface water value from McGrath & Di Toro (2009). See text. (µg/kg @ 1% OC)
d - Region 4 Sediment Model based on highest ranked surface water quality ESV from Table 1a. See Equation 3 in text Section 6.2.2. (µg/kg @ 1% OC)
E - Endocrine disrupters or reproductive and developmental toxicantsF - Fungicide
Page 4 of 9 3/19/2018

Table 2bRegion 4 Sediment Screening Values for Hazardous Waste Sites
for Narcotic Mode of Action
ESV RSV ESV RSV
1,1,1,2-Tetrachloroethane 630-20-6 99 418 a, c 418 c1,1,2,2-Tetrachloroethane 79-34-5 250 2,230 a, c 13 2,230 a, c1,1,1-Trichloroethane 71-55-6 70 367 i, c 367 c1,1,2-Trichloroethane 79-00-5 538 1,545 a, c 1,545 c1,1-Dichloroethane 75-34-3 20 1,666 i, c 1,666 c1,2-Dichloroethane 107-06-2 986 1,131 a, c 1,131 c1,2-Dichloropropane 78-87-5 428 876 a, c 876 cDichloromethane (methylene chloride) 75-09-2 18 2,404 i, c 667 2,404 a, cHexachloroethane 67-72-1 27 75 a, b 75 bTrichloromethane (Chloroform) 67-66-3 87 3,352 a, c 291 3,352 a, cTetrachloromethane (Carbon tetrachloride) 56-23-5 57 706 a, c 3.3 706 a, c
1,1-Dichloroethene (1,1-Dichloroethylene) 75-35-4 100 753 i, c 2.0 753 a, c1,2-Dichloroethene (1,2-Dichloroethylene) 540-59-0 200 1,135 i, c 569 1,135 a, c1,2-cis-Dichloroethyene 156-59-2 432 1,135 a, c 1,135 c1,2-trans-Dichloroethylene 156-60-5 389 1,135 a, c 1,135 c1,3-Dichloropropene 542-75-6 1.5 75 a, b 35 75 a, b1,1,2,2-Tetrachloroethylene (PCE) 127-18-4 2 415 i, c 11 415 a, c1,1,2-Trichloroethylene (TCE) 79-01-6 78 692 i, c 73 692 a, cChloroethene (Vinyl chloride) 75-01-4 482 1,178 a, c 1,178 c
Chlorobenzene 108-90-7 30 939 i, c 66 939 a, c1,2-Dichlorobenzene 95-50-1 95 477 a, c 173 477 a, c1,3-Dichlorobenzene 541-73-1 89 468 a, c 468 c1,4-Dichlorobenzene 106-46-7 30 468 i, c 468 c1,2,3-Trichlorobenzene 87-61-6 113 495 a, b 71 495 a, b1,2,4-Trichlorobenzene 120-82-1 11 485 i, b 75 485 a, b1,3,5-Trichlorobenzene 108-70-3 68 476 a, b 68 476 a, bTrichlorobenzene (mixed isomers) 12002-48-1 68 476 a, b 68 476 a, b
1,2,3-Trimethylbenzene 526-73-8 368 a, b 368 b1,2,4-Trimethylbenzene 95-63-6 97 361 a, b 361 b1,3,5-Trimethylbenzene 108-67-8 164 354 a, b 354 bBenzene 71-43-2 10 2,185 i, c 111 2,185 a, cCymene, p- (4-Isopropyltoluene) 99-87-6 184 242 a, b 242 bEthylbenzene 100-41-4 290 1,467 a, b 119 1,467 a, bIsopropylbenzene (Cumene) 98-82-8 35 713 a, b 713 bStyrene (Vinyl benzene) 100-42-5 126 1,621 a, c 1,621 cToluene 108-88-3 10 2,074 i, c 568 2,074 a, cXylenes (total) 1330-20-7 130 1,074 i, b 1,074 b
2-Butanone (methyl ethyl ketone) 78-93-3 7,604 22,707 a, b 22,707 b2-Hexanone (methyl butyl ketone) 591-78-6 45 7,598 a, b 7,598 b2-Octanone (methyl hexyl ketone) 111-13-7 6.6 2,240 a, c 2,240 c4-Methyl-2-pentanone (MIBK) 108-10-1 73 8,165 a, b 8,165 bAcetone 67-64-1 65 38,133 i, b 38,133 b
Volatile Organic Compounds (VOCs) - µg/kg @ 1% OC unless denoted by shadingChlorinated and Brominated Alkanes
Chlorinated and Brominated Alkenes
Chemical CASFreshwater Sediment
Screening Value SourceMarine/Estuarine Sediment
Screening Value Source
Chlorobenzenes
Monoaromatic Hydrocarbons
Ketones
Page 5 of 9 3/19/2018

Table 2bRegion 4 Sediment Screening Values for Hazardous Waste Sites
for Narcotic Mode of Action
ESV RSV ESV RSV
Chemical CASFreshwater Sediment
Screening Value SourceMarine/Estuarine Sediment
Screening Value Source
1-Pentanol 71-41-0 40 4,597 a, b 4,597 b2-Propanol 67-63-0 2.4 16,700 a, b 16,700 bEthylene glycol 107-21-1 42,389 145,224 a, b 1,272 145,224 a, bMethanol 67-56-1 102 34,983 a, b 34,983 bPropylene glycol 57-55-6 22 100,268 a, b 100,268 b
Acetonitrile 75-05-8 4,167 25,498 a, b 25,498 b4-Bromophenyl phenyl ether 101-55-3 47 62 a, b 62 bCarbon disulfide 75-15-0 7.8 1,580 a, c 131 1,580 a, cMethyl tert-butyl ether (MTBE) 1634-04-4 304 4,433 a, c 2,081 4,433 a, c
1,2,3,4-Tetrachlorobenzene 634-66-2 69 138 a, b 138 b1,2,4,5-Tetrachlorobenzene 95-94-3 187 135 a, b 135 bPentachlorobenzene 608-93-5 116 150 a, j 36 b
2,4-Dichlorophenol 120-83-2 57 1,886 a, c 1,886 c2,4,6-Tribromophenol 118-79-6 47 308 a, c 308 c2,3,4,6-Tetrachlorophenol 58-90-2 30 948 a, c 948 cNonylphenol 25154-52-3 203 c 203 c
2-Nitrotoluene 88-72-2 207 5,042 a, c 3,448 5,042 a, c3-Nitrotoluene 99-08-1 145 5,995 a, c 4,787 5,995 a, c4-Nitrotoluene 99-99-0 145 5,465 a, c 4,534 5,465 a, c
Bis(2-ethylhexyl)phthalate 117-81-7 180 2,600 f 182 2,647 dButyl benzyl phthalate 85-68-7 100 481 i, c 481 cDiethyl phthalate 84-66-2 630 1,105 f, b 80 1,105 a, bDimethyl phthalate 131-11-3 678 2,031 a, b 530 2,031 e, bDi-n-butyl phthalate 84-74-2 11 319 i, c 319 cDi-n-octyl phthalate 117-84-0 39 1,100 e 580 45,000 e
1-Methylnaphthalene 90-12-0 141 * a * 2-Methylnaphthalene 91-57-6 20.2 * g 20.2 * dAcenaphthene 83-32-9 6.7 * f 6.7 * dAcenaphthylene 208-96-8 5.9 * f 5.9 * dAnthracene 120-12-7 57 * f 47 * dFluorene 86-73-7 77 * f 21 * dNaphthalene 91-20-3 176 * f 35 * dPhenanthrene 85-01-8 204 * f 87 * dTotal LMW-PAHs 600 k 312 d
Benz(a)anthracene 56-55-3 108 * f 75 * dBenzo(a)pyrene 50-32-8 150 * f 89 * dBenzo(b)fluoranthene 205-99-2 190 * i * Benzo(g,h,i)perylene 191-24-2 170 * i 310 * eBenzo(k)fluoranthene 207-08-9 240 * i * Chrysene 218-01-9 166 * f 108 * d
Low molecular weight PAHs (LMW-PAHs)
High molecular weight PAHs (HMW-PAHs)
Phenols
Energetic SVOAs
Phthalates - µg/kg @ 1% OC unless denoted by shading
PAHs - µg/kg @ 1% OC unless denoted by shading
Other VOCs
Semivolatile Organic Compounds (SVOCs) - µg/kg @ 1% OC Chlorobenzenes
Alcohols
Page 6 of 9 3/19/2018

Table 2bRegion 4 Sediment Screening Values for Hazardous Waste Sites
for Narcotic Mode of Action
ESV RSV ESV RSV
Chemical CASFreshwater Sediment
Screening Value SourceMarine/Estuarine Sediment
Screening Value Source
Dibenz(a,h)anthracene 53-70-3 33 * f 6.2 * dFluoranthene 206-44-0 423 * f 113 * dIndeno(1,2,3-cd)pyrene 193-39-5 200 * i 340 * ePhenanthrene 85-01-8 204 * f 87 * dPyrene 129-00-0 195 * f 153 * dTotal HMW-PAHs 1,000 k 655 dTotal PAHs 1,610 f 1,684 d
1,1-Biphenyl 92-52-4 198 1,494 a, b 1,494 bDibenzofuran 132-64-9 510 2,313 i, b 2,313 bQuinoline 91-22-5 3.0 2,398 a, c 1,435 2,398 a, cTetrahydrofuran 109-99-9 4,488 8,000 a, c 8,000 c
4-Bromophenyl Phenyl Ether 101-55-3 47 62 a, b 62 bBenzoic Acid 65-85-0 19 2,000 a, c 2,000 cBenzyl alcohol 100-51-6 3.7 6,729 a, b 522 6,729 a, bCarbazole 86-74-8 69 4,561 a, b 1,928 4,561 a, bIsodecyl diphenyl phosphate 29761-21-5 89 aIsophorone 78-59-1 876 948 a, c 948 cN-Nitrosodiphenylamine 86-30-6 110 370 a, b 211 370 a, bNitrobenzene 98-95-3 407 9,007 a, c 1,853 9,007 a, cTriphenyl phosphate 115-86-6 70 a 0.55
Table 2 Notes:
Red font indicates a bioaccumulative chemical.* - indicates protective of aquatic and wildlife receptors.Gray shaded cells indicate concentration in µg/kg dry weight
ESV - Ecological Screening Value for Step 2
RSV - Refinement Screening Value for Step 3a
Table 2a Sources:
d- Florida Department of Environmental Quality Numerical Sediment Quality Assessment Guidelines for Florida Coastal Waters
k - Median of Refinement Screening Values on Table 2c divided by 10.
g - CCME (Canadian Council of Ministers of the Environment). 2003. Canadian Environmental Quality Guidelines: Summary Table December 2003. Canadian Council of Ministers of the Environment, Winnipeg, Manitoba. Available at http:/www.ccme.ca/publications/ce (µg/kg dw)
i - Los Alamos National Laboratory ECORISK Database, 2017. http://www.lanl.gov/environment/protection/eco-risk-assessment.php (µg/kg dw)
h - Persaud, D., R. Jaagumagi and A. Hayton. 1993. Guidelines for the protection and management of aquatic sediment quality in Ontario. Ontario Ministry of the Environment. Queen’s Printer of Ontario.
b - Region 4 Sediment Model based on: (ECOSAR minimum chronic value). See text. (µg/kg @ 1% OC)c - Region 4 Sediment Model based on: (lowest predicted surface water value from McGrath & Di Toro (2009). See text. (µg/kg @ 1% OC)
a - Region 4 Sediment Model based on highest ranked surface water quality ESV from Table 1a See Equation 3 in text Section 6.2.2. (µg/kg @ 1% OC)
PAH-like Compounds - µg/kg @ 1% OC unless denoted by shading
f - MacDonald, D.D.; Ingersoll, C.G.; Smorong, D.E.; Lindskoog, R.A.; Sloane, G; and T. Biernacki. 2003. Development and Evaluation of Numerical Sediment Quality Assessment Guidelines for Florida Inland Waters. Florida Department of Environmental Protection, Tallahassee, FL. Development and Evaluation of Numerical Sediment Quality Assessment Guidelines for Florida Inland Waters. Used threshold effect concentration (TEC) for ESV. (µg/kg dw)
e - Washington State Sediment Management Standards, Cleanup Objectives. http://www.ecy.wa.gov/programs/tcp/smu/sed_standards.htm (µg/kg @ 1% OC)
* see Total below.
CAS = chemical abstract service registry number
j - NYDEC (2014) Screening and Assessment of Contaminated Sediment, New York State Department of Environmental Conservation, Division of Fish, Wildlife and Marine Resources, Bureau of Habitat, June 24, 2014.
Other SVOCs - µg/kg
Page 7 of 9 3/19/2018

Table 2cRegion 4 Step 3a Sediment Refinement Screening Values
for Polycyclic Aromatic Hydrocarbons (PAHs) at Hazardous Waste Sites
Freshwater and Saltwater Sediment Refinement Screening Values (RSVs) for Sum
Toxic Unit Approach (µg/kg @ 1% OC)RSV
Naphthalene 91-20-3 3,850 a1-Methylnaphthalene 90-12-0 4,460 a2-Methylnaphthalene 91-57-6 4,470 aC1-Naphthalenes - 4,940 a2,6-Dimethylnaphthalene 581-42-0 5,130 aC2-Naphthalenes - 5,100 a2,3,5-Trimethylnaphthalene 2245-38-7 5,840 aC3-Naphthalenes - 5,810 aC4-Naphthalenes - 6,570 aAcenaphthylene 208-96-8 4,520 aAcenaphthene 83-32-9 4,910 aFluorene 86-73-7 5,380 aC1-Fluorenes - 6,110 aC2-Fluorenes - 6,860 aC3-Fluorenes - 7,690 aAnthracene 120-12-7 5,940 aPhenanthrene 85-01-8 5,960 a1-Methylphenanthrene 832-69-9 6,700 aC1-Phenatherene/anthracenes - 6,700 aC2-Phenatherene/anthracenes - 7,460 aC3-Phenatherene/anthracenes - 8,290 aC4-Phenatherene/anthracenes - 9,130 a
Benzothiophene 11095-43-5 3,910 bDibenzothiophene 132-65-0 5,950 bC1-Dibenzothiophenes - 6,720 bC2-Dibenzothiophenes - 7,540 bC3-Dibenzothiophenes - 8,440 bC4-Dibenzothiophenes - 9,400 bNaphthothiophene 233-02-3 5,950 b
Fluoranthene 206-44-0 7,070 aPyrene 129-00-0 6,970 aC1-Fluoranthene/pyrenes - 7,700 aC2-Fluoranthene/pyrenes 8,730 bC3-Fluoranthene/pyrenes 9,490 bC4-Fluoranthene/pyrenes 10,700 bBenzo(a)anthracene 56-55-3 8,410 aChrysene 218-01-9 8,440 aC1-Benzanthracene/chrysenes - 9,290 aC2-Benzanthracene/chrysenes - 10,100 a
Chemical CAS Source
Low Molecular Weight PAHs (LMW-PAHs)
Thiophenes
High Molecular Weight PAHs (HMW-PAHs)
Page 8 of 9 3/19/2018

Table 2cRegion 4 Step 3a Sediment Refinement Screening Values
for Polycyclic Aromatic Hydrocarbons (PAHs) at Hazardous Waste Sites
Freshwater and Saltwater Sediment Refinement Screening Values (RSVs) for Sum
Toxic Unit Approach (µg/kg @ 1% OC)RSV
Chemical CAS Source
C3-Benzanthracene/chrysenes - 11,100 aC4-Benzanthracene/chrysenes - 12,100 aPerylene 198-55-0 9,680 aBenzo(b)fluoranthene 205-99-2 9,790 aBenzo(k)fluoranthene 207-08-9 9,810 aBenzo(a)pyrene 50-32-8 9,650 aBenzo(e)pyrene 192-97-2 9,670 aBenzo(g,h,i)perylene 191-24-2 10,900 aIndeno(1,2,3-cd)pyrene 193-39-5 11,200 aDibenz(a,h) anthracene 53-70-3 11,200 a
Notes:
b - Calculated using equations in EPA (2003) using log octanol-water partition coefficient from KOWWIN.
a - EPA (2003). Procedures for the Derivation of Equlibrium Partitioning Sediment Benchmarks(ESBs) for the Protection of Benthic Orgamisms: PAH Mixtures. EPA/600/R-02/013. Table 3-4.
Page 9 of 9 3/19/2018

Soil Screening Values
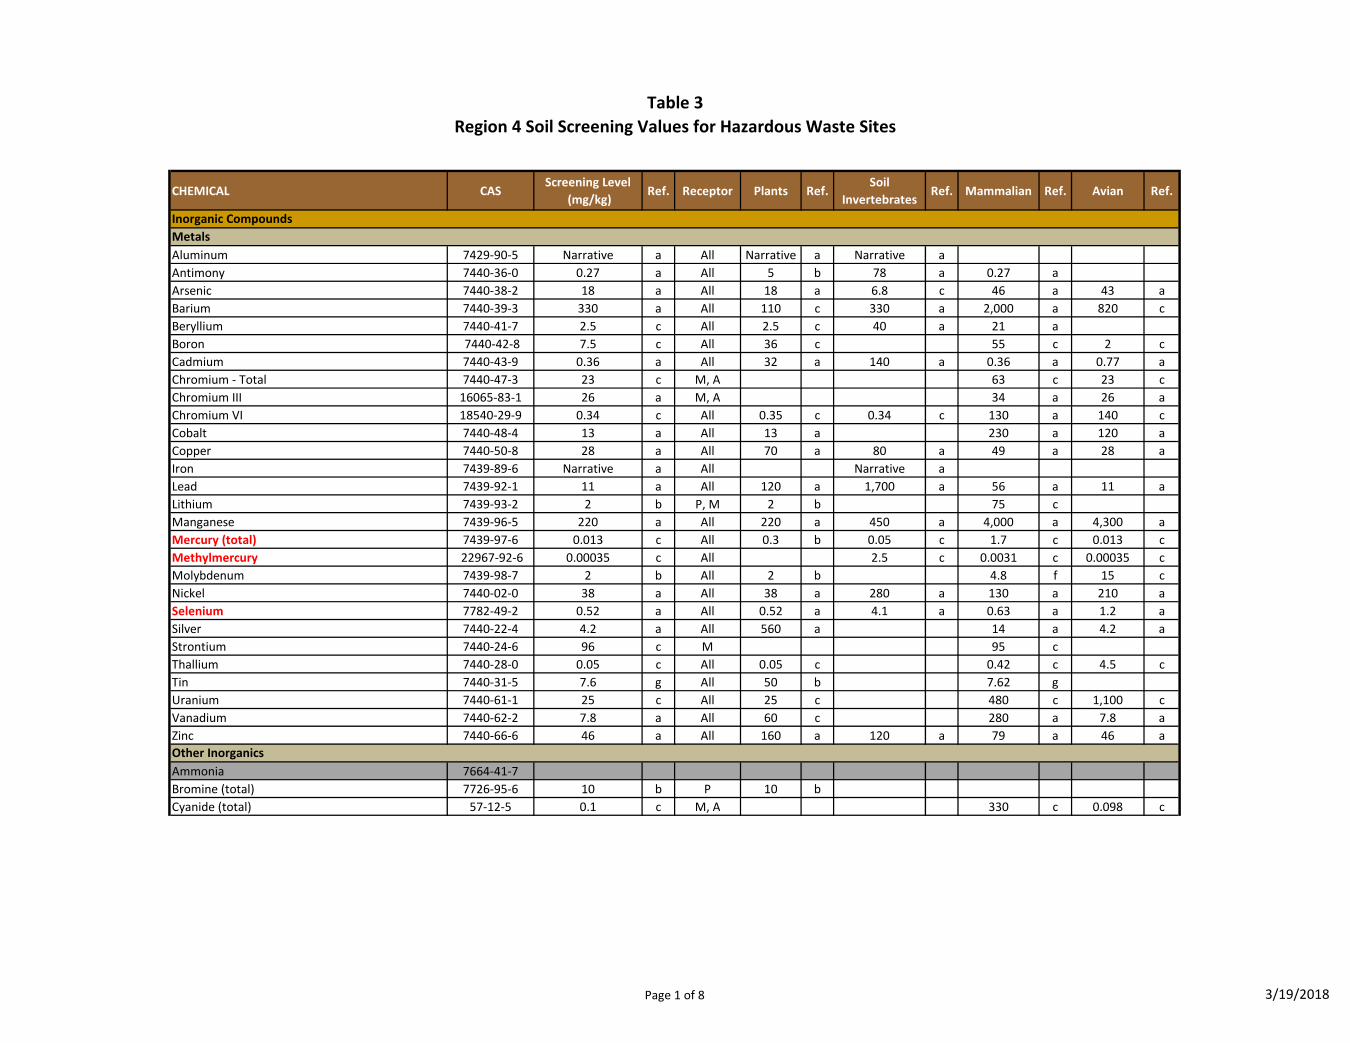
Table 3Region 4 Soil Screening Values for Hazardous Waste Sites
CHEMICAL CASScreening Level
(mg/kg)Ref. Receptor Plants Ref.
Soil Invertebrates
Ref. Mammalian Ref. Avian Ref.
Aluminum 7429-90-5 Narrative a All Narrative a Narrative aAntimony 7440-36-0 0.27 a All 5 b 78 a 0.27 aArsenic 7440-38-2 18 a All 18 a 6.8 c 46 a 43 aBarium 7440-39-3 330 a All 110 c 330 a 2,000 a 820 cBeryllium 7440-41-7 2.5 c All 2.5 c 40 a 21 aBoron 7440-42-8 7.5 c All 36 c 55 c 2 cCadmium 7440-43-9 0.36 a All 32 a 140 a 0.36 a 0.77 aChromium - Total 7440-47-3 23 c M, A 63 c 23 cChromium III 16065-83-1 26 a M, A 34 a 26 aChromium VI 18540-29-9 0.34 c All 0.35 c 0.34 c 130 a 140 cCobalt 7440-48-4 13 a All 13 a 230 a 120 aCopper 7440-50-8 28 a All 70 a 80 a 49 a 28 aIron 7439-89-6 Narrative a All Narrative aLead 7439-92-1 11 a All 120 a 1,700 a 56 a 11 aLithium 7439-93-2 2 b P, M 2 b 75 cManganese 7439-96-5 220 a All 220 a 450 a 4,000 a 4,300 aMercury (total) 7439-97-6 0.013 c All 0.3 b 0.05 c 1.7 c 0.013 cMethylmercury 22967-92-6 0.00035 c All 2.5 c 0.0031 c 0.00035 cMolybdenum 7439-98-7 2 b All 2 b 4.8 f 15 cNickel 7440-02-0 38 a All 38 a 280 a 130 a 210 aSelenium 7782-49-2 0.52 a All 0.52 a 4.1 a 0.63 a 1.2 aSilver 7440-22-4 4.2 a All 560 a 14 a 4.2 aStrontium 7440-24-6 96 c M 95 cThallium 7440-28-0 0.05 c All 0.05 c 0.42 c 4.5 cTin 7440-31-5 7.6 g All 50 b 7.62 gUranium 7440-61-1 25 c All 25 c 480 c 1,100 cVanadium 7440-62-2 7.8 a All 60 c 280 a 7.8 aZinc 7440-66-6 46 a All 160 a 120 a 79 a 46 a
Ammonia 7664-41-7Bromine (total) 7726-95-6 10 b P 10 b Cyanide (total) 57-12-5 0.1 c M, A 330 c 0.098 c
MetalsInorganic Compounds
Other Inorganics
Page 1 of 8 3/19/2018

Table 3Region 4 Soil Screening Values for Hazardous Waste Sites
CHEMICAL CASScreening Level
(mg/kg)Ref. Receptor Plants Ref.
Soil Invertebrates
Ref. Mammalian Ref. Avian Ref.
Fluoride 16984-48-8 32 c M, A 870 c 120 cFluorine† 7782-41-4 200 b P 200 bIodine 7553-56-2 4 b P 4 b
1,1,1,2-Tetrachloroethane 630-20-6 0.07 d SI 0.07 d 225 g1,1,2,2-Tetrachloroethane 79-34-5 0.127 g All 0.19 d 0.127 g1,1,1-Trichloroethane 71-55-6 0.04 d All 0.04 d 260 c1,1,2-Trichloroethane 79-00-5 0.32 d All 0.32 d 28.6 g1,1-Dichloroethane 75-34-3 0.14 d All 0.14 d 210 c1,2-Dichloroethane 107-06-2 0.4 d All 0.40 d 27 c 0.85 c1,2-Dichloropropane 78-87-5 0.28 d All 0.28 d 32.7 gDichloromethane (Methylene chloride) 75-09-2 0.21 d All 1,600 c 0.21 d 2.6 cTrichloromethane (chloroform) 67-66-3 0.05 d All 0.05 d 8 cTetrachloromethane (Carbon tetrachloride) 56-23-5 0.05 d All 0.05 d 2.98 g
1,1-Dichloroethene/ethylene 75-35-4 0.04 d All 0.04 d 11 c1,2-Dichloroethene (cis and trans) 540-59-0 0.04 d All 0.04 d 24 c1,2-cis-Dichloroethyene 156-59-2 0.04 d All 0.04 d1,2-trans-Dichloroethylene 156-60-5 0.04 d All 0.04 d 0.784 g1,3-Dichloropropene 542-75-6 0.001 d All 0.001 dTetrachloroethene (PCE) 127-18-4 0.06 d All 10 c 0.06 d 0.18 c1,1,2-Trichloroethylene (TCE) 79-01-6 0.06 d All 0.06 d 42 cVinyl chloride 75-01-4 0.03 d All 0.03 d 0.12 c
Chlorobenzene 108-90-7 2.4 c All 2.4 c 43 c1,2-Dichlorobenzene 95-50-1 0.09 d All 0.09 d 0.92 c1,3-Dichlorobenzene 541-73-1 0.08 d All 0.08 d 0.74 c1,4-Dichlorobenzene 106-46-7 0.88 c SI, M 1.2 c 0.89 c1,2,3-Trichlorobenzene 87-61-6 20 e SI 20 e1,2,4-Trichlorobenzene 120-82-1 0.27 c All 1.2 c 0.27 c1,3,5-Trichlorobenzene 108-70-3 0.07 d All 0.07 d
Chlorinated Alkanes
Inorganic CompoundsOther Inorganics
Volatile Organic Compounds (VOCs)
Chlorinated Alkenes
Chlorobenzenes
Page 2 of 8 3/19/2018

Table 3Region 4 Soil Screening Values for Hazardous Waste Sites
CHEMICAL CASScreening Level
(mg/kg)Ref. Receptor Plants Ref.
Soil Invertebrates
Ref. Mammalian Ref. Avian Ref.
1,2,4-Trimethylbenzene 95-63-6 0.09 d All 0.09 d1,3,5-Trimethylbenzene 108-67-8 0.16 d All 0.16 dBenzene 71-43-2 0.12 d All 0.12 d 24 cCymene, p- (4-Isopropyltoluene) 99-87-6 0.18 d All 0.18 dEthylbenzene 100-41-4 0.27 d All 0.27 d 5.16 gIsopropylbenzene (Cumene) 98-82-8 0.04 d All 0.04 dStyrene (Vinyl benzene) 100-42-5 1.2 c All 3.2 c 1.2 cToluene 108-88-3 0.15 d All 200 c 0.15 d 23 cXylenes (total) 1330-20-7 0.1 d All 100 c 0.1 d 1.4 c 41 c
2-Butanone (Methyl Ethyl Ketone) 78-93-3 1.0 d All 1.0 d 350 c2-Hexanone 591-78-6 0.36 c SI, M, A 2.5 d 5.4 c 0.36 cAcetone 67-64-1 1.2 c M, A 0.04 d 1.2 c 7.5 c
Tribromomethane (Bromoform) 75-25-2 0.07 d All 0.07 d 15.9 gBromomethane (methyl bromide) 74-83-9 0.002 d All 0.002 d 0.24 gCarbon Disulfide 75-15-0 0.005 d All 0.005 d 0.81 cEthylene glycol 107-21-1 0.31 d All 0.31 dHexachloroethane 67-72-1 0.024 d All 0.024 d 0.6 gHexane 110-54-3 0.007 d All 0.007 d
3-Chloroaniline 108-42-9 20 b P, SI 20 b 30 e4-Chloroaniline 106-47-8 1 c P, SI 1 c 1.8 c 1.1 g3,4-Dichloroaniline 95-76-1 20 e SI 20 e2,4,5-Trichloroaniline 636-30-6 20 e P, SI 20 b 20 ePentachloroaniline 527-20-8 100 e SI 100 e
Monoaromatic Hydrocarbons
Ketones
Other VOCs
Volatile Organic Compounds (VOCs)
Chloroanilines
Page 3 of 8 3/19/2018

Table 3Region 4 Soil Screening Values for Hazardous Waste Sites
CHEMICAL CASScreening Level
(mg/kg)Ref. Receptor Plants Ref.
Soil Invertebrates
Ref. Mammalian Ref. Avian Ref.
1,2,3,4-Tetrachlorobenzene 634-66-2 10 e SI 10 e1,2,4,5-Tetrachlorobenzene 95-94-3 0.18 d All 0.18 d 2.02 gHexachlorobenzene 118-74-1 0.079 c All 10 c 10 c 0.2 c 0.079 cPentachlorobenzene 608-93-5 0.5 g All 20 e 0.5 g
Dichlorophenols (2,3-), (2,4-), (2,5-), (2,6-) 120-83-2 0.05 d All 0.05 d 87.5 g3,4-Dichlorophenols (3,4-), (3,5-) 95-77-2 20 e P, SI 20 b 20 e
2,4,5-Trichlorophenol 95-95-4 4 b P, SI, M 4 b 9 e 14.1 g2,4,6-Trichlorophenol 88-06-2 9.94 g SI, M 10 e 9.94 g
2,3,4,5-Tetrachlorophenol 4901-51-3 20 e SI 20 eTetrachlorophenols (2,3,4,6-), (2,3,5,6-) 58-90-2 0.04 d All 0.04 d 0.2 g
Chlorophenols (2-), (4-) 95-57-8 0.06 d All 0.06 d 0.54 c 0.39 c3-Chlorophenol 108-43-0 7 e P, SI 7 b 10 e2,4-Dimethylphenol 105-67-9 0.04 d SI 0.04 d2,4-Dinitrophenol 51-28-5 0.061 g All 20 b 0.15 d 0.061 g4-Nitrophenol 100-02-7 5.12 g SI, M 7 e 5.12 g2-Methylphenol (Cresol, o-) 95-48-7 0.1 d All 0.67 c 0.1 d 580 c3-Methylphenol (Cresol, m-) 108-39-4 0.09 d All 0.69 c 0.09 d 3.49 g4-Methylphenol (Cresol, p-) 106-44-5 0.08 d All 0.08 d 163 gNonylphenol 25154-52-3 1.27 d SI 1.27 dPentachlorophenol (PCP) 87-86-5 2.1 a All 5 a 31 a 2.8 a 2.1 aPhenol 108-95-2 0.79 c All 0.79 c 1.8 c 37 c
2-Amino-4,6-dinitrotoluene 35572-78-2 14 c SI, M, P 14 c 43 c 16 c4-Amino-2,6-dinitrotoluene 19406-51-0 12 c SI, M, P 33 c 18 c 12 c1,3- Dinitrobenzene 99-65-0 0.034 d All 0.034 d 0.072 c 0.079 c2,4-Dinitrotoluene 121-14-2 6 c SI, M, P 6 c 18 c 14 c2,6-Dinitrotoluene 606-20-2 4 c All 30 c 4.0 c 52 c
Dichlorophenols
Trichlorophenols
Tetrachlorophenols
Other Phenols
Energetic SVOCs
Semivolatile Organic Compounds (SVOCs)Chlorobenzenes
Page 4 of 8 3/19/2018

Table 3Region 4 Soil Screening Values for Hazardous Waste Sites
CHEMICAL CASScreening Level
(mg/kg)Ref. Receptor Plants Ref.
Soil Invertebrates
Ref. Mammalian Ref. Avian Ref.
HMX (Octahydro-tetranitro-1,3,5,7-tetrazocine) 2691-41-0 16 c SI, M, P 2,700 c 16 c 290 cNitroglycerine 55-63-0 13 c SI, M, P 21 c 13 c 70 c2-Nitrotoluene 88-72-2 0.19 d All 0.19 d 9.8 c3-Nitrotoluene 99-08-1 0.13 d All 0.13 d 12 c4-Nitrotoluene 99-99-0 0.14 d All 0.14 d 21 cPETN (Pentaerythrite-tetranitrate) 78-11-5 2.2 d SI, M 2.2 d 100 cRDX (Hexahydro-1,3,5-trinitro-1,3,5-triazine) 121-82-4 2.3 c All 45.9 h 8.4 c 16 c 2.3 cTetryl (Methyl-2,4,6-trinitrophenylnitroamine) 479-45-8 0.018 d All 25 h 0.018 d 1.5 c1,3,5-Trinitrobenzene 99-35-4 0.3 h All 0.3 h 10 c2,4,6-Trinitrotoluene (TNT) 118-96-7 7.5 c All 62 c 32 c 95 c 7.5 c
1,1'-Biphenyl 92-52-4 0.2 d All 60 b 0.2 d3,3'- Dichlorobenzidine 91-94-1 0.03 d All 0.03 d 0.646 gBenzoic acid 65-85-0 0.01 d All 0.01 d 1 cBenzyl Alcohol 100-51-6 0.002 d All 0.002 d 120 cCarbazole 86-74-8 0.07 d All 0.07 d 79 cDibenzofuran 132-64-9 0.15 d All 6.1 c 0.15 dHexachlorobutadiene 87-68-3 0.009 d All 0.009 d 0.04 gHexachlorocyclopentadiene 77-47-4 0.001 d All 10 b 0.001 d 0.755 gN-Nitrosodiphenylamine 86-30-6 0.545 g All 20 e 0.545 gNitrobenzene 98-95-3 2.2 c SI, M 2.2 c 4.8 cPentachloronitrobenzene 82-68-8 0.09 d All 0.09 d 11 c 0.7 c
Bis(2-ethylhexyl) phthalate 117-81-7 0.02 c All 8.4 d 0.6 c 0.02 cButylbenzyl phthalate 85-68-7 0.59 d All 0.59 d 90 cDiethylphthalate 84-66-2 0.25 d All 100 c 0.25 d 3,600 cDimethylphthalate 131-11-3 0.35 d All 10 c 38 cDi-n-butyl phthalate 84-74-2 0.011 c All 160 c 0.22 d 180 c 0.011 cDi-n-octyl phthalate 117-84-0 0.91 c All 303 d 0.91 c
Other SVOCs
Semivolatile Organic Compounds (SVOCs)Energetic SVOCs
Phthalates
Page 5 of 8 3/19/2018

Table 3Region 4 Soil Screening Values for Hazardous Waste Sites
CHEMICAL CASScreening Level
(mg/kg)Ref. Receptor Plants Ref.
Soil Invertebrates
Ref. Mammalian Ref. Avian Ref.
Low Molecular Weight PAHsAcenaphthene 83-32-9 See Total 0.25 c 0.38 d 130 cAcenaphthylene 208-96-8 See Total 0.34 d 120 cAnthracene 120-12-7 See Total 6.8 c 0.0015 d 210 cFluorene 86-73-7 See Total 3.7 c 250 c1-Methyl naphthalene 90-12-0 See Total 0.14 d2-Methylnaphthalene 91-57-6 See Total 0.11 d 16 c2,6-Dimethyl naphthalene 581-42-0 See Total 0.44 d2,3,5-Trimethylnaphthalene 2245-38-7 See Total 0.13 dNaphthalene 91-20-3 See Total 1.0 c 0.16 d 9.6 c 3.4 c1-Methyl phenanthrene 832-69-9 See Total 0.5 dPhenanthrene 85-01-8 See Total 5.5 c 11 cTotal LMWPAHs - 29 a All 29 a 100 a
Benzo(a)anthracene 56-55-3 See Total 18 c 4.69 d 3.4 c 0.73 cBenzo(b)fluoranthene 205-99-2 See Total 18 c 2.7 d 44 cBenzo(k)fluoranthene 207-08-9 See Total 0.13 d 71 cBenzo(ghi)perylene 191-24-2 See Total 0.07 d 25 cBenzo(a)pyrene 50-32-8 See Total 0.13 d 62 cBenzo(e)pyrene 192-97-2 See Total 0.25 dChrysene 218-01-9 See Total 5.18 d 3.1 cDibenzo(a,h)anthracene 53-70-3 See Total 0.06 d 14 cFluoranthene 206-44-0 See Total 10 c 22 cIndeno(1,2,3-cd)pyrene 193-39-5 See Total 0.08 d 71 cPerylene 198-55-0 See Total 0.17 dPyrene 129-00-0 See Total 10 c 23 c 33 cTotal HMWPAHs - 1.1 a M 18 a 1.1 a
Acrolein 107-02-8 0.0003 d All 0.0003 d 5.27 gAldrin 309-00-2 0.03 c SI, M 0.030 c 0.037 cAtrazine 1912-24-9 0.00005 d SI 0.000 dBHC - alpha 319-84-6 0.0003 d SI, M 0.00 d 59 c
Pesticides/Herbicides
Polycyclic Aromatic Hydrocarbons (PAHs)
High Molecular Weight PAHs
Semivolatile Organic Compounds (SVOCs)
Page 6 of 8 3/19/2018

Table 3Region 4 Soil Screening Values for Hazardous Waste Sites
CHEMICAL CASScreening Level
(mg/kg)Ref. Receptor Plants Ref.
Soil Invertebrates
Ref. Mammalian Ref. Avian Ref.
BHC - beta 319-85-7 0.0003 d All 0.0003 d 0.27 c 14 cBHC - gamma (Lindane) 58-89-9 0.0031 d All 0.1 c 0.0031 d 0.0095 c 0.21 cCarbaryl 63-25-2 0.0003 d All 0.0003 dCarbofuran 1563-66-2 0.0008 d All 0.0008 dChlordane - alpha 5103-71-9 0.0029 d All 2.2 c 0.0029 d 0.27 c 0.27 cChlordane - gamma 12789-03-6 0.02 d All 2.2 c 0.02 d 2.3 c 2.2 cChloropyrifos 2921-88-2 0.003 d All 0.003 dDinoseb 88-85-7 0.015 d All 0.015 d 0.022 gDDT/DDE/DDD (total) -- 0.021 a All 0.021 a 0.093 aDiazinon 333-41-5 0.0037 d All 0.0037 dDieldrin 60-57-1 0.0029 d All 10 c 0.0029 d 0.0049 a 0.022 aEndosulfan - alpha 959-98-8 0.0009 d All 0.0009 d 0.119 gEndosulfan (alpha and beta) 115-29-7 0.0009 d All 0.0009 d 0.64 c 15 cEndosulfan sulfate 1031-07-8 0.0065 d All 0.0007 d 0.036 gEndrin 72-20-8 0.0019 c All 0.0034 c 0.0019 d 0.023 c 0.0014 cGuthion 86-50-0 0.00006 d All 0.00006 dHeptachlor 76-44-8 0.0016 d All 0.4 c 0.0016 d 0.059 c 0.3 cHeptachlor epoxide 1024-57-3 0.00015 d All 0.00015 d 0.152 gHexachlorocyclopentadiene 77-47-4 0.0064 d All 10 b 0.0064 d 0.755 gKepone (Chlordecone) 143-50-0 0.017 d All 0.017 d 0.022 c 1.3 cMalathion 121-75-5 0.00004 d All 0.00004 dMethoxychlor 72-43-5 0.0021 d All 0.0021 d 5.1 c 18 cMirex 2385-85-5 0.0036 d All 0.0036 dParathion 56-38-2 0.00019 d All 0.00019 d2,4,5-TP (Silvex) 93-72-1 0.055 d SI 0.055 dSimazine 122-34-9 0.0083 d All 0.0083 dToxaphene 8001-35-2 0.00015 d All 0.00015 d 5.9 c 4.1 cTrifluralin 1582-09-8 0.079 d All 0.079 d
Pesticides/Herbicides
Page 7 of 8 3/19/2018

Table 3Region 4 Soil Screening Values for Hazardous Waste Sites
CHEMICAL CASScreening Level
(mg/kg)Ref. Receptor Plants Ref.
Soil Invertebrates
Ref. Mammalian Ref. Avian Ref.
PCDDs, PCDFs (ΣTEQ) 1746-01-6 0.00000315 f All 5 c 0.00000315 f 0.000016 fPCBs (total) 1336-36-3 0.041 c All 40 b 0.33 d 0.371 f 0.041 c
2-Nitroaniline 88-74-4 0.02 d SI, M 0.02 d 5.3 cDiphenylamine 122-39-4 1.01 g All 1.1 d 1.01 g 10 cTrichlorofluoromethane 75-69-4 16.4 g M 16.4 g
Notes:Screening values in mg/kg.All - ESV for protection of all receptorsA - ESV for protection of AviansM - ESV for protection of MammalsP - ESV for protection of PlantsSI - ESV for protection of soil invertebratesLMWPAHs have less than 4 ringsHMWPAHs have 4 or more ringsTable 3 Sources:a - USEPA (2007): Ecological Soil Screening Levels. http://www.epa.gov/ecotox/ecossl/
d - ECOSAR & Region 4 soil model. See text Section 6.3.
g - EPA Region 5 RCRA Ecological Screening Levels (2003).
e - Efroymson, R.A., M.E. Will, and G.W. Suter. 1997b. Toxicological Benchmarks for Screening Contaminants of Potential Concern for Effects on Soil and Litter Invertebrates and Heterotrophic Process: 1997 Revision. Oak Ridge National Laboratory, Oak Ridge, TN. ES/ER/TM-126/R2. https://rais.ornl.gov/documents/tm126r21.pdf
b - Efroymson, R.A., M.E. Will, G.W. Suter, and A.C. Wooten. 1997a. Toxicological Benchmarks for Screening Contaminants of Potential Concern for Effects on Terrestrial Plants: 1997 Revision. Oak Ridge National Laboratory, Oak Ridge, TN. ES/ER/TM-95/R4.
f - Efroymson, R.A., G.W. Suter, II, B.E. Sample, and D.S. Jones. 1997c. Preliminary Remediation Goals for Ecological Endpoints. Oak Ridge National Laboratory, Oak Ridge, TN. 50 pp. ES/ER/TM-162/R2 http://www.esd.ornl.gov/programs/ecorisk/documents/tm162
c - Los Alamos National Laboratory (LANL). 2017. ECORISK Database Release 4.1. September 2017. http://www.lanl.gov/environment/protection/eco-risk-assessment.php (µg/kg dw)
Polychlorinated Biphenyls (PCBs) and Dioxins/Furans
Other
Page 8 of 8 3/19/2018