regi.tankonyvtar.hu · Web viewAgricultural Economics II. Agricultural Economics II. Agricultural...
203
Agricultural Economics II. Popp, József Created by XMLmind XSL-FO Converter.
Transcript of regi.tankonyvtar.hu · Web viewAgricultural Economics II. Agricultural Economics II. Agricultural...
Agricultural Economics II.Popp, József
Created by XMLmind XSL-FO Converter.
Agricultural Economics II.Popp, József
TÁMOP-4.1.2.A/1-11/1-2011-0009
University of Debrecen, Service Sciences Methodology Centre
Debrecen, 2013.
Created by XMLmind XSL-FO Converter.
TartalomTárgymutató ......................................................................................................................................... 11. 1. THE GLOBAL AGRICULTURAL ECONOMY, HUNGER, AND POVERTY ........................ 2
1. 1.1. Sustainable future ............................................................................................................ 21.1. 1.1.1. Economic and financial crisis (2006-2008) ..................................................... 31.2. 1.1.2. Food-security strategy ...................................................................................... 41.3. 1.1.3. External shocks in addition to demand and supply fundamentals .................. 41.4. 1.1.4. A way forward .................................................................................................. 61.5. 1.1.5. World market volatility challenges facing poor net food-importing countries 71.6. 1.1.6. Characteristics of food insecurity in net food importing countries ................. 71.7. 1.1.7. What can LDCs and NFIDCs do for themselves? ........................................... 81.8. 1.1.8. Avoiding export prohibitions and restrictions ................................................. 81.9. 1.1.9. Stockholding and domestic food assistance .................................................... 81.10. 1.1.10. Reducing the high transaction costs for intra-regional trade ...................... 81.11. 1.1.11. Using AoA flexibility to invest in food production and resilience ............... 81.12. 1.1.12. How can the international community help? ............................................... 8
2. 1.2. Limiting the role of food aid to emergency responses .................................................... 83. 1.3. Targeting export credits ................................................................................................... 94. 1.4. Strengthening food financing facilities ........................................................................... 95. 1.5. Increasing technical and financial assistance to boost productivity ................................ 96. Questions ................................................................................................................................ 97. References ............................................................................................................................ 10
2. 2. FOOD SECURITY AND SOCIAL PROTECTION .................................................................. 111. 2.1. Risks to food security .................................................................................................... 112. 2.2. Competition for land and water .................................................................................... 133. 2.3. Growth of agricultural output ........................................................................................ 134. Questions .............................................................................................................................. 145. References ............................................................................................................................ 15
3. 3. LIVESTOCK IN FOOD SECURITY ........................................................................................ 161. 3.1. Livestock food in the diet .............................................................................................. 162. 3.2. Livestock and the food balance ..................................................................................... 173. 3.3. Livestock contributing to crop production .................................................................... 184. 3.4. Stability of food supplies ............................................................................................... 195. 3.5. Economic factors affecting choice of livestock source foods ....................................... 196. Questions .............................................................................................................................. 227. References ............................................................................................................................ 22
4. 4. TENSION BETWEEN FOOD, ENERGYAND ENVIRONMENTAL SECURITY ................ 251. 4.1. Food security ................................................................................................................. 262. 4.2. Energy security .............................................................................................................. 26
2.1. 4.2.1. Bioenergy potential ....................................................................................... 273. 4.3. Environmental impact: land use change and greenhouse gas emission ........................ 27
3.1. 4.3.1. Sustainability criteria for bioenergy ............................................................. 294. Questions .............................................................................................................................. 305. References ............................................................................................................................ 31
5. 5. ENERGY SECURITY ............................................................................................................... 321. 5.1. Global energy demand .................................................................................................. 322. 5.2. Rising transport demand reconfirms the end of cheap oil ............................................. 343. 5.3. Prospects for natural gas ............................................................................................... 34
Created by XMLmind XSL-FO Converter.
Agricultural Economics II.
4. 5.4. Coal in global energy demand ....................................................................................... 355. 5.5. Nuclear energy .............................................................................................................. 356. 5.6. Achieving energy for all ................................................................................................ 367. 5.7. Transport policies .......................................................................................................... 368. 5.8. Environmental impact ................................................................................................... 379. Questions .............................................................................................................................. 3810. References .......................................................................................................................... 38
6. 6. RENEWABLE ENERGY ALTERNATIVES ............................................................................ 401. 6.1. Global energy consumption .......................................................................................... 402. 6.2. The increasing competition for biomass: bioenergy potential ..................................... 403. 6.3. Competition for financing between renewable energy alternatives ............................. 434. 6.4. Biofuels ......................................................................................................................... 435. 6.5. Land use for biofuels production .................................................................................. 466. 6.6. Environmental impact of biofuels ................................................................................. 477. Questions ............................................................................................................................. 488. References ............................................................................................................................ 48
7. 7. ENVIRONMENTAL SECURITY ............................................................................................. 501. 7.1. Food cost ....................................................................................................................... 502. 7.2. Agricultural land depletion ............................................................................................ 503. 7.3. Irrigation and aquifer stress ........................................................................................... 514. 7.4. Yield increase ................................................................................................................ 525. 7.5. Climate change .............................................................................................................. 526. 7.6. Carbon dioxide concentration ....................................................................................... 537. 7.7. Temperature ................................................................................................................... 548. 7.8. Precipitation .................................................................................................................. 549. 7.9. Climate change, soil degradation and crop productivity interaction ............................ 5510. Questions ............................................................................................................................ 5511. References .......................................................................................................................... 56
8. 8. PROVISION OF PUBLIC GOODS .......................................................................................... 581. 8.1. Loss of biodiversity ....................................................................................................... 582. 8.2. Economic value of ecosystem goods and services ........................................................ 593. 8.3. Markets for environmental services .............................................................................. 614. Questions .............................................................................................................................. 625. References ............................................................................................................................ 62
9. 9. CLIMATE CHANGE: IMPACT, ADAPTATION AND MITIGATION ................................... 641. 9.1. Definition of climate change ......................................................................................... 642. 9.2. Global greenhouse ......................................................................................................... 653. 9.3. Deeper cuts .................................................................................................................... 654. 9.4. The world needs to adapt to the impacts of climate change .......................................... 665. 9.5. Providing financing for adaptation ............................................................................... 666. 9.6. Timeline of climate change ........................................................................................... 667. Questions ............................................................................................................................. 698. References ............................................................................................................................ 69
10. 10. FOOD CHAIN: FOOD MANUFACTURING, DISTRIBUTION, AND RETAILING ........ 711. 10.1. Food supply chain ....................................................................................................... 71
1.1. 10.1.1. Producers ..................................................................................................... 711.2. 10.1.2. Wholesalers ................................................................................................. 711.3. 10.1.3. Supermarkets ............................................................................................... 72
2. 10.2. Food retail trade .......................................................................................................... 722.1. 10.2.1. Negotiations ................................................................................................. 722.2. 10.2.2. Price, discounts, financial contributions and risks ...................................... 73
Created by XMLmind XSL-FO Converter.
Agricultural Economics II.
3. 10.3. Asymmetric price adjustment ..................................................................................... 744. Questions .............................................................................................................................. 755. References ............................................................................................................................ 75
11. 11. PRICE VOLATILITY IN FOOD AND AGRICULTURAL MARKETS .............................. 761. 11.1. What is volatility? ....................................................................................................... 762. 11.2. Price levels and food security ...................................................................................... 763. 11.3. Drivers of food price volatility .................................................................................... 77
3.1. 11.3.1. Demand elasticity ........................................................................................ 774. 11.4. Trade policies ............................................................................................................. 785. 11.5. Hedging agricultural commodity with futures and options (USA) ............................. 79
5.1. 11.5.1. Commodity arbitrage and the operations of a commodity exchange ......... 795.1.1. 11.5.1.1. If the future price goes higher, lower or does not change ............ 81
5.2. 11.5.2. Options ......................................................................................................... 825.3. 11.5.3. Future contract specifications for selected agricultural commodities ........ 835.4. 11.5.4. Deliverable versus cash settled commodities and price quote ..................... 855.5. 11.5.5. What is commodity basis? .......................................................................... 875.6. 11.5.6. Speculation on the futures market ............................................................... 88
6. 11.6. Demand for food products in the future ..................................................................... 886.1. 11.6.1. Investing in agriculture ................................................................................ 896.2. 11.6.2. Food waste ................................................................................................... 896.3. 11.6.3. Biofuels ........................................................................................................ 906.4. 11.6.4. GHG-emission ............................................................................................. 906.5. 11.6.5. Promoting food security strategy programmes ............................................ 90
7. Questions .............................................................................................................................. 908. References ........................................................................................................................... 91
12. 12. Plant biotechnology ............................................................................................................... 921. 12.1. History ......................................................................................................................... 92
1.1. 12.1.1. Thousands of years ago ............................................................................... 922. 12.2. How biotechnology works? ......................................................................................... 943. 12.3. Why biotechnology matters? ....................................................................................... 944. 12.4. Why do we need biotechnology? ................................................................................ 955. 12.5. What is genetic modification? ..................................................................................... 956. 12.6. What sort of changes can be brought about by genetic modification? ........................ 957. 12.7. How can we assure that these new developments are safe? ........................................ 968. 12.8. How do we know that genetically modified crops are safe to eat? ............................. 969. 12.9. What about the impact of genetically modified crops on the environment? ............... 9610. 12.10. Could the new genes in these crops to be passed on the other plants? .................. 9611. 12.11. What about consumer information? ........................................................................ 9612. 12.13. Substantial equivalence of genetically engineered crops and products with their conventional counterparts ........................................................................................................ 9613. Questions ............................................................................................................................ 9814. References .......................................................................................................................... 98
13. 13. ECONOMICS OF GM CROP CULTIVATION .................................................................... 991. Introduction .......................................................................................................................... 992. 13.1. Global status of commercialised GM crops in 2011 ................................................... 993. 13.2. Global maize trade .................................................................................................... 1024. 13.3. Global soybean and soymeal trade ............................................................................ 1035. 13.4. The authorisation process in practice ........................................................................ 1046. 13.5. The GM debate in Europe ........................................................................................ 1087. Questions ............................................................................................................................ 1108. References .......................................................................................................................... 110
14. 14. ECONOMICS OF CROP PROTECTION MEASURES .................................................... 111
Created by XMLmind XSL-FO Converter.
Agricultural Economics II.
1. 14.1. Challenges facing scientists and pest management experts ...................................... 1112. 14.2. Estimates of crop losses due to pests ........................................................................ 1113. 14.3. Cost and benefit of pesticides ................................................................................... 1124. 14.4. Global pesticide market ............................................................................................ 1155. Questions ........................................................................................................................... 1166. References .......................................................................................................................... 116
15. 15. INTERNATIONAL AGRICULTURAL TRADE: WORLD TRADE ORGANIZATION (WTO) .......................................................................................................................................................... 118
1. 15.1. The WTO Agreements .............................................................................................. 1181.1. 15.1.1. Objectives of the WTO: ............................................................................ 1181.2. 15.1.2. Functions of the WTO: .............................................................................. 1181.3. 15.1.3. The Ministerial Conference ....................................................................... 1191.4. 15.1.4. The General Council .................................................................................. 1191.5. 15.1.5. The Trade Negotiations Committee .......................................................... 1191.6. 15.1.6. The Councils & Subsidiary Bodies ........................................................... 1191.7. 15.1.7. Decision- making in the WTO .................................................................. 119
2. 15.2. Principles ................................................................................................................... 1203. 15.3. Rules on unfair trade ................................................................................................. 120
3.1. 15.3.1. Anti-dumping measures ............................................................................. 1203.2. 15.3.2. Subsidies & countervailing duties ............................................................. 120
4. 15.4. Non-discrimination ................................................................................................... 1214.1. 15.4.1. MFN under GATT ..................................................................................... 1214.2. 15.4.2. National treatment under GATT ................................................................ 121
5. 15.5. Tariffs ........................................................................................................................ 1215.1. 15.5.1. Negotiations on tariff reduction ................................................................. 1215.2. 15.5.2. National tariffs ........................................................................................... 1225.3. 15.5.3. Other duties and charges ........................................................................... 122
6. 15.6. Non-tariff barriers ..................................................................................................... 1226.1. 15.6.1. Quantitative restrictions ............................................................................ 1226.2. 15.6.2. Specific exceptions .................................................................................... 1236.3. 15.6.3. Other non-tariff barriers ............................................................................ 123
7. 15.7. Technical regulations and standards .......................................................................... 1247.1. 15.7.1. Sanitary and phytosanitary measures ........................................................ 124
8. 15.8. General safeguards .................................................................................................... 1259. 15.9. Waivers ...................................................................................................................... 12510. 15.10. Dispute settlement ................................................................................................. 12511. 15.11. Agreement on Agriculture .................................................................................... 125
11.1. 15.11.1. Tarification ............................................................................................. 12611.2. 15.11.2. Bindings and reductions ........................................................................ 12611.3. 15.11.3. Tariff-rate quotas .................................................................................... 12611.4. 15.11.4. The boxes ............................................................................................... 12711.5. 15.11.5. Green box ............................................................................................... 12711.6. 15.11.6. Amber box ............................................................................................. 12711.7. 15.11.7. Blue box ................................................................................................. 12711.8. 15.11.8. De minimis ............................................................................................. 12811.9. 15.11.9. Export competition ................................................................................ 12911.10. 15.11.10. Anti-circumvention ........................................................................... 130
12. 15.12. WTO negotiations after 2000 ................................................................................ 13113. Questions .......................................................................................................................... 13214. References ........................................................................................................................ 132
Created by XMLmind XSL-FO Converter.
Az ábrák listája1.1. Figure 1: Poor people spend much of their income on food ......................................................... 31.2. Figure 2: Countries requiring external assistance for food (34 countries) .................................... 92.1. Figure 1: World population growth ............................................................................................. 112.2. Figure 2: Losses along the food chain ........................................................................................ 123.1. Table 1: Average dietary protein and energy consumption and undernourishment by region .... 163.2. Table 2: Changes in global livestock production total and per person 1967 to 200 ................... 185.1. Figure 1: World primary energy demand by fuel in 2008 ........................................................... 335.2. Figure 2: World primary energy demand by fuel in 2035 ........................................................... 336.1. Figure 1: World primary energy demand by fuel in 2008 ........................................................... 406.2. Figure 2: Global bioenergy sources ............................................................................................ 416.3. Figure 3: Word fuel ethanol production, 2010 ............................................................................ 446.4. Figure 4: World biodiesel production, 2010 ............................................................................... 457.1. Figure 1: Closed basins ............................................................................................................... 517.2. Figure 2: Aquifer stress ............................................................................................................... 517.3. Figure 3: Climate change ............................................................................................................ 5210.1. Figure 1: Overview of players in the agri-food sector .............................................................. 7111.1. Figure 1: Food Price Index, annually, 1960-2011 (2000 = 100) ............................................... 7611.2. Figure 2: World stocks as a percentage of world consumption for corn, wheat, rice and vegetable oils, 1960–2010 .................................................................................................................................. 7912.1. Figure 1: Bt Cotton lifecycle .................................................................................................... 9513.1. Figure 1: GM crop plantings 2011 by crop ............................................................................ 10013.2. Figure 2: Share of GM crops in global plantings of key crops in 2011* ................................ 10013.3. Figure 3: GM Product submissions and authorisations. Status of 1 February 2012 .............. 10814.1. Figure 1: Development of crop losses from 1996-98 to 2001-03 ........................................... 11214.2. Figure 2: Development of efficacy of actual crop protection practices from 1996-98 to 2001-03 11215.1. Figure 1: Tariff-Quota ............................................................................................................. 12315.2. Figure 2: TBT and SPS measures relating to the international trade of oranges .................... 12415.3. Figure 1: Amber Box and de minimis: Current Total Aggregate Measurement of Support ... 12815.4. Table 3: Reduction formula for ad valorem tariffs ................................................................. 131
Created by XMLmind XSL-FO Converter.
A táblázatok listája8.1. Table 1: Scenario of the future: 2050 .......................................................................................... 5911.1. Table 1: Future contract specifications ..................................................................................... 8311.2. Table 2: Chicago mercantile exchange feeder cattle futures price quotes for 10:30 am ........... 8611.3. Table 3: Chicago mercantile exchange feeder cattle options price quotes for 10:30 am .......... 8611.4. Table 4: How a grain producer should use basis in marketing strategies ................................. 8813.1. Table 1: Area of GM crops by country (2011) Million hectares ............................................... 9913.2. Table 2: Adoption rate of GM crops in the leading exporting countries of maize and soybean (2011) .......................................................................................................................................................... 10113.3. Table 3: Global maize trade (Million tonnes) ......................................................................... 10213.4. Table 4: Global soybean trade (Million tonnes) ..................................................................... 10313.5. Table 5: Global soybean meal trade (Million tonnes) ............................................................ 10413.6. Table 6: Events in commercial GM crops and in pipelines worldwide, by crop .................... 10613.7. Table 7: Events in commercial GM crops and in pipelines worldwide by region of origin ... 10613.8. Table 8: Asynchronous and isolated foreign approvals as potential sources for low-level presence .......................................................................................................................................................... 10714.1. Table 1: Value of herbicides, insecticides and fungicides in U.S. crop production ................ 11314.2. Table 2: Total estimated environmental and social costs from pesticides in the USA ........... 11414.3. Table 3: Annual estimated pesticide use in the world ............................................................. 11515.1. Table 1: The reductions in agricultural subsidies and protection agreed in the Uruguay Round 12515.2. Table 2: Domestic support structure ....................................................................................... 128
Created by XMLmind XSL-FO Converter.
Tárgymutató
Created by XMLmind XSL-FO Converter.
1. fejezet - 1. THE GLOBAL AGRICULTURAL ECONOMY, HUNGER, AND POVERTYIntroduction
As stated in the 1972 United Nations Conference on the Human Environment and the 1992 Earth Summit, human beings are at the centre of sustainable development. However, even today, over 900 million people still suffer from hunger. Poor populations worldwide, especially in rural areas, are among those most vulnerable to the food, climate, financial, economic, social and energy crises and threats the world faces today We cannot call development sustainable while this situation persists, while nearly one out of every seven men, women and children are victims of undernourishment (FAO, 2012a).
The quest for food security can be the common thread that ulinks the different challenges we face and helps build a sustainable future. To feed a growing population that is expected to top the nine billion mark in 2050, the Food and Agriculture Organization of the United Nations (FAO) projects the need to increase agricultural output by at least 60% in the next decades. But even then the pressure on our natural resources will be extreme. So we must also change the way we eat and find ways to feed the world without the need to produce as much. We can do this by changing to healthier diets in the richer segments of our population and by diminishing the food loss and waste that exist in industrialized and developing countries, and that make us throw away 1.3 billion tonnes of food every year, between production and consumption (FAO, 2012a).
However, even if we do increase agricultural output by 60%, the world would still have 300 million people hungry in 2050 because, like the hundreds of millions today, they would still lack the means to access the food they need. For them, food security is not an issue of insufficient production; it is an issue of inadequate access. The only way to ensure their food security is by creating decent jobs, paying better wages, giving them access to productive assets and distributing income in a more equitable way. We must bring them into society, complementing support to smallholders and income generation opportunities with the strengthening of safety nets, cash for work and cash transfer programmes that contribute to strengthening of local production and consumption circuits, in an effort that must contribute to our sustainable development goals.
The transition to a sustainable future also requires fundamental changes in the governance of food and agriculture and an equitable sharing of the transition costs and benefits. In the past, the poorer have paid a greater share of transition costs and received a smaller share of benefits. This is an unacceptable balance and one that needs to change. The speed of change should also be a concern, so that the vulnerable population can adapt and be part of the changes instead of widening the gaps that exist today.
1. 1.1. Sustainable futureImproving agricultural and food systems is essential for a world with healthier people and healthier ecosystems. Healthy and productive lives cannot be achieved unless “all people at all times have physical, social and economic access to sufficient, safe and nutritious food which meets their dietary needs and food preferences for an active and healthy life” (FAO, 1996). Healthy ecosystems must be resilient and productive, and provide the goods and services needed to meet current societal needs and desires without jeopardizing the options for future generations to benefit from the full range of goods and services provided by terrestrial, aquatic and marine ecosystems. There are very strong ulinkages between the conditions to achieve universal food security and nutrition, responsible environmental stewardship and greater fairness in food management. They intersect in agricultural and food systems at the global, national and local levels. The transition to a sustainable future requires fundamental changes in the governance of food and agriculture and an equitable distribution of the transition costs and benefits.
The sustainable management of agriculture and food systems is key to a sustainable future. Sound policies are needed to create the incentives and capacities for sustainable consumption and production and to enable consumers and producers to make sustainable choices.
Created by XMLmind XSL-FO Converter.
1. THE GLOBAL AGRICULTURAL ECONOMY,
HUNGER, AND POVERTYNational governments and other stakeholders need to:
• Establish and protect rights to resources, especially for the most vulnerable;
• Incorporate incentives for sustainable consumption and production into food systems;
• Promote fair and well-functioning agricultural and food markets;
• Reduce risk and increase the resilience of the most vulnerable; and
• Invest public resources in essential public goods, including innovation and infrastructure.
1.1. 1.1.1. Economic and financial crisis (2006-2008)Small import-dependent countries, especially in Africa, were deeply affected by the food and economic crises. Some large countries were able to insulate themselves from the crisis through restrictive trade policies and functioning safety nets, but trade insulation increased prices and volatility on international markets. High and volatile food prices are likely to continue. Demand from consumers in rapidly growing economies will increase, population continues to grow, and any further growth in biofuels will place additional demands on the food system. On the supply side, there are challenges due to increasingly scarce natural resources in some regions, as well as declining rates of yield growth for some commodities. Food price volatility may increase due to stronger ulinkages between agricultural and energy markets, as well as an increased frequency of weather shocks (FAO, 2011a).
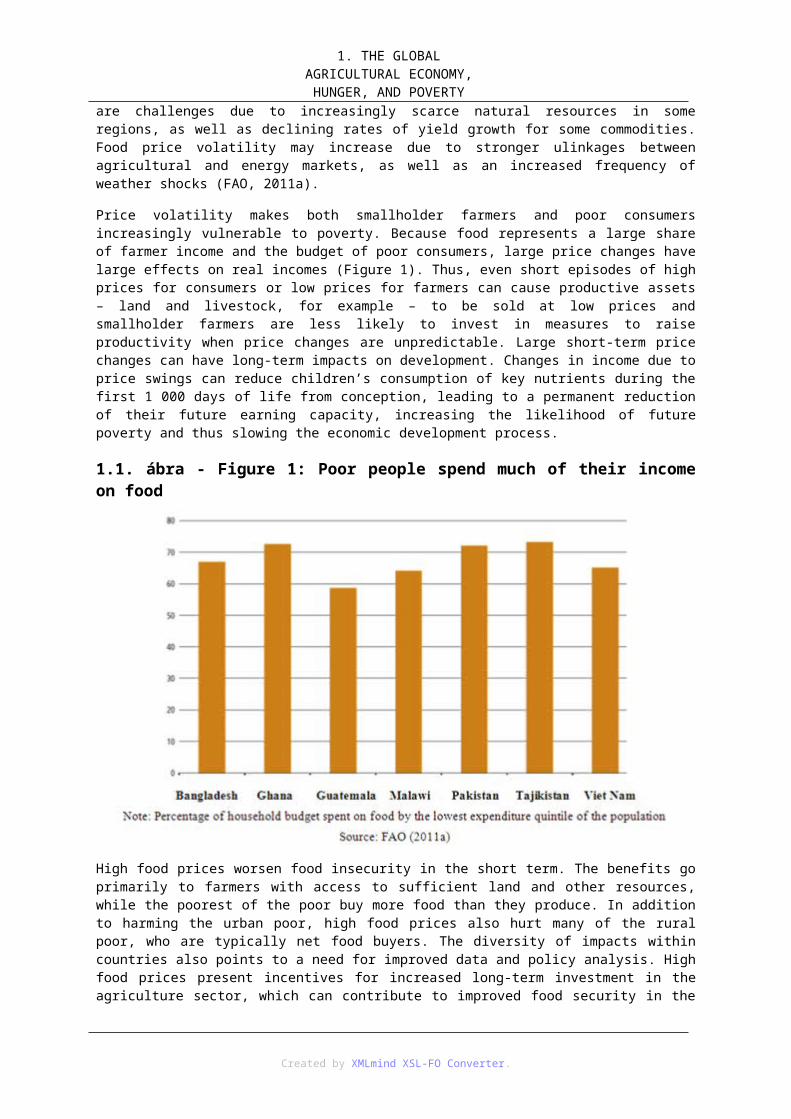
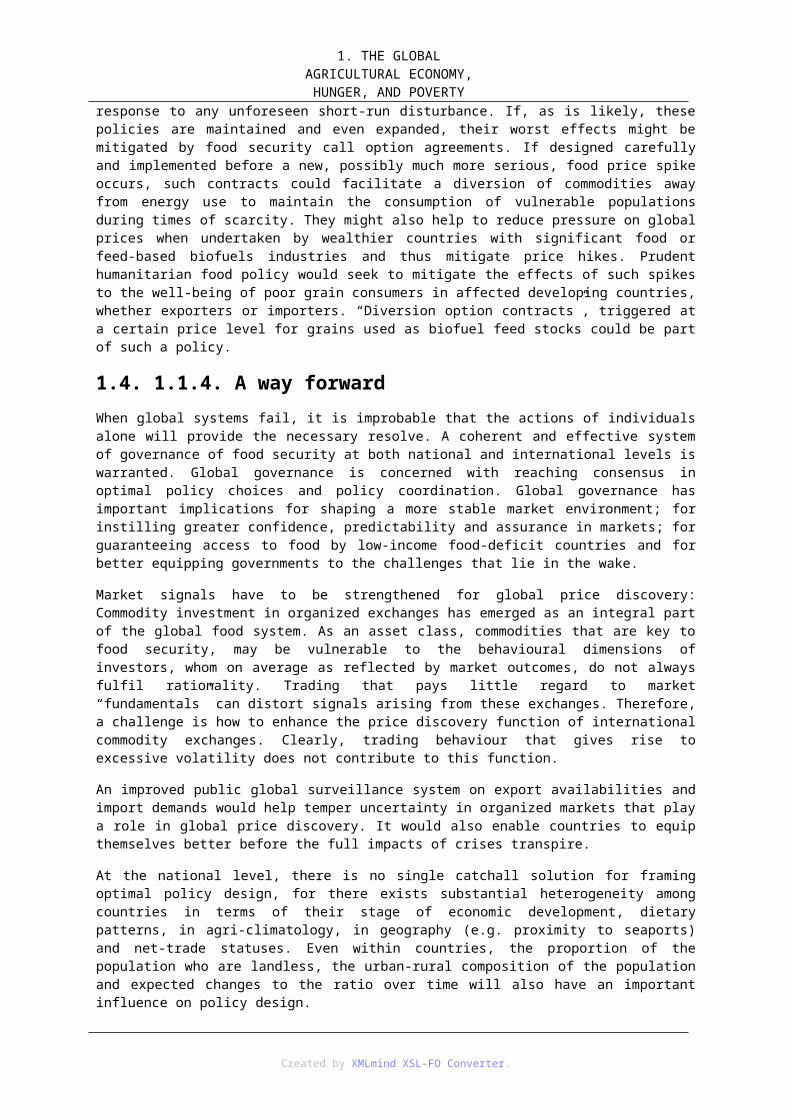
Price volatility makes both smallholder farmers and poor consumers increasingly vulnerable to poverty. Because food represents a large share of farmer income and the budget of poor consumers, large price changes have large effects on real incomes (Figure 1). Thus, even short episodes of high prices for consumers or low prices for farmers can cause productive assets – land and livestock, for example – to be sold at low prices and smallholder farmers are less likely to invest in measures to raise productivity when price changes are unpredictable. Large short-term price changes can have long-term impacts on development. Changes in income due to price swings can reduce children’s consumption of key nutrients during the first 1 000 days of life from conception, leading to a permanent reduction of their future earning capacity, increasing the likelihood of future poverty and thus slowing the economic development process.
1.1. ábra - Figure 1: Poor people spend much of their income on food
High food prices worsen food insecurity in the short term. The benefits go primarily to farmers with access to sufficient land and other resources, while the poorest of the poor buy more food than they produce. In addition
Created by XMLmind XSL-FO Converter.
1. THE GLOBAL AGRICULTURAL ECONOMY,
HUNGER, AND POVERTYto harming the urban poor, high food prices also hurt many of the rural poor, who are typically net food buyers. The diversity of impacts within countries also points to a need for improved data and policy analysis. High food prices present incentives for increased long-term investment in the agriculture sector, which can contribute to improved food security in the longer term.
Domestic food prices increased substantially in most countries during the 2006-08 world food crisis at both retail and farm gate levels. Despite higher fertilizer prices, this led to a strong supply response in many countries. It is essential to build upon this short-term supply response with increased investment in agriculture, including initiatives that target smallholder farmers and help them to access markets, such as Purchase for Progress (P4P). Safety nets are crucial for alleviating food insecurity in the short term, as well as for providing a foundation for long-term development. In order to be effective at reducing the negative consequences of price volatility, targeted safety-net mechanisms must be designed in advance and in consultation with the most vulnerable people (FAO, 2011a).
1.2. 1.1.2. Food-security strategyA food-security strategy that relies on a combination of increased productivity in agriculture, greater policy predictability and general openness to trade will be more effective than other strategies. Restrictive trade policies can protect domestic prices from world market volatility, but these policies can also result in increased domestic price volatility as a result of domestic supply shocks, especially if government policies are unpredictable and erratic. Government policies that are more predictable and that promote participation by the private sector in trade will generally decrease price volatility.
Investment in agriculture remains critical to sustainable long-term food security. Such investment will improve the competitiveness of domestic production, increase farmers’ profits and make food more affordable for the poor. For example, cost-effective irrigation and improved practices and seeds developed through agricultural research can reduce the production risks facing farmers, especially smallholders, and reduce price volatility. Private investment will form the bulk of the needed investment, but public investment has a catalytic role to play in supplying public goods that the private sector will not provide. These investments should consider the rights of existing users of land and related natural resources, benefit local communities, promote food security and not cause undue harm to the environment
The world is again experiencing a bout of heightened and prolonged price volatility in global food markets. Historically, occurrences are rare and each time they transpire, the world’s attention is temporarily galvanized, but concerted follow-up action has always fallen short of momentary expectations. The failure to prevent history from repeating itself is troubling, particularly when contrasted against other global systems that come under threat. When, for instance, financial crises take hold, the depth, breadth and rapidity of a coordinated response by the world’s leaders in marshalling resources to remedy imbalances demonstrates that global action is possible. When the world food order falters and millions forego food security, however, the resolve of global leadership fails. The impasse on inaction must be broken. Shielding food security against the threat of more frequent bouts of turmoil in global food markets must now be put at the top of the political and economic agenda (FAO, 2011b).
Much rests on the concept of “global governance” – building consensus on optimal policy choice and enhancing policy coordination. Global governance has important implications for shaping a more stable market environment; for instilling greater confidence, predictability and assurance in the international arena; for guaranteeing access to food for low-income countries and for better equipping governments to deal with the challenges ahead. But governance has a role within geographical boundaries. There are a host of initiatives that countries at risk can promote. These are principally directed towards building resilience and lowering vulnerability through investing in productivity for a diversified set of crops supported by incentive frameworks, instilling greater efficiency in domestic food systems and protecting those most at risk through safety nets. Enacting such measures will not only address the root cause of vulnerability, namely poverty, but would constitute a major step towards tackling the problem of hunger and malnutrition that still afflicts almost one billion people in the world today (FAO, 2011b).
1.3. 1.1.3. External shocks in addition to demand and supply fundamentalsThe seeds of crisis sown in past events change little, for instance the 1974 crisis and the 2006 – 08 turmoil, but time and again, policy-makers and the multilateral agencies have failed to prevent history from repeating itself.
Created by XMLmind XSL-FO Converter.
1. THE GLOBAL AGRICULTURAL ECONOMY,
HUNGER, AND POVERTYBy assuming world prices as a reference for measuring economic efficiency, trade liberalization would enhance resource allocation through exploiting comparative advantage. This increased reliance on markets was also concomitant to a progressive withdrawal of the state and intervention schemes from the food and agriculture sector, on the grounds that the private sector was more efficient from an economic point of view. Against these trends, public and private sectors in both developed and developing countries saw a limited need to invest in agricultural production and infrastructure, as food imports appeared an efficient way of achieving food security. Such perceptions, though, were radically changed when in 2006 prices of most internationally traded foodstuffs began to soar.
Episodes of extreme volatility are a major threat to food security in developing countries. Typically, low-income food-importing countries that are dependent on foreign aid and are characterized by high levels of foreign debt are the most vulnerable to positive food price shocks. The detrimental impact of rising volatility on these economies rests on their structural disposition: poor infrastructure, poor supply response, incomplete markets, weak capacity to import, sovereign risk, dependence on a single dominant staple, and susceptibility to climatic disturbances. Rising volatility can, in countries falling under this typology, increase the incidence of poverty, as well as putting a strain on government expenditure and borrowing, thus worsening debt sustainability. The deterioration of the terms-of-trade may destabilize the economy, thus impeding economic growth.
Beyond the uncertainty driven by environmental factors, including a changing climate and land degradation, the trajectory of the global food system is no longer determined by the resolution of demand and supply fundamentals. External shocks are emerging from a complexity of sources and are having a profound influence in shaping the agricultural landscape. Many of these shocks transcend international borders, spilling over from other sectors, and have the potential to amplify and perpetuate volatility. Their complexity compounds uncertainty, and is driving vulnerability in food systems. In this vein, there is a strong case that volatility is both a cause and consequence of vulnerability. The argument is framed in the context of both the resilience and response of food systems to shocks.
The growing exposure of vulnerable countries to bouts of market volatility is a challenge to all, and beckons the question of what policies governments should pursue to cope with an increasingly unpredictable environment, especially in the longer term. Authorities, including marketing boards in vulnerable food deficit nations, have attempted to intervene, but in most instances, budgetary constraints and the sheer scale of price increases have precluded any meaningful success at stabilization. Accordingly, interventions have been short-term, limited to the micro-level such as targeted consumer subsidies and safety nets and also to policies at the border, such as lowering tariffs and restraining exports. However, such policy cannot control the actions of myriads of private agents that are a feature of all food markets. Moreover, speculators can normally counteract the actions of all but the most well financed intervention activities.
An important “new reality” of the global food system that has sparked considerable controversy and debate, often polarized, concerns the influence of commodity speculation on food prices. On one side, it is recognized that speculation is crucial to the proper functioning of markets, there is strong conviction that unlimited speculation is not. The central argument here is that once speculation becomes “excessive” – to the point that the marginal benefit of the liquidity that speculators provide exceeds the marginal cost of the damage that they do to the price discovery function – there is need for intervention. As the prices broadcast from the major commodity exchanges reverberate around the world and affect billions of lives, a serious and more directed inquiry into the trading on the international commodity futures markets should commence.
World Trade Organization rules and disciplines are much less effective in situations of high world market price than they are in cases of depressed prices. This asymmetry is largely a consequence of the original objective of this system that aimed at disciplining situations leading to depressed prices in world markets adversely affecting exports. Thus, domestic and export subsidies, as well as import barriers, have been the target for reform, while policies that have the opposite effect (such as export taxes and prohibitions) have been largely tolerated. But the extent to which the fundamentals of world food markets have changed, the multilateral rules must adjust accordingly to be able to address trade issues that arise when food is no longer cheap. This would also add to the credibility of the system and foster an environment conducive to more trade openness on the part of importing countries, to the extent the latter are assured that the world market is a reliable source of supply, both in periods of plenty and in periods of relative scarcity.
In addition, under the present aggregate minimum commitment of the Food Aid Convention, diverting food aid resources away from their prioritized use may seriously compromise the timely availability of resources for meeting pressing emergency needs as well as the needs of chronically food-insecure populations. The present Convention offers little room for providing any relief to countries facing difficulties from high food prices.
Created by XMLmind XSL-FO Converter.
1. THE GLOBAL AGRICULTURAL ECONOMY,
HUNGER, AND POVERTYMultilateral agencies have responded to past turmoil in both food and financial markets by establishing global safety-net schemes with the objective of assisting countries in financing food imports. These schemes have been valuable, but they were set up as crisis response measures and for a limited duration. As high and volatile prices look likely to continue, what is now required is a longer-term response, with emphasis on established market mechanisms.
One approach, reliant on the purchase of call options, provides a promising way forward. This approach would enable vulnerable food importing countries to limit the impact of volatility in world food prices on their domestic markets and could be integrated with national food security structures. It would constitute a natural extension of trade-based policies recently advocated by multilateral donors. A structure through which multilateral agencies would intermediate optionality, such that costs and ownership remained with the countries themselves, would be appropriate. Taken together with an agreement to limit the use of restrictions on food exports, the market-based approach can re-establish food security on a trade basis and obviate the need for costly national food stockpiles.
The complexity of the new marketplace has placed exceptional demands on accurate and timely information on commodity developments and on the external drivers which influence market outcomes. It is argued that among the root causes of recent price volatility was the lack of reliable and up-to-date information on crop supply and demand and export availability. The problem is widespread. Despite the increase in the volume of raw data and the greater speed of transmitting information over recent years, the capacity to analyse the mass of often conflicting and variable-quality data and to disseminate the resulting analyses has not kept pace, particularly in the public, free-access sector. Furthermore, at the national level, the capacity of many countries to collect and process basic agricultural data has often deteriorated, and public statistical services have difficulties undertaking such forward-looking exercises as crop forecasts, let alone comprehensive supply/demand analyses and trade forecasts.
Another issue that requires urgent addressing concerns biofuels, especially those derived from food staple crops. Expansion of biofuels that is unpredicted, or so rapid that it outpaces the ability of the economy to accommodate it, reduces carryover stocks of grains and oilseeds, raises food price levels and increases the threat of further price spikes in response to any unforeseen short-run disturbance. If, as is likely, these policies are maintained and even expanded, their worst effects might be mitigated by food security call option agreements. If designed carefully and implemented before a new, possibly much more serious, food price spike occurs, such contracts could facilitate a diversion of commodities away from energy use to maintain the consumption of vulnerable populations during times of scarcity. They might also help to reduce pressure on global prices when undertaken by wealthier countries with significant food or feed-based biofuels industries and thus mitigate price hikes. Prudent humanitarian food policy would seek to mitigate the effects of such spikes to the well-being of poor grain consumers in affected developing countries, whether exporters or importers. “Diversion option contracts”, triggered at a certain price level for grains used as biofuel feed stocks could be part of such a policy.
1.4. 1.1.4. A way forwardWhen global systems fail, it is improbable that the actions of individuals alone will provide the necessary resolve. A coherent and effective system of governance of food security at both national and international levels is warranted. Global governance is concerned with reaching consensus in optimal policy choices and policy coordination. Global governance has important implications for shaping a more stable market environment; for instilling greater confidence, predictability and assurance in markets; for guaranteeing access to food by low-income food-deficit countries and for better equipping governments to the challenges that lie in the wake.
Market signals have to be strengthened for global price discovery: Commodity investment in organized exchanges has emerged as an integral part of the global food system. As an asset class, commodities that are key to food security, may be vulnerable to the behavioural dimensions of investors, whom on average as reflected by market outcomes, do not always fulfil rationality. Trading that pays little regard to market “fundamentals” can distort signals arising from these exchanges. Therefore, a challenge is how to enhance the price discovery function of international commodity exchanges. Clearly, trading behaviour that gives rise to excessive volatility does not contribute to this function.
An improved public global surveillance system on export availabilities and import demands would help temper uncertainty in organized markets that play a role in global price discovery. It would also enable countries to equip themselves better before the full impacts of crises transpire.
At the national level, there is no single catchall solution for framing optimal policy design, for there exists
Created by XMLmind XSL-FO Converter.
1. THE GLOBAL AGRICULTURAL ECONOMY,
HUNGER, AND POVERTYsubstantial heterogeneity among countries in terms of their stage of economic development, dietary patterns, in agri-climatology, in geography (e.g. proximity to seaports) and net-trade statuses. Even within countries, the proportion of the population who are landless, the urban-rural composition of the population and expected changes to the ratio over time will also have an important influence on policy design.
1.5. 1.1.5. World market volatility challenges facing poor net food-importing countriesAround 75% of the poor live in rural areas and many depend on agriculture for their livelihoods. They eke out a living on farms of often less than two hectares, work as small entrepreneurs or earn low wages in the agriculture-related processing, storage, seed or feedstuffs sectors. They are poor because they rely on too few and too unproductive assets. A profound and prolonged lack of investment in agriculture has restrained the overall productivity of the sector, sometimes to the extent that it no longer stands as a viable base for poverty reduction. A lack of investment has also reduced the ability of farmers to cope with price volatility. Moreover, the cyclical tendency of investment flows appears to have pronounced price peaks and troughs.
Since the late 1990s the world has entered a period of tight food supplies, higher prices and increased price volatility. These trends adversely affect the capacity of food import-dependent countries to access supplies. Poor households in these countries which already spend much of their income on food and have limited coping mechanisms at their disposal, suffer in the process. These developments are related, in part, to the implementation of reforms agreed under the Uruguay Round that came into effect in 1995, which resulted in a reduction of structural surpluses and a strengthening of world agricultural and food prices. Also as anticipated, other forms of food assistance made available in the past, such as subsidized exports and food aid, declined drastically in recent years. At the same time the world food market has been dramatically affected by factors external to agriculture, including energy prices and speculative activity from the financial sector, as well as unilateral export restrictions put in place by some countries.
1.6. 1.1.6. Characteristics of food insecurity in net food importing countriesThe average supply of calories and protein in the Least Developed Countries (LDCs) and Net-Food Importing Developing Countries (NFIDCs) is well below and much more variable than the aggregate for developing countries. Gains in the past half century have been modest. Considering also the often very unequal distribution of available supplies within countries, these trends are indicative of their food security vulnerability. A manifestation of the precariousness of the food security situation in these countries is the frequency of being in need of external assistance in response to food emergencies, with some of them permanently in that state. Their growing demand for basic foodstuffs continues to be met by domestic supplies and growing import volumes. In the case of cereals, self-sufficiency ratios are hovering around 90% and 70%, for LDCs and NFIDCs respectively (Konandreas, 2012).
While NFIDCs have generally kept the pace of other developing countries in increasing productivity, LDCs achieved only modest gains. Cereal yields in LDCs are only half of those attained by developing countries and one-third of those achieved by developed countries. Much of the increase in output has come from area expansion. Cereals comprise the largest item in the food import basket accounting for some 42% and 40% of the value of food imports of LDCs and NFIDCs, respectively, followed by oils and fats and sugar. Together these three commodity groups account for over three-quarters of the value of food items imported by LDCs and over two-thirds for the NFIDCs. The share of food aid in their total cereal imports has declined sharply, from close to 30% in the beginning of the 1990s for the LDCs (8% for the NFIDCs), to about 8 percent in the last 3 years (less than 0.5% for the NFIDCs).
The increase in the cost of cereal imports has been much more affected by price increases rather than volumes imported in recent years. Thus, for LDCs while the aggregate volume of commercial cereal imports increased by less than three times during 1990-2010, their cereal import bill increased by over six times during the same period. Similar sharp increases in the cereal import bill have been experienced by the NFIDCs, with a volume increase by about 70% and a cereal import bill nearly quadrupling (therefore rising by some 300%). For both LDCs and NFIDCs, there is considerable variation between countries, and for some, all the increase in their cereal import bill was due to price. The escalating burden of food imports, necessary to meet immediate consumption, represents a serious threat for the economies of most LDCs and NFIDCs. The share of food imports to total merchandize exports is very high even under normal years, especially for the LDCs, and
Created by XMLmind XSL-FO Converter.
1. THE GLOBAL AGRICULTURAL ECONOMY,
HUNGER, AND POVERTYskyrockets for some countries during price spikes. The imperative of importing food often comes at the expense of other imports including capital goods necessary for long-term development (Konandreas, 2012).
1.7. 1.1.7. What can LDCs and NFIDCs do for themselves?Lowering or eliminating import tariffs is the most common measure that governments take to cushion the impact on domestic prices of imported goods when world market prices rise. However, this option is severely limited when applied tariffs are already low as is generally the case in many poor countries and even their elimination is a small relief when import prices shoot up by several multiples of prevailing tariff levels.
1.8. 1.1.8. Avoiding export prohibitions and restrictionsWhile export restraints are seemingly politically attractive in the short term, they are a blunt instrument. By aggravating further world market prices they shift the burden of an even greater adjustment to other countries. There are always much more attractive approaches to address the needs of vulnerable domestic consumers than imposing export prohibitions/restrictions, which are also less costly in the longer term. Also, to the extent that the country is a regular exporter of food commodities, it risks losing markets if it turns on and off exports unilaterally. Net food importing countries should be enthusiastic proponents of approaches in strengthening WTO rules on export prohibitions and restrictions.
1.9. 1.1.9. Stockholding and domestic food assistanceBuilding modest stocks has been a very common response to market instability and, although often an expensive undertaking, their appeal is clear from the point of view of vulnerable countries to offer some degree of protection against domestic and external shocks. In general, there are no effective limitations from the WTO Agreement on Agriculture (AoA) for public stockholding for food security purposes as long as these form an integral part of a food security programme identified in national legislation. The same applies to domestic food aid under clearly-defined eligibility criteria related to nutritional objectives. The limitations arise from cost considerations and clear rules for accumulation and release of such stocks are essential.
1.10. 1.1.10. Reducing the high transaction costs for intra-regional tradeWeak market integration in regions where the majority of net food-importing countries are located tends to result in higher food prices, adding to their vulnerability. Some relief can be obtained by reducing transaction costs, which is an important mitigating factor in containing price increases and price volatility. Transactions costs can be curbed through improvements to physical infrastructure (e.g. roads) but also through a facilitation of regional transport and transit formalities, simplification of cross-border regulations and cracking down on petty corruption, which is highly detrimental to food security.
1.11. 1.1.11. Using AoA flexibility to invest in food production and resilienceIn general the AoA disciplines are not constraining poor countries in investing in agriculture, even with production and trade distorting policies. The policy mix that individual countries may use would depend on their specific circumstances but one policy that has proven very effective in achieving rapid increases in output is targeted investment assistance to farmers and “smart” input subsidies to resource poor farmers.
1.12. 1.1.12. How can the international community help?Among the measures to assist net food-importing countries to deal with escalating food import bills. These include: food aid; export credits; compensatory financing; and assistance to increase agricultural productivity and infrastructure.
2. 1.2. Limiting the role of food aid to emergency responses
Created by XMLmind XSL-FO Converter.
1. THE GLOBAL AGRICULTURAL ECONOMY,
HUNGER, AND POVERTYWhile food aid has been an important resource in the past to help countries with structural deficits, it now barely meets the requirements of growing emergency situations (Figure 2). Also the provision of food aid for budgetary support has been increasingly under scrutiny. Considering also the nutritional needs of poor households, especially in periods of scarcity, it would be prudent to limit the use of food aid to emergencies and nutritional support and, perhaps, broaden its scope by including essential agricultural inputs as part of the donors’ contributions under the Food Aid Convention (FAC).
1.2. ábra - Figure 2: Countries requiring external assistance for food (34 countries)
Source: FAO (2012b)
3. 1.3. Targeting export creditsThe record of officially supported export credits in providing assistance to liquidity-constrained countries to import food has not been very good. Only a very small share of such credits was given to poor net food importing countries and the concessionality element was minimal.
4. 1.4. Strengthening food financing facilitiesThe need for assistance in financing imports of basic foodstuffs is evident from the already heavy burden net food-importing countries endure even when import prices are normal. IMF and the World Bank facilities had been identified as most relevant in the context of the Marrakesh Decision, although their utility has been questioned by beneficiary countries for a number of reasons. A battery of new instruments has now been created by these institutions with improved conditions of access and necessary resources, reflecting the need to address increased vulnerabilities in poor countries in recent years.
5. 1.5. Increasing technical and financial assistance to boost productivityTargeting agricultural productivity reflects a genuine recognition of the fundamental causes of
vulnerability. The types of technical and financial assistance would have to be holistic by addressing constraints along the supply chain, including appropriate technologies, processing, storage and marketing of agricultural commodities. Reversing the past declining trends in Official Development Assistance (ODA) investment to agriculture can be instrumental in reducing vulnerability in poor net food importing countries.
6. Questions1. Sustainable future?
2. Food expenditure shares in percentage of per capita income?
3. Food crisis and financial crisis?
Created by XMLmind XSL-FO Converter.
1. THE GLOBAL AGRICULTURAL ECONOMY,
HUNGER, AND POVERTY4. Hunger and malnourishment?
5. Increase of agricultural output?
6. Characteristics of food insecurity in net food importing countries?
7. ReferencesFAO (1996): World Food Summit. 13-17 November 1996. Food and Agriculture Organization of the United Nations. Rome, 1996. http://www.fao.org/docrep/003/w3548e/w3548e00.htm
FAO (2011a): The State of Food Insecurity in the World. How does international price volatility affect domestic economies and food security? Food and Agriculture Organization of the United Nations. Rome, 2011. p. 50.
FAO (2011b): Safeguarding food security in volatile global markets. Edited by Adam Prakash. Food and Agriculture Organization of the United Nations, Rome, 2011. p. 594.
FAO (2012a): Towards the future we want. End hunger and make the transition to sustainable agricultural and food systems. Food and Agriculture Organization of the United Nations. Rome, 2012. p. 28.
FAO (2012b): Crop Prospects and Food Situation. Food and Agriculture Organization of the United Nations. No.1. March 2012. http://www.fao.org/giews/english/cpfs/index.htm
Konandreas, P. (2012): Trade policy responses to food price volatility in poor net food-importing countries. Issue Paper No. 42, 2012. Published by International Centre for Trade and Sustainable Development (ICTSD). p. 65, Geneva, Switzerland. http://ictsd.org/downloads/2012/06/trade-policy-responses-to-food-price-volatility-in-poor-net-food-importing-countries. pdf
Created by XMLmind XSL-FO Converter.
2. fejezet - 2. FOOD SECURITY AND SOCIAL PROTECTION1. 2.1. Risks to food securityThe combined effect of the Green Revolution has allowed world food production to double in the past 50 years. From 1960 to present the human population has more than doubled to reach seven billion people (Figure 1). The 7 billion world population is projected to increase by 30% to 9.2 billion by 2050. This increased population density, coupled with changes in dietary habits in developing countries towards high quality food (e.g. greater consumption of meat and milk products) and the increasing use of grains for livestock feed, is projected to increase demand for food production increase by over 40% by 2030 and 70% by 2050, compared with average 2005-07 levels (FAO, 2009). At the same time the increase in arable land between 2005 and 2050 will be just 5% (FAO, 2011a).
2.1. ábra - Figure 1: World population growth
Source: FAO (2009)
Land use for food and feed are typically determined by global diet and agricultural yield improvements. With respect to diet, consumption of meat and dairy products is an important driver for land use since meat and dairy use a lot more basic agricultural production than does the consumption of grain. Livestock products imply an inefficient conversion of calories of the crops used in livestock feeds. On average, 6 kg of plant protein is required to yield 1 kg of meat protein. By 2050 an expanded world population will be consuming two thirds more animal protein than it does today, bringing new strains to bear on the planet's natural resources. Meat consumption is projected to rise nearly 73% by 2050; dairy consumption will grow 58% over current levels. The surge in livestock production that took place over the last 40 years resulted largely from an increase in the overall number of animals being raised. Meeting projected demand increases in production will need to come from improvements in the efficiency of livestock systems in converting natural resources into food and reducing waste. This will require capital investment and a supporting policy and regulatory environment. Meat consumption in China alone increased from 27 to 60 kg per person per year between 1990 and 2010. Each additional kg of meat consumption increase in China results in a need for roughly 4-5 million tons of animal feed (FAO, 2011b).
Helping farmers lose less of their crops will be a key factor in promoting food security but even in the poorest countries those rural farmers aspire to more than self-sufficiency. The reduction of current yield losses caused by pests, pathogens and weeds are major challenges to agricultural production. Globally, an average of 35% of potential crop yield is lost to pre-harvest pests (Oerke, 2006). In addition to the pre-harvest losses transport, pre-processing, storage, processing, packaging, marketing and plate waste losses are relatively high. If there is going to be enough food at affordable prices for the global population, we may also have to change our food habits and decrease food waste.
Food waste in the field pre-processing (broken grains, excessive dehulling), transport (spillage, leakage), storage (insects, bacteria) and processing and packaging (excessive peeling, trimming and inefficiency) goes up to
Created by XMLmind XSL-FO Converter.
2. FOOD SECURITY AND SOCIAL PROTECTION
10%15% in quantity and 25%-50% in value (quality). Marketing (retailing) and plate (by consumers and retailers) waste adds another 5%-30% in developed and 2%-20% in developing countries to the losses in the food chain (Figure 2).
2.2. ábra - Figure 2: Losses along the food chain
Food losses in industrialized countries are as high as in developing countries, but in developing countries more than 40% of the food losses occur at post harvest and processing levels, while in industrialized countries, more than 40% of the food losses occur at retail and consumer levels (Gustavsson et al., 2011). We can save also water by reducing losses in the food chain.
Roughly one-third of food produced for human consumption is lost or wasted globally, which amounts to about 1.3 billion tons per year. This inevitably also means that huge amounts of the resources used in food production are used in vain, and that the greenhouse gas emissions caused by production of food that gets lost or wasted are also emissions in vain. Food is lost or wasted throughout the supply chain, from initial agricultural production down to final household consumption. In medium- and high-income countries food is to a significant extent wasted at the consumption stage, meaning that it is discarded even if it is still suitable for human consumption (Gustavsson et al., 2011).
Significant losses also occur early in the food supply chains in the industrialized regions. In low-income countries food is lost mostly during the early and middle stages of the food supply chain; much less food is wasted at the consumer level. Overall, on a per-capita basis, much more food is wasted in the industrialized world than in developing countries. The per capita food waste by consumers in Europe and North-America is 95-115 kg/year, while this figure in Sub-Saharan Africa and South/Southeast Asia is only 6-11 kg/year (Gustavsson et al., 2011).
The causes of food losses and waste in low-income countries are mainly connected to financial, managerial and technical limitations in harvesting techniques, storage and cooling facilities in difficult climatic conditions, infrastructure, packaging and marketing systems. Given that many smallholder farmers in developing countries live on the margins of food insecurity, a reduction in food losses could have an immediate and significant impact on their livelihoods. The food supply chains in developing countries need to be strengthened by, inter alia, encouraging small farmers to organize and to diversify and upscale their production and marketing. Investments in infrastructure, transportation, food industries and packaging industries are also required. Both the public and private sectors have a role to play in achieving this.
The causes of food losses and waste in medium/high-income countries mainly relate to consumer behaviour as well as to a lack of coordination between different actors in the supply chain. Farmer-buyer sales agreements may contribute to quantities of farm crops being wasted. Food can be wasted due to quality standards, which reject food items not perfect in shape or appearance. At the consumer level, insufficient purchase planning and expiring “best-before-dates” also cause large amounts of waste, in combination with the careless attitude of those consumers who can afford to waste food. Food waste in industrialized countries can be reduced by raising awareness among food industries, retailers and consumers. There is a need to find good and beneficial use for safe food that is presently thrown away.
While increasing primary food production is paramount to meet the future increase in final demand, tensions
Created by XMLmind XSL-FO Converter.
2. FOOD SECURITY AND SOCIAL PROTECTION
between production and access to food can also be reduced by tapping into the potential to reduce food losses. Efficient solutions exist along the whole food chain, for reducing total amounts of food lost and wasted. Actions should not only be directed towards isolated parts of the chain, since what is done (or not done) in one part has effects in others. In low income countries, measures should foremost have a producer perspective, e.g. by improving harvest techniques, farmer education, storage facilities and cooling chains. In industrialized countries on the other hand, solutions at producer and industrial level would only be marginal if consumers continue to waste at current levels. Consumer households need to be informed and change the behaviour which causes the current high levels of food waste. Another point to be stressed is that the food supply chain of today is more and more globalized. Certain food items are produced, transformed and consumed in very different parts of the world. The impact of growing international trade on food losses still has to be better assessed.
2. 2.2. Competition for land and waterLand use change is not a new concept but is something that has been taking place since the beginning of civilization and continues to do so. In this context, agriculture has always been an important driver, so far mostly for food and feed production. A growing world population and a changing diet have led to continuously expanding areas of agricultural land, despite parallel increases in yields from existing cropland. In addition, cropland is lost due to erosion through chemical and physical degradation, which further increases the requirement for new agricultural land. On the other hand cultivated land is tightening due to population growth and accelerated urbanization and motorization1, changes in lifestyles, falling water tables and diversion of irrigated water towards the cities (Earth Institute, 2005).
The land surface of our planet is equal to 13.4 billion hectares of which 38% is given over to agriculture and 30% to forest (FAO, 2011a). The rest of the total is rounded out through a combination of man-made infrastructure, inland water systems, and land that is unsuited for agriculture and forestry (desert, rocks etc.). Of the 5 billion hectares of land used for agricultural purposes worldwide around one-third is suited to annual or permanent crops whereas just over two-thirds are allocated to permanent meadows or pasture. Just 1.6 billion hectares are used for crop production (arable land and land under permanent crops).
Over the last 50 years, land and water management has met rapidly rising demands for food and fibre. In particular, input-intensive, mechanized agriculture and irrigation have contributed to rapid increases in productivity. The world’s agricultural production has grown between 2.5 and 3 times over the period while the cultivated area has grown only by 12% as a result of two opposite trends: an increase of 227 million ha in developing countries, and a decline of 40 million ha in developed countries. More than 40% of the increase in food production came from irrigated areas, which have doubled in area over the same period, accounting for 15% of all arable land. In the same period, the cultivated area of land per person gradually declined from 0.45 to less than 0.23 ha indicating that the largest contribution to increases in agricultural output will most likely come from intensification of production on existing agricultural land (FAO, 2011c).
However, global achievements in production in some regions have been associated with degradation of land and water resources, and the deterioration of related ecosystem goods and services. Agriculture also makes use of 70% of all water withdrawn from aquifers, streams and lakes. Urbanisation may double domestic and industrial water use, not to mention climate change and bioenergy production. Without water productivity gains, crop water consumption will double by 2050. The water “bubble” is unsustainable and fragile because 7 billion people at present have to share the same quantity as the 300 million global inhabitants of Roman times. About 80% of water for food production comes directly from rain, but an increasing part is met by irrigation. Both the physical water productivity (more crop production per drop water use) and economic water productivity (more production value per drop water use) have to be increased by investing in rained agriculture and irrigation. This will require widespread adoption of sustainable land management practices, and more efficient use of irrigation water through enhanced flexibility, reliability and timing of irrigation water delivery. Promoting food trade from water rich, highly productive areas to water scarce areas contributes to global water productivity improvement (IWMI, 2007).
3. 2.3. Growth of agricultural outputFuture agricultural production will have to rise faster than population growth largely on existing agricultural land. Improvements will thus have to come from sustainable intensification that makes effective use of land and
11 An estimated 40,000 ha of land are needed for basic living space for every 1 million people added and 20,000 ha of land are needed for every 1 million vehicles added.
Created by XMLmind XSL-FO Converter.
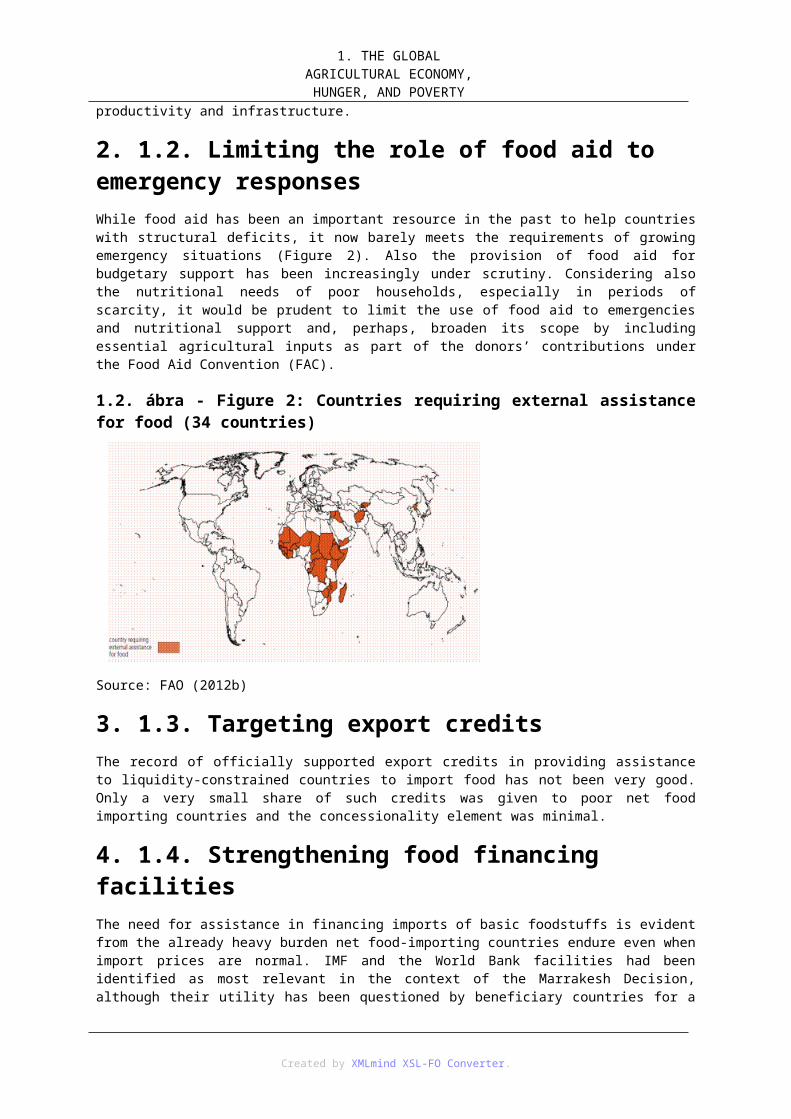
2. FOOD SECURITY AND SOCIAL PROTECTION
water resources as well as not causing them harm. Regarding yield improvements, there seems to be a large theoretical potential for yield improvements throughout the world, especially in the developing countries, but there are still major uncertainties as to what proportion of this potential can be harvested. The increase in food demand is met to some extent by an increase of agricultural yields. Crop yields would continue to grow, but at a slower rate than in the past. On average, annual growth would be about half that of the historical period: 0.8% per annum from 2005/2007 to 2050, against 1.7% per annum from 1961 to 2007.
Nevertheless, agricultural production would still need to increase by 70% by 2050 to cope with a 30% increase in world population. This translates into additional production of 1 billion tons of cereals and 200 million tons of meat a year by 2050 (compared with production in 2005/2007). In addition to yield growth there will also be a slow expansion of agricultural land. Arable land would expand by 70 million ha (less than 5%), an expansion of about 120 million ha (12%) in developing countries being offset by a decline of 50 million ha (8%) in developed countries. Much of the suitable land not yet in use is concentrated in a few countries in Latin America and sub-Saharan Africa, not necessarily in Asia (with some 60% of the world’s population) where it is most needed, and much is suitable for growing only a few crops, not necessarily those for which the demand is highest (FAO, 2011a).
Large-scale land acquisitions are on the increase in parts of Africa, Asia and Latin America where land and water resources appear abundant and available. More recent transnational land deals are partly a consequence of the larger changing economic valuation of land and water. Higher agricultural prices generally result in higher land prices because the expected returns to land increase when profits per unit of land increase. Given that the rise of food price has increased competition for land and water resources for agriculture, it is not surprising that farmland prices have risen throughout the world in recent years. Although large-scale land acquisitions remain a small proportion of suitable land in any one country, contrary to widespread perceptions there is very little ‘empty’ land as most remaining suitable land is already used or claimed, often by local people. While they offer opportunities for development, there is a risk that the rural poor could be evicted or lose access to land, water and other related resources (Braun and Meinzen-Dick, 2009).
Bioenergy may compete with the food sector, either directly, if food commodities are used as the energy source, or indirectly, if bioenergy crops are cultivated on soil that would otherwise be used for food production. Both effects may impact on food prices and food security if demand for the crops or for land is significantly large. This issue has typically been of concern for the biofuels sector, which uses mainly food crops. Increased biofuels production could also reduce water availability for food production, as more water is diverted to production of biofuel feedstocks (Chakravorty et al., 2009; Hoekstra et al., 2010). Until now, the price increases that this has led to seem to be limited for most crops, and the agricultural sector has responded by increasing production. There are exceptions, though, especially with crops where biofuel demand accounts for a significant share of total demand (e.g. maize, oilseeds, sugarcane). Besides competition with food and feed, increased use of biomass also has its effects on other sectors. Forest-based industries (pulp and paper, building materials etc.) for example, will be affected by the increased use of wood for energy conversion, both negatively and positively (European Commission, 2010).
Almost 1 billion people are undernourished. There will always be risks associated with food supply and thus a need to manage these risks. Domestic food supplies are not less risky than for example energy imports, but it is sensible to plan for systemic risks (such as nuclear fallout, port strikes, etc.). We experience food poverty due to a lack of entitlements, not lack of food availability (Krugman, 2009). Future food security depends on the development of the political and logistical capacity to make food accessible everywhere, to everyone (FAO, 2011a).
4. Questions1. Food security concerns?
2. Challenges of food security?
3. Food waste?
4. Competition for land and water?
5. Growth of agricultural output?
Created by XMLmind XSL-FO Converter.
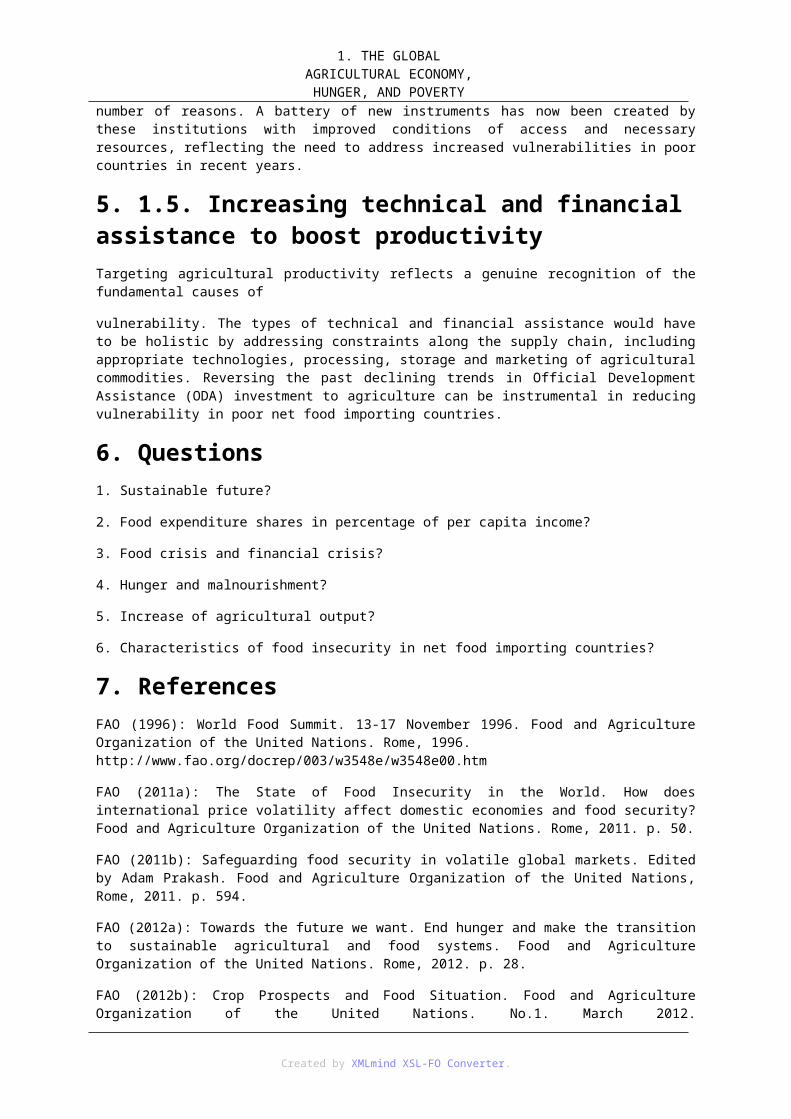
2. FOOD SECURITY AND SOCIAL PROTECTION
5. ReferencesBraun, von J. and Meinzen-Dick, R. (2009): “Land Grabbing by Foreign Investors in Developing Countries: Risks and Opportunities”. Policy Brief 13. Washington: International Food Policy Research Institute.
Chakravorty, U. et al. (2009): Fuel versus food. Annual Review of Resource Economics, 1(1):645-663.
European Commission (2010): Report from the commission to the council and the European parliament on sustainability requirements for the use of solid and gaseous biomass sources in electricity, heating and cooling. SEC (2010) 65. Brussels: European Commission.
FAO (2009): Proceedings of the expert meeting on how to feed the world in 2050. High-Level Expert Forum on „How to feed the world in 2050”, FAO, Rome, 12-13 October 2009. http://www.fao.org/wsfs/forum2050/wsfs-background-documents/wsfs-expert-papers/en/
FAO (2011a): Looking ahead in world food and agriculture: perspectives to 2050. Edited by Piero Conforti. Agricultural Development Economics Division Economic and Social Development Department. Food and Agriculture Organization of the United Nations, 2011, Paris Pages 539 (ISBN 978-92-5-106903-5) http://www.fao.org/docrep/014/i2280e/i2280e.pdf
FAO (2011b): World Livestock 2011 – Livestock in food security. Rome: FAO.
FAO (2011c): The State of the World’s Land and Water Resources for Food and Agriculture. Summary report. Rome: FAO. http://www.fao.org/nr/water/docs/Solaw_ex_summ_web_en.pdf
Gustavsson, J. et al. (2011): Global food losses and food wastes – extent, causes and prevention. Rome: FAO http://www.fao.org/fileadmin/user_upload/ags/publications/GFL_web.pdf
Hoekstra, A.Y. et al. (2010): The water footprint of bio-energy. In: Climate Change and Water: International Perspectives on Mitigation and Adaptation. Howe, C.J., Smith, B. and Henderson, J. (eds.). London: American Water Works Association, IWA Publishing. pp. 81-95.
IWMI (2007): Water for Food, Water for Life: A Comprehensive Assessment of Water Management in Agriculture. London: Earthscan; Colombo: International Water Management Institute.
Krugman, P. (2009): “Is a New Architecture Required for Financing Food and Environmental Security?” Summary of the speech made during the launching event of the Second Forum for the Future of Agriculture. Brussels. http://www.elo.org
Oerke, E.C. (2006): Crop losses to pests. Journal of Agricultural Science. 144: 31-43.
The Earth Institute (2005): The Growing Urbanization of the World. New York: Columbia University.
Created by XMLmind XSL-FO Converter.
3. fejezet - 3. LIVESTOCK IN FOOD SECURITY1. 3.1. Livestock food in the dietAnimal source foods, a choice for many people in many societies, add taste, texture and variety to the diet. Some foods have specific social and cultural roles, such as turkey at Christmas, a duck taken as a gift on a social visit, eggs or milk given to lactating mothers, meat cooked for honoured visitors, tea with milk given to guests. Cultural norms also prohibit consumption of some foods, such as pork in Muslim and Jewish communities. Livestock contribute around 12.9% of global calories and 27.9% of protein directly through provision of meat, milk, eggs and offal, and also contribute to crop production through the provision of transport and manure.
The livestock sector globally employs 1.3 billion people, either directly or indirectly, and is responsible for up to 50% of global agriculture GDP. Malnutrition and micronutrient deficiencies cause 3.5 million to 5.5 million deaths annually in children under 5 years of age. In Africa, livestock are absolutely critical to livelihoods and to life. Animal-source foods need greater attention from those trying to help African residents during crisis. The biological value of animal-source protein is about 1.4 times that of plant foods. The most critical part is that essential amino acids and micronutrients are more bio-available in animal-source foods than from plant-based foods. Animal-source foods are critical for immune system functions, cognitive and physical development, work productivity and the span and quality of life. Research underscores the importance of livestock production to human health and food security.
In spite of recent growth in consumption, many people are still deficient in the nutrients that can be provided by animal source foods, which are complete, nutrient-dense and important for the high quality protein and bio-available micronutrients they contain, particularly for children and pregnant and lactating women. Even quite small amounts of animal source foods are important for improving the nutritional status of low-income households. Meat, milk and eggs provide proteins with a wide range of amino acids that match human needs as well as bio-available micro-nutrients such as iron, zinc, vitamin A, vitamin B12 and calcium in which many malnourished people are deficient. International dietary guidelines on levels of energy and protein consumption do not distinguish between plant and animal sources. They suggest that the intake of energy needed by an adult in a day varies from 1 680 to 1 990 kilocalories (kcals) in total, depending on the country. They also suggest that the safe level of protein consumption is about 58 g per adult per day (Table 1). “Safe” in this case is defined as the average protein requirement of the individuals in the population, plus twice the standard deviation and it is an accepted practice to refer to this measure rather than a minimum (WHO, FAO, UNU, 2007).
3.1. ábra - Table 1: Average dietary protein and energy consumption and undernourishment by region
Source: FAO (2011)
Created by XMLmind XSL-FO Converter.
3. LIVESTOCK IN FOOD SECURITY
In most parts of the world, average consumption is above the minimum recommended level of energy and the safe level of protein. However, these averages hide a significant problem of malnutrition, with 16% of people in the developing world (28% in sub-Saharan Africa) estimated to be undernourished. Energy and protein consumption are quite closely ulinked, and insufficient calorie consumption tends to go in tandem with insufficient protein consumption. Actual individual requirements depend on height, age, lifestyle and stage of life. Pregnant or lactating women, for example, need extra energy and protein. However, even the more detailed guidelines give only limited guidance about minimum requirements of livestock source food.
2. 3.2. Livestock and the food balanceLivestock make their most important contribution to total food availability when they are produced in places where crops cannot be grown easily, such as marginal areas, or when they scavenge on public land, use feed sources that cannot directly be eaten by humans, or supply manure and traction for crop production. In these situations, they add to the balance of energy and protein available for human consumption. When livestock are raised in intensive systems, they convert carbohydrates and protein that might otherwise be eaten directly by humans and use them to produce a smaller quantity of energy and protein. In these situations, livestock can be said to reduce the food balance.
In a world that is increasingly concerned with sustainable food production, ideally the contribution of livestock to the food balance should be at least neutral, making the conversion of natural resources to human food as efficient as possible while also ensuring that people still have the possibility of eating a diverse diet that includes livestock products. However, on a global scale, this is not the case and may not even be possible. It is estimated that 77 million tonnes of plant protein are consumed annually to produce 58 million tonnes of livestock protein (Steinfeld et al., 2006). The production system and the species of livestock both affect the food balance. Monogastrics such as pigs and poultry naturally eat a diet that is closer to a human one than that of ruminants. Extensive systems require animals to find a large proportion of their feed from sources not edible to humans, such as grasses and insects, grains left over from harvests and kitchen waste, while animals in intensive systems are fed concentrate feed that includes cereals, soya and fishmeal as well as roughage. Intensive poultry and pigs are the biggest consumers of grain and protein edible by humans, although both have been bred to be efficient feed converters. Intensive beef systems in feed lots convert concentrates less efficiently but can be fed partly on brewers’ waste. Intensive dairy cows are fed concentrates that enable them to produce much greater volumes of milk than they could manage from a roughage-only diet.
The systems that compete least for human food – those that primarily depend on grazing – produce only about 12% of the world’s milk and 9 % of its meat. Mixed systems in which animals eat grass and crop residues as well as concentrates produce 88% of the world’s milk and 6% of its meat. The most intensive industrial livestock systems are termed “landless” because the animals themselves occupy little land – they are kept in controlled environments and can be housed almost anywhere. These systems produce 45% of the world’s meat, much of it from poultry and pigs, and 61% of the world’s eggs (FAO, 2009).
Since livestock have an important role in protein production, it serves as a valuable exercise to consider the effect of livestock production systems on the available balance of human-edible protein. The trend fits with what common sense might suggest: the countries with the most concentrated and intensive systems have an output/input ratio of below or near one (1), meaning that the livestock sector consumes more human-edible protein than it provides, while those countries with a predominance of extensive ruminants have considerably higher ratios, meaning that they add to the overall supply of protein. Reducing the amount of human-edible food needed to produce each kilogram of livestock source food processed through livestock would be a valuable contribution to food security. There are two ways that this might be done: i) produce a larger percentage of the world’s livestock protein within grazing and low intensity mixed systems, leaving more plant protein to be eaten by humans, or ii) recycle more waste products, including agro-industrial by-products, through animals.
Livestock products supply around 12.9% of calories consumed worldwide and 20.3% in developed countries. Even more important, perhaps, is their contribution to protein consumption, estimated at 27.9% worldwide and 47.8% in developed countries (FAO, 2009b). The availability of livestock products worldwide and within nations is determined by the volume of production and the scale and reach of international trade. During the past 40 years global production of meat, milk and eggs has grown steadily (Table 2). While the global supply of livestock products has more than kept up with the human population expansion, the situation has not been the same in all regions. Production levels have expanded rapidly in East and Southeast Asia, and in Latin America and the Caribbean, but growth in sub-Saharan Africa has been very slow. There is also considerable variation within the developing world, with sub-Saharan Africa and South Asia producing at much lower levels per
Created by XMLmind XSL-FO Converter.
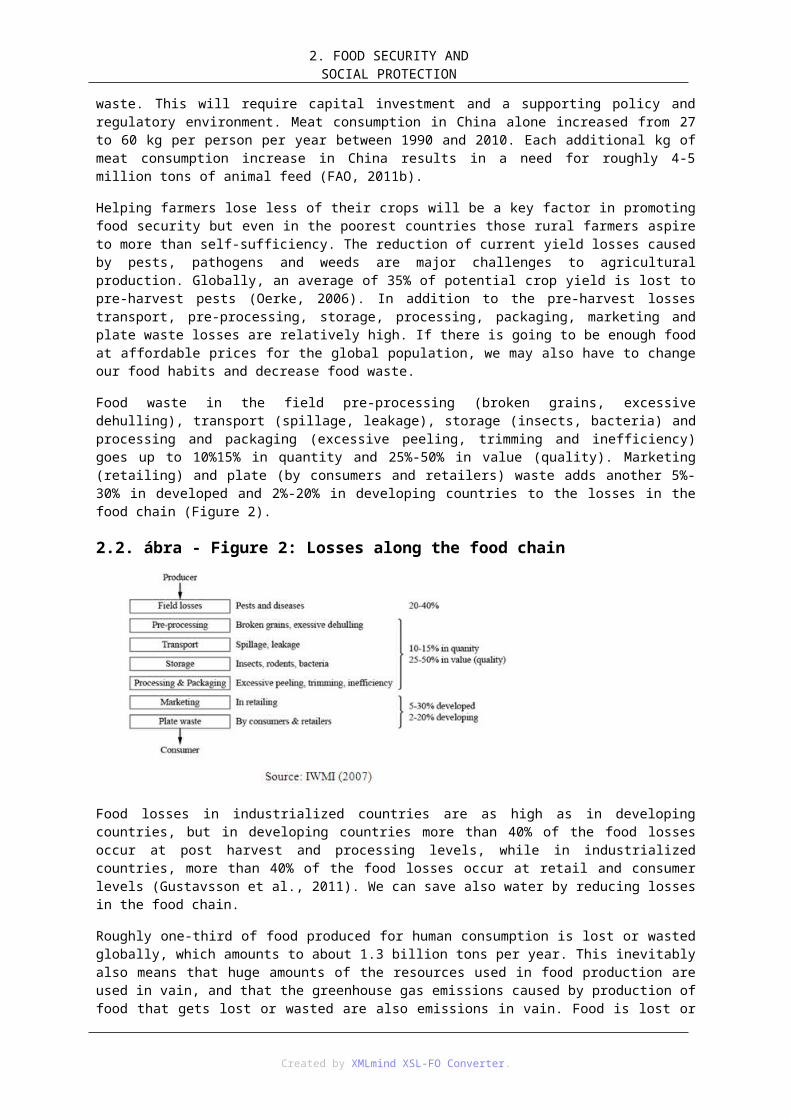
3. LIVESTOCK IN FOOD SECURITY
person than Latin America and the Caribbean. Export trade, which in 1967 was relatively small and dominated by Europe, has not only expanded greatly, it has diversified, with the Americas becoming the dominant exporter of poultry meat, Asia taking a growing share of egg and poultry meat trade, and Oceania showing strong growth in milk and ruminant meat exports.
3.2. ábra - Table 2: Changes in global livestock production total and per person 1967 to 200
Source: FAO (2011)
There is a large gap in self-sufficiency in livestock products between the developed and the developing regions. Oceania is a major net exporter of ruminant meat and milk, including exports of live sheep, many to the Middle East and North Africa. The Americas are increasingly net exporters of pig and poultry meat, Europe is self-sufficient in some products and a minor net importer of others, and Africa is a net importer of almost all livestock products. Within regions, some countries stand out as major producers and net exporters while others are net importers and rely on trade to make livestock products available in their domestic markets. For example, Asia as a whole is barely self-sufficient in poultry meat, but Thailand has been among the top ten exporters, and China is a major producer with a growing export market. Within the Americas, the USA and Brazil stand out as exporters of livestock products while some of the smaller countries are net importers. The biggest milk powder importers are oil exporters such as Mexico, Algeria, Venezuela and Malaysia, and the fast-growing economies of India, the Philippines and Thailand (Knips, 2005). In China, domestic milk production has risen but still has not been able to keep up with rising demand as domestic milk consumption has increased even faster. As a result, milk powder imports have risen rapidly to meet demand. North Africa, which has experienced rapid income growth in the past few years, has become a large importer of milk powder to meet increased demand for dairy products.
3. 3.3. Livestock contributing to crop productionIn addition to contributing directly to food supply through provision of their own products, livestock contribute indirectly by supporting crop production with inputs of manure and traction. In both cases, their contribution is greatest in developing countries. In the developed world, the use of traction has fallen to almost nothing, and the manure produced by livestock raised for food is more than can be used conveniently on local cropland.
Draft power from working animals has reduced human drudgery, allowed cropping areas to be expanded beyond what can be cultivated by hand, and made it possible to till land without waiting for it to be softened by rain which gives farmers more flexibility in when they plant crops. In spite of this, a recent review (Starkey, 2010) indicates that the number of working animals in the world has probably fallen from 300-400 million in the 1980s to 200-250 million today. In Western Europe and North America, the use of animal power has almost disappeared since WW II other than for specialized uses and in traditional communities, such as the Amish in North America. In Eastern Europe, it is steadily decreasing as tractors become more affordable and available and farm sizes shrink.
In much of South and Southeast Asia, draught animals are being replaced by mechanization. In Central and South America, oxen and horses remain common on smallholder farms in spite of increasing adoption of tractors, and animal drawn carts are quite widely used for rural and urban transport. The traditional use of pack llamas has declined greatly but donkeys remain important in the Andes and in Mexico. Animal traction also remains important for agriculture and for transport in Haiti and the Dominican Republic, although motorcycles, three-wheelers and power tillers may eventually reduce demand. Throughout the world, even in countries where the number of work animals is falling, pockets of use remain in remote and poor communities, where livestock
Created by XMLmind XSL-FO Converter.
3. LIVESTOCK IN FOOD SECURITY
make an important contribution to livelihoods.
The potential contribution of animal manure to crop production is well understood although there is no convenient global database to summarize its current contribution. It is easier to determine the extent of artificial fertilizer use, which is expected to double in developing countries by 2020 (Bumb and Baanante, 1996). In developed countries, it has been suggested that only about 15% of the nitrogen applied to crops comes from livestock manure. The relationship between manure and food production is interesting and complex. It is a valuable input, but also a comparatively inconvenient one. Manure is known to be better than artificial fertilizer for soil structure and long-term fertility. Its greatest value can be seen in developing countries, where small-scale farmers report that they do not have enough manure to apply to their crops (Jackson and Mtengeti, 2005) and exchange of grain and manure occurs between settled farmers and pastoralists (Hoffman and Mohammed, 2004). The distance that manure is sometimes transported attests to its perceived value. For example, chicken manure is reportedly transported 100 km or more in Viet Nam.
It also has multiple uses for household fuel, construction and biogas production as well as fertilizer, although these are not being fully exploited. At the same time, it is less convenient to handle than artificial fertilizer, has variable quality, and the reduction in animal traction in many countries has also reduced the availability of this resource. In countries where the livestock sector is dominated by large-scale intensive production, manure can be as much a problem as a benefit. For example, the EU and Canada have strict rules and detailed guidelines about storage, processing and application of animal waste to avoid pollution of runoff water and the build-up of heavy metals in the soil. The extent to which livestock manure is applied to crops is a question of economics, logistics and regulation. There is evidence that using manure on small- to medium-sized mixed farms has economic viability (Bamire and Amujoyegbe, 2004). However, storage needs, transport requirements and the relative locations of livestock and crops all affect the cost and convenience of applying manure, as do government regulations on nutrient management (Kaplan et al., 2004). The goal is to use more of these nutrients directly in agriculture (Steinfeld et al., 2010).
4. 3.4. Stability of food suppliesFood security can be compromised when crops and livestock are destroyed or market chains disrupted, cutting off supplies, or when economic crises or loss of livelihoods abruptly reduce access to food. Wars and conflicts, economic crises, fires, floods, droughts, earthquakes, tsunamis and major epidemic diseases have all destabilized food security, sometimes affecting both supply and demand. Long global food chains and the dominance of some exporting countries mean that local problems can have regional or global effects (Stage et al., 2010). Resilient food systems have inbuilt factors that help stabilize them or help them recover from instability. Livestock contribute in a number of ways to the food stability of their owners and the nations where they are produced. However, they are vulnerable to disease and natural disasters and, if these effects are not addressed, the beneficial effect of livestock on the stability of food supplies will be reduced.
At global and national levels, the livestock sector can provide a buffering effect for food system stability. In a severe economic crisis, global consumption and production of meat falls, thus freeing cereal grains for other uses and damping down price shocks for staple foods (FAO, 2009b). Nationally, livestock production for domestic use can contribute to food security by buffering countries against problems with international food supplies. Livestock exports also have the potential to make an important contribution to the national balance of payments for countries that are net exporters. International trade can make an important positive contribution to food security but it exposes countries to volatility in international markets. Additionally, export subsidies and tariff and non-tariff barriers of both developed and developing countries bring cheap, subsidized imports into developing country markets. It is said that small-scale livestock producers cannot match the higher quality and lower prices of imported products and are squeezed out of their traditional markets (Costales et al., 2005).
While livestock contribute to food stability, livestock systems face threats to their own stability. One aspect of vulnerability is manifested in the effects of long-term trends associated with climate change, the increasing need to find renewable forms of energy and the growing human population displacing grazing livestock systems. Recurring droughts in the Horn of Africa have forced poor pastoralists and agro-pastoralists to sell animals that they might not normally choose to sell, to diversify their herds (Pavanello, 2010).
5. 3.5. Economic factors affecting choice of livestock source foods
Created by XMLmind XSL-FO Converter.
3. LIVESTOCK IN FOOD SECURITY
Livestock source foods are a choice for many people in many societies, as well as a valuable source of nutrition. However, their place in the household diet depends not just on preference but also on their affordability. This is affected by household income levels and the proportion of household income allocated to different kinds of food, and by the price of livestock source foods compared to crop-based alternatives.
Global statistics show that livestock source foods are fairly income elastic. As income levels have risen and urbanization increased, diets have changed. Demand for livestock products has diversified, consumption of livestock products has increased, and wheat and vegetable oils have been substituted for traditional foods such as cassava, maize and lard. Consumption of animal source foods is uneven across countries, regions and income levels, although the general trend is upwards. While developed countries have seen a slow growth in consumption from a very high base, the picture in the developing world has been more varied. In East and Southeast Asia and particularly China, where economic growth and poverty reduction have been strongest, there has been a strong growth in consumption of livestock products. The countries within these regions that have higher per person incomes, such as Malaysia, Thailand and the Philippines, also have relatively high per person meat consumption (Costales, 2007).
Livestock source foods are rarely listed among household staples. They are more expensive than the grains and starches that provide the basic energy supply and often more expensive than plant-source protein such as lentils or beans. High prices depress consumption levels of livestock products. Worldwide prices of food in general, including livestock source foods, were about 40% lower in the mid-1990s and early-2000s than they are today and a little more stable. In recent years, increasing grain prices have had a double impact on livestock – they have raised the price of staple cereals, reducing people’s purchasing power and, at the same time, raised the cost of livestock feed. Interestingly, during the 2007-08 global economic crisis, meat prices increased less than cereal or dairy product prices, but still the growth of demand for livestock products slowed. In richer countries, this manifested as a change to cheaper cuts of meat, affecting people’s lifestyle but not their food security. In poorer countries, there has been some substitution of crops for livestock protein. Fish are also an important protein source and farmed fish, being efficient converters of feed, are a growing competitor to livestock. It is challenging to balance the need of producers to make a living with consumers’ need for affordable food.
Access to livestock source foods is facilitated by the connections that producers and consumers have to markets for livestock products, which range from selling to one’s neighbour over the fence to supplying supermarkets in distant cities through integrated market chains. Good market access increases the food security of producers through assured income and the food security of consumers by ensuring that food products will be locally available when needed. Small-scale producers, pastoralists and poor consumers do the bulk of their trading through informal markets and often close to home. Formal markets are almost non-existent in remote areas, and rural livestock producers face long distances, poor road networks and high transactions costs (Costales et al., 2005). These factors encourage producers to consume at home and sell milk, meat and eggs in local marketplaces. Closer to town, peri-urban livestock producers have the advantage of proximity to a wider range of markets, so the prices they fetch for their produce are higher. However, they still face barriers to entering formal markets due to requirements to meet consistent quality standards and volume, and for certification of product safety. There is also, sometimes, an assumption that formal markets will ensure safer food for consumers.
The relative price of livestock protein and substitute proteins also affects the demand for livestock products. The biggest direct competitor is fish, which is estimated to provide 22% of the protein intake in sub-Saharan Africa and 50% or more in some small island developing states and some other countries. In the past 20 years, fish consumption per person has remained fairly stable while consumption of livestock products has grown, but this could change if relative prices change (FAO, 2008).
With marine stocks dwindling and caught sea fish more expensive, sea and inland aquaculture have become more important. Marine aquaculture production grew from 16.4 to 20.1 billion tonnes between 2002 and 2006, and inland aquaculture from 24 to 31.6 billion tonnes during the same period with two-thirds of all production in China. Aquaculture is now estimated to be responsible for almost 50% of fish consumption and it is set to overtake capture fisheries as a source of food fish (FAO, 2010). Some farmed fish are highly efficient feed converters of the same feeds used for livestock (fishmeal, soya and cereals), take little space and, in some cases, do not require fresh water. There are problems associated with intensive rearing such as contamination of the marine environment with algae, over-use of antibiotics, overfishing to provide low-value catch fish as feed, and contamination of fish with toxic chemicals.
Meat produced “in vitro” (artificially) offers a possible future competitor to meat from animals for those who wish to consume meat sustainably or have concerns about animal welfare. It has the potential advantages of
Created by XMLmind XSL-FO Converter.
3. LIVESTOCK IN FOOD SECURITY
using less water and energy and being more welfare-friendly than rearing animals, but the technology has some way to go before it can produce marketable meat. Current techniques involve growing cultures from stem cells of farm animals into 3-dimensional muscle structures. Stem cells are currently obtained from muscle removed by biopsy and multiplied in culture, although it may in time be possible to maintain an independent stock of stem cells. It is difficult to bulk up the cells, as each cell only divides a certain number of times, and while growth media not containing animal products are available, they are expensive (Jones, 2010). The resulting meat has poor texture and will need to have fat cells grown together with the muscle to improve its taste as well as added micronutrients before it is viable as a meat substitute. It is also expensive to produce, costing between USD 300 per tonne and USD 500 per tonne (The In Vitro Meat Consortium, 2008). However, this is a relatively new technology with relatively little spent on research thus far. Within the next 40 years, it may well become a part of the diet for some consumers.
Voluntary lifestyle choices, particularly by wealthier consumers, could result in consumption of fewer livestock products, particularly red meat. The newly wealthy have tended to eat more livestock products, particularly red meat and fatty foods, while some of the established wealthy tend to gradually diversify their dietary habits towards different cuisines and sources, “green” products and healthier diets. Any changes to diet are likely to be driven primarily through education, choice and exposure to healthy food. Demographic and economic trends may act to keep livestock consumption at the forecast levels, while production costs and competition particularly from fish are likely to dampen consumption growth for livestock products. For the time being, it seems wise to assume that by 2050 the demand for meat may grow by as much as 1.7 times and for milk by 1.6 times, as projected, and to consider whether it is feasible to produce that much.
The growth in production that took place during the livestock revolution was largely a result of an increase in the number of animals. Demand grew so fast that it was difficult for productivity improvements to keep up. Now, it is hard to envisage meeting projected demand using the same level of natural resources that they currently use. Part of any increase will need to be driven by efforts to convert more of the existing natural resources into food on the plate. In other words, efficiency needs to increase or there is a need to reduce waste of natural resources. In both cases, the end point is the same, but focussing on waste puts a spotlight on what is thrown away and might be recycled. Waste occurs throughout livestock food systems. It can be due to production inefficiency resulting from disease or poor feeding. It also can result from loss of food between production and the plate, which may amount to as much as 33% for all global food production (Stuart, 2009). Food lost at or near the point of consumption, because of food safety and quality requirements, is a problem, but it will not be addressed here because there is little that the livestock sector can do about it. Losses that occur on the farm or in marketing and primary processing of livestock commodities are within the influence of the livestock sector and therefore will receive more attention.
Losses occur in marketing because of the long distances that animals and products must be transported. Poor roads and often the need to pass through conflict areas make it hard to provide reliable transportation. Animals travelling in poorly designed lorries without adequate water lose weight, suffer dehydration and bruising, and may die. Milk is in danger of spoilage unless local coolers and refrigerated trucks are available. If prices are low or transport unavailable, any excess milk that cannot be consumed by calves or people will be wasted. There are technical solutions to these problems when a demand exists for the product. Milk coolers and alternative forms of preservation have been provided in remote places in Africa rest stops have been built where animals can be given water, and lorries are available that improve animal welfare during transport. The challenge is to find funds to invest in the necessary infrastructure and technology (FAO, 2005).
If a larger percent of the world’s livestock protein were produced within grazing and low-intensity mixed systems, would this leave more plant protein to be eaten by humans? The reality is not that simple. The main problem of food security is not currently one of supply but of demand. The about 900 million undernourished people are not undernourished because the global food supply is deficient, but because they cannot afford to buy food or they live in places or societies where it is hard to obtain. Reducing the grain fed to livestock would not ensure that these people could access food. Neither would it automatically result in more plant protein being grown, as it might reduce the prices for those commodities to a level where it would be less attractive to grow them, although the higher number of people to be fed and increasing resource pressure may change this in future. Intensive systems also have economies of scale that make it possible to produce livestock protein in large quantities relatively cheaply, an important consideration for growing urban populations. The less intensive systems are an excellent option to supply food to rural populations with access to short food chains, or to consumers who can afford to buy “green” products, but they are less practical for the majority of city populations.
From a food security perspective, an emphasis on markets is critical for livestock-dependent societies. Ranchers
Created by XMLmind XSL-FO Converter.
3. LIVESTOCK IN FOOD SECURITY
and governments in developed countries are very well aware of this. In pastoralist systems, innovative approaches to improving access to markets for live animals and livestock products are essential and so are programmes to pay for environmental services.
Together, these can be an incentive to reduce production and transport losses, and provide livestock-dependent communities with the means to co-finance animal health, pasture management and better transport facilities. Small-scale mixed farmers are efficient at using and recycling natural resources. Their animals eat crop residues, kitchen scraps, snails and insects. They grow forage at the edge of crop fields or around houses, or cut and carry it from communal grazing areas, forests or the side of the road. Mixed farming is probably the most environmentally benign agricultural production system and it has a great deal to contribute to minimizing waste, especially with all of the opportunities it offers for nutrient recycling. Given the number of small scale mixed farms, if most of them increased their efficiency by even a small amount, it would be beneficial for the global food supply and food security.
Much of the future demand for livestock products, particularly for urban populations, will have to be met by integrated value chains served by intensive medium- and large-scale production units with the potential to increase production per animal, per unit of land and per unit of time. These food systems are economically competitive but can be highly wasteful of natural resources. However, they do have the potential to improve. A large part of the loss is at the retail end of the value chain, to meet the demands placed on supermarkets and fast-food retailers for quality and freshness (Stuart, 2009). Feeding waste food to animals is severely restricted in developed countries because of concerns about the safety and variable quality of the waste. Livestock source food is not safe to feed to animals unless very thoroughly processed, because of the risk of disease spread.
Food safety crises are frequent causes of waste in developed country food chains, examples being the 2009 withdrawal of ground beef from California markets because of e-coli contamination, the 2010 contamination of milk products by melamine in China and the 2011 contamination of eggs by dioxin in eggs in Germany. There is constant upgrading of safety management throughout food chains but since consumers and retailers pursue a near-zero risk policy, this kind of waste will always exist to some extent. Moving further down the chain, there is waste during slaughter and processing. Some of this is due to parts of the animal or whole carcases being condemned or downgraded for health reasons or bruising (Martinez et al., 2007). Investment in animal health and welfare can prevent some of these losses. At the farm, greater use of the agro-industrial by-products that make up part of animal feed could reduce the amount of human-edible food fed to livestock. Intensive livestock in the emerging economies make quite effective use of agro-industrial by-products.
Feeding and health systems are also important to exploit the genetic potential for feed conversion. Therefore another way to limit waste is to ensure that all farmers move closer to the standards set by the most productive. Ruminant systems still have some potential to increase their productivity through breeding, particularly if the balance of grain to roughage can be reduced (Thornton, 2010). Some would argue that feedlot cattle are fed too much grain for their own health or for optimum productivity. Animal welfare standards, which are becoming more demanding in developed countries, may increasingly influence the limits on feed conversion and other productivity improvements. For example, larger battery has to be used for egg production in the EU since 2012, and the use of bovine somatotrophin has been banned there for several years.
6. Questions1. Livestock food in the diet?
2. Livestock and the food balance?
3. Indicators of livestock’s importance?
4. Economic factors affecting choice of livestock source foods?
5. Livestock contributing to crop production?
6. Global fisheries and aquaculture?
7. ReferencesBamire, A.S. and Amujoyegbe, B.J. (2004): Economics of poultry manure utilization in land quality
Created by XMLmind XSL-FO Converter.
3. LIVESTOCK IN FOOD SECURITY
improvement among integrated poultry-maize-farmers in South-western Nigeria. Journal of Sustainable Agriculture, 1540-7578, 23(3) 2004, 21-37 Nigeria.
Bumb, B. and Baanante, C. (1996): World trends in fertilizer use and projections to 2020, 2020 Brief No. 38. International Food Policy Research Institute, Washington, D.C., 1996.
Costales, A., Otte, J. and Upton, M. (2005): Smallholder livestock keepers in the era of globalization. PPLPI Research Paper. Rome, Pro-Poor Livestock Policy Initiative, FAO.
Costales, A. (2007): Pig systems, livelihoods and poverty: current status, emerging issues and ways forward. PPLPI Research Report. Rome, Pro-Poor Livestock Policy Initiative, FAO.
FAO (2005): Benefits and potential risks of the lactoperoxidase system of raw milk preservation. Report of an FAO/WHO technical meeting. FAO Headquarters, Rome, Italy, 28 November - 2 December, 2005
FAO (2008): The state of world fisheries and aquaculture 2008. FAO Fisheries and Aquaculture Department, Rome, 2009 ftp://ftp.fao.org/docrep/fao/011/i0250e/i0250e01.pdf
FAO (2009): Livestock in the balance. State of food and agriculture 2009. FAO Rome.
FAO (2010): The state of world fisheries and aquaculture. Rome, FAO. 2010.
FAO (2011): World livestock 2011 – livestock in food security. Rome, FAO.
Hoffmann, I. and Mohammed, I. (2004): The role of nomadic camels for manuring farmer’s fields in the Sokoto close settled zone, northwest Nigeria. Nomadic peoples 8(1).
Jackson, H.L. and Mtengeti, E.J. (2005): Assessment of animal manure production, management and utilization in Southern Highlands of Tanzania. Livestock research for rural development. 17(10) (available at http://www. lrrd.org/lrrd17/10/jack17110.htm).
Jones, N (2010): A taste of things to come. Nature 468, 752-753 2010 (available at http://www.nature.com/news/2010/101207/full/468752a.html)
Kaplan, J.D., Johanssen, R.C. and Peters, M. (2004): The manure hits the land: economic and environmental implications when land application of nutrients is constrained. Amer. J. Ag. Econ. 86(3) (August 2004) 688-800
Knips, V. (2005): Developing countries and the global dairy sector: part 1: global overview: pplpi working paper no. 30. Rome, Pro-Poor Livestock Policy Initiative, FAO.
Martínez, J., Jaro, P.J., Aduriz, G., Gómez, E.A., Peris, B. and Corpa, J.M. (2007): Carcass condemnation causes of growth retarded pigs at slaughter. The Veterinary Journal 174 (1), July pp 160-164.
Pavanello, S. (2010): Livestock marketing in Kenya-Ethiopia border areas: A baseline study. HPG Working Paper. July 2010. Humanitarian Policy Group. London, UK. http://www.odi.org.uk/sites/odi.org.uk/files/odi-assets/publications-opinion-files/6054.pdf
Stage, J., Stage, J. and McGranahan, G. (2010): Is urbanization contributing to higher food prices? Environment & Urbanization Vol 22 (1): 199–215. DOI: 10.1177/0956247809359644.
Starkey, P. (2010): Livestock for traction: world trends, key issues and policy implications. AGA working paper series. Rome, FAO. http://www.healingharvestforestfoundation.org/uploads/1/7/0/8/17089550/livestock-for-traction.pdf
Steinfeld, H., Gerber, P., Wassenaar, T., Castel, V., Rosales, M. and De Haan, C. (2006): Livestock’s long shadow: environmental issues and options. Rome, FAO.
Steinfeld, H., Gerber, P. and Opio, C. (2010): Responses on environmental issues. In: H. Steinfeld, H. Mooney, F. Schneider & L. Neville, eds. Livestock in a changing landscape, Vol. 1: Drivers, consequences, and responses. Washington, DC, Island Press.
The In Vitro Meat Consortium (2008): Preliminary Economics Study. Project 29071 V5 March 2008. http://invitromeat.org/images/Papers/invitro%20meat%20economics%20study%20v5%20%20march%20 08.pdf
Created by XMLmind XSL-FO Converter.
3. LIVESTOCK IN FOOD SECURITY
Thornton, P. (2010): Livestock production: recent trends, future prospects. Phil. Trans. R. Soc. B 2010 365, 2853-2867.
Stuart, T. (2009): Waste: Uncovering the global food scandal. London, Penguin Books.
WHO, FAO and UNU (2007): Protein and amino acid requirements in human nutrition (PDF). WHO Press http://whqlibdoc. who.int/trs/WHO_TRS_935_eng.pdf.
Created by XMLmind XSL-FO Converter.
4. fejezet - 4. TENSION BETWEEN FOOD, ENERGYAND ENVIRONMENTAL SECURITYIntroduction
In the last 35 years global energy supplies have nearly doubled but the relative contribution from renewables has hardly changed at around 13%. Global energy demand is increasing, as is the environmental damage due to fossil fuel use. Continued reliance on fossil fuels will make it very difficult to reduce emissions of greenhouse gases that contribute to global warming. Experts warn that greenhouse gas (GHG) emissions must peak before 2020 to avoid unacceptable risks.
With world population expected to reach 9 billion people before 2050, higher food, feed and fibre demand will place an increasing pressure on land and water resources, whose availability and productivity in agriculture may themselves be under threat from climate change. The additional impact on food prices of higher demand for crops as energy feedstock is of real concern. Since biomass can substitute for petrochemicals too, higher oil prices will trigger new non-energy demands on bio resources as well (FAO, 2009).
Bioenergy currently provides roughly 10% of global supplies and accounts for roughly 80% of the energy derived from renewable sources. By far the largest element of the bioenergy sector globally is wood used for cooking and heating in developing countries. The “new” renewables (e.g., solar, wind, biofuel) have been growing fast from a very low base, but their contribution is still marginal of the global renewable supply but continuously growing. Bioenergy has the potential to play an increasing but modest role in ensuring future global energy demand keeping in perspective the relative significance of the renewables sector in the overall energy mix. Bioenergy was the main source of power and heat prior to the industrial revolution. Since then, economic development has largely relied on fossil fuels. A major impetus for the development of bioenergy has been the search for alternatives to fossil fuels, particularly those used in transportation. The renewed interest in biofuel is driven by a range of considerations, including climate change and the potential economic contribution of the development of the biofuel industry in terms of income and employment.
The development of biofuels has been one of the most visible and controversial manifestations of the use of biomass for energy. Biofuels policies in the EU, US and Brazil have been particularly important for the development of the industry in these important markets where a variety of measures, including consumption mandates, tax incentives and import protection to promote the production and use of biofuels have been used. Despite this, the EU and US may run into difficulties in meeting consumption mandates for biofuels. Furthermore, an ongoing debate about the benefits of reliance on biofuels derived from food crops and concern about the efficacy of current biofuels policies may contribute to the doubts of future policy. Brazil has liberalised its domestic ethanol market and adopted a more market-oriented approach to biofuels policy, but the management of domestic petroleum prices and the inter-relationship between the sugar market and ethanol production are important factors affecting domestic consumption and exports.
While biofuel has the potential to be more environmentally friendly in terms of reduced GHG emissions, it may have unintended negative environmental consequences, particularly relating to changes in land use. Characterizing and quantifying the relationship between biofuel production and the environment poses a considerable challenge. Much of the focus has been on the implications of expanded use of biofuels and there are concerns that the accounting of environmental effects remains incomplete. In combination with an improved assessment of the effects of indirect land use change and an expansion of sustainability criteria to biomass production in general (and not only to biofuels) could help in integrating energy, agricultural, environmental and international trade policies to develop renewable energy in a sustainable way.
Waste biomass and crops with high energy yields that do not compete for prime cropland are more promising bioenergy feedstocks than food crops. Still, constrained land capacity relative to potential demands means that bioenergy can only be part of the solution. A broader, more integrated approach is needed to energy policy, embracing all renewable energies that reduce GHG emissions without serious side-effects. Governments should maximize their efforts to reach global consensus on emissions targets and reduction of fossil fuel subsidies.
Created by XMLmind XSL-FO Converter.
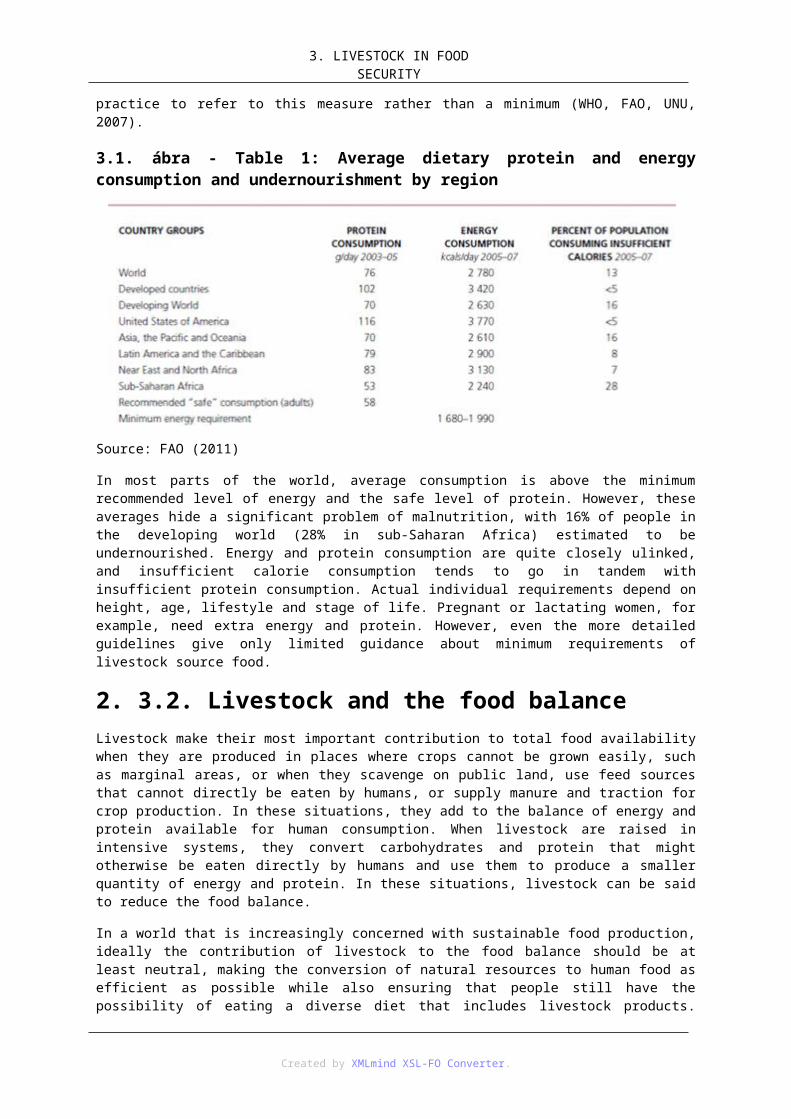
4. TENSION BETWEEN FOOD, ENERGYAND
ENVIRONMENTAL SECURITY
1. 4.1. Food securityWorld population will continue to expand with a virtually certain 30% increase in the next 40 years. This increased population density, coupled with changes in dietary habits in developing countries towards high quality food (e.g. greater consumption of meat and milk products) and the increasing use of grains for livestock feed, is projected to increase demand for food production increase by 70% by 2050 (FAO, 2011a). A majority of this increase will occur in undeveloped and developing regions of the world. Many of these areas are currently suffering from food and water shortages and projections are that future shortages will become more serious. Because of economic realities, many people in these regions cannot afford food imports from developed nations. Meeting the basic human need for food (daily caloric intake) will depend upon agricultural production increases in regions currently experiencing food shortages to balance the increasing demand expected from a growing population. Anticipated climate changes will likely make this a difficult scenario to fulfil, at least without substantial outside investment in both improved management practices, technology, and infrastructure (such as irrigation).
In developing countries, the increase in middle class is occurring at record rates and with this increase comes rapidly improving diets that amplify demands for both food/feed quantity and quality, especially increased demand for meat and dairy products. The increased demand for meat products in particular will amplify the demand for grain production on agricultural land. Cattle, for example, require approximately 8 kg of feed to produce 1 kg of meat; as meat consumption increases, land area required to feed livestock increases dramatically compared to land area needed to feed a population that is dominantly vegetarian. In addition to growing demands for agriculture food products, increased use of traditional food and/or feed for non-food products, such as corn grain for ethanol, is reducing food/feed supplies.
With rising demand and a marginal ability to meet that demand, especially in some regions, food price and price stability are vulnerable to small production shocks such as those due to abnormal climate events. Not only will the risk of food shortages rise for a variety of reasons discussed in this paper, the cost of food that is available may be increasingly unaffordable to the less-affluent people of the world. Food price and availability have had, and will likely have, impacts beyond those living in poverty. High food prices and food shortages have been implicated in political unrest in multiple countries in recent years, with concerns that these situations could become more prevalent. The need for an efficient, stable, and highly productive agricultural industry is critical.
Land use for food and feed are typically determined by global diet and agricultural yield improvements. With respect to diet, consumption of meat and dairy products is an important driver for land use since meat and dairy use a lot more basic agricultural production than does the consumption of grain. Livestock products imply an inefficient conversion of calories of the crops used in livestock feeds. On average, 6 kg of plant protein is required to yield 1 kg of meat protein. By 2050 an expanded world population will be consuming two thirds more animal protein than it does today, bringing new strains to bear on the planet's natural resources. Meat consumption is projected to rise nearly 73% by 2050; dairy consumption will grow 58% over current levels.
The surge in livestock production that took place over the last 40 years resulted largely from an increase in the overall number of animals being raised. Meeting projected demand increases in production will need to come from improvements in the efficiency of livestock systems in converting natural resources into food and reducing waste. This will require capital investment and a supporting policy and regulatory environment. Meat consumption in China alone increased from 27 to 60 kg per person per year between 1990 and 2010. Each additional kg of meat consumption increase in China results in a need for roughly 4-5 million tons of animal feed (FAO, 2011b).
Helping farmers lose less of their crops will be a key factor in promoting food security but even in the poorest countries those rural farmers aspire to more than self-sufficiency. The reduction of current yield losses caused by pests, pathogens and weeds are major challenges to agricultural production. Globally, an average of 35% of potential crop yield is lost to pre-harvest pests (Oerke, 2006). In addition to the pre-harvest losses transport, pre-processing, storage, processing, packaging, marketing and plate waste losses are relatively high. Roughly one-third of the edible parts of food produced for human consumption, gets lost or wasted globally. We can save also water by reducing losses in the food chain.
2. 4.2. Energy securityThe use of fossil fuels by agriculture has made a significant contribution to feeding the world over the last few decades. The food sector accounts for around 30% of global energy consumption and produces over 20% of
Created by XMLmind XSL-FO Converter.
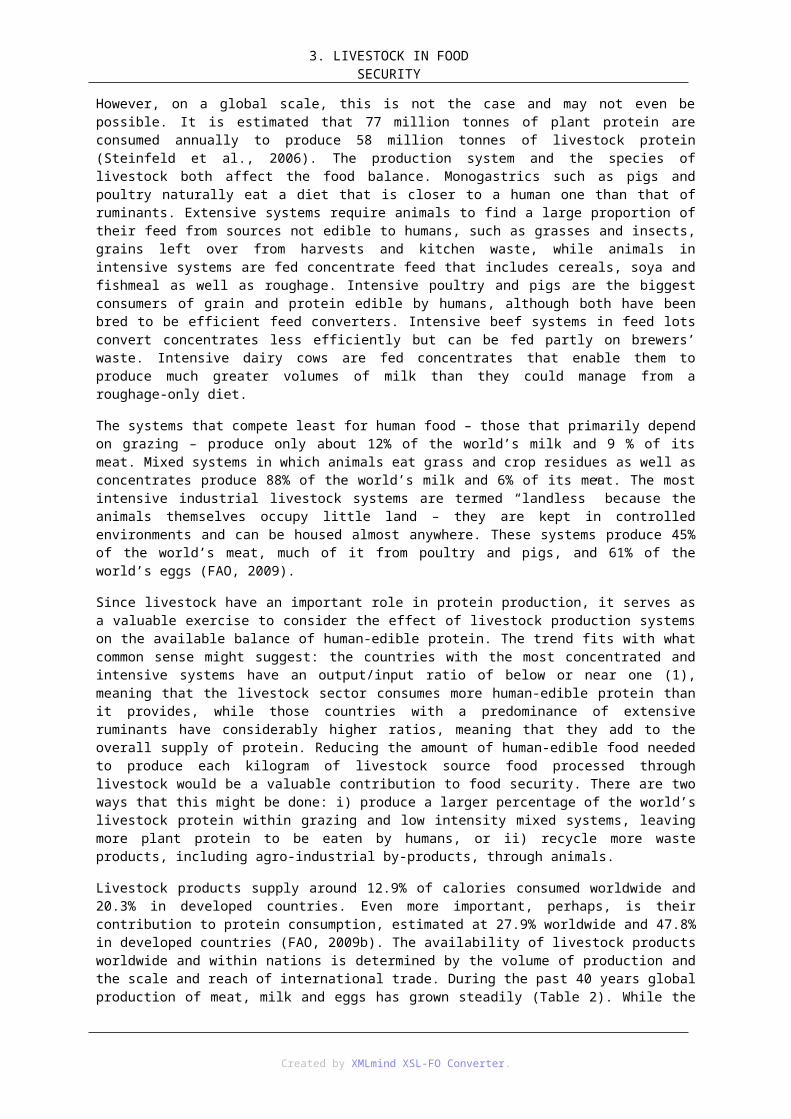
4. TENSION BETWEEN FOOD, ENERGYAND
ENVIRONMENTAL SECURITYglobal greenhouse gas (GHG) emissions. Around one-third of the food we produce, and the energy that is embedded in it, is lost or wasted. The energy embedded in global annual food losses is around 38% of the total final energy consumed by the whole food chain (Gustavsson et al., 2011). Due to high dependence of the global food sector on fossil fuels the volatility of energy markets can have a potentially significant impact on food prices, and this would have serious implications for food security and sustainable development (IPCC, 2011). Rising energy prices may cause spillovers into food markets leading to increasing food insecurity. Furthermore, any increase in the use of fossil fuels to boost production will lead to greater GHG emissions, which the global community has pledged to reduce.
The food sector can adapt to future energy supply constraints and to the impacts of climate change with rapid deployment of energy efficiency and renewable energy technologies (FAO, 2011d). Global primary energy demand is projected to increase of over 35% in 2035. On a global basis, it is estimated that renewable energy accounted for 13% of the total primary energy supply in 2008 (IEA Bioenergy, 2009). The largest contributor to renewable energy with 10% points was biomass.
2.1. 4.2.1. Bioenergy potentialConcern about energy security, the threat of climate change and the need to meet growing energy demand (particularly in the developing world) all pose major challenges to energy decision makers. Advancing the low-carbon technology revolution will involve millions of choices by a myriad of stakeholders. Overall, the global share of biomass has remained stable over the past two decades, but in recent years a sharp decline in share can be observed in China due to a rapid growth of total energy consumption and a steady increase of all types of biomass (for electricity, heat and biofuels) in the EU.
Biomass is a versatile energy source – it can be stored and converted in practically any form of energy carrier and also into biochemicals and biomaterials from which, once they have been used, the energy content can be recovered to generate electricity, heat, or transport fuels. The worldwide potential of bioenergy is limited because all land is multifunctional and land is also needed for food, feed, timber and fibre production, as well as for nature conservation and climate protection. In addition, the use of biomass as an industrial feedstock (e.g. plastics) will become increasingly important. Biomass can include land- and water-based vegetation (e.g., trees, algae), as well as other organic wastes.
Bioenergy is the largest single source of renewable energy today and has the highest technical potential for expansion amongst renewable energy technologies. In 2008, biomass provided about 10% (50.3 EJ/year) of the global primary energy supply (IEA Bioenergy, 2009). More than 80% of the biomass feedstocks are derived from wood (trees, branches, residues) and shrubs. The remaining bioenergy feedstocks came from the agricultural sector (energy crops, residues and by-products) and from various commercial and post-consumer waste and by-product streams (biomass product recycling and processing or the organic biogenic fraction of municipal solid waste.
3. 4.3. Environmental impact: land use change and greenhouse gas emissionAbout 84% of current CO2 emissions are energy-related and about 65% of all greenhouse-gas emissions can be attributed to energy supply and energy use. All sectors (buildings, transport, industry and other) will need to reduce dramatically their CO2 intensity if global CO2 emissions are to be decreased by 50 to 85% below 2000 levels by 2050. Energy-related carbon-dioxide (CO2) emissions in 2010 are estimated to have climbed to a record 30.6 Gigatons (Gt) and concentrations have continued to grow to over 390 parts per million (ppm) CO 2 or 39% above pre-industrial levels. The Cancun Agreements call for limiting global average temperature rises to no more than 2°C above pre-industrial values. In order to be confident of achieving an equilibrium temperature increase of only 2°C to 2.4°C, atmospheric GHG concentrations would need to be stabilized in the range of 445 to 490 ppm CO2 equivalent in the atmosphere.
Scientists warn that if the current trend to build high-carbon generating infrastructures continues, the world's carbon budget will be swallowed up by 2017, leaving the planet more vulnerable than ever to the effects of irreversible climate change. The establishment of the required new energy technologies and associated infrastructure will in itself lead to GHG emissions, implying that a portion of the ‘emission space’ allowed within the GHG target will need to be “invested“ for energy system transformation (IEA, 2010).
Created by XMLmind XSL-FO Converter.
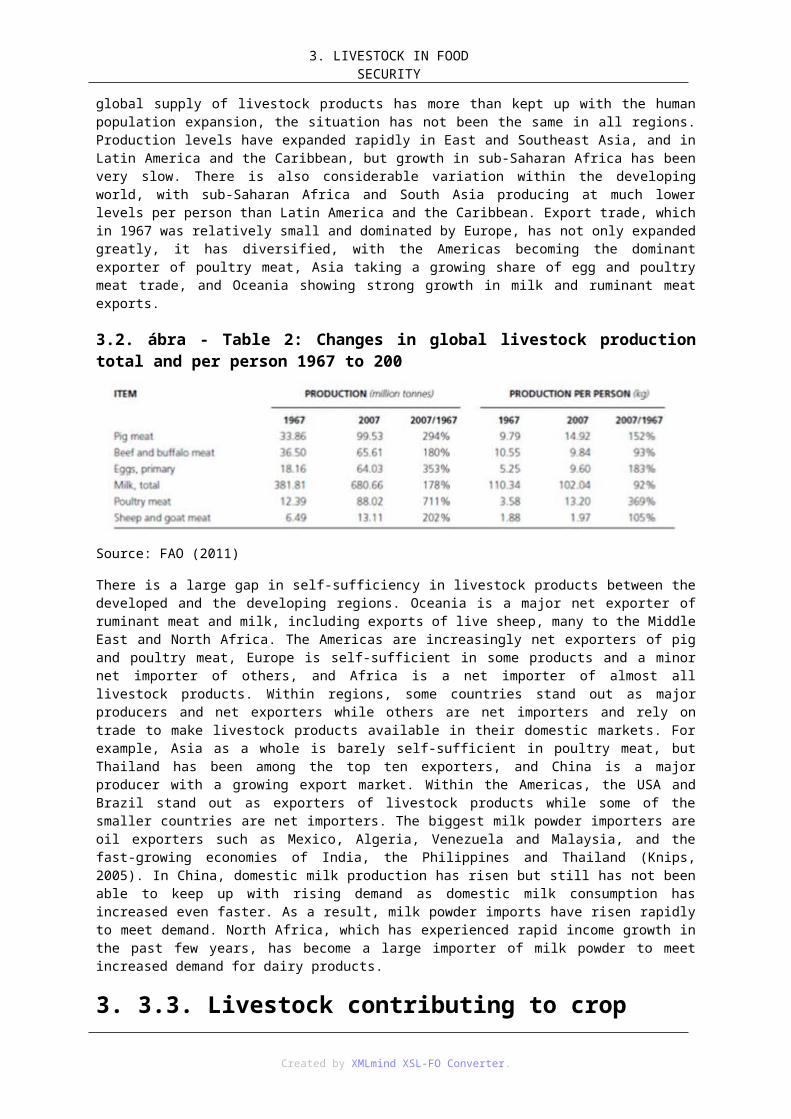
4. TENSION BETWEEN FOOD, ENERGYAND
ENVIRONMENTAL SECURITYThe transport sector is currently responsible for 23% (10 Gt CO 2 -equivalent) of energy-related CO2 emissions. To achieve the projected target of 50% reduction in energy-related CO2 emissions by 2050 from 2005 levels sustainably produced biofuels production must provide 27% of total transport fuel. Reductions in transport emissions contribute considerably to achieving overall targets. India and China show significant increases because of rapidly growing vehicle fleets. Vehicle efficiency improvements account for one-third of emissions reduction in the transport sector; the use of biofuels is the second-largest contributor, together with electrification of the fleet accounting for 20% (2.1 Gt CO2 -equivalent) of emissions saving (IEA, 2010).
Bioenergy’s contribution to climate change mitigation needs to reflect a balance between near-term GHG targets and the long-term objective to hold the increase in global temperature below 2ºC. Bioenergy has significant potential to mitigate GHGs if resources are sustainably developed and efficient technologies are applied. The impacts and performance of biomass production and use are region- and site-specific. Most current bioenergy systems, including liquid biofuels, result in GHG emission reductions, and advanced biofuels could provide higher GHG mitigation. The GHG balance may be affected by land use changes and corresponding emissions and removals. The possibility of using bioenergy in combination with carbon capture and storage (CCS) is now being actively considered. The idea behind CCS is that capturing the CO 2 emitted during bioenergy generation and injecting it into a long-term geological storage formation could turn “carbon neutral” emissions into negative emissions (OECD/IEA, 2011). One CCS demonstration project started operation in Illinois in the beginning of 2010 (MGSC, 2010).
The role of bioenergy systems in reducing GHG emissions needs to be evaluated by comparison with the energy systems they replace using life-cycle assessment (LCA) methodology. The precise quantification of GHG savings for specific systems is often hampered by lack of reliable data. Furthermore, different methods of quantification lead to variation in estimates of GHG savings. Nonetheless practically all bioenergy systems deliver large GHG savings if they replace fossil-based energy and if the bioenergy production emissions – including those arising due to land use change – are kept low. Currently available values indicate a high GHG mitigation potential of 60-120%1, similar to the 70-110% mitigation level of sugarcane ethanol and better than most current biofuels (IEA Bioenergy, 2009). However, these values do not include the impact of land use change (LUC)2 that can have considerable negative impact on the lifecycle emissions of advanced biofuels and also negatively impact biodiversity.
To ensure sustainable production of advanced biofuels, it is therefore important to assess and minimise potential indirect LUC caused by the cultivation of dedicated energy crops. This deserves a careful mapping and planning of land use, in order to identify which areas (if any) can be potentially used for bioenergy crops. Brazil is the only emerging country that has initiated the agro-ecological sugarcane zoning programme (ZAE Cana) to direct available land to the production of biofuel feedstock in order to stop deforestation and indirect land use change. The programme constrains the areas in which sugar cane production can be expanded by increasing cattle density, without the need to convert new land to pasture. The programme is enforced by limiting access to development funds for sugar cane growers and sugar mill/ethanol plant owners that do not comply with the regulations. The programme currently focuses on sugarcane, but it could also be applied to other biofuel feedstocks.
Biomass for energy is only one option for land use among others, and markets for bioenergy feedstocks and agricultural commodities are closely ulinked. Thus, LUC effects which are “indirect” to bioenergy are “direct” effects of changes in agriculture (food, feed), and forestry (fibre, wood products). They can be dealt with only within an overall framework of sustainable land use, and in the context of overall food and fibre policies and respective markets. The direct LUC effects of bioenergy production can, in principle, be controlled through certification systems, wherever biomass is grown. The risks of land-use change and resulting emissions can be minimised by focusing on wastes and residues as feedstock; maximising land-use efficiency by sustainably increasing productivity and intensity and choosing high-yielding feedstocks; using perennial energy crops, particularly on unproductive or low-carbon soils; maximising the efficiency of feedstock use in the conversion processes; cascade utilisation of biomass, i.e. ulinking industrial and subsequent energetic use of biomass; co-production of energy and food crops.
Changes in land use, principally those associated with deforestation and expansion of agricultural production for food, contribute about 15% of global emissions of GHG. Currently, less than 3% of global agricultural land is used for cultivating biofuel crops and LUC associated with bioenergy represents only around 1% of the total
11 An improvement higher than 100% is possible because of the benefits of co-products (notably power and heat).
22 Two types of land use change (LUC) exist: direct LUC occurs when biofuel feedstocks replace native forest for example; indirect LUC (iLUC) occurs when biofuel feedstocks replace other crops that are then grown on land with high carbon stocks.
Created by XMLmind XSL-FO Converter.
4. TENSION BETWEEN FOOD, ENERGYAND
ENVIRONMENTAL SECURITYemissions caused by land-use change globally most of which are produced by changes in land use for food and fodder production, or other reasons (Berndes et al., 2010). Indirect land-use changes, however, are more difficult to identify and model explicitly in GHG balances. Most current biofuel production systems have significant reductions in GHG emissions relative to the fossil fuels displaced, if no indirect LUC effects are considered.
The bioethanol share in total grains demand – i.e. corn, wheat and other coarse grains – in 2010 was 8%, or 143 million tons. By adding the feed value of ethanol by-product dried distillers’s grains and soluble (DDGS), the net shares decline by one third to slightly above 5%. The bulk of the worldwide use of grains in alcohol production comprises corn in the USA and China. However, an increase in the offtake of wheat for fuel ethanol can also be observed in Canada and the EU. The fuel ethanol sector, mainly in the US, accounted for 16% (net 11%) of global corn consumption and 20% of global sugar cane production. The biodisel share in rapeseed, soybean and palm oil demand was around 10% of global vegetable oil production. The share of waste biodiesel feedstocks such as animal fat and used cooking oil increased to 15% in total biodiesel output in 2010 (Licht, F.O., 2011 and 2012).
In 2010 about 22 million gross hectares of grains, sugar cane and cassava for fuel ethanol production and 17 million gross hectares of oilseed feedstock was needed for biodiesel production. The proportion of global cropland used for biofuels is currently some 2.5% with wide differences among countries and regions. In the US some 8% of cropland is dedicated to biofuel production, however, 20% of corn and soybean area is used for biofuel production. In the EU 5-6% of cropland is used for biofuel but 25% of biofuel feedstock or biofuel is imported. In Brazil biofuel is just requiring 3% (ethanol 1.5%) of all cropland (included pastureland) available in the country even if more than 50% of sugar cane area (20% of global area) is used for ethanol production (author’s calculation).
The fuel production processes give rise to by-products which are largely suitable as animal feed. By-products are supposed to be credited with the area of cropland required to produce the amount of feed they substitute. In the cases of grains and oilseeds, DDGS (dried distillers grains with solubles) and CGF/CGM (corn gluten feed/meal) and oil cakes (mainly rapeseed and soybean cake/meal) substitute grain and soybean as feed. It means that not all the grains used for ethanol production should be subtracted from the supplies since some 35% is returned to the feed sector in the form of by-products (mainly DDGS) so the land required for feedstock production declines to 17 million hectares. In case of biodiesel production 50-60% of rapeseed (rapeseed cake/meal) and 80% of soybean (soybean meal) is returned to the feed sector and the net land requirement decrease to around 5 million hectares. By adding by-products substituted for corn and soybean meal the net hectares needed for fuel ethanol decline to 17 million (author’s calculation). By adding by-products substituted for grains and oilseeds the land required for cultivation of feedstocks declines to 1.5% of the global crop area (net land requirement).
Based on the land-use efficiencies land use for biofuel production would need to increase from 40 million hectares (22 million hectares net land requirement by adding by-products substituted for grains and oilseeds) to around 100 million hectares in 2050. This corresponds to an increase from 2.5% of total arable land today to around 6% in 2050. This expansion would include some cropland, as well as pastures and currently unused land, the latter in particular for production of lingo-cellulosic biomass (IEA, 2010; author’s calculation).
3.1. 4.3.1. Sustainability criteria for bioenergyThe debate surrounding biomass in the food versus fuel competition, and growing concerns about other conflicts, have resulted in a strong push for the development and implementation of sustainability criteria and frameworks as well as changes in target levels and schedules for bioenergy and biofuels. This is true for the EU, the USA and China, but also for many developing countries. Furthermore, support for advanced biorefinery and advanced biofuel options is driving bioenergy to be more sustainable. The development of sustainability frameworks and standards can reduce potential negative impacts associated with bioenergy production and lead to higher efficiency than today’s systems.
Many efforts are under way to develop sustainability criteria and standards that aim to provide assurance about overall sustainability of biofuels. International initiatives include the Global Bioenergy Partnership, the Roundtable on Sustainable Biofuels, the International Organization for Standardization and the International Sustainability and Carbon Certification System. There are also initiatives looking at standards for the sustainable production of specific agricultural products, such as the Roundtable for Sustainable Palm Oil, the Roundtable for Responsible Soy and the Better Sugarcane Initiative. Development of standards or criteria will push bioenergy production to lower emissions and higher efficiency than today’s systems. The standards aim at
Created by XMLmind XSL-FO Converter.
4. TENSION BETWEEN FOOD, ENERGYAND
ENVIRONMENTAL SECURITYensuring sustainable production of feedstocks, regardless of their final uses (be it for food, material or biofuel production), and can thus help to ensure sustainable production throughout the whole sector, rather than for the feedstock specifically dedicated to biofuel production. Some policies have been adopted during recent years that include binding sustainability standards for biofuels.
Some of the GHG emissions principles require process improvement over time, while others require a specific target to be achieved. Some schemes require higher emission treshholds over time. The EU is the global frontrunner on sustainability, other continents may follow. The EU has introduced regulations under the Renewable Energy Directive (RED) that lay down sustainability criteria that biofuels must meet before being eligible to contribute to the binding national targets that each Member State must attain by 2020 (European Commission, 2010). In order to count towards the RED target, biofuels must provide 35% GHG emissions saving compared to fossil fuels. This threshold will rise to 50% as of 2017, and to 60% as of 2018 for new plants. However, there is a loophole as only direct LUC emission is accounted and indirect LUC emission is not calculated. In 2010 the European Commission published its indirect LUC communication presenting 4 policy options: a) doing nothing (monitoring); b) increasing the GHG saving threshold; c) introducing additional sustainability criteria for some biofuels and d) introducing an indirect LUC factor. The difficulty is that indirect LUC cannot be observed or measured and therefore models are used to estimate the impact.
The RED promotes advanced biofuels (biofuels from lignocellulose, algae, wastes and residues), by counting their contribution twice towards the 2020 target. Each Member State has adopted a certification system but there is no EU-wide alignment. As a consequence most of the Member States have not yet (fully) transposed the RED, e.g. double counting mechanism or defining highly bio-diverse grasslands. Harmonised definitions of waste, residues and highly bio-diverse grasslands are needed to avoid market distortion and make the voluntary sustainability schemes work. The full and harmonized transposition of the RED by the Member States is important for the future development of the industry. Critical issues around the double counting mechanism and indirect LUC need also to be resolved in a timely manner.
In the United States, the Environmental Protection Agency (EPA) is responsible for the Renewable Fuel Standard program. This establishes specific annual volume requirements for renewable fuels, which rise to 36 billion gallons by 2022. These regulatory requirements apply to domestic and foreign producers and importers of renewable fuel used in the US. Advanced biofuels and cellulosic biofuels must demonstrate that they meet minimum GHG reduction standards of 50% and 60% respectively, based on a life-cycle assessment (including indirect land-use change) in comparison with the petroleum fuels they displace. In 2010, the EPA designated Brazilian sugarcane ethanol as an advanced biofuel due to its 61% reduction of total life cyclegreenhouse gas emissions, including direct indirect land use change emissions. In Switzerland the Federal Act on Mineral Oil mandates a 40% GHG reduction of biofuels in order to qualify for tax benefits.
Sustainability criteria and biomass and biofuels certification have been developed in increasing numbers in recent years as voluntary or mandatory systems; such criteria, so far, do not apply to conventional fossil fuels. The registered several dozens of initiatives worldwide to develop and implement sustainability frameworks and certification systems for bioenergy and biofuels, as well as agriculture and forestry, can lead to a fragmentation of efforts. A proliferation of standards increases the potential for confusion, inefficiencies in the market and abuses such as “shopping” for standards that meet particular criteria. Such disparities may act as a discouragement for producers to make the necessary investments to meet high standards. There is a risk that in the short term a multitude of different and partially incompatible systems will arise, creating trade barriers (van Dam et al., 2010). If they are not developed globally or with clear rules for mutual recognition, such a multitude of systems could potentially become a major barrier for international bioenergy trade instead of promoting the use of sustainable biofuels production. In addition, lack of international systems may cause market distortions. Production of “uncertified” biofuel feedstocks will continue and enter other markets in countries with lower standards or for non-biofuel applications that may not have the same standards. The existence of a “two-tier” system would result in failure to achieve the safeguards envisaged (particularly for LUC and socioeconomic impacts).
4. Questions1. Tension between the food, energy and environmental security?
2. Global population growth?
3. Energy security?
Created by XMLmind XSL-FO Converter.
4. TENSION BETWEEN FOOD, ENERGYAND
ENVIRONMENTAL SECURITY4. Environmental security: sustainability criteria for bioenergy?
5. Environmental impact: land use change and greenhouse gas emission?
5. ReferencesBerndes, G. et al. (2010): Bioenergy, Land-use change and Climate Change Mitigation. Paris: IEA. http://www.ieabioenergy.com
European Commission (2010): Report from the commission to the council and the European parliament on sustainability requirements for the use of solid and gaseous biomass sources in electricity, heating and cooling. SEC (2010) 65. Brussels: European Commission.
FAO (2009): Proceedings of the expert meeting on how to feed the world in 2050. High-Level Expert Forum on „How to feed the world in 2050”, FAO, Rome, 12-13 October 2009. http://www.fao.org/wsfs/forum2050/wsfs-background-documents/wsfs-expert-papers/en/
FAO (2011a): Looking ahead in world food and agriculture: perspectives to 2050. Edited by Piero Conforti. Agricultural Development Economics Division Economic and Social Development Department Food and Agriculture Organization of the United Nations, 2011, Paris Pages 539 (ISBN 978-92-5-106903-5) http://www.fao.org/docrep/014/i2280e/i2280e.pdf
FAO (2011b): World Livestock 2011 – Livestock in food security. Rome: FAO.
Gustavsson, J. et al. (2011): Global food losses and food wastes – extent, causes and prevention. Rome: FAO http://www.fao.org/fileadmin/user_upload/ags/publications/GFL_web.pdf
IEA Bioenergy (2009): A Sustainable and Reliable Energy Source. Main Report. Paris: International Energy Agency.
IEA (2010): Energy Technology Perspectives 2010. Scenarios & Strategies to 2050. Paris: OECD/IEA.
IPCC (2011): Special report on renewable energy and climate change mitigation. Potsdam: Intergovernmental Panel on Climate Change. http://srren.ipcc-3.de/report/IPCC_SRREN_Full_Report.pdf
OECD/IEA (2011) Technology roadmap. Biofuels for transport. 2011. International Energy Agency. Paris, France. http://www.scribd.com/doc/62558544/Biofuels-Roadmap
Licht, F.O. (2011): World Ethanol and Biofuel Report (Jan.–Dec.). London: Agra Informa.
Licht, F.O. (2012): World Ethanol and Biofuel Report (Vol. 10, No. 9, Jan.13). London: Agra Informa.
MGSC (2010): Illinois Basin – Decatur Project Moves Forward. Groundbreaking project will help determine the future of geologic carbon sequestration (Midwest Geological Sequestration Consortium (MGSC). http://www.sequestration.org
Oerke, E.C. (2006): Crop losses to pests. Journal of Agricultural Science. 144: 31-43.
van Dam, J. et al. 2010. From the global efforts on certification of bioenergy towards an integrated approach based on sustainable land use planning. Renewable and Sustainable Energy Reviews. 14 (9): 2445-2472.
Created by XMLmind XSL-FO Converter.
5. fejezet - 5. ENERGY SECURITYIntroduction
Energy prices have seen a steady decline (in constant dollars) over the last 200 years. Political zeal has led governments to keep energy prices as low as possible, thus frustrating most attempts to increase energy productivity. Energy price elasticity is very much a long-term rather than a short-term affair, yet the investments in infrastructure that are crucial to the creation of an energy efficient society are very long term. Creating a long-term trajectory of energy prices that slowly, steadily and predictably rise in parallel with our energy productivity would give a clear signal to investors and infrastructure planners that energy efficiency and productivity are going to become ever more necessary and profitable (Krugman, 2009).
Energy security is: „the uninterrupted physical availability of energy products on the market, at a price which is affordable for all consumers (private and industrial)1. Threats to energy security come in many forms. Some can disrupt the provision of energy to consumers and businesses (e.g. through limited availability of fuel), while others affect the price of energy (e.g. price spikes as a result of geopolitical tensions and war). Biofuels contribute to energy security by increasing the diversity of supply choices and introducing a component of supply that is not necessarily import dependent (some biofuels can be produced domestically in many countries). In addition, biofuels that are locally produced are less susceptible to some threats to energy security, although extreme weather events and terrorist attacks on infrastructure can still affect them.
Concern about energy security, the threat of climate change and the need to meet growing energy demand (particularly in the developing world) all pose major challenges to energy decision makers. Advancing the low-carbon technology revolution will involve millions of choices by a myriad of stakeholders. Overall, the global share of biomass has remained stable over the past two decades, but in recent years a sharp decline in share can be observed in China due to a rapid growth of total energy consumption and a steady increase of all types of biomass (for electricity, heat and biofuels) in the EU. Projected world primary energy demand by 2050 is expected to be in the range of 600 to 1000 EJ/year compared to about 500 EJ in 2008.
Russia’s large energy resources underpin its continuing role as a cornerstone of the global energy economy over the coming decades. As the geography of Russian oil and gas production changes, so does the geography of export. The majority of Russia’s exports continue to go westwards to traditional markets in Europe, but a shift towards Asian markets gathers momentum. Russia gains greater diversity of export revenues as a result: the share of China in Russia’s total fossil-fuel export earnings rises from 2% in 2010 to 20% in 2035, while the share of the European Union falls from 61% to 48%. Russia aims to create a more efficient economy, less dependent on oil and gas, but needs to pick up the pace of change (IEA, 2011).
1. 5.1. Global energy demandEmerging economies continue to drive global energy demand. Rising incomes and population will push energy needs higher. Oil supply diversity is diminishing, while new options are opening up for natural gas. Renewables enter the mainstream. Global energy demand is increasing, as is the environmental damage due to fossil fuel use. Continued reliance on fossil fuels will make it very difficult to reduce emissions of greenhouse gases that contribute to global warming. Experts warn that greenhouse gas (GHG) emissions must peak before 2020 to avoid unacceptable risks.
The use of fossil fuels by agriculture has made a significant contribution to feeding the world over the last few decades. The food sector accounts for around 30% of global energy consumption and produces over 20% of global greenhouse gas (GHG) emissions. Around one-third of the food we produce, and the energy that is embedded in it, is lost or wasted. The energy embedded in global annual food losses is around 38% of the total final energy consumed by the whole food chain (Gustavsson et al., 2011). Due to high dependence of the global food sector on fossil fuels the volatility of energy markets can have a potentially significant impact on food prices, and this would have serious implications for food security and sustainable development (IPCC, 2011). Rising energy prices may cause spillovers into food markets leading to increasing food insecurity. Furthermore, any increase in the use of fossil fuels to boost production will lead to greater GHG emissions, which the global
11 European Commission (2000) Green Paper: towards a European strategy for the security of energy supply, available at:http://ec.europa.eu/energy/green-paper-energy-supply/doc/green paper energy supply en.pdf, p4.
Created by XMLmind XSL-FO Converter.
5. ENERGY SECURITY
community has pledged to reduce. The food sector can adapt to future energy supply constraints and to the impacts of climate change with rapid deployment of energy efficiency and renewable energy technologies (FAO, 2011).
Global primary energy demand is projected to rise from around 12 300 million tons oil equivalent (Mtoe) in 2008 to 16 800 Mtoe in 2035 – an increase of over 35% with China and India accounting for 50% of the growth.2 China will consume nearly 70% more energy than the United States by 2035, even though, by then, per capita demand in China will still be less than half the level in the United States.
While oil continues to be the dominant fuel in the primary energy mix, its share of the mix drops from 33% in 2008 to 27% in 2035. The average price of imported crude oil will remain high, approaching to USD120 per barrel in 2035 (at the rate of US dollar in 2010), i.e. more than USD210 per barrel in nominal terms. Natural gas increases from 21% of the global fuel mix in 2008 to 25% in 2035 becoming the second-largest fuel in the primary energy mix. The share of primary coal demand declines by 5% from 27% in 2008 to 22% in 2035. The share of nuclear power in global primary energy supply increases from 6% in 2008 to 7% in 2035 (IEA, 2011). On a global basis, it is estimated that renewable energy accounted for 13% of the total 492 Exajoules (EJ) 3 of primary energy supply in 2008 (IEA Bioenergy, 2009). Renewables increase from 13% of the mix to 19% over the same period leading to a decreasing share of fossil fuels in the global primary energy consumption from 87% in 2008 to 81% in 2035 (Figure 1 and Figure 2).
5.1. ábra - Figure 1: World primary energy demand by fuel in 2008
5.2. ábra - Figure 2: World primary energy demand by fuel in 2035
22 Global primery energy demand is projected to rise from around 500 exajoule (EJ) in 2008 to around 700 EJ in 2035.
33 1 Exajoule = 1018 joules = 23.88 million tons of oil equivalent (Mtoe).
Created by XMLmind XSL-FO Converter.
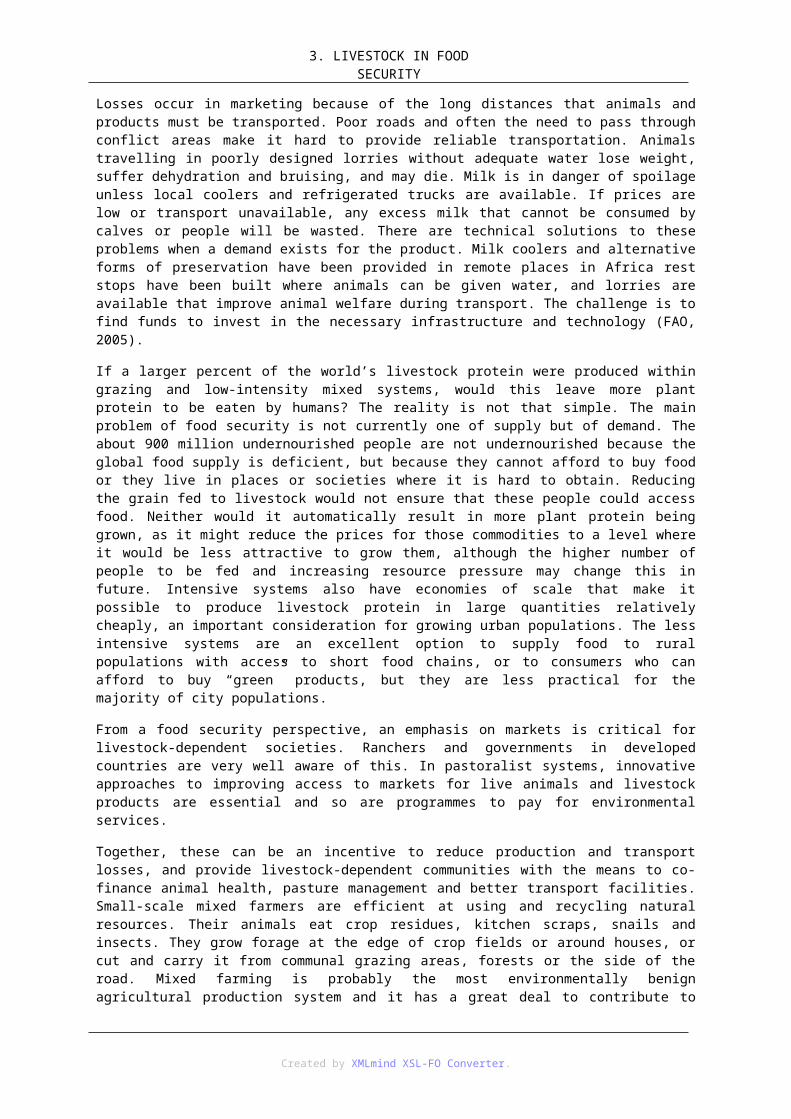
5. ENERGY SECURITY
While fossil fuels meet 87% of world energy demand, its subsidies are creating market distortions that encourage wasteful consumption. The International Energy Agency (IEA) estimates governments spent USD409 billion on fossil fuel subsidies in 2010 increasing to USD660 billion (0.7 percent of global gross domestic product) by 2020 unless action is taken. Eliminating fossil-fuel consumption subsidies would slash the growth in energy demand by 2020 by 4.1% and contribute to more competitive renewable energy sources. Renewable subsidies of $66 billion in 2010 (compared with USD409 billion for fossil fuels) need to climb to USD250 billion in 2035 as rising deployment outweighs improved competitiveness (IEA, 2011).
2. 5.2. Rising transport demand reconfirms the end of cheap oilThe oil import bill in Europe, the U.S. and Japan is close to the level hit in 2008, when high prices were a contributing factor in the severe recession. When expenditures on oil rise to around 5% of gross domestic product, it has historically caused economic problems. With a more than $100 per barrel oil price, we get close to that 5% hurdle.
Global oil demand is set to grow by 14.0% by 2035, pulled by China and emerging economies.90% of the growth in oil production required to meet rising demand over the next 20 years will need to come from the Middle East and North Africa (MENA countries), due to the decline in output from oil fields in other parts of the world. Yet there was a risk that there may not be adequate investment to ensure the additional production. Oil imports to the United States, currently the world’s biggest importer, will drop as efficiency gains reduce demand and new supplies such as light tight oil are developed, but increasing reliance on oil imports elsewhere heightens concerns about the cost of imports and supply security.
All of the net increase in oil demand comes from the transport sector in emerging economies, as economic growth pushes up demand for personal mobility and freight. The rise in oil use comes despite some impressive gains in fuel economy in many regions, notably for passenger vehicles in Europe and for heavy freight in the United States. Alternative vehicle technologies emerge that use oil much more efficiently or not at all, such as electric vehicles, but it takes time for them to become commercially viable and penetrate markets. With limited potential for substitution for oil as a transportation fuel, the concentration of oil demand in the transport sector makes demand less responsive to changes in the oil price (especially where oil products are subsidised). The cost of bringing oil to market rises as oil companies are forced to turn to more difficult and costly sources to replace lost capacity and meet rising demand. The largest increase in oil production comes from Iraq, followed by Saudi Arabia, Brazil, Kazakhstan and Canada (IEA, 2011).
3. 5.3. Prospects for natural gasThere is much less uncertainty over the outlook for natural gas: factors both on the supply and demand sides point to a bright future, even a golden age, for natural gas. Demand for gas could outstrip coal by 2030, and get close to demand for oil by 2035. Ample supplies, robust emerging markets and uncertainty about nuclear power all point to a prominent role for gas in the global energy mix (IEA, 2011).
Created by XMLmind XSL-FO Converter.
5. ENERGY SECURITY
Policies promoting fuel diversification support a major expansion of gas use in China; this is met through higher domestic production and through an increasing share of liquefied natural gas (LNG) trade and Eurasian pipeline imports. Global trade doubles and more than one-third of the increase goes to China. Russia remains the largest gas producer in 2035 and makes the largest contribution to global supply growth, followed by China, Qatar, the United States and Australia.
Unconventional gas now accounts for half of the estimated natural gas resource base and it is more widely dispersed than conventional resources, a fact that has positive implications for gas security. The share of unconventional gas rises to one-fifth of total gas production by 2035, although the pace of this development varies considerably by region. The growth in output will also depend on the gas industry dealing successfully with the environmental challenges: a golden age of gas will require golden standards for production. Meanwhile, trade doubles, with the increase split between natural gas pipelines and liquefied natural gas (LNG) Natural gas could play a much larger role in the world's future energy mix as some countries veer away from the perceived dangers of nuclear energy after Japan's crisis, and see it as a cheaper alternative to renewable energy sources like wind and solar.
Natural gas markets are becoming more global and regional prices are expected to show signs of increased convergence, but the market does not become truly globalised. The price of the commodity in key regions, including much of Europe and Asia, will remain anchored in decades-old practices: long-term contracts indexed to the cost of oil or refined oil products. As such, natural gas prices do not reflect the supply and demand fundamentals for that commodity, but rather those of the oil market. The regional price gap will have narrowed by 2030, but prices will nonetheless remain far apart.
When burned for power, gas produces half the carbon of coal. Natural gas is the cleanest of the fossil fuels, but increased use of gas in itself (without carbon capture and storage) will not be enough to put us on a carbon emissions path consistent with limiting the rise in average global temperatures to 2°C (IEA, 2011).
4. 5.4. Coal in global energy demandCoal has met almost half of the increase in global energy demand over the last decade. Whether this trend alters and how quickly is among the most important questions for the future of the global energy economy. The range of projections for coal demand in 2035 is nearly as large as total world coal demand in 2009. The implications of policy and technology choices for the global climate are huge. China’s consumption of coal is almost half of global demand and its Five-Year Plan for 2011 to 2015, which aims to reduce the energy and carbon intensity of the economy, will be a determining factor for world coal markets. Worldwide, 16 of the 20 most polluted cities are in China, largely related from coal power plant production.
China’s emergence as a net coal importer in 2009 led to rising prices and new investment in exporting countries, including Australia, Indonesia, Russia and Mongolia. It would take only a relatively small shift in domestic demand or supply for China to become a net-exporter again, competing for markets against the countries that are now investing to supply its needs. India’s coal use doubles, so that India displaces the United States as the world’s second-largest coal consumer and becomes the largest coal importer in the 2020s. The main market for traded coal continues to shift from the Atlantic to the Pacific, but the scale and direction of international trade flows are highly uncertain (IEA, 2011).
Widespread deployment of more efficient coal-fired power plants and carbon capture and storage (CCS) technology could boost the long-term prospects for coal, but there are still considerable hurdles. Opting for more efficient technology for new coal power plants would require relatively small additional investments, but improving efficiency levels at existing plants would come at a much higher cost. If CCS is not widely deployed in the 2020s, an extraordinary burden would rest on other low-carbon technologies to deliver lower emissions in line with global climate objectives.
5. 5.5. Nuclear energyDependence on fossil fuels will increase if countries move away from nuclear in the aftermath of Fukushima Daiichi. The crisis at Japan's Fukushima atomic facility could result in a 15% fall in nuclear power capacity by 2035 if countries reconsider existing policies. This would result in increased costs for coal and gas imports for power generation and higher emissions of climate-warming gases. However, nuclear will continue to play an important role despite recent policy changes in Germany and Switzerland.
Created by XMLmind XSL-FO Converter.
5. ENERGY SECURITY
Events at Fukushima Daiichi have raised questions about the future role of nuclear power, although it has not changed policies in countries such as China, India, Russia and Korea that are driving its expansion. Nuclear output rises by more than 70% over the period to 2035. However, the IEA examine the possible implications of a more substantial shift away from nuclear power, which assumes that no new OECD reactors are built, that non-OECD countries build only half of the additions projected in the current scenario and that the operating lifespan of existing nuclear plants is shortened.
While creating opportunities for renewables, such a low-nuclear future would also boost demand for fossil fuels: the increase in global coal demand is equal to twice the level of Australia’s current steam coal exports and the rise in gas demand is equivalent to two-thirds of Russia’s current natural gas exports. The net result would be to put additional upward pressure on energy prices, raise additional concerns about energy security and make it harder and more expensive to combat climate change. The consequences would be particularly severe for those countries with limited indigenous energy resources which have been planning to rely relatively heavily on nuclear power. It would also make it considerably more challenging for emerging economies to satisfy their rapidly growing demand for electricity (IEA, 2011).
6. 5.6. Achieving energy for allIn 2009, around USD 9 billion was invested globally to provide first access to modern energy, but more than five-times this amount, USD 48 billion, needs to be invested each year if universal access is to be achieved by 2030. The investment required is equivalent to around 3% of total energy investment to 2030. Without this increase, the global picture in 2030 is projected to change little from today and in sub-Saharan Africa it gets worse.
About 1.3 billion of the world's seven billion people have no access to modern energy, 95 percent of whom live in sub-Saharan Africa or poorer parts of Asia. Also, some 2.7 billion people are without clean cooking facilities, causing 1.5 million deaths annually from respiratory diseases. Financially feasible, universal access to energy would only lead to a 1.1% rise in global energy demand, since poor households would still be limited in their consumption, and a 0.7% rise in greenhouse gas emissions. The implications are very small. Some existing policies designed to help the poorest miss their mark. Only 8% of the subsidies to fossil-fuel consumption in 2010 reached the poorest 20% of the population. More finance, from many sources and in many forms, is needed to provide modern energy for all, with solutions matched to the particular challenges, risks and returns of each category of project. There are no real tensions between the targets of providing energy access and the issues of energy security and climate change (IEA, 2011).
7. 5.7. Transport policiesThe transport sector is responsible for about 20% of world primary energy demand (94 EJ). At present 96% of vehicles are dependent on petroleum and 60% of oil is used for transport fuel. The passenger vehicle fleet will double to 1.7 billion in 2035. The global car fleet will continue to surge as more and more people in China and other emerging economies buy a car. Alternative technologies, such as hybrid and electric vehicles that use oil more efficiently or not at all, continue to advance but they take time to penetrate markets. Advanced vehicles, which represent 70% of new car sales by 2035, make a big contribution to emissions abatement, underpinned by a dramatic decarbonisation of the power sector (IEA, 2011).
Common policies include biofuel subsidies, tax exemptions, or blending mandates. Blending mandates, targets, fuel-tax exemptions and production subsidies exist in around 50 countries. City and local governments around the world continue to enact policies to reduce greenhouse gas emissions and promote renewable energy. In 2010, local governments received official recognition for the first time in international climate negotiations, where they are now designated as “governmental stakeholders.” Almost all cities working to promote renewable energy at the local level have established some type of renewable energy or CO 2 emissions reduction target. There are several types of renewable energy-specific targets (IPPC, 2011).
The U.S. renewable fuels standard (RFS) requires fuel distributors to increase the annual volume of biofuels with a specific quota for advanced biofuels blended to 36 billion gallons (136 billion litres) by 2022. The EU is targeting 10% of transport energy from renewables by 2020. The biofuel target refers to road and rail transport but electricity in all transport. Biofuels in aviation, shipping should be included in to the biofuels target even if it is not included in the legislation of the Member States. Since 1976 the government in Brazil made it mandatory to blend anhydrous ethanol with gasoline, fluctuating between 10% and 25%. In 2011 the mandatory blend of 25% was reduced to 20% (on volumetric basis) due to recurring ethanol supply shortages and high prices that
Created by XMLmind XSL-FO Converter.
5. ENERGY SECURITY
take place between harvest seasons. China targets the equivalent of 13 billion litres of ethanol and 2.3 billion litres of biodiesel per year by 2020.
To drive development of biofuels that provide considerable emission savings and at the same time are socially and environmentally acceptable, support measures need to be based on the sustainable performance of biofuels. Recent years have also seen increased attention to biofuels sustainability and environmental standards (Licht F.O., 2011). Another approach is to directly ulink financial support to life-cycle CO 2 -emission reductions (calculated with a standard life-cycle analysis methodology agreed on internationally) to support those biofuels that perform best in terms of CO2 savings. Neither specific advanced biofuel quota, nor performance based support measures on their own seem to be effective to address the higher production costs of advanced biofuels in the short term. Specific transitional measures may thus be needed to support the introduction of the new technologies. Financial incentives, for instance a tax incentive or perhaps analogous to feed-in tariffs for electricity, could be coupled to the use of co-products such as waste heat to promote efficient use of by-products.
A key requirement for all biofuels to get access to the market will be compliance with international fuel quality standards. This will ensure vehicle and infrastructure compatibility among different regions and promote consumer acceptance for new fuels. End-use infrastructure requirements need also to be addressed to avoid bottlenecks caused by incompatibility with deployed biofuels. The ethanol “blending wall” – the limiting of ethanol in gasoline to 10% to 15% because of vehicle compatibility constraints – is one example of potential infrastructure bottlenecks that need to be addressed. Evolution of fuel specifications and new fuel grades are taken into account in the developing of future vehicles, such as compatibility of vehicles in the fleet with higher biofuels blends or new limits for existing specifications. Backward compatibility of fuel changes is a very difficult issue because it is extremely difficult to cover all the vehicle generations and models combined with reliability risks for the customers and a risk for vehicle manufacturers in meeting legal commitments (CO2 emissions) and furthermore it is costly. Automotive manufacturers need sufficient protection for the existing fleet at any point in time and a sufficient lead-time and clear fuel specifications for the future. At least 5 years lead-time should enable car industry to adopt to new fuel standards. Electric vehicles get much attention and incentives but they still face many barriers. They seem to be viable for light vehicles and short distances.
Introduction of flex-fuel vehicles (FFV) and high-level ethanol blends is a suitable measure to avoid infrastructure incompatibility issues for ethanol, as has been successfully demonstrated in Brazil, the US and the EU. Introduced in the market in 2003, flex vehicles became a commercial success in Brazil, reaching a 95% share of all new cars and light vehicle sales today. Most of the cars on the road in the U.S. can run on blends of up to 15% ethanol, and the use of 10% and 15% ethanol gasoline is mandated in several U.S. states and cities. Well over 90% of U.S. gasoline is blended with ethanol. In the EU Member States (Germany and France) the biofuel “blending wall” has been increased up to 10%. Policy measures maybe required, such as obligations for retailers to provide high-level biofuel blends (e.g. E85) or tax incentives for FFVs.
Ford was the first manufacturer offering in 2001 FFVs in Europe and began to develop market also beyond Sweden. In contrast to Brazil (and Sweden) there are no significant incentives for customers to buy FFVs because the production costs of ethanol exceed gasoline costs. Reason for that is primarily the different feedstock used in Europe versus Brazil. The market of FFVs will remain a niche without substantial and stable net fuel price benefits. The price premium of FFVs ranges between EUR100–300 on consumer price (Germany).
8. 5.8. Environmental impactAbout 84% of current CO2 emissions are energy-related and about 65% of all greenhouse-gas emissions can be attributed to energy supply and energy use. All sectors (buildings, transport, industry and other) will need to reduce dramatically their CO2 intensity if global CO2 emissions are to be decreased by 50 to 85% below 2000 levels by 2050. Energy-related carbon-dioxide (CO2) emissions in 2010 are estimated to have climbed to a record 30.6 Gigatons (Gt) and concentrations have continued to grow to over 390 parts per million (ppm) CO 2 or 39% above pre-industrial levels.
The Cancun Agreements call for limiting global average temperature rises to no more than 2°C above pre-industrial values. In order to be confident of achieving an equilibrium temperature increase of only 2°C to 2.4°C, atmospheric greenhouse gas (GHG) concentrations would need to be stabilized in the range of 445 to 490 ppm CO2 equivalent in the atmosphere. Scientists warn that if the current trend to build high-carbon generating infrastructures continues, the world's carbon budget will be swallowed up by 2017, leaving the planet more vulnerable than ever to the effects of irreversible climate change. The establishment of the required new energy technologies and associated infrastructure will in itself lead to GHG emissions, implying that a portion of the
Created by XMLmind XSL-FO Converter.
5. ENERGY SECURITY
‘emission space’ allowed within the GHG target will need to be “invested“ for energy system transformation (IEA, 2010).
The transport sector is currently responsible for 23% (10 Gigatonne CO 2 -equivalent) of energy-related CO2
emissions. To achieve the projected target of 50% reduction in energy-related CO2 emissions by 2050 from 2005 levels sustainably produced biofuels production must provide 27% of total transport fuel. Reductions in transport emissions contribute considerably to achieving overall targets. India and China show significant increases because of rapidly growing vehicle fleets. Vehicle efficiency improvements account for one-third of emissions reduction in the transport sector; the use of biofuels is the second-largest contributor, together with electrification of the fleet accounting for 20% (2.1 Gigatonne CO2 -equivalent) of emissions saving (IEA, 2010b).
Bioenergy’s contribution to climate change mitigation needs to reflect a balance between near-term GHG targets and the long-term objective to hold the increase in global temperature below 2ºC. Bioenergy has significant potential to mitigate GHGs if resources are sustainably developed and efficient technologies are applied. The impacts and performance of biomass production and use are region- and site-specific. Most current bioenergy systems, including liquid biofuels, result in GHG emission reductions, and advanced biofuels could provide higher GHG mitigation. The GHG balance may be affected by land use changes and corresponding emissions and removals. The possibility of using bioenergy in combination with carbon capture and storage (CCS) is now being actively considered. The idea behind CCS is that capturing the CO 2 emitted during bioenergy generation and injecting it into a long-term geological storage formation could turn “carbon neutral” emissions into negative emissions (Kraxner et al., 2010). One CCS demonstration project started operation in Illinois in the beginning of 2010 (MGSC, 2010).
9. Questions1. Global primary energy demand and final end use consumption?
2. Shares of energy sources in world primary energy demand?
3. World energy-related CO2 emissions in 2010?
4. Worldwide challenges and trends in the traffic sector?
5. Why biofuels in transport?
10. ReferencesEuropean Commission (2000): Green Paper: towards a European strategy for the security of energy supply, available at:http://ec.europa.eu/energy/green-paper-energy-supply/doc/green paper energy supply en.pdf, p4.
FAO (2011): Energy-smart food for people and climate. Issue paper. Rome: FAO. http://www.fao.org/docrep/014/i2454e/i2454e00.pdf
Gustavsson, J. et al. (2011): Global food losses and food wastes – extent, causes and prevention. Rome: FAO. http://www.fao.org/fileadmin/user_upload/ags/publications/GFL_web.pdf
IEA Bioenergy (2009). Sustainable and Reliable Energy Source. Main Report. Paris: International Energy Agency.
IEA (2010): Energy Technology Perspectives 2010. Scenarios & Strategies to 2050. Paris: OECD/IEA.
IEA (2011): Are we entering a golden age of gas? Special report. Paris: International Energy Agency.http://www.iea.org/weo/docs/weo2011/WEO2011_GoldenAgeofGasReport.pdf
IPCC (2011). Special report on renewable energy and climate change mitigation. Potsdam: Intergovernmental Panel on Climate Change. http://srren.ipcc-3.de/report/IPCC_SRREN_Full_Report.pdf
Kraxner, F. et al. (2010): “Bioenergy Use for Negative Emissions – Potentials for Carbon Capture and Storage (BECCS) from a Global Forest Model Combined with Optimized Siting and Scaling of Bioenergy Plants in Europe”. Working paper presented at the First International Workshop on Biomass & Carbon Capture and
Created by XMLmind XSL-FO Converter.
5. ENERGY SECURITY
Storage, 14-15 October 2010, University of Orléans, France.
Krugman, P. (2009): “Is a New Architecture Required for Financing Food and Environmental Security?” Summary of the speech made during the launching event of the Second Forum for the Future of Agriculture. Brussels. http://www.elo.org
Licht, F.O. (2011): World Ethanol and Biofuel Report (Jan.–Dec.). London: Agra Informa.
MGSC (2010): Illinois Basin – Decatur Project Moves Forward. Groundbreaking project will help determine the future of geologic carbon sequestration (Midwest Geological Sequestration Consortium (MGSC). http://www.sequestration.org
Created by XMLmind XSL-FO Converter.
6. fejezet - 6. RENEWABLE ENERGY ALTERNATIVES1. 6.1. Global energy consumptionGlobal primary energy demand is projected to raise from around 12 300 million tons oil equivalent (Mtoe) in 2008 to 16 800 Mtoe in 2035 – an increase of over 35%. In the last 35 years global energy supplies have nearly doubled but the relative contribution from renewables has hardly changed at around 13%. Renewables increase from 13% of the mix to 19% over the same period leading to a decreasing share of fossil fuels in the global primary energy consumption from 87% in 2008 to 81% in 2035 (Figure 1).
6.1. ábra - Figure 1: World primary energy demand by fuel in 2008
Source: IEA Bioenergy (2009)
On a global basis, it is estimated that renewable energy accounted for 13% of the total 492 Exajoules (EJ) 1 of primary energy supply in 2008 (IEA Bioenergy, 2009). The largest contributor to renewable energy with 10% points was biomass. Hydropower represented 2% points, whereas other renewable energy sources accounted for 1% point (Figure 1). The contribution of renewable energy to primary energy supply varies substantially by country and region.
2. 6.2. The increasing competition for biomass: bioenergy potentialConcern about energy security, the threat of climate change and the need to meet growing energy demand (particularly in the developing world) all pose major challenges to energy decision makers. Advancing the low-carbon technology revolution will involve millions of choices by a myriad of stakeholders. Overall, the global share of biomass has remained stable over the past two decades, but in recent years a sharp decline in share can be observed in China due to a rapid growth of total energy consumption and a steady increase of all types of biomass (for electricity, heat and biofuels) in the EU.
Biomass is a versatile energy source – it can be stored and converted in practically any form of energy carrier and also into biochemicals and biomaterials from which, once they have been used, the energy content can be recovered to generate electricity, heat, or transport fuels. The worldwide potential of bioenergy is limited because all land is multifunctional and land is also needed for food, feed, timber and fibre production, as well as for nature conservation and climate protection. In addition, the use of biomass as an industrial feedstock (e.g. plastics) will become increasingly important. Biomass can include land- and water-based vegetation (e.g., trees, algae), as well as other organic wastes.
The biomass feedstock can be subdivided into primary, secondary or tertiary feedstocks. Primary biomass
111 Exajoule = 1018 joules = 23.88 million tons of oil equivalent (Mtoe).
Created by XMLmind XSL-FO Converter.
6. RENEWABLE ENERGY ALTERNATIVES
feedstocks are materials harvested or collected directly from forest or agricultural land where they are grown (e.g., grains). Secondary biomass feedstocks are by-products of the processing of primary feedstocks (e.g., corn stover, sawmill residues, black liquor). Tertiary biomass feedstocks are post-consumer residues and wastes (e.g., waste greases, wastewaters, municipal solid waste). At present only a small fraction of biomass is used globally for biofuels production and power generation, but these shares are growing rapidly because of issues like energy security, rising fossil fuel prices and, last but not least, global warming concerns and greenhouse gas reduction policies. With demand for energy continuing to rise in absolute terms, the absolute use of biomass will increase even more.
Bioenergy is the largest single source of renewable energy today and has the highest technical potential for expansion amongst renewable energy technologies. In 2008, biomass provided about 10% (50.3 EJ/year) of the global primary energy supply (IEA Bioenergy, 2009). More than 80% of the biomass feedstocks are derived from wood (trees, branches, residues) and shrubs. The remaining bioenergy feedstocks came from the agricultural sector (energy crops, residues and by-products) and from various commercial and post-consumer waste and by-product streams (biomass product recycling and processing or the organic biogenic fraction of municipal solid waste (Figure 1).
The majority of biomass (roughly two-thirds) is used inefficiently for traditional domestic cooking, lighting and space heating in developing countries. More than a third of the world's population depends on this form of energy, which is unhealthy and contributes to the deaths of 1.5 million people a year from the pollution it causes. The share of the smaller, modern bioenergy use is growing rapidly. High-efficiency modern bioenergy uses more convenient solids, liquids and gases as secondary energy carriers to generate heat, electricity, combined heat and power, and transport fuels for various sectors. The estimated total primary biomass supply for modern bioenergy is 11.3 EJ/year (the secondary energy delivered to end-use consumers is roughly 6.6 EJ/year). Additionally, the industry sector, such as the pulp and paper, forestry, and food industries, consumes approximately 7.7 EJ of biomass annually, primarily as a source for industrial process steam (IEA, 2010a).
In developing countries biomass contributes some 22% to the total primary energy mix. The traditional use of biomass is expected to grow with increasing world population, but there is significant scope to improve its efficiency and environmental performance, and thereby help reduce biomass consumption and related impacts. In industrialised countries, the total contribution of modern biomass is on average only about 3% of total primary energy with large differences among the industrialized countries. Finland and Sweden have shares of around 20%2, for example, while for Ireland and the UK these figures were 1.3% and 1.5% respectively (IPPC, 2011). In the future biomass could also provide an attractive feedstock for the chemical industry (to produce soap, cosmetics, etc.) and that use of biogenic fibres will increase.
The total annual aboveground net primary production (the net amount of carbon assimilated in a time period by vegetation) on the Earth’s terrestrial surface is estimated to be about 35 Gt carbon, or 1.260 EJ/year assuming an average carbon content of 50% and 18 GJ/t average heating value (Haberl et al., 2007), which can be compared to the current world primary energy supply of about 500 EJ/year (IEA, 2010a). All harvested biomass used for food, fodder, fibre and forest products, when expressed in equivalent heat content, equals 219 EJ/year (2000 data, Krausmann et al. 2008). The global harvest of major crops (cereals, oil crops, sugar crops, roots, tubers and pulses) corresponds to about 60 EJ/year and the global industrial round-wood production corresponds to 15 to 20 EJ/year (FAOSTAT, 2011).
Based on this diverse range of feedstocks, the technical potential for biomass is estimated in the literature to be possibly as high as 1500 EJ/year by 2050 (Smeets et al., 2007), although most biomass supply scenarios that take into account sustainability constraints, indicate an annual potential of between 200 and 500 EJ/year (excluding aquatic biomass owing to its early state of development), representing 40 to 100% of the current global energy use (IEA Bioenergy, 2009). Forestry and agricultural residues and other organic wastes (including municipal solid waste) would provide between 50 and 150 EJ/year, while the remainder would come from energy crops, surplus forest growth, and increased agricultural productivity (Figure 2).
6.2. ábra - Figure 2: Global bioenergy sources
22 Because of the large wood industries (pulp and paper) in both countries there is a large feedstock of black liquor (by-product from paper pulp production) which is used to produce industrial heat.
Created by XMLmind XSL-FO Converter.
6. RENEWABLE ENERGY ALTERNATIVES
Projected world primary energy demand by 2050 is expected to be in the range of 600 to 1000 EJ/year compared to about 500 EJ in 2008. The expert assessment suggests potential deployment levels of bioenergy by 2050 in the range of 100–300 EJ/year. However, there are large uncertainties in this potential, such as market and policy conditions, and there is strong dependence on the rate of improvements in the agricultural sector for food, fodder and fibre production and forest products. The entire current global biomass harvest would be required to achieve a 200 EJ/year deployment level of bioenergy by 2050. Scenarios looking at the penetration of different low carbon energy sources indicate that future demand for bioenergy could be up to 250 EJ/year (Kampman et al., 2010). It is reasonable to assume that biomass could sustainably contribute between a quarter and a third of the future global energy mix.
The transport sector is responsible for about 20% of world primary energy demand (94 EJ). Transport biofuels are currently the fastest growing bioenergy sector. However, today they represent just 3% of total road transport fuel consumption and only 5% of total bioenergy (in energy value). At present only a small fraction of biomass (sugarcane, grain, and vegetable oil crop) is used globally for biofuels production, but these shares are growing rapidly because of issues like energy security, rising fossil fuel prices and, last but not least, global warming concerns and greenhouse gas reduction policies. Liquid transport fuels from biomass represent one of the most important options for the sustainable supply of transport fuels (Kampman et al., 2010).
The projected primary bioenergy demand is 145 EJ (65 EJ for biofuels, 80 EJ mainly for heat and power) in 2050. The total feedstock required to meet the ambitious goals of biofuels production is around 65 EJ of biomass meeting 27% of world demand for transportation fuels by 2050. It is assumed that 50% of the feedstock for advanced biofuels and biomethane will be obtained from wastes and residues, corresponding to 20 EJ (IEA, 2010b). This is a rather conservative estimate, but given the potential constraints regarding collection and transportation of residues, and the potentially enormous feedstock demand of commercial advanced biofuel plants, it is not clear if a higher residue share can realistically be mobilised for biofuel production. Advanced biofuels are expected to increase in importance over the next two decades.
The volume of sustainable biomass resources that are economically competitive but do not significantly impact on food production is expected to slowly expand as new feedstock varieties and refining pathways are developed. Availability of land for non-food crops will be determined by increased yield potential, reducing losses and wastes along the food chain and lower inputs. However, these volumes will remain limited relative to total energy and transport sector fuel demand. Limited biomass resources will be allocated to the sector (materials, chemicals, energy) that is most able to afford them. This will depend on the price of existing fossil
Created by XMLmind XSL-FO Converter.
6. RENEWABLE ENERGY ALTERNATIVES
fuel products and the relative cost of converting biomass into substitute final fuels such as bio-derived electricity, ethanol blends, biodiesel and bio-derived jet fuel. It will also depend on factors such as cost of alternative fuel and energy sources, government policies including excise rates, and the emission intensity of each sector.
Competition for land may be limited, as production of feedstocks for advanced biofuels are expected to be grown mainly outside cultivated land, and that some 100 million ha would be sufficient to achieve the target biofuel share in world transport fuels in 2050 (IEA, 2010b). An important step in increasing biofuel production and sustainability is the competitive production of biofuels from (hemi)-cellulose. Perennial crops and woody energy crops typically have higher yields than grain, and vegetable oil crop used for current biofuels. The extent of grassland and woodland with potential for lingo-cellulosic feedstocks is about 1.75 billion ha worldwide. However, much of this grass- and woodland provides food and wood for cooking and heating to local communities, or is in use as (extensive) grazing ground for livestock and only some 700 to 800 million ha of this land is suitable for economically viable lignocellulosic feedstock production (Fischer et al., 2009).
The sustainable use of residues and wastes for bioenergy, which do not require any new agricultural land and present limited or zero environmental risks, needs to be encouraged and promoted globally. Several factors may discourage the use of these “lower-risk” resources. Using residues and surplus forest growth, and establishing energy crop plantations on currently unused land, may prove more expensive than creating large-scale energy plantations on arable land. In the case of residues, opportunity costs can occur, and the scattered distribution of residues may render it difficult in some places to recover them (IEA, 2010b). Whatever is actually realised will depend on the cost competitiveness of bioenergy and on future policy frameworks, such as greenhouse gas emission reduction targets. The uptake of biomass depends on biomass production costs – USD4/GJ is often regarded as an upper limit if bioenergy is to be widely deployed today in all sectors –, logistics, and resource and environmental issues (IPPC, 2011).
3. 6.3. Competition for financing between renewable energy alternativesExperience of banks with first generation biofuels shows amateurism, losses, bankruptcies, overcapacity of biodiesel, latent sustainability issues (food/fuel and land) and still a long dependence on policies. Most capacity expansion – and thus financing need – is expected for next generation biofuels in the longer term (except from sugarcane-based ethanol in Brazil). Ultimately, these biofuels should be produced at lower costs than the current generation but feedstock and technology poses time and money-related barriers since the new supply chains, feedstock and technology are unproven and investment capital expenditure is very high. The roll-out of large-scale next generation facilities will be a slow process. The key to unlock financing is control or co-operation in the supply chain in addition to lower costs.
General capital constraints make competition for financing from other renewable energy projects (e.g. wind farms) stronger. A strong and clear business case that eliminates or reduces cash flow uncertainties is needed. For example, wind energy often has the advantage of a fixed feed-in-tariff. Pre-requisite for long-term survival is a largely integrated supply chain via contracts, ownership and agreements. Key success factors of any bioenergy project are logistics and location, price risk management, feedstock supply (easy and assured access), off take (easy and assured contracts), capacity utilisation (benchmark is 75%), experienced management and compliance with sustainability requirements.
The annual value of renewable energy capacity installed will double in real terms to $395 billion in 2020, rising to USD460 billion in 2030, compared with USD195 billion in 2010 – according to analysis company Bloomberg New Energy Finance (BNEF, 2011). Spending on new renewable energy capacity will total USD7 trillion over next 20 years. The solar and wind sector will continue to expand with a combined share of 70% in total money spent on renewable energy projects but biofuel is projected to reach a share of just 8% or $510 billion in total spending. Banks are cautious to lend money which means that more sources of capital are needed. Strong competition from other renewable energy projects with lower (perceived) risks (specifically wind) can be experienced. Fuels should be taxed directly proportional to their energy content since competition balance supply and demand. Market prices including CO2 costs allocate resources most efficiently.
4. 6.4. BiofuelsThe transport sector is responsible for about 20% of world primary energy demand (94 EJ). The passenger
Created by XMLmind XSL-FO Converter.
6. RENEWABLE ENERGY ALTERNATIVES
vehicle fleet will double to 1.7 billion in 2035. Today 96% of vehicles are dependent on petroleum and 60% of oil is used for transport fuel.
Biofuels are not a new technology. Rudolf Diesel ran an engine on peanut oil at the World’s’ Fair in Paris in 1900, and liquid fuels made from sources such as food crops have been researched for more than a century. For most of that time, interest in biofuels was confined to rather specialist research projects, largely unnoticed by members of the public (with the exception of Brazil). However, towards the end of the 20th century, a number of challenges to the modern way of life combined to bring (has brought) biofuels to national and international attention. Increasing worries over energy security in the face of growing demand, dwindling supplies of oil, and international conflicts and wars drove countries dependent on energy imports to look for alternative, home-grown sources.
Interest in biofuels further intensified with the search for new opportunities for economic development, especially in agriculture. This was particularly relevant in emerging economies such as India and China; however, creating new jobs and a new industry are also attractive prospects in the developed world, where many established sectors such as agriculture and manufacturing are increasingly precarious. And, most recently, the growing awareness of the dangers of global climate change reinforced the challenge to find alternatives to fossil fuels as the dominant form of energy.
World fuels and especially European fuels are moving towards diesel, however, there is more supply of ethanol available than biodiesel. Indirect LUC effects seem to affect more conventional biodiesel than conventional ethanol. Liquid biofuels for transport are generating the most attention and have seen a rapid expansion in production. World fuel ethanol production amounted to 1.8 EJ and biodiesel production increased to 0.6 EJ in 2010. Liquid biofuels make a small but growing contribution to fuel usage worldwide, they covered about 3% (2.4 EJ) of global road transport fuel consumption (in energy value). They accounted for higher shares in some countries (e.g., 4% in the United States) and regions (3% in the EU) and provided a very large contribution in Brazil, where ethanol from sugar cane accounted for 41.5% of light duty transport fuel during 2010.
However, biofuels have the potential to meet 27% of world demand for transportation fuels by 2050 (IEA, 2010b). A considerable share of the required volume will have to come from advanced biofuel technologies that are not yet commercially deployed. Even though liquid biofuels supply only a small share of global energy needs, they still have the potential to have a significant effect on global agriculture and agricultural markets, because of the volume of feedstocks and the relative land areas needed for their production.
Currently, around 80% of the global production of liquid biofuels is in the form of ethanol. In 2010 global fuel ethanol production reached 85 billion litres, global biodiesel production amounted to 16.5 million tons, or 18.5 billion litres ((Figure 3 and Figure 4). In 2010 the United States was the world’s largest producer of biofuels, followed by Brazil and the European Union. Despite continued increases in production, growth rates for biodiesel slowed again, whereas ethanol production growth picked up new momentum.
6.3. ábra - Figure 3: Word fuel ethanol production, 2010
Created by XMLmind XSL-FO Converter.
6. RENEWABLE ENERGY ALTERNATIVES
6.4. ábra - Figure 4: World biodiesel production, 2010
The global ethanol industry recovered in 2010 in response to rising oil prices. Some previously bankrupt firms returned to the market, and there were a number of acquisitions as large traditional oil companies entered the industry. The two world’s top ethanol producers, the United States of America and Brazil, accounted for around 90% of total production, with the remainder accounted for mostly by the EU, China and Canada (Figure 3). The US is the world’s largest bioethanol producer. In 2010, it produced 50 billion litres of ethanol and accounted for nearly 60% of global production. In Brazil fuel ethanol production reached 26 billion litres and in the EU 4.3 billion litres in 2010. China, at 2 billion litres, remained Asia’s largest ethanol producer, followed by Thailand and India, which more than doubled its annual production to 0.25 billion litres. Other important producers included Canada, Colombia, Poland, and Spain. Africa represents a tiny share of world production but saw continued rapid growth in production during 2010 (Licht, F.O., 2011).
Global biodiesel production amounted to 16.5 million tons (18.5 billion litres) in 2010. Biodiesel production is far less concentrated than ethanol, with the top 10 countries accounting for 75% of total production in 2010. The European Union remained the centre of global biodiesel production, with 8.9 million tons litres and representing 54% of total output in 2010 (Figure 4). Biodiesel accounted for the vast majority of biofuels consumed in the EU, but growth in the region continued to slow (Licht, F.O., 2011). The slowdown of biodiesel output in many countries was due to increased competition with relatively cheap imports from outside the EU (including Canada, Argentina, and increasingly Indonesia). This trend is leading to plant closures from reduced domestic production requirements, an expansion of tariffs on imports, and increases in some blending mandates.
Germany remained the world’s top biodiesel producer at 2.3 million tons in 2010, followed by Brazil, Argentina, France, and the United States. Consumption in Germany has declined significantly since the elimination of Germany’s biodiesel tax credit. The greatest drop in demand has been in pure vegetable oil and B100 (100% unblended biodiesel). In contrast, the use of blended biodiesel has increased during this period due to the national blending quota, and total production rose in 2010. The greatest production increase was seen in Brazil and in Argentina, which continued its rapid growth with production, three-quarters of which was exported (and national blending rare has been increased from B5 to B7). In the United States, biodiesel production fell more than 40%. Almost 12% of biodiesel production occurred in Asia, with most of this from palm oil in Indonesia and Thailand.
Advanced biofuels are high-energy liquid fuels, usually used for transportation derived from low nutrient input, high-yield crops, agricultural or forestry waste, or other sustainable biomass feedstocks including algae. There is considerable debate on how to classify biofuels. Biofuels are commonly divided into first-, second- and third-generation biofuels, but the same fuel might be classified differently depending on whether technology maturity, GHG emission balance or the feedstock is used to guide the distinction. The most transparent way is to follow a definition based on the maturity of a technology, and the terms “conventional” and “advanced” for classification (IEA, 2010b).
Advanced biofuels are biofuels produced from sustainable feedstock. Sustainability of a feedstock is defined
Created by XMLmind XSL-FO Converter.
6. RENEWABLE ENERGY ALTERNATIVES
among others by availability of the feedstock, impact on GHG emissions and impact on biodiversity and land use. The GHG emission balance depends on the feedstock and processes used, and it is important to realise that advanced biofuels performance is not always superior to that of conventional biofuels. Advanced biofuel technologies are conversion technologies which are still in the research and development (R&D), pilot or demonstration phase.
High capital costs and limited market differentiation (same ethanol molecule/same price) are preventing investment in cellulosic ethanol. It is not attractive to venture capital, banks are not in a hurry either and strategic partners are balancing against other options. Government policies, incentives and financial support is necessary to move new technology from lab to commercial deployment. Government can also use ”technology push” policies – time bound subsidies to assist new technologies through the demonstration phase with multiple tools (tax credit, support of FFV sale and blender pumps, higher mandates, low carbon fuel standards ect). The biofuel industry must collaborate since new policy support cannot be at the expense of other biofuels, and cellulosic ethanol and grain ethanol need to carry this forward together.
Hydrotreated Vegetable Oil (HVO) is a drop-in biofuel, i.e. has same molecular structure as hydrocarbons and offers benefits to all stakeholders since it is compatible with existing diesel logistics, existing distribution, engines and vehicle systems without any modifications. It has outstanding blending properties without blending limits and good storage stability. HVO exceeds minimum requirements of the fuel specification and can be produced from a wide range of vegetable oils and waste animal fats with significant reduction in GHG emissions. The production cost is still higher than the cost of the conventional biodiesel production. It is available in commercial sale, for example in Finland.
Algae have been cultivated commercially since the 1950s, mainly for the pharmaceutical industry, but only recently gained attention as a potential source of biomass. Algae oil does have potential as feedstock for biodiesel in future; however, biodiesel from algae must meet given fuel standards. Algae oil is a challenging raw material for biodiesel production if mature conversion technology for reaction and purification is developed. Algae promise a potentially high productivity per hectare, could be grown on non-arable land, can utilise a wide variety of water sources (fresh, brackish, saline and wastewater), and potentially recycle CO 2 and other nutrient waste streams. However, algae cultivation faces several challenges, related to availability of locations with sufficient sunshine and water, required nutrient inputs, and oil extraction. Traditional oil companies have begun to enter the algae industry. In the future, algae-based biorefinery systems and seaweed production to assimilate dissolved nutrients combined with intensive fish or shrimp culture in integrated multi-trophic aquaculture systems may be a viable option (van Iersel et al., 2010).
The installation of the first commercial-scale advanced biofuel plants is anticipated within the next decade, followed by rapid growth of advanced biofuel production after 2020. Some novel technologies such as algae biofuels and sugar-based hydrocarbons will also need to be developed, but commercialisation of these will require more substantial R&D. The installed advanced biofuel capacity today is roughly 200 million litres gasoline equivalent per year and production capacity of another 1.9 billion litres gasoline equivalent is currently under construction (IEA, 2010b).
Ultimately, bioenergy production may increasingly occur in biorefineries where transport biofuels, power, heat, chemicals and other marketable products could all be co-produced from a mix of biomass feedstocks. Biorefinery is a facility that integrates upstream, midstream and downstream processing of biomass into a range of products (fuels, power, and chemicals); analogous to today's petroleum refineries, which produce multiple fuels and products from petroleum. Margins on petrol and diesel are very poor. Today about 10% of crude oil is used to make chemicals generating 35% of refinery profits. Why should biorefinering be any different? The economic competitiveness of the operation is based on the production of high-value, low-volume co-products in addition to comparably low-value biofuels. Biorefineries can potentially make use of a broader variety of biomass feedstocks and allow for a more efficient use of resources than current biofuel production units, and reduce competition among different uses of biomass (Jong and Ree, 2009).
5. 6.5. Land use for biofuels productionThe bioethanol share in total grains demand – i.e. corn, wheat and other coarse grains – in 2010 was 8%, or 143 million tons. By adding the feed value of ethanol by-product dried distiller’s grains and soluble (DDGS), the net shares decline by one third to slightly above 5%. The bulk of the worldwide use of grains in alcohol production comprises corn in the USA and China. However, an increase in the offtake of wheat for fuel ethanol can also be observed in Canada and the EU. The fuel ethanol sector, mainly in the US, accounted for 16% (net 11%) of
Created by XMLmind XSL-FO Converter.
6. RENEWABLE ENERGY ALTERNATIVES
global corn consumption and 20% of global sugar cane production. The biodisel share in rapeseed, soybean and palm oil demand was around 10% of global vegetable oil production. The share of waste biodiesel feedstocks such as animal fat and used cooking oil increased to 15% in total biodiesel output in 2010 (Licht, F.O., 2011).
In 2010 about 20 million gross hectares of grains, sugar cane and cassava for fuel ethanol production and 20 million gross hectares of oilseed feedstock was needed for biodiesel production. The proportion of global cropland used for biofuels is currently some 2.5% with wide differences among countries and regions. In the US some 8% of cropland is dedicated to biofuel production, however, 20-35% of corn and soybean area is used for biofuel production. In the EU 5-6% of cropland is used for biofuel but 25% of biofuel feedstock or biofuel is imported. In Brazil biofuel is just requiring 3% (ethanol 1.5%) of all cropland (included pastureland) available in the country even if more than 50% of sugar cane area (20% of global area) is used for ethanol production (author’s calculation).
The fuel production processes give rise to by-products which are largely suitable as animal feed. By-products are supposed to be credited with the area of cropland required to produce the amount of feed they substitute. In the cases of grains and oilseeds, DDGS (dried distillers grains with solubles) and CGF/CGM (corn gluten feed/meal) and oil cakes (mainly rapeseed and soybean cake/meal) substitute grain and soybean as feed. It means that not all the grains used for ethanol production should be subtracted from the supplies since some 35% is returned to the feed sector in the form of by-products (mainly DDGS) so the land required for feedstock production declines to 15 million hectares. In case of biodiesel production 50-60% of rapeseed (rapeseed cake/meal) and 80% of soybean (soybean meal) is returned to the feed sector and the net land requirement decrease to around 6 million hectares. By adding by-products substituted for corn and soybean meal the net hectares needed for fuel ethanol decline to 21 million (author’s calculation). By adding by-products substituted for grains and oilseeds the land required for cultivation of feedstocks declines to 1.5% of the global crop area (net land requirement).
Based on the land-use efficiencies land use for biofuel production would need to increase from 40 million hectares (21 million hectares net land requirement by adding by-products substituted for grains and oilseeds) to around 100 million hectares in 2050. This corresponds to an increase from 2.5% of total arable land today to around 6% in 2050.
6. 6.6. Environmental impact of biofuelsThe role of bioenergy systems in reducing GHG emissions needs to be evaluated by comparison with the energy systems they replace using life-cycle assessment (LCA) methodology. The precise quantification of GHG savings for specific systems is often hampered by lack of reliable data. Furthermore, different methods of quantification lead to variation in estimates of GHG savings. Nonetheless practically all bioenergy systems deliver large GHG savings if they replace fossil-based energy and if the bioenergy production emissions – including those arising due to land use change – are kept low. Currently available values indicate a high GHG mitigation potential of 60-120%3, similar to the 70-110% mitigation level of sugarcane ethanol and better than most current biofuels (IEA Bioenergy, 2009). However, these values do not include the impact of land use change (LUC)4 that can have considerable negative impact on the lifecycle emissions of advanced biofuels and also negatively impact biodiversity.
To ensure sustainable production of advanced biofuels, it is therefore important to assess and minimise potential indirect LUC caused by the cultivation of dedicated energy crops. This deserves a careful mapping and planning of land use, in order to identify which areas (if any) can be potentially used for bioenergy crops. Brazil is the only emerging country that has initiated the agro-ecological sugarcane zoning programme (ZAE Cana) to direct available land to the production of biofuel feedstock in order to stop deforestation and indirect land use change. The programme constrains the areas in which sugar cane production can be expanded by increasing cattle density, without the need to convert new land to pasture. The programme is enforced by limiting access to development funds for sugar cane growers and sugar mill/ethanol plant owners that do not comply with the regulations. The programme currently focuses on sugarcane, but it could also be applied to other biofuel feedstocks.
Biomass for energy is only one option for land use among others, and markets for bioenergy feedstocks and
33 An improvement higher than 100% is possible because of the benefits of co-products (notably power and heat).
44 Two types of land use change (LUC) exist: direct LUC occurs when biofuel feedstocks replace native forest for example; indirect LUC (iLUC) occurs when biofuel feedstocks replace other crops that are then grown on land with high carbon stocks.
Created by XMLmind XSL-FO Converter.
6. RENEWABLE ENERGY ALTERNATIVES
agricultural commodities are closely ulinked. Thus, LUC effects which are “indirect” to bioenergy are “direct” effects of changes in agriculture (food, feed), and forestry (fiber, wood products). They can be dealt with only within an overall framework of sustainable land use, and in the context of overall food and fiber policies and respective markets.
The direct LUC effects of bioenergy production can, in principle, be controlled through certification systems, wherever biomass is grown. The risks of land-use change and resulting emissions can be minimised by focusing on wastes and residues as feedstock; maximising land-use efficiency by sustainably increasing productivity and intensity and choosing high-yielding feedstocks; using perennial energy crops, particularly on unproductive or low-carbon soils; maximising the efficiency of feedstock use in the conversion processes; cascade utilisation of biomass, i.e. ulinking industrial and subsequent energetic use of biomass; co-production of energy and food crops.
Changes in land use, principally those associated with deforestation and expansion of agricultural production for food, contribute about 15% of global emissions of GHG. Currently, less than 3% of global agricultural land is used for cultivating biofuel crops and LUC associated with bioenergy represents only around 1% of the total emissions caused by land-use change globally most of which are produced by changes in land use for food and fodder production, or other reasons (Berndes et al. 2010). Indirect land-use changes, however, are more difficult to identify and model explicitly in GHG balances. Most current biofuel production systems have significant reductions in GHG emissions relative to the fossil fuels displaced, if no indirect LUC effects are considered.
7. Questions1. Global energy consumption?
2. Global bioenergy resources?
3. Types of feedstocks for bioenergy production?
4. Bioenergy and biofuels demand in 2050?
5. What about competition for financing between renewable energy alternatives?
6. World fuel ethanol and biodiesel production?
7. Impact of biofuel production on use of agricultural land?
8. ReferencesBerndes, G. et al. (2010): Bioenergy, Land-use change and Climate Change Mitigation. Paris: IEA. http://www.ieabioenergy.com
BNEF (2011): Global Renewable Energy Market Outlook. Bloomberg New Energy Finance. https://www.bnef.com/PressReleases/view/173 (accessed Jan. 28 2012).
de Jong, E. and van Ree, R (2009): Biorefineries: Co-production of Fuels, Chemicals, Power and Materials from Biomass. IEA Bioenergy. http://www.ieabioenergy.com/task.aspx?id=42
FAOSTAT (2011): FAOSTAT. Rome: FAO. http://www.faostat.fao.org/default.aspx (accessed Dec.28 2011).
Fischer, G. et al. (2009): Biofuels and Food Security. Vienna: The OPEC Fund for International Development (OFID) and International Institute of Applied Systems Analysis (IIASA).
Haberl, et al. (2007): Quantifying and mapping the human appropriation of net primary production in earth’s terrestrial ecosystems. Proceedings of the National Academy of Sciences, 104(31): 12942-12947.
IEA Bioenergy (2009): A Sustainable and Reliable Energy Source. Main Report. Paris: International Energy Agency.
IEA (2010a): Sustainable Production of Second-Generation Biofuels. Potential and perspectives in major economies and developing countries. Paris: OECD/IEA
Created by XMLmind XSL-FO Converter.
6. RENEWABLE ENERGY ALTERNATIVES
www.iea.org/papers/2010/second_generation_biofuels.pdf (accessed Dec.19 2011).
IEA (2010b): Energy Technology Perspectives 2010. Scenarios & Strategies to 2050. Paris: OECD/IEA.
IPCC (2011): Special report on renewable energy and climate change mitigation. Potsdam: Intergovernmental Panel on Climate Change. http://srren.ipcc-3.de/report/IPCC_SRREN_Full_Report.pdf
Kampman, B. et al. (2010): BUBE: Better Use of Biomass for Energy. Background Report to the Position Paper of IEA RETD and IEA Bioenergy. Darmstadt: CE Delft/Öko-Institut.
Krausmann, F., Erb, K.H., Gingrich, S., Lauk, C., Haberl, H. (2008) Global patterns of socioeconomic biomass flows in the year 2000: A comprehensive assessm ent of supply, consumption and constraints. Ecological Economics 65(3): 471-487.
Licht, F.O. (2011): World Ethanol and Biofuel Report (Jan.–Dec.). London: Agra Informa.
Smeets, E. et al. (2007): “A Bottom-Up Assessment and Review of Global Bioenergy Potentials to 2050”. Energy and Combustion Science. 33: 56-106.
van Iersel, M. P., Pico, A. R., Kelder, T., Gao, J., Ho, I., Hanspers, K., Conklin, B. R. and Chris T Evelo, C. T. (2010): The BridgeDb framework: standardized access to gene, protein and metabolite identifier mapping services. BMC Bioinformatics, 2010, 11:5,doi: 10.1186/1471-2105-11-5. http://www.biomedcentral.com/1471-2105/11/5
Created by XMLmind XSL-FO Converter.
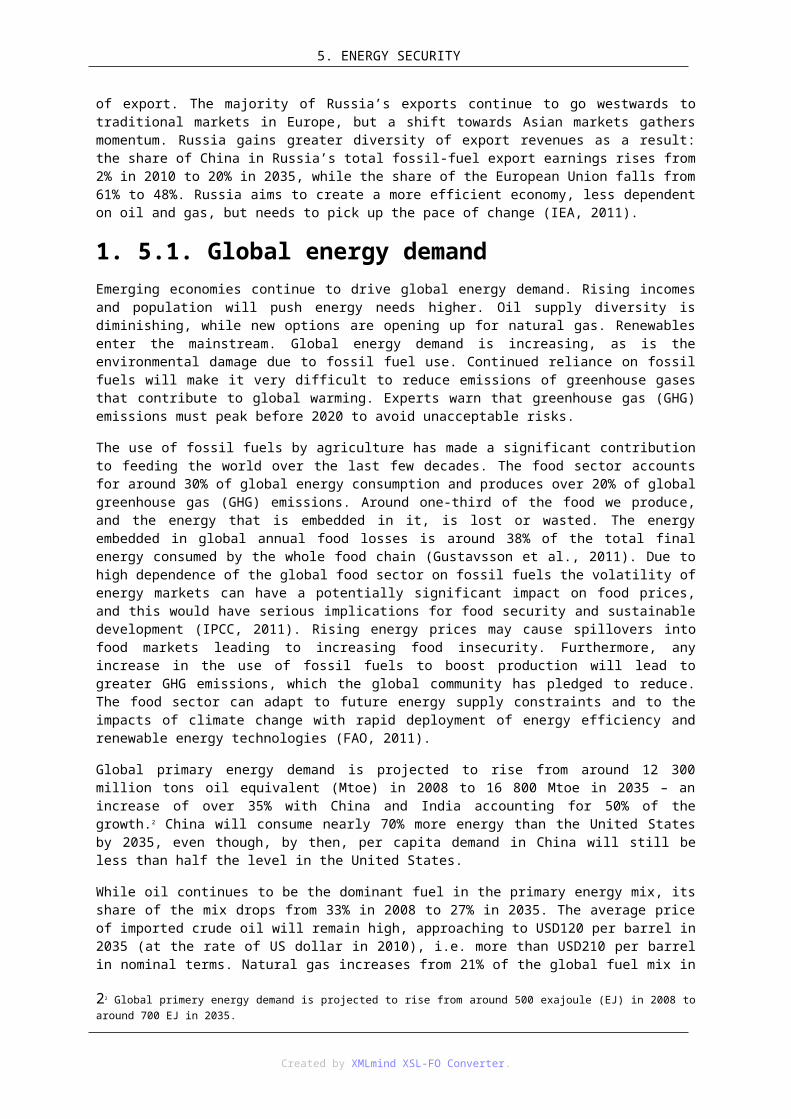
7. fejezet - 7. ENVIRONMENTAL SECURITY1
Introduction
Agriculture must deal with a finite set of resources required for food, feed, and biofuel feedstock production while population and standard of living continues to increase across a broad group of developing societies. Agriculture’s ability to supply products in sufficient quantity and quality to meet rising demand will be challenged more in the coming years than ever before, even if climate were to remain stable and relatively favourable for food production. A stable favourable climate for food production seems unlikely as evidence exists that climate change has already negatively impacted cereal production over recent decades (Lobell et al., 2011).
1. 7.1. Food costWorld population will continue to expand with a virtually certain 30% increase in the next 40 years. A majority of this increase will occur in undeveloped and developing regions of the world (United Nations, 2011). Meeting the basic human need for food (daily caloric intake) will depend upon agricultural production increases in regions currently experiencing food shortages to balance the increasing demand expected from a growing population. However, anticipated climate changes will likely make this a difficult scenario to fulfil. In addition to growing demands for agriculture food products, increased use of traditional food and/or feed for non-food products, such as corn grain for ethanol, is reducing food/feed supplies. Not only does alternative uses impact supply of food and feed directly, it has significant impacts on food prices. Food price is particularly critical for nations experiencing poverty.
With rising food demand and a marginal ability to meet that demand, especially in some regions, food price and price stability are vulnerable to small production shocks such as those due to abnormal climate events (World Bank, 2012). Not only will the risk of food shortages rise for a variety of reasons, the cost of food that is available may be increasingly unaffordable to the less-affluent people of the world. Food price and availability have had, and will have impacts beyond those living in poverty. High food prices and food shortages have been implicated in political unrest in multiple countries in recent years, with concerns that these situations could become more prevalent (Lagi et al., 2011). The need for an efficient, stable, and highly productive agricultural industry is critical.
2. 7.2. Agricultural land depletionWhile demand for agricultural products is increasing, land suitable for agricultural production worldwide is decreasing (due to urbanization, motorization etc.). China has lost productive land due to urban expansion since 1986. It seems land consumed by urban expansion has been replaced with other land, but the replacement land is of lower productivity. As China’s economy expands, rate of agricultural land conversion, however, seems to be accelerating and concerns exist about this impact on food security (Deng et al., 2006). Land use plans have called for as much as 42% of Indonesia’s high producing paddy rice fields to be converted to non-agricultural purposes (Fahmuddin Agus and Irawan, 2006).
Recent estimates indicated conversion of agriculture land to non-agricultural land use in Bangladesh is at an annual rate of 0.56%; loss of rice production ranges from 0.86 to 1.16% annually (Quasem, 2011). “As economies expand, agricultural land tends to assume uses that have higher economic value and financial return than that obtained through agricultural production. Loss of productive land worldwide has significantly reduced agricultural production potential and unless creative policies and means of enforcing those policies are developed, this loss is likely to continue” (Cruse, 2012).
Agriculture utilizes 11-12% of the world’s land surface. Globally, 25% of agricultural land is considered to be highly degraded such that livelihoods have been compromised, production capacity has been seriously diminished, and opportunities to renovate are limited or non-existent (FAO, 2011). Further, many of these
11 The chapter Environmental security is based on the manuscript “Agriculture: is climate change a serious issue” of Cruse, R. M. (2012).
Created by XMLmind XSL-FO Converter.
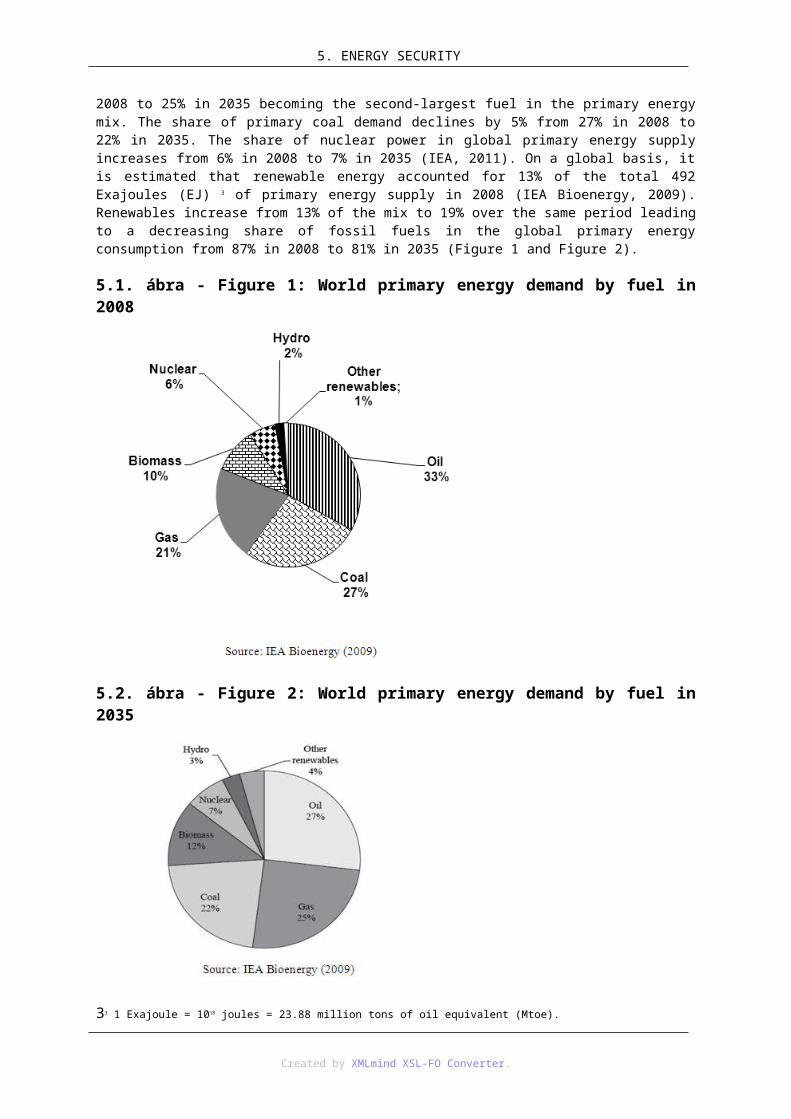
7. ENVIRONMENTAL SECURITY
degraded lands occur in regions with high poverty and only marginal or no potential to increase food production. Estimates indicate that yields have been compromised 20% by erosion in India, China, Iran, Israel, Jordan, Lebanon, Nepal, and Pakistan (Drenge, 1992). While absolutely imperative that world soil resources be managed in a sustainable manner, it is unlikely that the pace of land degradation will slow in the near future given the historical trend and stress placed on these resources due to rising demand for food, feed and fuel production. Management of soils to maintain or even increase productive potential should be one of the highest priorities for the agricultural sciences.
3. 7.3. Irrigation and aquifer stress“Water availability and food production are tightly ulinked. Agriculture consumes 70% of all fresh water withdrawals, mostly for irrigation purposes. While covering only 18% of the world’s agricultural land, the production of 40% of world food/feed/fuel feedstock is assisted by irrigation. Irrigation yields are not only high, they are very stable, as irrigated land has less risk of crop production failure than does rainfed land. In a world of growing food demand, high and stable yields (year to year yield consistency) are critical for maintaining stable food supplies and for reducing sharp price fluctuations that can be devastating for those in poverty and that can have significant impact on political stability” (Cruse, 2012).
“While irrigation offers high crop yields and stable production, a substantial portion of water extracted for irrigation comes from ancient aquifers that are being stressed and in some locations depleted (closed basins.). Multiple countries relying on irrigation for food production face serious to severe water stress issues (Figure 1). Saudi Arabia exemplifies a country that has produced wheat for their own citizens until recently as water resources used for irrigation have been severely stressed. Wheat harvest, dependent on irrigation from ancient aquifers, peaked at 4.1 million tons in 1992 and dropped 71% to 1.2 million tons in 2005. Irrigation subsidies have been removed “ (Cruse).
7.1. ábra - Figure 1: Closed basins
Irrigated land in China produces approximately 75% of the country’s cereals, and about 90% of its cotton (is a very water intensive crop), fruits vegetables and other agricultural commodities (FAO, 2010). Brown (2010) identifies 15 countries that were over-pumping aquifers in 2005; these countries had a combined population of 3.3 billion people and included population centres of China, India, and Pakistan. Some farmers reportedly were pumping water from depths greater than 1 200 meters (Figure 2). Feeding a growing world population on less water for crop production seems a stark reality and one that places increasing pressure on rain-fed agricultural areas.
7.2. ábra - Figure 2: Aquifer stress
Created by XMLmind XSL-FO Converter.
7. ENVIRONMENTAL SECURITY
Development of lands that are not being farmed, but that are suitable for crop and/or animal production, seems necessary if we are to meet projected food demand increases. Through use of available technology substantial areas currently unfarmed could support rain-fed agriculture. Greatest potential for expansion was in East and Middle Africa and South America. Developing countries contain nearly three times as much potential rain-fed farmable land as the developed countries.
4. 7.4. Yield increaseWhile soil resource limitations and water stress seem serious concerns as we look to the future, crop yields and world production have experienced a consistent increase for multiple decades although these increases have not been uniform across regions. Improved genetics (during the period of the green revolution) coupled with increased fertilizer use and expansion of irrigated land resulted in dramatic production increases of wheat and rice.
“Recently, however, the rate of increase has diminished in relation to growing demand, especially in areas such as the US and Europe where advanced crop production technology is being practiced and high yields are observed” (Cruse). The slowing pace of crop yield increases suggests further challenges for global food security in that these existing high producing areas seem to be approaching a yield and production plateau (Cassman et al., 2011). Further, management practices (high yielding varieties, sound fertility practices, and high plant populations) are nearly optimum for production in these countries and thus yield improvements attributed to management improvements in these areas will likely be marginal or non-existent. “Agricultural production increases must occur in regions currently experiencing lower yields as it seems that these areas, through improved technology, have the greatest opportunity for production increases; all things considered, demand increases threaten to outpace production increases in the near and extended future. Thus, future yield increases on lands currently supporting high production levels must come from continued yield enhancing genetic modifications” (Cruse, 2012).
Genetics will face greater challenges in fostering higher yields in significant areas that already are highly productive. Increasingly higher yields must occur on soils that are experiencing significant degradation through soil erosion and soil organic matter loss. Further, challenges to continued yield increases may be based on basic plant physiology principles. Continued crop yield increases are not likely since yield is coupled to transpiration and that water limitations and our inability to continually move more water through the crop will cap yield advances.
5. 7.5. Climate changeClimate change potentially modifies or impacts each stress associated with agriculture’s ability to meet the growing demand for agricultural products. In many cases, when considered globally, climate change acts as a multiplier to existing challenges. Increasing variability of climate components and increased frequency of extremes will very likely have negative impacts on production of existing crops in current agricultural areas, which further magnifies the importance of positive production advances being made in agricultural sciences. And while agriculture must adapt to climate change, it also contributes substantially to greenhouse gas emissions leading to climate modification (US National Research Council, 2010).
Climate change components can be divided into those which are highly dynamic (those that vary sufficiently to affect biological systems at the daily and sometimes smaller time scales) and those that are less dynamic but change predictably and more uniformly in space and time (Figure 3). The more dynamic components also tend to vary spatially and can be exemplified by precipitation and air temperature; long term predictability is relatively challenging and accuracy of predictions within short time scales or regionally with current technology is problematic. In contrast, a component such as CO2 concentration changes slowly, consistently, and quite predictably. Its impact on biological productivity may be as important as the more dynamic changes, but its change is more gradual, and as such, its impact more easily addressed.
7.3. ábra - Figure 3: Climate change
Created by XMLmind XSL-FO Converter.
7. ENVIRONMENTAL SECURITY
It is the impact of extreme conditions that will define productivity levels, and not the averages. Research addressing crop response to variance in climate components is lacking and an area that demands much attention. Additionally, growth affecting climatic factors that interact, i.e., CO 2 , temperature and rainfall, must be addressed factorials as understanding only main effects greatly limits our understanding of real world outcomes. Climate variability will play an increasingly important production roll in the coming decades.
6. 7.6. Carbon dioxide concentrationIncreasing CO2 concentration has positive photosynthesis effects and therefore favourable crop production impacts, at least under controlled environmental conditions; these effects have been well documented (Fleisher et al., 2011). “Research quite conclusively indicates that, with all other factors being held constant, increased CO2 concentration, or CO2 fertilization, will increase crop production potential, with C3 crops responding more than C4 crops. However, caution is advised in interpreting this to mean rising CO 2 levels will increase global food security. To illustrate, plants are composed of 16 different nutrient elements, with 13 of these obtained from the soil” (Cruse, 2012).
“Healthy crop seeds or fruit, the most important human food component of plants, have higher nutrient needs and are more sensitive to nutrient deficiencies than most other plant organs. For CO 2 enrichment to favourably affect global food security, sufficient additional nutrients must be absorbed from the soil to compliment elevated carbon fixation occurring during photosynthesis, thus promoting normal healthy plant organs, including seeds and/or fruit” (Cruse, 2012). High level of crop production on most world soils is nutrient and/or water limited; thus unless the nutrient absorption kinetics at and near the root surface are changed such that nutrient absorption occurs more rapidly under what is currently considered nutrient limiting conditions, or agriculture expands to soils for which nutrients and water are non-limiting, or substantial increases in soil nutrient application occur on nutrient deficient soils, increasing CO2 concentration is unlikely to add dramatically to quality food production. Yield increases attributed to CO2 concentration increases will be less than multiple studies have suggested and that quality of the consumable plant component will be lower than that associated with lower CO 2
concentrations (Ainsworth and McGrath, 2009).
“Under controlled conditions elevated CO2 concentration reduces plant stomata openings, which results in lower transpiration rates and, in general, improved water use efficiency, again with all other factors remaining constant or nearly so. As atmospheric temperatures rise and rainfall variability increases, improving water use efficiency is highly desirable, especially in areas where production is water limiting” (Cruse, 2012). One must remain aware that transpiration cools the leaf and that lowering transpiration rate, while improving water use efficiency under controlled environmental conditions, also results in a warmer leaf. The combined impact of atmospheric CO2 increases and lower transpiration rates, accompanied by elevated atmospheric temperature extremes on photosynthesis is less well understood (Fleisher et al., 2011), although modelling efforts suggest the effect of combined elevated CO2 concentration and temperature may not decrease yield of wheat with adapted management practices (Wang and Connor, 1996). Climate models predict combined increase of CO2 and air temperature, basically assuring that future leaf photosynthesis will be occurring under elevated leaf temperatures.
Plant breeding and genetic engineering will be critical tools for adapting crop plants to changing climatic conditions (Ceccarelli et al., 2010). Genetic and management advances that adapt to, and even take advantage of, changing climate averages seem much easier to address than adapting to the variance of these conditions. Unfortunately, a changing climate is much more complex than simply changing average values of selected climate component(s). The variance is also likely to increase, that is, the variation about the mean value of different climate variables will likely be greater than it is today; frequency of extreme events and intensity of
Created by XMLmind XSL-FO Converter.
7. ENVIRONMENTAL SECURITY
events are likely to increase (IPCC, 2007); this is anticipated especially for atmospheric temperature and precipitation. Plant breeding and genetic modifications must increasingly address variance aspects of climate and interactions of climate components.
7. 7.7. TemperatureAir temperature increases associated with rising concentrations of greenhouse gases have been well documented empirically and are predicted to occur through multiple ensembles of climate models (IPCC, 2007). Anticipated average global, and even average regional temperature increases, seem realistically manageable from the agricultural production perspective when considered in light of potentially attainable genetic improvements and management modifications, such as increased irrigation and agricultural land expansion.
“Understanding that adapting to gradual rise in average temperature seems quite possible, the Intergovernmental Panel on Climate Change (IPCC) cautions that average surface temperature rise of 3°C may lead to reduction in agricultural production. Recently, temperature extremes have periodically devastated crops. Improving crops to not only survive such conditions, but to produce when such conditions exist during a significant period of the life cycle is increasingly important; it is also an incredible challenge” (Cruse, 2012).
“A second challenge involves rising night time temperatures. Plant respiration consumes plant carbohydrate resources and this process is temperature dependent” (Cruse, 2012). Observed and predicted night time minimum temperatures are increasing at a rate faster than increases in daytime maximum temperatures. As night time respiration increases, photosynthetic is consumed leading to a general understanding that crop yields will be negatively impacted. Grain yield decreased approximately 10% for each 1°C increase in growing-season minimum temperature during the dry season (Peng et al., 2004).
The respiration impact of elevated night time temperatures on rapidly growing plants, however, may be less than environmentally controlled studies tend to suggest (Frantz et al., 2004). The magnitude of yield reduction associated with elevated night time temperature is not yet conclusive; however, the general consensus is that increasing night time temperature will have a negative effect on yields.
8. 7.8. PrecipitationThe earth’s atmosphere is warming 0.13 °C per decade (Easterling and Karl (2008). Additionally, the atmosphere's water vapour content is increasing with measured increases over the earth’s oceans of about 0.41 kg/m3 per decade since 1988 (Santer et al., 2007). Latent energy accompanies the added water vapour. The combination of heat energy associated with globally rising air temperatures and latent energy associated with increases in water vapor in the earth’s atmosphere suggests greater atmospheric instability is likely; stated very simplistically, with increased instability the potential for high energy precipitation events increases. Climate records indicate that frequency of extreme events is occurring and climate models suggest this trend will continue (Min et al., 2011).
“Similar to temperature, precipitation variability presents greater challenges to the agricultural community than does the change in average precipitation values. Adapting to extended periods of excessively wet or dry conditions, for example, is much more difficult than adapting to average changes in availability of water necessary for plant processes. Water dynamics are a bit more manageable than temperature in that water must infiltrate soil, be retained in the soil, and then be absorbed by the plant root and transpired by the crop plant. Water availability is not only rainfall dependent, but significantly influenced by soil surface conditions influencing infiltration rates, soil water evaporation losses, and soil profile properties impacting water retention and plant root growth” (Cruse, 2012).
These conditions, favourable or unfavourable, are often the result of soil management practices used by the farmer. Further plant genetic improvements have helped crop plant survival during quite severe water stress conditions (Sinclair, 2011). Survival is critical to withstand water deficit stress; however crop survival alone is insufficient to meet rising global demand for food. Adaptations that will foster production to continue when plants are under substantial water stress must be the geneticist’s goal.
Adding to this challenge, nutrient uptake is impeded by soil water deficit. Nutrients enter plant roots in solution, roots must contact soil particles and/or water films for nutrient transfer to occur from soil to roots, and roots shrink when plant turgor pressure is reduced from water deficit reducing the root to soil contact interface (Carminati et al., 2009). Genetics fostering plant survival is one part of the drought and heat stress production
Created by XMLmind XSL-FO Converter.
7. ENVIRONMENTAL SECURITY
puzzle. Soil conditions promoting required transfer of water and nutrients to the root surface is also vital to maintaining production under water stress conditions. Our ability to enhance nutrient transfer and uptake under water deficient conditions is without a doubt limited and a mechanistic process that likely will remain limiting under water deficit conditions. Nonetheless, favourable soil quality will enhance infiltration, reduce evaporation losses, favour root growth, improve water retention and support crop plant survival and production during stress periods.
Increasing production in regions currently producing well below their potential such as that occurring in many underdeveloped countries will become increasingly important in addressing local and world food needs. Unfortunately, most climate models predict that significant land areas for which production increases could occur under current weather conditions will experience an increasingly challenging climate for crop production in the coming decades (Lobell et al., 2008). This again highlights the importance of managing the soil resource base to both enhance production potential and to improve crop plants tolerance of stress periods that are likely to occur with increasing frequency.
Montgomery (2007) indicates current conventional agriculture practices globally result in erosion rates an order of magnitude greater than soil regeneration rates. In Iowa, USA, an area equivalent to 25% of row crop production in the state eroded at a rate 20 – 100 times the estimated soil renewal rate in 2007, a year with quite typical rainfall patterns (Cox et al., 2011). Degradation pressure on soils worldwide is not likely to decrease; recent trends and climate models suggest the contrary.
9. 7.9. Climate change, soil degradation and crop productivity interactionProduction potential differs dramatically between soils as soil properties important for crop growth vary spatially across the landscape and even more so between regions. Temporal variation in soil productivity also exists, but is less frequently addressed as it tends to be more subtle than spatial variability. Fertility, soil erosion, soil salinization and/or soil organic matter content vary with time for most farmed soils; in most situations agriculture practices degrade rather than improve soil properties that affect productivity (Eswaran et al., 2001).
“Causes of yield loss vary for the different degradation processes and can be basically classified as those that damage the plant soil water relationship, reduce or inhibit root growth (inhibiting water and nutrient uptake), and/or reduce soil nutrient content. Nutrients can be added as either organic or inorganic fertilizers, if available, to supplement lost fertility, however fertilizers are not always available or may be too costly for farmer purchase. Nonetheless, compensation for nutrient loss can be addressed with technology. Degradation of physical conditions through erosion, salinization, or depletion of soil organic matter critically affects soil-plant-water relationships, has much longer term impacts, and is much more difficult to correct”(Cruse, 2012).
The impact of climate extremes, especially rainfall, on land degradation is likely to increase with increasing frequency of these events, and does so disproportionately to rainfall amount. That is, soil erosion increases by a factor of about 1.7 times that of rainfall increase (Nearing et al., 2004). As mentioned earlier, with rising global demand and increased emphasis on maximizing agricultural production, soils in many regions will very likely become more vulnerable to degradation processes, especially soil erosion from more frequent and stronger storms.
“For rain-fed conditions, production is highly dependent on weather (or climatic conditions). In fact, literature addressing climate change impacts on crop production almost exclusively focuses on air temperatures, changing rainfall, and/or rising CO2 concentration. A critical relationship missing in the literature is that of addressing climate change impacts on crop production with degraded or degrading soils. The combination of increased production demands, higher temperatures and more variable precipitation will increase the need for soil conditions that can meet increased demand for nutrients, and especially water” (Cruse, 2012).
“Genetic improvements can help reduce stress impacts on yield losses, however as yield and food/feed quality is linearly related to transpired water and nutrient uptake, soils must be able to infiltrate water, retain water, and release water to growing plant roots to meet plant needs (24). Soil degradation inhibits each of these processes. One of the most critical challenges soil scientists face is that of maintaining, or increasing, quality of soils under intensive agricultural management” (Cruse, 2012).
10. Questions
Created by XMLmind XSL-FO Converter.
7. ENVIRONMENTAL SECURITY
1. Global population growth, yield increase and food cost?
2 Water crisis: irrigation and aquifer stress?
3. Climate change: carbon dioxide concentration, temperature and precipitation?
4. Climate change, soil degradation and crop productivity interaction?
5. Pressure on global markets and local ecosystems to supply food needs?
11. ReferencesAinsworth, E.A. and J.M. McGrath (2009): Direct effects of rising atmospheric carbon dioxide on crop yields. In: Loebell, D. and Burke, M. (eds.) Climate Change and Food Security: Adapting Agriculture to a Warmer World. New York, NY: Springer. p. 109-132
Brown, Lester (Lead Author), Brian Black, Galal Hassan Galal Hussein (Topic Editor) (2011): “Aquifer” depletion”. In: Encyclopedia of Earth. Eds. Cutler J. Cleveland (Washington, D.C.: Environmental Information Coalition, National Council for Science and the Environment). First published in the Encyclopedia of Earth January 23, 2010; Last revised Date March 22, 2011; http://www.eoearth.org/article/Aquifer_depletion
Carminati, A., D. Vetterlein, U. Weller, H.-J. Vogel, and S.E. Oswald (2009): When roots lose contact. Vadose Zone J. 8:805–809. doi:10.2136/vzj2008.0147.
Cassman, Kenneth G., Patricio Grassini and Justin van Wart (2011): Crop yield potential, yield trends, and global food security in a changing climate. In Danielle Hillel and Cynthia
Ceccarelli, S., S. Grando, M. Maatougui, M. Michael, M. Slash, R. Haghparast, M. Rahmanian, A. Taheri, A. Al-Yassin, A. Benbelkacem, M. Labdi, H. Mimoun and M. Nachit (2010): Plant breeding and climate changes. The Journal of Agricultural Science. 148:627-637. doi:10.1017/S0021859610000651
Cox, Craig, Andrew Hug and Nils Bruzelius (2011): Losing Ground. Environmental Working Group. http://static.ewg.org/reports/2010/losingground/pdf/losingground_report.pdf
Cruse, R. M. (2012): Agriculture: is climate change a serious issue. Manuscript. 3212 Agronomy/Iowa State University, Ames, Iowa/USA
Deng, X., Huang, J., Rozelle, S. and Uchid, E. (2006): Cultivated land conversion and potential agricultural productivity in China. Land Use Policy 23:372–384.
Drenge, H.E. eds. (1992): Degradation and Restoration of Arid Lands. Lubbock: Texas Technical University as cited by: Eswaran, H., R. Lal and P.F. Reich. 2001. Land degradation: an overview. In: Bridges, E.M., I.D. Hannam, L.R. Oldeman, F.W.T. Pening de Vries, S.J. Scherr, and S. Sompatpanit (eds.). Responses to Land Degradation. Proc. 2nd. International Conference on Land Degradation and Desertification, Khon Kaen, Thailand. Oxford Press, New Delhi, India.
Easterling, David and Tom Karl (2008): Global warming: Frequently asked questions. National Oceanic and Atmospheric Administration National Climatic Data Center. http://www.ncdc.noaa.gov/oa/climate/globalwarming.html#q3
Eswaran, H., R. Lal and P.F. Reich (2001): Land degradation: an overview. In: Bridges, E.M., I.D. Hannam, L.R. Oldeman, F.W.T. Pening de Vries, S.J. Scherr, and S. Sompatpanit (eds.). Responses to Land Degradation. Proc. 2nd. International Conference on Land Degradation and Desertification, Khon Kaen, Thailand. Oxford Press, New Delhi, India.
Fahmuddin Agus and Irawan (2006): Agricultural land conversion as a threat to food security and environmental quality. Jurnal Litbang Pertanian. 25(3):90-98.
FAO (2010): Aquastat. http://www.fao.org/nr/water/aquastat/countries/china/print1.stm
FAO (2011): State of the world’s land and water resources for food and agriculture. Summary Report. FAO. Rome
Created by XMLmind XSL-FO Converter.
7. ENVIRONMENTAL SECURITY
Fleisher, David, Dennis Timlin, K. Raja Reddy, Vangimalla R. Redy, Yang Yang, and Soo-Hyung Kim (2011): Effects of CO2 and Temperature on Crops: Lessons from SPAR Growth Chambers. In Danielle Hillel and Cynthia Rosenzweig (eds.) Handbook of climate change and agroecosystems: impacts, adaptation, and Mitigation. Imperial College Press. London.
Frantz, Jonathan M., Nilton N. Cometti and Bruce Bugbee (2004): Night temperature has a minimal effect on respiration and growth in rapidly growing plants. Annals of Botany. 94:155-166.
IPCC (2007): Climate Change 2007: Synthesis Report. Contribution of Working Groups I, II and III to the Fourth Assessment Report of the Intergovernmental Panel on Climate Change [Core Writing Team, Pachauri, R.K and Reisinger, A. (eds.)]. IPCC, Geneva, Switzerland, 104 pp.
Lagi, Marco, Karla Z. Bertrand and Yaneer Bar-Yam. (2011): The food crises and political instability in Notrh Aftirca and the Middle East. EprintarXiv:1108.2455. http://arxiv.org/pdf/1108.2455v1.pdf
Lobell, D.B., W.S. Schlenker and J. Costa-Roberts (2011): Climate trends and global crop production since 1980. Science. doi:10.1126/science.1204531
Lobell, D.B., M.B. Burke, C. Tebaldi, M.M. Mastrandrea, W.P. Falcon and R.L. Naylor (2008): Prioritizing climate change adaptation needs for food security in 2030. Science. 319:607-610. DOI:10.1126/science.1152339.
Min S., X. Zhang, F. Zwiers and G. Hegerl (2011): Human contribution to more-intense precipitation extremes. Nature 470:378–381. doi:10.1038/nature09763
Montgomery, D. (2007): Soil erosion and agricultural sustainability. Proceedings of the National Academy of Science. 104:13268 – 13272.
Nearing, M.A., F.F. Pruski and M.R. O’Neal (2004): Expected climate change impacts on soil erosion rates: a review. Soil and Water Conservation Journal. 59:43-50.
Peng S, J Huang, J.E. Sheehy, R.C. Laza, R.M. Visperas, X. Zhong, G.S. Centeno, G.S. Khush, and K.G. Cassman (2004): Rice yields decline with higher night temperature from global warming. Proceedings of the National Academy of Sciences. 101 (27): 9971-9975.
Santer, B. D., C. Mears, F. J. Wentz, K. E. Taylor, P. J. Gleckler, T. M. L. Wigley, T. P. Barnett, J. S. Boyle, W. Brüggemann, N. P. Gillett, S. A. Klein, G. A. Meehl, T. Nozawa, D. W. Pierce, P. A. Stott, W. M. Washington and M. F. Wehner (2007): Identification of human-induced changes in atmospheric moisture content. Proceedings of the National Academy of Science. 104(39):15248-15253.
Quasem, Md Abul (2011): Conversion of Agricultural Land to Non-agricultural Uses in Bangladesh: Extent and Determinants. Conversion of Agricultural Land to Non-agricultural Uses in Bangladesh: Extent and Determinants. Bangladesh Development Studies. 34:59-85.
Rosenzweig (eds.) Handbook of climate change and agroecosystems: Impacts, Adaptation, and Mitigation. Imperial College Press. London.
Sinclair, T.R. (2011): Precipitation: The thousand-pound gorilla in crop response to climate change. In Danielle Hillel and Cynthia Rosenzweig (eds.): Handbook of climate change and agroecosystems: Impacts, Adaptation, and Mitigation. Imperial College Press. London.
United Nations. Department of Economic and Social Affairs, Population Division (2011): World Population Prospects: The 2010 Revision. New York.
US National Research Council (2010): Panel on Advancing the Science of Climate Change; Advancing the Science of Climate Change. National Academy Press, Washington, D.C., USA. p. 28.
Wang, Y.P. and D.J. Connor (1996): Simulation of optimal development for spring wheat at two locations in southern Australia under present and changed climate conditions. Agric. For. Meteorol. 79:9-28.
World Bank (2012): Food Price Watch. http://siteresources.worldbank.org/EXTPOVERTY/Images/336990-1327605927518/FPWJan2012v10noembargoFinal.pdf
Created by XMLmind XSL-FO Converter.
8. fejezet - 8. PROVISION OF PUBLIC GOODSIntroduction
Biodiversity losses have accelerated, most notably in the tropics. The depletion of fisheries and fish stocks has continued, and in some cases has accelerated. China’s growing appetite for mineral and energy resources in Africa and elsewhere is cause for concern, and India, Brazil, South Africa, Angola and others are all aiming to fuel their high growth rates with accelerating resource extraction.
In terms of climate change and the overall ecological situation, the picture is not better but a good deal grimmer. By adopting the right policy mix, we can decouple wealth creation from energy and material consumption just as we decoupled wealth creation from the total number of hours of human labour. That was the great achievement of the industrial revolution, and labour productivity has risen at least twentyfold in the course of mankind’s last 150 years of industrialisation. Resource productivity should become the core of our next industrial revolution. Technologically speaking, this should not be more difficult than the rise in labour productivity.
We now start to recognize that the (over)exploitation of our entire ecosystem and the depletion of natural resources (the reserve/production ratio of oil reserves is rapidly declining) carries a price which must be paid today to compensate future generations for the loss (or costs of substitution) they will be faced with tomorrow. Moreover, world population growth by 50% during the next 50 years, causing new scarcities (e.g. water) and pollution (e.g. CO2 emission rights), is reinforcing this issue. Already now corporations in energy-intensive sectors need to start taking future CO2 prices into account in their investment decisions and public disclosure policies, because the scarcity of emission rights has been recognized, an active market has been created in the EU and CO2 emission rights now have a price; more regional cap and trade markets for CO 2 have been (in the USA) or are in the process of being created.
The environment is now back at centre-stage, after a quarter century of denial among the political and business elite in the US. The weight of evidence from the Intergovernmental Panel on Climate Change, and the devastating levels of pollution in the industrial centres of the high growth countries, like China, have at last shifted opinion behind tough new controls. The EU has taken the political lead in addressing global warming, setting up the European Trading System (ETS) for carbon dioxide emissions. President Obama has given clear commitments to mitigating global warming, and China too has become very serious about tackling pollution, climate change and energy efficiency. Renewable energy sources now constitute a dynamic growth sector, and the Convention on Biological Diversity (CBD) is enjoying increasing visibility in the signatory states which means nearly all countries around the world except the US.
Joseph Stiglitz and Nicholas Stern have made a joint appeal to use the financial crisis as an opportunity to lay the foundations for a new wave of growth based on the technologies for a low carbon economy (Financial Times, 2009). The investments would drive growth over the next two or three decades, ensuring it becomes sustainable. They added that “providing a strong, stable carbon price is the single policy action that is likely to have the biggest effect in improving economic efficiency and tackling the climate crisis.” Lord Stern calculated that governments should spend at least 20% of their stimulus on green measures to achieve the emission targets (Stern, 2006).
1. 8.1. Loss of biodiversityMankind is directly influenced by the loss of biodiversity. Through the extinction of species we lose possibly crucial opportunities and solutions to problems of our society. Biodiversity provides us directly with essentials like clean water and air, fertile soil, and protects us from floods and avalanches. These aspects can all be economically valuated. It is a difficult and complex task, but through this valuation it becomes clear how important they are for human well-being and economic development (Table 1).
Many people are unaware of the speed at which we are using up our natural resources, and that we are producing waste far faster than it can be recycled. It is important to clarify the items of public goods and services with arguments whether or not market failures are ulinked to the provision of services. Market failure is
Created by XMLmind XSL-FO Converter.
8. PROVISION OF PUBLIC GOODS
crucially important justification for taking measures to protect our landscapes. Corrections in market failures could also be achieved through investments and the provision of payments to reward land managers who provide public goods and services (European Commission, 2008).
8.1. táblázat - Table 1: Scenario of the future: 2050
Actual 2000 2010 2050 Difference Difference Difference
Area million km2 million km2 million km2 2000 to 2010 2010 to 2050 2000 to 2050
Natural areas 65.5 62.8 58.0 -4% -8% -11%
Bare natural 3.3 3.1 3.0 -6% -4% -9%
Forest managed
4.2 4.4 7.0 5% 62% 70%
Extensive agriculture
5.0 4.5 3.0 -9% -33% -39%
Intensive agriculture
11.0 12.9 15.8 17% 23% 44%
Woody biofuels
0.1 0.1 0.5 35% 437% 626%
Cultivated grazing
19.1 20.3 20.8 6% 2% 9%
Artificial surfaces
0.2 0.2 0.2 0% 0% 0%
World Total 108.4 108.4 108.4 0% 0% 0%
Source: Braat et al. (2008)
2. 8.2. Economic value of ecosystem goods and servicesIt is important to demonstrate the economic value of ecosystem goods and services. We not only need to know costs, but also to be assured that the benefits are greater. There is increasing consensus about the importance of incorporating these “ecosystem services” into resource management decisions, but quantifying the levels and values of these services has proven difficult.
Studies have revealed a disappointingly small set of attempts to measure and value ecosystem services. The first chronologically is the quantification of global ecosystem services by Constanza et al (1997). Estimates were extracted from the literature of values based on willingness to pay for a hectare’s worth of each of the services. These were all expressed in 1994 USD per hectare, there was some attempt to adjust these values across regions by purchasing power. The results were that central estimate of the total value of annual global flows of ecosystem services in the mid-1990s was USD33 trillion (ie 1012) the range was thought to be USD 16 – 54 trillion. To put their figure into some kind of context, their central estimate was 1.8 times bigger than global Gross Domestic Product (GDP) at that time. We should take the figures only as the roughest of approximations – indeed the authors warn of the huge uncertainties involved in making calculations of this kind.
Another study, “Millennium Ecosystem Assessment” (MA), found that over the second half of the 20th Century
Created by XMLmind XSL-FO Converter.
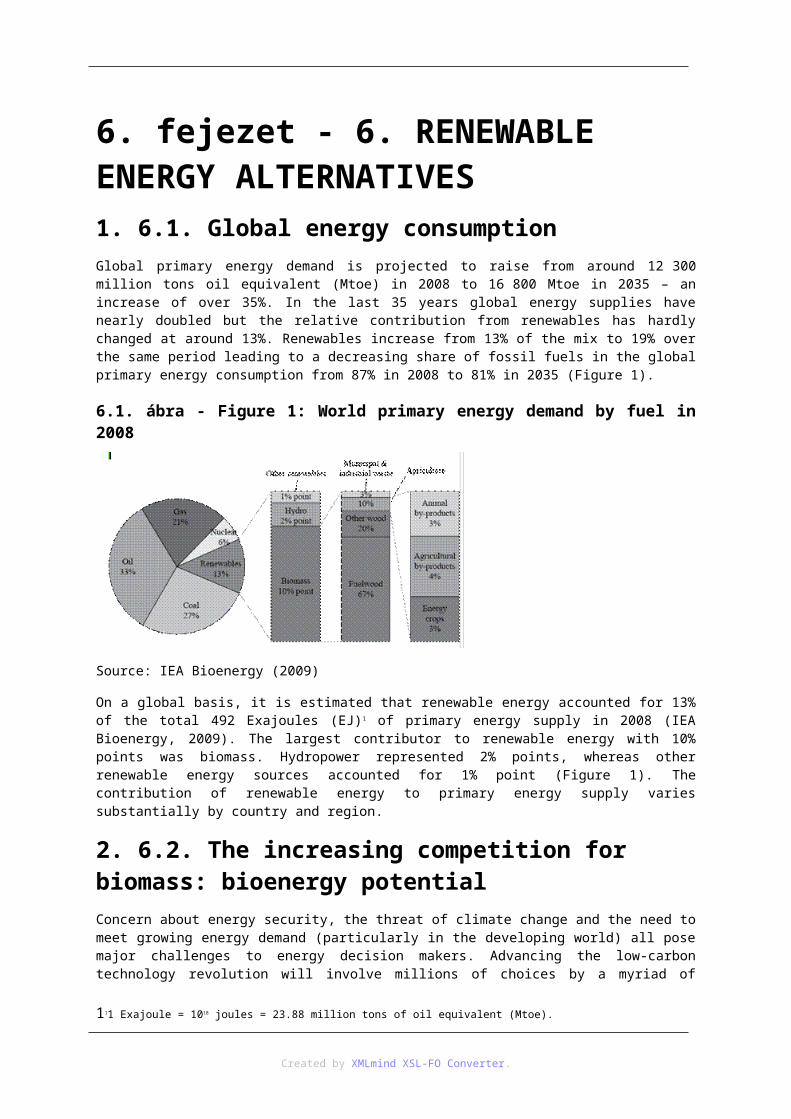
8. PROVISION OF PUBLIC GOODS
human capacity to exploit ecosystems has increased dramatically to meet rapidly growing demands for food, fresh water, timber, fibre and fuel, which has resulted in a substantial and largely irreversible loss in biodiversity of life on Earth. The benefits of these developments have been unevenly distributed and they are causing uncomfortable tradeoffs amongst the services provided by ecosystems (United Nations, 2003).
The findings of “The ecosystems and human well-being – biodiversity synthesis” have established the importance of biodiversity in associated environmental or ecosystem services to human-wellbeing (Reid, et al., 2005). The report is based on the findings of the Millennium Ecosystem Assessment (MA) and supports the goals of improving the management of the world's ecosystems, improving the information used by policy makers, and building human and institutional capacity to conduct integrated assessments. The challenge of sustainably managing ecosystems for human well-being needs to be met through institutions at multiple scales – there is no single critical scale. Local, national, regional and international institutions have a unique role to play in understanding and managing ecosystems for people. Ecosystems provide many tangible benefits or “ecosystem services” to people around the world.
The “Stern Review” parallels the TEEB (see later) study into the economics of climate change (Stern, 2006). Climate change could have very serious impacts on growth and development. The costs of stabilising the climate are significant but manageable; delay would be dangerous and much more costly. The review estimates that if we don’t act, the overall costs and risks of climate change will be equivalent to losing at least 5% of global GDP each year, now and forever. In contrast, the costs of action – reducing greenhouse gas emissions to avoid the worst impacts of climate change – can be limited to around 1% of global GDP each year. Key to understanding the conclusions is that as forests decline, nature stops providing services which it used to provide essentially for free. So the human economy either has to provide them instead, perhaps through building reservoirs, building facilities to sequester carbon dioxide, or farming foods that were once naturally available.
“World Wildlife Fund’s Living Planet Report” demonstrates that mankind is living way beyond the capacity of the environment to supply us with services and to absorb our waste (WWF, 2008). They express this using the concepts of ecological footprints and biocapacity, each expressed per hectare per person1. Humanity’s footprint first exceeded global biocapacity in 1980 and the overshoot has been increasing ever since. In 2005 they calculated the global footprint on average across the world was 2.7 global hectares (gha) per person2 compared to a biocapacity they calculated as 2.1 gha/person, a difference of 30%. That is each person on earth, on average is consuming 30% more resources and waste absorption capacity than the world can provide. We are therefore destroying the earth’s capacity and compromising future generations.
The study on “The Economics of Ecosystems and Biodiversity” (TEEB) is fundamentally about the struggle to find the value of nature. Calculations show that the global economy is losing more money from the disappearance of forests than through the current banking crisis as forest decline could be costing about 7% of global GDP. It puts the annual cost of forest loss at between USD2 trillion and USD5 trillion. The figure comes from adding the value of the various services that forests perform, such as providing clean water and absorbing carbon dioxide. But the cost falls disproportionately on the poor, because a greater part of their livelihood depends directly on the forest, especially in tropical regions. The greatest cost to western nations would initially come through losing a natural absorber of the most important greenhouse gas (European Commission, 2008).
The Global Canopy Programme's report concludes: "If we lose forests, we lose the fight against climate change". International demand has driven intensive agriculture, logging and ranching leading to deforestation. Standing forest was not included in the original Kyoto protocols and stands outside the carbon markets. The inclusion of standing forests in internationally regulated carbon markets could provide cash incentives to halt this disastrous process. Marketing these ecosystem services could provide the added value forests need and help dampen the effects of industrial emissions. Those countries wise enough to have kept their forests could find themselves the owners of a new billion-dollar industry (Parker et al., 2008).
Currently, there are two paradigms for generating ecosystem service assessments that are meant to influence policy decisions. Under the first paradigm, researchers use broad-scale assessments of multiple services to extrapolate a few estimates of values, based on habitat types, to entire regions or the entire planet (Costanza et al., 1997). This “benefits transfer” approach incorrectly assumes that every hectare of a given habitat type is of equal value – regardless of its quality, rarity, spatial configuration, size, proximity to population centres, or the
11 The Ecological Footprint “measures the amount of biologically productive land and water area required to produce the resources an individual, population or activity consumes and to absorb the waste it generates, given prevailing technology and resource management.” (WWF, 2008)22 A global hectare is a hectare with a global average ability to produce resources and absorb wastes.
Created by XMLmind XSL-FO Converter.
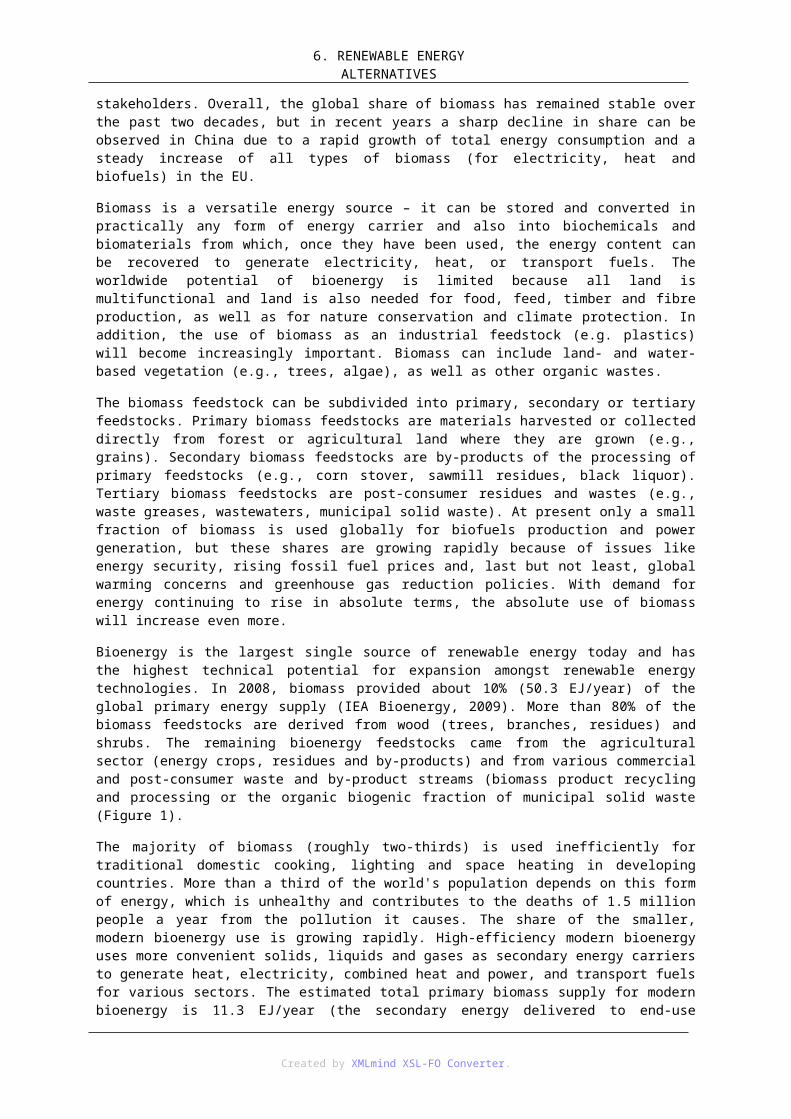
8. PROVISION OF PUBLIC GOODS
prevailing social practices and values. Furthermore, this approach does not allow for analyses of service provision and changes in value under new conditions. In contrast, under the second paradigm for generating policy-relevant ecosystem service assessments, researchers carefully model the production of a single service in a small area with an “ecological production function” – how provision of that service depends on local ecological variables (Kaiser and Roumasset, 2002). These methods lack both the scope (number of services) and scale (geographic and temporal) to be relevant for most policy questions (Nelson, et al., 2009)
Spatially explicit values of services across landscapes that might inform land-use and management decisions are still lacking. Quantifying ecosystem services in a spatially explicit manner, and analysing tradeoffs between them, can help to make natural resource decisions more effective, efficient, and defensible (Nelson, at al., 2009). Both the costs and the benefits of biodiversity-enhancing land-use measures are subject to spatial variation, and the criterion of cost-effectiveness calls for spatially heterogeneous compensation payments (Drechsler and Waetzold, 2005). Cost-effectiveness may also be achieved by paying compensation for results rather than measures. We have to ensure that all the possibilities to create markets to provide environmental services are fully exploited to minimise the public costs (and the extent of government bureaucracy etc.).
3. 8.3. Markets for environmental servicesCreating markets for environmental services could encourage the adoption of farming practices that provide cleaner air and water, and other conservation benefits. Products expected to generate the greatest net returns are the ones generally selected for production. Since environmental services generally do not have markets, they have little or no value when the farmer makes land-use or production decisions. As a result, environmental services are under-provided by farmers. The biggest reason that markets for environmental services do not develop naturally is that the services themselves have characteristics that defy ownership. Once they are produced, people can “consume” them without paying a price. Most consumers are unwilling to pay for a good that they can obtain for free, so markets cannot develop. Can anything be done other than relying on government programmes to provide publicly funded investments in environmental services?
Creating markets for environmental services is not an entirely novel idea. Governments play a central role in setting them up as has been done for markets in water quality trading, carbon trading and wetland damage mitigation. These markets would not exist without government programmes that require regulated business firms (such as industrial plants and land developers) to meet strict environmental standards. In essence, legally binding caps on emissions (water and carbon) or mandatory replacement of lost biodiversity (wetland damage mitigation) create the demand needed to support a market for environmental services. So-called cap and trade programs create a tradable good related to an environmental service (Ribaudo et al., 2008).
Mandatory reduction pledges can be experienced in all developed nations apart from the United States. The same is true for project-level reductions in developing countries. Mandatory cap-and-trade programs have been introduced in the North-eastern U.S. and EU. The U.S. and Australian government will also institute a mandatory cap and trade programme to create financial incentives to limit energy use or reduce emissions.
In the case of water quality, it is necessary to establish caps on total pollutant discharges from regulated firms in some watersheds, and issue discharge allowances to each firm specifying how much pollution the firm can legally discharge. In markets for greenhouse gases, carbon credits are exchanged. Contracts also include renewable energy credits and voluntary carbon credits.
No-net-loss requirements for new housing and commercial development require that damaged/lost wetland services be replaced, creating demand for mitigation credits, which are produced by creating new wetlands. In all of these cases, the managing or regulatory entity defines the tradable good and enforces the transactions.
Simply creating demand for an environmental service does not guarantee that a market for services from agricultural sources will actually develop. A number of impediments affect agricultural producers’ ability to participate in markets for environmental services. Purchasers may be unwilling to enter into a contract with a farmer who cannot guarantee delivery of the agreed-upon quantity of pollution abatement, wetlands services, or other environmental service. Some markets prevent uncertain services from being sold. For example the Chicago Climate Exchange does not certify credits from soil types for which scientific evidence is lacking on the soil’s ability to sequester carbon. Transaction costs can also undermine the development of markets for environmental services (Ribaudo et al., 2008).
If markets are to become important tools for generating resources for conservation on farms, government or
Created by XMLmind XSL-FO Converter.
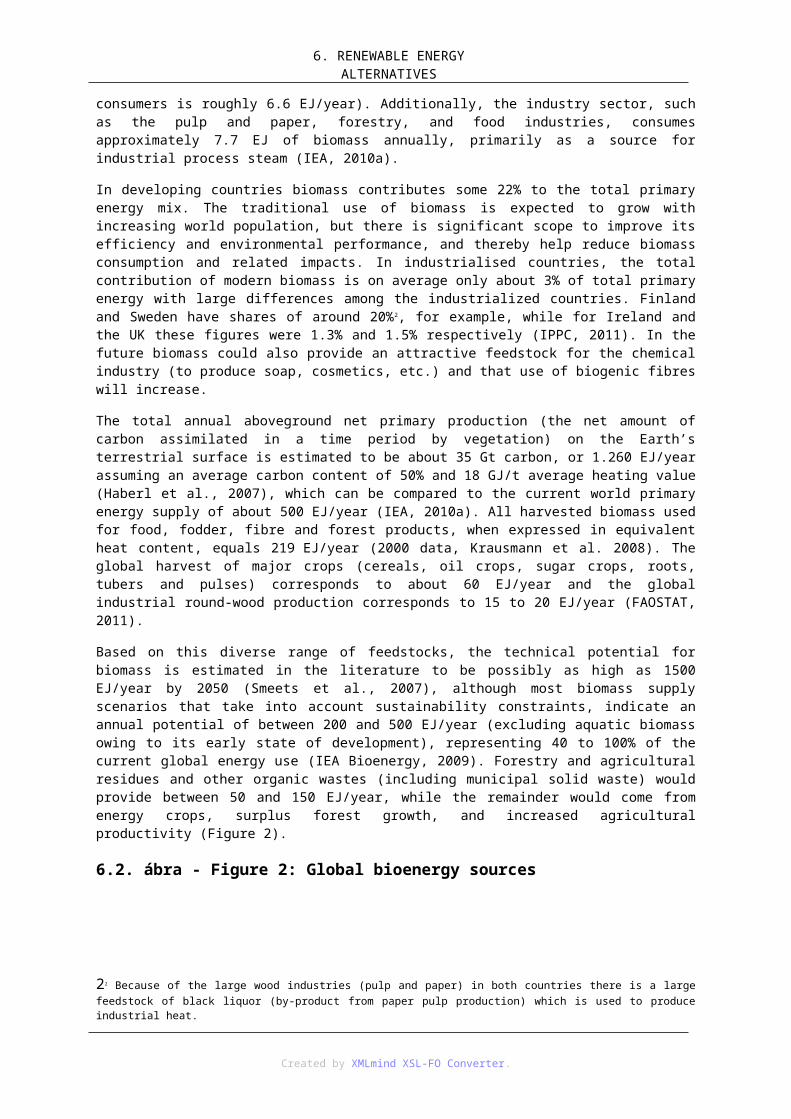
8. PROVISION OF PUBLIC GOODS
other organizations may have to help emerging markets overcome uncertainty and transaction costs. Government can reduce uncertainty by setting standards for environmental services. Government can play a major role in reducing uncertainty by providing research on the level of environmental services from different conservation practices. For example, the government can develop an online Nitrogen Trading Tool to help farmers determine how many potential nitrogen credits they can generate on their farms for sale in a water quality trading programme.
While markets have many desirable properties, they are limited in what they can accomplish, even with government assistance. Public good characteristics that defy ownership discourage markets for environmental services from developing – and prevent the full value of environmental services from being reflected in prices The prices of credits in water, carbon, and wetland markets also may not reflect their full social value, only their value to the regulated community. A national cap-and-trade programme could establish a national market for carbon credits. Others, such as water quality trading or wetland damage/loss mitigation, may be limited to a few specific geographic areas.
A significant role will be given for EU policy and budget in the appropriate land and environmental management. The EU needs regulation defining its policy on markets for environmental services. This policy would cooperate with MS and local governments to establish a role for agriculture in environmental markets. We have to find ways to make EU policies and programmes support producers wanting to participate in such markets. Conducting research and developing tools for quantifying environmental impacts of farming practices is of great importance as well. Requirements are needed to establish technical guidelines for measuring environmental services from conservation and other land management activities, with priority given to participation in carbon markets. Guidelines are also to be established for a registry to record and maintain information on measured environmental service benefits, and a process for verifying that a farmer has implemented the conservation or land management activities reported in the registry.
Enthusiasm can be observed for green public procurement, ulinked to certification/labelling, and supported by due information on embedded water/carbon/biodiversity or simply guidance to help public procurers buy less biodiversity harmful goods/commodities. It is a useful stepping stone towards due biodiversity reflective procurement in public sector establishments in due course (schools, hospitals).
“Ecosystems” markets will change the present, economics-only value-paradigm, with winners and losers. As an example, countries and companies with significant carbon-sink potential will benefit. On the other hand, applying the “polluter-must-pay” principle, CO2 emitters must a pay a price for continuing to be able to do so. The concept of limiting (capping), auctioning and trading emission/access/user rights must be further developed beyond CO2 , in scope (e.g. water) and scale (worldwide). On the basis of valuing our ecosystems and regulating the access thereto a market will be created for payment for ecosystem-access entitlements and for ecosystem services. We really need to upgrade our performance metrics. The same is true with respect to Human/Social Capital: also here the metrics, the value of education, culture, social cohesion, etc. should be established and more prominently included in investment/development decisions.
stable food economy meeting the Kyoto goals against climate change is impossible.
4. Questions1. Characteristics of public goods?
2. Supply and demand of public goods?
3. Economic value of ecosystem goods and services?
4. Delivery mechanism of public goods?
5. Threats to the provision of public goods?
6. The case for public intervention?
5. References
Created by XMLmind XSL-FO Converter.
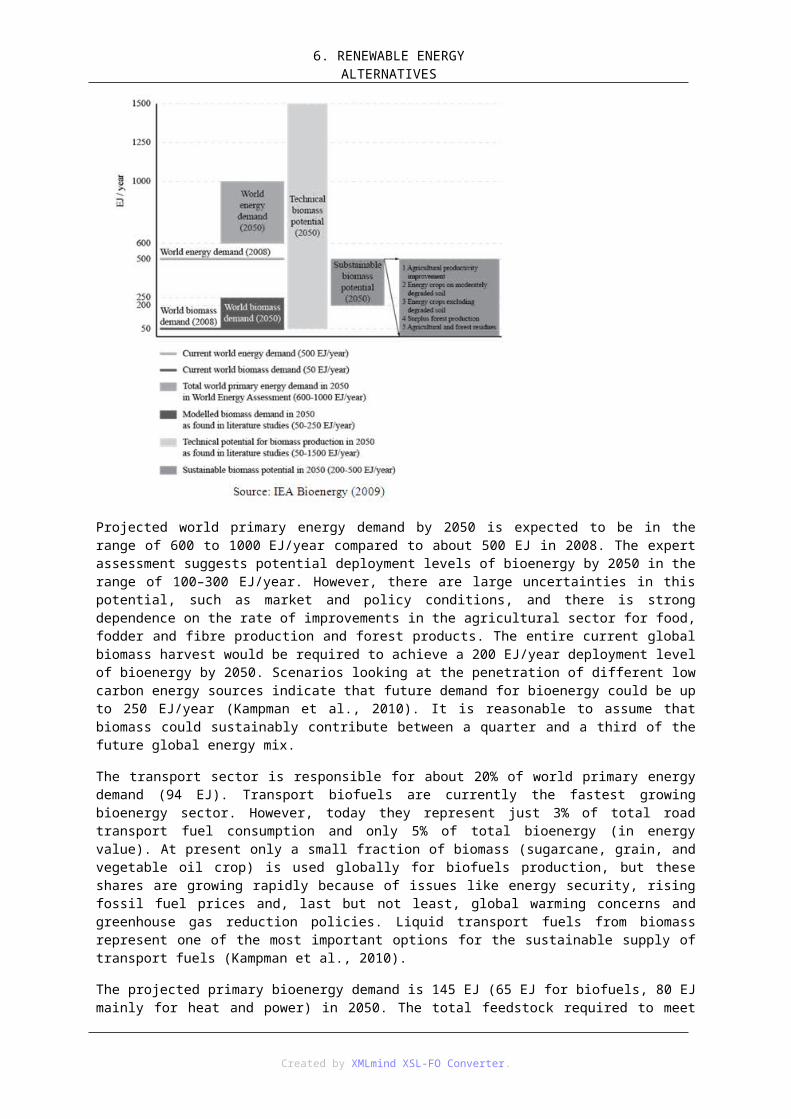
8. PROVISION OF PUBLIC GOODS
Braat, L. and Brink, P. (eds.): Contribution of different pressures to the global biodiversity loss between 2000 and 2050 in the OECD baseline. Brussels: The Economics of ecosystems and biodiversity (TEEB): an interim report. Resources.
Constanza, R; d’Arge, R; and de Groot, R. (1997): The value of the world’s ecosystem services and natural capital. Nature 387: 253-60.
Drechsler, M. and Waetzold, F. (2005): Spatially uniform versus spatially heterogeneous compensation payments for biodiversity-enhancing land-use measures, Environmental & Resource Economics (2005) 31: 73-93.
European Commission (2008): The Economics of ecosystems and biodiversity (TEEB). Brussels: an interim report. Resources. http://ec.europa.eu/environment/nature/biodiversity/economics/index_en.htm.
Financial Times (2009): Obama’s chance to lead the green recovery. Financial Times, 3 March, 2009.
Kaiser, B. and Roumasset, J. (2002): Valuing indirect ecosystem services: the case of tropical watersheds. Environ Dev Econ 7: 701-14.
Nelson, E.; Mendoza, G.; Regetz, J.; Polasky, S.; Tallis, H., Cameron, D R.; Chan, KM.; Daily, GC.; Goldstein, J.; Kareiva, PM., Lonsdorf, E.; Naidoo, R., Ricketts, TH. and Shaw, MR. (2009): Modelling multiple ecosystem services, biodiversity conservation, commodity production, and tradeoffs at landscape scales. Front Ecol Environ; 7(1): 4-11.
Parker, Ch.; Mitchell, A.; Trivedi, M; and Mardas, N. (2008): The Little Reed Book. (Reducing Emissions from Deforestation and (Forest) Degradation: Reed). Global Canopy Programme, Oxford: John Krebs Field Station.
Reid, W. V.; Mooney, H. A.; Cropper, A.; Capistrano, D.; Carpenter, S.R.; Chopra, K.; Dasgupta, P.; Dietz, T.; Kumar, D. A.; Hassan, R.; Kasperson, R.; Leemans, R.; May, R. M.; McMichael, T. (A.J.); Pingali, P.; Samper, C.; Scholes, R.; Watson, R. T.; Zakri, A.H.; Shidong, Z.; Ash, J. N.; Bennett, E.; Kumar, P.; Lee, M. J.; Raudsepp-Hearne, C.; Simons, H.; Thonell, J.; and Zurek, M. B. (2005): Millennium Ecosystem Assessment: Ecosystems and human well-being - biodiversity synthesis. Washington D.C.: World Resources Institute.
Ribaudo, M; LeRoy, H; Hellerstein, D. and Greene, C. (2008): The use of market to increase private investment in environmental stewardship, Washington D. C.: USDA-ERS.
Stern, N. (2006): Stern Review: The Economics of Climate Change. Cambridge, UK: Cambridge University Press.
United Nations (2003): Millennium Ecosystem Assessment: Ecosystems and Human Wellbeing. Washington D.C.: Island Press.
WWF (2008): Living Planet Report, Gland, Switzerland: World Wildlife Fund.
Created by XMLmind XSL-FO Converter.
9. fejezet - 9. CLIMATE CHANGE: IMPACT, ADAPTATION AND MITIGATIONIntroduction
Climate change is with us. A decade ago, it was conjecture. Now the future is unfolding before our eyes. Canada’s Inuit see it in disappearing Arctic ice and permafrost. The shantytown dwellers of Latin America and Southern Asia see it in lethal storms and floods. Europeans see it in disappearing glaciers, forest fires and fatal heat waves. Scientists see it in tree rings, ancient coral and bubbles trapped in ice cores. These reveal that the world has not been as warm as it is now for a millennium or more.
The three warmest years on record have all occurred since 1998; 19 of the warmest 20 since 1980. And Earth has probably never warmed as fast as in the past 30 years – a period when natural influences on global temperatures, such as solar cycles and volcanoes should have cooled us down. Studies of the thermal inertia of the oceans suggest that there is more warming in the pipeline. Climatologists reporting for the UN Intergovernmental Panel on Climate Change (IPCC) say we are seeing global warming caused by human activities and there are growing fears of feedbacks that will accelerate this warming (IPCC, 2007a).
1. 9.1. Definition of climate changeClimate change is a significant and lasting change in the statistical distribution of weather patterns over periods ranging from decades to millions of years. It may be a change in average weather conditions, or in the distribution of weather around the average conditions (i.e., more or fewer extreme weather events). Climate change is caused by factors that include oceanic processes (such as oceanic circulation), variations in solar radiation received by Earth, plate tectonics and volcanic eruptions, and human-induced alterations of the natural world; these latter effects are currently causing global warming, and “climate change” is often used to describe human-specific impacts (IPCC, 2007b).
Scientists actively work to understand past and future climate by using observations and theoretical models. Borehole temperature profiles, ice cores, floral and faunal records, glacial and periglacial processes, stable isotope and other sediment analyses, and sea level records serve to provide a climate record that spans the geologic past. More recent data are provided by the instrumental record. Physically based general circulation models are often used in theoretical approaches to match past climate data, make future projections, and ulink causes and effects in climate change.
The most general definition of climate change is a change in the statistical properties of the climate system when considered over long periods of time, regardless of cause. Accordingly, fluctuations over periods shorter than a few decades, such as El Niño, do not represent climate change. The term sometimes is used to refer specifically to climate change caused by human activity, as opposed to changes in climate that may have resulted as part of Earth's natural processes. In this sense, especially in the context of environmental policy, the term climate change has become synonymous with anthropogenicglobal warming. Within scientific journals, global warming refers to surface temperature increases while climate change includes global warming and everything else that increasing greenhouse gas levels will affect.
On the broadest scale, the rate at which energy is received from the sun and the rate at which it is lost to space determine the equilibrium temperature and climate of Earth. This energy is distributed around the globe by winds, ocean currents, and other mechanisms to affect the climates of different regions.
Factors that can shape climate are called climate forcing or “forcing mechanisms”. These include processes such as variations in solar radiation, variations in the Earth’s orbit, mountain-building and continental drift and changes in greenhouse gas concentrations. There are a variety of climate change feedbacks that can either amplify or diminish the initial forcing. Some parts of the climate system, such as the oceans and ice caps, respond slowly in reaction to climate forcings, while others respond more quickly.
Created by XMLmind XSL-FO Converter.
9. CLIMATE CHANGE: IMPACT, ADAPTATION AND
MITIGATIONForcing mechanisms can be either “internal” or “external”. Internal forcing mechanisms are natural processes within the climate system itself (e.g., the thermohaline circulation). External forcing mechanisms can be either natural (e.g., changes in solar output) or anthropogenic (e.g., increased emissions of greenhouse gases).
Whether the initial forcing mechanism is internal or external, the response of the climate system might be fast (e.g., a sudden cooling due to airborne volcanic ash reflecting sunlight), slow (e.g. thermal expansion of warming ocean water), or a combination (e.g., sudden loss of albedo in the arctic ocean as sea ice melts, followed by more gradual thermal expansion of the water). Therefore, the climate system can respond abruptly, but the full response to forcing mechanisms might not be fully developed for centuries or even longer (IPCC, 2007c).
2. 9.2. Global greenhousePeople are causing the change by burning nature’s vast stores of coal, oil and natural gas. This releases billions of tonnes of carbon dioxide (CO2) every year, although the changes may actually have started with the dawn of agriculture, say some scientists. The physics of the “greenhouse effect” has been a matter of scientific fact for a century. CO2 is a greenhouse gas that traps the Sun’s radiation within the troposphere, the lower atmosphere. It has accumulated along with other man-made greenhouse gases, such as methane and chlorofluorocarbons (CFCs).
If current trends continue, we will raise atmospheric CO2 concentrations to double pre-industrial levels during this century. That will probably be enough to raise global temperatures by around 2°C to 5°C. Some warming is certain, but the degree will be determined by feedbacks involving melting ice, the oceans, water vapour, clouds and changes to vegetation. Warming is bringing other unpredictable changes. Melting glaciers and precipitation are causing some rivers to overflow, while evaporation is emptying others. Diseases are spreading. Some crops grow faster while others see yields slashed by disease and drought. Strong hurricanes are becoming more frequent and destructive. Arctic sea ice is melting faster every year, and there are growing fears of a shutdown of the ocean currents that keep Europe warm for its latitude. Clashes over dwindling water resources may cause conflicts in many regions (Emanuel, 2005).
As natural ecosystems – such as coral reefs – are disrupted, biodiversity is reduced. Most species cannot migrate fast enough to keep up, though others are already evolving in response to warming. Thermal expansion of the oceans, combined with melting ice on land, is also raising sea levels. In this century, human activity could trigger an irreversible melting of the Greenland ice sheet and Antarctic glaciers. This would condemn the world to a rise in sea level of six metres – enough to flood land occupied by billions of people (Schmidt et al., 2004).
The global warming would be more pronounced if it were not for sulphur particles and other pollutants that shade us, and because forests and oceans absorb around half of the CO2 we produce. But the accumulation rate of atmospheric CO2 has increased since 2001, suggesting that nature’s ability to absorb the gas could now be stretched to the limit. Recent research suggests that natural CO 2 “sinks”, like peat bogs and forests, are actually starting to release CO2 .
3. 9.3. Deeper cutsAt the Earth Summit in 1992, the world agreed to prevent “dangerous” climate change. The first step was the 1997 Kyoto Protocol, which finally came into force during 2005. It will bring modest emission reductions from industrialised countries. But many observers say deeper cuts are needed and developing nations, which have large and growing populations, will one day have to join in. Some, including the US Bush administration, say the scientific uncertainty over the pace of climate change is grounds for delaying action. The US and Australia have reneged on Kyoto (Australia eventually joined the protocol in late 2007). During 2005 these countries, and others, suggested “clean fuel” technologies as an alternative to emissions cuts (McKibben, 2011).
In any case, according to the IPCC, the world needs to quickly improve the efficiency of its energy usage and develop renewable non-carbon fuels like: wind, solar, tidal, wave and perhaps nuclear power. It also means developing new methods of converting this clean energy into motive power, like hydrogenfuel cells for cars. Trading in Kyoto carbon permits may help.
Other less conventional solutions include ideas to stave off warming by “mega-engineering” the planet with giant mirrors to deflect the Sun’s rays, seeding the oceans with iron to generate algal blooms, or burying greenhouse gases below the sea. The bottom line is that we will need to cut CO 2 emissions by 70% to 80%
Created by XMLmind XSL-FO Converter.
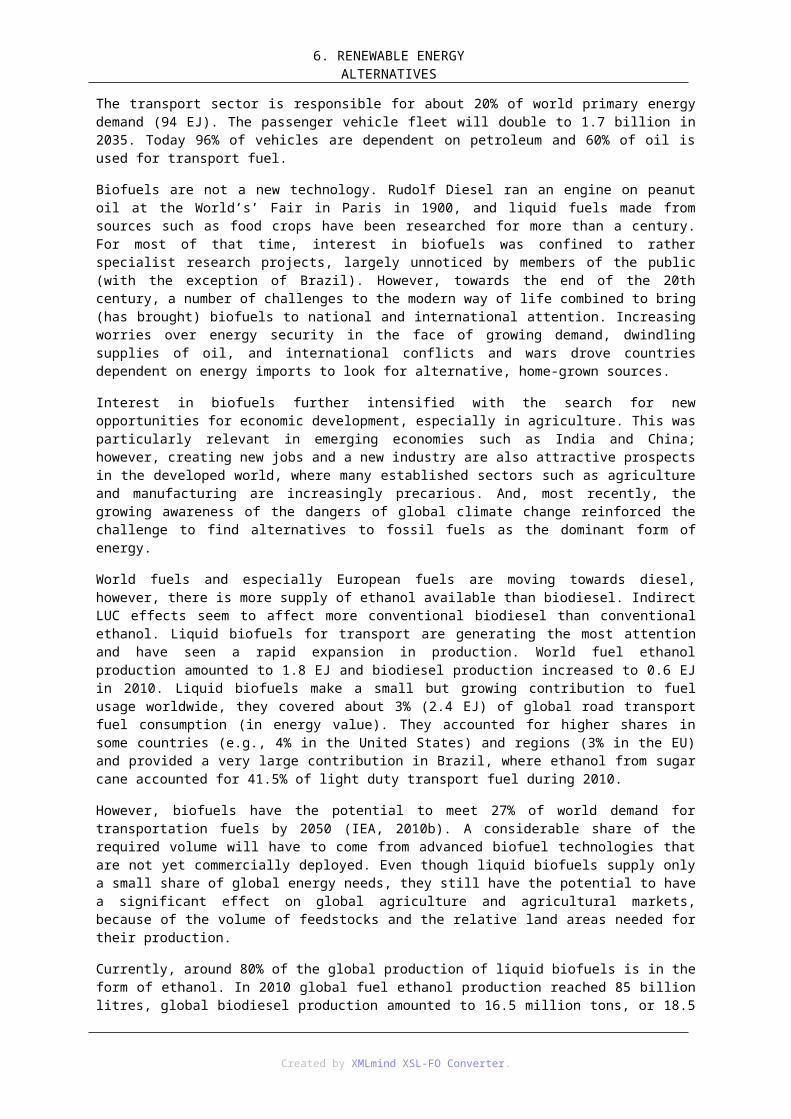
9. CLIMATE CHANGE: IMPACT, ADAPTATION AND
MITIGATIONsimply to stabilise atmospheric CO2 concentrations – and thus temperatures. The quicker we do that, the less unbearably hot our future world will be (McKibben, 2011).
4. 9.4. The world needs to adapt to the impacts of climate changeIt is now widely accepted that the world is likely to exceed a commonly held benchmark of a two-degree temperature increase, relative to pre-industrial levels, by the end of the century. A 3-4 degree centigrade increase could have catastrophic implications for developing countries. Adaptation is at the centre of the World Bank’s support to developing countries as it is critical to sustaining and furthering development gains in these countries. It will cost an estimated USD70-USD100 billion per year through 2050 for developing countries to adapt, according to a World Bank study Economics of Adaptation to Climate Change (EACC).
5. 9.5. Providing financing for adaptationPrograms range from adaptation in arid and semi-arid lands in Kenya, Yemen, and India to dealing with the impact of rapid glacier retreat in the Andes. These programs integrate a menu of financing options available from several sources, such as the International Development Association (IDA), the Least Developed Countries Fund (LDCF), the Special Climate Change Fund (SCCF), and bi-lateral co-financing. Finance from IDA – fund for the poorest countries – to climate-affected sectors like agriculture, flood protection, water supply, and health has been increasing every year (The World Bank, 2012).
The Pilot Program for Climate Resilience – a dedicated fund of almost USD1 billion for adaptation under the Climate Investment Funds, is working with nine country pilots and two regional pilot programs in the Caribbean and South Pacific with the World Bank, and the other Multi-lateral Development Banks. This fund gives priority to highly vulnerable least-developed countries, and provides grants and optional near-zero interest concessional loans for a range of activities, including improving agricultural practices and food security, building climate-resilient housing, and improving weather data monitoring.
The World Bank is the world’s largest source of finance for disaster risk reduction and reconstruction. Since 2007, the Bank has lent USD 9.2 billion through 215 post-disaster recovery projects. As part of a comprehensive disaster risk management strategy, the World Bank has two instruments on catastrophe risk financing that provide the much-needed financing when a disaster strikes (The World Bank, 2012).
Countries need support to re-orient their development plans so that climate change is factored into their planning process. For example, in Indonesia, a development policy loan promotes a low-carbon growth path for the economy. The World Bank is screening all its programs and projects in climate-sensitive sectors like energy, urban and water for climate change concerns. The World Bank has strengthened operational ulinks between climate adaptation and disaster risk management, working closely with the Global Facility for Disaster Reduction and Recovery (GFDRR). Disasters are an entry point for dialogue with countries on building resilience to future long-term risks posed by climate change.
There are increasing efforts to ensure synergies between adaptation and mitigation when designing and planning climate actions. Examples include work on climate smart agriculture where the focus is on a triple-win: carbon sequestration, food security and climate resilient livelihoods; or water efficiency measures in urban municipalities which reduce energy consumption and emissions from water pumping and distribution.
Africa is one of the most vulnerable regions in the world to climate change. Since water is an area that will be most stressed, the World Bank is working on a real-time, comprehensive Hydro-met Monitoring and Forecasting System. For river basins like Niger and Zambezi, there is a need for ongoing work on climate resilience assessments.
6. 9.6. Timeline of climate change900-1300: The Medieval Warm Period brings warm weather to Europe, thanks to an unusually strong North Atlantic Oscillation bringing in extra heat.
1350-1850: The Little Ice Age chills parts of the northern hemisphere.
Created by XMLmind XSL-FO Converter.
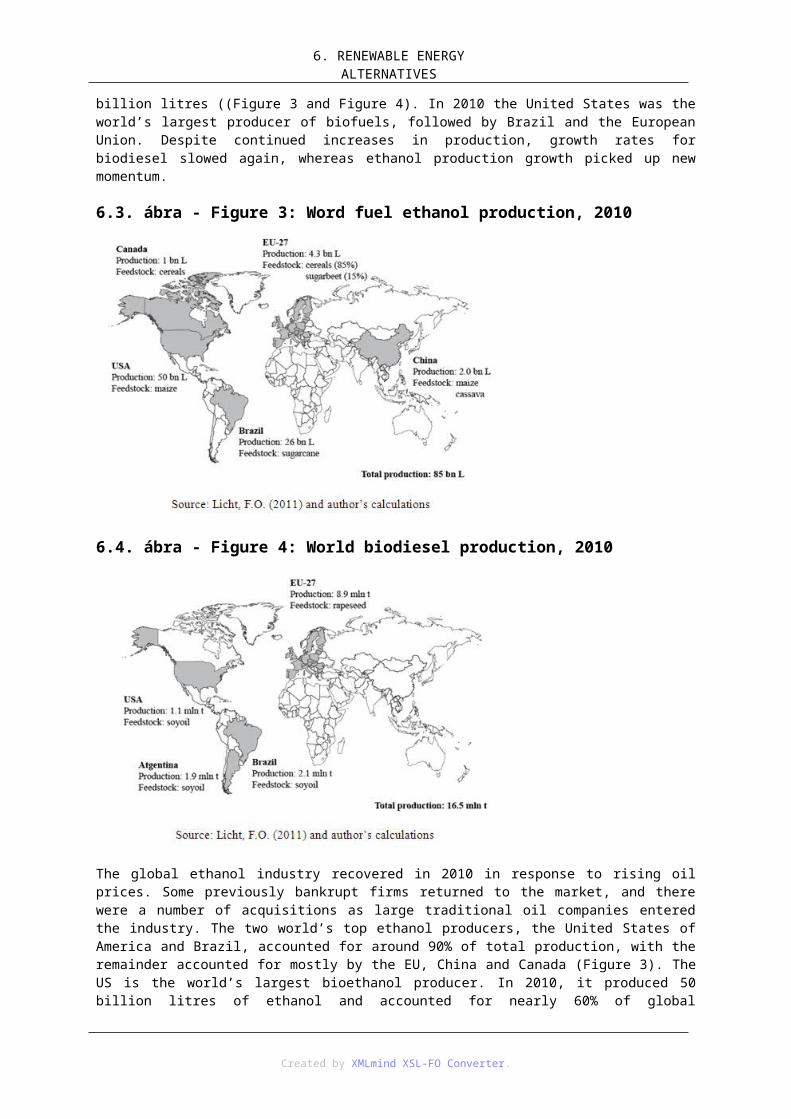
9. CLIMATE CHANGE: IMPACT, ADAPTATION AND
MITIGATION1709: As the Little Ice Age comes to an end, Europe experiences a freakishly cold winter.
1827: French polymath Jean-Baptiste Fourier predicts an atmospheric effect keeping the Earth warmer than it would otherwise be. He is the first to use a greenhouse analogy.
1863: Irish scientist John Tyndall publishes a paper describing how water vapour can be a greenhouse gas.
1890s: Swedish scientist Svante Arrhenius and an American, P C Chamberlain, independently consider the problems that might be caused by CO2 building up in the atmosphere. Both scientists realise that the burning of fossil fuels could lead to global warming, but neither suspects the process might already have begun.
1890s to 1940: Average surface air temperatures increase by about 0.25 °C. Some scientists see the American Dust Bowl as a sign of the greenhouse effect at work.
1940 to 1970: Worldwide cooling of 0.2°C. Scientific interest in greenhouse effect wanes. Some climatologists predict a new ice age.
1957: US oceanographer Roger Revelle warns that humanity is conducting a “large-scale geophysical experiment” on the planet by releasing greenhouse gases. Colleague David Keeling sets up first continuous monitoring of CO2 levels in the atmosphere. Keeling soon finds a regular year-on-year rise.
1970s: Series of studies by the US Department of Energy increases concerns about future global warming.
1979: First World Climate Conference adopts climate change as major issue and calls on governments “to foresee and prevent potential man-made changes in climate.”
1985: First major international conference on the greenhouse effect at Villach, Austria, warns that greenhouse gases will “in the first half of the next century, cause a rise of global mean temperature which is greater than any in man’s history.” This could cause sea levels to rise by up to one metre, researchers say. The conference also reports that gases other than CO2 , such as methane, ozone, CFCs and nitrous oxide, also contribute to warming.
1987: Warmest year since records began. The 1980s turn out to be the hottest decade on record, with seven of the eight warmest years recorded up to 1990. Even the coldest years in the 1980s were warmer than the warmest years of the 1880s.
1988: Global warming attracts worldwide headlines after scientists at Congressional hearings in Washington DC blame major US drought on its influence. Meeting of climate scientists in Toronto subsequently calls for 20% cuts in global CO2 emissions by the year 2005. UN sets up the Intergovernmental Panel on Climate Change (IPCC) to analyse and report on scientific findings.
1990: The first report of the IPCC finds that the planet has warmed by 0.5°C in the past century. IPCC warns that only strong measures to halt rising greenhouse gas emissions will prevent serious global warming. This provides scientific clout for UN negotiations for a climate convention. Negotiations begin after the UN General Assembly in December.
1991: Mount Pinatubo erupts in the Philippines, throwing debris into the stratosphere that shields the Earth from solar energy, which helps interrupt the warming trend. Average temperatures drop for two years before rising again. Scientists point out that this event shows how sensitive global temperatures are to disruption.
1992: Climate Change Convention, signed by 154 nations in Rio, agrees to prevent “dangerous” warming from greenhouse gases and sets initial target of reducing emissions from industrialised countries to 1990 levels by the year 2000.
1994: The Alliance of Small Island States – many of whom fear they will disappear beneath the waves as sea levels rise – adopt a demand for 20% cuts in emissions by the year 2005. This, they say, will cap sea-level rise at 20 centimetres.
1995: The hottest year recorded to date. In March, the Berlin Mandate is agreed by signatories at the first full meeting of the Climate Change Convention in Berlin. Industrialised nations agree on the need to negotiate real cuts in their emissions, to be concluded by the end of 1997.
In November, the IPCC states that current warming “is unlikely to be entirely natural in origin” and that “the
Created by XMLmind XSL-FO Converter.
9. CLIMATE CHANGE: IMPACT, ADAPTATION AND
MITIGATIONbalance of evidence suggests a discernible human influence on global climate”. Its report predicts that, under a “business as usual” scenario, global temperatures by the year 2100 will have risen by between 1°C and 3.5°C.
1996: At the second meeting of the Climate Change Convention, the US agrees for the first time to legally binding emissions targets and sides with the IPCC against influential sceptical scientists. After a four-year pause, global emissions of CO2 resume their steep climb, and scientists warn that most industrialised countries will not meet Rio agreement to stabilise emissions at 1990 levels by the year 2000.
1997: Kyoto Protocol agrees legally binding emissions cuts for industrialised nations, averaging 5.4%, to be met by 2010. The meeting also adopts a series of flexibility measures, allowing countries to meet their targets partly by trading emissions permits, establishing carbon sinks such as forests to soak up emissions, and by investing in other countries. The precise rules are left for further negotiations. Meanwhile, the US government says it will not ratify the agreement unless it sees evidence of “meaningful participation” in reducing emissions from developing countries.
1998: Follow-up negotiations in Buenos Aires fail to resolve disputes over the Kyoto “rule book”, but agree on a deadline for resolution by the end of 2000. 1998 is the hottest year in the hottest decade of the hottest century of the millennium.
2000: IPCC scientists re-assess likely future emissions and warn that, if things go badly, the world could warm by 6°C within a century. A series of major floods around the world reinforce public concerns that global warming is raising the risk of extreme weather events. But in November, crunch talks held in The Hague to finalise the “Kyoto rule book” fail to reach agreement after EU and US fall out. Decisions postponed until at least May 2001.
2001: The new US president, George W Bush, renounces the Kyoto Protocol because he believes it will damage the US economy. After some hesitation, other nations agree to go ahead without him. Talks in Bonn in July and Marrakech in November finally conclude the fine print of the protocol. Analysts say that loopholes have pegged agreed cuts in emissions from rich-nation signatories to less than a third of the original Kyoto promise. Signatory nations urged to ratify the protocol in their national legislatures in time for it to come into force before the end of 2002.
2002: Parliaments in the European Union, Japan and others ratify Kyoto. But the protocol’s complicated rules require ratification by nations responsible for 55% of industrialised country emissions, before it can come into force. After Australia joins the US in reneging on the deal, Russia is left to make or break the treaty, but hesitates. Meanwhile, the world experiences the second hottest year on record and Antarctica's Larsen B ice sheet breaks up.
2003: Globally it is the third hottest year on record, but Europe experiences the hottest summer for at least 500 years, with an estimated 30,000 fatalities as a result. Researchers later conclude that climate change at least doubled the risk of the heat wave happening. Extreme weather costs an estimated record of USD 60 billion this year. 2003 also sees a marked acceleration in the rate of accumulation of greenhouse gases. Scientists are uncertain if it is a blip or a new, more ominous trend. Meanwhile Russia blows hot and cold over Kyoto.
2004: A deal is struck on Kyoto. President Putin announces in May that Russia will back the Protocol. On 18 November, the Russian parliament ratifies the protocol, paving the way for it to come into force in 2005. A study ulinks the 2003 heat wave to global warming. Hollywood blockbuster The Day After Tomorrow bases its plot on an exaggerated climate change scenario.
2005: On 16 February, the Kyoto Protocol comes into force. In December, Kyoto signatories agree to discuss emissions targets for the second compliance period beyond 2012, while countries without targets, including the US and China, agree to a “non-binding dialogue” on their future roles in curbing emissions. Europe launches its Emissions Trading Scheme, despite criticism of the idea.
2005 is the second warmest year on record. Researchers ulink warming to a record US hurricane season, accelerated melting of Arctic sea ice and Siberian permafrost. At a pivotal climate meeting held in Exeter, UK, scientists warn that the west Antarctic ice sheet is starting to collapse.
2006: The Stern Report, commissioned by the UK government, argues that the costs of coping with climate change will be greater than the costs of preventing it. Al Gore’s climate change film An Inconvenient Truth becomes a box-office hit. Carbon dioxide emissions are found to be rising faster than in the 1990s, and new
Created by XMLmind XSL-FO Converter.
9. CLIMATE CHANGE: IMPACT, ADAPTATION AND
MITIGATIONevidence bolsters the iconic “hockey stick” graph. The US Environmental Protection Agency is taken to the Supreme Court over its refusal to regulate CO2 emissions. US agencies, including NASA, are accused of trying to censor climate experts.
2007: The fourth Assessment Report of the IPCC places the blame for global warming firmly on humankind, estimates the cost of stabilising greenhouse gases at USD1830 billion, and calls for governments to begin planning adaptive measures. Some of the most extreme scenarios are left out of the report, leading to accusations that it has been watered down. The synthesis report warns of “abrupt and irreversible” climate change.
Al Gore and the IPCC are awarded the Nobel Peace Prize, while a UK judge criticises An Inconvenient Truth for containing nine “factual inaccuracies”. TV documentary The Great Global Warming Swindle alleges that climate science is deeply flawed – the programme is later found to have misrepresented the science and interviewed researchers complain to the British watchdog for broadcasting standards, Ofcom. In April the US Supreme Court rules that the EPA does have the authority to regulate carbon dioxide emissions.
Measurements of solar activity show that it has declined since the 1980s, debunking the claim that it is responsible for global warming. At the annual UN climate summit held in December in Bali, government representatives from around the world agree a timetable to establish a post-2012 replacement for the Kyoto protocol. The United States delegation is publicly booed, then agrees to the pledge at the eleventh hour.
2008: The polar bear is listed on the US endangered species act, because of the risk to its habitat from climate change. Alaska threatens to sue over the decision. The World Conservation Union finds that thousands of species are at risk from climate change.
Barack Obama becomes president of the United States, promising increases in science funding, especially for climate change and energy technology. He appoints Nobel laureate winner and renewables expert Steve Chu as energy secretary.
2009: Governments, including the US, prepare to negotiate a successor to the Kyoto Protocol at a conference in December. Eric Steig and colleagues show that Antarctica is warming. A thin strip of ice protecting the Wilkins ice sheet from collapse breaks apart, hastening the sheet's demise – while the Arctic continues to warm much faster than expected. A major study suggests that humanity can emit no more than 1 trillion tonnes of carbon, if we are to avoid temperature rises of 2°C or more.
Indigenous peoples from around the world meet in Alaska to agree a common position on climate change. Italy and Switzerland agree to redraw their border in response to melting glaciers.
7. Questions1. True or false: Planet earth’s climate is changing?
2. True or false: Most of the increase in global temperatures since the mid-20th century is due to humankind burning fossil fuels?
3. True or false: Most or all of the lights in my home are energy efficient?
4. True or false: The electricity supplied to my home is from a green tariff?
5. True or false: I know what my personal or family carbon footprint is?
6. Is global warming equal to climate change?
8. ReferencesIPCC AR4 WG1 (2007a): Solomon, S.; Qin, D.; Manning, M.; Chen, Z.; Marquis, M.; Averyt, K.B.; Tignor, M.; and Miller, H.L., ed., Climate Change 2007: The Physical Science Basis, Contribution of Working Group I to the Fourth Assessment Report of the Intergovernmental Panel on Climate Change, Cambridge University Press. http://www.ipcc.ch/publications_and_data/ar4/wg1/en/contents.html
IPCC AR4 SYR (2007b): Core Writing Team; Pachauri, R.K; and Reisinger, A., ed., Climate Change 2007:
Created by XMLmind XSL-FO Converter.
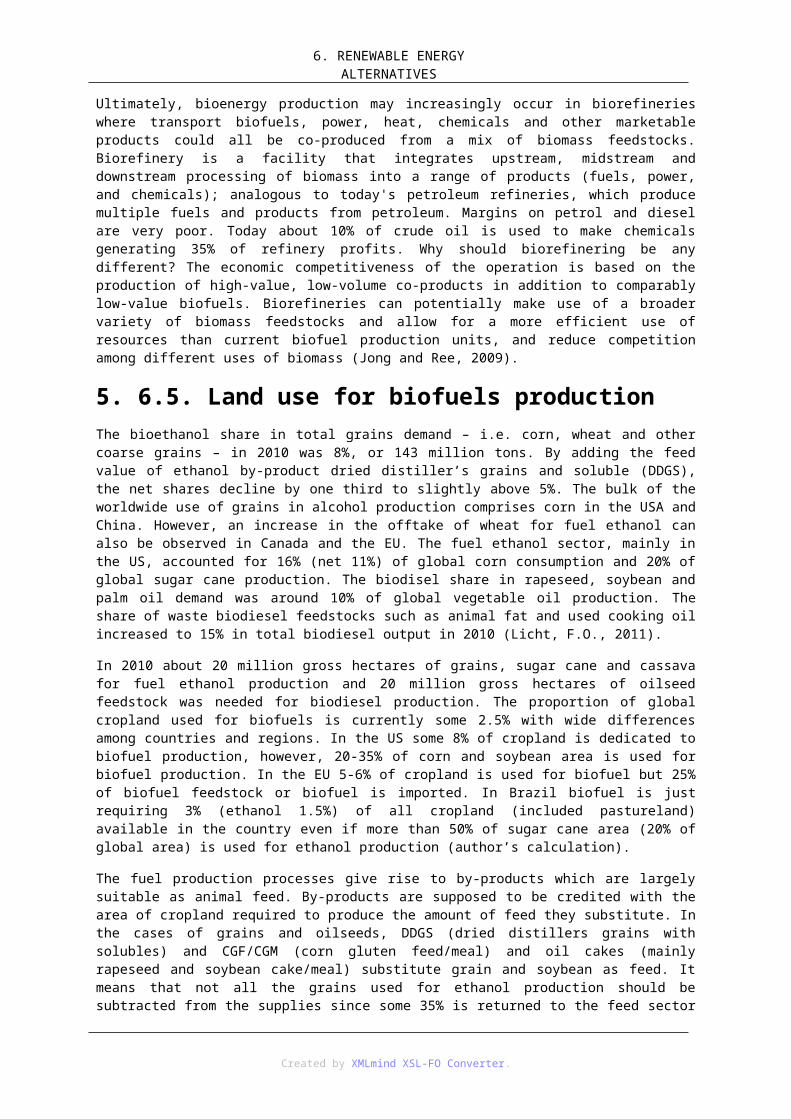
9. CLIMATE CHANGE: IMPACT, ADAPTATION AND
MITIGATIONSynthesis Report, Contribution of Working Groups I, II and III to the Fourth Assessment Report of the Intergovernmental Panel on Climate Change, IPCC, http://www.ipcc.ch/publications_and_data/ar4/syr/en/contents.html .
IPCC AR4 WG1 (2007c): “Summary for Policymakers”. In Solomon, S.; Qin, D.; Manning, M.; Chen, Z.; Marquis, M.; Averyt, K.B.; Tignor, M.; and Miller, H.L.. Climate Change 2007: The Physical Science Basis. Contribution of Working Group I to the Fourth Assessment Report of the Intergovernmental Panel on Climate Change. Cambridge University Press. http://www.ipcc.ch/publications_and_data/ar4/wg1/en/spm.html (pb: 978-0-521-70596-7).
Emanuel, K. (2005): Increasing destructiveness of tropical cyclones over the past 30 years. Nature 436 (7051): 686-8. Bibcode 2005Natur..436.686E. doi:10.1038/nature03906. PMID 16056221. ftp://texmex.mit.edu/pub/emanuel/PAPERS/NATURE03906.pdf.
Edwards, P. G. and Miller, C.A. (2001): Changing the atmosphere: expert knowledge and environmental governance. Cambridge, Mass: MIT Press.
McKibben, B. (2011): The Global Warming Reader. New York, N.Y.: OR Books.
Ruddiman, W. F. (2003): The anthropogenic greenhouse era began thousands of years ago. Climate Change 61 (3): 261-293. doi:10.1023/B:CLIM.0000004577.17928.fa.
Ruddiman, W. F. (2005): Plows, plagues, and petroleum: how humans took control of climate. Princeton, N.J: Princeton University Press.
Schmidt, G. A., Shindel, D. T. and Harder, S. (2004): A note of the relationship between ice core methane concentrations and insolation. Geophys. Res. Lett. 31 (23): L23206. Bibcode2004GeoRL..3123206S. doi:10.1029/2004GL021083. http://www.agu.org/pubs/crossref/2004/2004GL021083.shtml.
The World Bank (2012): Climate finance and the world bank: the facts. http://climatechange.worldbank.org/content/climate-finance-and-world-bank-facts
Created by XMLmind XSL-FO Converter.
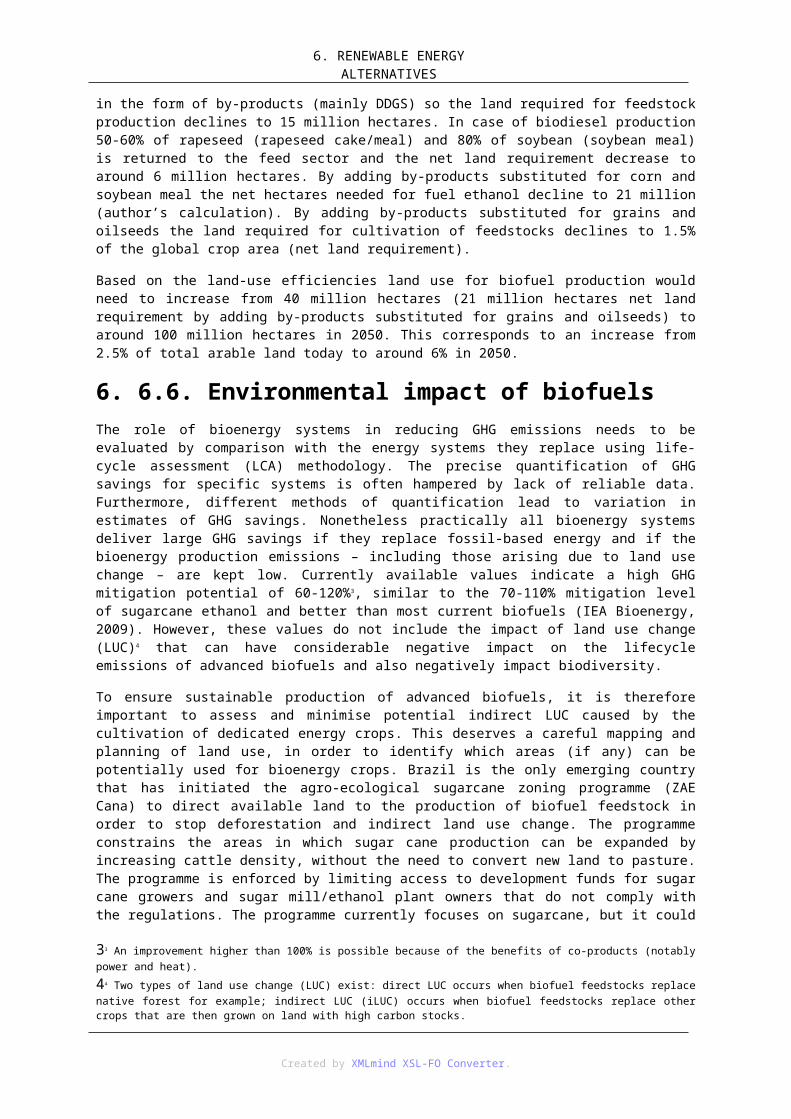
10. fejezet - 10. FOOD CHAIN: FOOD MANUFACTURING, DISTRIBUTION, AND RETAILING1. 10.1. Food supply chainThere are three ulinks in the supply chains of the agri-food sector. They are production, wholesale/intermediary trade and retail trade (Figure 1). For example the supply chains for bread and onions have a number of additional ulinks. In the case of bread, there is first the production and wholesaling of wheat, flour and meal before the production of bread starts. In the potatoes, vegetables and fruit group processing also occurs before the supply chain in the case of onions (i.e. the sliced onions). In the wholesale/intermediary trade it is possible to make a distinction between companies that do their own purchasing and distribution and companies that use specialised service providers for distribution and/or processing.
10.1. ábra - Figure 1: Overview of players in the agri-food sector
Source: The Netherlands Competition Authority (2009)
The vegetables and fruit product group is seasonal in most of the countries. There are several months when it is not generally profitable for producers to produce. Factors that play a role include the temperature and the limited number of daylight hours. To meet domestic demand in this period the wholesalers and intermediary traders obtain products from other countries. Trading in the vegetables and fruit sector is highly international.
1.1. 10.1.1. ProducersThe producers in the upstream sector have a large number of companies compared with other stakeholders in the supply chain. The producer level usually has the highest added value compared to food manufacturing and retailing. An exception is the bread supply chain where most value is created within the bread industry. The vegetables and fruit sectors are often affiliated to sales organisations where the members receive payout prices based on the expected or actual revenues of the growers’ associations and sales organisations.
1.2. 10.1.2. WholesalersThe wholesale level lies between producers and supermarkets. This level is characterised by numerous intermediary traders, i.e. wholesalers that buy and sell to other wholesalers. The most important activities for the wholesale/intermediary trade are collecting products from the various primary producers and distributing a total package of products to a relatively small number of large customers. Depending on the type of company and type of product, the products are on the one hand sold and distributed directly to the supermarkets, and on the other hand sold to service providers who perform such activities as packaging, grading, cutting, processing and
Created by XMLmind XSL-FO Converter.
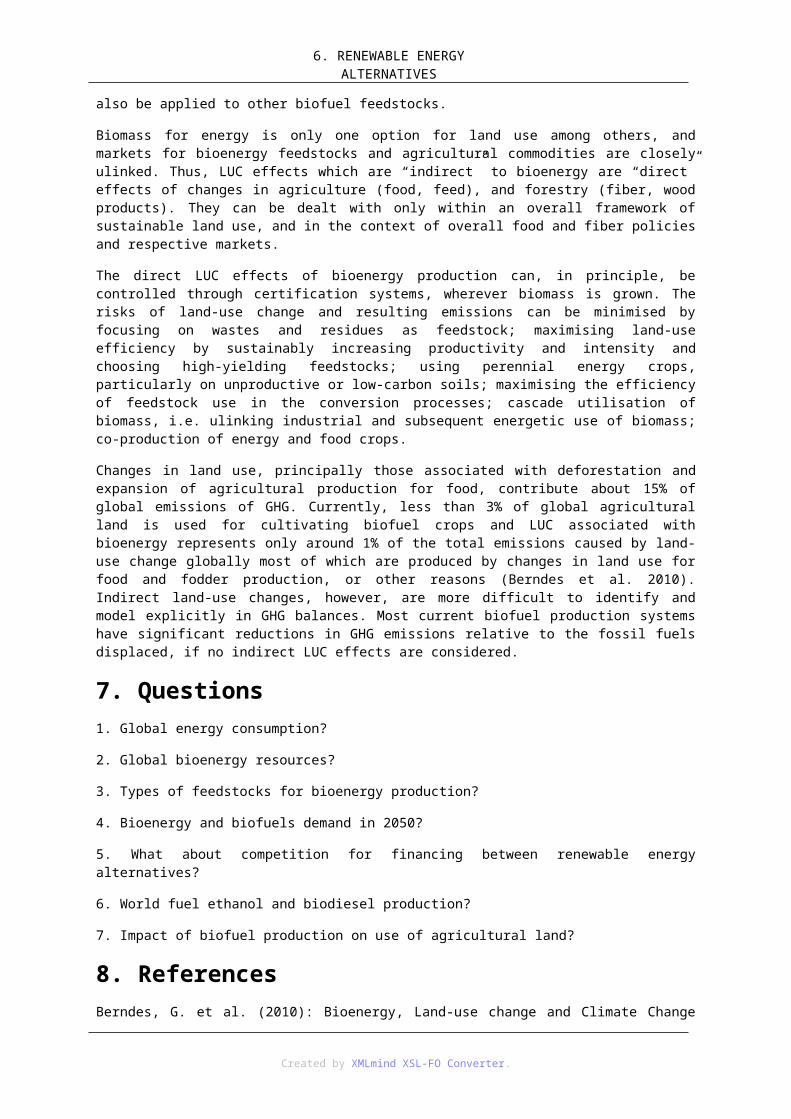
10. FOOD CHAIN: FOOD MANUFACTURING,
DISTRIBUTION, AND RETAILING
distributing. There are often mutual deliveries between wholesale companies. Besides the classical wholesale companies this level includes the sales organisations of producers.
Wholesalers appear to be strongly concentrated for a majority of products. Compared with the upstream sector, the added value of wholesalers is significantly less, with the exception of the some typical supply chain for bread. Nevertheless, the wholesalers do fulfil an important role in packing the products, quality control and often product development and promotional activities.
1.3. 10.1.3. SupermarketsThe supermarket is the final downstream sector in the supply chain. There are supermarket chains that independently purchase their products, such as Aldi, Lidl and Super de Boer, while others, often smaller chains buy through purchasing organisations. The added value for these products is limited compared to the stakeholders in the upstream sectors of the supply chain. As a supermarket sells a lot of products, the added value over the entire product group may be relatively high.
2. 10.2. Food retail tradeOn the purchasing side the core tasks of food retailers are purchasing, logistics and stock management. Suppliers deliver products to the distribution centres of the supermarket chains, from where the supermarkets deliver to their branches. Distribution nowadays depends not only on managing logistics but also on managing information. The supplying of branches and distribution centres is ulinked to the data scanned at the cash desk. On the selling side, the core tasks include the layout of the shop floor and shelves, the choice of product ranges, price determination and promotional activities. Supermarkets are providing more and more service to consumers, such as home delivery, electronic ordering and a wide array of payment possibilities and other financial services. The profile of supermarket chains is being strengthened by the selling of their own-label-brands. Supermarkets are issuing an increasing number of more stringent product specifications for own-label-brands and also for other products. This occurs particularly with respect to food safety.
The geographical market for the products in question is larger than the country where the food chain is located. The market is not a national but a global one. Food chains use a limited number of suppliers to guarantee security of supply, quality and competition. Besides possible price and volume arrangements, the suppliers and supermarkets agree arrangements about the width of the range of products, logistics and planning, peak supply, brands and packaging. The purpose of such arrangements is to increase product quality, accessibility, traceability and supply chain transparency and to differentiate the supermarket chain from other chains. Chain stores determine to a significant degree the product specifications and other conditions of delivery. They do so for such purposes as developing own-label brands. These arrangements are agreed with the direct supplier, but increasingly also with a chain of suppliers. Agreements are concluded both with growers and with service providers.
Arrangements for product specifications, packaging and logistics are made under master agreements, but also in detailed written contracts. Large supermarket chains sign arrangements throughout the entire chain. Small supermarket chains confine themselves to arrangements with relatively large parties in the chain. Backward integration is difficult, because wholesaling is not part of the core competence of chain stores.
However, the interdependence between suppliers and supermarket chains is increasing all the time. This increases the switching costs for supermarkets. The arrangements for packaging, own-label-brands, product specifications and logistics mean that it is no longer possible to replace a supplier by an arbitrary competitor. Generally speaking, there are no major differences regarding the conditions of delivery between suppliers on the one hand and supermarket chains on the other.
2.1. 10.2.1. NegotiationsSupermarket chains and their suppliers agree in writing or otherwise the supply of products for a period of six months to a full year. The prices are agreed in writing for this period. The value of a written contract is limited, however. Supermarket chains are said regularly to reverse arrangements. Prices for vegetables and fruit are generally set weekly. However, there are some supermarkets (value‐for‐money supermarkets) that agree volume and price arrangements for the duration of the harvesting season. Supermarket chains also claim that a fixed contractual price is risky since they do not want to incur a loss on a product for the whole season. The same
Created by XMLmind XSL-FO Converter.
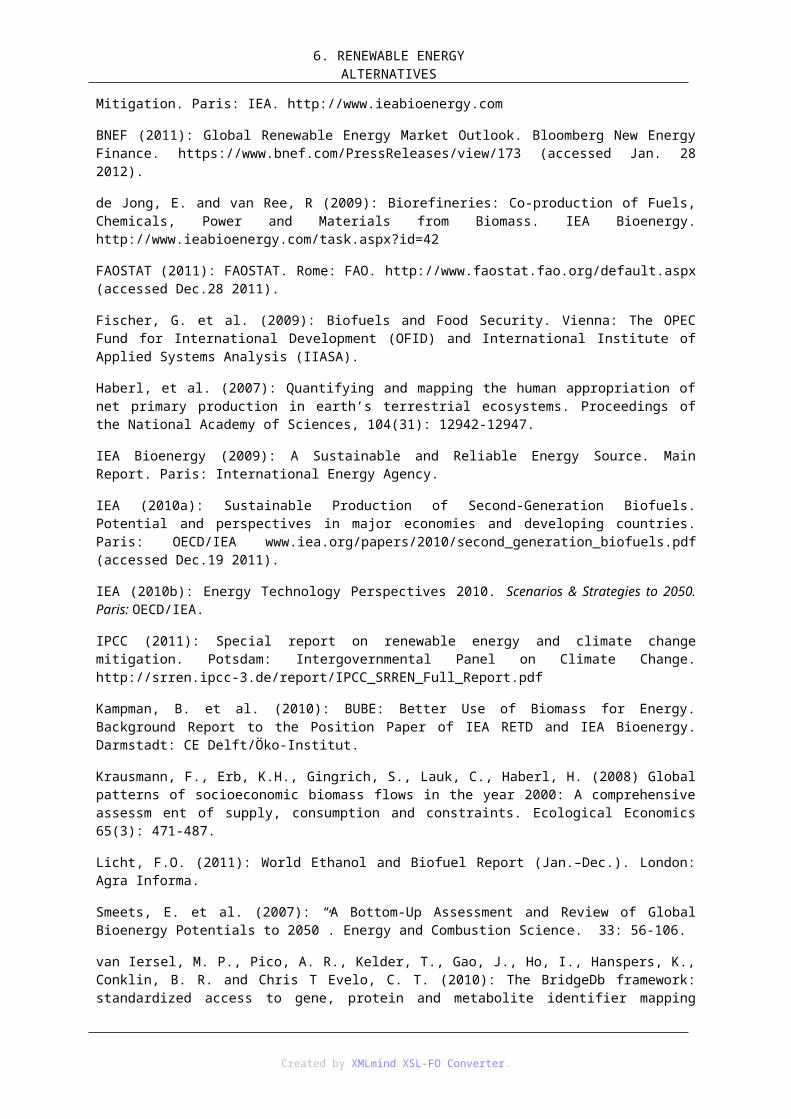
10. FOOD CHAIN: FOOD MANUFACTURING,
DISTRIBUTION, AND RETAILING
applies to price arrangements when planning and marketing special offers.
Supermarkets get a number of suppliers to submit offers for the price at which they are willing to deliver. Based on such offers, suppliers are selected for one week, six months, one year or a season. However, the freedom of choice of supermarkets is limited for some products, particularly if the supermarkets want to have several suppliers of a certain size. When there is limited freedom of choice the prices are established by consulting with each other.
The volume in long‐term contracts depends on the required (minimum) weekly quantity and the price. If the contractual price is too high, the contractual quantity will be smaller. The rest will be purchased on a weekly or daily basis. These purchases will be made with the same supplier as the one with whom the seasonal contract exists with a view to the logistical costs and the monitoring of quality. Consultations are held to agree the contractual conditions. Furthermore, supermarket chains have great influence over the conditions. This has to do with the wish of supermarket chains to define in increasing details the product specifications of products, in particular own-label-brands. It is also in the interests of supermarkets to organise the logistical process as cheaply as possible. Logistics is the crucial point in controlling costs in the chain. The contractual conditions that suppliers and supermarket chains agree with each other are similar. However, there are some differences that are related to differences in quality, volume, order size and frequency.
2.2. 10.2.2. Price, discounts, financial contributions and risksThe prices that suppliers and supermarkets agree depend in the first instance on supply and demand. To a significant extent this also explains why the negotiating position of suppliers is weak in relation to the supermarket chains. In virtually all markets there is an oversupply and overcapacity. This enables supermarket chains to play‐off suppliers against each other. Suppliers underbid their competitors in every possible way in order to market an oversupply. Supermarket chains and also independent branch owners take advantage of this situation. Particularly for vegetables and fruit, suppliers regularly do business with branch owners outside the central purchasing organisation of supermarket chains. Franchisees and independent companies are free to make some of their purchases themselves.
The negotiating position of suppliers is relatively strong if they hold a licence for a new variety. This occurs in the case of new varieties of vegetables and fruit. The exclusive sales rights result in sales being monopolised and competitors can be pushed out via the back door. The suppliers earn particularly through new varieties. For these varieties the suppliers are able to determine the selling price based on a cost price‐plus method. There are differences in the prices that suppliers and supermarket chains agree with each other. The differences are related to a significant extent to differences in quality, variety, order frequency and volume and the total range of products. When determining the price some supermarket chains agree one price for all suppliers.
Supermarkets regularly negotiate discounts on deliveries. Volume and graduated discounts in particular are given. The purpose of both kinds of discounts is to get the supermarket chains to take up as many products as possible from the overall range and to stimulate repeat purchases. Discounts are also regularly given for early payment. The supermarket chains regularly lengthen the payment term, unilaterally or otherwise. Discount arrangements are set down contractually but are also negotiated between the parties while a contract is in force. Discounts and payment arrangements are important to preservation of the supplier‐customer relationship.
The discounts correspond in part with cost savings but are also unrelated to cost savings to a certain extent. Indirectly, volumes play a large role due to the effect on the logistical costs, i.e. full versus half‐full lorries and pallets. Discounters do not negotiate discounts or other financial contributions and concentrate on price. Supermarkets negotiate with suppliers on contributions towards promotional activities, i.e. costs for a leaflet and sometimes a lower purchasing price. Such arrangements are agreed contractually, however, in some cases they are also negotiated in the interim. Payments for such matters as shelf space, inclusion in the range of products and introduction of a new product occur seldom if at all. In the case of generic fresh products, negotiations revolve around the price (including discounts). The supermarkets carry out pilots if they foresee risks in introducing new product varieties. There are also suppliers that require financial contributions from supermarket chains although they are exceptions.
The product and sales risks attached to vegetables and fruit generally shift at the time of sale of the product from the supplier to the customer. The risks attached to perishable and unsold products therefore rest with the supermarket chains after delivery. The loss is great at relatively small supermarket chains. Unsold vegetables and fruit are dumped by the supermarket or by the service providers. There are generally no buyback
Created by XMLmind XSL-FO Converter.
10. FOOD CHAIN: FOOD MANUFACTURING,
DISTRIBUTION, AND RETAILING
arrangements for vegetables and fruit. Unsold bread is generally taken back by the bakeries (or by the service providers) after one day and is resold for processing into bread crumbs, animal feed and similar. The bakeries sometimes buy back the unsold bread, furthermore it also happens that they take it back for nothing.
Prices are not adjusted to changed market conditions unless the prices jeopardise quality or security of supply or the market conditions have changed dramatically. This occurs occasionally. It can prove necessary for the supermarkets to agree to a price increase to safeguard supplies. A threat not to deliver or not to take a product is used occasionally as a way of getting a better price. Supermarkets do this but so do suppliers. Supermarkets sometimes threaten to remove a product from the range and occasionally actually do so. This usually concerns either a single product or a small number of products but not the entire range of products.
Differences of opinion about fulfilment of contractual conditions occur to a limited extent. Where differences of opinion exist they are settled generally. Cancellation of a contract while it is in force occurs seldom if at all. Differences of opinion may arise about the quality of a product. Quality control is not complete and based on random samples. Growers can take advantage of this situation by wrongly trying to sell products as Class I products. A dispute will exist if the customer discovers this during checks. Conflicts of this kind are resolved commercially.
3. 10.3. Asymmetric price adjustmentIn the examined supply chains, the purchase of raw materials consists for the larger part of the total direct costs of the wholesaler and the supermarket. This cost item is also by far the most volatile over time. The other costs (labour, capital, interest) are generally far more constant over time. Therefore, a strong relationship (long term) may be expected to exist between the purchasing price and the selling price of stakeholders (upstream and downstream sectors) in a supply chain. Changes to the purchasing price will ultimately result in similar changes to the selling price. In the economic literature, however, a number of examples can be found as to why this price adjustment does not need to be perfect and why asymmetry may occur. Asymmetric price adjustment is mainly about the difference in adjustments between price increases and price decreases.
Two aspects typify asymmetric price adjustment. The first concerns the speed of the price adjustment. A higher purchase price can be passed on sooner in the selling price than a reduction of the purchasing price, for example. A situation may also occur where a higher purchasing price is charged on more slowly than a lower purchasing price. This form of asymmetric price adjustment leads to a temporary transfer of margin between the selling company and the purchasing company. The second aspect concerns the size of the price adjustment. In this instance, higher purchasing prices will be passed on in their entirety to the following sector, while price reductions will be passed on only to a limited extent. Here again, it is possible for a higher purchasing price not to be passed on in its entirety on one hand side, and a lower purchasing price to be passed on in its entirety on the other side. This form of asymmetric price adjustment leads to a permanent transfer of margins.
Asymmetric price adjustments have to do with imperfect competitive markets, or in other words the existence of market power. It is generally assumed that if market power rests with the wholesalers or the supermarkets, the consequence will be that increases in producer prices will be passed on sooner and/or more than decreases in producer prices. The wholesaler or supermarket will then achieve temporary or permanently higher margins. However, there may also be market conditions in which market power can lead to temporary or permanent lower margins.
However, asymmetric price adjustment can be caused by asymmetric adjustment costs for changes to quantities and/or prices of inputs and/or outputs. For example, if the output increases, a company will have to incur extra costs to obtain extra input (search costs, pay a higher price). In the case of perishable goods like vegetables and bread, supermarkets might be cautious about increasing the price because a possible reduction in demand might oblige them to throw away unsold products.
Asymmetric price adjustment may further have to do with psychological price levels. Supermarkets generally charge prices like EUR0.99, EUR2.49 and EUR9.99. Relatively small price increases might not be desirable for this reason (EUR1.04, EUR2.61 and EUR10.48).
A consumer will generally prefer to pay relatively stable prices for products. A consumer does not want to pay a different price every day for a loaf of bread in the supermarket because of fluctuations in the grain market. Therefore, some of these fluctuations will be absorbed by relevant sector in the supply chain. Examples of ways
Created by XMLmind XSL-FO Converter.
10. FOOD CHAIN: FOOD MANUFACTURING,
DISTRIBUTION, AND RETAILING
of absorbing a fluctuation are the conclusion of forward contracts and the temporary application of higher or lower margins. Asymmetric price may further be caused by certain government interventions, like price thresholds and quality requirements.
4. Questions1. Trends in the food industry?
2. Lack of price transparency in the food supply chain?
3. Food retail trade?
4. Price adjustment in the food supply chain?
5. ReferencesThe Netherlands Competition Authority (2009): Pricing in the agri-food sector. The Netherlands Competition Authority (NMa). p. 54. http://www.oecd.org/site/agrfcn/48638829.pdf
Bunte, F., Bolhuis, J., de Bont, C., Jukema, G. and Kuiper, E (2009). Pricing of food products. LEI Wageningen UR, The Hague. 70 p. http://www.oecd.org/site/agrfcn/48638813.pdf
Created by XMLmind XSL-FO Converter.
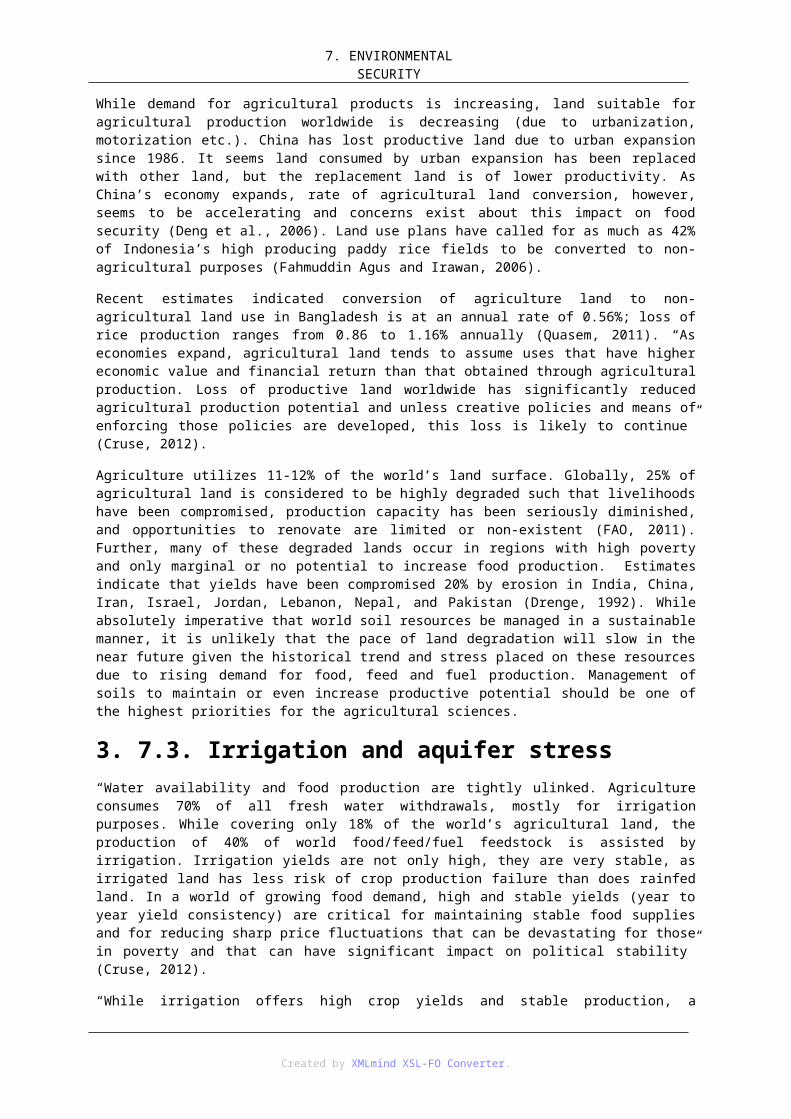
11. fejezet - 11. PRICE VOLATILITY IN FOOD AND AGRICULTURAL MARKETSIntroduction
Food price volatility over the last four years has hurt millions of people, undermining nutritional status and food security. The level of price volatility in commodity markets has also undermined the prospects of developing countries for economic growth and poverty reduction. After staying at historic lows for decades, food prices have become significantly higher and more volatile since 2007. A first price spike occurred across almost all commodities in 2007/2008. After a drop in 2009/10, prices are now climbing again and volatility remains high (Figure 1). Periods of high or low prices are not new. In fact, price variability is at the core of the very existence of markets. Since 2007, however, the degree of price volatility and the number of countries affected have been very high. This is why food price volatility in the context of higher food prices has generated considerable anxiety and caused real problems in many countries (Headey, 2011b).
11.1. ábra - Figure 1: Food Price Index, annually, 1960-2011 (2000 = 100)
Source: World Bank (2011)
1. 11.1. What is volatility?In a purely descriptive sense volatility refers to variations in economic variables over time. Here we are explicitly concerned with variations in agricultural prices over time. Not all price variations are problematic, such as when prices move along a smooth and well-established trend reflecting market fundamentals or when they exhibit a typical and well known seasonal pattern. But variations in prices become problematic when they are large and cannot be anticipated and, as a result, create a level of uncertainty which increases risks for producers, traders, consumers and governments and may lead to sub-optimal decisions. Variations in prices that do not reflect market fundamentals are also problematic as they can lead to incorrect decisions (Prakash and Stigler, 2011).
2. 11.2. Price levels and food securityBehind concerns about volatility lie concerns about While producers benefit (or at least those who are net producers and whose asset base and knowledge enable them to respond effectively), consumers, especially poor consumers, are severely adversely affected by high prices. Food accounts for a very high share of the total budget of the poorest households. And because poor households often consume foods that are less processed the effect of rises in commodity prices is felt more strongly. These households find their nutrition status (especially of pregnant women, children and those affected by long-term diseases such as HIV), as well as their capacity to purchase education, health care, or other basic needs compromised, when food prices are high.
Producers are more concerned about low prices, which may threaten their living standards as well as their longer
Created by XMLmind XSL-FO Converter.
11. PRICE VOLATILITY IN FOOD AND AGRICULTURAL
MARKETSterm viability when income is too low to provide for the farm family or for the operational needs of the farm. Uncertainty may result in less than optimal production and investment decisions. In developing countries, many households are both producers and purchasers of agricultural products. For this group the impacts of price volatility are complex, with net outcomes depending on a combination of many factors.
Price volatility has a strong impact on food security because it affects household incomes and purchasing power. It can transform vulnerable people into poor and hungry people. Price volatility also interacts with price levels to affect welfare and food security. The higher the price, the stronger the welfare consequences of volatility for consumers, while the opposite is true for producers. This interaction implies that focusing only on price spikes will not address overall welfare consequences.
Food price increases are problems of agricultural price volatility (implicitly suggesting that high prices will not last) and as a quasi-natural and constant problem in agricultural markets. There appears to be a consensus that price volatility in the last five years has been higher than in the previous two decades, but lower than it was in the 1970s. Because of the liberalization of markets over the past 20 years, however, domestic prices in many countries are more connected to international prices than they were in the 1970s. For some developing countries, liberalization has also meant a significant increase in the level of imports in the total food supply, making international food price volatility even more a concern than it would have been in the 1970s (Prakash, 2011).
3. 11.3. Drivers of food price volatilityBased on the view that volatility is the normal state of agricultural markets, three possible causes of international food price volatility are discussed: demand elasticity, trade policies and speculation. Of these three, the role of speculation in the futures market is clearly the most controversial. Nobody contests the dramatic increase in the volume of non-commercial transactions on the futures market. However, conclusions diverge widely as to whether increased non-commercial transactions led to the formation of price bubbles.
By contrast, the effects of both the demand from the biofuel industry and the use of restrictive trade measures (mostly export bans) on prices are far less controversial. But both issues are very sensitive politically. Biofuel support policies in the United States and the European Union have created a demand shock that is widely considered to be one of the major causes of the international food price rise of 2007/08. Similarly, the restrictive trade measures adopted by many countries to protect consumers during that time are widely seen as having accelerated price increases. Both biofuel support policies and export restraints have led many governments to question whether they can rely on international markets as part of their food security strategies (OECD, 2008).
3.1. 11.3.1. Demand elasticityIncreasing volatility may also be related to a decrease in price elasticity of demand as a result of increased income. The richer consumers are, the less likely it is that they would reduce food consumption because of a price increase. This is because the share of staple food in the total expenditure of relatively rich people is smaller relative to their income. As a result, an increase in prices does not necessarily lead to a decrease in demand. Given the overall growth in world incomes, food demand is now less price sensitive, which, as price theory shows, can lead to more volatility (HLPE, 2011).
This observation raises an international equity issue. In the international markets, consumers with very different income levels compete for access to food. Consumers in poor countries are much more sensitive to price changes than consumers in rich countries. This is true of richer and poorer consumers within countries as well. It also means that, when supplies are short, the poorest consumers must absorb the largest part of the quantitative adjustment necessary to restore equilibrium to the market. While a spike in food prices forces the poorest consumers to reduce their consumption, richer consumers can maintain more or less the same level of consumption, increasing inequity in the overall distribution of food.
The second explanation of the current behaviour of international food prices points to the fact that there have been periodic food crises (1950s, 1970s, and present) that can be explained by the dynamics of agricultural investment. High prices trigger a rush of investment and technological development that succeeds in raising production and lowering prices. In contrast, persistence of low prices leads to a reduction of public interest and waning investment. This situation persists until supply is so low that prices begin to spike, which again triggers a new round of investment. From the end of the 1970s to the mid-1990s, the growth of world Agricultural Capital Stocks (ACS) slowed, ultimately stabilizing at a low growth level. Several developed regions even experienced a process of decapitalisation in agriculture. In developing regions, the growth of ACS stayed
Created by XMLmind XSL-FO Converter.
11. PRICE VOLATILITY IN FOOD AND AGRICULTURAL
MARKETSpositive, but slowed and is still slowing in Latin America, sub-Saharan Africa, and south Asian countries. The slowing of agricultural investment growth occurred during a period of restricted public support for agriculture in developing countries.
The third explanation sees the current price increases as an early signal of a long-lasting scarcity in agricultural markets. According to this explanation, the world could be facing the end of a long period of structural overproduction in international agricultural markets, made possible by the extensive use of cheap natural resources (e.g. oil, water, biodiversity, phosphate, land) backed by farm subsidies in OECD countries. In other words, we might be at the end of a period of historically unprecedented growth in agricultural production that relied on a strategy akin to mining. At the same time, new demands for biomass are emerging. Biofuels are just the most visible part of increasing demand for biomass to provide not only food but also building materials, heat, and transportation.
This explanation of rising food prices in terms of scarcity is not new; it was much discussed in the 1970s. But our understanding of the environment has deepened. Today, we see more clearly the costs of industrial agriculture, including the associated pollution, depletion of freshwater aquifers and loss of biological diversity. We also see the costs of long-term under-investment in agriculture and agricultural research. We are asking new questions about what to expect from climate change and how the introduction of potentially unlimited demand on agricultural resources from the energy sector will play out. We can be optimistic that human ingenuity will find solutions, but only if we are prepared to learn from our past mistakes. The long-term challenges confronting agriculture today on both the supply and the demand side are very real (FAO, IFAD, IMF, OECD, UNCTAD, WFP, the World Bank, the WTO, IFPRI and the UN HLTF, 2011).
Although rising international food prices represent a serious threat to vulnerable people in developing countries, it is domestic food price inflation and volatility that determine the poverty and food security impacts of international food crises. In most developing countries, the 2007/08 international food price rise was transmitted to domestic prices, although not evenly and in some cases with significant delays. Moreover, the subsequent drop in international prices was only partially transmitted – average consumer prices in developing countries remained up to 50% higher than they were before 2007/08. The international price rise that started in 2010 and continues today was transmitted to domestic markets even more quickly than the 2007/08 price spike. However, the uneven transmission of international price spikes to domestic prices across countries, commodities, and time periods means that each case will require careful characterization of the transmission in order to appropriately formulate price stabilization and food security policies (Headey and Fan, 2010).
In many poor countries, price volatility on domestic markets for locally grown products is the result of both the transmission of international price volatility and of purely domestic (sometimes called endogenous) sources. Even when international prices are stable (as they were between 2000 and 2007) many poor countries exhibited very high price volatility across space and time. Again, there is a large heterogeneity with respect to the mix of imported and domestic sources of volatility. Each country should therefore accurately identify the sources of its own price volatility. Appropriate policies to stabilize, manage, and cope with domestic price volatility can be quite different depending on the sources of price volatility. To date, there is no institutional mechanism that systematically collects and analyses data with a view to informing a global and dynamic vision of the actual impact of food price crises on vulnerable populations.
There is considerable heterogeneity across countries in terms of how increased price volatility could affect a given country. Key sources of heterogeneity include: agro-ecological conditions and connectivity (e.g. landlocked countries may be affected differently from those with coastal access), preferences of staple food (e.g. diversified versus single staple focus), institutional capacity to implement policies, and macroeconomic health. There is consequently no “one policy response fits all” approach.
The feasibility and effectiveness of some of the most commonly recommended policy prescriptions for poor countries – such as scaling up social safety nets and introducing weather insurance programmes for risk management – will vary from country to country. Therefore, information regarding cross-country heterogeneities needs to be assessed in order to make these policies work. Every country will need to design its own comprehensive food security strategy. This will involve objective assessment of the existing food security policies and programmes, identification of gaps, and working towards building the internal institutional capacity to address them.
4. 11.4. Trade policies
Created by XMLmind XSL-FO Converter.
11. PRICE VOLATILITY IN FOOD AND AGRICULTURAL
MARKETSBuilding a rules-based multilateral trading system able to guarantee food access for every country is now a major challenge for the international community. Since the Uruguay Round, negotiations regarding agriculture have been conceived and conducted in the context of a structural overproduction. This means that the focus has been on how to limit trade conflicts amongst exporting countries and how to open up protected economies to more imports. The objective of the rules was to guarantee fairness of competition between suppliers and to protect market access for exporters. Access to world markets was not negotiated for importers and export restrictions were hardly disciplined. The increase in international food prices and the breakdown of the Doha negotiations opens the possibility of a new project in which confidence in international markets would not be based on unrestricted free trade. The food price crisis showed that sovereign states are not prepared to serve international markets at the expense of domestic priorities. This political “reality check” suggests that trade policies, and the multilateral rules that frame them, need to be reconsidered. Multilateral rules are more essential than ever (Headey, 2011a).
The relationship between stock levels and price volatility is well established: low stocks are strongly associated with price spikes and volatility (Figure 2). It is likely that some international coordination of stocks would also make an important contribution to restoring confidence in international markets. Empirically, a minimum level of world stocks seems to be a sufficient condition to avoid price spikes. Experience also shows that, in a crisis, access to financing mechanisms may not secure stocks during supply shortages. Past experience shows that managing world stocks for price stability is difficult as this requires intergovernment cooperation and information. This needs international agreement regarding complex issues – among other issues – when to stock, governance of the systems, location, coordination, and ensuring that the stocks reach those who need it most.
11.2. ábra - Figure 2: World stocks as a percentage of world consumption for corn, wheat, rice and vegetable oils, 1960–2010
Source: World Bank (2011)
5. 11.5. Hedging agricultural commodity with futures and options (USA)Producers of agricultural commodities are faced with price and production risk over time and within a marketing year. Furthermore, increased global free trade and changes in domestic agricultural policy have increased the price and production risks of agricultural producers. As price and production variability increases, producers are realizing the importance of risk management as a component of their management strategies. One means of reducing these risks is through the use of the commodity futures exchange markets. Like the use of car insurance to hedge the potential costs of a car accident, agricultural producers can use the commodity futures markets to hedge the potential costs of commodity price volatility. However, like car insurance in that the gains from an insurance claim may not exceed the cost of the cumulative sum of premiums, the gains from hedging may not cover the costs of hedging. This guide was designed to introduce agricultural hedging and aid you in better evaluating hedging opportunities. The primary objective of hedging is not to make money. The primary objective of hedging is to minimize price risk and this includes using hedging to minimize losses.
5.1. 11.5.1. Commodity arbitrage and the operations of a commodity exchange
Created by XMLmind XSL-FO Converter.
11. PRICE VOLATILITY IN FOOD AND AGRICULTURAL
MARKETSArbitrage is the process whereby a commodity is simultaneously bought and sold in two separate markets to take advantage of a price discrepancy between the two markets. A commodity futures exchange acts as a market place for persons interested in arbitrage. The factors driving arbitrage are the differences and perception of differences of the equilibrium price determined by supply and demand at various locations. For instance, suppose there is a shortage of corn in North Carolina to feed livestock. If I believe that I can profit from buying corn in Missouri, paying shipping costs, and selling corn in North Carolina, I will continue to do so until the supply and demand for corn are equal in North Carolina, thus the Missouri corn price plus the shipping costs equal the North Carolina corn price (Parcell and Pierce, 2013).
For the futures market, the arbitrage activities are carried out through the exchange of paper promissory notes to sell or buy a commodity at an agreed upon price at a future date. As persons with different perceptions of where supply and demand are currently and how supply and demand will change in the future interact, commodity prices are driven to equilibrium. As new information enters the market, people’s perceptions change and the process of arbitraging begins again.
For example, let’s say Bill believes the domestic fall production of corn has been under estimated in mid-summer, and Tom believes the domestic fall production of corn has been over estimated in mid-summer. Using the commodity exchange as a market place, since Bill believes corn prices will drop, Bill sells a futures contract, and Tom buys a futures contract because he believes the price is going to go higher. Assume that Bill and Tom sell and buy their contracts for the same price and they are held by each other, and in three months, Bill must buy back his contract and Tom must sell back his contract. By both individuals ending up with no obligations, this clears the market. Furthermore, the contract price is allowed to freely change in value during the three months depending on the change in supply and demand for the underlying commodity (Parcell and Pierce, 2013).
Now, depending on what happens to prices over the following few months, either the contract will not change in value, appreciate, or depreciate. If the value doesn't change, neither person benefits. If the value appreciates, Tom would earn a profit by selling back his contract at the new higher price and Bill would lose money by buying back his contract at the new higher price. If the value depreciates, Tom would lose money by selling back his contract at the new lower price and Bill would profit by buying back his contract at the new lower price.
So, is arbitrage through a commodity exchange really this simple? In some ways yes, and the rules of trading allow for the buying and selling of the contract at any time. There is no minimum time you must hold a contract. However, as you might suspect from the above scenario, arbitrage through the futures is in some way a gamble like buying insurance. Sometimes it pays for itself and sometimes it doesn’t. Furthermore, the scenario described above between Bill and Tom is called speculating. That is, neither party has actual ownership of a commodity, but they believe they can “out-guess” the market. Hedging, is the process whereby a person owns the commodity and uses the commodity futures markets to transfer their risk (Parcell and Pierce, 2013).
There are two main locations where arbitrage occurs for agricultural commodity futures markets. Chicago is the location of both of these main futures exchanges. The Chicago Board of Trade (CBOT) is where the agricultural commodities corn, soybean, soybean oil, soybean meal, and wheat futures are traded. The Chicago Mercantile Exchange (CME) is where the agricultural commodities lean hogs, live cattle, stocker cattle, and feeder cattle are traded. In addition to these commodity markets, cotton is traded at the New York Cotton Exchange (NYCE), and rough rice is traded at the MidAmerica Commodity Exchange.
In a market place like the CBOT or CME, the number of buyers equals the number of sellers. However, no specific buyer and seller are obligated to each other. Therefore, a person is allowed to sell his/her contract or buy a contract at any time within the trading specifications for the exchange. As contract months change, the market enters a contract expiration month in which all persons end up with zero contracts for that trading period. That is, if you sell (buy) one contract, you must buy (sell) back one prior to contract expiration. However, the physical delivery of commodities allows for the substituting of the commodity for the contract.
Hedging is a transfer of risk through arbitrage. Price risk can occur for a number of reasons. For agricultural commodities, price risk may occur due to drought, near record production, an increase in demand, decreased international production, etc. The commodity futures markets provide a means to transfer risk between persons holding the physical commodity (hedgers) and other hedgers or persons speculating in the market. Futures exchanges exist and are successful based on the principle that hedgers may forgo some profit potential in exchange for less risk and speculators will have access to increased profit potential from assuming this risk. For example, suppose a person works on commission and receives USD2 000, USD8 000, USD5 000, and USD13
Created by XMLmind XSL-FO Converter.
11. PRICE VOLATILITY IN FOOD AND AGRICULTURAL
MARKETS000 in salary for four consecutive months for an average salary of USD 7 000/month over this period. Now suppose the person could accept a salaried position for a known USD 6 000/month. If the person prefers less income variability, they would pay for the decreased variability and accept the, on average, USD 1 000/month pay cut. Alternatively, the employer would require the USD 1 000/month to off-set the risk he/she now assumes from the person not being motivated to sell more (Parcell and Pierce, 2013).
This same concept applies to hedging in which hedgers might be willing to give up some of the revenues for a known price, and speculators would require the opportunity for more revenue by assuming the price risk. For example, suppose that in late April Joe Farmer plants 500 acres of corn. At this time, Joe Farmer notices that he can forward price a portion of his corn production through the futures market at USD 2.80/bushel. Knowing that his cost of production is USD 2.45/bushel, Joe is willing to price one-third of his anticipated production at USD 2.80/bushel. That is, hedging by the agricultural producer generally involves selling the commodity at the commodity exchange market because producers want to lock in a price floor (a minimum price they will receive). Joe sells a futures contract for his corn, speculators or hedgers (entities such as grain elevators looking to lock in a price ceiling for the grain they are forward contracting) simultaneously are buying the contracts. Now, what can happen? The following analysis holds basis constant (Parcell and Pierce, 2013).
5.1.1. 11.5.1.1. If the future price goes higher, lower or does not change
Assume the fall futures and cash price of corn goes up to USD 3.00/bushel when Joe is ready to harvest the crop. Joe loses USD 0.20/bushel in the futures market, but he gains this back in the cash market through the simultaneous cash price increase with the futures price [what happens to basis, the difference between the cash and futures market, during this time will determine how much Joe makes in the cash market]. At worst, Joe receives USD 2.80/bushel for his hedged grain (commissions are not used for this example which would lower the price Joe receives by a small amount).
The fall futures and cash price of corn goes down to USD2.50/bushel when Joe is ready to harvest the crop. Joe gains USD0.30/bushel in the futures market, but loses in the cash market through the simultaneous price decrease with the futures price [again, what happens to basis, the difference between the cash and futures market, during this time will determine how much Joe makes in the cash market). At worst, Joe receives USD2.80/bushel for his hedged grain less commissions. The fall futures and cash price of corn stays at USD2.80/bushel when Joe is ready to harvest the crop. Joe does not gain in either the futures or cash market except for potential basis gain or loss. At worst, Joe receives USD2.80/bushel for his hedged grain less commissions (Parcell and Pierce, 2013).
What do all of these scenarios have in common? Joe generally knew what price he would receive for the portion of his hedged corn. Why is this important? Joe does not need to worry about a price decline that would affect revenue; therefore, Joe knows approximately how much of a revenue stream he will have for cash flow analysis. However, there may be some types of production risks that cannot be covered through futures. If persons are concerned about production risks due to natural type catastrophes, persons may want to inquire about crop insurance to cover production short-falls. Also, the basis component of hedging was not discussed. A change in basis can increase or decrease a net price decrease or increase from hedging.
When to hedge? By knowing the enterprise cost of production, Joe can determine at what prices he might consider forward pricing portions of this crop. Thus, it is imperative that a producer knows his/her cost of production when hedging a commodity. For instance, if Calvin knows his cost of production on 400 pound feeder calves is USD60/cwt., then Calvin might consider forward pricing a portion of his calf crop through the futures market when the futures market price allows for Calvin to cover his cost of production. It is important that producers determine a target profit margin, because people have a tendency to always want to price at the market high. Some words of advice, it is nice to say you received USD5/cwt. more on your calf crop then your neighbour, but it is even better to say you retired a farmer by making wise choices instead of risky choices.
The costs of hedging are straightforward; however, these expenses can become substantial over time. Commissions are paid to a broker for administrative costs, futures exchange operation, and futures exchange regulation. These costs can range from USD 9 to USD 35 or more per order. An order is either a buy or sell order. Therefore, to enter and exit the market the total costs can range from USD18 to USD70 or more (Parcell and Pierce, 2013).
Margin money is only paid on futures positions and not options positions. Margin money refers to earnest money placed in a brokerage account to cover potential losses. The initial margin is needed to start trading. Typically, a futures position will require the initial cost of between 3% to 10% of the actual cost of the contract
Created by XMLmind XSL-FO Converter.
11. PRICE VOLATILITY IN FOOD AND AGRICULTURAL
MARKETSbeing traded (e.g., a 5 000 bushel corn contract may require an initial margin of USD 750/contract). The exact percentage is determined by the commodity broker. The maintenance margin is used to step up the initial margin account. For instance, suppose the maintenance margin on the corn contract is USD500/contract. Therefore, whenever the initial margin account drops to USD500 because of “paper” losses in the futures market the account must be added to so that the balance in the account returns to the brokerage set minimums. There is no maximum number of times a margin call can occur (Parcell and Pierce, 2013).
5.2. 11.5.2. OptionsThe options market is sometimes referred to as insurance. Why? Because by hedging through the options market an individual locks in the costs of hedging and then can lose at most only the cost of the option premium while having unlimited profit potential. Alternatively, holding a futures position limits profits and losses by the hedged price.
For the options market, the trading activities are carried out through the exchange of paper promissory notes to sell or buy a commodity at an agreed upon price at a later date. This promissory note gives the individual the right to either buy or sell at a later date and not the obligation to buy or sell as with futures hedging. As new information enters the market (exchange), people perceptions change and the process of arbitraging begins again. Options change in value due to the perception of traders of where the market will go in the future.
Before proceeding, a few careful notes are needed as to the terminology used with the options market. A put option gives the individual the right but not the obligation to sell a futures contract at a later date. A call option gives the individual the right but not the obligation to buy a futures contract at a later date. The price at which the futures market can be entered at a later date is referred to as the strike price. The premium paid is in relation to the strike price. The strike price is a predetermined range of values that is different for each commodity. A put (call) option is said to be in the money if the strike price is above (below) the underlying futures price. A put (call) option is said to be at the money if the strike price is equal to (equal to) the underlying futures price. A put (call) option is said to out of the money if the strike price is below (above) the underlying futures price. At any given time, the range of strike prices quoted will cover values in the money, at the money, and out of the money. Thus, a hedger or speculator has the option of purchasing an option at any of these three levels. Typically, options in the money will have the highest premium, followed by options at the money, and options out of the money will have the lowest premiums (Parcell and Pierce, 2013).
There are two components which make up the value of the option, intrinsic and time value. Both of these values are implicit values not observed, but theoretically present. Intrinsic value is the value of the option relative to the underlying futures price. That is USD76/cwt. Put option for feeder cattle has an intrinsic value of USD2.50/cwt. if the underlying futures is priced at USD73.50/cwt. This is due to the fact that the Put option could be exercised (sell a futures contract at USD76/cwt. and buy back at USD73.50/cwt). Typically, the change in intrinsic value of the option is determined by the change in futures price. However, the change in option price is typically not as large for out of the and at the money options. Additionally, there is a time component to the value of an option. The time value reflects the time between the options premiums quote and contract expiration. Typically, the larger the time period the greater the implicit time value of the option. That is, the greater number of days until contract expiration, the higher the probability of the futures market changing in value enough to improve the intrinsic value of the option (Parcell and Pierce, 2013).
Here is an example. Bill believes the domestic fall production of corn has been under estimated in mid-summer, and Tom believes the domestic fall production of corn has been over estimated in mid-summer. Using the commodity exchange as a market place, since Bill believes corn prices are destined to go lower, Bill purchases the right to sell a futures contract (Put) at a predetermined price at a later date, and Tom purchases the right to buy a futures contract (Call) at a predetermined price at a later date because he believes the price is going to go higher. Unlike the case of the futures, Bill and Tom will not off-set each other’s position. In the options market there are writers of options. These people are like an insurance agency. A writer of an option is willing to take a set premium per unit of commodity in exchange for the risk that the commodity price may move against them.
Suppose Bill purchases the right to sell (put option) a future contract for corn at a later date at a strike price of USD2.60/bushel for a premium of USD0.15/bushel and the futures price is at USD2.70/bushel that day, then Bill would initially pay the commodity broker USD 750 (5 000 bushels multiplied times USD0.15) plus commissions. The USD750 would go to the writer of the option. Anyone can write options. Why would anyone write an option? Because if the price does not decline or the price rises the premium would decline over time and the option writer would profit USD750. However, the futures market price could have decreased to
Created by XMLmind XSL-FO Converter.
11. PRICE VOLATILITY IN FOOD AND AGRICULTURAL
MARKETSUSD2.40/bushel and the premium increased to USD0.35/bushel. Note, generally there is not a one-to-one relationship between a change in the futures market price and option premiums due to less risk in the options market. Thus, Bill could now either sell the option for USD0.35/bushel and profit USD0.20/bushel (USD1 000) or exercise the option. Exercising an option should only be done if there is concern as to the liquidity in filling an order to sell the option. More detail on the exercise of an option can found in the options examples of this guide series (Parcell and Pierce, 2013).
5.3. 11.5.3. Future contract specifications for selected agricultural commoditiesThere are two primary regulatory bodies overseeing futures/options trading. These entities are the Commodity Futures Trading Commission (CFTC) and National Futures Association (NFA). Each agricultural commodity contract has specifications unique to that commodity. For instance, Chicago Mercantile Exchange feeder and live cattle futures/options contracts have weight specifications of 50 000 lbs. and 40 000 lbs., respectively. These weights approximate the weight of a semi load of feeder and live cattle. Additionally, each commodity contract price quote is expressed differently, and changes in the price quote differ by commodity. The contract specification information listed below is intended to help producers and agribusinesses better understand futures/options contract specifications.
Various commodities are traded at more than one commodity exchange. For example, corn is traded at the Chicago Board of Trade and Mid-America Commodity Exchange. The difference in these contracts is that the Chicago Board of Trade contract is for 5,000 bushels of corn per contract and the Mid-America Commodity Exchange contract is for 1,000 bushels. You should be aware of the difference in trading volume between these markets. Lack of adequate trading volume can cause difficulty when entering or exiting the market; however, mini-contracts can be useful to those lacking finances or the production quantity necessary to purchase or sell a full contract.
Column heading definitions are offered here. The Futures column heading represents the commodity being traded. The Exchange column heading represents the commodity exchange where the listed commodity is traded. Contract Size refers to the size of the contract being traded. Trading Hours refers to the hours of trading of that specific commodity at the given commodity exchange. Minimum Fluctuation refers to the change in overall value of the contract from a unit movement in the price quoted (for instance, if the CBOT corn price increase by 1/4 cent, the contract increases in value by USD12.50). Daily Limit refers to the maximum allowable change in price allowed for the specific commodity on a given day (note, the daily limit may be waived during the expiration month).
11.1. táblázat - Table 1: Future contract specifications
Futures Exchange Contract Size Trading Hours
Minimum Fluctuation
Daily Limit
Food and Fiber
Butter CME 40,000 lbs. 8:00-13:10 2.5¢/cwt.=$10.00
2.5¢/lb.=$1,000*
Chedder Chs. CME 40,000 lbs. 8:00-13:10 2.5¢/cwt.=$10.00
2.5¢/lb.=$1,000*
Cotton CTN 50,000 lbs. 10:30-14:40 0.1¢/lb.=$50.00
3¢/lb.=$1,500*
BFP Milk CME 200,000 lbs. 8:00-13:10 0.1¢/lb.=$200.00
1.5¢/lb.=$3000*
Anhydrous, Grains, and Oilseeds
Created by XMLmind XSL-FO Converter.
11. PRICE VOLATILITY IN FOOD AND AGRICULTURAL
MARKETS
Anhydrous Ammonia CBT 100 tons 9:05-12:20 10¢/ton=$10.00
$10/ton= $1,000*
Corn CBT 5,000 bu. 9:30-13:15 1/4¢/bu.= $12.50
12¢/bu. = $600*
Corn MACE 1,000 bu. 9:30-13:45 1/8¢/bu.= $1.25
10¢/bu..= $100*
Oats CBT 5,000 bu. 9:30-13:15 1/4¢/bu.= $12.50
10¢/bu.= $500*
Oats MACE 1,000 bu. 9:30-13:45 1/8¢/bu.= $1.25
10¢/bu.=$100*
Rice Rough CBT 2,000 cwt. 9:15-13:30 .5¢/cwt.=$10.00
30¢/bu.= $600*
Soybeans CBT 5,000 bu. 9:30-13:15 1/4¢/bu.=$12.50
30¢/bu.= $1500*
Soybeans MACE 1,000 bu. 9:30-13:45 1/8¢/bu.= $1.25
30¢/bu.= $300*
Soybean Meal CBT 10 tons 9:30-13:15 10¢/ton = $1.00
$10/ton = $1,00*
Soybean Meal MACE 50 tons 9:30-13:45 10¢/ton = $5.00
$10/ton = $500*
Soybean Oil CBT 60,000 lbs 9:30-13:15 0.01¢/lb.= $6.00
1¢/lb.= $600*
Soybean Oil MACE 30,000 lbs. 9:30-13:45 0.01¢/lb.= $3.00
1¢/lb.= $300*
Wheat CBT 5,000 bu. 9:30-13:15 1/4¢/bu.= $12.50
20¢/bu.= $1000*
Wheat KCBT 5,000 bu. 9:30-13:15 1/4¢/bu.= $12.50
25¢/bu.=$1,250*
Wheat MACE 1,000 bu. 9:30-13:45 1/8¢/bu.= $1.25
20¢/bu.= $200*
Livestock
Feeder Cattle CME 50,000 lbs. 9:05-13:00 2.5¢/cwt.=$12.50
1.5¢/lb.=$750
Live Cattle CME 40,000 lbs. 9:05-13:00 2.5¢/cwt.=$10.00
1.5¢/lb.=$600
Cattle MACE 20,000 lbs. 9:05-13:15 0.025¢/ 1.5¢/lb.=$300
Created by XMLmind XSL-FO Converter.
11. PRICE VOLATILITY IN FOOD AND AGRICULTURAL
MARKETS
lb.=$5.00
Boneless Beef CME 20,000 lbs. 8:50-13:00 1/.1¢/lb.=$20.00
3.0¢/lb.=$600
Boneless Beef Trimmings CME 20,000 lbs. 8:50-13:00 .1¢/lb.=$20.00 3.0¢/lb.=$600
Stocker Cattle CME 25,000 lbs. 9:10-13:05 0.05¢/lb.=$12.50
2.0¢/lb.=$500
Lean Hogs CME 40,000 lbs. 9:10-13:00 2.5¢/cwt.=$10.00
2.0¢/lb.=$800
Lean Hogs MACE 20,000 lbs. 9:10-13:15 0.025¢/lb.=$5.00
1.5¢/lb.=$300
Pork Bellies CME 40,000 lbs. 9:10-13:00 2.5¢/cwt.=$10.00
3¢/lb.=$1200
Note: * denotes that trading limits may change during different periods of the contract life.
Note: Many of these commodities have options markets that are traded based on similar contract specifications.
Source: Parcell and Pierce (2013)
5.4. 11.5.4. Deliverable versus cash settled commodities and price quoteTwo classes of agricultural commodities typically referred to in trading agricultural commodities are deliverable and cash settled commodities. Deliverable commodities refer to those commodities that the short position (seller) has the right, but not the obligation, to make delivery to a pre-specified location for which the long position (buyer) has the obligation to take delivery. For instance, corn is a deliverable commodity. A seller (short) could make delivery at one of the specified delivery locations and the buyer (long) would have to take delivery of the corn at that location. Other deliverable commodities include wheat, soybeans, live cattle, and pork bellies.
Cash settled commodities are those commodities for which a cash settlement can be made at the end of the trading period. For instance, feeder cattle are a cash traded commodity. If Joe Bob held his short position until expiration, he would not have the right to make delivery. Instead, Joe Bob would cash settle his short position, much like offsetting his contract by buying. You should be aware of the settlement terms of the commodity you are trading.
Table 2 shows a typical futures price quote page for the Chicago Mercantile Exchange Feeder Cattle Futures Contract. The table is explained by moving left to right across columns. Contract represents the month and year of the feeder cattle futures contract for which price quote are given. For instance, Jan-99 refers to the futures contract due to expire in January 1999. Open represents the opening futures price for the day. High represents the high bid for the day. Low represents the low bid for the day. Last represents the most recent bid of the day. For example, at 10:30 a.m. the last value would be the most recent bid and the high and low would represent the high and low of the day up until 10:30 a.m. Volume represents the number of contracts traded up until that time of the day. Settle price represents the final bid price for the most recently concluded trading day.
Table 3 shows a typical options price quote page for the Chicago Mercantile Exchange Feeder Cattle Futures Contract. The table is explained by moving left to right across columns. The month, year, and whether the table is a Call or Put option is described at the top of each portion of the table. Strike represents the price for which the Call or Put option contract is currently traded. Open represents the opening options price for the day. For
Created by XMLmind XSL-FO Converter.
11. PRICE VOLATILITY IN FOOD AND AGRICULTURAL
MARKETSinstance, the USD1.65/cwt. open price for a 7 000 Call is the price that was bid at the beginning of the day for a USD70/cwt. Chicago Mercantile Exchange Feeder Cattle Call option. High represents the high bid for the day. Low represents the low bid for the day. Last represents the most recent bid of the day. For example, at 10:30 a.m. the last value would be the most recent bid and the high and low would represent the high and low of the day up until 10:30 a.m. Change represents the change in bid value from the previous day close. Volume represents the number of contracts traded up until that time of the day (Parcell and Pierce, 2013).
11.2. táblázat - Table 2: Chicago mercantile exchange feeder cattle futures price quotes for 10:30 am
Contract OPEN HIGH LOW LAST Volume Settle
Jan-99 67.90 68.15 66.35 67.10 630 67.73
Mar-99 68.00 68.10 66.40 67.15 204 67.70
Apr-99 68.75 68.90 67.50 68.20 88 68.50
May-99 69.55 69.80 68.30 69.00 35 69.48
Aug-99 70.60 70.75 69.70 70.20 14 70.50
Sep-99 70.15 70.35 69.50 69.70 4 70.30
Oct-99 70.50 70.55 69.50 70.15 6 70.45
Nov-99 70.80 71.55 70.50 70.80 1 71.50
11.3. táblázat - Table 3: Chicago mercantile exchange feeder cattle options price quotes for 10:30 am
STRIKE OPEN HIGH LOW LAST CHANGE VOLUME
March 1999 Call
6800 ---- ---- 2.15 2.15 -500
7000 1.65 1.65 1.3 1.3 -475 10
7200 ---- 0.95 0.8 0.85 -300 20
7300 ---- ---- ---- ---- UNCH
7400 0.75 0.75 0.5 0.5 -225 5
7600 0.4 0.4 0.4 0.4 -25 5
7800 0.25 0.25 0.2 0.2 -50 5
8000 ---- ---- ---- ---- UNCH
8200 ---- ---- ---- ---- UNCH
Created by XMLmind XSL-FO Converter.
11. PRICE VOLATILITY IN FOOD AND AGRICULTURAL
MARKETS
March 1999 Put
5800 ---- ---- ---- ---- UNCH
6000 ---- 0.7 0.55 0.7 50 5
6200 1 1.1 0.9 1.1 150 10
6400 ---- 1.6 1.3 1.6 200 10
6600 2.1 2.3 1.9 2.3 200 10
6800 3.0 3.4 2.7 3.4 450 10
7000 ---- 4.25 3.8 4.25 200 5
7200 ---- ---- ---- ---- UNCH
Source: Parcell and Pierce (2013)
5.5. 11.5.5. What is commodity basis?Commodity basis provides a significant amount of information to producers and agribusinesses for making production, forward pricing, hedging, and storage decisions. Many producers believe that understanding basis patterns is the most fundamental means of evaluating marketing decisions. That is, basis tends to follow historical seasonal patterns and by understanding these patterns a producer or agribusiness person can make better management decisions and reduce risks involved in those decisions.
Commodity basis is the difference between a local cash price and the relevant futures contract price for a specific time period. For a specific commodity basis is defined as:
Basis = Cash Price - Futures Price,
where cash price is the cash price for a specific commodity at a given location and futures price is the relevant futures price for that commodity. An example illustrates:
Assume Clover B. Cattle raises corn and feeder cattle in Fayette, Missouri. On November 4 the local elevator is buying corn for USD2.83/bushel and the local livestock auction is selling 7-8 cwt. feeder cattle for USD72.36/cwt. On this same day, the closing price of the December corn futures price at the Chicago Board of Trade is USD2.96/bushel and the closing price of the November feeder cattle futures price at the Chicago Mercantile Exchange is USD70.98/cwt. Now, if Clover B. Cattle wants to know her basis, she would simply take the cash price and subtract the futures price for each commodity (Parcell and Pierce, 2013).
Corn Feeder Cattle
Local Cash Price $2.83 $72.36
Less Futures Market Price $2.96 $70.98
---------------- ------- -------
Basis -$0.13 $1.38
A negative value represents a cash price “under” the futures price and a positive value represents a cash price “over” the futures price. A basis that becomes more positive or less negative over time is said to narrow or
Created by XMLmind XSL-FO Converter.
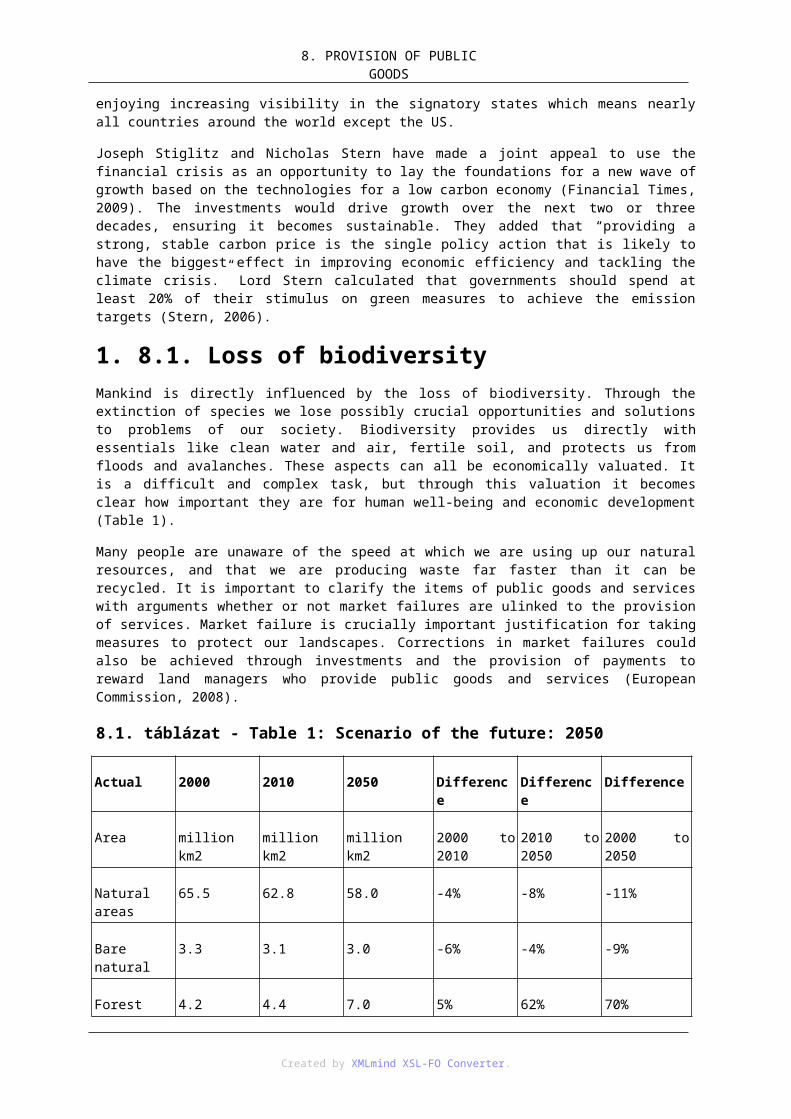
11. PRICE VOLATILITY IN FOOD AND AGRICULTURAL
MARKETSstrengthen. A basis that become less positive or more negative over time is said to widen or weaken.
Basis describes two separate relationships for grain and livestock. Therefore, these enterprises are separated in the discussion below. For grain, basis is typically used as an indication of current local demand. Weak basis indicates that the market doesn’t want grain now, but the market may or may not want it later. Strong basis indicates the market wants the grain. Basis is best used in deciding how to sell. For instance, assume you are a corn producer who believes the corn price is high and basis is strong relative to historical patterns. What should you do? Sell in the cash market as there is little opportunity to better the current market price through storage and/or taking a futures position. For livestock, basis refers to the difference between supply and demand in a local location and supply and demand for the aggregate market. Like grains, basis contracts can be formulated for livestock. Thus, understanding the basis can help farmers and agribusiness personnel in evaluating forward contracting and hedging decisions (Parcell and Pierce, 2013).
Basis is a crucial factor in hedging using the futures. Table 4 is used to describe a gain or loss to either a short or long hedger when basis strengthens or weakens. For the long hedger, the hedger prefers for the basis to weaken. That is, the hedger pays less in the cash market relative to the futures market and may gain more from their position in the futures market. For the short hedger, the hedger gains from a strengthening basis. That is, the hedger realizes a cash price increase relative to the futures price and may gain more from their position taken in the futures market.
11.4. táblázat - Table 4: How a grain producer should use basis in marketing strategies
High Price Low Price
Strong Basis Sell Cash Sell CashRe-own with futures or options (if expect a higher price)Long futures or buy call
Weak basis Hedge with futuresShort futures or buy putDelay Cash Sale
Store
Source: Parcell and Pierce (2013)
5.6. 11.5.6. Speculation on the futures marketEven though the evidence on the impacts of increased speculative activities on prices is inconclusive, the risks of the formation of price bubbles and the exclusion of commercial actors, because of higher costs of participation in a deregulated commodity futures market, are well documented. This implies that tighter regulation is warranted, at least as a precautionary measure. Increasing transparency, by requiring exchange trading and clearing of most agricultural commodity contracts, and setting lower limits for non-commercial actors could be the first set of measures taken by the countries that house major commodity exchanges. Action regarding transparency in futures markets and tighter regulation of speculation is necessary (Sanders and Irwin, 2010).
6. 11.6. Demand for food products in the futureIt appears increasingly clear that the unlimited demand of rich consumers for food products generates negative pecuniary externalities for the poorest consumers. Demand tends to be presented as an exogenous variable (like the weather) that cannot be negotiated. This is not true. Indeed, we know that the consumption levels of the world‘s richest countries cannot be extended to everyone in a world that looks set to grow to include 9 billion people by 2050. Demand is significantly affected by public policy choices and can be reduced. The significant expansion in the production of animal products also raises questions as a number of associated costs are not internalized in prices, and because industrial meat production places significant demands on cereal stocks and freshwater reserves. Moreover, the livestock industry makes a significant contribution to greenhouse gas emissions.
By generating a new demand for food commodities that can outbid poor countries and food-insecure populations, industrial biofuels highlight the tension between a potentially unlimited demand (in this case for
Created by XMLmind XSL-FO Converter.
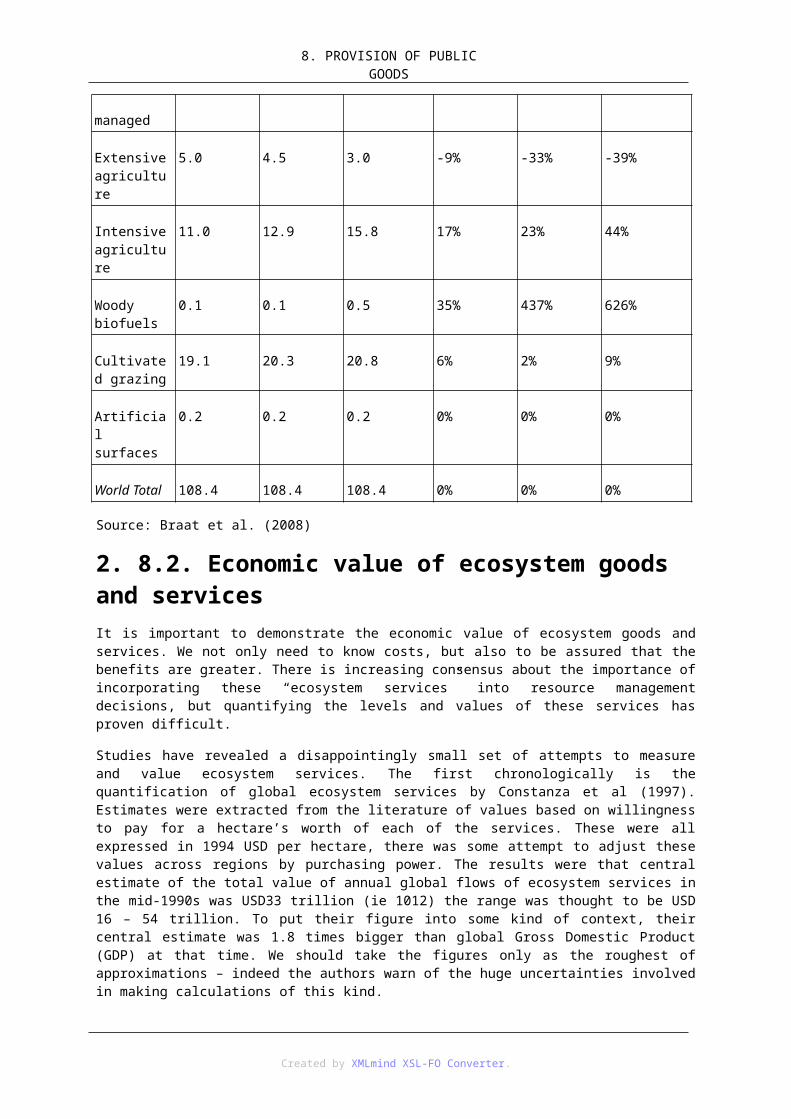
11. PRICE VOLATILITY IN FOOD AND AGRICULTURAL
MARKETSenergy) and the constraints of a world with finite resources. Several proposals ulinked to changes in existing mandates could reduce the likelihood of biofuel production contributing to price spikes. Given the major roles played by biofuels in diverting food to energy use, governments should abolish or reduce targets on biofuels and remove subsidies and tariffs on biofuel production and processing. Governments should explore incentives for the reduction of waste in the food system including addressing post harvest losses.
6.1. 11.6.1. Investing in agricultureFarmers and prospective farmers will invest in agriculture only if their investments are profitable. Private sector investment also needs to be encouraged at all stages in the value chain – upstream of the farm, in seed and fertilizer production and distribution, and downstream in processing, marketing and distribution. Underlying competition problems that have led to the development of cartels or of monopsonistic/monopolistic market structure should also be tackled (FAO, 2009).
Increasing public investment in transport and productive infrastructure, as well as in human capital, is central in stimulating productivity and reducing post-harvest wastage. Improving infrastructure, in particular rural roads and market facilities such as warehouses, storage facilities and market-information systems are important in reducing transport costs and integrating smallholders to markets. Investing in, and improving irrigation facilities, and market institutions and mechanisms will result in increased quantities of food produced, better quality and more stable prices. Improving extension, education and health, targeting small producers but also other value chain actors, are key elements of a sound policy approach to increase productivity and enhance food security and the well-being of farmers.
Investments in infrastructure, extension services, education, as well as in research and development, can increase food supply in developing countries and improve the functioning of local agricultural markets, resulting in less volatile prices. In this way, markets can work for the poor people who bear the burden of food price volatility. Most of the investment, both in primary agriculture and downstream sectors, will have to come from private sources, primarily farmers themselves purchasing implements and machinery, improving soil fertility, etc.
However, investing in agriculture with a long-term view is necessary to prevent a repetition of the food crisis. It is also necessary to guarantee a transition from food and agricultural systems that deplete natural resources to sustainable food and agricultural systems that reduce the use of fossil energy and pollution. Preservation of agrobiodiversity and the creation of new varieties should be promoted by international and national agronomic research centres, as should research aimed at maximizing biomass on diversified agricultural production systems. Agro-ecology offers an important and complementary base of experience and perspectives for such a transition that is particularly suited for producers with limited access to chemical inputs.
6.2. 11.6.2. Food wasteWaste has been identified as an important issue which affects the underlying supply-demand balance for food. In developing countries, post-harvest and post production losses due to inadequate infrastructure, poor storage facilities, inadequate technical capacity and under-developed markets are the main causes of waste. In developed countries and increasingly in emerging economies waste occurs in the distribution system, in the restaurant sector and at home, including parts of food products which are not economical to use; food that does not meet cosmetic standards, plate waste; food that is discarded because it spoiled, and inefficient use of food , contributing to obesity.
Most losses are avoidable to some degree and some types of waste could be almost entirely eliminated. Reducing waste could be an important part of a strategy to improve food security while reducing environmental and resource pressures. If food waste can be reduced, the increase in production estimated to be needed to meet the increase in demand over the next 40 years would be smaller. Reducing waste would also help to reduce the pressure on land, water stress, soil degradation, and greenhouse gas emissions.
In developing countries the improvement of the overall resilience and productivity of agriculture should address much of the problem of waste from post-harvest losses. In developed countries, possible avenues for policy action could include engaging with the private sector, to increase awareness and develop voluntary agreements, reviewing regulations that may inadvertently generate avoidable waste, supporting research to improve storage, prolong shelf life and better detect deterioration, implementing public education campaigns, and investment in better assessment and monitoring.
Created by XMLmind XSL-FO Converter.
11. PRICE VOLATILITY IN FOOD AND AGRICULTURAL
MARKETS
6.3. 11.6.3. BiofuelsAt the international level, crop prices are increasingly related to oil prices in a discrete manner determined by the level of biofuel production costs. Increases in the price of oil enhance ethanol’s competitiveness relative to petrol and strengthen its demand. Since both energy and food/feed utilise the same input, for example grain or sugarcane, increases in the production of ethanol reduce the supply of food and result in increases in its price. This relationship between the prices of oil, biofuels and crops arises due to the fact that, in the short run, the supply of crops cannot be expanded to meet the demand by both food and energy consumers.
If oil prices are high and a crop’s value in the energy market exceeds that in the food market, crops will be diverted to the production of biofuels which will increase the price of food (up to the limit determined by the capacity of conventional cars to use biofuels – in the absence of flex fuel cars and a suitable distribution network). Changes in the price of oil can be abrupt and may cause increased food price volatility. Support to the biofuel industry also plays a role. Subsidies to first-generation biofuel production lower biofuel production costs and, therefore, increase the dependence of crop prices on the price of oil.
6.4. 11.6.4. GHG-emissionThe agricultural sector is very green-house-gas (GHG) intensive: it accounts for about 13-33% of global GHG-emissions, but only for about 4% of global output. Agriculture will therefore be called upon to contribute significantly to mitigation. At the same time, agriculture will be affected in ways that are not fully understood or fully predictable, but there is little doubt that some regions, principally arid and semi-arid zones, will come under increasing pressure.
Climate change will lead to more frequent extreme events such as droughts, heat waves and floods. These incidents will affect not just production and the volatility of production, they may also create new difficulties related to water quality, storage and related food safety issues. Complex demands for mitigation and adaption will therefore be made on the sector during a period when significantly increased production is needed in response to projected needs. There is need to improve agricultural technologies specific for, and well targeted to small-scale agriculture and for appropriate production policies and practices aimed at increasing smallholder productivity in a sustainable manner.
6.5. 11.6.5. Promoting food security strategy programmesFood security is a complex and multidimensional issue and a national responsibility. Therefore countries need a national comprehensive food security strategy in line with the specificities and special characteristics of each country. Such strategies should include policies to reduce, manage and cope with price volatility. These strategies should be developed and managed in an inclusive manner with civil society, Farmers‘ Organisations and in partnership with the private sector.
A key element in any long term solution is investment in increasing the productivity and resilience of developing country agriculture. This can contribute to improving food security in two ways. It can reduce food price volatility, for example through increased productivity and improved technical management of production and of risk, and it can help farmers and households to cope better with the effects of volatility, once it occurs.
7. Questions1. Impact of the financial crisis on the food chain?
2. Drivers of food price volatility?
3. Food expenditure shares in terms of per capita income?
4. What are the territorial supply constraints?
5. Hedging agricultural commodity with futures and options?
6. Demand for food products in the future?
Created by XMLmind XSL-FO Converter.

11. PRICE VOLATILITY IN FOOD AND AGRICULTURAL
MARKETS
8. ReferencesFAO (2009): Investment. High level expert forum on how to feed the world, 12-13 October 2009, Rome.
FAO, IFAD, IMF, OECD, UNCTAD, WFP, the World Bank, the WTO, IFPRI and the UN HLTF (2011): Price volatility in food and agricultural markets: policy responses. Rome, FAO.
Headey, D. and Fan, S. (2010): Global food crisis: How did it happen? How has it hurt? And how can we prevent the next one? Washington, IFPRI: 122.
Headey, D. (2011a): Rethinking the global food crisis: The role of trade shocks. Food Policy 36: 136-146.
Headey, D. (2011b). Was the global food crisis really a crisis? IFPRI, Washington: 66.
HLPE (2011): Price volatility and food security. A report by the High Level Panel of Experts on Food Security and Nutrition of the Committee on World Food Security, Rome 2011. http://www.fao.org/fileadmin/user_upload/hlpe/hlpe_documents/HLPE-price-volatility-and-food-security-report-July-2011.pdf
OECD (2008): Biofuel support policies – an economic assessment, OECD, Paris.
Prakash, A. (2011): Why volatility matters, in Prakash. A. (ed.) Safeguarding food security in volatile markets, FAO, Rome
Prakash, A. and Stigler, M. (2011): The economics of information and behaviour in explaining excess volatility, in A. Prakash (ed.), Safeguarding food security in volatile markets, FAO, Rome.
Sanders, D.R. and Irwin, S. (2010): A speculative bubble in commodity futures prices? Cross sectional evidence, Agricultural Economics, Vol. 41, pp. 25-32.
World Bank (2011): Commodity prices (Pink Sheet), http://go.worldbank.org/4ROCCIEQ50l
Parcell, J. and Pierce, V. (2013): An introduction to hedging agricultural commodities with futures. http://agebb.missouri.edu/mgt/risk/introfut.htm
Created by XMLmind XSL-FO Converter.
12. fejezet - 12. Plant biotechnologyIntroduction
”Biotechnology” is the short form of Biological technology, often further shortened as “biotech” or even as ”BT”, which is neither a new concept nor a new application. Ancient fermented food processes, such as making bread, wine, cheese, curds, idli, dosa, etc., some of which are over 6,000 years old and developed long before man had any knowledge of the existence of the micro-organisms involved, also genuinely constitute biotechnology. Conventional agriculture (animal husbandry included) is a well-developed biotechnological industry in its own right. However, for the sake of convenience, the traditional processes are excluded from the realm of “modern biotechnology”. In simpler words, biotechnology is the industry-scale use of organisms and/or their products.
The term covers the scientific, technological and commercial aspects as well as the services rendered through them, touching almost every aspect of human wellbeing, from agriculture to therapeutics to pollution control. The hope, the hype and the vehement opposition modern biotechnology has generated in a short time are immense and unprecedented. Both the technical and non-technical literature on biotechnology is vast and diverse, often frustrating even the biologists. The students and teachers of biological sciences are also at a serious disadvantage in accessing and understanding the full measure of the implications and complications of the new technology. The diverse and often conflicting views that appear in the media leave the general public in a state of confusion. There is a clear need to disseminate factual science based information that facilitates informed decisions on the acceptance or rejection of the products and services biotechnology endlessly offers.
1. 12.1. HistoryFor thousands of years, farmers have been using breeding techniques to “genetically modify” crops to improve quality and yield. Modern biotechnology allows plants breeders to select genes that produce beneficial traits and move them from one organism to another. Plant biotechnology is far more precise and selective than crossbreeding in producing desired agronomic traits. Plant biotechnology has been adopted by farmers worldwide at rates never before seen by any other advances in the history of agriculture. In 2011, biotech crops were grown by 16.7 million farmers on 160 million hectares in 29 countries. The reason for such impressive adoption rates is simple – plant biotechnology delivers significant and tangible benefits, all the way from the farm to the fork. Plant biotechnology has enabled improved farming techniques and crop production around the world by increasing plants' resistance to diseases and pests; reducing pesticide applications; and maintaining and improving crop yields.
For centuries, humankind has made improvements to crop plants through selective breeding and hybridization – the controlled pollination of plants. Plant biotechnology is an extension of this traditional plant breeding with one very important difference – plant biotechnology allows for the transfer of a greater variety of genetic information in a more precise, controlled manner. Unlike traditional plant breeding, which involves the crossing of hundreds or thousands of genes, plant biotechnology allows for the transfer of only one or a few desirable genes. This more precise science allows plant breeders to develop crops with specific beneficial traits and without undesirable traits. Many of these beneficial traits in new plant varieties fight plant pests – insects, disease and weeds – that can be devastating to crops. Others provide quality improvements, such as tastier fruits and vegetables; processing advantages, such as tomatoes with higher solids content; and nutrition enhancements, such as oil seeds that produce oils with lower saturated fat content. Crop improvements like these can help provide an abundant, healthful food supply and protect our environment for future generations.
Tens of thousands of years ago people wandered the earth, collecting and eating only what they found growing in nature. By about 8000 BC, however, the first farmers decided to stay in one place and grow certain plants as crops – creating agriculture and civilization, in that order.
1.1. 12.1.1. Thousands of years agoPeople first learn to use bacteria to make new and different foods, and to employ yeast and fermentation processes to make wine, beer and leavened bread.
1700s
Created by XMLmind XSL-FO Converter.
12. Plant biotechnology
Naturalists begin to identify many kinds of hybrid plants – the offspring of breeding between two varieties of plants.
1840s
Gregor Mendel begins a meticulous study of specific characteristics he found in various plants which were passed to future plant generations.
1861
Louis Pasteur defines the role of micro-organisms and establishes the science of microbiology.
1900
European botanists use Mendel’s Law to improve plant species. This is the beginning of classic selection.
1950
First regeneration of entire plants from an in vitro culture.
1953
Enter James Watson and Francis Crick. These two future Nobel Prize winners discovered the double helix structure of deoxyribonucleic acid, commonly known as DNA. Proteins are made up of strings of amino acids. The number, order and kind of amino acids determine the property of that protein. DNA holds the information necessary to order the amino acids correctly. The DNA transmits this hereditary information from one generation to the next. But it wasn't until three decades later that even larger strides occurred in the field.
1973
Researchers develop the ability to isolate genes. Specific genes code for specific proteins.
1980s
Scientists discover how to transfer pieces of genetic information from one organism to another, allowing the expression of desirable traits in the recipient organism. This is called genetic engineering, one process used in biotechnology. Using the technique of “gene splicing” or “recombinant DNA technology” (rDNA), scientists can add new genetic information to create a new protein which creates new traits – such as resistance to disease and pests.
1982
The first commercial application of this technology is used to develop human insulin for diabetes treatment.
1983
The first transgenic plant: a tobacco plant resistant to an antibiotic.
1985
Genetically engineered plants resistant to insects, viruses, and bacteria are field tested for the first time.
1990
Publication of the European Directives on the use and voluntary dissemination of genetically modified organisms in the environment.
1994
First authorisation by the EU to market a transgenic plant: a tobacco plant resistant to bromoxynil.
1995 – 1996
Created by XMLmind XSL-FO Converter.
12. Plant biotechnology
The European Union approves the importation and use of Monsanto’s Roundup Ready soya beans in foods for people and feed for animals. These are beans genetically modified to tolerate spraying of Roundup for weed control while the beans are growing.
1996
Posilac bovine somatotropin, designed to increase milk efficiency in dairy cattle, is approved for use in the United States.
1997
Roundup Ready cotton first commercialized in the US.
1998
DEKALB markets the first Roundup Ready corn. YieldGard Corn is approved for import into European Union.
1999
President Clinton awards four Monsanto scientists National Medal o Technology.
2000
Scientists achieve major breakthrough in rice; data to be shared with worldwide research community.
2. 12.2. How biotechnology works?Many people are beginning to appreciate more deeply the bonds between human well-being, social stability and the natural processes of earth that sustain all life. They are realising that the earth's capacity to continue providing clean air and water, productive soils and a rich diversity of plant and animal life is central to ensuring quality of life for ourselves and our descendants. But current population growth is already straining the earth's resources. One of the few certainties of the future is that the world’s population will grow reach 9 billion inhabitants by the year 2050. Humanity must respond to the growing pressures on the earth’s natural resources to feed more people.
Biotechnology, which allows the transfer of a gene for a specific trait from one plant variety or species to another, is one important piece of the puzzle of sustainable development. Experts assert that biotechnology innovations will triple crop yields without requiring any additional farmland, saving valuable rain forests and animal habitats. Other innovations can reduce or eliminate reliance on pesticides and herbicides that may contribute to environmental degradation. Still others will preserve precious groundsoils and water resources. Most experts agree that the world doesn’t have the luxury of waiting to act. By working now to put in place the technology and the infrastructure required to meet future food needs, we can feed the world for centuries to come and improve the quality of life for people worldwide.
The current debate in Europe and the United States over genetically modified crops mostly ignores the concerns and needs of the developing world. Western consumers who do not face food shortages or nutritional deficiencies or work in fields are more likely to focus on food safety and the potential loss of biodiversity, while farming communities in developing countries are more likely to focus on potentially higher yields and greater nutritional value, and on the reduced need to spray pesticides that can damage soil and sicken farmers.
3. 12.3. Why biotechnology matters?The benefits of biotechnology, today and in the future, are nearly limitless. Plant biotechnology offers the potential to produce crops that not only taste better but are also healthier. Agronomic or “input” traits create value by giving plants the ability to do things that increase production or reduce the need for other inputs such as chemical pesticides or fertilisers. Current products with input traits include potatoes, corn and soybeans that produce better yields with fewer costly inputs through better control of pests and weeds. Already, farmers in Romania are growing potatoes that use 40% less chemical insecticides than would be possible using traditional techniques.
Quality traits – or “output” traits – help create value for consumers by enhancing the quality of the food and
Created by XMLmind XSL-FO Converter.
12. Plant biotechnology
fibre produced by the plant. Likely future offerings include potatoes that will absorb less oil when fried, corn and soybeans with increased protein content, tomatoes with a fresher flavour and corn and sweet potatoes that contain high levels of amino acids, such as lysine. Someday, seeds will become the ultimate energy-efficient, environmentally friendly production facilities that can manufacture products which are today made from non-renewable resources. An oilseed rape plant, for example, could serve as a factory to add beta carotene to canola oil to alleviate the nutritional deficiency that causes night blindness. The worldwide area under commercially grown genetically modified (GM) crops has been rapidly increasing since they were first introduced in 1996. An environmentally sustainable and more specific method of controlling insect pests than conventional insecticides (Figure 1). The use of Bt. technology reduces and in some instances can even avoid the need for insecticides.
12.1. ábra - Figure 1: Bt Cotton lifecycle
4. 12.4. Why do we need biotechnology?Demand for food is increasing dramatically as the world’s population grows. Biotechnology provides us with a way of meeting this growing demand without placing even greater pressure on our scarce resources. It allows us to grow better quality crops with higher yields while at the same time sustaining and protecting the environment. It can also help to improve the nutritional value of the crops which are grown.
5. 12.5. What is genetic modification?Genetic modification is an accurate and effective way of achieving more desirable characteristics in plants without the trial and error of traditional methods of selective breeding. For centuries farmers and gardeners have attempted to alter and improve the plants they grow. In the past this was done by crossbreeding one plant or flower with another in the hope of producing a plant with particular qualities such as a larger flower or a sweeter fruit. The processes used in the past attempted to bring about changes in plants by combining all the characteristics of one plant with those of another. But as our understanding of plant life has grown, scientists have found ways of speeding up this process and making it more precise and reliable. It is now possible to identify exactly which genes are responsible for which traits. Using this information, scientists can make small and specific changes to a plant without affecting it in other ways. An example of this is a potato which has been genetically modified to give it a built-in resistance to the Colorado beetle, which can destroy potato crops, thus reducing the need for chemical pesticides.
6. 12.6. What sort of changes can be brought about by genetic modification?Plants can be modified to bring about many types of changes which can be of benefit to the consumers, the food industry, farmers and people in the developing world. Genetic modification can also contribute towards a more sustainable form of agriculture and bring environmental benefits. Fruit and vegetables can be modified to improve their taste and appearance. This means being able to provide consumers with the consistently high quality fresh produce they demand. Improvements can be made to the nutritional qualities of certain plants. For example, oil seed, from which some cooking oils are made, can be developed so that the oil has reduced saturated fat content.
Products can be modified in ways which will make it easier and cheaper to process them. For example, the modification of tomatoes to delay ripening has led to cheaper tomato puree.
Created by XMLmind XSL-FO Converter.
12. Plant biotechnology
Plants can be modified to increase their ability to fight insects, disease and weeds, all of which can destroy or seriously damage crops. This not only increases the yield of these crops, but also reduces the need for pesticides. Plants can be modified to be resistant to drought or to grow in difficult conditions. This will have many benefits for parts of the world where the demand for food is increasing significantly and there is not enough good arable land.
7. 12.7. How can we assure that these new developments are safe?It is important that consumers feel confident about the food they buy. Modern biotechnology is therefore subject to strict controls. These are designed to ensure that new genetically modified products are safe to eat and that they pose no new risks to the environment. European legislation on novel foods is implemented in the UK by a strict regulatory process involving a number of different committees, each composed of independent experts. Many of these people are scientists but the committees also include individuals who are primarily concerned with ethical and consumer issues.
8. 12.8. How do we know that genetically modified crops are safe to eat?Before any GM crops can be sown, or food produced from GM crops can be sold, they must go through a rigorous approval process, involving several expert committees. In order to ensure transparency and accountability, the proceedings of all of these committees are available to the public, and they also hold public meetings.
9. 12.9. What about the impact of genetically modified crops on the environment?Genetically modified organisms may not be released into the environment without approval. Approval to grow the crops commercially will not be given until the trials have been completed and the regulators are satisfied. In Canada and the USA, genetically modified crops are now grown extensively after the regulatory authorities there concluded that there was no threat to the environment.
10. 12.10. Could the new genes in these crops to be passed on the other plants?The question of the transfer of genes from genetically modified crops to other plants is considered carefully by the regulators. They have accepted that there is no greater risk of this happening than exists with the conventional crops grown at present.
11. 12.11. What about consumer information?Labelling helps consumers decide what they buy. Decisions about the labelling of foods containing ingredients from genetically modified crops are made by the European Union, began labelling many of these foods voluntarily in November 1997. In order to help improve public understanding of modern biotechnology and genetic modification, the food industry is working to keep consumers better informed. Public information is a priority.
12. 12.13. Substantial equivalence of genetically engineered crops and products with their conventional counterpartsThe US Food and Drug Administration (FDA) routinely and stringently used the “Principle of Substantial Equivalence” (PSE) for decades to assure the public of the safety of foods and drugs marketed in the US. PSE
Created by XMLmind XSL-FO Converter.
12. Plant biotechnology
refers only to the product and not the process of its production. On account of the high standards of FDA’s regulatory oversight, most other countries generally approve drugs and pharmaceuticals on the basis of FDA’s approval. In the context of modern agricultural biotechnology, antitech activists have repeatedly made PSE an issue of serious concern. Efforts are made in every country to demonstrate that a genetically engineered (GE) variety (transgenic) and its products are “substantially equivalent” (SE) to its conventional variety (isogenic) and its products, but for the new genes (transgenes) in the transgenic variety and the consequent expected products of the transgenes. Once SE is established, the FDA requires no further regulatory review.
Labelling GE products is not mandatory in the US, but there are persistent demands for labelling in several other parts of the world. This leads to considerable confusion and controversies, more so if PSE has to be applied to all products of GE, including livestock feed, and worse if SE has to be established for different transgenic varieties of the same crop with the same transgene, as demanded by some activist groups.
In the application of PSE, the comparison should only be between the GE variety and its isogenic, which is the basic variety into which a new gene was inserted, but not any and every variety of the same crop. The certification is to the effect that the GE crop variety is substantially equivalent to its isogenic, in genotype, marked characteristics and performance, but for the transgenes and their anticipated products and characteristics. If the isogenic were safe, the transgenic would be equally safe, provided that the newly introduced transgenes do not exercise any adverse effects by themselves or through altering the expression of any other genes of the isogenic in the new status which may happen very very rarely. Such an assurance requires scientific evaluation of the crop variety and its products, which involves additional effort, time and expense that escalate consumer costs.
The US practice of agricultural biotechnology companies voluntarily submitting detailed dossiers on the safety and risk analysis of the GEOs and their products, developed by them before they are marketed should be global, although the activists look down upon data provided by the product developers themselves, even when gathered by different recognized laboratories outside the companies. When testing standards and procedures in different countries were reasonably uniform, what is considered safe in one country should also be considered so in the other countries? This will eliminate the need for repeating the same and every test in every country, saving time and expense.
At no time, transgenics can be wholly SE to their isogenics in their entire genotypes and this is not related to transgenic technology. Even to start with, members of the same population are not entirely genetically identical. In addition, mutations occur naturally and randomly, involving different genes. Lethal mutations are naturally eliminated. Mutations of the genes of the desired characteristics are eliminated in the process of selection, but those that do not affect the desired characteristics escape attention and accumulate. After a certain number of generations, a critical genetic analysis will contravene SE, although SE can be established for the genes of the desired characteristics. Such a situation would cause problems in some countries, where the regulatory authorities apply the principle of SE more in letter than in spirit, and a lot more strictly than in other countries.
The official consensus of the European Union (EU) is that, SE should only be used to inform of basic safety assessments and so GE products require further confirmatory analysis by sophisticated methods. The EU safety regulations, based on this premise, are so stringent that they raised doubts whether any GE product will at all qualify to be considered safe. The Codex Alimentarius Commission (CAC) is the international organization established in 1963, jointly by the FAO and WHO, under the Food Standards Programme to set international guidelines for food standards and safety. Comprised of 165 member countries, the CAC sees SE as a starting point in the regulatory process rather than as the end point. Notwithstanding the importance given to PSE, it has been criticized as vague, ill defined, flexible, malleable, open to interpretation, unscientific and arbitrary.
In the debate on SE it is often held that, the focus of SE has been well known nutritionally significant components, occurring in significant quantities, the studies employed routine food safety testing methods which are not sensitive enough to detect all components and are not detailed total critical analyses, that more sophisticated and deep analytical approaches may reveal chemical compounds hither to unexpected and unknown, which may make the GE products unsafe for human consumption, and in the US, SE data were generated not by independent entities but by the product developers themselves (and so suspect) and largely remained in the private domain, not easy for others to access for evaluation.
Some activists groups demand sophisticated and complex procedures to establish SE, but such procedures entail time and money escalating consumer costs and so cannot be routine methods of establishing SE. They should be used only if there was justification, perceived from standard analyses, to go for more intensive methods. There is a dire need for a uniform and harmonized international policy on SE. On account of the concerns raised, the
Created by XMLmind XSL-FO Converter.
12. Plant biotechnology
PSE should be re-examined, for re-defining its applicability to GE crop plants and their products, laying emphasis on a reasonable application of the principle, addressing only those genes and their products that are relevant to the objectives of developing a particular transgenic variety or product. At the moment, there is no evidence that SE is an issue that adversely affects the safety of GE crops or their products as food and feed.
13. Questions1. Challenges for agriculture?
2. Green Revolution: promises and constraints?
3. The role of biotechnology in food security and non-food crop (bio-chemicals) production?
4. The GM controversy in Europe?
5. Actions needed?
14. ReferencesClaire Halpin, C. (2005): Gene stacking in transgenic plants – the challenge for 21st century plant biotechnology. DOI: 10.1111/j.1467-7652.2004.00113.x, Plant Biotechnology Journal, Volume 3, Issue 2, pp. 141-155.
David Edwards, D. and Batley, J. (2010): Plant genome sequencing: applications for crop improvement. DOI: 10.1111/j.1467-7652.2009.00459.x, Plant Biotechnology Journal, Volume 8, Issue 1, pp. 2-9.
Baker, J. M., Hawkins, N. D., Ward, J. L., Lovegrove, A., Napier, J. A., Shewry, P.R. and Beale, M. H. (2006): A metabolomic study of substantial equivalence of field-grown genetically modified wheat. DOI: 10.1111/j.1467-7652.2006.00197.x, Plant Biotechnology Journal, Volume 4, Issue 4, pp. 381-392.
Schaart, J. G., Krens, F. A., Pelgrom, K. T. B., Mendes, O and Rouwendal, G. J. A. (2004): Effective production of marker-free transgenic strawberry plants using inducible site-specific recombination and a bifunctional selectable marker gene. DOI: 10.1111/j.1467-7652.2004.00067.x.Plant Biotechnology Journal, Volume 2, Issue 3, pp. 233-240.
Created by XMLmind XSL-FO Converter.
13. fejezet - 13. ECONOMICS OF GM CROP CULTIVATION1. IntroductionThe produce of GM plants and its derivatives (whether or not mixed with non-GM stocks) account for, year on year, a greater volume of international trade and constitute an increasing share of the world’s feed and food chains. The International Service for the Acquisition of Agri-biotech Applications (ISAAA) estimated that in 2011 in 29 countries worldwide representing 60% of world’s population some 17 million farmers planted commercialised GM varieties. More than half the world’s population, 60% or around 4 billion people, live in the 29 countries planting biotech crops. The global area planted to GM crop varieties amounted to 160 million hectares which represented 10-11% of global cropland.
2. 13.1. Global status of commercialised GM crops in 2011Since 1996, when the first GM soybean was harvested, biotechnology and its adaptations by the food industry have become one of the most controversial and most disputed topics. However, the adoption of GM crops is occurring at a rapid pace. The global area planted to GM crops in 1996 was approximately 1.7 million hectares. GM crop production has increased each year since then, with an estimated 160 million hectares of GM crops planted in 2011. The United States is the leading producer of GM crops accounting for 69 million hectares of the total GM crop area. Brazil is second, producing GM crops on 30 million hectares. Argentina had about 24 million, India and Canada over 10 million hectares of GMO area in 2011 (Table 1).
13.1. táblázat - Table 1: Area of GM crops by country (2011) Million hectares
Country Area GM crops
USA 69.0 Soybean, maize, cotton, canola, squash,, papaya, alfalfa, sugarbeet
Brazil 30.3 Soybean, maize, cotton
Argentina 23.7 Soybean, maize, cotton
India 10.6 Cotton
Canada 10.4 Canola, maize, soybean, sugarbeet
China 3.9 Cotton, tomato, poplar, papaya, sweet pepper
Paraguay 2.8 Soybean
South Africa 2.3 Maize, soybean, cotton
Source: James (2012)
Stacked traits occupied about 25% of the global 160 million hectares of biotech crops. Biotech crops are accepted for import for food and feed use and for release into the environment in 60 countries, including major food importing and exporting countries like the USA, Japan, Canada, Mexico, South Korea, Australia, the Philippines, New Zealand, the European Union, and Taiwan (James, 2012). However, acceptance of GM crops is very heterogeneous. Public opinion in Europe is mostly seen to be critical (whether because of a lack of
Created by XMLmind XSL-FO Converter.
13. ECONOMICS OF GM CROP CULTIVATION
perceived personal benefits, ideologically motivated judgements, emotional responses or diffuse mistrust of governments and the media), while most people in the rest of the world are rather indifferent or (if they are farmers) increasingly in favour of GM crops (Brook Lyndhurst, 2009).
Almost all of the global biotech crop area consists of soybeans, maize, cotton and canola (Figure 1). In 2011, GM soybeans accounted for the largest share (47%), followed by maize (32%), cotton (15%) and canola (5%).
13.1. ábra - Figure 1: GM crop plantings 2011 by crop
Despite the severe effects of the 2011 economic recession, record hectarages were reported for all four major biotech crops occupying 159 million hectares. For the first time, biotech soybean occupied three-quarters of the 100 million hectares of soybean globally, biotech cotton over 80% of the 30 million hectares of global cotton, biotech maize over 30% of the 159 million hectares of global maize and biotech canola more than one-quarter of the 31 million hectares of global canola (Figure 2).
13.2. ábra - Figure 2: Share of GM crops in global plantings of key crops in 2011*
Created by XMLmind XSL-FO Converter.
13. ECONOMICS OF GM CROP CULTIVATION
The percentage of exports of transgenic soybean from the USA, Argentina and Brazil is growing from year to year, in proportion to the rate of adoption of GM soybean by farmers in the soybean exporting countries. This means that the animal compound feed industry in the EU is gradually replacing conventional soybean for its GM counterpart, without any serious repercussions in the market. In the USA, the relative share of conventional soybean cultivation amounts to around 9% of the total soy plantings, while in Argentina the comparative figure is around 2% for the past four years. In Brazil there is still room for more transgenic soybean expansion, as the current share of conventional varieties in production amounts to 20% (Table 2).
13.2. táblázat - Table 2: Adoption rate of GM crops in the leading exporting countries of maize and soybean (2011)
GM crops Country Adoption rate (%)
Soybean USA 92
Argentina 98
Brazil 80
Canola Canada 95
Maize USA 90
Argentina 65
Brazil* 50-65
Notes:* In Brazil the cultivation of GM maize (MON 810, Liberty ulink) was approved in February 2008 (adoption rate in 2011: summer: 50%; winter: 65%)
Source: USDA (2012), James (2012)
Differences also exist regarding both the number of GM crops authorised in different countries and the timing of their authorisation. The major GM crops – soybeans, maize, cotton and rapeseed – are also those crops that are the most heavily traded internationally, providing vital export revenues for many countries and industries but also providing a crucial supply of cheap feed and fibres for many importing countries, including the member states of the European Union (EU). For climatic and agronomic reasons, the EU is unable to produce most of the oilseed meal and other protein-rich feedstuffs required to feed its livestock.
In fact, the EU imports about 80% of its protein needs. Protein-rich soybean meal, as well as Corn Gluten Feed (CGF) and Distillers Dried Grain with Solubles (DDGS), are needed by livestock producers in the EU to achieve a balanced diet for their animals, especially as far as protein is concerned. There is no prospect for developing large scale domestic production of protein rich plants. Even with the increased land sown to oilseeds for biofuels and stepping up production of protein crops such as field peas, field beans and sweet lupins to provide alternatives to soybean, at most they could only replace between 10-20% of EU imports of soybeans and soybean meal. Without an adequate supply of these feed ingredients, the EU’s livestock production will lose competitiveness and European livestock producers will lose market share. All EU imports of meat are produced from animals which may legally be fed with GM plants not yet authorised in the EU (EC,2007).
The supply chain of commodity crops (e.g. soya and maize) is complex. The EU livestock sector uses imported soybean, soybean meal and maize by-products as animal feed. Countries exporting these crops are growing both EU-authorised and non-EU-authorised GM crops, as well as non-GM crops. The EU decision-making regime for GM products is relatively slow in comparison with the rest of the world (asynchronous GM approvals). The supply of non-GM commodity crops is decreasing as a consequence of an increase in the volume of GM crops being grown and the potential for non-EU authorised GM varieties to enter the non-GM supply chain as adventitious presence is becoming greater. Combined with the EU’s zero tolerance for unauthorised GM products, this threatens to create a situation where traders are reluctant to import any commodity into the EU
Created by XMLmind XSL-FO Converter.
13. ECONOMICS OF GM CROP CULTIVATION
(GM or non-GM) that might have a trace level of unapproved GM material. Organic livestock farmers are legally required to use non-GM feed. Brazil has been the main source of non-GM soya, for which a variable price premium has applied over recent years. There is concern within the EU feed and food sectors that it is becoming increasingly difficult and costly to maintain a non-GM supply chain, and that it may become unsustainable at some point in the future.
The economic benefits of genetically modified (GM) crops are undeniable and with adoption only likely to increase, and the commercial pipeline suggests that product quality traits will be increasingly prominent if seed companies are going to maintain decent margins from the technology. The claim by GM critics that yield increases over conventional varieties are not there, thus undermining their economic benefits, is too simplistic. The economic gains are not necessarily in direct yield gains, they come from easier agronomy, better protection from insects and lower input costs. If you had 30% loss from insects, then you add protection, there is your gain. The economic bottom line is undeniable. The economic gains worldwide split almost equally between developed and developing countries as the latter have caught up in terms of adoption.
3. 13.2. Global maize tradeThe United States grows about 40% of the maize world production (around 800 million tonnes a year). Other major maize producing countries include China, the EU, Brazil, Mexico, India and Argentina. The United States is not only the world's top maize producer, but also the top exporter. On average, about 15% of U.S. corn is exported. The United States, Argentina and Brazil are the world’s three largest maize exporters with above 80% share of world maize trade. The U.S. share of global maize trade is around 50%, Argentina with a small domestic market is the world’s second largest maize exporter. In the last several years, Brazil has targeted the EU’s demand for non-genetically modified maize. This marketing situation is assumed to decline as Brazil continues to expand the planting of GM maize varieties (Table 3).
13.3. táblázat - Table 3: Global maize trade (Million tonnes)
2010/2011 2011/2012
Global trade 90.5 94.9
Exporters
USA 46.6 43.2
Argentina 15.0 14.0
Brazil 9.0 9.0
Ukraine 5.0 14.0
South Africa 2.5 2.5
Importers
Japan 15.7 16.1
Mexico 8.3 9.8
South Korea 8.1 8.0
Egypt 5.8 6.0
EU-27 7.4 4.0
Created by XMLmind XSL-FO Converter.
13. ECONOMICS OF GM CROP CULTIVATION
Source: USDA (2012); Toepfer International (2012)
4. 13.3. Global soybean and soymeal tradeMany countries with limited opportunity to expand oilseed production, such as China and some countries in South Asia, have invested heavily in crushing capacity in recent years. As a result, import demand for soybean and other oilseeds has grown rapidly. China’s expansion of crushing capacity changes the composition of world trade by raising global import demand for soybeans rather than for soybean meal. Argentina, Brazil and the United States account for 90% of world export of soybean and soybean meal.
The USA, Brazil and Argentina dominate soybean cultivation worldwide accounting for 80 to 85% of global production (250 million tonnes a year). Other significant producing countries are India, with an output of 7 to 8 million tonnes (3%) and the People’s Republic of China with 16 million tonnes (7%) a year. China is not at all of significance as an exporting country; it is instead by far the leading soybean importing country. Imports into China amounted to 55 million tonnes in 2011/12, or 60% of world soybean trade. While China has generally no exports, India exports 4 to 5 million tonnes of soybean meal a year mainly to the Asian region. Thus, there are no real alternatives to imports from the three large producing countries. Soybean global trade is about one third of its total production. The USA, Brazil and Argentina contribute 85-90% of total world soybean exports. Besides China and India, all the other soybean and soybean meal producing and exporting countries have for the most part switched the cultivation of soybeans to the GMO varieties (Table 4).
13.4. táblázat - Table 4: Global soybean trade (Million tonnes)
2010/2011 2011/2012
Global trade 92.0 92.8
Exporters
USA 40.9 34.7
Brazil 30.0 37.8
Argentina 9.2 8.9
Paraguay 6.0 5.0
Importers
China 52.3 55.0
EU-27 12.5 11.5
Mexico 3.5 3.5
Japan 2.9 2.9
Taiwan 2.5 2.4
Source: USDA (2012); Toepfer International (2012)
Soybean meal is the most used vegetable protein feed as an animal feed ingredient. Soybean meal is considered premium to other oilmeals due to its high protein content. The USA, Brazil, Argentina and India are the world’s major producers and exporters of soy meal. The USA is the biggest producer but Argentina is the leading exporter followed by Brazil and the USA. The United States also has a big domestic demand whereas Argentina has limited local demand. Soybean meal world production is around 160 million tonnes a year. Generally, the
Created by XMLmind XSL-FO Converter.
13. ECONOMICS OF GM CROP CULTIVATION
United States, Argentina and Brazil contribute over 50% of the world soybean meal production, while China imports soybeans from these countries in huge and increasing quantities for crushing. In recent times China has overtaken the U.S. in soybean meal production.
Soybean meal world trade is around 60 million tonnes a year, which is approximately one third of its total production. Argentina, Brazil and the USA, the world’s first, second and third largest meal exporters, account for 85 to 90% of total world soybean meal exports. Argentina exports around 98% of its soybean meal production. No real alternatives exist to imports from the three large producing and exporting countries since South East Asian countries are major markets of Indian soybean meal. India has a freight advantage over American countries for supply to Asia (Table 5). EU-27 imports 35% of the soybean meal available in world market. Though China is a biggest consumer of soybean meal it does not directly import meal but beans for crushing. EU-27 is the major destination for Argentinean and Brazilian soybean meal. The EU imports soybeans and soybean meal from the three large soybean producing countries.
13.5. táblázat - Table 5: Global soybean meal trade (Million tonnes)
2010/2011 2011/2012
Global trade 58.3 60.6
Exporters
Argentina 27.5 29.8
Brazil 14.0 14.8
USA 8.3 8.0
India 4.6 4.2
Importers
EU-27 22.0 23.0
Japan 2.2 2.2
Mexico 1.5 1.5
Canada 1.1 1.1
Source: USDA (2012); Toepfer International (2012)
The world’s largest producer of GM-free soy is still Brazil. The discrepancy between the quantities of soybean cultivated as GM-free and the quantities of GM-free certified soya is a result of the fact that products that have undergone the certification process are more costly and only if traders are certain that they can pass on the price surcharge to their customers will they subject their harvest to such a process. If there is no specific demand for GM-free soya, then it may simply be mixed with GM soy and sold as genetically modified. How much GM-free soy is actually delivered to the EU depends on local needs, i.e. on European producers of animal feed and food, on food retailers and on demand from farmers and consumers (Céleres, 2008).
5. 13.4. The authorisation process in practiceThe problem with GM is the way it has been introduced, primarily as a way of maintaining the sales of pesticide companies. In less than three decades, a handful of multinational corporations have engineered a fast and furious corporate enclosure of the first ulink in the food chain. The concentration of corporate power in commercial seed and agrochemical production is unprecedented, as is its crossover with the powerful US-based commodity
Created by XMLmind XSL-FO Converter.
13. ECONOMICS OF GM CROP CULTIVATION
trading corporations Cargill, ADM and Bunge.
Every GMO that is allowed to be placed on the market in the EU is required to be labelled if it contains more than 0.9% GMO. If it has less than 0.9% GMO, it does not have to be labelled, provided that this amount is either adventitious or technically unavoidable. In the USA, Canada, Japan and Taiwan, food with a content of up to 5% of approved GM material can be classified as “non-GM”; however, in Australia, New Zealand, South Africa, Brazil or China, all food with more than 1% approved GM material has to be labelled as “GM” (Ramessar et al., 2008).
Although the approval process for a GMO is subject to clear rules and regulations, time and again these rules and regulations are more or less overridden. This does not apply to the scientific risk assessment. Article 18, Section 1 of Regulation 1829/2003 stipulates that the EFSA (European Food Safety Authority) should attempt to give its opinion within a period of six months from receipt of a valid application. However, the EFSA does at times take an extremely long time to complete the risk assessment. There have also been cases in which delays were due to incomplete applications received from the companies. However, to a large extent it is the EU Member States who are contributing to the delays in the approval process. An example of this is the “Herculex” corn: The Commission granted the approval for “Herculex” corn (DAS 59122-7) effective October 24, 2007 two years and nine months after the application had been filed (EC, 2007). The EU GMO approval system takes more time than in other countries (average of over 30 months compared to 15 months for example in the USA.
The commercialisation of GM crops is a regulated activity, and countries have different authorisation procedures. New GM crops are not approved simultaneously. This asynchronous approval in combination with a zero-tolerance policy towards low-level presence of nationally unapproved GM material in crop imports is of growing concern for its potential economic impact on international trade. There is an obvious difference between traces of nationally unapproved GM material due to asynchronous approval and isolated foreign approval or due to the accidental presence of research events: in the former two cases the source of the traces is a GM crop that – somewhere – presumably has passed some kind of safety evaluation and has been authorised for commercial use. By contrast, traces of research events necessarily come from crops that are not authorised for commercial use anywhere (Stein and Rodríguez-Cerezo, 2010).
There can be “asynchronous approval”, i.e., at least one cultivating country has already authorised a GM crop while other (importing) countries have not. There can be “isolated foreign approval” (or “asymmetric approval”), i.e. a cultivating country has authorised a GM crop but its developer does not seek approval in (potential or unattractive) importing countries.
There can be “low-level presence” of research events, i.e., a country has authorised the cultivation of a GM crop in field trials only but, due to accidental admixture, traces end up in the commercial crop supply.
Another question is what level of nationally unapproved GM material constitutes a “low” level that, depending on the country, may be tolerated in crop shipments or not. In the United States, for instance, GM crops as such are not regulated; it is rather their use (e.g. as food or as pesticide) that may require their approval. As long as a GM crop is similar to a conventional crop, no authorisation is needed for its cultivation or use; only if the crop fulfils, for example, the function of a pesticide (as insect-resistant or herbicide-tolerant crops do) does it need to be regulated as such. Hence, if traces of a GM crop are detected that has not been submitted to the regulatory agencies, the latter determine on a case-by-case basis whether the GM crop could pose a risk and take proportionate measures (USDA, 2007). In Switzerland traces of unapproved GM material of up to 0.5% are tolerated in food if the respective GM crop is already authorised in another country where comparable procedures are followed or if a danger to human health can be excluded after an ad-hoc science-based evaluation.
Strict regulations in politically powerful or economically relevant countries may have a detrimental impact on the development of potentially welfare-enhancing crops. If developing countries even have to fear the loss of markets for economically important export crops because of possible but unavoidable traces of unrelated GM crops, these countries may become still more hesitant to adopt GM crops for domestic use that could potentially enhance productivity and farmers' welfare (Graff et al., 2009).
Low-level presence problems can be expected to intensify when more new GM crops are commercialised in the coming years in more countries. By 2015 there could be over 120 different transgenic events in commercialised GM crops worldwide – compared with over 30 GM events in commercially cultivated GM crops in 2008 (Table 6). Although the commercialisation of the crops shown may be technically possible by 2015, the practical – or rather regulatory – feasibility may be more questionable (e.g. for rice in particular), given that in some of the
Created by XMLmind XSL-FO Converter.
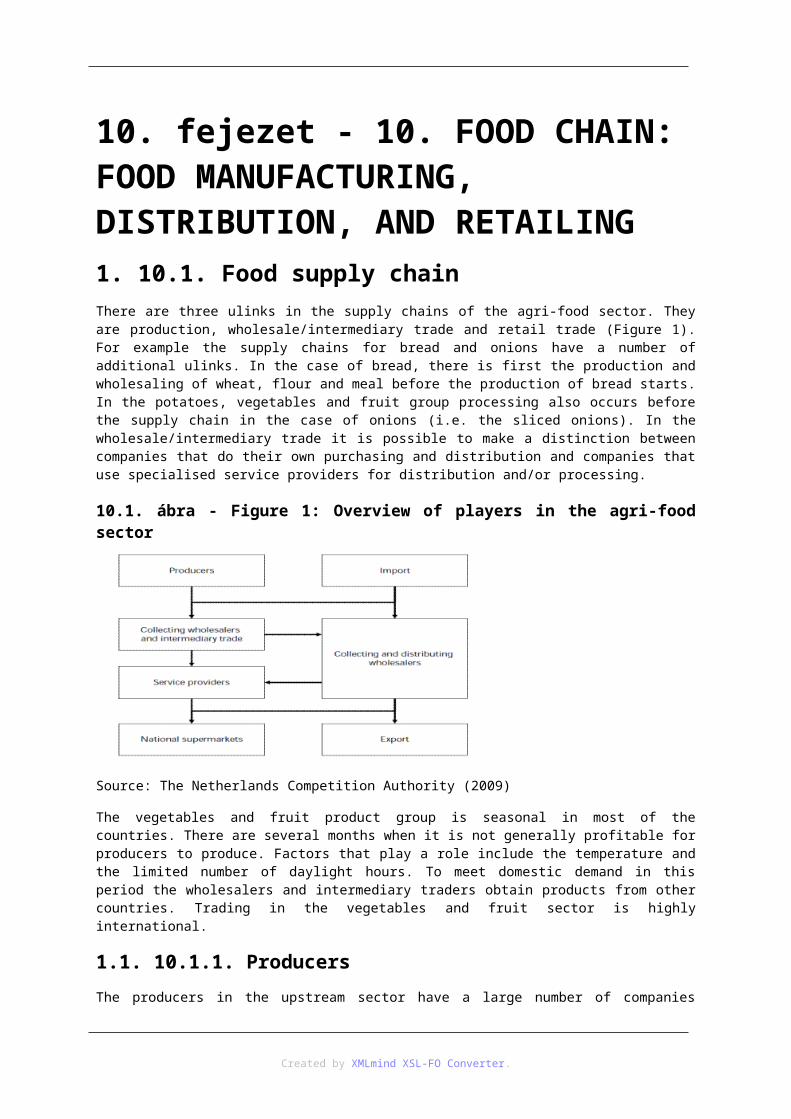
13. ECONOMICS OF GM CROP CULTIVATION
developer countries no GM (food) crops have been authorised so far (Stein and Rodríguez-Cerezo, 2010).
13.6. táblázat - Table 6: Events in commercial GM crops and in pipelines worldwide, by crop
Crop Commercial in 2008
Commercialpipeline
Regulatorypipeline
Advanceddevelopment
Total by2015*
Soybeans 1 2 4 10 17
Maize 9 3 5 7 24
Rapeseed 4 0 1 5 10
Cotton 12 1 5 9 27
Rice 0 1 4 10 15
Potatoes 0 0 3 5 8
Other crops 7 0 2 14 23
All crops 33 7 24 61 124
Notes:* The total number of GM crops by 2015 represents an upper limit, given that by then some of the current GM crops may have been phased out.
Source: Stein and Rodríguez-Cerezo (2009)
Another development with GM crops is the emergence of more players. While currently private companies from the United States or Europe develop most of the GM events and crops (which are generally first authorised and cultivated in the United States), over the next few years more GM crops will be supplied by private and public entities from Asia in particular from China and India (Table 7). In the longer term, even more developing countries may commercialise GM crops (FAO, 2009). Hence, while in the past GM crop adoption spread from North America to other parts of the world (with asynchrony of approvals following the same path), in the future the adoption pattern may change fundamentally, with more new GM crops being adopted first in Asia and then potentially spreading from there.
13.7. táblázat - Table 7: Events in commercial GM crops and in pipelines worldwide by region of origin
Developer country
Commercial in2008
Commercial pipeline
Regulatory pipeline
Advanced development
Total by 2015
United States/Europe
24 7 10 26 67
Asia 9 0 11 34 54
Latin America 0 0 2 1 3
Source: Stein and Rodríguez-Cerezo (2009)
This changing pattern, with more new GM crops coming from Asia, has consequences for the issue of low-level presence. In Asia, GM crops are usually developed for domestic consumption and not for export and therefore
Created by XMLmind XSL-FO Converter.
13. ECONOMICS OF GM CROP CULTIVATION
the respective events are less likely to be submitted for approval in the EU or the United States. Hence, incidents due to isolated foreign approval or asymmetric approval could become more common (Table 8). However, as has been seen in the recent cases where traces of GM maize in soybeans led to the rejection of the soybean shipments, under certain regulatory settings (in particular zero tolerance towards low-level presence) the cultivation of one type of crop may even affect the marketability of other types of crops. This means that if third countries want to authorise GM varieties of crops that are welfare-enhancing for their societies, in future they may also consider the potential impact of cross low-level presence in different, but export-relevant, crops. The extent to which this situation shapes the approval and development of future agbiotech innovations remains to be seen. Unfortunately, past experience with the use of GM crops shows that irrational fear of export losses represents a significant impediment to biosafety policymaking (Stein and Rodríguez-Cerezo, 2010).
13.8. táblázat - Table 8: Asynchronous and isolated foreign approvals as potential sources for low-level presence
Crop Asynchronous approvals*
Isolated foreign approvals#
Total sources for low level presence
Soybeans 2 1 3
Maize 6 5 11
Rapeseed 0 1 1
Cotton 3 9 12
Rice 1 4 5
Potatoes 0 2 2
Other crops 0 8 8
All crops 12 30 42
Notes: * Number of individual events authorized for commercial use in at least one country worldwide, and submitted but not yet authorised in the EU.
# Number of events not submitted for authorisation in the EU but already in the regulatory pipeline in at least one country worldwide.
Source: Stein and Rodríguez-Cerezo (2009)
By 2009, there were already more than 40 individual GM events that may become potential sources of low-level presence. And although some of the major exporters of agricultural commodities – like Argentina and Brazil – so far have considered trade implications when authorising new GM crops, it is by no means guaranteed that this situation will last. Other countries, like China could gain importance as importers of these commodities (of soybeans in particular), or the advantages of cultivating certain new GM crops in exporting countries could simply outweigh the potential loss of sensitive markets. Moreover, increasing biotechnology know-how in emerging economies themselves can strengthen “South-South” technology transfers, which could boost the acceptance and adoption of GM crops in cultivating countries. In this case, the number of alternative suppliers of non-GM crops decreases, thereby making it more and more difficult to simply redirect trade flows by matching exporters of GM crops with “easy” importing countries and letting the remaining exporters supply the more sensitive markets (Vaidyanathan, 2010).
In the early days there was no concept of using GM to improve product quality; this would be the way for the future, including traits that improve water use, nitrogen uptake, salt and drought tolerance, as well as better nutritional properties such as Omega-3 or fat profiles. In addition to the increasing number of new GM events, there is also the tendency to generate new products by combining different GM traits in one plant, i.e. through
Created by XMLmind XSL-FO Converter.
13. ECONOMICS OF GM CROP CULTIVATION
the stacking of already approved GM events. When individual authorised GM events are “stacked” by conventional crossing, the resulting new plant may have a different regulatory status in different countries. For instance, the EU requires each stacked GM crop to go through the regulatory system as a new GM crop, irrespective of whether the parental GM events were already authorised or not. Given the increase of individual GM events that are to come to market in the next years, eventually hundreds of combinations of these events can be quickly developed by stacking – meaning that the number of GM crops that could be submitted for approval could increase dramatically.
6. 13.5. The GM debate in EuropeThe GM debate in Europe often seems to have lost sight of the bigger picture of the challenges in food security and environmental protection and often compares forms of farming (e.g. conventional, IPM, organic) with GM, which is a tool in plant breeding, not a form of farming. The food crisis is a multifaceted problem and no single technology or approach can solve this by itself. The GM debate is too often conducted in an “either this or that technology” mode, rather than recognizing that food security in a combination of all available best approaches. Farmers will need to have as many safe tools at their disposal as possible, and will need to have the freedom to choose what fits best in their approach. The debate sometimes assumes that the food crisis is mainly an issue of (re)distribution and forgets that all approaches have their strengths and weaknesses and that every approach can be used wisely and unwisely.
The EU has one of the world’s strictest approval procedures for GM products. If, after an extensive scientific risk assessment, the European Food Safety Authority (EFSA) concludes that the product in question is as safe as a comparable non GM variety (for example, conventional soy or maize), a political decision needs to be taken whether or not to authorise the product. This decision making phase (risk management) is administered by the EU Commission and involves the Member States. The EU legislation requires the EU Commission to stick to the following timelines: upon reception of a positive EFSA opinion, the Commission has 3 months to bring about a vote at the Standing Committee. Once the Standing Committee has voted, if the Member States do not achieve a qualified majority for or against the approval (which is the usual voting result), the Commission has to submit the approval dossier to the Appeal Committee within 2 months at the very most (or, according to the old procedure, to Council without delay). In exceptional circumstances, the Commission may agree with the applicant to align regulatory procedures (which may result in a delay). The inconsistency between legally prescribed timelines and the administrative practice has been published by EuropaBio (Figure 3)
13.3. ábra - Figure 3: GM Product submissions and authorisations. Status of 1 February 2012
For climatic and agronomic reasons, the EU is unable to produce most of the oilseed meal and other protein-rich feedstuffs required to feed its livestock. In fact, the EU imports about 80% of its protein needs. In addition to protein-rich soybean meal, Corn Gluten Feed (CGF) and Distillers Dried Grain with Solubles (DDGS) are needed by livestock producers in the EU to achieve a balanced diet for their animals, especially as far as protein
Created by XMLmind XSL-FO Converter.
13. ECONOMICS OF GM CROP CULTIVATION
is concerned. Without an adequate supply of these feed ingredients, the EU’s livestock production will lose competitiveness and European livestock producers will lose market share. All EU imports of meat are produced from animals which may legally be fed with GM plants not yet authorised in the EU (EC 2007, 2010).
The supply chain of commodity crops (e.g. soya and maize) is complex. The EU livestock sector uses imported maize and maize by-products as animal feed. Countries exporting these crops are growing both EU-authorised and non-EU-authorised GM crops, as well as non-GM crops. The EU decision-making regime for GM products is relatively slow in comparison with the rest of the world (asynchronous GM approvals). The supply of non-GM commodity crops is decreasing as a consequence of an increase in the volume of GM crops being grown and the potential for non-EU authorised GM varieties to enter the non-GM supply chain as adventitious presence is becoming greater.
In fact, the EU has not been able to import maize from the United States since 1997 because there has not been a harmonisation of approvals in the EU and the United States. Other countries, primarily Argentina, have provided a substitute for the previous exports from the United States. However, in 2007 there were also substantial problems with the importation of maize from Argentina for the starch industry as well as for the feed sector due to a GMO trait (event GA21 or “Herculex”) not approved in the EU. Until this trait was approved in 2008 maize could only have been exported from Argentina to the EU if the Argentinean authorities had issued an analysis certificate for each shipment confirming the absence of GA21. This time demand for maize in the EU was concentrated on maize from Brazil, which has intensified the acceleration in prices on the feedstuff market. The compound feed producers in the EU had to pay up to 50 €/t more for maize from Brazil.
The EU used to import significant quantities of maize by-products from the USA for use as animal protein feed (CGF and DDGS). However, this trade declined sharply from 2007 because the USA adopted new GM maize crops before they were cleared for EU import. This was the first example of an asynchronous GM approval problem for the EU feed and livestock industries. The reduced import of US maize by-products has been replaced by the use of other feed materials, at a cost to compound feed producers and livestock farmers, especially in the ruminant sector. As can be seen from the example of “Herculex” (GA21), delays in the approval process have already had significant effects on the feedstuff supply in the EU. Due to the delayed approval process for “Herculex”, imports into the EU of CGF and DDGS started to decline dramatically. While 3.3 million tons of CGF and DDGS had been imported in the 2005/2006 marketing year, it was only around 1.0 million tons in 2009/2010. The products imported were those produced from maize grown in 2006 and exported from the USA to the EU until December 2007 (Toepfer International, 2010).
CGF and DDGS imports recovered in 2010/11 to almost 1.5 million tons but they will be much lower again in 2011/12. Trade is hindered by a genetically modified corn construct, which has been grown in the USA since 2011 but has not yet been approved for import into the EU. The regulation on a technical solution for unapproved genetically modified organisms in feed came into force in July 2011. It permits their presence up to 0.1% with an additional 0.05% as a tolerance for measuring inaccuracies if they are already undergoing the approval procedure by the European Food Safety Authority (EFSA). The MIR162 construct, developed by Syngenta, is covered by this regulation, but it was panted on about 1% of the corn acreage for the 2011 US harvest, meaning it is very difficult or practically impossible to comply with the threshold value of 0.1% plus tolerance for measuring uncertainty (Toepfer International, 2012).
Preliminary figures for exports from the USA to the EU consequently also reveal a sharp decline in exports of corn by-products. The move away from absolute zero tolerance for unapproved GMOs is to be welcomed, but experience over recent months has shown that the threshold level is not feasible as soon as non-EU approved GMOs are commercially grown in exporting countries. Construct MIR162 is still in the initial approval phase meaning that approval may not be granted until the end of 2012 or even later. Consequently the situation for trade in corn by-products is not expected to improve in the foreseeable future, especially as the list of GMOs waiting for EU approval is getting ever longer (Figure 3).
The experience with the “Herculex” maize has shown that low-level presence in maize can still have considerable economic repercussions throughout the EU’s supply chain. Following the potential for the accidental presence of the unauthorised GM maize “Herculex”, the feed industry stopped importing CGF and DDFS from the USA. Where cargoes were rejected due to the presence of unauthorised GM varieties these were re-directed to other markets. Alternative cereal proteins had to be sourced but at an additional cost to livestock producers. Moreover, especially for maize the stacking of events can quickly generate more crops that are considered new GMOs under the EU’s regulatory framework.
Created by XMLmind XSL-FO Converter.
13. ECONOMICS OF GM CROP CULTIVATION
7. Questions1. Global area planted to GM crops in 2011?
2. Adoption rate of key GM crops in the main exporter countries?
3. World trade of maize, soybean and soybean meal (main exporters and importers)?
4. Approval process for GMO in the EU and third countries?
5. What is at stake for the feed industry in the EU?
8. ReferencesBrook Lyndhurst Ltd. (2009): An evidence review of public attitudes to emerging food technologies. London: Food Standards Agency.
Céleres (2008): União Européia consumirá 80% de soja transgênica em 2008. http://www.portaldoagronegocio.com. Br/conteudo.
EC (2007): Economic impact of unapproved GMOs on EU feed imports and livestock production. DG AGRI Report. Brussels: European Commission.
EC (2010): Study on the implications of asynchronous GMO approvals for EU imports of animal feed products. Directorate-General for Agriculture and Rural Development European Commission ETC Group (2008).
EuropaBio (2011): Undue delays in the EU approval of safe GM products. The European Association for Bioindustries. www.europabio.org/agricultural/positions/approvals-gmos-european-union
FAO (2009): Food and Agriculture Organization of the United Nations FAO-BioDeC: Biotechnologies in developing countries (database). Rome.
Graff, G.D., D. Zilberman and A.B. Bennett (2009): The contraction of agbiotech product quality innovation. Nature Biotechnology 27: 702-704.
James, C. (2012): Global Status of Commercialized Biotech/GM Crops: 2011. The International Service for the Acquisition of Agri-Biotech Applications (ISAAA).
Ramessar, K., T. Capell, R.M. Twyman, H. Quemada and P. Christou (2008): Trace and traceability: a call for regulatory harmony. Nature Biotechnology 26: 975-978.
Stein, A.J. and E. Rodríguez-Cerezo (2009): The global pipeline of new GM crops: implications of asynchronous approval for international trade. JRC Technical Report EUR 23486 EN. Luxembourg.
Stein, A.J., Rodríguez-Cerezo, E. (2010): Low-level presence of new GM crops: An issue on the rise for countries where they lack approval. AgBioForum, 13: (2), 173-182.
Toepfer International 2010: The EU feedstuffs market. (Market Review February 2010). Toepfer International GmbH. Hamburg.
Toepfer International (2012): Market review February 2012. Toepfer International GmbH. Hamburg.
USDA (2012): USDA Agricultural Projections to 2021. United States Department of Agriculture. 2012. Washington, D.C.
Vaidyanathan, G. (2010): A search for regulators and a road map to deliver GM crops to third world farmers. New York: New York Times Company. 31 March 2010.
Created by XMLmind XSL-FO Converter.
14. fejezet - 14. ECONOMICS OF CROP PROTECTION MEASURESIntroduction
The human population is projected to grow by 70 million per annum, increasing by 30% to 9.2 billion by 2050 (FAO, 2009). This increased population density, coupled with changes in dietary habits in developing countries towards high quality food (e.g. greater consumption of meat and milk products) and the increasing use of grains for livestock feed, is projected to increase demand for food production by 60%. The increase in production will occur at the same time as the climate is changing and becoming less predictable, as greenhouse gas emissions from agriculture need to be cut, and as land and water resources are shrinking or deteriorating. The availability of additional agricultural land is limited and any expansion would happen mostly at the expense of forests and the natural habitats containing wildlife, wild relatives of crops and natural enemies of crop pests. Thus, we may need to grow food on even less land, with less water, using less energy, fertiliser and pesticide than we use today (FAO, 2009). Given these limitations, sustainable production at elevated levels is urgently needed. Increasing productivity on existing land is by far the better option.
1. 14.1. Challenges facing scientists and pest management expertsGlobally, agricultural producers apply around USD 40 billion worth of pesticides per annum (McDougall, 2010). What is the pay-off for such high chemical usage? What risks might we encounter if this level of pesticide use is continued or increased over time? How would this compare to a discontinuation of pesticide usage? Farmers in highly developed, industrialised countries expect a four or five fold return on money spent on pesticides (Gianessi and Reigner, 2005; Gianessi and Reigner, 2006; Gianessi, 2009). Is this realistic given current circumstances? Can we meet world food demands if producers stop using pesticides because of reduced economic benefits? Can better integrated pest management (IPM) preserve the economic benefits of pesticide use? Although crop losses are currently greatest in less industrialised countries, can we meet the educational and training requirements to safely increase pesticide use in these areas? These are just some of the questions facing scientists and pest management experts at a time when agriculture faces some of its most daunting challenges to date.
2. 14.2. Estimates of crop losses due to pestsTwo loss rates have to be differentiated: the potential loss and the actual loss. The potential loss from pests includes the losses without physical, biological or chemical crop protection compared with yields with a similar intensity of crop production (fertilisation, irrigation, cultivars, etc.) in a no-loss scenario. Crop losses to weeds, animal pests, pathogens and viruses continue to reduce available production of food and cash crops worldwide. Absolute losses and loss rates vary among crops due to differences in their reaction to the competition of weeds and the susceptibility to attack of the other pest groups. Increased agricultural pesticide use nearly doubled food crop harvests from 42% of the theoretical worldwide yield in 1965 to 70% of the theoretical yield by 1990. Unfortunately, 30% of the theoretical yield was still being lost because effective pest management methods were not uniformly applied around the world. This remains true today. However, without pesticides, natural enemies, host plant resistance and other nonchemical controls, it is estimated that 70% of crop yields could have been lost to pests (Oerke et al., 1994).
Since the early 1990s, production systems and crop protection methods have changed significantly, especially in crops such as maize, soybean and cotton, in which the advent of transgenic varieties has modified the strategies for pest control in some major production regions. Comparing crop production and actual losses to pests for 1996-98 and 2001-03 to data from 1988-90, it is apparent that the actual losses of the six food and cash crops have decreased in relative terms (Figure 1). Due to the increased use of pesticides the absolute value of crop losses and the overall proportion of crop losses have decreased between the period 1988-90 and 2001-03 (Oerke and Dehne, 2004; Oerke, 2006). In total, the loss potential of about 70% was reduced to actual losses of approximately 35% and the efficacy of actual crop protection worldwide increased from 40% to 52% (Figure 2). The efficacy of pest control strategies has changed in many regions. The intensity of pest control has increased,
Created by XMLmind XSL-FO Converter.
14. ECONOMICS OF CROP PROTECTION MEASURES
sometimes dramatically (e.g. in Asia and Latin America, where the use of pesticides increased well above the global average (McDougall, 2010). In large parts of Asia and Latin America great advances have been made in the education of farmers, but the same is not true in Sub-Saharan Africa and the position has actually worsened in the countries of the former Soviet Union through a lack of resources.
14.1. ábra - Figure 1: Development of crop losses from 1996-98 to 2001-03
14.2. ábra - Figure 2: Development of efficacy of actual crop protection practices from 1996-98 to 2001-03
3. 14.3. Cost and benefit of pesticides
Created by XMLmind XSL-FO Converter.
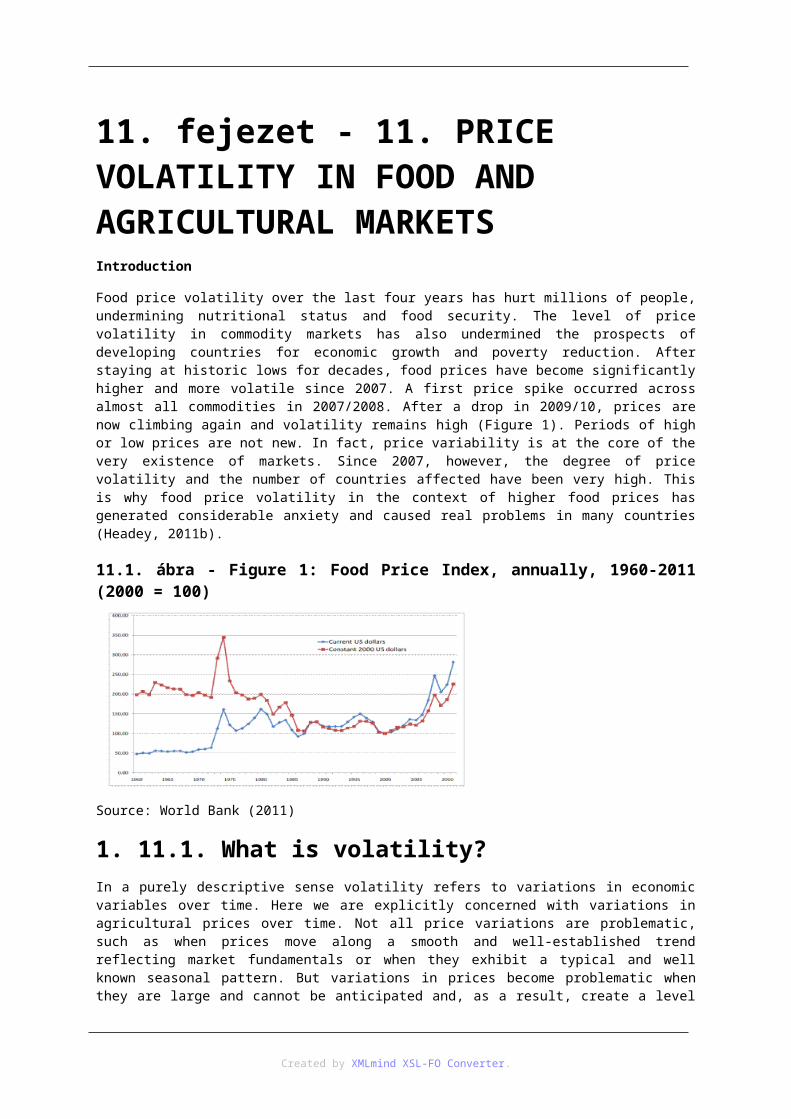
14. ECONOMICS OF CROP PROTECTION MEASURES
The costs of pesticides and non-chemical pest control methods alike are low relative to crop prices and total production costs. Pesticides account for about 7-8% of total farm production costs in the EU. However, there is wide variation among Member States fluctuating between 11% in France and Ireland and 4% in Slovenia (European Commission, 2010). Pesticide use was relatively low in the new Member States prior to EU-accesion (Keszthelyi and Pesti, 2010). Pesticides account for 5-6% of total farm input in monetary terms in the USA (USDA, 2010).
Overall, farmers have sound economic reasons for using pesticides on crop land. In spite of the yearly investments of nearly USD 40 billion worldwide, pests cause an estimated 35% actual loss (Oerke, 2006; Mc Dougall, 2010). The value of this crop loss is estimated to be USD 2000 billion per year, yet there is still about USD 5 return per dollar invested in pesticide control (Pimentel, 2009).
Detailed pesticide benefit analyses have been made mainly in the United States. In the late 1990s, it was estimated that growers in the U.S. could expect a USD 4 return for each dollar they spent on agricultural pesticides (Fernandez-Cornejo et al., 1998). However, when all the indirect costs for pesticide were considered, there was only a USD 2 return to society at large for each dollar that growers spent on pesticides (Pimentel and Greiner, 1997). Later, the national pesticide benefit studies from the second half of the twentieth century documented a huge net return of costs that growers spend on herbicides, insecticides, fungicides and their application. Research covers fifty crops, including 5-10 crops for each state in the U.S. (Gianessi and Reigner, 2005; Gianessi and Reigner, 2006; Gianessi, 2009).
U.S. farmers have sprayed herbicides on close to 90% of the nation’s crop land acreage for the past thirty years. The value of the use of herbicides in 2005 is estimated to have been USD 16 billion in increased crop yields and USD 10 billion in reduced weed control costs totalling to a herbicide non-use net income impact of USD 26 billion. Increased fuel and labour costs have made the costs of alternatives (to herbicides) higher. The aggregate cost of cultivation and hand weeding as replacements for herbicides increased to USD 16.8 billion, resulting in a net increase in weed control costs without herbicides to USD 10 billion in 2005. Including the value of the crops, the loss of production without herbicides was worth approximately USD 16 billion.
Cost estimates consist of three components: cost of the product, cost of application, and premiums for use of herbicide tolerant soybean, corn, canola, rice, and cotton seeds. Nationally, it is estimated that growers spent USD 4.4 billion on herbicide products in 2005. The total costs of herbicide application are estimated at USD 1.9 billion and the total premium for planting herbicide tolerant seed is estimated at USD 0.8 billion, which represents a total cost of USD 7.1 billion (Gianessi and Reigner, 2006). It gives a net return of USD 3.7 for every dollar that growers spend on herbicides and their application (Table 1).
14.1. táblázat - Table 1: Value of herbicides, insecticides and fungicides in U.S. crop production
USD billion Herbicides 2005 Insecticides 2008
Fungicides 2002 Total 2002-08
Cost to growers 7.1 1.2 0.9 9.2
Non-use cost increase 9.7 - - 9.7
Yield benefit 16.3 22.9 12.8 52.0
Net benefit 26.0 21.7 12.0 59.7
Return ratio: benefit/cost (USD) 3.7 18.1 13.3 6.5
Source: Gianessi and Reigner (2005), Gianessi and Reigner (2006), Gianessi (2009) and own calculations.
Insecticides are the chief means of controlling 90% of the major insect pests attacking crops in the U.S. Farmers sprayed insecticides at a cost of USD 1.2 billion in 2008 (Gianessi, 2009). Growers gained USD 22.9 billion in increased production value from the control of crop-feeding insects with insecticides. For every dollar spent on insecticides, farmers gain about USD 18 in increased production value (Table 1).
Created by XMLmind XSL-FO Converter.
14. ECONOMICS OF CROP PROTECTION MEASURES
The fungicide benefit study identified net return rates of USD 13.3 for every dollar spent on fungicides and their application. Growers gained USD 12.8 billion in increased production value from the control of plant diseases with fungicides in 2002, spending USD 880 million on fungicides and their application (Table 1). If left untreated, it is estimated that yields of most fruit and vegetable crops would have declined by between 50% and 95% (Gianessi and Reigner, 2005).
According to the national pesticide benefit studies in the United States, USD 9.2 billion are spent on pesticides and their application for crop use every year (Gianessi and Reigner, 2005; Gianessi and Reigner, 2006; Gianessi, 2009). This pesticide use saves around USD 60 billion on crops that otherwise would be lost to pest destruction. It indicates a net return of USD 6.5 for every dollar that growers spent on pesticides and their application (Table 1). However, the USD 60 billion saved does not take into account the external costs associated with the application of pesticides in crops.
In a well-documented analysis on environmental and economic costs of pesticide use, Pimentel et al. (1992) found that pesticides indirectly cost the U.S. USD 8.1 billion a year (Table 2). This includes losses from increased pest resistance; loss of natural pollinators (including bees and butterflies) and pest predators; crop, fish and bird losses; groundwater contamination; harm to pets, livestock and public health (Pimentel et al., 1992). In a supplementary study, Pimentel (2005) estimates that the total indirect cost of pesticide use was around USD 9.6 billion in 2005. Had the full environmental, public health and social costs been included it was estimated the total cost could have risen to USD 9.6 billion figure (Pimentel, 2005).
14.2. táblázat - Table 2: Total estimated environmental and social costs from pesticides in the USA
Impact Cost (USD mln/year) 1992
Cost (USD mln/year) 2005
Public health impacts 787 1 140
Domestic animals deaths and contaminations 30 30
Loss of natural enemies 520 520
Cost of pesticide resistance 1 400 1 500
Honeybee and pollination losses 320 334
Crop losses 942 1 391
Fishery losses 24 100
Bird losses 2 100 2 160
Groundwater contamination 1800 2 000
Government regulations to prevent damage 200 470
Total 8 123 9 645
Source: Pimentel et al. (1992), Pimentel (2005)
While pesticide use is beneficial from a strict agricultural cost/benefit perspective, the environmental and public health costs of pesticides necessitate the consideration of other trade-offs involving environmental quality and public health when assessing the net returns of pesticide use age. The environmental and social costs of pesticides to the U.S. have been estimated at USD 10 billion. But past assessments of environmental and social impact have been narrow and should they be broadened to USD 20 billion per year the previous estimate of
Created by XMLmind XSL-FO Converter.
14. ECONOMICS OF CROP PROTECTION MEASURES
USD 60 billion worth of production benefits to the U.S. from pesticide use would be dramatically lower (USD 40 billion) if net effects are considered. However, the net benefit still shows a high profitability of pesticides indicating a net return of USD 3 for every dollar spent on pesticides (Table 1 and Table 2).
The EC Directive 2009/128/EC on the sustainable use of pesticides establishes a framework to achieve a sustainable use of pesticides by reducing the risks and impacts of pesticide use on human health and the environment and promoting the use of IPM and alternative approaches or techniques such as non-chemical alternatives to pesticides. Each Member State government needs to prepare an action plan which covers measures such as compulsory testing of application equipment, certification of operators, distributors and advisors, banning aerial spraying, protecting the aquatic environment, public spaces and conservation areas and minimising risk to human health and the environment.
Large agrochemical companies are steadily becoming more involved in ecologically based IPM. For example, the stewardship team of Syngenta turned a thought leadership idea into a project: MARGINS – Managing Agricultural Runoff into Surface Water. The main aim of the MARGINS project is to demonstrate the integration of crop productivity needs with the demands for protecting water, biodiversity and soil. The project was initiated in 2009 near Lake Balaton in Hungary which is renowned for its beauty and wildlife, but which is surrounded by steep rolling hills of very productive loam soils. MARGINS is an example of how to meet the demands of 21st century sustainable agriculture – a skilful blend of modern technology with respect for nature. Further research and development, along with investment in new technologies, is vital to maintain a sustainable, competitive agricultural industry which can still deliver the required economic, social and environmental benefits (Syngenta, 2010).
4. 14.4. Global pesticide marketThe global chemical-pesticide market is about 3 million tonnes associated with expenditures around USD 40 billion in a year. Regional figures of crop protection mask differences within regions and among crops. Pesticide use in West Europe is high because of intensive production in greenhouses, the growth of fruits and vegetables requiring repeated use of pesticides, and the high quality standards of consumers for food and ornamentals. In other regions, ornamentals associated with high pesticide use are hardly grown and the intensity of pesticide use in cash crops like cotton and groundnut is often similar in both developing and developed countries (Table 3).
14.3. táblázat - Table 3: Annual estimated pesticide use in the world
Country/Regions Pesticide use (mln t)
United States 0.5
Canada 0.2
Europe 1.0
Other developed 0.5
China 0.2
Asia, developing 0.3
Latin America 0.2
Africa 0.1
Total 3.0
Source: Pimentel (2009)
Created by XMLmind XSL-FO Converter.
14. ECONOMICS OF CROP PROTECTION MEASURES
In 2009 chemical crop protection accounted for 70, agricultural biotechnology for 19 and environmental science for 11% of the global crop protection market. During 2009, conventional agrochemical product sales for crop protection experienced a decrease of 6.5% to USD 37.9 billion. In contrast to the decline in the value of the conventional crop protection market, the value of GM herbicide tolerant and insect resistant crop seed increased by 15.5% to USD 10.6 billion and sales of agrochemicals used in non-crop situations (gardening, household use, golf courses, etc rose by 3.6% to USD 5.9 billion. As a result the value of the overall crop protection sector in 2009 is estimated to have fallen by 2.4% to USD 54.3 billion. The increasing sale of GM seeds has had a direct impact on the market for conventional agrochemical products (McDougall, 2010).
Herbicides account for almost half of the pesticides used. Insecticides and fungicides have approximately 25% share each. During 2009, 85% the of conventional crop protection product market were used in the following sectors: fruit & vegetables, cereals, maize, soybean, rice, cotton and rape (McDougall, 2010).
Global sales of biopesticides are estimated to total around USD 1 billion, still small compared to the USD 38-40 billion in the worldwide pesticide market. It is pegged at around 2% of the global crop protection market but the segment’s market share is growing faster than that of conventional chemicals. Biopesticides are used most widely on specialty crops. Reduced-risk or green pesticides is a growing sector, and companies are striving to discover new products for that market segment. While biopesticides may be safer than conventional pesticides, the industry is plagued by the lack of critical mass to effectively develop and market its products, as well as compete with multinational synthetic pesticide producers. The industry is composed mostly of small to medium sized enterprises and it is difficult for one company to fully and comprehensively fund research and development, field development and provide the marketing services required to make a successful biopesticide company.
Another challenge is the lack of innovative biopesticide products coming to the marketplace and their registration (Farm Chemical Internationals, 2010). To increase the rate of development of new biopesticides a larger overall investment in R&D is required as well as greater uptake of the IPM concept and continued growth of organic production. Products not requiring registration and those that already have been registered have priority in the R&D of these companies. In recent times, large agricultural chemical companies have become very dynamic, and are constantly on the lookout for technology that complements what they already have or that complements a segment of the market that they are focused on. While biopesticides are typically seen as an alternative to synthetic chemicals, some experts see biopesticides as complementary to conventional pesticides already on the market. Biopesticides can enhance and synergise synthetic chemical active ingredients and also fill unmet market needs. Given the difficulties in developing new chemical pesticides that meet all of today’s environmental and safety requirements, biopesticides can increasingly meet the market need for new active ingredients.
5. Questions1. What is the challenge of food supply?
2. Actual crop losses due to pests in % of production?
3. Economic, environmental and social impacts of pesticides use?
4. Crop protection cost in % of total farm production costs?
5. What is the bottleneck of biological control?
6. ReferencesEuropean Commission (2010): Farm Accountancy Data Network, FADN Public Database. http://ec.europa.eu/agriculture/rica/database
FAO (2009): Feeding the world in 2050. World Agricultural Summit on Food Security 16-18 November 2009, Food and Agriculture Organization of the United Nations, Rome.
Farm Chemical Internationals (2010): Biological pesticides on the rise. www.farmchemicalsinternational.com/magazine
Created by XMLmind XSL-FO Converter.
14. ECONOMICS OF CROP PROTECTION MEASURES
Fernandez-Cornejo J. et al. (1998): Issues in the economics of pesticide use in agriculture: A review of the empirical evidence. Rev Agric Econ 20(2):462-488.
Gianessi, L.P. (2009): The value of insecticides in U.S. crop production. Croplife Foundation, Crop Protection Research Institute (CPRI), March 2009.
Gianessi, L.P., Reigner N. (2005): The value of fungicides in U.S. crop production. Croplife Foundation, Crop Protection Research Institute (CPRI), September 2005.
Gianessi, L.P., Reigner N. (2006): The value of herbicides in U.S. crop production. 2005 Update. Croplife Foundation, Crop Protection Research Institute (CPRI), June 2006.
Keszthelyi, Sz, Pesti Cs. (2010): Results of Hungarian FADN farms 2009, Hungarian Research Institute for Agricultural Economics, 2010.
McDougall (2010): Phillips McDougall, AgriService, Industry Overview – 2009 Market, Vineyard Business Centre Saughland Pathhead Midlothian EH37 5XP Copyright 2010.
Oerke, E.C. et al. (1994): Crop Production and Crop Protection – Estimated Losses in Major Food and Cash Crops. Elsevier Science, Amsterdam, 808 pp.
Oerke, E.C., Dehne HW. (2004): Safeguarding production – losses in major crops and the role of crop protection. Crop Prot 23: 275 -285.
Oerke, E.C. (2006): Crop losses to pests. J Agr Sci 144: 31-43.
Pimentel, D. et al. (1992): Environmental and economic costs of pesticide use. BioScience 42: 750-760.
Pimentel, D. (2005): Environmental and economic costs of the application of pesticides primarily in the United States. Environ Dev Sus 7: 229-252.
Pimentel, D., Greiner A. (1997): Environmental and socio-economic costs of pesticide use, Chapter 4, In: Techniques for Reducing Pesticide Use: Economic and Environmental Benefits, D. Pimentel, Editor, John Wiley and Sons, New York.
Pimentel, D. (2009): Pesticides and pest controls. In: Peshin R, Dhawan AK. (eds.) (2009). Integrated pest management: Innovation-development process, 1: 83-87. Springer Science + Business Media B. V. 2009.
Syngenta (2010): The MARGINS Project. Managing Agricultural Runoff Generation INto Surface Water. Syngenta Stewardship & Sustainable Agriculture, Basel, Switzerland.
USDA (2010): Commodity costs and returns: U.S. and regional cost and return data. http://www.ers.usda.gov./data/costsandreturns.
Created by XMLmind XSL-FO Converter.
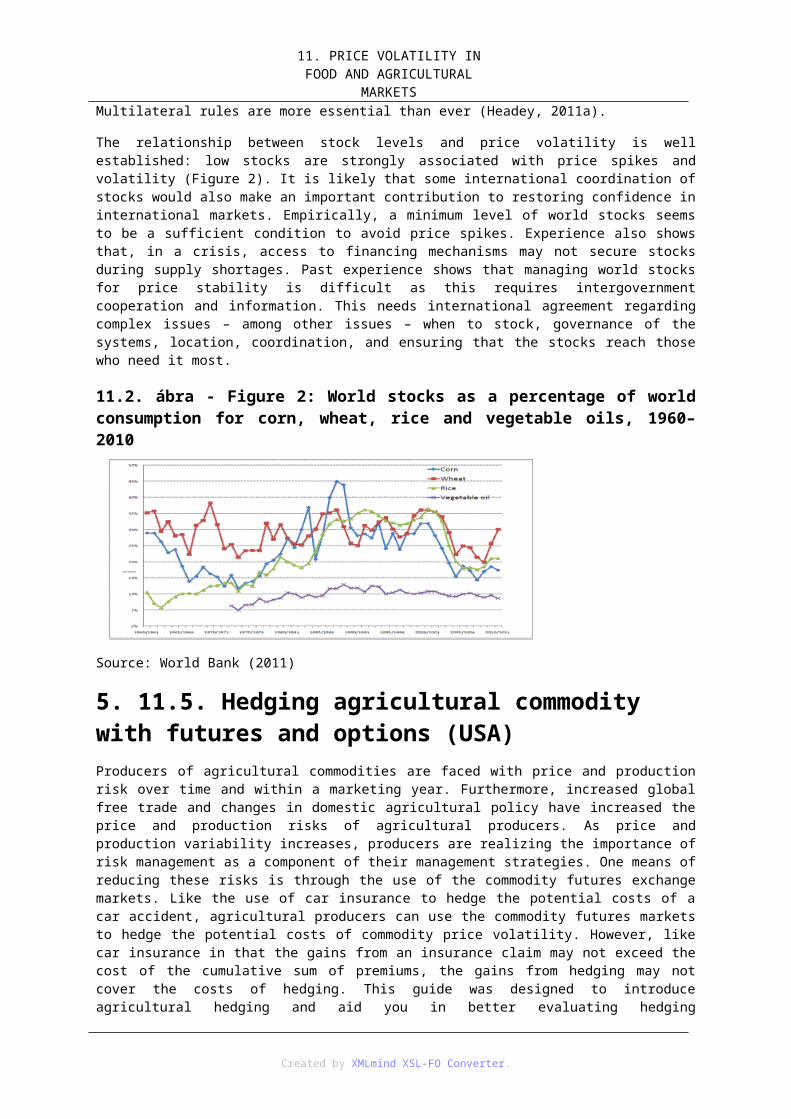
15. fejezet - 15. INTERNATIONAL AGRICULTURAL TRADE: WORLD TRADE ORGANIZATION (WTO)Introduction
“GATT” is the acronym of General Agreement on Tariffs and Trade. The GATT is an international agreement concluded in 1947. It contains the rules and obligations that governed trade in goods for almost fifty years between the nations, which signed and ratified it and which were normally called "the Contracting Parties". Until the creation of the WTO in 1995, the GATT provided the legal framework for the bulk of world trade. From 1947 to 1994, Contracting Parties organized eight rounds of negotiations. The longest (1986-1994) and most comprehensive of them was the Uruguay Round, which incorporated negotiations on services and intellectual property. The Contracting Parties concluded the Round by adopting the “Final Act Embodying the Results of the Uruguay Round of Multilateral Trade Negotiations”. The Final Act includes the “Marrakesh Agreement Establishing the World Trade Organization” (the “WTO Agreement”). The WTO Agreement is the constitutive agreement which established a new organizational body, the World Trade Organization. Therefore, the WTO came into being in 1995, and though legally distinct from the “GATT”, both are interrelated. The WTO is in charge of administering the Uruguay Round Agreements (WTO, 2010).
1. 15.1. The WTO AgreementsThe WTO agreements are the result of the 1986-1994 Uruguay Round negotiations signed at the Marrakesh Ministerial Meeting in April 1994. There are about 60 agreements and Decisions totalling 550 pages. It also included a major revision of the original GATT text. Negotiations since 1994 have produced additional legal texts such as the Information Technology Agreement Services and Accession Protocols. The Final Act of the Uruguay Round was signed in Marrakesh in 1994. It works like a cover note to all WTO Agreements, which are subsequently attached. Next, is the Marrakesh Agreement establishing the World Trade Organization (”the WTO Agreement”), it serves as an umbrella agreement. The WTO Agreement includes provisions on establishment, scope, functions and structure of the WTO. It defines the WTO relationship with other organizations, its secretariat, budget and contributions, legal status, and decision-making and amendment procedures (including special voting procedures). Additionally, it presents information on the definition of original Members, accession, non-application, acceptance, entry into force and deposit, denunciation and final provisions. The WTO Agreement has four Annexes. Annexes 1, 2, and 3 are termed “multilateral Trade Agreements” and Annex 4 is termed ”Plurilateral Trade Agreements” (WTO, 2010).
Annex 1 is divided into three sections:
Annex 1A (The Multilateral Agreements on Trade in Goods);
Annex 1B (General Agreement on Trade in Services); and
Annex 1C (Agreement on Trade-related Aspects of Intellectual Property Rights
1.1. 15.1.1. Objectives of the WTO:• raise living standards;
• ensure full employment;
• ensure large and steadily growing volume of real income and effective demand; and expand the production of and trade in, goods and services, while allowing for the optimal use of the world's resources in accordance with the objective of sustainable development.
1.2. 15.1.2. Functions of the WTO:
Created by XMLmind XSL-FO Converter.
15. INTERNATIONAL AGRICULTURAL TRADE:
WORLD TRADE ORGANIZATION (WTO)
• administer trade agreements;
• serve as a forum for trade negotiations;
• settle trade disputes;
• review Member's trade policies;
• assist developing countries with trade policy issues, through technical assistance and training programmes; and cooperate with other international organizations.
1.3. 15.1.3. The Ministerial ConferenceThe Ministerial Conference is the highest decision-making body in the WTO. Its sessions must take place at least once every two years and deals with all matters under the WTO agreements.
1.4. 15.1.4. The General CouncilThe General Council constitutes the second tier in the WTO Structure. It comprises representatives from all Member countries, usually Ambassadors/Permanent Representatives based in Geneva. It meets regularly (approximately once a month) to adopt decisions, mostly on behalf of the Ministerial Conference when the Conference is not in session. The General Council has authority over the Trade Negotiations Committee (“TNC”), which is in charge of the negotiations mandated by the Doha Development Agenda.
1.5. 15.1.5. The Trade Negotiations CommitteeThe Trade Negotiations Committee (TNC) was set up by the Doha Ministerial Declaration, which in turn assigned it to create subsidiary negotiating bodies to handle negotiations for different topics, among them the Special Sessions of various Committees that have a mandate to negotiate (such as Agriculture, Trade and Environment, Subsidies, etc.). At present, its chairperson is Mr. Pascal Lamy, the Director-General of the WTO. The TNC reports directly to the General Council.
1.6. 15.1.6. The Councils & Subsidiary BodiesThe Councils can be described as subsidiary bodies to the General Council. They are composed of all WTO Members.
There are three:
• The Council for Trade in Goods (the “Goods Council”) oversees all the issues related to the Agreements on trade in goods;
• The Council for Trade in Services (the “GATS Council”) oversees all issues related to the GATS Agreement;
• The Council for Trade-Related Aspects of Intellectual Property Rights (the “TRIPS Council”) administers the TRIPS Agreement
1.7. 15.1.7. Decision- making in the WTOThe WTO is a Member-driven, consensus-based organization. Where consensus is not possible, the WTO Agreement permits voting – a vote being won by a tally of the majority of votes cast, and based on “one country, one vote”.
The WTO Agreement envisages voting in four specific situations:
1. a three-quarters majority of WTO Members can adopt an interpretation of any of a multilateral trade agreements;
2. the Ministerial Conference, by a three-quarters majority, can waive an obligation imposed on a Member by a multilateral agreement;
Created by XMLmind XSL-FO Converter.
15. INTERNATIONAL AGRICULTURAL TRADE:
WORLD TRADE ORGANIZATION (WTO)
3. all Members or a two-thirds majority (depending on the provision of the agreement) can take a decision to amend provisions of the multilateral agreements. However, the amendments only apply to WTO Members that accept them; and
4. a two-thirds majority in the Ministerial Conference or the General Council in between conferences can take a decision to admit a new Member.
2. 15.2. PrinciplesThere are two main principles of non-discrimination, the Most Favoured Nation (MFN) and the national treatment principles. The MFN principle prohibits discrimination between imports irrespective of their origin or destination while the national treatment principle prohibits discrimination between imported and locally produced products. Whilst the MFN principle seeks to ensure that a WTO Member does not discriminate between like products originating in or destined for WTO Members, the national treatment principle prohibits a Member from favouring its domestic products over the imported products of other Members (WTO, 2010).
Under GATT, the subject of MFN treatment is goods and under The General Agreement on Trade in Services (GATS) the subjects of is services or service providers, in the context of the TRIPS Agreement, the subject of MFN treatment is “nationals”. For TRIPS, the national treatment principle prohibits treatment of foreign nationals on less favourable terms than that accorded to nationals in the context of the implementation of national or international intellectual property laws or regulations.
3. 15.3. Rules on unfair tradeIncreased imports from one country can be caused by changes in consumer preferences or by improvements in the competitiveness of the companies producing the imports vis-à-vis national companies producing like products. However, increasing imports can be cause by “unfair” practices or “unfair” competition. Consequently, WTO Members have retained their right to take protective measures to correct the competitive imbalances created by unfair practices. The rationale behind the idea is not to create additional barriers to trade but rather, to restore, in a targeted manner, “fair” competitive conditions as if the cause of the unfair competition were eliminated. GATT governs the use of anti-dumping measures and also constitutes the basis for the use of countervailing measures (the Anti-dumping Agreement for anti-dumping measures, and the Agreement on Subsidies and Countervailing Measures: SCM Agreement) adopted in the Uruguay Round (WTO, 2010).
3.1. 15.3.1. Anti-dumping measuresThe Anti-Dumping Agreement defines dumping as the introduction of a product into the commerce of another country at less than its normal value. Dumping is, in general, a situation of international price discrimination, where the price of a product when sold in the importing country is less than the price of that product in the market of the country exporting the product. In addition to rules governing the determination of dumping, injury, and causal ulink, the Agreement sets forth detailed procedural rules for the initiation and conduct of investigations, and the imposition, duration and review of measures. In the simplest scenario, one can identify dumping by comparing the price of a product in two markets to determine whether there is a difference in prices in those markets. However, the situation is rarely that simple, and in most cases it is necessary to undertake complex analytical steps to determine the appropriate price in the market of the exporting country (the “normal value”) and the appropriate price in the market of the importing country (the “export price”) to be able to make a comparison. The Anti-dumping Agreement explicitly authorize a Member to impose specific anti dumping duties on imports (in addition to import tariffs), when the importing Member demonstrates that dumping is causing or is threatening to cause material injury to a domestic industry, or would materially retard the establishment of a domestic industry.
3.2. 15.3.2. Subsidies & countervailing dutiesThe Agreement on Subsidies and Countervailing Measures (SCM Agreement) applies to agricultural and industrial products, except for the subsidies exempt under the Agriculture Agreement's “Peace Clause”, which expired at the end of 2003. The SCM Agreement contains the rules on subsidies, while the Agreement on Agriculture contains specific rules governing the use of agricultural subsidies. The term countervailing duty shall be understood to mean a special duty levied for the purpose of offsetting any bounty or subsidy bestowed,
Created by XMLmind XSL-FO Converter.
15. INTERNATIONAL AGRICULTURAL TRADE:
WORLD TRADE ORGANIZATION (WTO)
directly or indirectly, upon the manufacture, production or exports of any merchandise. The definition of subsidies under the SCM Agreement contains three elements which must be satisfied in order for a subsidy to exist: a financial contribution; by a government or any public body within the territory of a Member; and which confers a benefit. The disciplines in the agreement only apply to specific subsidies. They can be production or export subsidies.
4. 15.4. Non-discriminationAs you know, non-discrimination is a key concept of the multilateral trading system. It is based on the most favoured-nation clause and national treatment (WTO, 2010).
4.1. 15.4.1. MFN under GATTThe Most Favoured Nation (MFN) principle prohibits discrimination between imports irrespective of their origin or destination and requires each Member to extend to all other Members, treatment no less favourable than it accords to imports from any other country.
4.2. 15.4.2. National treatment under GATTThe national treatment principle constitutes the second component of the non-discrimination pillar, the first being the MFN principle. Like MFN, the national treatment principle applies to trade in goods, trade in services, and trade-related aspects of intellectual property rights. The national treatment principle prohibits a Member from favouring its locally-produced goods (as well as services and intellectual property rights such as patents or copyrights) over the ones imported from other Members.
Three key objectives underpin the national treatment principle. First, the application of laws, regulations, etc. affecting the sale of the imported product should not be discriminatory. If the law (regulations) is the same for both the domestic and the imported product, but is discriminatory in its application, it nevertheless offends this provision because it can be viewed as affording “protection to domestic production”. Second, the charges and internal taxes that Member countries’ products are subjected to should not be “in excess of those applied, directly or indirectly, to like domestic products”. To explicate, an imported product should be charged the same taxes as domestic products. Third, the principle applies to “like products”. What is understood by “like domestic products”? Traditionally, “likeness” is to be determined on a case-by-case analysis, involving but not limited to the following criteria: the properties, nature and quality of the products; the end-uses of the products; consumer tastes and habits, and/or consumers' perception and behaviour in respect of the products; and the tariff classification of the products.
5. 15.5. TariffsTariffs, also called “customs duties” are the most common and widely used barrier to market access for goods. A tariff is a financial charge in the form of a tax, imposed on merchandise imports. Tariffs can also be imposed on exports. Tariffs give a price advantage to similar local goods and raise revenue for governments, as market access is conditional upon the payment of the custom duty. In addition, a tariff can be used to promote a rational allocation of scarce foreign exchange. Tariffs can be specific, ad valorem, or mixed. A specific tariff is an amount based on the weight, volume or quantity of product, for example, US$ 7 per kilo. Ad valorem tariffs refer to the tax levied as a percentage of value, for example, a 7% duty on cars. So the duty on a car worth US$ 7,000.00 would be US$ 490.00. A mixed or compound tariff is the combination of a specific and an ad valorem tariff (WTO, 2010).
5.1. 15.5.1. Negotiations on tariff reductionThe WTO does not prohibit the use of tariffs, however, there is the recognition that they often constitute obstacle to trade, hence there is the obligation on Members to negotiate on tariff reductions. Current negotiations under the Doha Development Agenda focus on the reduction of tariffs in agriculture and non-agricultural market access (NAMA).One result of the Uruguay Round was countries’ commitments to cut tariffs and to “bind” their customs duty rates. A “bound” tariff is a tariff for which there is a legal commitment not to raise it above the bound level. The bound level of the tariff is maximum level of customs duty to be levied on products imported into a Member. Each Member is responsible for negotiating its "bound levels" (maximum levels of tariffs to be
Created by XMLmind XSL-FO Converter.
15. INTERNATIONAL AGRICULTURAL TRADE:
WORLD TRADE ORGANIZATION (WTO)
collected at the border). The “bound levels” are agreed upon during “market access negotiations”, which are often bilateral but which sometimes are determined by “target levels” or reduction objectives that are to be met by “tariff cuts”. A bound tariff can differ from an applied tariff as a Member can apply a different (lower) tariff than that which it committed to apply as a maximum. Members can apply lower customs duties (“applied tariff level”) but they cannot apply customs duty at a level higher than that in their Schedule of Tariff Concession
5.2. 15.5.2. National tariffsThe word “tariff” also has a second meaning. It sometimes refers to a structured list of products description and their corresponding customs duties. Most “national tariffs” reflect the structure in the Harmonized Commodity Description and Coding System (HS) an international commodity classification system. This comes from the International Convention on the Harmonized Commodity Description and Coding System which entered into force on 1 January 1988 and to which most WTO Members are a party.
5.3. 15.5.3. Other duties and chargesAs you studied earlier, the “protection” that may be granted to domestically produced goods vis à vis imported products should consist of “ordinary customs duties”, often referred to as “tariffs”. Other duties and charges (ODCs) may be imposed in addition to the “ordinary customs duty”. In such circumstances, charges can exceed the “bound level” inscribed in the Schedule of Tariff Concessions. However, for ODCs to be applicable, they must be registered in the Schedule and they must not exceed the level recorded in the schedules.
Examples of these ODCs are:
• import surcharges, i.e. a duty imposed on an imported product in addition to the ordinary custom1s duties;
• security deposits to be made on the importation of goods;
• a statistical tax imposed to finance the collection of statistical information; and
• -a customs fees charged for processing the goods.
They are exceptions to the rule that one might not impose other duties and charges in excess of the recorded level.
Members may impose on imported products:
• any financial charge not in excess of the internal tax imposed on the like domestic product;
• WTO consistent anti-dumping duties; safeguards duties; countervailing duties;
• and fees or other charges commensurate with services rendered (examples of the above are: consular transactions (such as invoices and certificates), quantitative restrictions, licensing, exchange control, statistical services, documents, documentation, and certification, analysis and inspection, quarantine, sanitation and fumigation. Internal taxes, anti-dumping and countervailing duties, and customs fees imposed in addition to the bound rate must also respect specific rules in GATT).
6. 15.6. Non-tariff barriersNon-tariff barriers may also restrict market access of goods (WTO, 2010). They include quantitative restrictions (such as quotas) and other non-tariff barriers (for example, lack of transparency of trade regulation, unfair and arbitrary application of trade regulation, customs formalities, technical barriers to trade and government procurement practices).
6.1. 15.6.1. Quantitative restrictionsQuantitative restrictions on imports are a ban on imports (or exports) after a determined quantity (the quota) has entered the territory. Only import duties can be used to regulate goods trade at customs. A WTO Member cannot, as a general rule, impose import or export prohibitions or restrictions in quantities or value on the goods
Created by XMLmind XSL-FO Converter.
15. INTERNATIONAL AGRICULTURAL TRADE:
WORLD TRADE ORGANIZATION (WTO)
of another Member. The only protective barriers that WTO Members can institute or maintain are “duties, taxes or other charges” compatible with the GATT rules. The general prohibition on quantitative restrictions applies equally to import and export measures.
State trading enterprises (Article XVII) are also prohibited from imposing quantitative restrictions. Quantitative restrictions must be imposed on a non-discriminatory basis. In other words, the Member imposing the quantitative restrictions is not allowed to favour any country over another. This provision focuses on the allocation of quotas between exporting Members and aims to ensure that when imposed, quantitative restrictions do not distort ordinary trade flows. It means that quotas should be applied equally to goods from all origins and their allocations should correspond as closely as possible to the expected market shares that would have existed in the absence of quotas.
One must distinguish between quotas – which are generally prohibited – and tariff-rate quotas (TRQs). TRQs are predetermined quantities of goods which can be imported at a “preferential” rate of customs duty (“in quota Tariff Rate”). Once the TRQ has been filled, one can continue to import the product without limitation – so it is not a quantitative restriction in the sense of GATT, but at a higher tariff rate (“out-of-quota Tariff Rate”). The “out-of-quota Tariff Rate” is generally the MFN rate. In a TRQ, specific quantities of goods may be imported at different tariff levels. TRQs should be applied similarly to products from all origins, but allocations should also respond as closely as possible to the expected markets share that would have existed in the absence of TRQs.
This is what a tariff-quota might look like (Figure 1). Imports entering under the tariff-quota (up to 1,000 tons) are generally charged 10%. Imports entering outside the tariff-quota are charged 80%. Under the Uruguay Round agreement, the 1,000 tons would be based on actual imports in the base period or an agreed “minimum access” formula. Tariff quotas are also called “tariff-rate quotas”.
15.1. ábra - Figure 1: Tariff-Quota
Source: WTO (2010)
6.2. 15.6.2. Specific exceptionsThe specific exceptions to the general prohibition against the use of quantitative restrictions are to prevent critical shortage of foodstuffs or other essential products. The exception creates a quasi-general derogation for agricultural policies and measures relating to fishery products constituted the essential provision which led to “special treatment” for agriculture. The “agricultural exception” ended when the WTO Agreement on Agriculture entered into force in 1995. Under the WTO, quantitative restrictions remain possible only on fishery products.
6.3. 15.6.3. Other non-tariff barriersIn addition to customs duties and other charges (tariff barriers), and quantitative restrictions, trade in goods may also be impeded by other non-tariff barriers, such as: (1) technical barriers to trade, which can be divided in to (a) sanitary and phytosanitary measures covered by the Agreement on the Application of Sanitary and Phytosanitary Measures (the “SPS Agreement”) and (b) the general category of technical barriers to trade set out in the Technical Barrier (“TBT”) Agreement; (2) customs formalities and procedures, (3) and government procurement practices. Lack of transparency, unfair and arbitrary application of trade measures, customs formalities and procedures, and other measures or actions such as pre-shipment inspection, marks of origin, and measures relating to transit shipments, as well as other forms of inaction (failure to inform about applicable
Created by XMLmind XSL-FO Converter.
15. INTERNATIONAL AGRICULTURAL TRADE:
WORLD TRADE ORGANIZATION (WTO)
trade laws, regulations, procedures and practises, timely and accurately) may constitute a barrier to trade.
7. 15.7. Technical regulations and standardsTechnical regulations and industrial standards are important, but they may vary from country to country. If the standards are set arbitrarily, they could be used as an excuse for protectionism and can become obstacles to trade. The TBT Agreement tries to ensure that regulations, standards, testing and certification procedures do not create unnecessary obstacles to trade. The TBT Agreement recognizes WTO Members' rights to adopt the standards they consider appropriate – for example to protect human, animal or plant life or health, the environment or to meet other consumer interests. It does not prevent Members from taking measures necessary to ensure their standards are met (WTO, 2010).
7.1. 15.7.1. Sanitary and phytosanitary measuresSanitary (human and animal health) and phytosanitary (plant health) measures can take many forms, such as, requiring products to come from a disease-free area, inspection of products, setting of allowable maximum levels of pesticide residues or permitted use of only certain additives in food. They apply to domestically produced food or local animal and plant diseases, as well as to products coming from other countries. The SPS Agreement entered into force in 1995 goes beyond the general principle of non-discrimination. The SPS Agreement builds on previous GATT rules to restrict the use of unjustified sanitary and phytosanitary measures for the purpose of trade protection and sets out the basic rules for food safety and animal and plant health standards.
It still allows countries to use different standards and different methods of inspecting products. However, it tries to ensure that sovereign rights are not misused for protectionist purposes and do not result in unnecessary barriers to international trade. It also says regulations must be based on science and that they should be applied only to the extent necessary to protect human, animal or plant life or health. Furthermore, SPS measures should not arbitrarily or unjustifiably discriminate between countries where identical or similar conditions prevail (Figure 2).
15.2. ábra - Figure 2: TBT and SPS measures relating to the international trade of oranges
Source: WTO (2010)
There are general as well as security exceptions relating to goods, services and intellectual property. For example, Members are allowed to take measures necessary for overriding policy concerns, including the protection of public morals or the protection of human, animal or plant life or health. However, such measures must not lead to arbitrary or unjustifiable discrimination or constitute a disguised restriction to trade. If essential security interests are at stake, GATS Safeguard measures are taken to confront unforeseen circumstances. GATS rules on safeguards allow for the introduction of temporary restrictions to safeguard the balance-of-payments; and a so-called “prudential carve-out” in financial services permits Members to take measures in order, inter alia, to ensure the integrity and stability of their financial system.
Created by XMLmind XSL-FO Converter.
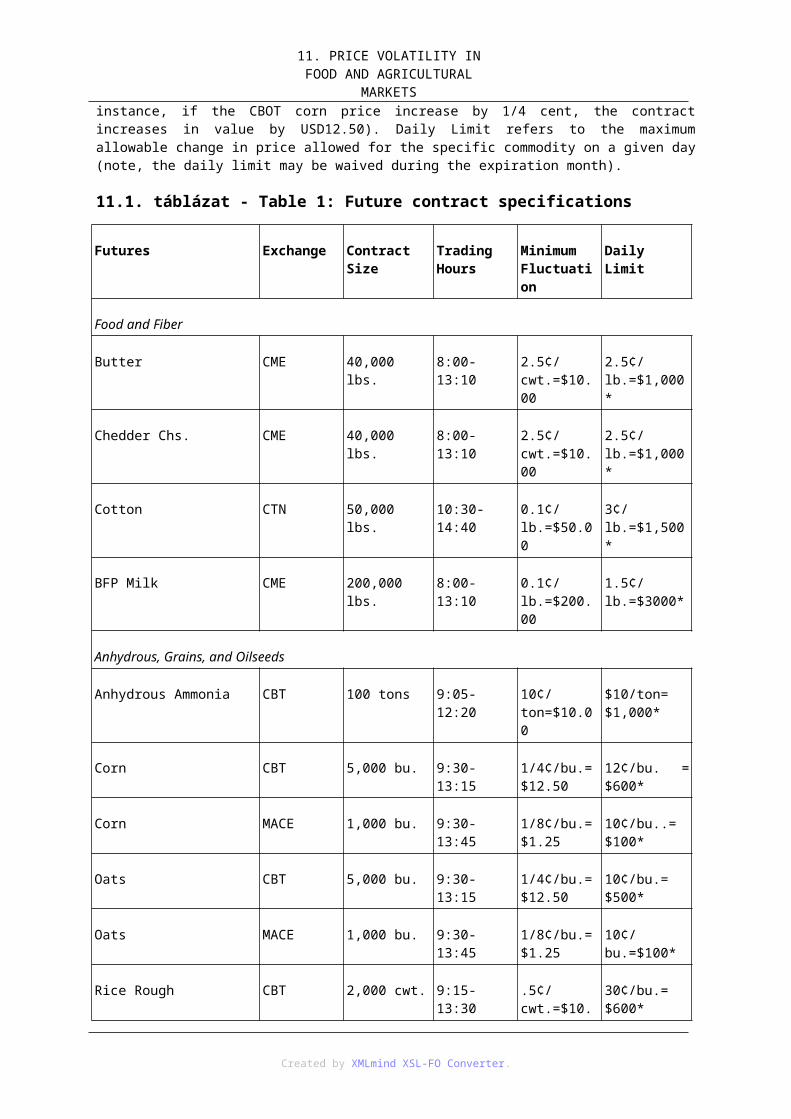
15. INTERNATIONAL AGRICULTURAL TRADE:
WORLD TRADE ORGANIZATION (WTO)
8. 15.8. General safeguardsA WTO member may impose a safeguard measure (i.e.), temporarily restrict imports of a product) to protect a domestic industry from an increase in imports of a product which causes or threatens to cause serious injury to the domestic industry. Safeguard measures were always available under the GATT. However, they were infrequently used, and some governments preferred to protect their industries through “grey area” measures (for example, “voluntary” export restraint arrangements on products such as cars, steel and semiconductors)
9. 15.9. WaiversGeneral exceptions, security exceptions and safeguards are not the only provisions which Members can use to maintain measures inconsistent with the WTO principles. They can also derogate from their obligations where they obtain waivers. A waiver is a permission granted by WTO Members allowing another WTO Member to not comply with its normal commitments. Waivers are time-bound. They have time limits and extensions have to be justified (WTO, 2010).
10. 15.10. Dispute settlementWTO Members can settle their disputes in four ways: (i) consultation or negotiations; (ii) adjudication by panels and the Appellate Body (in cases where there is an appeal); (iii) arbitration; and (iv) good offices, conciliation and mediation. The dispute settlement system is based on clearly defined rules, with timetables for completing a case. Rulings are first made by a panel and appeals based on points of law are possible. Rulings made by a panel can be appealed to the Appellate Body (WTO, 2010).
11. 15.11. Agreement on AgricultureThe results of the Uruguay Round provide a framework for the long-term reform of agricultural trade and domestic policies. The Agreement on Agriculture reflects the compromises made to satisfy the multiple negotiating interests in the Uruguay Round (WTO, 2010). The new rules and commitments apply to market access, domestic support and export competition. It includes provisions that limit the use of distorting domestic support policies, export subsidies and subjected these limits to reductions. The Agreement on Agriculture does allow governments to support their rural economies, but preferably through policies that cause a minimal or none distortion to trade (Duponcel, 2000).
In 1995, the year that the WTO was established, the first effective rules governing international trade in agriculture and food were introduced. Following the Uruguay Round negotiations, all agricultural products were brought under multilateral trade rules by the WTO’s Agreement on Agriculture. The Agreement is made up of three ”pillars”: market access, export competition and domestic support. All WTO members, except least developed countries (LDCs), were required to make commitments in all these areas in order to liberalise agricultural trade. As can be seen in the box below, developing countries were given a limited element of special and differential treatment (S&DT).
Developing countries do not have to cut their subsidies or lower their tariffs as much as developed countries, and they are given extra time to complete their obligations. Least-developed countries do not have any reduction commitments. Special provisions deal with the interests of countries that rely on imports for their food supplies, and the concerns of least-developed economies. The Agreement on Agriculture also includes a “Peace Clause” which was designed to reduce the likelihood of disputes or challenges on agricultural subsidies over a period of nine years. This provision expired at the end of 2003. The Agreement on Agriculture includes a commitment to continue the reform through new negotiations. These were launched in 2000 and continue as part of the Doha Development Agenda (Table 1).
15.1. táblázat - Table 1: The reductions in agricultural subsidies and protection agreed in the Uruguay Round
Developed countries 6 years: 1995–2000
Developing countries 10 years: 1995–2004
Created by XMLmind XSL-FO Converter.
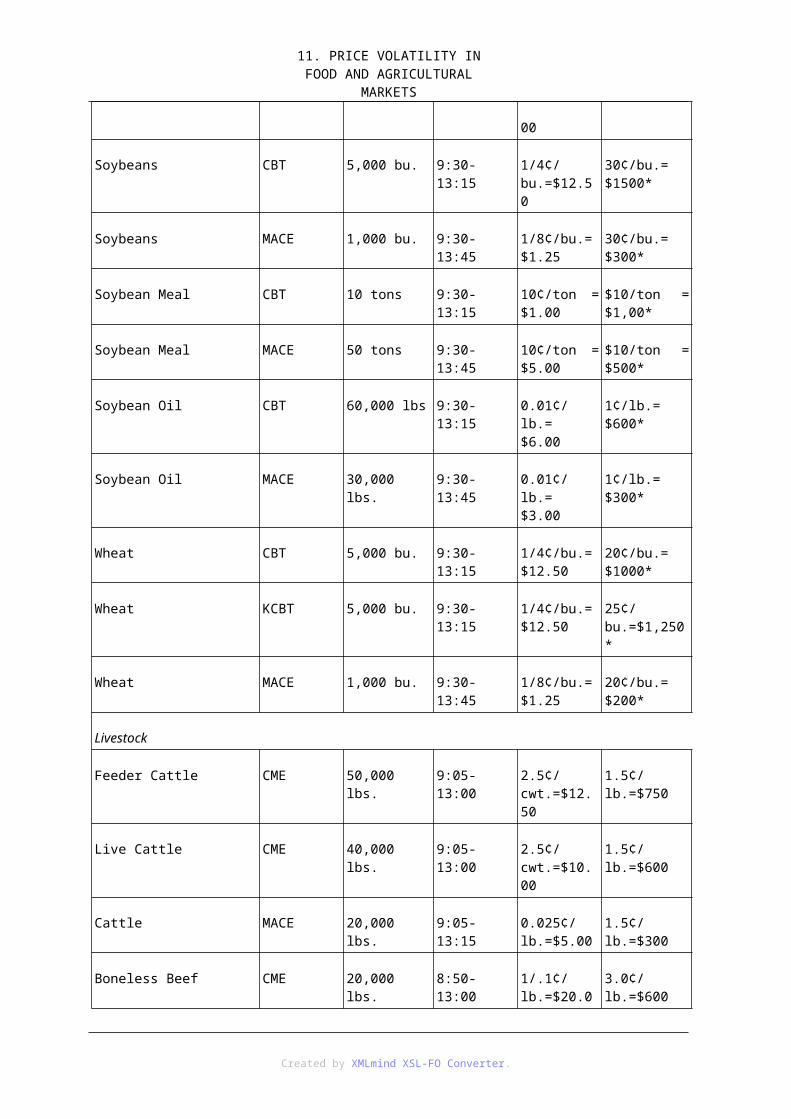
15. INTERNATIONAL AGRICULTURAL TRADE:
WORLD TRADE ORGANIZATION (WTO)
Tariffs
average cut for all agricultural products
–36% –24%
minimum cut per product –15% –10%
Domestic support
cuts in total ("AMS") support for the sector
–20% –13%
Exports
value of subsidies (outlays) –36% –24%
subsidized quantities –21% –14%
Notes: Least-developed countries do not have to reduce tariffs or subsidies. The base level for tariff cuts was the bound rate before 1 January 1995; or, for unbound tariffs, the actual rate charged in September 1986 (when the Uruguay Round began).
Source: WTO (2010)
11.1. 15.11.1. TarificationThe calculation of the tariff equivalents, whether expressed as ad valorem or specific rates, shall be made using the actual difference between internal and external prices in a transparent manner.
For example:
Bound tariff is the price-gap between the internal price and external price, that is:
Internal Price = USD250/tonne = representative wholesale price; and
External Price = USD200/tonne = average c.i.f. unit value for 1986-1988
--> Price Gap = USD50/tonne or 25%
--> Tariff = USD50/tonne; or = 25%; or = USD25/tonne + 12.5%; or etc.
11.2. 15.11.2. Bindings and reductionsOnce tariffs were fixed, Members undertook to apply reductions. These reductions are based on a simple average of 36% and a minimum of 15% over six years (1995-2000) for developed countries and a simple average of 24% and a minimum of 10% over ten years (1995-2004) for developing countries. Developing countries that adopted ceiling bindings did not have to reduce their tariffs, except on an ad-hoc basis. Least-developed countries did not have to reduce tariffs whether or not they adopted ceiling-bindings.
11.3. 15.11.3. Tariff-rate quotasIt was foreseen that the conversion of non-tariff measures into tariffs using the 1986 to 1988 reference period could result in high tariff levels, as it was intended to result in a level of protection equivalent to the non-tariff measure previously in force. However, in many cases some imports were allowed in and these “current access” opportunities had to be maintained and, if necessary, increased to 3% of corresponding domestic consumption rising to 5% of domestic consumption by the end of the implementation period. In cases where no significant
Created by XMLmind XSL-FO Converter.
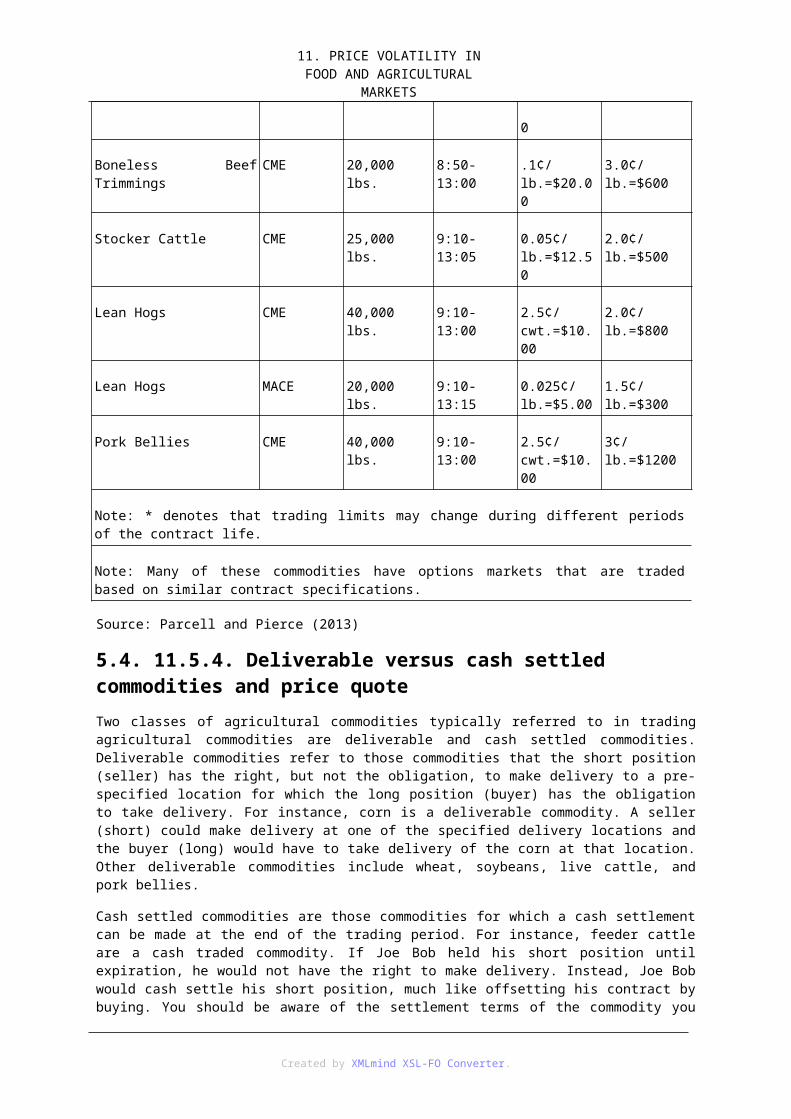
15. INTERNATIONAL AGRICULTURAL TRADE:
WORLD TRADE ORGANIZATION (WTO)
quantities were imported a “minimum access commitment” had to be created starting at 3% of domestic consumption and increasing to 5% over the implementation period.
Least developed countries and developing countries with ceiling bindings did not have to create market access opportunities. The current and minimum access commitments were implemented by tariff-rate quotas (TRQs), which allow imports at low tariff rates up to a certain volume. A TRQ is a two level tariff (Figure 1). A lower tariff (in-quota) rate is charged on the imports within the quota volume and a higher tariff (over-quota) rate is charged on the imports outside the quota TRQs, including the applicable tariff rates and any other conditions related to them, are specified in the Schedules of the WTO Members concerned. Over 40 WTO members currently have a combined total of 1,425 tariff quotas in their commitments.
11.4. 15.11.4. The boxesIn WTO terminology, domestic subsidies are classified in “boxes”. Originally, these were meant to have the colours of traffic lights: green (permitted), amber (slow down – i.e. be reduced), red (forbidden). The Agreement on Agriculture has no Red Box, although domestic support exceeding the reduction commitment levels in the Amber Box is prohibited; and there is a Blue Box for subsidies that are tied to programmes that limit production. There are also exemptions for developing-country Members (normally called "S&D Box"). And there is a Green Box for subsidies that cause no more than minimal trade distortion.
11.5. 15.11.5. Green box
In order to qualify for the Green Box, a subsidy programme must not have more than a minimal trade-distorting effect or effect on production. In addition, such measures have to be government-funded and must not involve price support. Green Box programmes tend to be those that are not targeted at particular products, and include general services, such as research, pest and disease control or marketing and promotion services, as well as certain direct payments to producers, such as income supports for farmers that are not related to (are “decoupled” from) current production levels or prices. They also include structural adjustment assistance, payments under environmental programmes and regional assistance programmes. Green Box subsidies are therefore allowed without limits.
11.6. 15.11.6. Amber box
All domestic support measures considered to distort production and trade, with the exception of some measures, fall into the Amber Box and are subject to limits. These include measures to support prices, input subsidies or subsidies directly related to production quantities. In fact, any domestic support that cannot be included in the categories exempt from reduction, has to be accommodated within the ceilings set by the Total Aggregate Measurement of Support (Total AMS) and/or the de minimis provisions of the Agreement. The Total AMS includes all support provided on either a product-specific or non-product-specific basis and is to be reduced during the implementation period. In the case of Members with no scheduled reduction commitments, any domestic support not covered by the exempt categories must be maintained within the relevant product-specific and non-product-specific de minimis levels.
11.7. 15.11.7. Blue box
Created by XMLmind XSL-FO Converter.
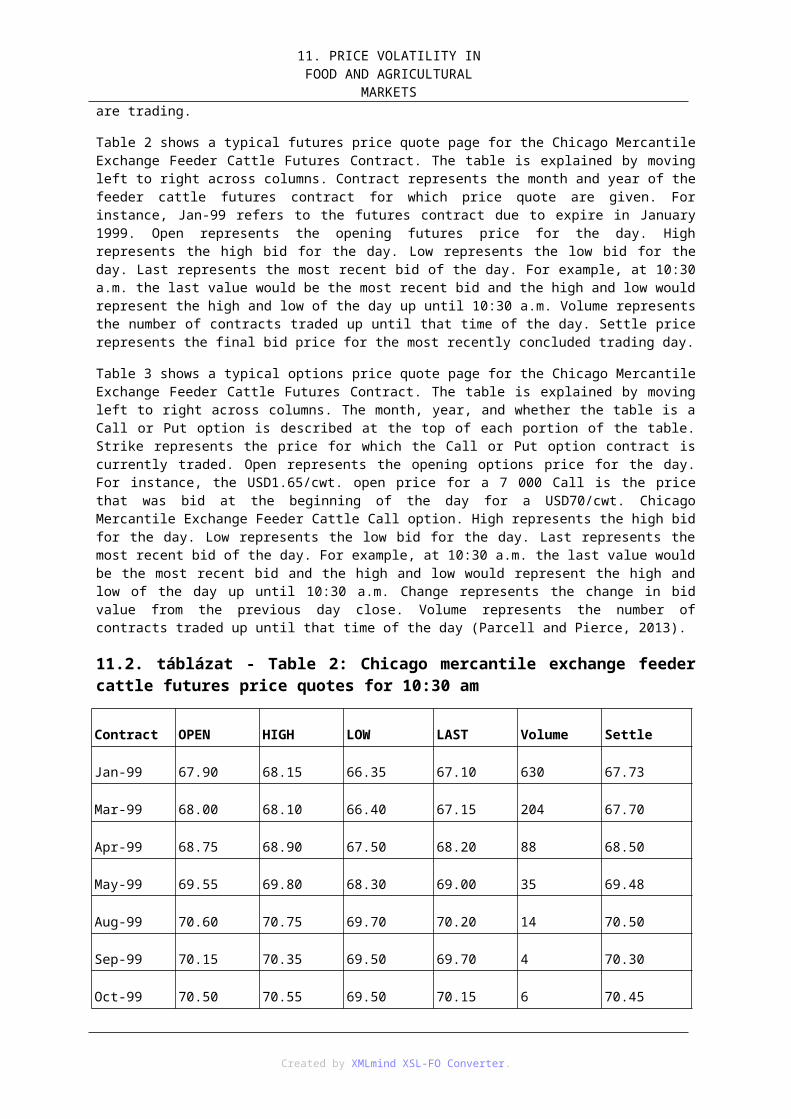
15. INTERNATIONAL AGRICULTURAL TRADE:
WORLD TRADE ORGANIZATION (WTO)
This is the “amber box with conditions” — for certain supports that are part of production limiting programmes. At present, there are no limits on spending on Blue Box subsidies (Table 2).
15.2. táblázat - Table 2: Domestic support structure
Exemption from Reduction Commitments
(1) Green Box Annex 2 No more than minimally trade or production distorting
(2) Blue Box Article 6.5 Production-limiting Programmes
(3) Development Programmes Article 6.2 Investment, Input, Diversification
Reduction Commitments & de minimis allowance
Amber Box Articles 3&6 Reduction Commitments, de minimis
Article 7 General Disciplines
Annex 3 Aggregate Measurement of Support
Annex 4 Equivalent Measurement of Support
Source: WTO (2010)
11.8. 15.11.8. De minimisSupport within de minimis levels is also exempt from reduction commitments. The related provisions of the Agreement on Agriculture will be taken up in conjunction with the Total AMS. De minimis is a concept in the Agreement on Agriculture that exempts relatively small amounts of Amber Box support from the Total AMS commitment.
When commitments were established in the Uruguay Round, Members were not required to include in their Total AMS the value of support during the base period 1986-88 that was within the following de minimis levels (Figure 1).
• product-specific support that did not exceed 5% of the total value of production of the basic agricultural product in question; and
• non-product-specific support that did not exceed 5% of the value of total agricultural production.
In the case of developing country Members, the de minimis threshold is 10%.
15.3. ábra - Figure 1: Amber Box and de minimis: Current Total Aggregate Measurement of Support
Created by XMLmind XSL-FO Converter.
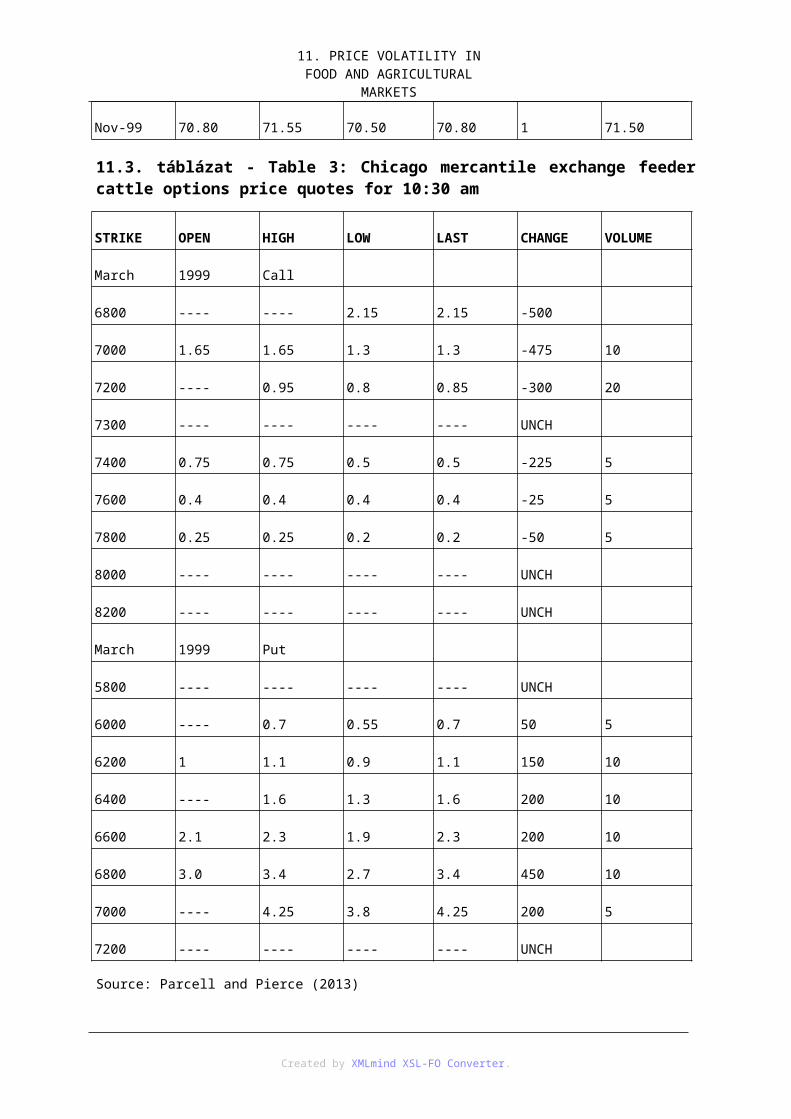
15. INTERNATIONAL AGRICULTURAL TRADE:
WORLD TRADE ORGANIZATION (WTO)
Source: WTO (2010)
11.9. 15.11.9. Export competitionThe proliferation of export subsidies in the years leading to the Uruguay Round was one of the key issues addressed in the agriculture negotiations. The rules on agricultural subsidies are found in both the Agreement on Agriculture and the Agreement on Subsidies and Countervailing measures (SCM Agreement). The negative effects of export subsidies on agriculture have been analyzed by international organizations, many WTO Members, as well as independent economists and academic institutions. Exporters that receive export subsidies enjoy an advantage, since they can for example, sell below the cost of production. In most cases the subsidy depends on the difference between the world and domestic prices, which means that the exporter can always match or undercut exporters in other countries. This in turn increases competition for other exporters or for domestic producers in the importing country.
In addition to reducing prices and undercutting unsubsidised exporters in other countries, export subsidies also amplify world market price variations. As the level of subsidy usually depends on the difference between domestic and world market prices, if world market prices fall the subsidy increases and supply from the subsidised exporter can remain the same, or even increase. In addition, supply from the subsidising country is not affected by market prices as the subsidy increases or decreases as prices fall or rise. This exaggerates the swings in world prices by reducing supply in times of high prices and increasing it in times of low prices.
On average export subsidies lead to declining food prices. This hurts vulnerable producers in developing countries. However, most of the export subsidies are granted to temperate products like dairy and cereals. Therefore, it could be argued that consumers in net-food-importing developing countries benefit from the lower food prices although producers in these countries will suffer from the increase in subsidised. The Agreement on Agriculture provides that the level of export subsidies cannot be increased and that the existing level of subsidies could continue subject to conditions and the commitments to reduce (1) subsidized export quantities, and (2) the amount of money spent subsidizing exports.
The SCM Agreement is also applicable to agricultural products. However, Members also agreed that the provisions of the SCM Agreement on export subsidies would apply “except as provided in the Agreement on Agriculture”. In addition, provided a Member’s use of export subsidies was within its commitments, the “Due Restraint” clause of the Agreement on Agriculture restricted other Members rights to challenge these subsidies until the end of 2003. At the 6th Ministerial Conference held in Hong Kong in 2005, WTO Members agreed to eliminate agricultural export subsidies by 2013, as part of the single undertaking and subject to the parallel elimination of all forms of such subsidies.
SCM Agreement prohibits subsidies contingent in law or fact on export performance, except as provided for in the Agreement on Agriculture. The SCM Agreement1 added precision to the rules, for example, it defined subsidies for the first time and further elaborated on subsidy disciplines, classifying subsidies into three categories (prohibited, actionable and non-actionable). It also developed definitions, concepts and methodologies relating to adverse effects, and established procedural rules for multilateral remedies. The
11 The use of export subsidies is prohibited except those provided within the framework of the Agreement on Agriculture. Article 3 (Prohibition) of the WTO Agreement on Subsidies and Countervailing Measures stipulates that, "Except as provided in the Agreement on Agriculture…", export subsidies and subsidies contingent upon the use of domestic products over imported goods are prohibited.
Created by XMLmind XSL-FO Converter.
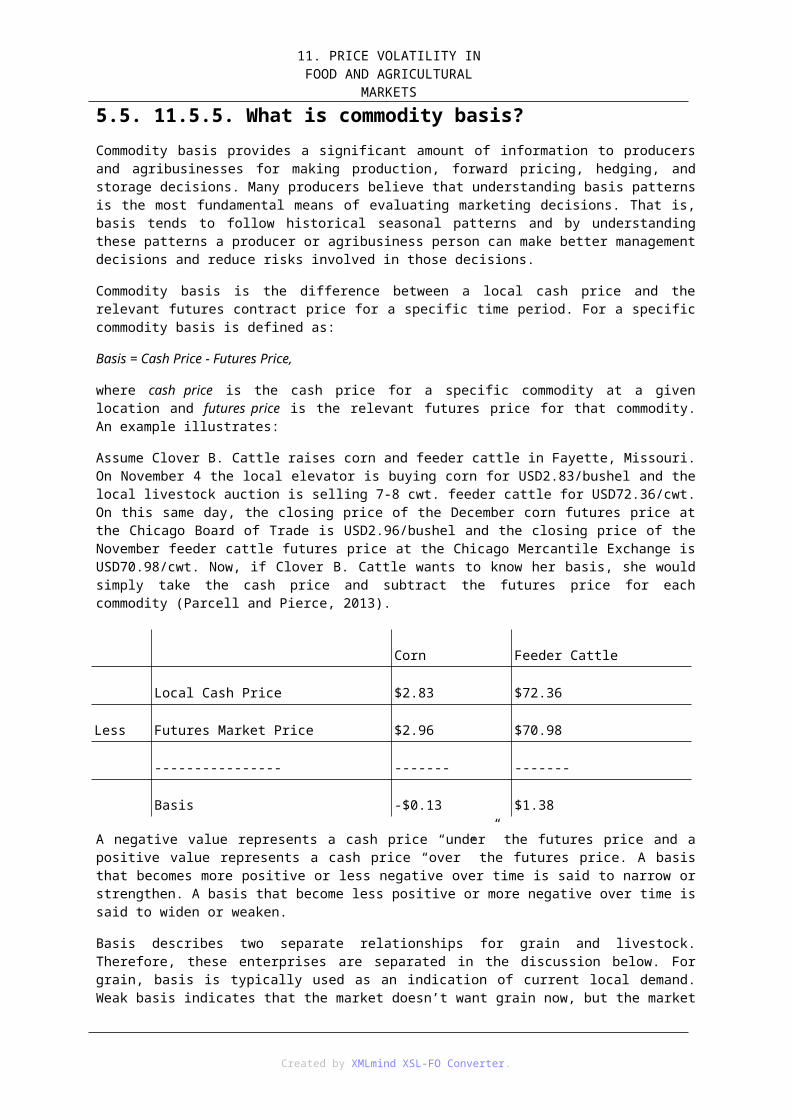
15. INTERNATIONAL AGRICULTURAL TRADE:
WORLD TRADE ORGANIZATION (WTO)
SCM Agreement also expanded and developed existing procedural and substantive rules on the use of countervailing measures.
The Agreement on Agriculture permits export subsidies on agriculture subject to the limits set out in Members’ Schedules of Commitments and the rules of the Agreement. Export subsidies can still be used by WTO Members, but only where they used them during the base period (1986-1988). However, although a subsidy is legal it may cause or threaten to cause harm to another Member. In these cases it may be possible to seek some of the remedies set out in the SCM Agreement. The Agriculture Agreement does not contain any definition of the term “subsidy”.
Under the SCM Agreement, a subsidy exists if:
• there is a financial contribution by a government or any public body within the territory of a Member;
• there is any form of income or price support in the sense of the GATT 1994; a benefit is thereby conferred.
A subsidy arises when:
• “financed” or a “financial contribution” do not necessarily mean a direct payment of monies, they can also cover cases where someone gets a benefit as a result of a government programme.
• A subsidy can exist even where the benefit is granted not directly by the government but by virtue of government action.
11.10. 15.11.10. Anti-circumventionIt must also be noted that exports can be supported in many different ways and that direct aid by governments is only one of these methods. Governments can also provide support to exports through export credits which offer the purchasing government or enterprise lower interest rates or easier terms than commercial banks. A state trading enterprise may also have access to government-guaranteed loans or government investments which enable it to undercut the competition. Food aid can also be used as a way to dispose of surplus stocks. In some cases, food aid could displace commercial trade in the receiving country rather than contributing to alleviation of hunger.
Export credits may also distort export competition, when the credit conditions are more favourable than those that private financial institutions would provide. Exporting state trading enterprises or single-desk traders may cross-subsidise, which would also distort trade, or have access to government guaranteed borrowing, giving them cheaper access to capital. Finally, food aid may be used as a surplus disposal instrument and disrupt or displace commercial transactions.
Food aid is a very sensitive and complex issue. In many cases it is vital for delivering food in urgent situations, where the government of the recipient country has declared an emergency and people would starve if aid were not delivered. In other cases, such as after the crisis and during the recovery period, food aid may be needed to address chronic shortages. However, there are also cases where food aid is used to dispose of surpluses in the donor country.
From the perspective of commercial trade there are two types of food aid:
• one that displaces commercial exports; and
• the other that increases consumption by providing food that would not have been consumed if the aid had not been granted.
If the food aid does not result in extra consumption, displaces other exports or domestic production and is used to dispose of surpluses in the supplying country, it is essentially the same as an export subsidy. Studies have shown that a small proportion of the food aid that is currently provided is supply-driven rather than needs-based and is used as a disposal tool for domestic surpluses. The concern of WTO Members is twofold: Firstly, to ensure that an adequate level of food aid is provided and that trade rules do not cause any unintended impediment to dealing with emergency situations, and second to ensure that food aid results in additional consumption and does not cause commercial displacement.
Created by XMLmind XSL-FO Converter.
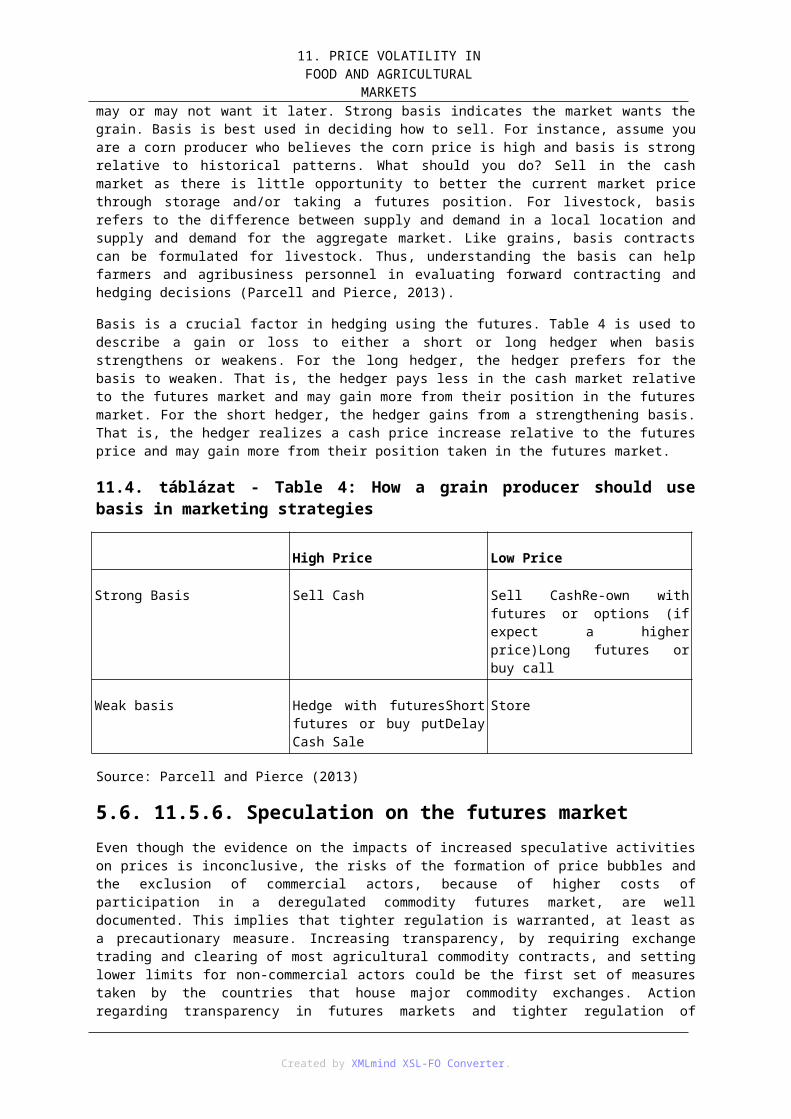
15. INTERNATIONAL AGRICULTURAL TRADE:
WORLD TRADE ORGANIZATION (WTO)
12. 15.12. WTO negotiations after 2000Negotiations on agriculture started in 2000 s were incorporated in the comprehensive round of negotiations under the Doha Development Agenda in 2001. Various deadlines for modalities were missed. First in March 2003 and then at the Cancún Ministerial Conference in September (2003). Agriculture negotiations were updated in the General Council Decision of 1st August 2004 (and advances were made in the Hong Kong Ministerial Conference in December 2005. In July 2006, negotiations were suspended. However, they restarted fully in January 2007 (WTO, 2010).
In December 2005, the Hong Kong Declaration reaffirmed Members' commitment to the development of internationally-agreed disciplines for export credits.2 Despite the lack of clear rules, any subsidy element that might exist in government-supported export credit, guarantee and insurance programmes is subject to the commitments in Members’ Schedules and the rules in the Agreement on Agriculture. In other words, no subsidy can be used to export products not listed in a Member’s Schedule nor, if there are commitments for a particular product, can it be used in a way that threatens to lead circumvention of commitments.
The draft modalities call on the developed world to provide duty- and quota-free access to LDCs, but whether this should be mandatory or voluntary is still to be negotiated. LDCs will continue to be exempt from tariff reduction commitments but the modalities paper says, LDCs are encouraged to consider making commitments commensurate with their development needs on a voluntary basis, including in response to requests from their trading partners. This sentence is still to be negotiated but is a clear indication that developed countries will put pressure on individual LDCs to lower tariffs. For all other WTO members, the tariff reductions proposed represent a compromise between the more radical Swiss formula proposed by the Cairns group and the US, and the Uruguay Round formula proposed by the EU and others.
The extent of these reductions is dependent on the current tariff levels. For example, for high tariffs of over 90% in developed countries, there would an average reduction of 60% with a minimum 45% reduction for each tariff line from the final bound level of the Uruguay Round. For tariffs between 15-90%, the respective figures would be 50% and 35% (Table 3). The proposal would mean sharp cuts in tariffs for developing as well as developed countries. Unfortunately, the modalities do not include any concrete steps to deal with non ad valorem tariffs, that is, tariffs which are not expressed as a percentage of the value of goods. These make up 42% of EU and US tariffs and 90% of Swiss tariffs.
15.4. ábra - Table 3: Reduction formula for ad valorem tariffs
Source: WTO (2010)
It is possible for prices to be high but show little variability, or to be low but variable, but in practice, price levels and volatilities tend to be positively associated. This is largely owing to low carryover, which reduces current availability, exerting upward price pressure, limiting the possibility of using inventories to respond to positive demand or negative supply shocks, and thereby increasing volatility. Regular price fluctuations – “day-to-day” or “normal” volatility – are both a typical attribute and a requisite for the functioning of competitive markets.
The essence of market functioning is that when a commodity becomes scarce its price rises, which induces a fall in consumption and signals more investment in the production of that commodity. Importantly, there is a need to
22WT/MIN(05)/DEC, paragraph 6 of the Hong Kong Ministerial Declaration.
Created by XMLmind XSL-FO Converter.
15. INTERNATIONAL AGRICULTURAL TRADE:
WORLD TRADE ORGANIZATION (WTO)
know why prices have risen to counteract the scarcity in an efficient way. But the efficiency of the price system begins to break down when economic shocks give rise to price movements that are increasingly uncertain and precipitous, and in the limit the system becomes largely redundant when prices undergo “extreme volatility” – or “crisis” to use popular terminology. Since when shocks surpass a certain critical size or threshold and persist at those levels, traditional policy prescriptions and coping mechanisms are likely to fail.
Historically, bouts of extreme volatility in global food markets have been rare. To draw the analogy with natural disasters, they typically have a low probability of occurrence but bring with them extremely high risks and potential costs to society. Being global events, they pose extreme covariate risks, and present the greatest challenge to policy-makers.
Many experts have reverted to public sector storage as a possible response to apparently inadequate private storage. However, public storage crowds out private storage so the mere introduction of a public storage programme increases the problem that it was designed to solve. Public storage is therefore costly; moreover, it is unlikely to be very effective in countering price spikes as the storage authority can only sell what it has previously bought. The knowledge that it cannot counter price spikes will leave it vulnerable to speculative attack.
13. Questions1. GATT-WTO: comparison?
2. WTO main principles?
3. How are decisions taken at WTO?
4. Structure of the Agreement on Agriculture (AoA)?
5. Uruguay Round reduction commitments?
6. Doha Agriculture Negotiations?
14. ReferencesActionAid and Azione Aiuto (2012): Foodrights. The WTO Agreement on Agriculture. www.actionaid.org
Duponcel, M. (2000): Workshop on Uruguay Round Follow-up and Multilateral Trade Negotiations on Agriculture. Prague, 10-14 January 2000. Food and Agriculture Organization of the United Nations. http://www.fao.org/ur
Wikipedia (2012): Agreement on Agriculture. http://hu.wikipedia.org/wiki/Kezd
WTO (2010): WTO E-Learning. Agriculture in the WTO. World Trade Organization. p. 286.
Created by XMLmind XSL-FO Converter.
15. INTERNATIONAL AGRICULTURAL TRADE:
WORLD TRADE ORGANIZATION (WTO)
Created by XMLmind XSL-FO Converter.