REGENTS HIGH SCHOOL EXAMINATION LIVING …REGENTS HIGH SCHOOL EXAMINATION LIVING ENVIRONMENT...
46
LIVING ENVIRONMENT The University of the State of New York REGENTS HIGH SCHOOL EXAMINATION LIVING ENVIRONMENT Wednesday, June 13, 2018 — 1:15 to 4:15 p.m., only Student Name _____________________________________________________________ School Name ______________________________________________________________ The possession or use of any communications device is strictly prohibited when taking this examination. If you have or use any communications device, no matter how briefly, your examination will be invalidated and no score will be calculated for you. Print your name and the name of your school on the lines above. A separate answer sheet for multiple-choice questions in Parts A, B–1, B–2, and D has been provided to you. Follow the instructions from the proctor for completing the student information on your answer sheet. You are to answer all questions in all parts of this examination. Record your answers for all multiple-choice questions, including those in Parts B–2 and D, on the separate answer sheet. Record your answers for all open-ended questions directly in this examination booklet. All answers in this examination booklet should be written in pen, except for graphs and drawings, which should be done in pencil. You may use scrap paper to work out the answers to the questions, but be sure to record all your answers on the answer sheet or in this examination booklet as directed. When you have completed the examination, you must sign the declaration printed on your separate answer sheet, indicating that you had no unlawful knowledge of the questions or answers prior to the examination and that you have neither given nor received assistance in answering any of the questions during the examination. Your answer sheet cannot be accepted if you fail to sign this declaration. Notice … A four-function or scientific calculator must be available for you to use while taking this examination. DO NOT OPEN THIS EXAMINATION BOOKLET UNTIL THE SIGNAL IS GIVEN. LIVING ENVIRONMENT
Transcript of REGENTS HIGH SCHOOL EXAMINATION LIVING …REGENTS HIGH SCHOOL EXAMINATION LIVING ENVIRONMENT...

LIVING ENVIRONMENT The University of the State of New York
REGENTS HIGH SCHOOL EXAMINATION
LIVING ENVIRONMENT Wednesday, June 13, 2018 — 1:15 to 4:15 p.m., only
Student Name _____________________________________________________________
School Name ______________________________________________________________
The possession or use of any communications device is strictly prohibited when taking this examination. If you have or use any communications device, no matter how briefl y, your examination will be invalidated and no score will be calculated for you.
Print your name and the name of your school on the lines above.
A separate answer sheet for multiple-choice questions in Parts A, B–1, B–2, and D has been provided to you. Follow the instructions from the proctor for completing the student information on your answer sheet.
You are to answer all questions in all parts of this examination. Record your answers for all multiple-choice questions, including those in Parts B–2 and D, on the separate answer sheet. Record your answers for all open-ended questions directly in this examination booklet. All answers in this examination booklet should be written in pen, except for graphs and drawings, which should be done in pencil. You may use scrap paper to work out the answers to the questions, but be sure to record all your answers on the answer sheet or in this examination booklet as directed.
When you have completed the examination, you must sign the declaration printed on your separate answer sheet, indicating that you had no unlawful knowledge of the questions or answers prior to the examination and that you have neither given nor received assistance in answering any of the questions during the examination. Your answer sheet cannot be accepted if you fail to sign this declaration.
Notice …
A four-function or scientific calculator must be available for you to use while taking this examination.
DO NOT OPEN THIS EXAMINATION BOOKLET UNTIL THE SIGNAL IS GIVEN.
LIVING ENVIRONMENT

Part A
Answer all questions in this part. [30]
Directions (1–30): For each statement or question, record on the separate answer sheet the number of the word or expression that, of those given, best completes the statement or answers the question.
1 Producers are generally found at the beginning of a food chain. Which statement best explains why this is true? (1) Producers are usually smaller in size than
consumers. (2) Producers do not rely on other organisms
for food. (3) There are always more consumers than
producers in food chains. (4) Consumers are always more complex organisms
than producers.
2 A lion cub resembles its parents because it inherits genes that produce (1) DNA identical to all of the DNA found in
both parents (2) proteins identical to all of the proteins found
in both parents (3) ATP identical to some of the ATP found in
each parent (4) enzymes identical to some of the enzymes
found in each parent
3 If body temperature is too high, some blood vessels increase in size and sweat glands will excrete sweat, resulting in a lower body temperature. These changes are an example of (1) a learned behavior (2) feedback mechanisms (3) an inherited disorder (4) genetic mutations
4 A farmer grows beans that he sells to local markets. Over a period of 40 years, the farmer has identifi ed the plants that produced the most beans and only used those beans to produce new plants. This procedure is part of the process of (1) selective breeding (3) replication (2) genetic engineering (4) cloning
5 Although we rely on coal, oil, and natural gas to produce energy, some environmental scientists have proposed that we use less fossil fuel. One reason to support this proposal is to (1) enable us to preserve rain forests in tropical
areas (2) help us to reduce the production of carbon
dioxide gas (3) allow us to decrease the use of fertilizers on
crops (4) encourage us to end research on wind and
water power sources
6 The diagram below represents relationships in an ecosystem.
Hawks
Mountain lions Snakes
FieldRabbits Elk mice
Trees
Shrubs Grasses
What is the primary source of energy in this environment? (1) cellular respiration in the plants (2) energy from minerals in the soil (3) fossil fuels (4) solar energy
[2]Living Environment–June ’18
7 Research has shown that treadmill training increases the number of certain energy-releasing structures in the brain cells of rats.
The cellular structures referred to in this study are most likely (1) mitochondria (3) vacuoles (2) nuclei (4) ribosomes
8 Which process must first take place in order for the proteins in foods to be used by body cells? (1) digestion (3) synthesis (2) storage (4) excretion
9 Which statement is characteristic of reproduction in humans? (1) The reproductive cells of males and females
differ in chromosome number. (2) Males and females produce gametes in the
ovaries. (3) Males and females produce the same num
ber of gametes. (4) The reproductive cycles of males and females
are regulated by hormones.
10 Which row in the chart below represents the most likely changes in the atmosphere due to widespread deforestation?
11 The chart below represents some of the events that occur during the cycling of nutrients in an ecosystem.
X
Converts
Organic Wastes
into
Compounds usable by autotrophs
Which organisms would most appropriately complete the chart when written in the circle at X? (1) producers (3) carnivores (2) herbivores (4) decomposers
Row Oxygen
Concentration
Carbon Dioxide
Concentration
(1) increases ↑ increases ↑
(2) increases ↑ decreases ↓
(3) decreases ↓ increases ↑
(4) decreases ↓ decreases ↓
Living Environment–June ’18 [3] [OVER]
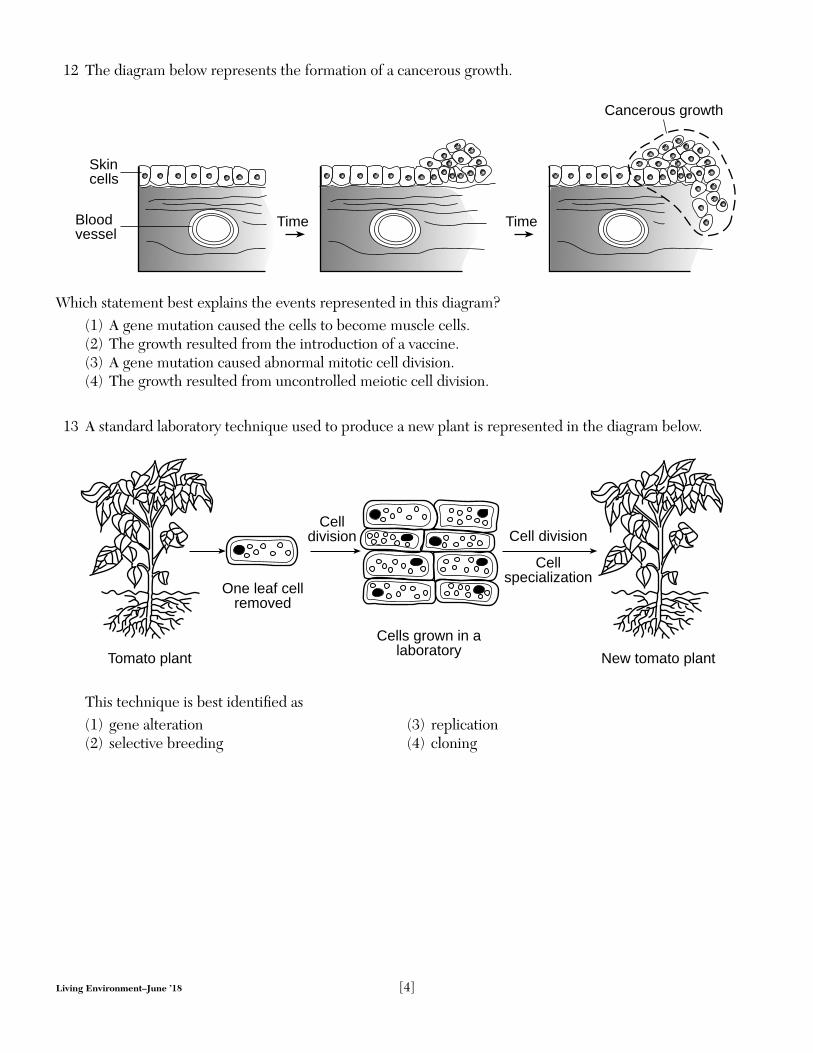
12 The diagram below represents the formation of a cancerous growth.
Time Time
Skin cells
Blood vessel
Cancerous growth
Which statement best explains the events represented in this diagram? (1) A gene mutation caused the cells to become muscle cells. (2) The growth resulted from the introduction of a vaccine. (3) A gene mutation caused abnormal mitotic cell division. (4) The growth resulted from uncontrolled meiotic cell division.
13 A standard laboratory technique used to produce a new plant is represented in the diagram below.
Cell division
One leaf cell removed
Cells grown in a
Cell division
Cell specialization
Tomato plant laboratory New tomato plant
This technique is best identifi ed as (1) gene alteration (2) selective breeding
(3) replication (4) cloning
Living Environment–June ’18 [4]

14 An example of competition between members of two different species is (1) mold growing on a dead tree that has fallen in
the forest (2) purple loosestrife plants growing in the same
wet areas as cattail plants (3) a coyote feeding on the remains of a deer that
died of starvation (4) two male turkeys displaying mating behaviors
to attract a female turkey
15 Which statement best explains why different body cells of the same individual look and function differently? (1) Each cell contains different genes. (2) Different genes are activated in different
kinds of cells. (3) Cells are able to change to adapt to their
surroundings. (4) Half of the genes in the cells came from the
mother and half from the father.
16 A diagram of the female reproductive system is shown below.
A
D
C
B
Identify the structure within which the egg cell is normally fertilized. (1) A (3) C (2) B (4) D
17 The ameba, a single-celled organism, reproduces asexually. Variations in an ameba would most commonly occur through (1) differentiation during development (2) the fusion of gametes (3) random mutations (4) recombination during fertilization
18 The development of organs and tissues from a zygote includes (1) mitosis and differentiation (2) mitosis and gamete production (3) meiosis and gamete production (4) meiosis and fertilization
19 In the 1920s, over 25 million acres of the American southern plains were stripped of prairie grasses to provide more land for farmers to grow wheat. The prairie grasses had served to hold the soil in place and prevent erosion. In the early 1930s, a series of severe dust storms eroded topsoil from more than 13 million acres of the southern plains and dumped it as tons of dust particles over many cities in the Northeast. Farmland was destroyed and people were sickened from “dust pneumonia.” This occurrence illustrates that (1) farmers should never clear land to grow crops
as it always creates problems (2) once an ecosystem has been altered, it can
not be restored to normal (3) the farmers deliberately altered the
equilibrium of the cities in the Northeast (4) when humans alter ecosystems, serious
consequences may result
20 The Cornell University News Service reported, “The sugar maple is the most economically valuable tree in the eastern United States because of its high-priced lumber, syrup and tourist-attracting fall colors.” The effects of acid rain now threaten the survival of these trees. This threat is the result of a human activity that has (1) introduced a foreign species by accident (2) stabilized a forest ecosystem through
technology (3) weakened an ecosystem through pollution (4) weakened a species by direct harvesting
21 The human male reproductive system is adapted for the production of (1) sperm and the delivery of these cells for
internal fertilization (2) gametes that transport food to the egg (3) zygotes and the development of these cells
into a fetus (4) hormones that stimulate placenta formation
in the male Living Environment–June ’18 [5] [OVER]

22 The diagram below represents an important biological technique scientists rely on to produce replacement hormones.
DNA
Human cell
DNA Bacterial cell
Specific section of human DNA
Bacterial DNA
Bacterial cell
Which two processes are required for the technique to successfully produce hormones? (1) replication of DNA in bacterial cells and cell division (2) replication of DNA in bacterial cells and gamete formation (3) meiosis and development (4) mitosis and fertilization
23 The diagram below summarizes some of the steps in the development of humans.
+
A B C D
All the genetic information needed for the organism to develop is first present at (1) A (3) C (2) B (4) D
Living Environment–June ’18 [6]
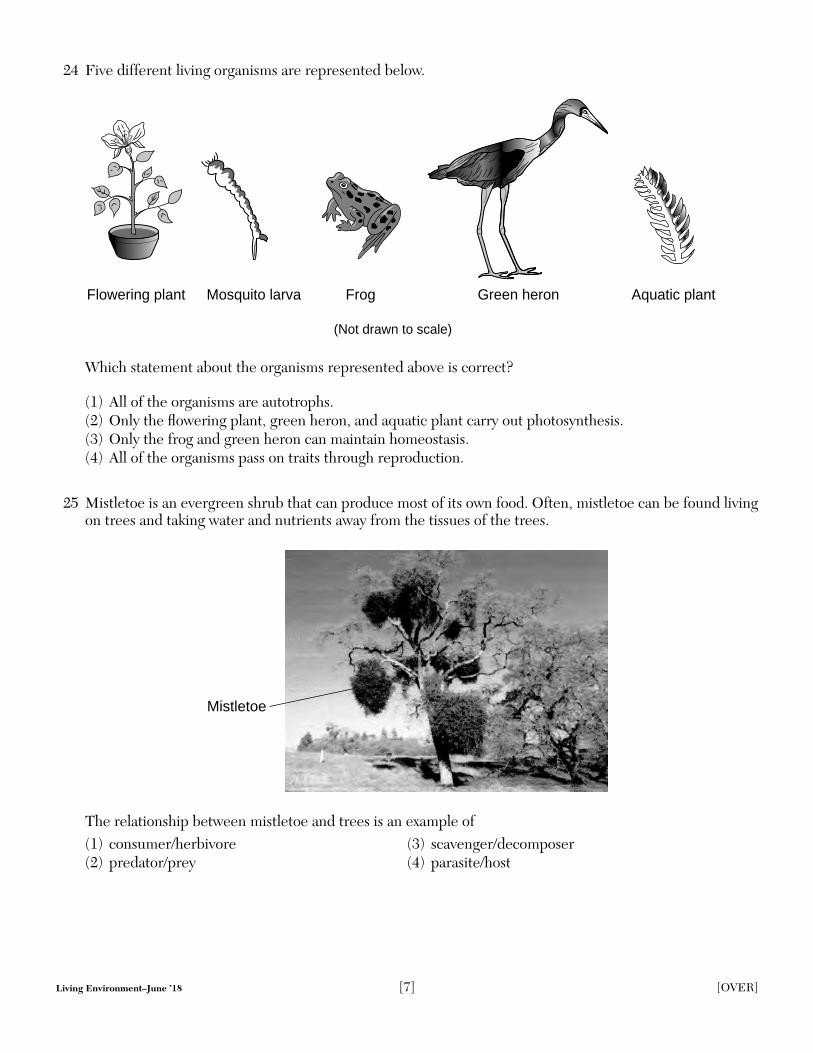
24 Five different living organisms are represented below.
Flowering plant Mosquito larva Frog Green heron Aquatic plant
(Not drawn to scale)
Which statement about the organisms represented above is correct?
(1) All of the organisms are autotrophs. (2) Only the flowering plant, green heron, and aquatic plant carry out photosynthesis. (3) Only the frog and green heron can maintain homeostasis. (4) All of the organisms pass on traits through reproduction.
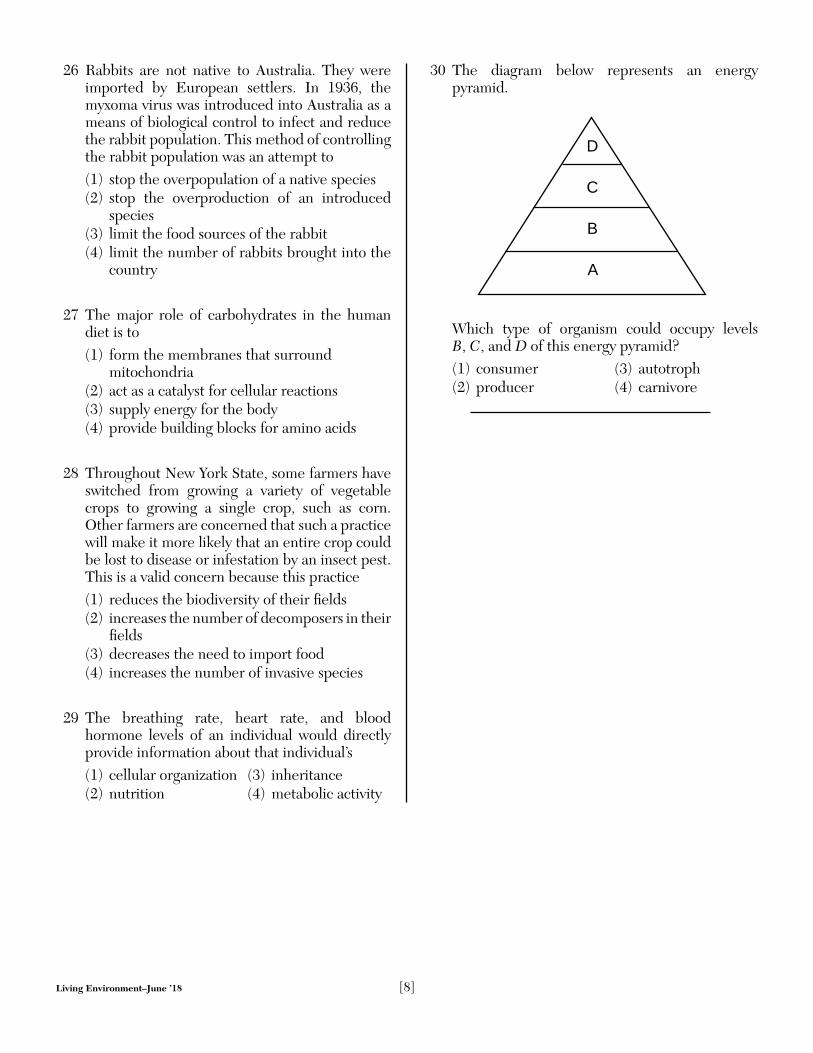
25 Mistletoe is an evergreen shrub that can produce most of its own food. Often, mistletoe can be found living on trees and taking water and nutrients away from the tissues of the trees.
Mistletoe
The relationship between mistletoe and trees is an example of (1) consumer/herbivore (3) scavenger/decomposer (2) predator/prey (4) parasite/host
Living Environment–June ’18 [7] [OVER]
26 Rabbits are not native to Australia. They were imported by European settlers. In 1936, the myxoma virus was introduced into Australia as a means of biological control to infect and reduce the rabbit population. This method of controlling the rabbit population was an attempt to (1) stop the overpopulation of a native species (2) stop the overproduction of an introduced
species (3) limit the food sources of the rabbit (4) limit the number of rabbits brought into the
country
27 The major role of carbohydrates in the human diet is to (1) form the membranes that surround
mitochondria (2) act as a catalyst for cellular reactions (3) supply energy for the body (4) provide building blocks for amino acids
28 Throughout New York State, some farmers have switched from growing a variety of vegetable crops to growing a single crop, such as corn. Other farmers are concerned that such a practice will make it more likely that an entire crop could be lost to disease or infestation by an insect pest. This is a valid concern because this practice (1) reduces the biodiversity of their fi elds (2) increases the number of decomposers in their
fi elds (3) decreases the need to import food (4) increases the number of invasive species
29 The breathing rate, heart rate, and blood hormone levels of an individual would directly provide information about that individual’s (1) cellular organization (3) inheritance (2) nutrition (4) metabolic activity
30 The diagram below represents an energy pyramid.
D
C
B
A
Which type of organism could occupy levels B, C, and D of this energy pyramid? (1) consumer (3) autotroph (2) producer (4) carnivore
Living Environment–June ’18 [8]

Part B–1
Answer all questions in this part. [13]
Directions (31–43): For each statement or question, record on the separate answer sheet the number of the word or expression that, of those given, best completes the statement or answers the question.
31 In the 1920s, two conflicting newspaper headlines called attention to a mysterious new illness.
1921–“Don’t breathe the air! Mysterious disease affecting thousands is caused by breathing the air in swamps.”
1922–“Don’t drink the water! Mysterious disease affecting thousands is caused by drinking the water in swamps.”
Another series of headlines appeared in the 1940s and 50s.
1945–“New technology finds tiny worms on swamp vegetation.” 1950–“Tiny worms found in lungs of patients suffering from mysterious swamp disease.” 1952–“Mysterious disease known to be caused by worms given name Swamp Lung
Disease.”
Headlines such as these best illustrate the concept that (1) scientific explanations are tentative and subject to change (2) some newspapers are not honest and report incorrect information on purpose (3) worms can enter the body many different ways (4) worms found in swamps should not be used for fi shing
Base your answer to question 32 on the information and diagram below and on your knowledge of biology.
In the early 1600s, a scientist planted a willow tree that weighed 5 pounds in 200 pounds of dry soil. He placed it outside and watered it for 5 years. At the end of that time, he observed that the tree had gained 164 pounds 3 ounces, while the soil had lost just 2 ounces.
Willow Willow
Dry soil Dry soil 5 years
Water only 200 lbs 199 lbs 14 oz
5 lbs 169 lbs 3 oz
32 From this, he concluded that plants gain weight from the water they take in. His conclusion was based on (1) the input of scientists from many countries doing similar studies (2) the application of advanced technologies to the study of a problem (3) careful observation, measurements, and inferences from his data (4) an extensive knowledge of the process of photosynthesis
Living Environment–June ’18 [9] [OVER]

33 A student observed five living cells in the fi eld of view of a microscope as represented below.
Diameter = 500 μm
What is the approximate diameter of one cell? (1) 10 µm (3) 250 µm (2) 50 µm (4) 500 µm
34 Ecologists are concerned that the golden-winged warbler population is at a dangerously low level. One reason this could lead to extinction of this warbler is that (1) after a species becomes extinct, it won’t be
able to carry out its role in the ecosystem (2) there may not be enough diversity among the
birds for the species to be able to survive an environmental change
(3) extinction always occurs when populations begin to decrease in number
(4) an increase in biodiversity within a population often causes the population to be classifi ed as threatened or endangered
35 One primary function of the cell membrane is (1) regulating the flow of simple sugars into or
out of the cell (2) synthesizing substances by breaking down
cell organelles (3) storing carbohydrates, water, and starches for
future use (4) digesting carbohydrates, fats, and protein
36 For several years now, there has been discussion of constructing a large oil pipeline across the United States. Which statement expresses a major concern many people are likely to have about the proposed pipeline? (1) The pipeline will bring a large number of jobs
to the area where it is being constructed. (2) The oil pipeline will increase the amount of
fi nite resources. (3) If this pipeline were to leak, the oil could
contaminate soil, water, and wildlife. (4) The pipeline is a technological fix for ozone
depletion.
37 The rings in the diagram below represent the annual growth of a tree approximately 20 years old.
Tree trunks grow wider each year by continuous growth in a thin layer of cells just beneath the bark. Since one new layer is added each year, the number of rings in a tree can be used to tell its age. The thickness of the rings provides information about the environmental conditions in past years.
By observing the annual rings in the diagram, one can infer that (1) environmental conditions did not change
over the last 20 years (2) trees grow faster on the side that faces the
Sun (3) some years provide better conditions for
growth than other years (4) tree rings are not reliable because trees must
be cut down to see them
Living Environment–June ’18 [10]
Base your answers to questions 38 through 40 on the information below and on your knowledge of biology.
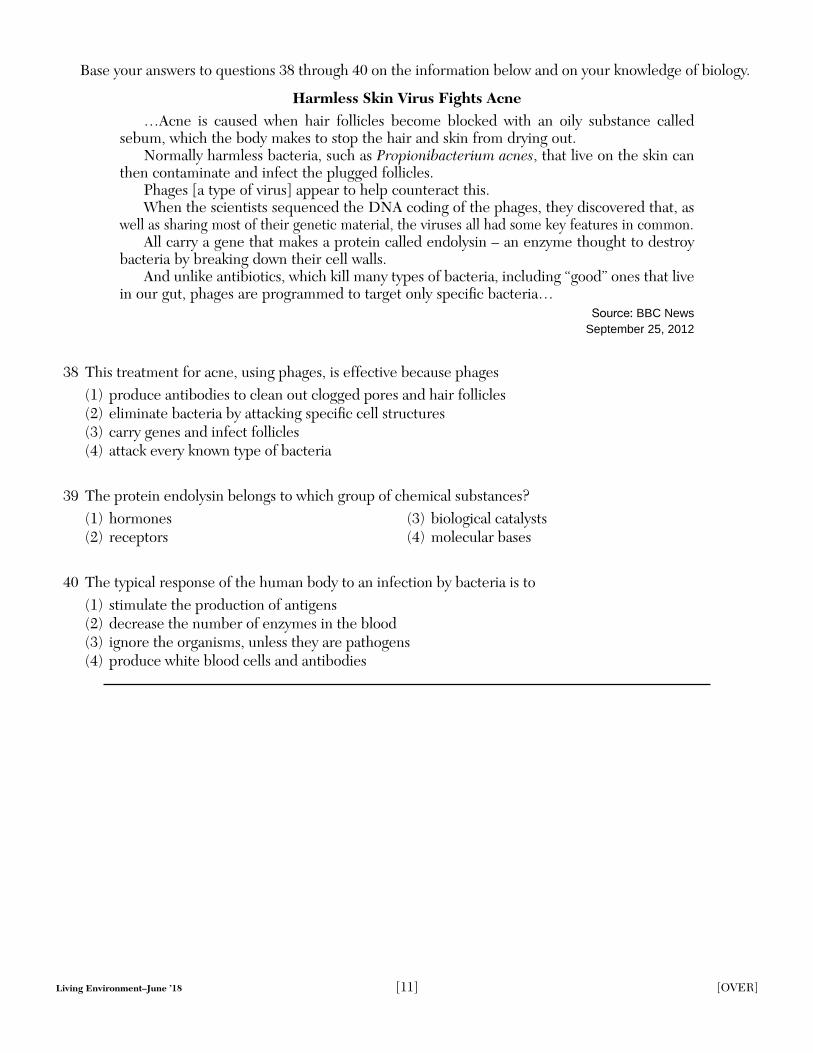
Harmless Skin Virus Fights Acne …Acne is caused when hair follicles become blocked with an oily substance called
sebum, which the body makes to stop the hair and skin from drying out. Normally harmless bacteria, such as Propionibacterium acnes, that live on the skin can
then contaminate and infect the plugged follicles. Phages [a type of virus] appear to help counteract this. When the scientists sequenced the DNA coding of the phages, they discovered that, as
well as sharing most of their genetic material, the viruses all had some key features in common. All carry a gene that makes a protein called endolysin – an enzyme thought to destroy
bacteria by breaking down their cell walls. And unlike antibiotics, which kill many types of bacteria, including “good” ones that live
in our gut, phages are programmed to target only specifi c bacteria… Source: BBC News
September 25, 2012
38 This treatment for acne, using phages, is effective because phages (1) produce antibodies to clean out clogged pores and hair follicles (2) eliminate bacteria by attacking specific cell structures (3) carry genes and infect follicles (4) attack every known type of bacteria
39 The protein endolysin belongs to which group of chemical substances? (1) hormones (3) biological catalysts (2) receptors (4) molecular bases
40 The typical response of the human body to an infection by bacteria is to (1) stimulate the production of antigens (2) decrease the number of enzymes in the blood (3) ignore the organisms, unless they are pathogens (4) produce white blood cells and antibodies
Living Environment–June ’18 [11] [OVER]

41 Two biological processes that occur in certain organelles are represented in the diagrams below.
CO2 O2 O2 CO2
Process X Process Y
Which statement is correct regarding the types of organisms able to carry out these processes? (1) Process X occurs in heterotrophs, but not in autotrophs. (2) Process Y occurs in consumers, but not in producers. (3) Both processes X and Y occur in all living things. (4) Both processes X and Y occur in green plants.
Base your answers to questions 42 and 43 on the diagram below and on your knowledge of biology. The diagram shows how ATP is used by some cell structures to perform various functions.
ATP Molecules
Mitochondria B Nucleus
Synthesis of Enzymes
C Synthesis of Molecules of
A
42 Which cell structure is represented by B? (1) vacuole (3) cytoplasm (2) ribosome (4) chloroplast
43 The nucleus contains molecules of A, which (1) recycle waste products (3) store hereditary information (2) remove water from the cell (4) regulate the pH of cytoplasm
Living Environment–June ’18 [12]

GO ON TO THE NEXT PAGE ➯
Living Environment–June ’18 [13] [OVER]
Part B –2
Answer all questions in this part. [12]
Directions (44–55): For those questions that are multiple choice, record on the separate answer sheet the number of the choice that, of those given, best completes each statement or answers each question. For all other questions in this part, follow the directions given and record your answers in the spaces provided in this examination booklet.
Base your answers to questions 44 through 47 on the information and data table below and on your knowledge of biology.
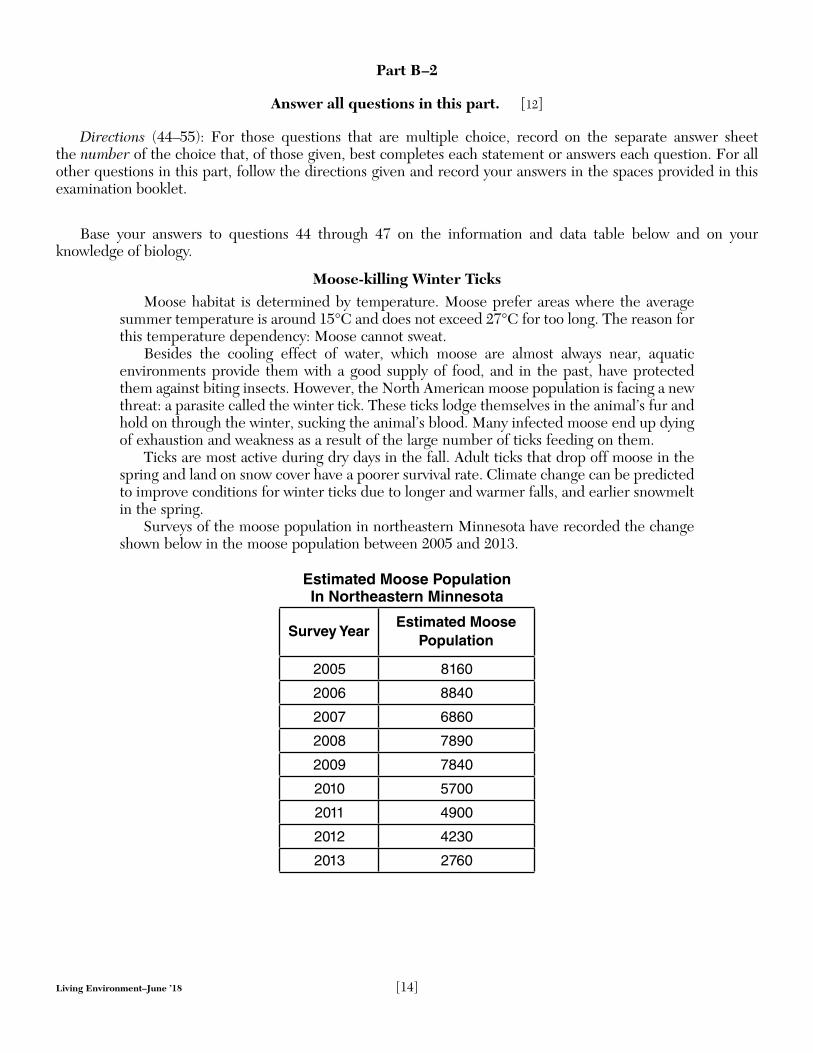
Moose-killing Winter Ticks Moose habitat is determined by temperature. Moose prefer areas where the average
summer temperature is around 15°C and does not exceed 27°C for too long. The reason for this temperature dependency: Moose cannot sweat.
Besides the cooling effect of water, which moose are almost always near, aquatic environments provide them with a good supply of food, and in the past, have protected them against biting insects. However, the North American moose population is facing a new threat: a parasite called the winter tick. These ticks lodge themselves in the animal’s fur and hold on through the winter, sucking the animal’s blood. Many infected moose end up dying of exhaustion and weakness as a result of the large number of ticks feeding on them.
Ticks are most active during dry days in the fall. Adult ticks that drop off moose in the spring and land on snow cover have a poorer survival rate. Climate change can be predicted to improve conditions for winter ticks due to longer and warmer falls, and earlier snowmelt in the spring.
Surveys of the moose population in northeastern Minnesota have recorded the change shown below in the moose population between 2005 and 2013.
Estimated Moose Population
In Northeastern Minnesota
Survey Year Estimated Moose
Population
2005 8160
2006 8840
2007 6860
2008 7890
2009 7840
2010 5700
2011 4900
2012 4230
2013 2760
Living Environment–June ’18 [14]
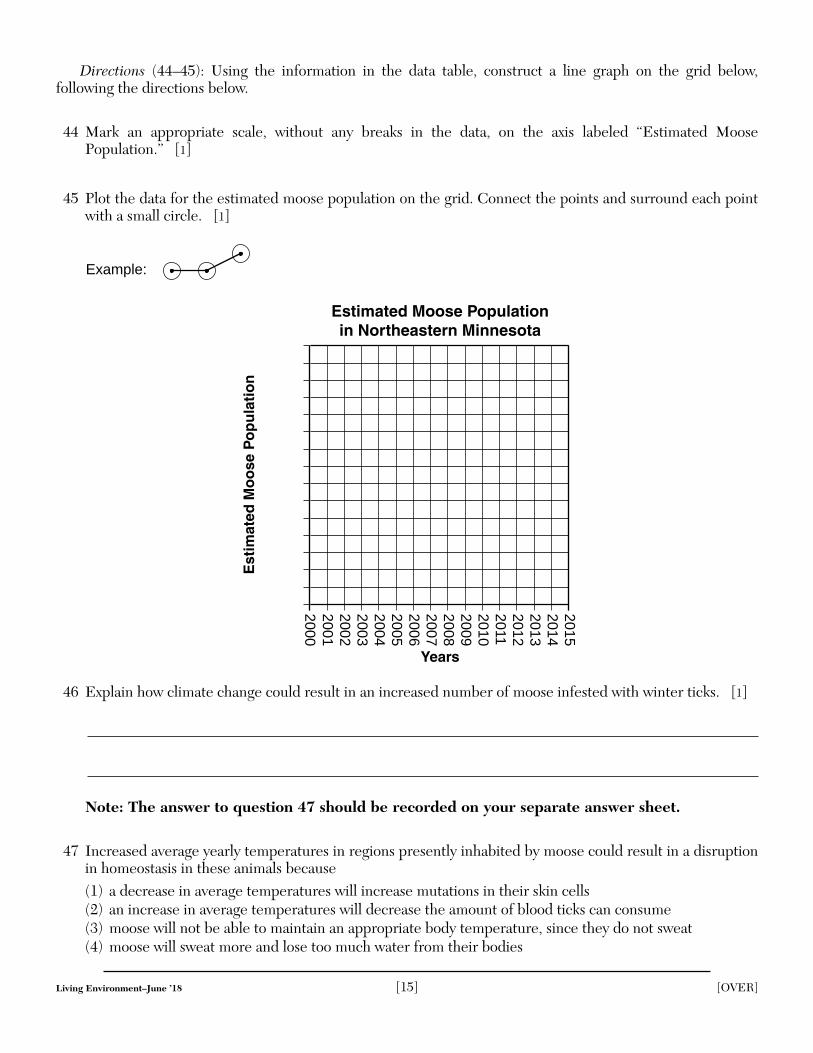
Directions (44–45): Using the information in the data table, construct a line graph on the grid below, following the directions below.
44 Mark an appropriate scale, without any breaks in the data, on the axis labeled “Estimated Moose Population.” [1]
45 Plot the data for the estimated moose population on the grid. Connect the points and surround each point with a small circle. [1]
Example: E
stim
ated
Mo
ose
Po
pu
lati
on
Estimated Moose Population in Northeastern Minnesota
2015201420132012201120102009200820072006200520042003200220012000
Years
46 Explain how climate change could result in an increased number of moose infested with winter ticks. [1]
Note: The answer to question 47 should be recorded on your separate answer sheet.
47 Increased average yearly temperatures in regions presently inhabited by moose could result in a disruption in homeostasis in these animals because (1) a decrease in average temperatures will increase mutations in their skin cells (2) an increase in average temperatures will decrease the amount of blood ticks can consume (3) moose will not be able to maintain an appropriate body temperature, since they do not sweat (4) moose will sweat more and lose too much water from their bodies
Living Environment–June ’18 [15] [OVER]

Base your answers to questions 48 and 49 on the information and diagram below and on your knowledge of biology. The diagram represents the evolutionary relationships among many organisms.
A
B
C D
F H J
E
G Present
Past
I
Tim
e
K
48 An environmental change severely affected the organism represented by species K. What was the result? Support your answer. [1]
Note: The answer to question 49 should be recorded on your separate answer sheet.
49 Three species with the most similar traits are most likely (1) F, I, G (3) B, D, G (2) D, H, J (4) F, A, J
Living Environment–June ’18 [16]
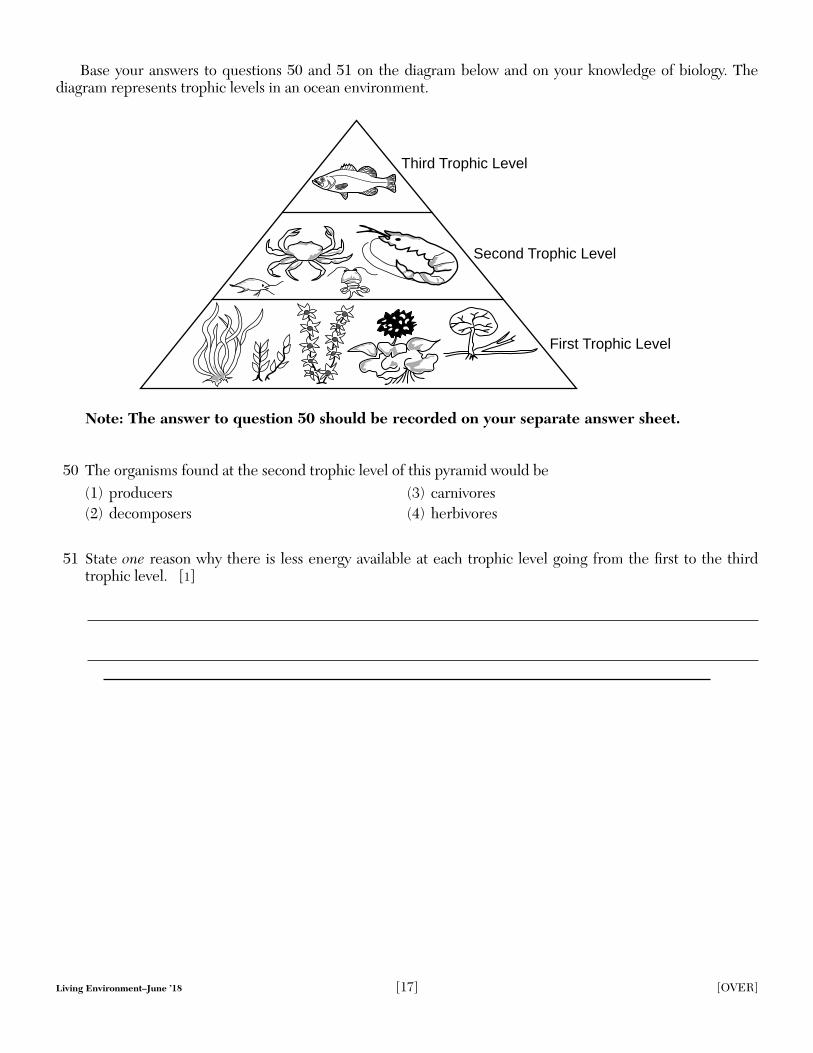
Base your answers to questions 50 and 51 on the diagram below and on your knowledge of biology. The diagram represents trophic levels in an ocean environment.
Third Trophic Level
Second Trophic Level
First Trophic Level
Note: The answer to question 50 should be recorded on your separate answer sheet.
50 The organisms found at the second trophic level of this pyramid would be (1) producers (3) carnivores (2) decomposers (4) herbivores
51 State one reason why there is less energy available at each trophic level going from the first to the third trophic level. [1]
Living Environment–June ’18 [17] [OVER]
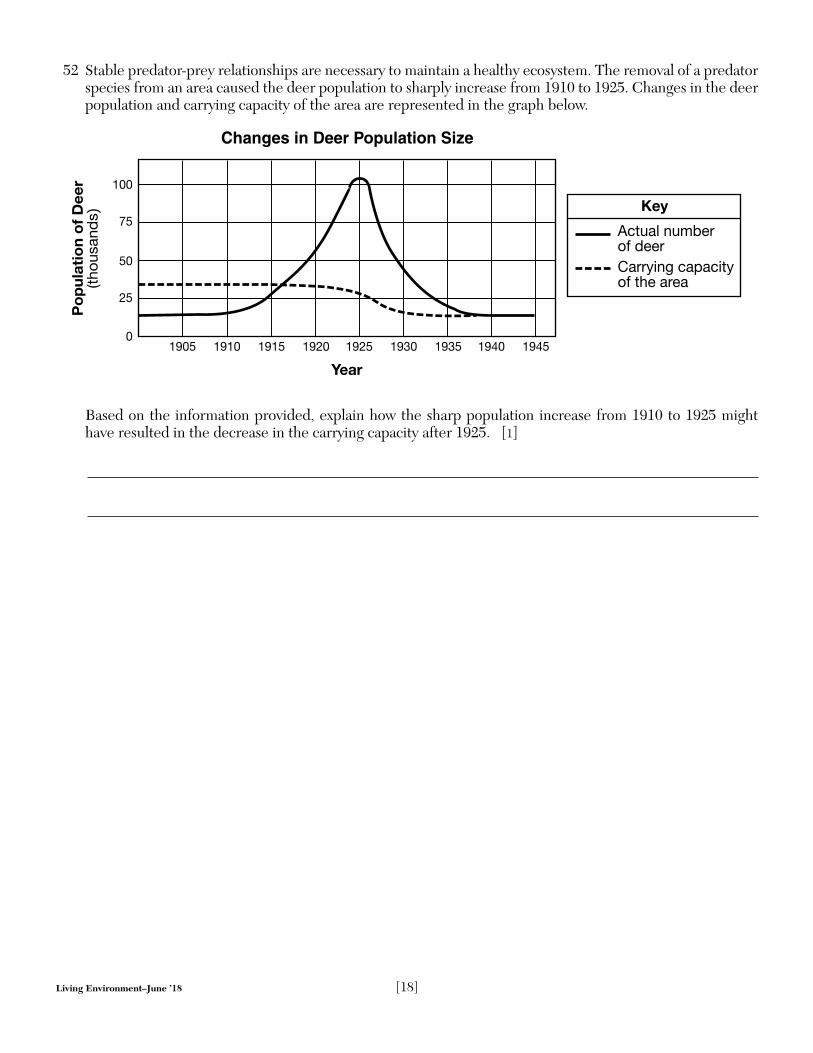
52 Stable predator-prey relationships are necessary to maintain a healthy ecosystem. The removal of a predator species from an area caused the deer population to sharply increase from 1910 to 1925. Changes in the deer population and carrying capacity of the area are represented in the graph below.
Po
pu
lati
on
of
Dee
r(t
hous
and
s)
Changes in Deer Population Size
100
75
50
25
0
Year
1905 1910 1915 1920 1925 1930 1935 1940 1945
Key
Actual number of deer Carrying capacity of the area
Based on the information provided, explain how the sharp population increase from 1910 to 1925 might have resulted in the decrease in the carrying capacity after 1925. [1]
Living Environment–June ’18 [18]

Base your answers to question 53–54 on the diagram below and on your knowledge of biology. The diagram indicates a change in an ecosystem.
Stable Disruption New stablegrassy field
ecosystemecosystem
53–54 Identify some of the key events associated with the change. In your answer, be sure to: • identify one natural event that could cause the disruption indicated in the diagram [1] • state what would most likely happen to the new stable ecosystem in future years if no further
disruptions occur [1]
55 Explain why a mutation that occurs in a body cell will not contribute to the evolution of a species. [1]
Living Environment–June ’18 [19] [OVER]

Part C
Answer all questions in this part. [17]
Directions (56–72): Record your answers in the spaces provided in this examination booklet.
Base your answers to questions 56 through 58 on the passage below and on your knowledge of biology.
Our [Nitrogen] Fertilized World It is the engine of agriculture, the key to plenty in our crowded, hungry world. … …Enter modern chemistry. Giant factories capture inert nitrogen gas from the vast
stores in our atmosphere and force it into a chemical union with the hydrogen in natural gas, creating the reactive compounds that plants crave. That nitrogen fertilizer – more than a hundred million tons applied worldwide every year – fuels bountiful harvests. Without it, human civilization in its current form could not exist. Our planet’s soil simply could not grow enough food to provide all seven billion of us our accustomed diet. In fact, almost half of the nitrogen found in our bodies’ muscle and organ tissue started out in a fertilizer factory.
Source: National Geographic, May 2013
56 Nitrogen fertilizers are used by plants to synthesize amino acids. State one reason why a supply of amino acids is important for the survival of complex organisms. [1]
57 Identify one possible effect on the human population if nitrogen fertilizers were not available. [1]
58 Explain how the building of factories to produce fertilizer is an example of a trade-off. [1]
Living Environment–June ’18 [20]
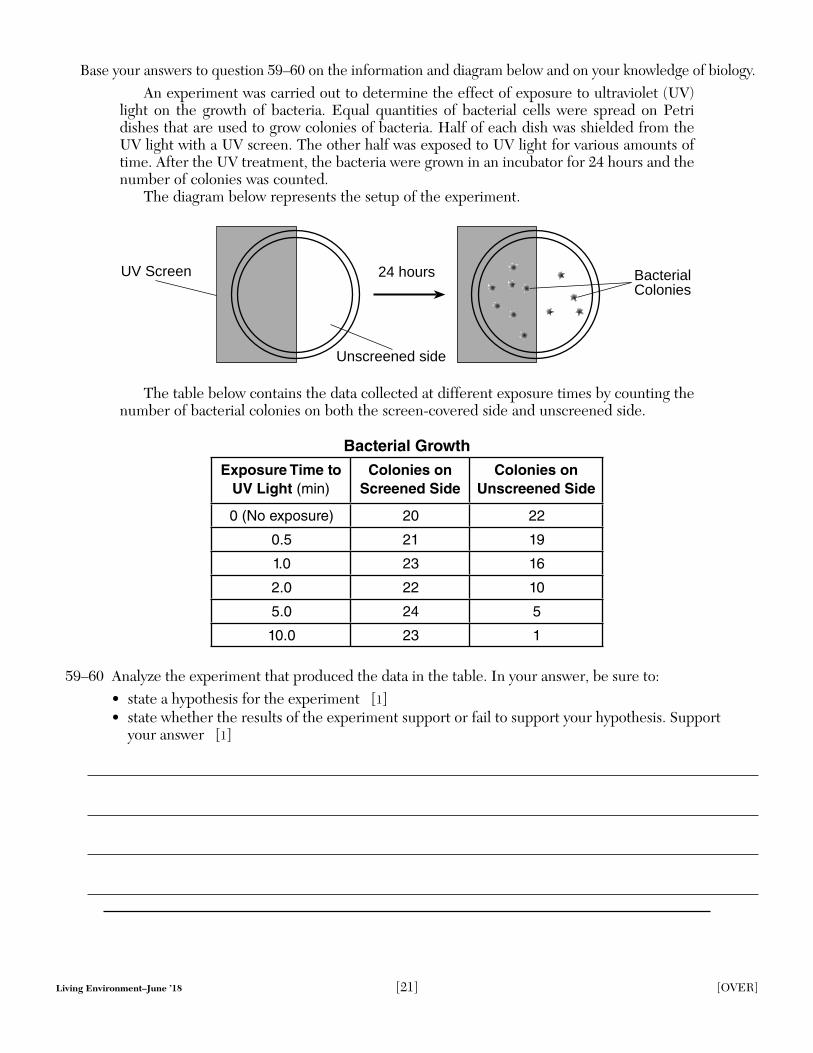
Base your answers to question 59–60 on the information and diagram below and on your knowledge of biology. An experiment was carried out to determine the effect of exposure to ultraviolet (UV)
light on the growth of bacteria. Equal quantities of bacterial cells were spread on Petri dishes that are used to grow colonies of bacteria. Half of each dish was shielded from the UV light with a UV screen. The other half was exposed to UV light for various amounts of time. After the UV treatment, the bacteria were grown in an incubator for 24 hours and the number of colonies was counted.
The diagram below represents the setup of the experiment.
UV Screen 24 hours Bacterial Colonies
Unscreened side
The table below contains the data collected at different exposure times by counting the number of bacterial colonies on both the screen-covered side and unscreened side.
Bacterial Growth
Exposure Time to
UV Light (min) Colonies on
Screened Side
Colonies on
Unscreened Side
0 (No exposure) 20 22
0.5 21 19
1.0 23 16
2.0 22 10
5.0 24 5
10.0 23 1
59–60 Analyze the experiment that produced the data in the table. In your answer, be sure to: • state a hypothesis for the experiment [1] • state whether the results of the experiment support or fail to support your hypothesis. Support
your answer [1]
Living Environment–June ’18 [21] [OVER]

Base your answers to questions 61 and 62 on the information below and on your knowledge of biology.
Evolution leads to changes in how frequently certain traits appear in a population.
61 Explain the importance of the presence of variations within a population. [1]
62 Describe how the process of natural selection can result in an increase in frequencies of certain traits found in a population. [1]
Base your answers to questions 63 through 65 on the information below and on your knowledge of biology.
A typical human liver cell can have over 90,000 insulin receptors. Due to a genetic difference, some people have liver cells that contain only about 1000 insulin receptors.
63 Describe the importance of receptors in cellular communication. [1]
64 Describe the importance of the shape of receptor molecules for carrying out their function. [1]
65 Identify one effect a reduced number of insulin receptors might have on an individual. [1]
Living Environment–June ’18 [22]
Base your answers to questions 66 through 68 on the passage below and on your knowledge of biology. Biologists have been studying the genes present in newborn twins.
Twins Don’t Share Everything …Chemicals called epigenetic markers can be attached to those [inherited] genes, like
fl ags or balloons hanging off the sides of the DNA ladder. These don’t just change the look of the genes. Like pieces of tape stuck over a light switch, these markers can force a gene to remain turned on or off. The type of marker scientists studied in the twins generally sticks the switch in the off position so that some proteins don’t get made. And that means the proteins’ jobs won’t get done.
Every time a cell divides, new epigenetic markers may form. Foods, pollutants, and stress may all contribute to the development of new markers. So throughout our lives we tend to accumulate more and more. But a few are there from the day we’re born.
…His [Jeffrey Craig’s] team found that newborn twins have markers attached to different genes from the very start. It’s true in identical twins, which come from the same fertilized egg. It’s also true in fraternal twins, which come from different fertilized eggs. However, fraternal twins had more such differences than identical twins did.
Source: Science News for Students; July 31, 2012
66 Explain why the genetic material in an offspring produced by sexual reproduction contains genetic material that is not identical to the genetic material of either parent. [1]
67 State one reason why identical twins should have fewer genetic differences than fraternal twins. [1]
68 Identify two environmental factors that can lead to an increase in the number of epigenetic markers that modify gene expression. [1]
and
Living Environment–June ’18 [23] [OVER]

Base your answers to questions 69 and 70 on the information below and on your knowledge of biology.
With the emotional roller coaster that pregnancy brings, it can be daunting [challenging] for pregnant women to take on the additional pressure of eating the “perfect” pregnancy diet. The good news: there is no single perfect diet for pregnancy. The best way for expectant mothers to meet their nutritional needs is to focus on consuming an overall healthy diet, with a variety of vegetables, fruits, whole grains, lean meats or meat substitutes, and low-fat dairy or dairy substitutes.…
Source: US News Health 11/9/2012
69 Describe how nutrients move from the mother to the fetus. [1]
70 State one other way, in addition to consuming a balanced diet, pregnant women can help ensure proper development of the fetus. [1]
Base your answer to question 71 on the information below and on your knowledge of biology.
…Bacteria often evolve clever ways of evading chemical assaults, but they will always struggle to resist the old-fashioned way of killing them; heating them up. It takes only a relatively mild warming to kill bugs [bacteria] without discomfort or harm to tissues. So imagine if little electric heaters could be implanted into wounds and powered wirelessly to fry bacteria during healing before dissolving harmlessly into body fluids once their job is done.…
Source: BBC Future, May 24, 2013
71 State one way the use of these new “little electric heaters” might represent a long-term benefit over using antibiotics to treat bacterial infections. [1]
72 A child became ill with the measles. Measles is a disease that is highly contagious. The child’s mother did not get sick, even though she and the child were close while the child was ill. State one reason why the mother did not get sick with the measles. [1]
Living Environment–June ’18 [24]
Part D
Answer all questions in this part. [13]
Directions (73–85): For those questions that are multiple choice, record on the separate answer sheet the number of the choice that, of those given, best completes each statement or answers each question. For all other questions in this part, follow the directions given and record your answers in the spaces provided in this examination booklet.
Note: The answer to question 73 should be recorded on your separate answer sheet.
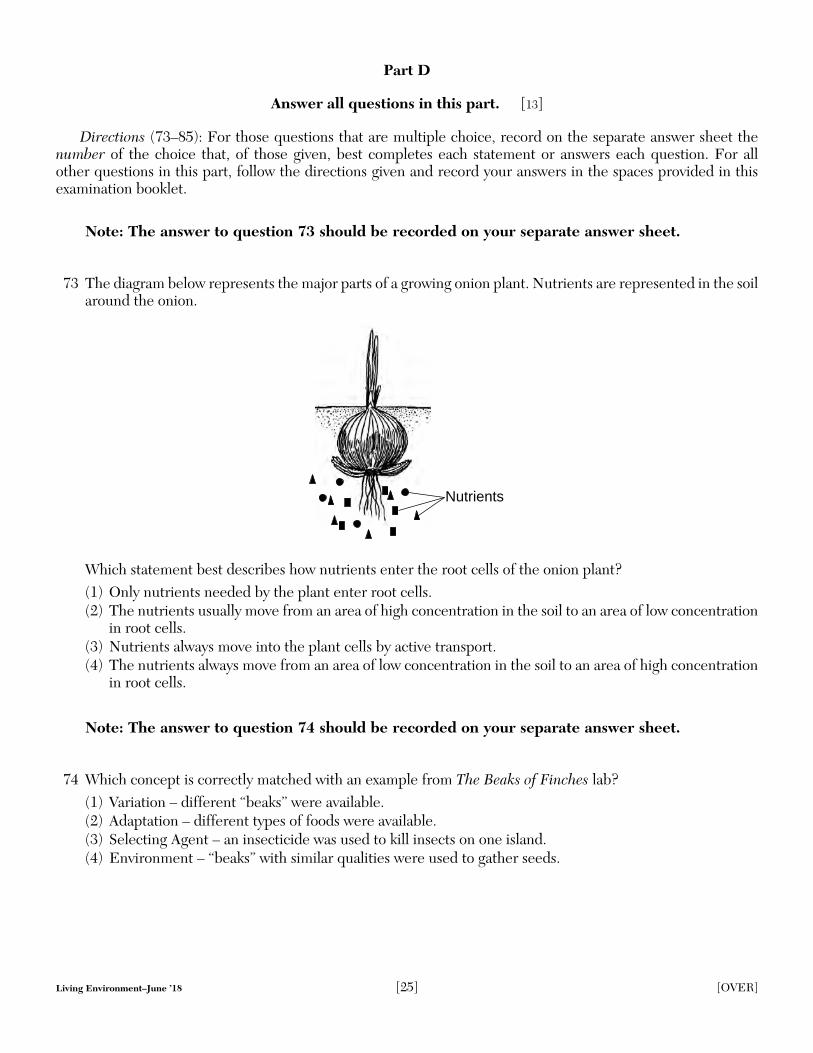
73 The diagram below represents the major parts of a growing onion plant. Nutrients are represented in the soil around the onion.
Nutrients
Which statement best describes how nutrients enter the root cells of the onion plant? (1) Only nutrients needed by the plant enter root cells. (2) The nutrients usually move from an area of high concentration in the soil to an area of low concentration
in root cells. (3) Nutrients always move into the plant cells by active transport. (4) The nutrients always move from an area of low concentration in the soil to an area of high concentration
in root cells.
Note: The answer to question 74 should be recorded on your separate answer sheet.
74 Which concept is correctly matched with an example from The Beaks of Finches lab? (1) Variation – different “beaks” were available. (2) Adaptation – different types of foods were available. (3) Selecting Agent – an insecticide was used to kill insects on one island. (4) Environment – “beaks” with similar qualities were used to gather seeds.
Living Environment–June ’18 [25] [OVER]
Note: The answer to question 75 should be recorded on your separate answer sheet.
75 When comparing characteristics of two organisms, which evidence would be considered the strongest for supporting a possible evolutionary relationship? (1) The two organisms are the same color. (2) The two organisms are the same height. (3) The two organisms produce many of the same proteins. (4) The two organisms are found in the same locations.
Note: The answer to question 76 should be recorded on your separate answer sheet.
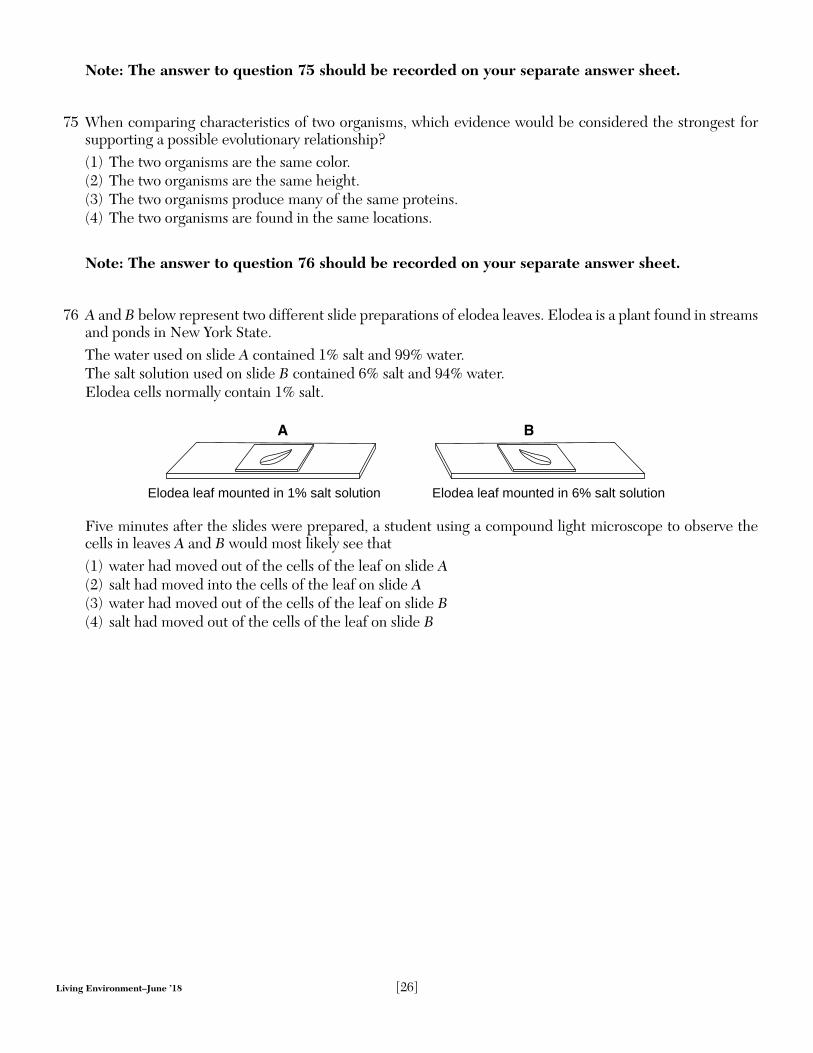
76 A and B below represent two different slide preparations of elodea leaves. Elodea is a plant found in streams and ponds in New York State. The water used on slide A contained 1% salt and 99% water. The salt solution used on slide B contained 6% salt and 94% water. Elodea cells normally contain 1% salt.
A B
Elodea leaf mounted in 1% salt solution Elodea leaf mounted in 6% salt solution
Five minutes after the slides were prepared, a student using a compound light microscope to observe the cells in leaves A and B would most likely see that (1) water had moved out of the cells of the leaf on slide A (2) salt had moved into the cells of the leaf on slide A (3) water had moved out of the cells of the leaf on slide B (4) salt had moved out of the cells of the leaf on slide B
Living Environment–June ’18 [26]

77 The table below shows the food sources for two different species of Galapagos finches on an island.
Two Galapagos Finches and Their Sources of Food
Name Foods
Vegetarian finch
Platyspiza crassirostris
Buds, leaves, fruit of trees
Cactus finch
Geospiza scandens
Cactus flowers and nectar
State one reason why these two species probably do not live in the same area of this island. [1]
Living Environment–June ’18 [27] [OVER]

Base your answers to questions 78 and 79 on the information below and on your knowledge of biology. During a lab activity, a 14-year-old student took his resting pulse rate. He counted
20 beats in 20 seconds. He calculated his pulse rate for a minute and compared the result to the data shown in the table below.
Normal Pulse Rate Ranges
Age Group Resting Heart Rate
(beats per minute)
Children (ages 6-15) 70 – 100
Adults (ages 18 and over) 60 – 100
78 According to the data table, does the student’s pulse rate fall within the normal range? Circle yes or no and support your answer. [1]
yes no
79 Using a biological explanation, state one reason why a person’s heart rate increases during exercise. [1]
Living Environment–June ’18 [28]

80 The chart below shows the molecular comparison between several species.
Molecular Comparison Chart
Botana curus
DNA GTG GAC TGA GGA CTC
mRNA CAC CUG ACU CCU GAG
Amino acid His Leu Thr Pro Glu
Species X
DNA GTG GAC AGA GGA CAC
mRNA CAC CUG UCU CCU GUG
Amino acid His Leu Ser Pro Val
Species Y
DNA GTG GAC AGA GGA CAC
mRNA CAC CUG UCU CCU GUG
Amino acid His Leu Ser Pro Val
Species Z
DNA GTA GAC TGA GGA CTC
mRNA CAU CUG ACU CCU GAG
Amino acid His Leu Thr Pro Glu
Identify which species is likely to be more closely related to Botana curus. Support your answer. [1]
Species:
Support:
Note: The answer to question 81 should be recorded on your separate answer sheet.
81 A factor that contributed to the evolution of finches on the Galapagos Islands was most likely the (1) lack of variation in beak structure of the fi nches (2) isolation of the finches on separate islands (3) relatively constant atmospheric temperature (4) total lack of competition for food
Living Environment–June ’18 [29] [OVER]

Base your answers to questions 82 and 83 on the diagram below and on your knowledge of biology. The diagram represents a laboratory setup.
A starch solution in a test tube was separated from the water in a beaker by a dialysis membrane. One hour later, it was observed that the liquid had risen in the test tube.
Test tube
Beaker
Water
Starch solution
Dialysis membrane
Initial set-up One hour later
Note: The answer to question 82 should be recorded on your separate answer sheet.
82 The rise of the liquid in the test tube that was observed after one hour can be explained as a result of the (1) starch solution moving into the test tube and out of the beaker (2) water moving from the beaker into the test tube (3) large starch molecules blocking the dialysis membrane (4) dialysis membrane acting as a barrier to the water molecules
83 If a starch indicator solution was initially added to the water in the beaker, describe one observation that would be made after one hour. [1]
Living Environment–June ’18 [30]

84 The diagram below represents an electrophoresis gel that was used to separate DNA fragments. Lanes 1, 2, and 3 contain DNA samples that were treated with the same restriction enzyme.
Lane 1Lane 1 Lane 2 Lane 3
Wells
+
–
Explain why the DNA sample in lane 3 did not separate into fragments. [1]
85 An experiment is performed to determine the effect of watching basketball games on pulse rates. Ten students agreed to wear devices that monitor pulse rates while watching a basketball game between competitive opponents. Their pulse rates were measured every minute for five minutes in the first quarter of the game. The data collected indicated that pulse rates did not change significantly during the monitored period. State one way that this experiment could be improved to obtain a valid conclusion. [1]
Living Environment–June ’18 [31] [OVER]

Living Environment–June ’18 [32]
LIVING ENVIRONMENT
Printed on Recycled Paper
LIVING ENVIRONMENT
FOR TEACHERS ONLYThe University of the State of New York
REGENTS HIGH SCHOOL EXAMINATION
LIVING ENVIRONMENT
Wednesday, June 13, 2018 — 1:15 to 4:15 p.m., only
SCORING KEY AND RATING GUIDE
Directions to the Teacher:Refer to the directions on page 2 before rating student papers.
Updated information regarding the rating of this examination may be posted on the New YorkState Education Department’s web site during the rating period. Check this web site at: http://www.p12.nysed.gov/assessment/ and select the link “Scoring Information” for anyrecently posted information regarding this examination. This site should be checked before the rating process for this examination begins and several times throughout the Regents Examinationperiod.
Multiple Choice for Parts A, B–1, B–2, and DAllow 1 credit for each correct response.
1 . . . . . . 2 . . . . . . 9 . . . . . . 4 . . . . . . 17 . . . . . . 3 . . . . . . 25 . . . . . . 4 . . . . . .
2 . . . . . . 4 . . . . . . 10 . . . . . . 3 . . . . . . 18 . . . . . . 1 . . . . . . 26 . . . . . . 2 . . . . . .
3 . . . . . . 2 . . . . . . 11 . . . . . . 4 . . . . . . 19 . . . . . . 4 . . . . . . 27 . . . . . . 3 . . . . . .
4 . . . . . . 1 . . . . . . 12 . . . . . . 3 . . . . . . 20 . . . . . . 3 . . . . . . 28 . . . . . . 1 . . . . . .
5 . . . . . . 2 . . . . . . 13 . . . . . . 4 . . . . . . 21 . . . . . . 1 . . . . . . 29 . . . . . . 4 . . . . . .
6 . . . . . . 4 . . . . . . 14 . . . . . . 2 . . . . . . 22 . . . . . . 1 . . . . . . 30 . . . . . . 1 . . . . . .
7 . . . . . . 1 . . . . . . 15 . . . . . . 2 . . . . . . 23 . . . . . . 3 . . . . . .
8 . . . . . . 1 . . . . . . 16 . . . . . . 2 . . . . . . 24 . . . . . . 4 . . . . . .
Part A
Part B–1
Part B–2
Part D
31 . . . . . . 1 . . . . . . 35 . . . . . . 1 . . . . . . 39 . . . . . . 3 . . . . . . 43 . . . . . . 3 . . . . . .
32 . . . . . . 3 . . . . . . 36 . . . . . . 3 . . . . . . 40 . . . . . . 4 . . . . . .
33 . . . . . . 2 . . . . . . 37 . . . . . . 3 . . . . . . 41 . . . . . . 4 . . . . . .
34 . . . . . . 2 . . . . . . 38 . . . . . . 2 . . . . . . 42 . . . . . . 2 . . . . . .
47 . . . . . . 3 . . . . . . 49 . . . . . . 2 . . . . . . 50 . . . . . . 4 . . . . . .
73 . . . . . . 2 . . . . . . 75 . . . . . . 3 . . . . . . 81 . . . . . . 2 . . . . . .
74 . . . . . . 1 . . . . . . 76 . . . . . . 3 . . . . . . 82 . . . . . . 2 . . . . . .
Directions to the Teacher
Follow the procedures below for scoring student answer papers for the Regents Examination in LivingEnvironment. Additional information about scoring is provided in the publication Information Booklet forScoring Regents Examinations in the Sciences.
Do not attempt to correct the student’s work by making insertions or changes of any kind. If the student’s responses for the multiple-choice questions are being hand scored prior to beingscanned, the scorer must be careful not to make any marks on the answer sheet except to recordthe scores in the designated score boxes. Marks elsewhere on the answer sheet will interfere withthe accuracy of the scanning.
Allow 1 credit for each correct response.
At least two science teachers must participate in the scoring of the Part B–2, Part C, and Part D open-ended questions on a student’s paper. Each of these teachers should be responsible for scoring a selectednumber of the open-ended questions on each answer paper. No one teacher is to score more than approximately one-half of the open-ended questions on a student’s answer paper. Teachers may not score theirown students’ answer papers.
Students’ responses must be scored strictly according to the Scoring Key and Rating Guide. For open-ended questions, credit may be allowed for responses other than those given in the rating guide if the responseis a scientifically accurate answer to the question and demonstrates adequate knowledge as indicated by the examples in the rating guide. On the student’s separate answer sheet, for each question, record the numberof credits earned and the teacher’s assigned rater/scorer letter.
Fractional credit is not allowed. Only whole-number credit may be given for a response. If the studentgives more than one answer to a question, only the first answer should be rated. Units need not be given whenthe wording of the questions allows such omissions.
For hand scoring, raters should enter the scores earned in the appropriate boxes printed on the separateanswer sheet. Next, the rater should add these scores and enter the total in the box labeled “Total Raw Score.”Then the student’s raw score should be converted to a scale score by using the conversion chart that will be postedon the Department’s web site at: http://www.p12.nysed.gov/assessment/ on Wednesday, June 13, 2018. The student’s scale score should be entered in the box labeled “Scale Score” on the student’s answer sheet.The scale score is the student’s final examination score.
Schools are not permitted to rescore any of the open-ended questions on this exam after eachquestion has been rated once, regardless of the final exam score. Schools are required to ensurethat the raw scores have been added correctly and that the resulting scale score has been determinedaccurately.
Because scale scores corresponding to raw scores in the conversion chart may change from one administration to another, it is crucial that, for each administration, the conversion chart provided for thatadministration be used to determine the student’s final score.
Living Environment Rating Guide – June ’18 [2]
Part B–2
44 [1] Allow 1 credit for completing an appropriate scale, without any breaks in the data, on the axislabeled “Estimated Moose Population.”
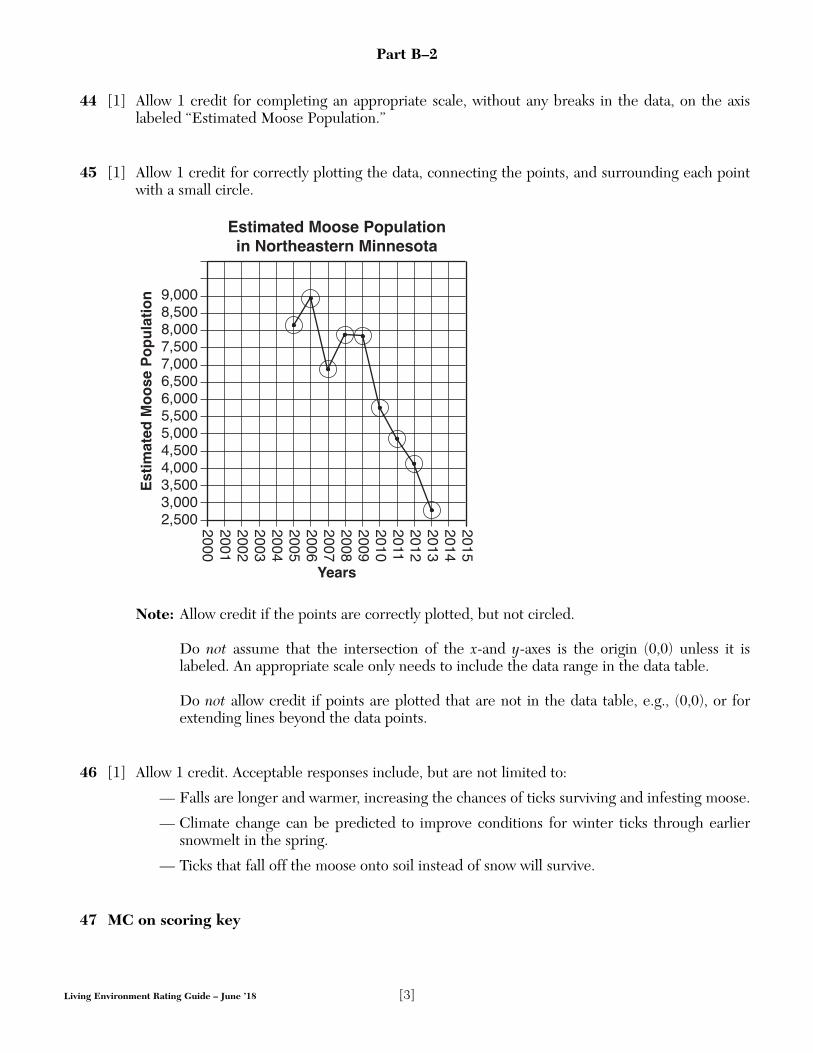
45 [1] Allow 1 credit for correctly plotting the data, connecting the points, and surrounding each pointwith a small circle.
Note: Allow credit if the points are correctly plotted, but not circled.
Do not assume that the intersection of the x-and y-axes is the origin (0,0) unless it islabeled. An appropriate scale only needs to include the data range in the data table.
Do not allow credit if points are plotted that are not in the data table, e.g., (0,0), or forextending lines beyond the data points.
46 [1] Allow 1 credit. Acceptable responses include, but are not limited to:
— Falls are longer and warmer, increasing the chances of ticks surviving and infesting moose.
— Climate change can be predicted to improve conditions for winter ticks through earliersnowmelt in the spring.
— Ticks that fall off the moose onto soil instead of snow will survive.
47 MC on scoring key
7,500
2,500
Est
imat
ed M
oo
se P
op
ula
tio
n
Years
2000
Estimated Moose Populationin Northeastern Minnesota
3,0003,5004,0004,5005,0005,5006,0006,5007,000
8,0008,5009,000
200120022003200420052006200720082009201020112012201320142015
Living Environment Rating Guide – June ’18 [3]

48 [1] Allow 1 credit for stating the result and supporting the answer.
— Species K did not survive. They were not able to adapt to their new environment.
— Species K became extinct because they could not survive in the changed environment.
— They became extinct. The diagram shows that they did not survive to the present.
49 MC on scoring key
50 MC on scoring key
51 [1] Allow 1 credit. Acceptable responses include, but are not limited to:
— Energy is lost at each level as heat.
— Some energy is used by the organisms at each level and is not available to the organisms atthe next level.
— Energy is lost.
52 [1] Allow 1 credit. Acceptable responses include, but are not limited to:
— The overpopulation of deer in 1925 caused their habitat to be overgrazed. This did notallow the food sources in the area to regrow for future deer populations.
— In 1925, the deer ate too much food, lowering the amount of food available in future years.
— Overpopulation of deer in 1925 destroyed some of the resources deer needed, so fewerdeer could live there.
Living Environment Rating Guide – June ’18 [4]

Note: The student’s response to the bulleted items in question 53–54 need not appear in the following order.
53 [1] Allow 1 credit for identifying one natural event that could cause the disruption indicated in the diagram. Acceptable responses include, but are not limited to:
— fire
— volcanic eruption
— hurricane/flood
— earthquake
54 [1] Allow 1 credit for explaining what would most likely happen to the new stable ecosystem in futureyears if no further disruptions occur. Acceptable responses include, but are not limited to:
— The new stable ecosystem would probably continue in the area.
— It would probably remain unchanged for many years.
— It will remain a stable ecosystem.
— It would remain the same.
— It becomes a climax community/grassy field.
55 [1] Allow 1 credit. Acceptable responses include, but are not limited to:
— Genetic information in body cells isn’t passed on to offspring.
— The mutation isn’t in sperm or egg cells.
— Mutations must be in gametes to be passed on to offspring.
Living Environment Rating Guide – June ’18 [5]
Part C
56 [1] Allow 1 credit. Acceptable responses include, but are not limited to:
— Amino acids are the building blocks of protein.
— Amino acids are found in enzymes, which regulate chemical activity in complex organisms.
— Amino acids are found in our bodies’ muscle and organ tissue.
57 [1] Allow 1 credit. Acceptable responses include, but are not limited to:
— People would starve.
— Farmers could not grow enough crops to feed the population.
— The human population would decrease.
— The food supply would decrease.
— Human civilization in its current form could not exist.
— Humans would have deficiencies in their diet.
— Humans would be malnourished.
58 [1] Allow 1 credit. Acceptable responses include, but are not limited to:
— The factories produce useful products to help increase the food supply, but also producepollutants.
— The factories provide fertilizers for the production of more food, but disrupt the habitats ofsome organisms.
— Fertilizers are useful for the growth of healthy plants, but can also be harmful if they washoff into lakes/waterways.
— Fertilizers help plants grow, but could harm the environment.
Living Environment Rating Guide – June ’18 [6]
Note: The student’s response to the bulleted items in question 59–60 need not appear in the following order.
59 [1] Allow 1 credit for stating a hypothesis for the experiment. Acceptable responses include, but arenot limited to:
— If bacteria are exposed to UV light, they will form fewer colonies than those not exposed.
— Longer exposure to UV light will limit bacterial growth.
— Exposure to UV light affects the growth of bacteria.
— If bacteria are exposed to UV light, they will not form colonies.
— Bacteria protected from UV light will produce more colonies.
Note: Do not allow credit for a hypothesis written in the form of a question.
60 [1] Allow 1 credit for stating whether the results of the experiment support or fail to support the student’s hypothesis and supporting the answer. Acceptable responses include, but are not limited to:
— The experiment supports the hypothesis that longer exposure to UV light limits bacterialgrowth, since fewer colonies grew with longer exposure to UV light.
— Support, because more exposure to UV light resulted in fewer bacterial colonies.
Note: Allow credit only for an answer that is consistent with the student’s response to question 59.
61 [1] Allow 1 credit. Acceptable responses include, but are not limited to:
— More variation increases the chances that some members of the population will survive ina changing environment.
— Differences between offspring increase the likelihood that some individuals will have adaptations to their new environment.
— Variations provide raw material for natural selection when environments change.
— More variation increases the stability of the population.
— Without the variations, the population may not survive in a changing environment.
62 [1] Allow 1 credit. Acceptable responses include, but are not limited to:
— More individuals with favorable traits usually survive, passing on those traits to the next generation.
— As a result of natural selection, the number of individuals with favorable traits increases.
— The fittest will survive, causing an increase in the frequency of favorable traits.
Living Environment Rating Guide – June ’18 [7]

63 [1] Allow 1 credit. Acceptable responses include, but are not limited to:
— Receptors receive messages sent by other cells.
— They enable cells to respond appropriately.
64 [1] Allow 1 credit. Acceptable responses include, but are not limited to:
— Receptor molecules have specific shapes that influence how they interact with other molecules.
— The shape determines with which molecules they interact.
— The shape of the receptor molecule and messenger molecule must match.
— The shapes must match/fit together.
65 [1] Allow 1 credit. Acceptable responses include, but are not limited to:
— high levels of glucose in the blood/urine
— The person might be diabetic.
— Less glucose will go into the cells.
— The blood glucose level will not be controlled.
66 [1] Allow 1 credit. Acceptable responses include, but are not limited to:
— Offspring receive genetic information from each of two parents.
— Each parent contributes half of the offspring’s genetic material.
— Recombination of genes occurs at fertilization.
— may be due to mutations
— meiosis and crossing over
67 [1] Allow 1 credit. Acceptable responses include, but are not limited to:
— Fraternal twins arise from two fertilized eggs.
— Identical twins are produced from one zygote/fertilized egg.
— Identical twins come from the same fertilized egg.
68 [1] Allow 1 credit for two environmental factors. Acceptable responses include, but are not limited to:
— stress
— pollutants
— food
— smoke/pesticides/alcohol/drugs
— temperature
Living Environment Rating Guide – June ’18 [8]
69 [1] Allow 1 credit. Acceptable responses include, but are not limited to:
— Nutrients move across the placenta.
— diffusion across the placenta
— diffusion from the mother’s blood to the fetus
Note: Simply stating “through the umbilical cord” by itself is not an acceptable answer.
70 [1] Allow 1 credit. Acceptable responses include, but are not limited to:
— Pregnant women should have regular doctor visits.
— exercise during the pregnancy
— avoid alcohol/drugs
71 [1] Allow 1 credit. Acceptable responses include, but are not limited to:
— The bacteria may not become resistant to the heaters.
— Antibiotics may have negative side effects.
— Heaters will act faster than the antibiotics.
72 [1] Allow 1 credit. Acceptable responses include, but are not limited to:
— The mother had antibodies against the measles.
— The mother had been vaccinated against measles.
— The mother had measles when younger and still had immunity to measles.
— The mother is immune to the measles.
— The mother had a mutation that made her resistant.
Living Environment Rating Guide – June ’18 [9]
Part D
73 MC on scoring key
74 MC on scoring key
75 MC on scoring key
76 MC on scoring key
77 [1] Allow 1 credit. Acceptable responses include, but are not limited to:
— Trees and cacti do not usually grow in the same areas.
— Their food may only be available in certain areas on the island and the foods are different.
— Their foods do not grow in the same place since they are different.
— There is another resource one of the species needs that is not available where the otherspecies lives.
78 [1] Allow 1 credit for circling “no” and supporting the answer. Acceptable responses include, but arenot limited to:
— because his heart rate is below the range for his age group
— It falls in the range for people older than 14.
— His rate of 60 beats per minute puts him in the adult range.
79 [1] Allow 1 credit. Acceptable responses include, but are not limited to:
— During exercise, there is an increase in carbon dioxide, which causes the heart to beat faster.
— There is a feedback mechanism that causes the heart to beat faster in response to an increasein activity.
— When the heart beats faster, it increases the flow of oxygen-rich blood to the muscles.
— The heart pumping faster removes wastes faster.
80 [1] Allow 1 credit for correctly identifying species Z as being most closely related and supporting theanswer. Acceptable responses include, but are not limited to:
— They have the same amino acid sequence.
— They have more DNA bases in common.
Living Environment Rating Guide – June ’18 [10]

81 MC on scoring key
82 MC on scoring key
83 [1] Allow 1 credit. Acceptable responses include, but are not limited to:
— The starch solution would turn blue-black.
— The water in the beaker would be amber-colored.
— The liquid in the test tube would be blue-black.
— A color change would occur in the test tube.
— There would be a color change.
84 [1] Allow 1 credit. Acceptable responses include, but are not limited to:
— The restriction enzyme did not have a long enough time to cut the DNA sample.
— The DNA sample was not cut by this restriction enzyme.
— The restriction enzyme was denatured/did not work in the sample in lane 3.
85 [1] Allow 1 credit. Acceptable responses include, but are not limited to:
— The experimental group should have been larger.
— The data should have been collected for a longer time period.
— A control group should have been included in the study.
— Data should have been collected during the last quarter of the game.
— Repeat the experiment.
Living Environment Rating Guide – June ’18 [11]

Living Environment Rating Guide – June ’18 [12]
The Chart for Determining the Final Examination Score for the June 2018Regents Examination in Living Environment will be posted on theDepartment’s web site at: http://www.p12.nysed.gov/assessment/ onWednesday, June 13, 2018. Conversion charts provided for previous administrations of the Regents Examination in Living Environment must NOTbe used to determine students’ final scores for this administration.
Online Submission of Teacher Evaluations of the Test to the Department
Suggestions and feedback from teachers provide an important contribution to the test development process. The Department provides an online evaluation form for State assessments. It contains spaces for teachers to respond to several specific questions and tomake suggestions. Instructions for completing the evaluation form are as follows:
1. Go to http://www.forms2.nysed.gov/emsc/osa/exameval/reexameval.cfm.
2. Select the test title.
3. Complete the required demographic fields.
4. Complete each evaluation question and provide comments in the space provided.
5. Click the SUBMIT button at the bottom of the page to submit the completed form.

Living Environment Rating Guide – June ’18 [13]
Map to Core Curriculum
June 2018 Living Environment
Standards Question Numbers
Part A 1–30
Part B–1 31–43
Part B–2 44–55
Part C 56–72
Standard 1 — Analysis, Inquiry and Design
Key Idea 1 31, 32
Key Idea 2
Key Idea 3 37
Appendix A (Laboratory Checklist) 33 44, 45, 47 59, 60
Standard 4
Key Idea 1 7, 8, 11, 14, 24, 29 35, 42, 43 56, 63
Key Idea 2 2, 4, 15, 17, 22 66, 67, 68
Key Idea 3 34 46, 48, 49, 55 61, 62
Key Idea 4 9, 13, 16, 18, 21, 23 69, 70
Key Idea 5 3, 12, 27 38, 39, 40, 41 64, 65, 71, 72
Key Idea 6 1, 6, 25, 30 50, 51, 52, 53, 54
Key Idea 7 5, 10, 19, 20, 26, 28 36 57, 58
Part D 73–85
Lab 1 75, 80, 84
Lab 2 78, 79, 85
Lab 3 74, 77, 81
Lab 5 73, 76, 82, 83
Raw Scale Raw Scale Raw ScaleScore Score Score Score Score Score
85 100 56 78 27 4984 98 55 77 26 4783 97 54 76 25 4682 97 53 76 24 4481 96 52 75 23 4380 95 51 74 22 4279 94 50 73 21 4078 93 49 72 20 3877 93 48 72 19 3776 92 47 71 18 3575 91 46 70 17 3474 91 45 69 16 3273 90 44 68 15 3072 89 43 67 14 2871 88 42 66 13 2770 88 41 65 12 2569 87 40 64 11 2368 86 39 63 10 2167 86 38 62 9 1966 85 37 61 8 1765 84 36 60 7 1564 83 35 59 6 1363 83 34 58 5 1162 82 33 56 4 961 81 32 55 3 760 81 31 54 2 559 80 30 53 1 258 79 29 51 0 057 79 28 50
The State Education Department / The University of the State of New York
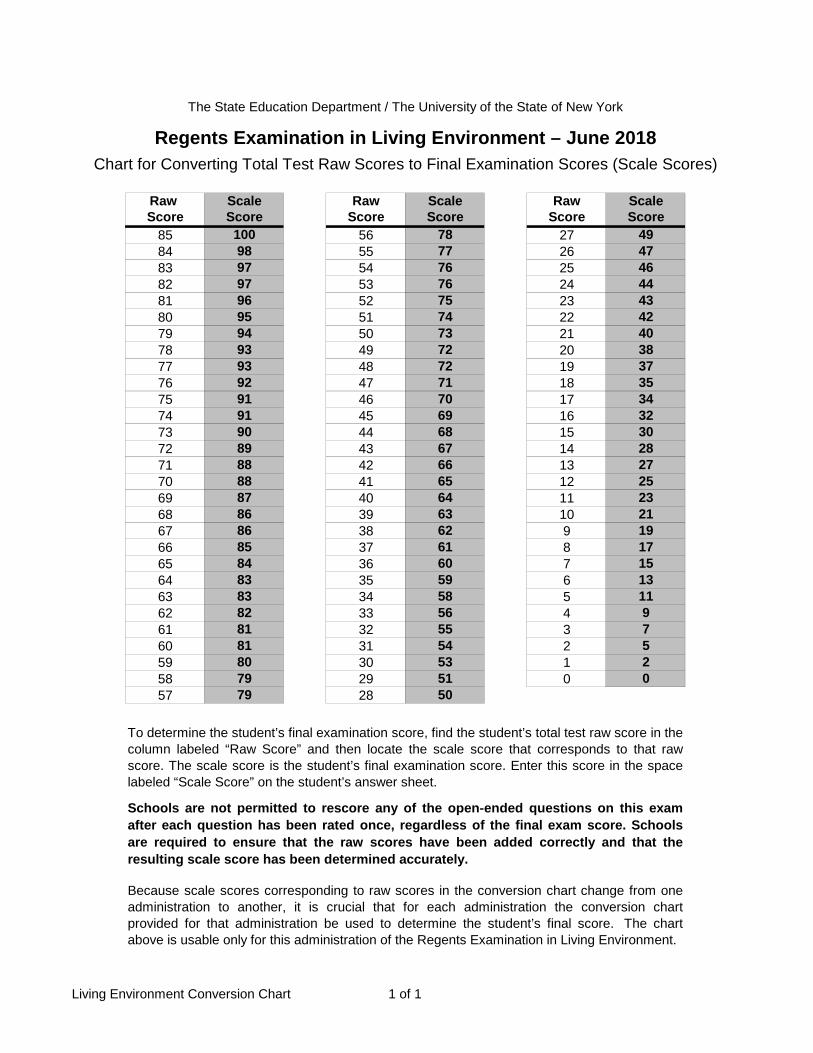
To determine the student’s final examination score, find the student’s total test raw score in thecolumn labeled “Raw Score” and then locate the scale score that corresponds to that rawscore. The scale score is the student’s final examination score. Enter this score in the spacelabeled “Scale Score” on the student’s answer sheet.
Schools are not permitted to rescore any of the open-ended questions on this examafter each question has been rated once, regardless of the final exam score. Schoolsare required to ensure that the raw scores have been added correctly and that theresulting scale score has been determined accurately.
Because scale scores corresponding to raw scores in the conversion chart change from oneadministration to another, it is crucial that for each administration the conversion chartprovided for that administration be used to determine the student’s final score. The chartabove is usable only for this administration of the Regents Examination in Living Environment.
Chart for Converting Total Test Raw Scores to Final Examination Scores (Scale Scores)Regents Examination in Living Environment – June 2018
Living Environment Conversion Chart 1 of 1