Regen_Summer 2015 ppt
55
Exploration of Knee and Hip Replacement based on HCUP dataset Purdue University July 24,2015 [email protected] [email protected] [email protected] [email protected] Tianzhao Wu Xiaofei Zhang Mengying Yang Tianyu Zhang
-
Upload
tianzhao-jonathan-wu -
Category
Documents
-
view
113 -
download
2
Transcript of Regen_Summer 2015 ppt

Exploration of Knee and Hip Replacement based on HCUP dataset
Purdue University July 24,2015
[email protected] [email protected] [email protected] [email protected]
Tianzhao Wu
Xiaofei Zhang
Mengying Yang
Tianyu Zhang

Acknowledgements
• Arthur and Kathryn Lorenz (Sponsors)
2
Department of Statistics • Hao Zhang • Rebecca Doerge
• Lingsong Zhang
• Mark D. Ward
• Jeffrey A. Beckley
Regenstrief Center
for Healthcare Engineering
• Marietta Harrison
• Steven M. Witz
• Kenneth J. Musselman
• Kit Klutzke

Outline
• Background of Bundle Payment
• Research Problem
• Methods and Results
• Summary and Discussion
3
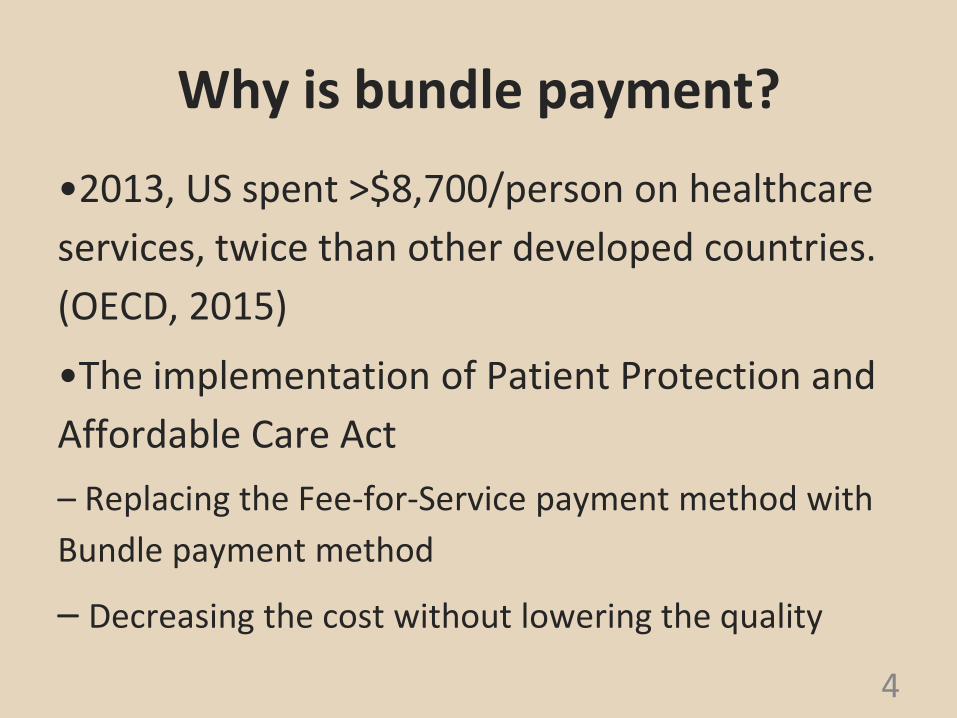
Why is bundle payment?
•2013, US spent >$8,700/person on healthcare
services, twice than other developed countries.
(OECD, 2015)
•The implementation of Patient Protection and
Affordable Care Act
– Replacing the Fee-for-Service payment method with
Bundle payment method
– Decreasing the cost without lowering the quality
4

What is Bundle Payment?
All the standard treatments costs are all included, from
inpatient and outpatient hospital services, medication
costs, and post-discharge services (Feder, 2011)
5
• Post-Acute Services such as physical therapy and nurse visits at home
• Physician services delivered in and outside the hospital

How does Bundle Payment work?
•Enhancing the collaboration among the
hospitals
–“over 50% of hip fracture treatment need 4 or more
different hospital visiting”(Calsyn,2012)
•Providing money incentives to improve the
quality
–“Episode Price=Typical Price + 50% Complications”
(HCI3,2011)
6

Why is total knee and hip replacement?
• Complication rate fall in the middle and close to the national average
• Complexity makes total knee replacement have more procedures
• Higher market demand
7
Research question
• Analyze the hospital total expense for hip and
knee replacements and compare variation
across different variables.
8

Data
• Data source:
Healthcare Cost and Utilization Project (HCUP)
(https://www.hcup-us.ahrq.gov)
• Data field:
National Inpatient Sample (NIS) (2008 & 2009)
State Inpatient Database (SID) (WA 2009)
• Data Feature:
Over 8 million observations
More than 230 variables
9
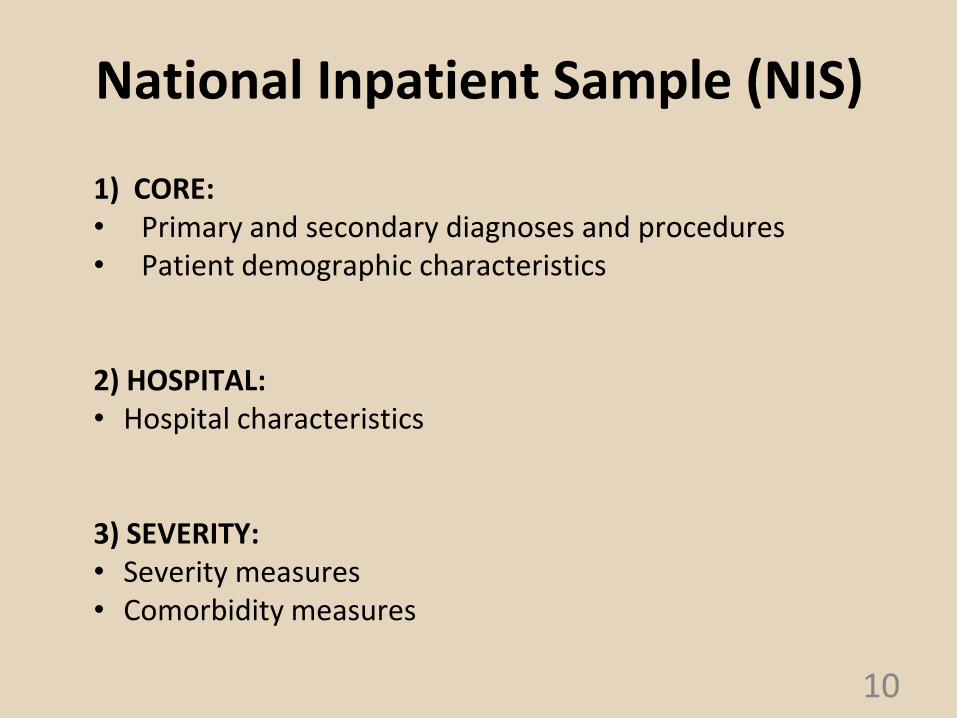
1) CORE: • Primary and secondary diagnoses and procedures • Patient demographic characteristics 2) HOSPITAL: • Hospital characteristics 3) SEVERITY: • Severity measures • Comorbidity measures
National Inpatient Sample (NIS)
10
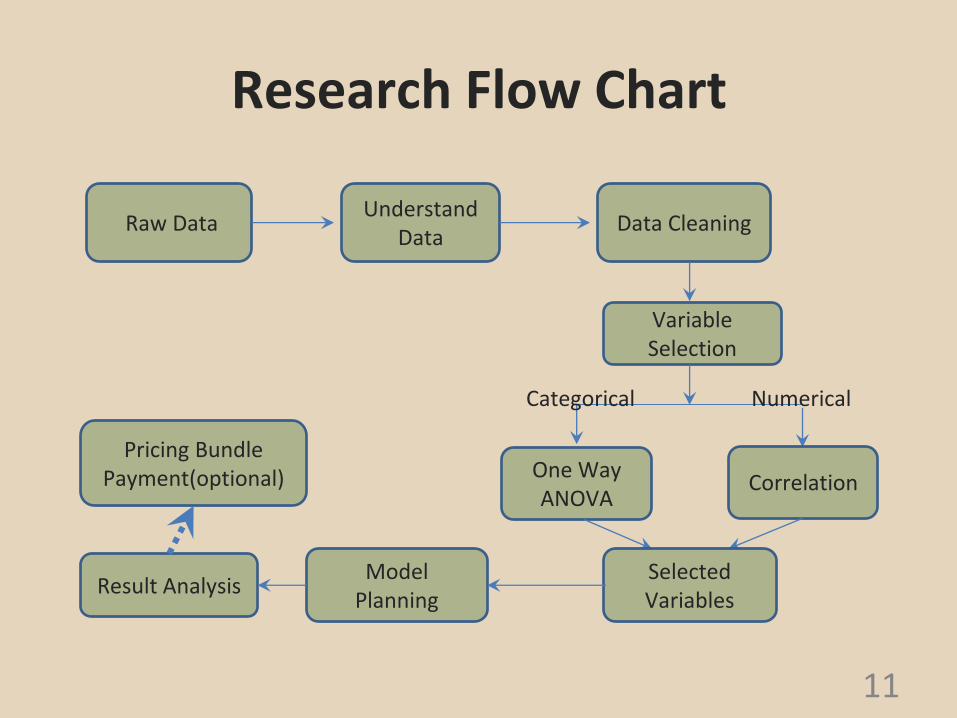
Research Flow Chart
11
Raw Data Understand
Data Data Cleaning
Variable Selection
One Way ANOVA
Correlation
Categorical Numerical
Selected Variables
Model Planning
Result Analysis
Pricing Bundle Payment(optional)
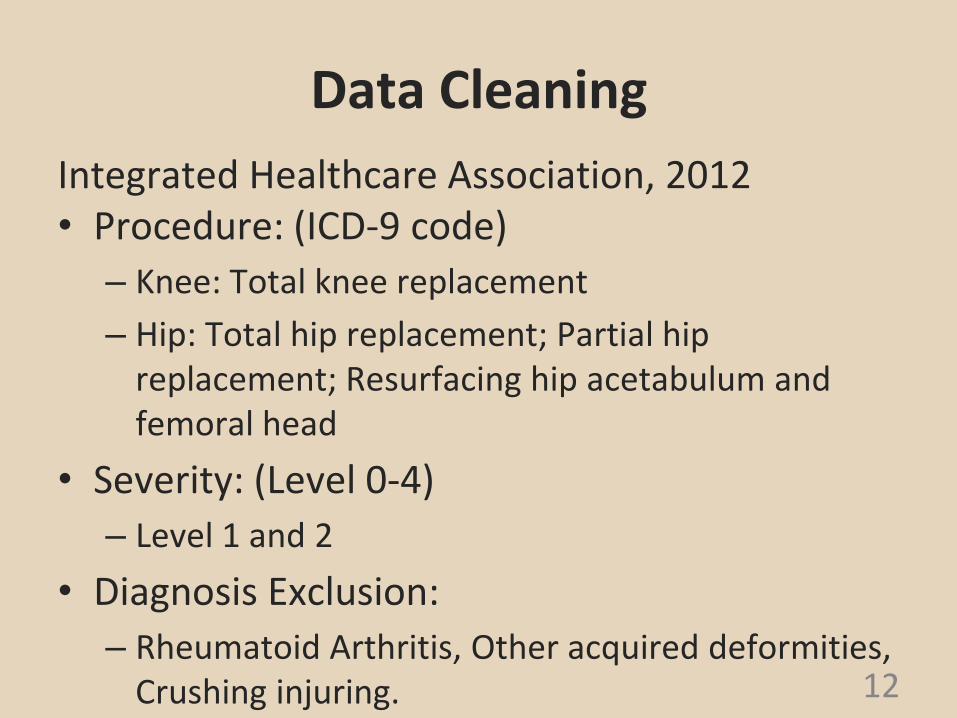
Data Cleaning
Integrated Healthcare Association, 2012 • Procedure: (ICD-9 code)
– Knee: Total knee replacement
– Hip: Total hip replacement; Partial hip replacement; Resurfacing hip acetabulum and femoral head
• Severity: (Level 0-4)
– Level 1 and 2
• Diagnosis Exclusion:
– Rheumatoid Arthritis, Other acquired deformities, Crushing injuring. 12
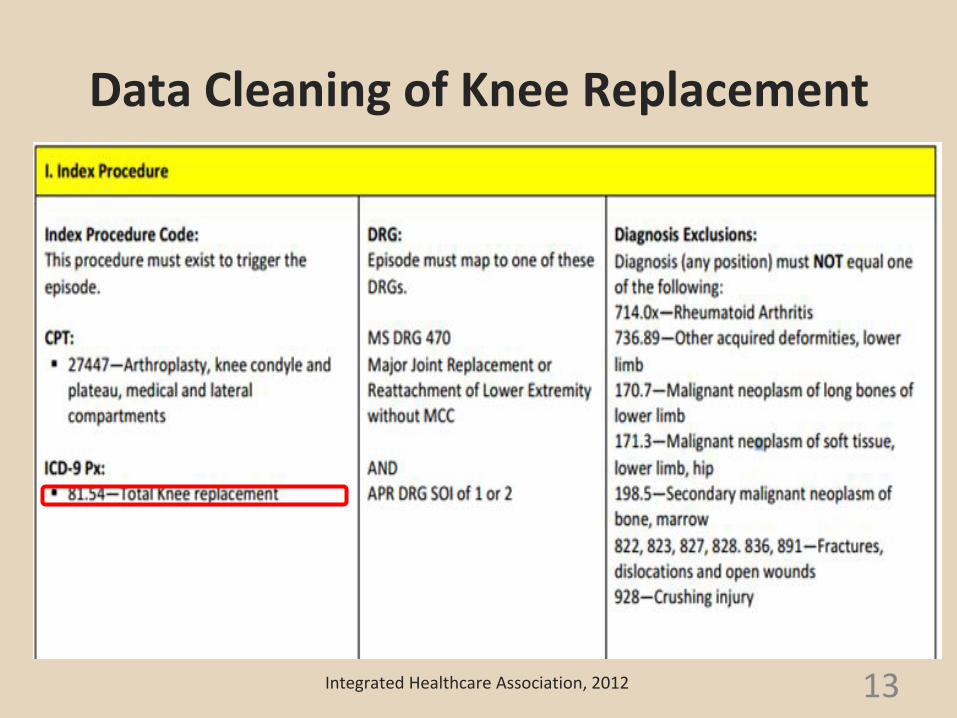
Data Cleaning of Knee Replacement
• Data definition:
13 Integrated Healthcare Association, 2012

Data Cleaning of Hip Replacement
14 Integrated Healthcare Association, 2012
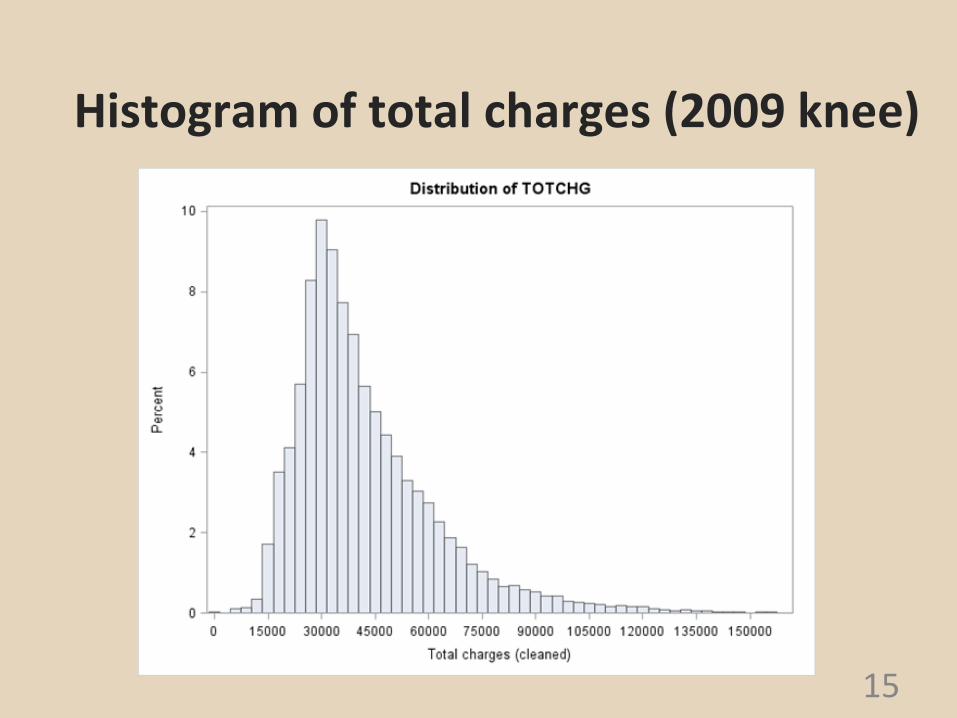
Histogram of total charges (2009 knee)
15

Histogram of total charges after taking log (2009 knee)
16
Quantiles (Definition 5)
Level Quantile
100% Max 12.72859
99% 11.66067
1% 9.57220
0% Min 5.41610

Histogram of total charges (2009 Hip)
17
Quantiles (Definition 5)
Level Quantile
100% Max 13.02399
99% 11.72254
1% 9.62338
0% Min 5.85793

Data Exploration for Each State
In the NIS dataset, there are missing values for some states: 2009 Missing States Data:
Alaska, Alabama, Washington D.C., Delaware, Idaho, Mississippi, North Dakota
2008 Missing States Data:
Alaska, Alabama, Washington D.C., Delaware, Idaho, Mississippi, North Dakota, Montana, New Mexico
18

1. (a)Boxplot of log total charge of different hospital states (2009 Knee)
19

1. (b)Boxplot of log total charge of different hospital states(2009 Knee)
20

1. (b)Scatter Plot of Population vs. mean of log total charge of each state
21
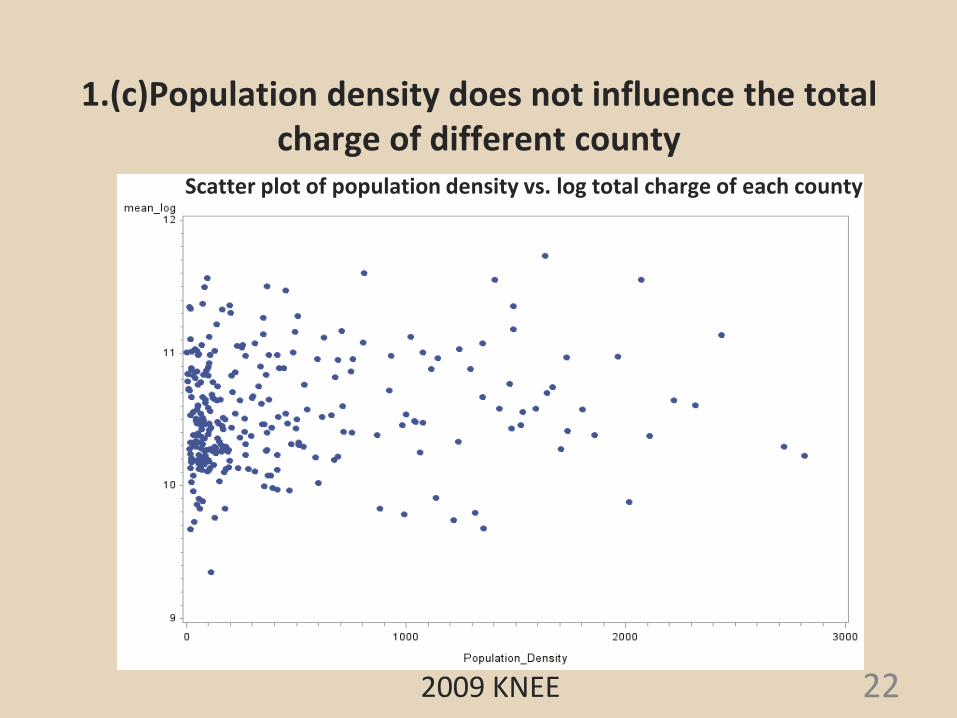
1.(c)Population density does not influence the total charge of different county
22 2009 KNEE
Scatter plot of population density vs. log total charge of each county
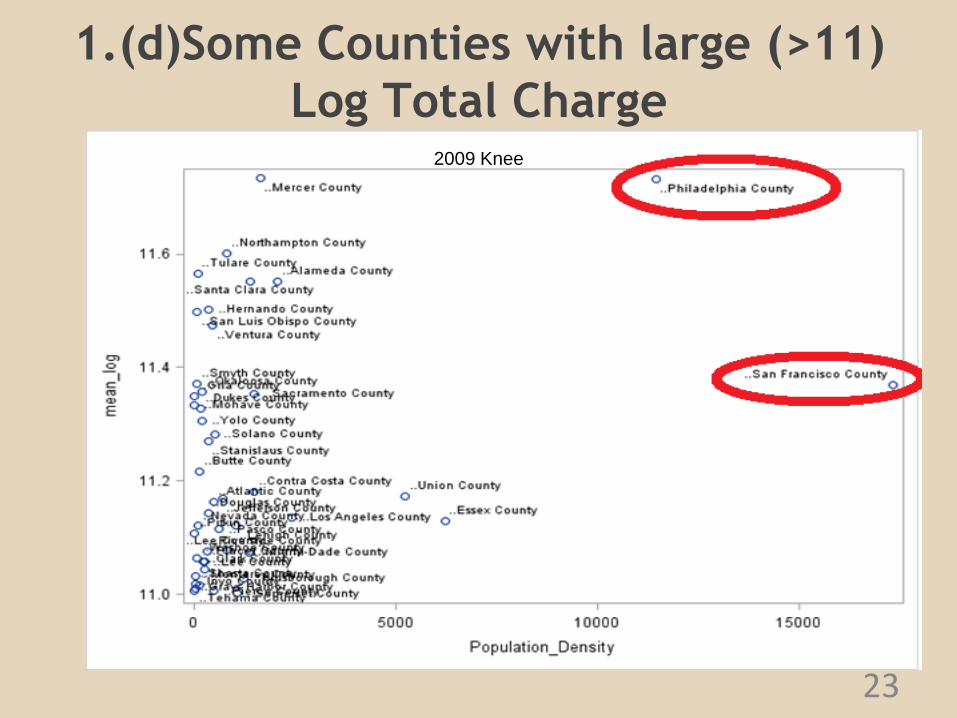
1.(d)Some Counties with large (>11)
Log Total Charge
23
2009 Knee

1. (e)Scatter Plot of GDP per Capita vs. mean of log total charge of each state
24
2009 KNEE
Merging data from Bureau of Economic Analysis

Variables Selection
• Selecting Criteria:
– Miss value less than 40%;
– P-value < 0.05;
• Selecting Methods:
– ANOVA for categorical variables
– Correlation for numerical variables
25
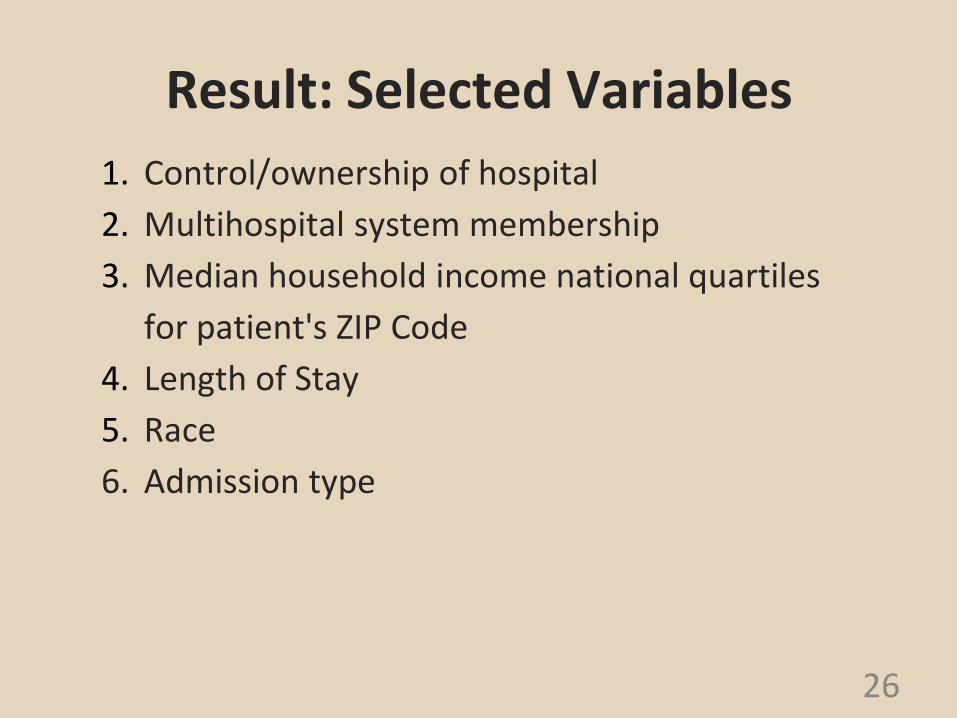
Result: Selected Variables
26
1. Control/ownership of hospital
2. Multihospital system membership
3. Median household income national quartiles
for patient's ZIP Code
4. Length of Stay
5. Race
6. Admission type
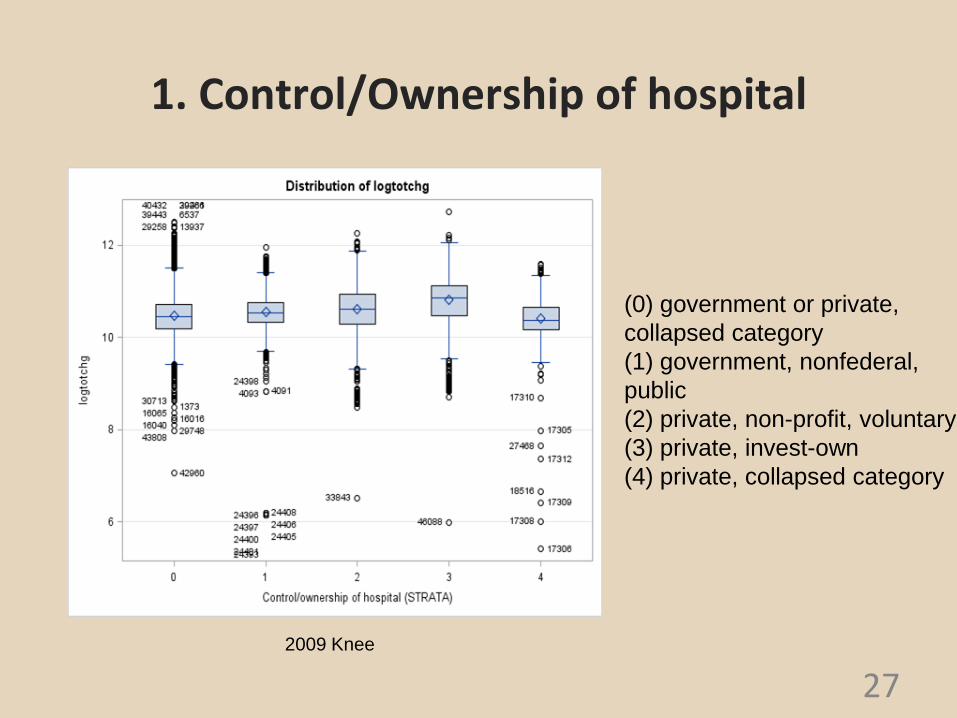
1. Control/Ownership of hospital
27
(0) government or private,
collapsed category
(1) government, nonfederal,
public
(2) private, non-profit, voluntary
(3) private, invest-own
(4) private, collapsed category
2009 Knee

Means with the same letter are not significantly different.
Scheffe
Grouping
Mean N HOSP_CONTROL
A 10.822950 6913 private, invest-own
B 10.621279 11342 private, non-profit, voluntary
C 10.555834 3748 government, nonfederal,
public
D 10.465235 26638 government or private,
collapsed category
E 10.413152 2537 private, collapsed category
1. Control/Ownership of hospital
28
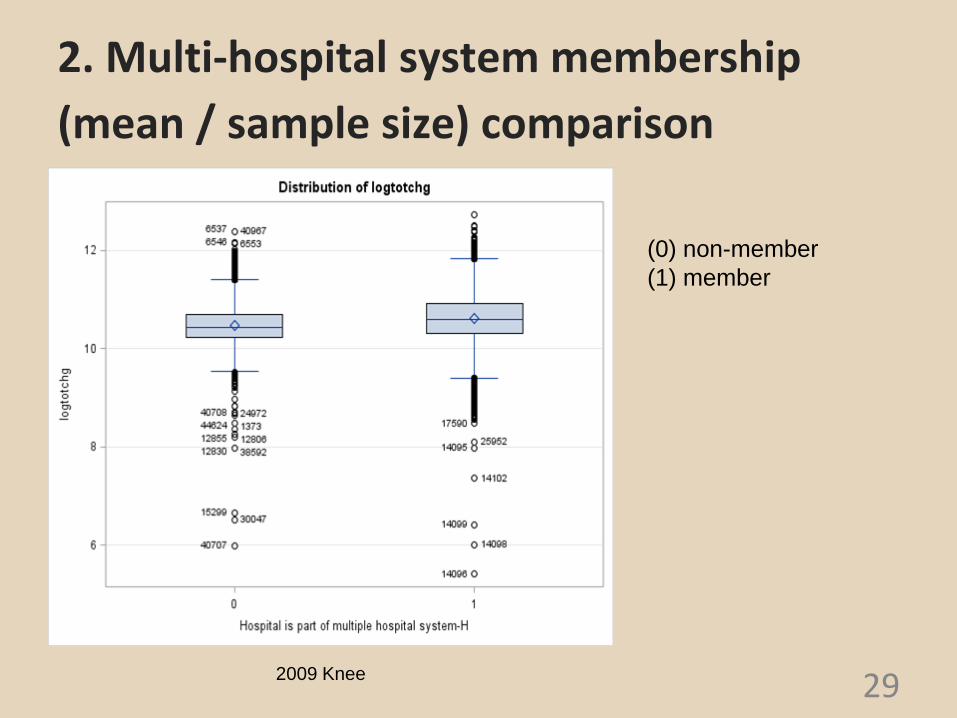
2. Multi-hospital system membership
(mean / sample size) comparison
29
(0) non-member
(1) member
2009 Knee
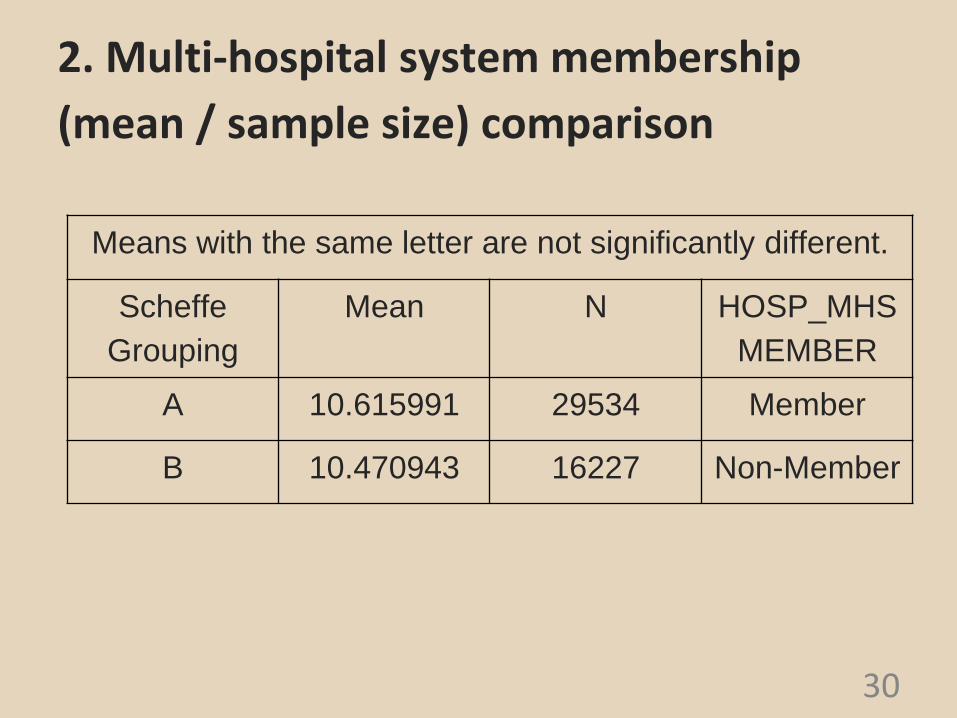
2. Multi-hospital system membership
(mean / sample size) comparison
30
Means with the same letter are not significantly different.
Scheffe
Grouping
Mean N HOSP_MHS
MEMBER
A 10.615991 29534 Member
B 10.470943 16227 Non-Member
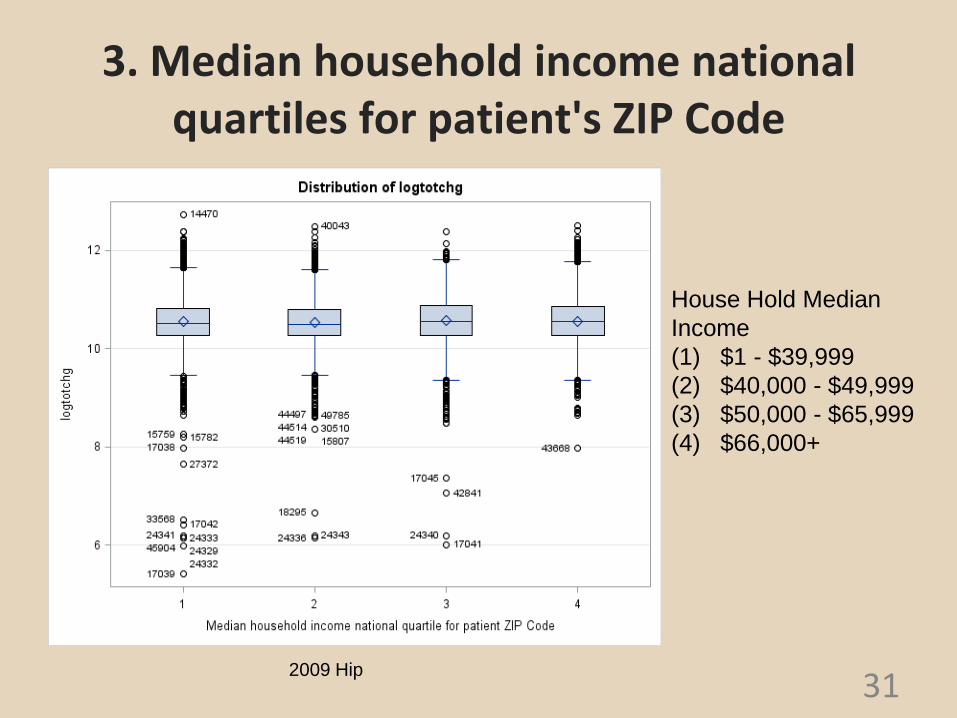
3. Median household income national quartiles for patient's ZIP Code
31
House Hold Median
Income
(1) $1 - $39,999
(2) $40,000 - $49,999
(3) $50,000 - $65,999
(4) $66,000+
2009 Hip
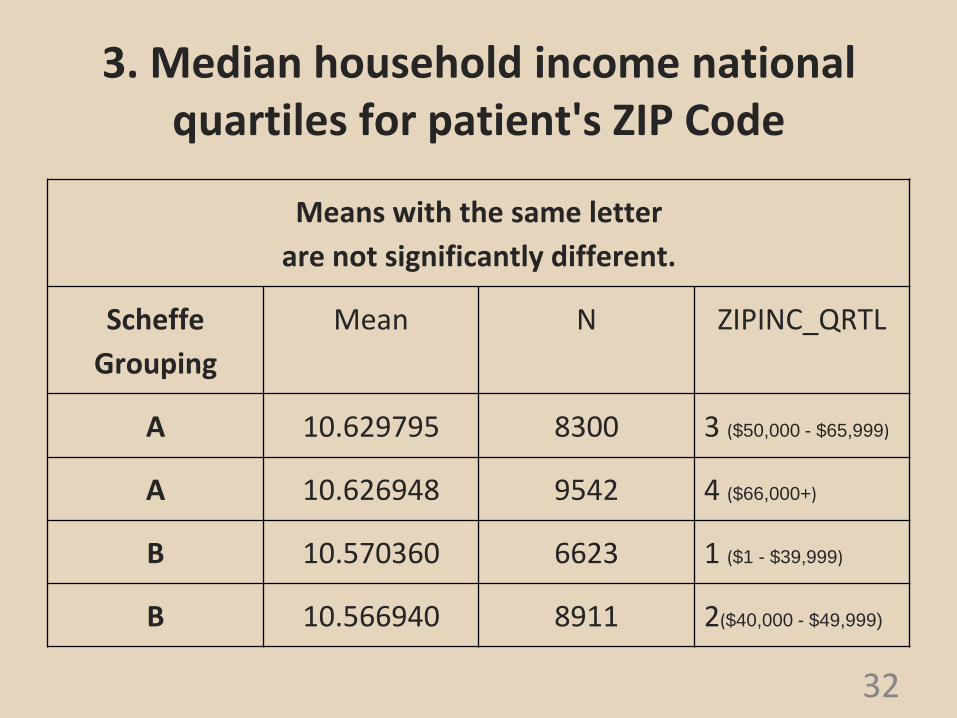
Means with the same letter
are not significantly different.
Scheffe
Grouping
Mean N ZIPINC_QRTL
A 10.629795 8300 3 ($50,000 - $65,999)
A 10.626948 9542 4 ($66,000+)
B 10.570360 6623 1 ($1 - $39,999)
B 10.566940 8911 2($40,000 - $49,999)
3. Median household income national quartiles for patient's ZIP Code
32
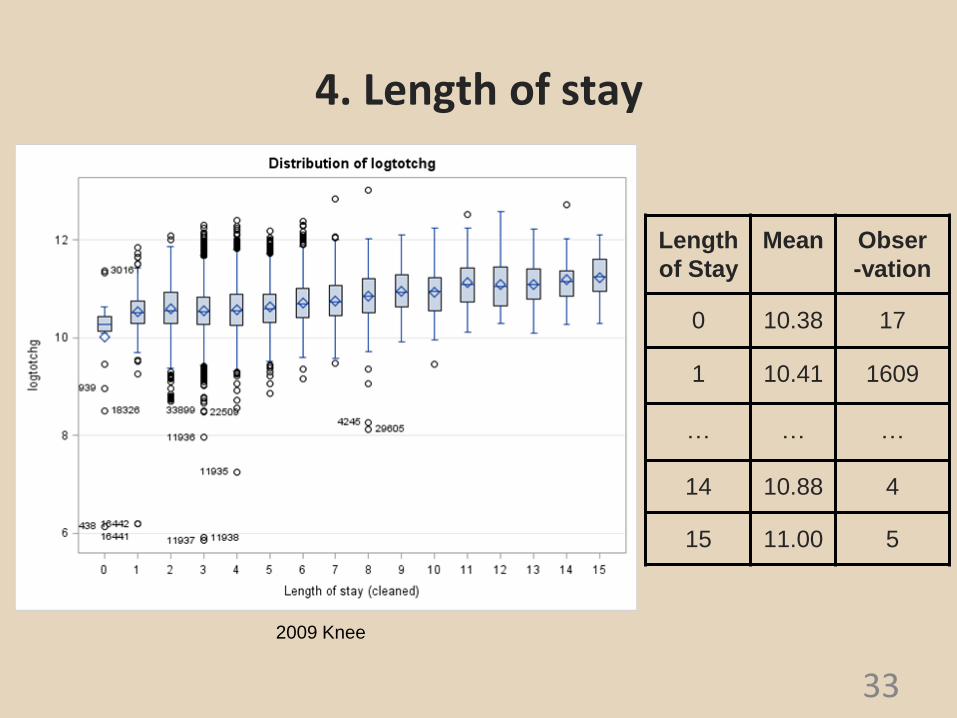
4. Length of stay
33
2009 Knee
Length
of Stay
Mean Obser
-vation
0 10.38 17
1 10.41 1609
… … …
14 10.88 4
15 11.00 5
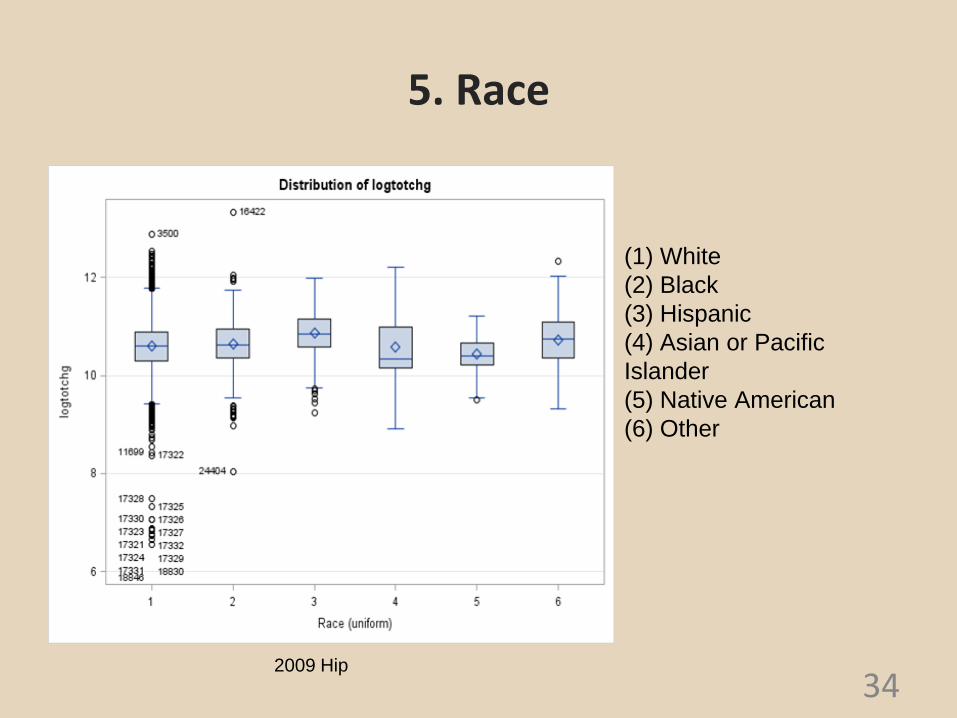
5. Race
34
(1) White
(2) Black
(3) Hispanic
(4) Asian or Pacific
Islander
(5) Native American
(6) Other
2009 Hip

Means with the same letter are not significantly different.
Scheffe
Grouping
Mean N RACE
A 10.91637 979 Hispanic
B 10.75915 370 Asian or Pacific
Islander
B 10.70530 1351 Black
B 10.70352 689 Other
C 10.59921 24933 White
D 10.49265 136 Native American
5. Race
35
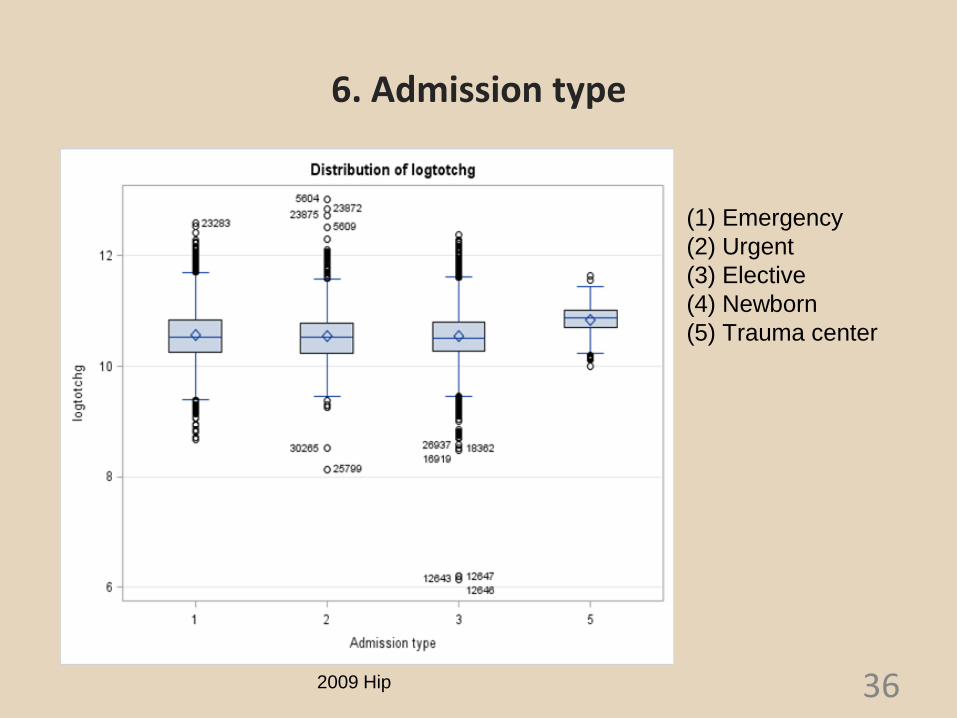
6. Admission type
36
(1) Emergency
(2) Urgent
(3) Elective
(4) Newborn
(5) Trauma center
2009 Hip

Means with the same letter
are not significantly different.
Scheffe
Grouping
Mean N ATYPE
A 10.84406 165 Trauma
Center
B 10.55698 7330 Emergency
B 10.54072 20473 Elective
B 10.53635 2744 Urgent
6. Admission type
37
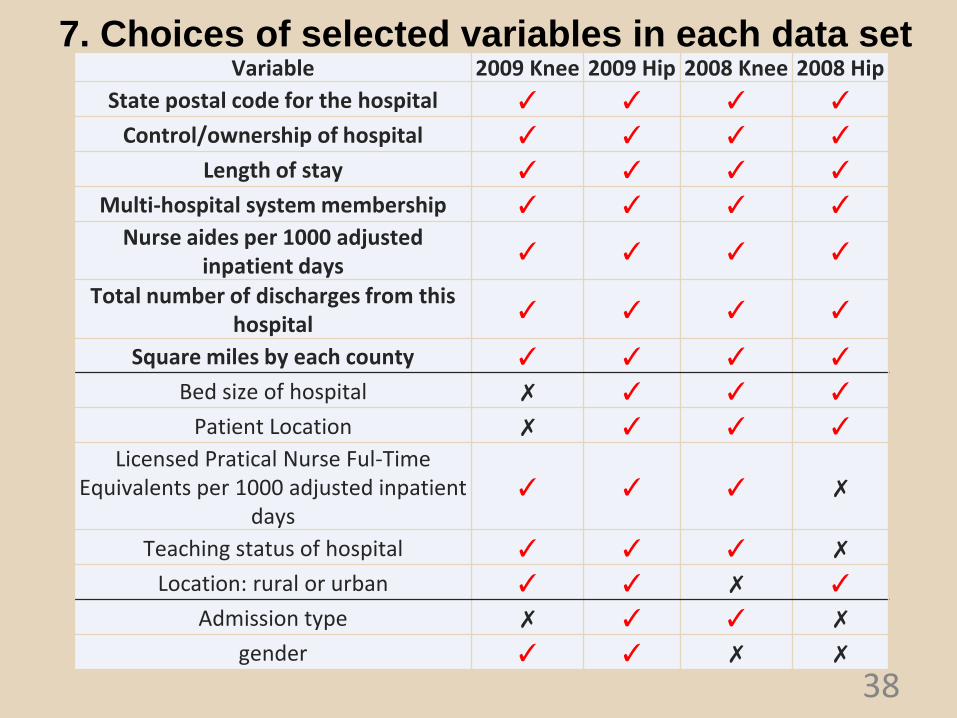
7. Choices of selected variables in each data set
38
Variable 2009 Knee 2009 Hip 2008 Knee 2008 Hip
State postal code for the hospital ✓ ✓ ✓ ✓
Control/ownership of hospital ✓ ✓ ✓ ✓
Length of stay ✓ ✓ ✓ ✓
Multi-hospital system membership ✓ ✓ ✓ ✓ Nurse aides per 1000 adjusted
inpatient days ✓ ✓ ✓ ✓
Total number of discharges from this hospital
✓ ✓ ✓ ✓
Square miles by each county ✓ ✓ ✓ ✓
Bed size of hospital ✗ ✓ ✓ ✓
Patient Location ✗ ✓ ✓ ✓ Licensed Pratical Nurse Ful-Time
Equivalents per 1000 adjusted inpatient days
✓ ✓ ✓ ✗
Teaching status of hospital ✓ ✓ ✓ ✗
Location: rural or urban ✓ ✓ ✗ ✓
Admission type ✗ ✓ ✓ ✗
gender ✓ ✓ ✗ ✗
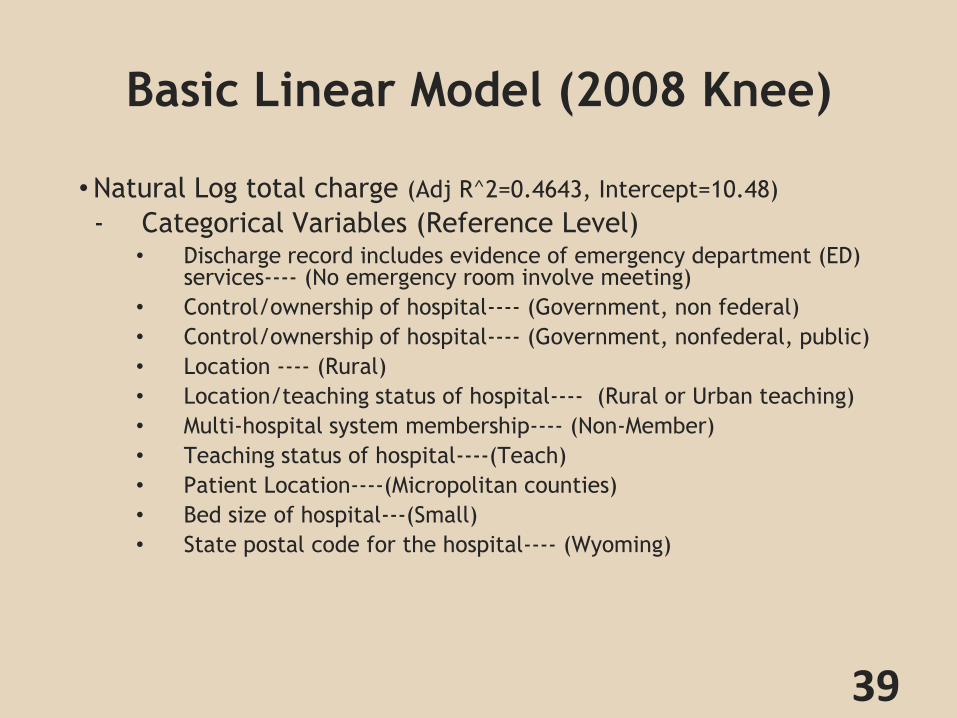
Basic Linear Model (2008 Knee)
•Natural Log total charge (Adj R^2=0.4643, Intercept=10.48)
- Categorical Variables (Reference Level) • Discharge record includes evidence of emergency department (ED)
services---- (No emergency room involve meeting)
• Control/ownership of hospital---- (Government, non federal)
• Control/ownership of hospital---- (Government, nonfederal, public)
• Location ---- (Rural)
• Location/teaching status of hospital---- (Rural or Urban teaching)
• Multi-hospital system membership---- (Non-Member)
• Teaching status of hospital----(Teach)
• Patient Location----(Micropolitan counties)
• Bed size of hospital---(Small)
• State postal code for the hospital---- (Wyoming)
39
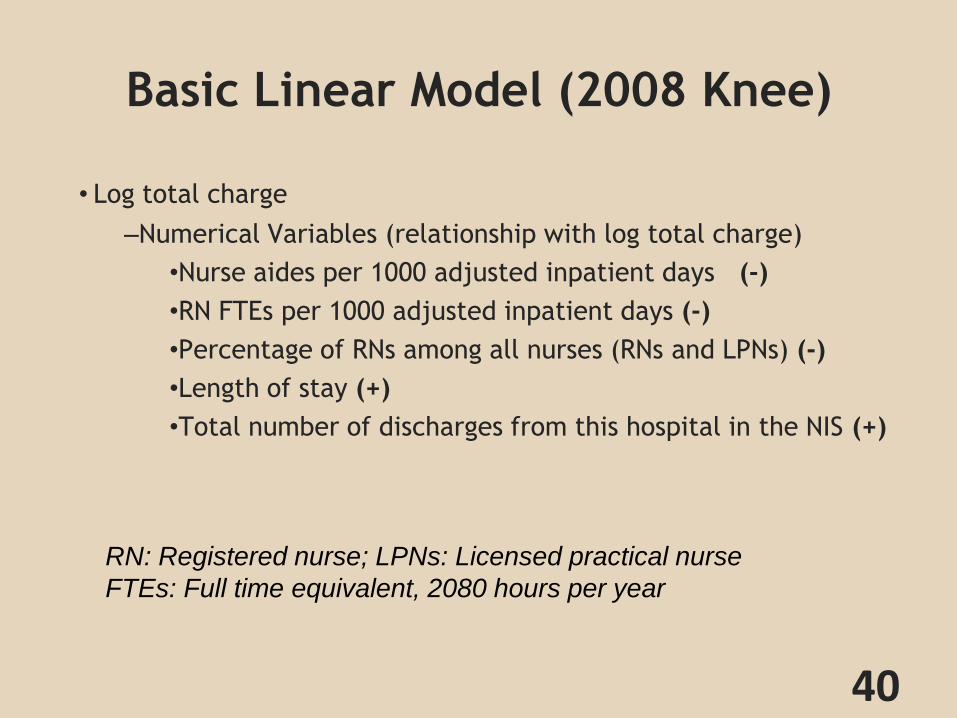
Basic Linear Model (2008 Knee)
• Log total charge
–Numerical Variables (relationship with log total charge)
•Nurse aides per 1000 adjusted inpatient days (-)
•RN FTEs per 1000 adjusted inpatient days (-)
•Percentage of RNs among all nurses (RNs and LPNs) (-)
•Length of stay (+)
•Total number of discharges from this hospital in the NIS (+)
40
RN: Registered nurse; LPNs: Licensed practical nurse
FTEs: Full time equivalent, 2080 hours per year

1. HCUP_ED
• 1. Discharge record includes evidence of emergency department (ED) services
-Reference: -(0) Record does not meet any HCUP Emergency Department criteria
- Above: -(1) Emergency Department revenue code on record
-(4) Admission source of ED
- Below: -(2) Positive Emergency Department charge (when revenue center codes are not available)
41
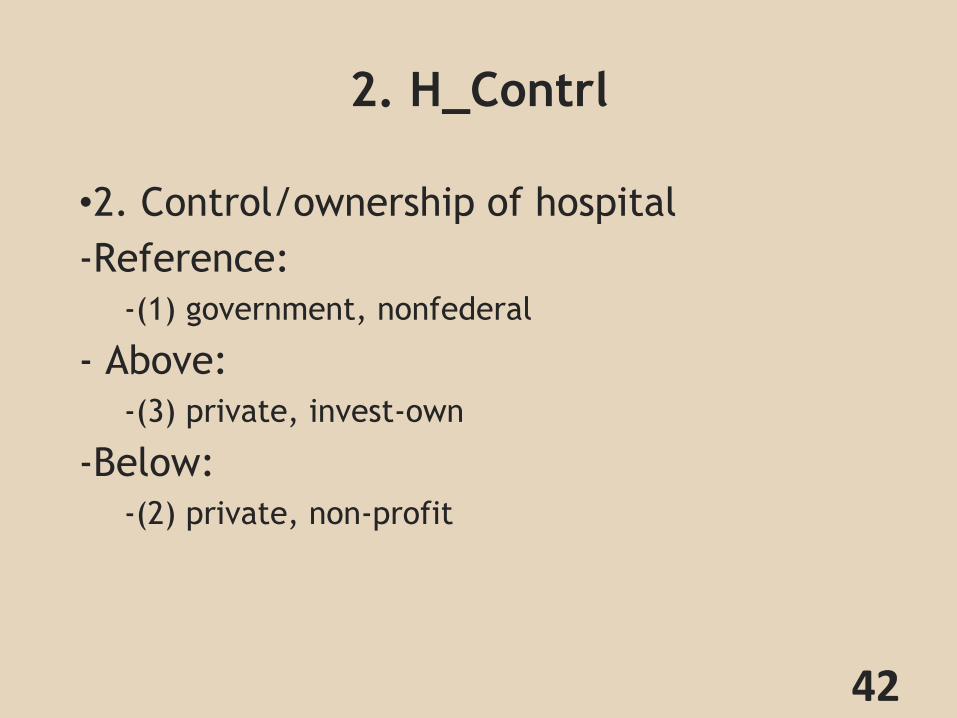
2. H_Contrl
•2. Control/ownership of hospital
-Reference:
-(1) government, nonfederal
- Above:
-(3) private, invest-own
-Below:
-(2) private, non-profit
42

3. Hosp_Control
•3. Control/ownership of hospital
-Reference:
-(1) government, nonfederal, public
-Above:
-(3) private, invest-own
-(4) private, collapsed category
-Below:
-(0) government or private, collapsed category
-(2) private, non-profit, voluntary
43
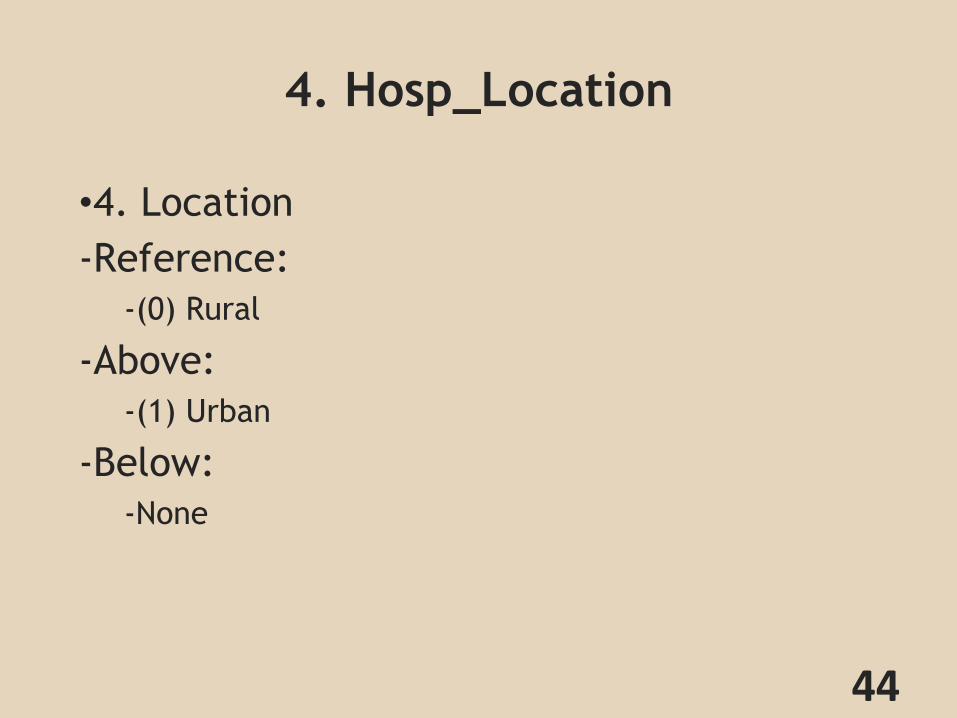
4. Hosp_Location
•4. Location
-Reference:
-(0) Rural
-Above:
-(1) Urban
-Below:
-None
44
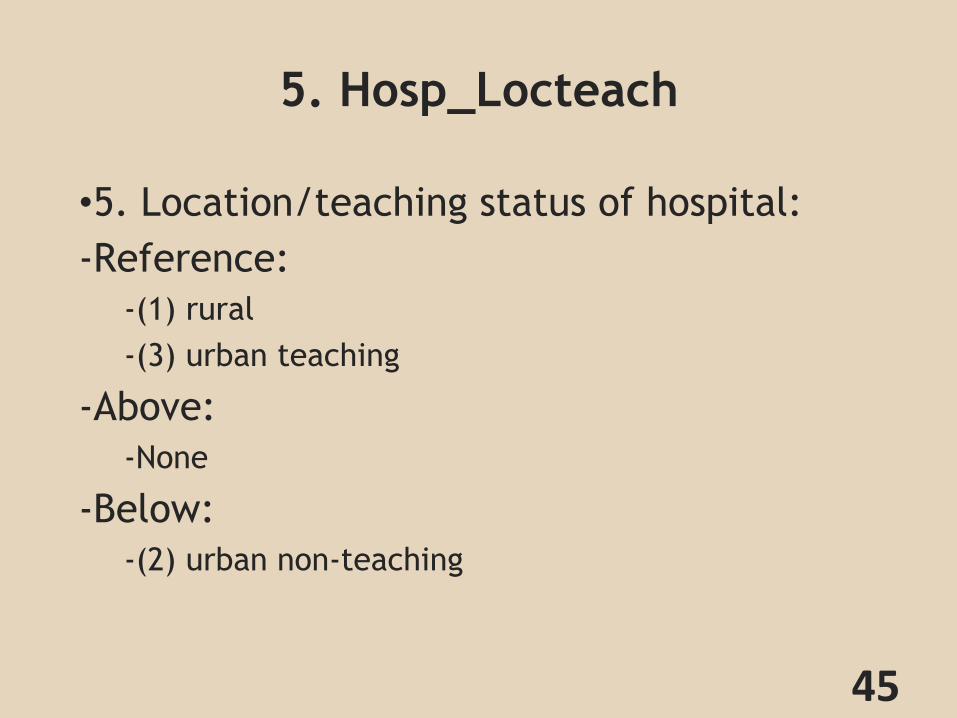
5. Hosp_Locteach
•5. Location/teaching status of hospital:
-Reference:
-(1) rural
-(3) urban teaching
-Above:
-None
-Below:
-(2) urban non-teaching
45
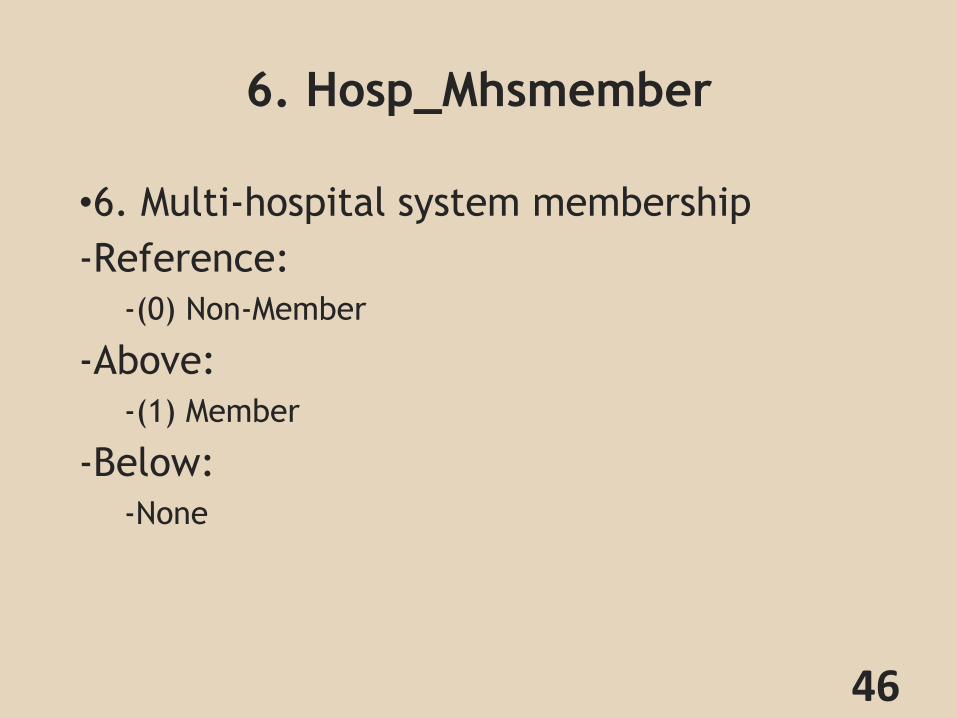
6. Hosp_Mhsmember
•6. Multi-hospital system membership
-Reference:
-(0) Non-Member
-Above:
-(1) Member
-Below:
-None
46
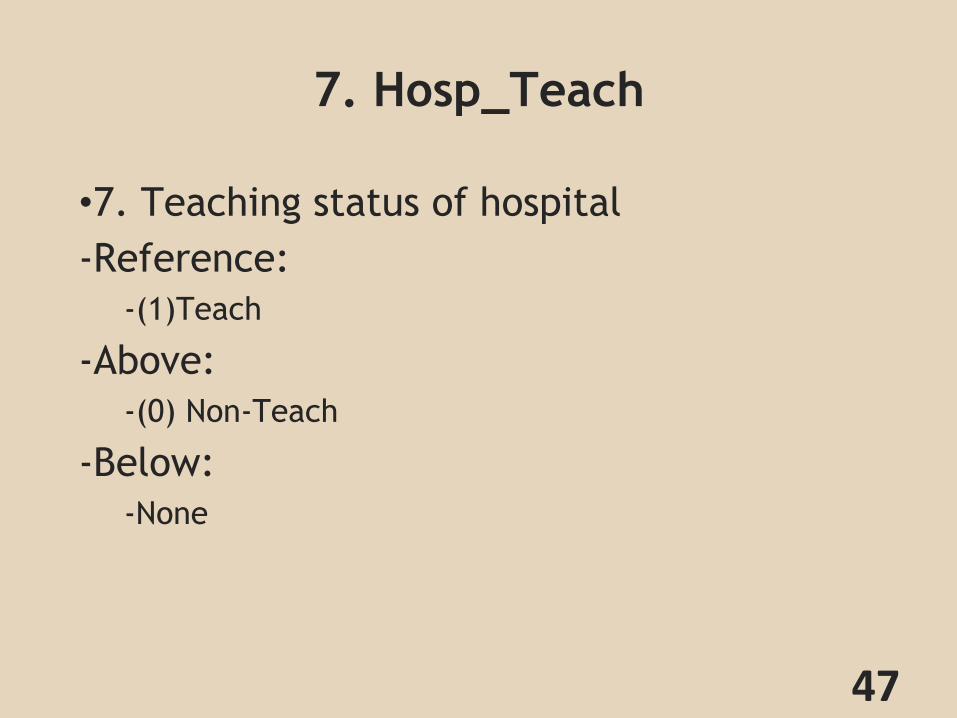
7. Hosp_Teach
•7. Teaching status of hospital
-Reference:
-(1)Teach
-Above:
-(0) Non-Teach
-Below:
-None
47
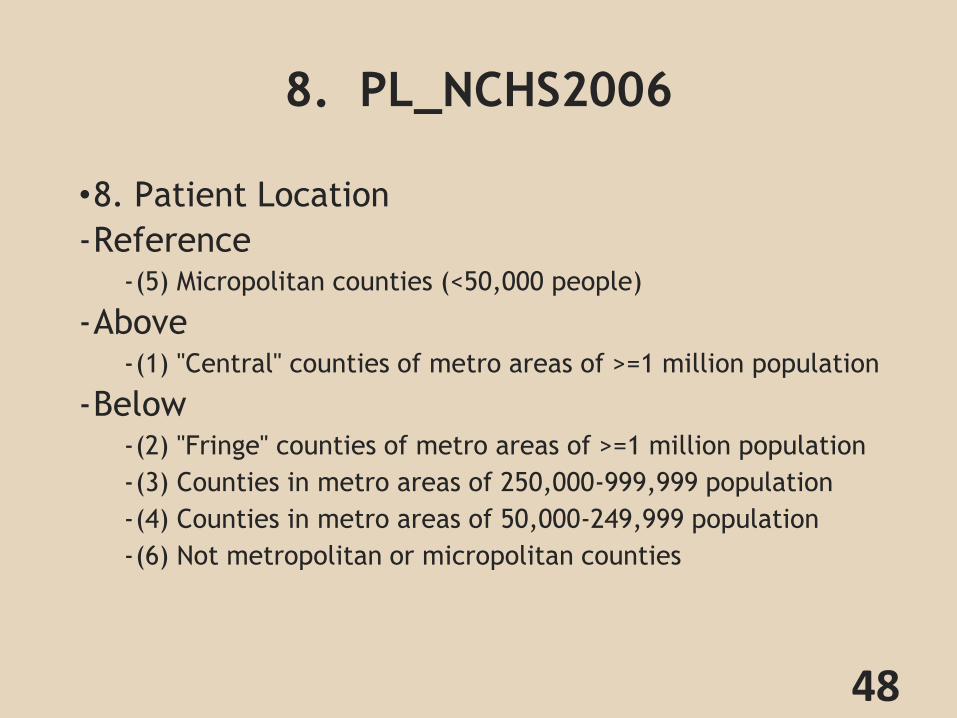
8. PL_NCHS2006
•8. Patient Location
-Reference -(5) Micropolitan counties (<50,000 people)
-Above -(1) "Central" counties of metro areas of >=1 million population
-Below -(2) "Fringe" counties of metro areas of >=1 million population
-(3) Counties in metro areas of 250,000-999,999 population
-(4) Counties in metro areas of 50,000-249,999 population
-(6) Not metropolitan or micropolitan counties
48

9. Hosp_Bedsize
•9. Bed size of hospital
-Reference
-(1) Small
-Above
-None
-Below
-(2) Medium
-(3) Large
49

10. Hospst
•10. State postal code for the hospital
-Reference -Wyoming
-Above -Arizona, Indiana, Kentucky, Louisiana, New Hampshire, New Jersey, Pennsylvania, Texas, Vermont, Washington
-Below -Arkansas, Hawaii, Iowa, Kansas, Michigan, Missouri, North Carolina, Nebraska, Nevada, New York, Oklahoma, Oregon, Rhode Island, South Dakota, Tennessee, Utah, Virginia, Wisconsin
50

Summary
• Total charge is not normally distributed. Logarithm transformed total
charge is normal
• We have found some important variables that associated with total charge
– Geographical information impacts the total charge (e.g. state, county,
square miles by each county, population, rural vs urban)
– Hospital characteristic (hospital ownership, multi-hospital system
membership; nurse aides per 1000 adjusted inpatient days)
– Care characteristic (length of stay, comorbidity)
51

Discussion
• Some limitation of our study:
– HCUP is not designed for bundle payment study. Hospital or insurance
transaction data may be better
– Our model is still preliminary, such as excluding higher level
interactions, and correlation structures.
– Time restriction. Some research can be continued after this
presentation.
52

Reference Page
[1] Organization for Economic Cooperation and Development, “OECD Health Data 2015” (2015), available at http://www.oecd.org/health/health-systems
[2] Judy Feder, Paul Ginsburg, Harriet Komisar, “’Bundling’ Payment for Episodes of Hospital Care” (2011), available at https://www.americanprogress.org
[3] Mayra Calsyn, Emily Lee, “Alternatives to Fee-for-Service Payments in Health Care” (2012), available at https://www.americanprogress.org
[4]Health Care Incentives Improvement Institute, “Bundle Payment Case Study”
[5]Integrated Healthcare Association, “Bundled Episode Payment and Gainsharing Demonstration Total Hip Replacement Definition”
[6] Integrated Healthcare Association, “Bundled Episode Payment and Gainsharing Demonstration Total Knee Replacement Definition”
53

Appendix 1:
7(b). Choices of selected variables in each data set
54
Variable 2009 Knee 2009 Hip 2008 Knee 2008 Hip Location/teaching status of hospital ✓ ✓ ✗ ✗
RN FTEs per 1000 adjusted inpatient days ✓ ✓ ✗ ✗ Percentage of RNs among all nurses (RNs
and LPNs) ✓ ✓ ✗ ✗
Population ✓ ✓ ✗ ✗ Population Density ✓ ✓ ✗ ✗
Race ✓ ✓ ✗ ✗
LRN FTEs per 1000 adjusted inpatient days ✓ ✓ ✗ ✗
Number of procedures coded on the original record
✗ ✓ ✗ ✓
Percentage of all surgeries performed in outpatient setting
✓ ✗ ✗ ✓
AHRQ comorbidity measure: Deficiency anemias
✗ ✗ ✓ ✗
Disease Staging: Principal Disease Category ✗ ✗ ✓ ✗ Indicates elective admission ✗ ✗ ✓ ✗
Number of E codes coded on the original record
✓ ✗ ✗ ✗
Procedure 1 ✗ ✗ ✗ ✓ Point of origin for admission or visit ✗ ✓ ✗ ✗
Discharge record includes evidence of emergency department (ED) services
✗ ✓ ✗ ✗

Appendix 2: P-Value
•State:
–1. Population----significant (p=0.0078)
–2. GDP Per Capita----not significant (p=0.3555)
•County
–1. Population---significant(p=0.0001)
–2. Population Density---not significant(p=0.4273)
55