Refractive-index and density matching in concentrated ...edge.rit.edu/edge/P13051/public/Research...
24
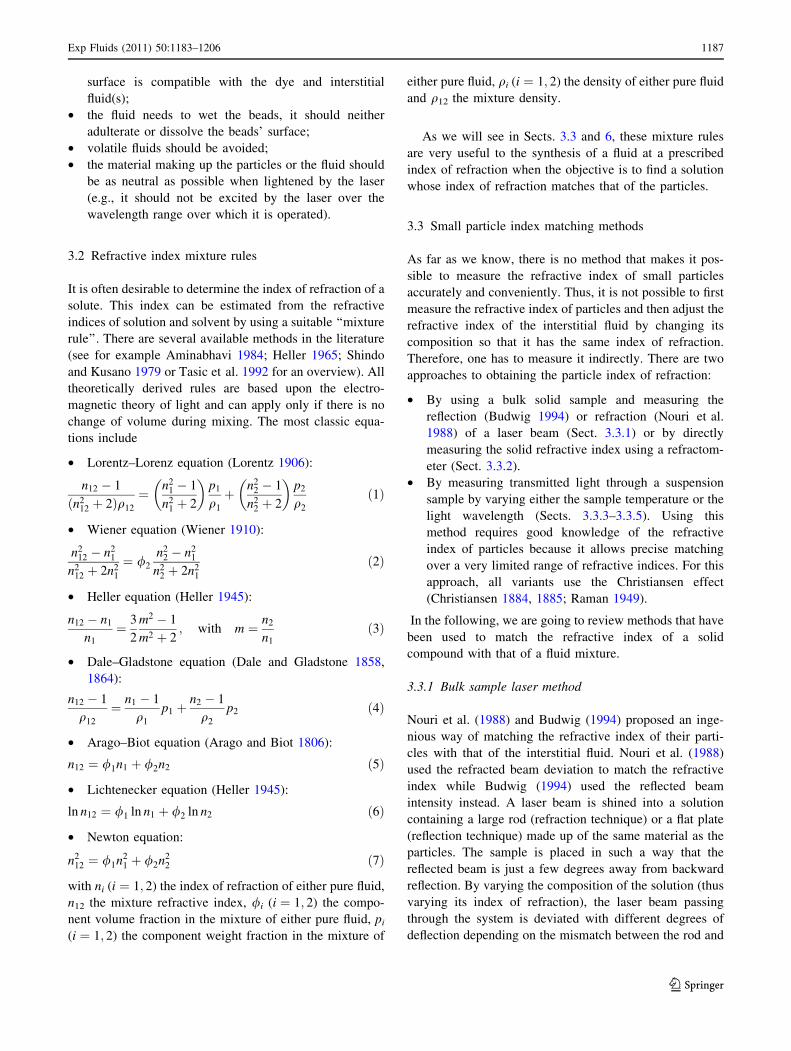
REVIEW ARTICLE Refractive-index and density matching in concentrated particle suspensions: a review Se ´bastien Wiederseiner • Nicolas Andreini • Gae ¨l Epely-Chauvin • Christophe Ancey Received: 8 July 2010 / Revised: 28 September 2010 / Accepted: 15 October 2010 / Published online: 5 November 2010 Ó Springer-Verlag 2010 Abstract Optical measurement techniques such as particle image velocimetry (PIV) and laser Doppler velocimetry (LDV) are now routinely used in experimental fluid mechanics to investigate pure fluids or dilute sus- pensions. For highly concentrated particle suspensions, material turbidity has long been a substantial impediment to these techniques, which explains why they have been scarcely used so far. A renewed interest has emerged with the development of specific methods combining the use of iso-index suspensions and imaging techniques. This review paper gives a broad overview of recent advances in visualization techniques suited to concentrated particle suspensions. In particular, we show how classic methods such as PIV, LDV, particle tracking velocimetry, and laser induced fluorescence can be adapted to deal with concen- trated particle suspensions. 1 Introduction A large number of flows involve suspensions of particles in fluids. Typical examples include gravity-driven geophysical flows such as snow avalanches, debris flows, turbidity cur- rents, pyroclastic flows, etc. Industrial pastes such as drilling muds, concrete, cosmetic pastes, pharmaceutical pastes, composites or foodstuffs offer other examples of particulate suspensions (Ancey 2007). Concentrated particle suspen- sions exhibit non-Newtonian rheological properties and, over the last few years, a great deal of work has been done to understand their flow behavior. First attempts to model particle suspension date back to the beginning of the last century with the work of Einstein (1906, 1911). Since that time, a large body of work has been done in this field, with substantial theoretical, numerical, and experimental devel- opments. A short and recent summary of the state of art can be found in the review paper by Mewis and Wagner (2009), but given the wide spectrum of topics in line with the dynamics of suspensions, there is no comprehensive review of this growing field. Despite many rheometric investiga- tions into the rheology of concentrated particle suspension, many questions have as yet received little answers. Exper- imental studies of these materials are faced with measure- ment problems that make the results difficult to analyze and understand. All usual difficulties encountered in rheometry such as bottom-end effects, sample rupture (especially at high particle fraction), free surface deformation and flow instabilities are amplified, with little ways of alleviating their disturbing effects. Additional effects arise with con- centrated suspensions: wall slip [due mainly to particle depletion at the wall (Barnes 1995; Jana et al. 1995), shear localization (Ancey and Coussot 1999; Coussot 2005), particle migration/segregation (Abott et al. 1991), and the finite-size limit when classic narrow-gap Couette cells are used (Ancey 2005)]. There has been a significant change of perception in the experimental study of concentrated particle suspen- sions over the last two decades. Until the late 1980s, most of the knowledge stemmed from macroscopic measure- ments obtained by using classic rheometers and viscom- etry theory (Walters 1975). Indeed, according to this theory, the flow curve (i.e., the relation between the shear S. Wiederseiner (&) N. Andreini G. Epely-Chauvin C. Ancey Laboratoire d’Hydraulique Environnementale, Ecole Polytechnique Fe ´de ´rale de Lausanne, 1015 Lausanne, Switzerland e-mail: [email protected]fl.ch 123 Exp Fluids (2011) 50:1183–1206 DOI 10.1007/s00348-010-0996-8
Transcript of Refractive-index and density matching in concentrated ...edge.rit.edu/edge/P13051/public/Research...
REVIEW ARTICLE
Refractive-index and density matching in concentrated particlesuspensions: a review
Sebastien Wiederseiner • Nicolas Andreini •
Gael Epely-Chauvin • Christophe Ancey
Received: 8 July 2010 / Revised: 28 September 2010 / Accepted: 15 October 2010 / Published online: 5 November 2010
� Springer-Verlag 2010
Abstract Optical measurement techniques such as
particle image velocimetry (PIV) and laser Doppler
velocimetry (LDV) are now routinely used in experimental
fluid mechanics to investigate pure fluids or dilute sus-
pensions. For highly concentrated particle suspensions,
material turbidity has long been a substantial impediment
to these techniques, which explains why they have been
scarcely used so far. A renewed interest has emerged
with the development of specific methods combining the
use of iso-index suspensions and imaging techniques. This
review paper gives a broad overview of recent advances in
visualization techniques suited to concentrated particle
suspensions. In particular, we show how classic methods
such as PIV, LDV, particle tracking velocimetry, and laser
induced fluorescence can be adapted to deal with concen-
trated particle suspensions.
1 Introduction
A large number of flows involve suspensions of particles in
fluids. Typical examples include gravity-driven geophysical
flows such as snow avalanches, debris flows, turbidity cur-
rents, pyroclastic flows, etc. Industrial pastes such as drilling
muds, concrete, cosmetic pastes, pharmaceutical pastes,
composites or foodstuffs offer other examples of particulate
suspensions (Ancey 2007). Concentrated particle suspen-
sions exhibit non-Newtonian rheological properties and,
over the last few years, a great deal of work has been done to
understand their flow behavior. First attempts to model
particle suspension date back to the beginning of the last
century with the work of Einstein (1906, 1911). Since that
time, a large body of work has been done in this field, with
substantial theoretical, numerical, and experimental devel-
opments. A short and recent summary of the state of art can
be found in the review paper by Mewis and Wagner (2009),
but given the wide spectrum of topics in line with the
dynamics of suspensions, there is no comprehensive review
of this growing field. Despite many rheometric investiga-
tions into the rheology of concentrated particle suspension,
many questions have as yet received little answers. Exper-
imental studies of these materials are faced with measure-
ment problems that make the results difficult to analyze and
understand. All usual difficulties encountered in rheometry
such as bottom-end effects, sample rupture (especially at
high particle fraction), free surface deformation and flow
instabilities are amplified, with little ways of alleviating
their disturbing effects. Additional effects arise with con-
centrated suspensions: wall slip [due mainly to particle
depletion at the wall (Barnes 1995; Jana et al. 1995), shear
localization (Ancey and Coussot 1999; Coussot 2005),
particle migration/segregation (Abott et al. 1991), and the
finite-size limit when classic narrow-gap Couette cells are
used (Ancey 2005)].
There has been a significant change of perception in
the experimental study of concentrated particle suspen-
sions over the last two decades. Until the late 1980s, most
of the knowledge stemmed from macroscopic measure-
ments obtained by using classic rheometers and viscom-
etry theory (Walters 1975). Indeed, according to this
theory, the flow curve (i.e., the relation between the shear
S. Wiederseiner (&) � N. Andreini � G. Epely-Chauvin �C. Ancey
Laboratoire d’Hydraulique Environnementale,
Ecole Polytechnique Federale de Lausanne,
1015 Lausanne, Switzerland
e-mail: [email protected]
123
Exp Fluids (2011) 50:1183–1206
DOI 10.1007/s00348-010-0996-8
stress s and shear rate _c) can be derived from bulk
measurements (i.e., torque and rotational velocity in
classic rheometers) by solving an inverse problem. While
performing well for most fluids of practical interest, vis-
cometry theory runs into difficulties with complex fluids,
since many of the assumptions needed to solve the inverse
problem (such as fluid homogeneity and the existence of a
one-to-one relation between stress and rate of strain) are
no longer valid. In the last 20 years, a new trend has
emerged, with emphasis given to visualization techniques
to derive the flow curve directly. For instance, sophisti-
cated tools such as Magnetic Resonance Imaging (MRI)
are now increasingly used to visualize flow behavior
inside a rheometer (Bonn et al. 2008; Coussot et al. 2003;
Ovarlez et al. 2006). The reader is referred to the review
papers of Callaghan (1999), Elkins and Alley (2007) and
Fukushima (1999) to get a better idea of the potential of
MRI techniques in fluid mechanics. These wonderful
techniques are, however, not free of problems. For
instance, their spatial and temporal resolutions are often
not high enough when studying complex suspensions with
time-dependent response. Furthermore, they also involve
heavy procedures and expensive tools that make them
hardly versatile and user-friendly. In a few investigations
on concentrated particle suspensions, Acoustic doppler
velocimetry (ADV) has also been used to measure
velocity profiles (Ouriev 2000, 2002). As this technique is
still in the early stages of development for concentrated
particle suspensions, we lack perspective concerning these
techniques.
Another approach involves using image-processing
techniques to visualize what occurs inside the flow. A
major impediment arises, however, with most fluids since
they are opaque. With particle suspensions, it is sometimes
possible to get round this issue by matching the refractive
index of both the solid and liquid components to obtain a
transparent suspension. While the principle is straightfor-
ward, its implementation is far less simple. Once this has
been achieved, classic optical techniques such as particle
image velocimetry (PIV), particle tracking velocimetry
(PTV), Laser Doppler Velocimetry (LDV) or Laser
Induced Fluorescence (LIF) can be used (see ‘‘Appendix
1’’ for references). There are many advantages of this
approach over magnetic resonance imaging and nuclear
magnetic resonance (NMR) techniques: reasonable cost,
robustness and versatility of the techniques, greater accu-
racy. There are also drawbacks: transparent suspensions
must be used and experiments are highly sensitive to
temperature and humidity changes, which imposes a rig-
orous experimental protocol. As we shall see in the present
work, a careful refractive index matching (RIM) procedure
is the key to obtaining reliable measurements in concen-
trated particle suspensions.
In recent years, RIM techniques have undergone a tre-
mendous development, with numerous applications in flow
visualization (in engines, arteries, etc.), density currents
in tanks, porous media, and more recently concentrated
suspensions. With the wealth of ideas and special methods
developed in this growing field, it is difficult to draw the
boundaries of RIM-based visualization techniques with any
confidence; in particular, the newcomer to the field gets
quickly lost in the abundance of details and recipes that can
be found in the technical literature, while at the same time,
there is no comprehensive monograph that provides guid-
ance on these techniques. In addition, while RIM-based
methods are reasonably simple to use in visualization
problems in which there are only a few fluid–solid and
solid–fluid interfaces through which one would like to see,
they become much more demanding when the number of
interfaces increases significantly. For instance, if we take a
10 cm thick sample made up of 1-mm particles, there are at
least 200 interfaces to cross if we want to see through the
sample. The point is that each interface introduces slight
mismatches in the refractive index, which cumulate and
eventually cause image deformation that affects flow
measurement. For this reason, there is a maximal distance
in multi-interface materials, above which no measurement
is possible. For many applications, increasing this limiting
distance is of great importance.
This paper is a first stab at reviewing RIM techniques.
The main objective is to show how refractive-index-
matching techniques can be used to visualize what occurs
in concentrated particle suspensions. A second objective is
to address visualization problems of particular relevance to
multi-interface systems such as particle suspensions.
Indeed, while RIM techniques are not new, their use in
complex systems characterized by numerous optical inter-
faces is made difficult unless optimal matching in the
refractive index is achieved. Our intent is thus not only to
review some techniques that makes this optimal matching
possible, but also to provide practical information such as
couples of fluids and materials that are well suited to this
purpose.
The paper is divided into two parts. The first part is
devoted to the presentation of the techniques. After a short
summary of applications (see Sect. 2), we outline the
refractive-index-matching techniques that are well suited to
preparing transparent concentrated particle suspensions in
Sect. 3 We confine attention to specific flow visualization
techniques based on tracers in Sect. 4 The second part of
the paper describes some examples of application that stem
from a set of experiments we have conducted in recent
years. After many trials and errors, we managed to find
appropriate materials (see Sect. 5) and to work out high-
quality matching techniques (see Sect. 6) for highly
concentrated suspensions. We illustrate these techniques
1184 Exp Fluids (2011) 50:1183–1206
123
through the Couette-cell experiment (in which a concen-
trated particle suspension is poured into the gap separating
two rotating cylinders). The goal of this experiment was to
derive the flow curve sð _cÞ by differentiating the velocity
profile across the gap, which can be measured using RIM
techniques. In Sect. 7, we show on this particular example
how particles were tagged to be tracked by a camera, while
Sect. 8 presents the final results.
2 Examples of application
RIM techniques are relatively old, with the first applica-
tions dating back to the 1950s. It was however not until
the late 1980s that the experimental protocol was more
formally established with the seminal papers of Nouri
et al. (1988) and Koh (1991). Since then, several authors
have elaborated on the refraction technique worked out by
Nouri et al. (1988). Here, we provide some typical
applications over the last 50 years, which can help the
reader to contextualize the techniques with respect to
applications.
2.1 Fluidized beds and particle suspensions
As far as we know, RIM techniques were first used to
investigate fluidized beds of concentrated noncolloidal
particle suspensions (Handley 1957). Abbas and Crowe
(1987) and Karnis et al. (1966) studied the flow properties
of a homogeneous slurry and Chen and Fan (1992) the flow
three-dimensional structure. Ackerson and Pusey (1988)
looked at particle ordering. Breedveld et al. (1998, 2001a,
b, 2002) and Leighton and Acrivos (1987) studied self-
diffusion in particle suspensions and Graham and Bird
(1984) particle clustering. Ham and Homsy (1988), Kapoor
and Acrivos (1995) and Nicolai et al. (1995, 1996) exam-
ined settling suspensions. Jana et al. (1995) observed wall
slip effects for concentrated suspensions. Kohnen and
Bohnet (2001) considered the suspension flow in an agi-
tated vessel. Lenoble et al. (2005a) and Wiederseiner
(2010) measured the velocity profiles in a rheometer (in a
parallel-plate and a wide-gap Couette cell, respectively).
Averbakh et al. (1997), Koh et al. (1994), Lyon and Leal
(1998a, b), Park et al. (1989), Shauly et al. (1997), and
Zisselmar and Molerus (1979) observed the flow of con-
centrated slurries in pipes. Wildman et al. (1992) looked at
pipe contraction flows. Chen et al. (2005) and Mikami
et al. (2001) studied natural flow convection in particle
suspensions. Colloidal suspensions were also studied by
Chaudhuri et al. (2008), Dibble et al. (2006), Gao and
Kilfoil (2007), Kaufman and Weitz (2006), Kegel and van
Blaaderen (2000) and Weeks et al. (2000).
2.2 Porous media
RIM techniques have also been abundantly used to inves-
tigate fluid flows through porous media or closely packed
beds. Typical examples include the works of Cenedese and
Viotti (1996), Hassan and Dominguez-Ontiveros (2008),
Johnston et al. (1975), Kubo et al. (1978), Montemagno
and Gray (1995), Moroni and Cushman (2001), Northrup
et al. (1991a, b, 1993), Okumura et al. (2005), Peurrung
et al. (1995), Rashidi et al. (1996), Saleh et al. (1992),
Stephenson and Stewart (1986), Stohr et al. (2003), and
Yarlagadda and Yoganathan (1989).
2.3 Flows through complex geometries
RIM techniques make it possible to use classic optical
measurement methods in complex and curved geometries.
For instance, Varty (1984) and Zerai et al. (2005) used
RIM fluids to better understand fluid flow into heat
exchangers. Uzol et al. (2002) examined the flow near the
blades of a turbo-pump with a rotor, stator, and blades
made up of polymethylmetacrylate (PMMA). Bovendeerd
et al. (1987), Durst et al. (1988), Jacobs et al. (1988), and
Parker and Merati (1996) were able to look through curved
walls such as circular pipes or Couette cells. Liu et al.
(1990) visualized the coolant passages of an internal
combustion engine. Hopkins et al. (2000) characterized the
flow into an optically transparent nasal cavity and Budwig
(1994), Gijsen et al. (1996) and Nguyen et al. (2004) the
flow in arteries. Alahyari and Longmire (1994), Atsava-
pranee and Gharib (1997), Augier et al. (2003), Daviero
et al. (2001), Hannoun et al. (1988) and McDougall (1979)
used two sets of immiscible refractive-index-matched flu-
ids to measure into density-stratified flows.
3 Refractive index matching
Optical visualization into concentrated particle suspensions
calls for convenient methods for matching the fluid and
particle indices of refraction. In principle, the more accu-
rate this matching is, the higher visibility is within the
suspension. There are, however, numerous impediments to
high visibility: as a result of the manufacturing process,
particles may not have the same index of refraction;
impurities in the particles or in the fluid (e.g., gas bubble)
reduce the field of visibility; temperature gradients within
the suspension also alter this field. As a consequence, the
first step—and perhaps the most important—is to select
particles with excellent optical properties (constant index
of refraction, few impurities, etc.). Needless to say that
with particles of insufficient quality, the particle suspension
remains opaque even with the ‘‘best’’ matched fluid (see for
Exp Fluids (2011) 50:1183–1206 1185
123

example Fig. 1). Here, we outline RIM techniques that are
well suited to multi-interface systems.
3.1 Index-matching material for concentrated particle
suspensions
For particles, we must select transparent materials. This
includes plastics, glass, and certain synthetic rubbers. Nylon,
polycarbonate (PC), polyetheretherketone (PEEK), poly-
ethyleneterephthalate (PET), polystyrene (PS), polyvinyl-
chloride (PVC), styrene/acrylonitrile copolymer (SAN) and
glasses are mostly excluded because they exhibit too high
refractive indices. Indeed the latter (hereafter referred to as
nD) often exceeds 1.5, as shown in Table 1, which would
require liquids with refractive indices above 1.580. Such
liquids are rare, and most of them are toxic. Some examples
are Aniline (nD ¼ 1:586), Bromoform (nD ¼ 1:590), Iodo-
benzene (nD ¼ 1:620), Quinoline (nD ¼ 1:620), and Carbon
disulfide (nD ¼ 1:625). Some potential candidates are
merely too expensive.
Many plastics (refractive index within the 1.37–1.50
range) are transparent if they are free of fillers or other
impurities and provided that they are in the amorphous
state or have a crystalline structure smaller than the
wavelength of the light incident upon the plastic. Among
synthetic rubbers only silicone rubber (nD ¼ 1:42) is
transparent. Only a few plastics (polymethylmethacrylate,
polytetrafluoroethylene, fluorinated ethylene-propylene,
tetrafluoroethylene) are manufactured industrially in the
transparent (amorphous) form. Crystalline polymers can
be made transparent by heating above the ‘‘melting
temperature’’, at which there is a transition to the
amorphous state, followed by rapid quenching to room
temperature. The plastics listed in Table 2 have refrac-
tive indices lower than 1.49 in the amorphous state.
There are many possible fluid mixtures to achieve index
matching for nD \ 1.49. In this case, mixture toxicity
depends on the fluids used for RIM. Appendix 2 gives a
non-exhaustive list of fluids that have been used in the
literature.
For the interstitial fluid, we have often to mix different
components to obtain a solution with the desired index of
refraction, viscosity, and density. Additional criteria are
also important:
• optical quality of both the fluid and beads should be
checked carefully: the index of refraction must stay
constant, fluid absorption must be negligible, materials
must not be spoiled with impurities and inclusions;
• the particles’ surface may be tagged by fluorescent dyes
and in this case, it should be checked that the state of
Fig. 1 Optical quality of the
beads: a particles with good
optical properties, b slightly
opaque particles with gas
bubble inclusions
Table 1 Possible RIM candidates with high-index fluids
RI Melting temp.
(�C)
Nylon 6,6 1.565 255
Polycarbonate (PC) 1.586 267
Polyetheretherketone (PEEK) 1.65–1.77 334
Polyethyleneterephthalate (PET) 1.575 68
Polystyrene (PS) 1.59 100
Polyvinylchloride (PVC) 1.54 80
Styrene/acrylonitrile copolymer
(SAN)
1.57 100
Table 2 Possible RIM candidates with low-index fluids
RI Melting temp. (�C)
Fluorinated ethylene-propylene
(FEP)
1.34 340
Fused quartz 1.458 1,650
Glass 1.47–1.65 500–1,100
Polychlorotrifluoroethylene (PCTFE) 1.435 216
Polyformaldehyde (POM) 1.41 175–180
Polymethylmethacrylate (PMMA) 1.49 130–140
Polysiloxane (Silicone rubber) 1.40 300
Polytetrafluoroethylene (PTFE) 1.38 327
Polyvinylacetate (PVA) 1.466 230
Silica gel 1.472 1,610
Tetrafluoroethylene (TFE) 1.34 –
1186 Exp Fluids (2011) 50:1183–1206
123
surface is compatible with the dye and interstitial
fluid(s);
• the fluid needs to wet the beads, it should neither
adulterate or dissolve the beads’ surface;
• volatile fluids should be avoided;
• the material making up the particles or the fluid should
be as neutral as possible when lightened by the laser
(e.g., it should not be excited by the laser over the
wavelength range over which it is operated).
3.2 Refractive index mixture rules
It is often desirable to determine the index of refraction of a
solute. This index can be estimated from the refractive
indices of solution and solvent by using a suitable ‘‘mixture
rule’’. There are several available methods in the literature
(see for example Aminabhavi 1984; Heller 1965; Shindo
and Kusano 1979 or Tasic et al. 1992 for an overview). All
theoretically derived rules are based upon the electro-
magnetic theory of light and can apply only if there is no
change of volume during mixing. The most classic equa-
tions include
• Lorentz–Lorenz equation (Lorentz 1906):
n12 � 1
ðn212 þ 2Þq12
¼ n21 � 1
n21 þ 2
� �p1
q1
þ n22 � 1
n22 þ 2
� �p2
q2
ð1Þ
• Wiener equation (Wiener 1910):
n212 � n2
1
n212 þ 2n2
1
¼ /2
n22 � n2
1
n22 þ 2n2
1
ð2Þ
• Heller equation (Heller 1945):
n12 � n1
n1
¼ 3
2
m2 � 1
m2 þ 2; with m ¼ n2
n1
ð3Þ
• Dale–Gladstone equation (Dale and Gladstone 1858,
1864):
n12 � 1
q12
¼ n1 � 1
q1
p1 þn2 � 1
q2
p2 ð4Þ
• Arago–Biot equation (Arago and Biot 1806):
n12 ¼ /1n1 þ /2n2 ð5Þ
• Lichtenecker equation (Heller 1945):
ln n12 ¼ /1 ln n1 þ /2 ln n2 ð6Þ
• Newton equation:
n212 ¼ /1n2
1 þ /2n22 ð7Þ
with ni (i ¼ 1; 2) the index of refraction of either pure fluid,
n12 the mixture refractive index, /i (i ¼ 1; 2) the compo-
nent volume fraction in the mixture of either pure fluid, pi
(i ¼ 1; 2) the component weight fraction in the mixture of
either pure fluid, qi (i ¼ 1; 2) the density of either pure fluid
and q12 the mixture density.
As we will see in Sects. 3.3 and 6, these mixture rules
are very useful to the synthesis of a fluid at a prescribed
index of refraction when the objective is to find a solution
whose index of refraction matches that of the particles.
3.3 Small particle index matching methods
As far as we know, there is no method that makes it pos-
sible to measure the refractive index of small particles
accurately and conveniently. Thus, it is not possible to first
measure the refractive index of particles and then adjust the
refractive index of the interstitial fluid by changing its
composition so that it has the same index of refraction.
Therefore, one has to measure it indirectly. There are two
approaches to obtaining the particle index of refraction:
• By using a bulk solid sample and measuring the
reflection (Budwig 1994) or refraction (Nouri et al.
1988) of a laser beam (Sect. 3.3.1) or by directly
measuring the solid refractive index using a refractom-
eter (Sect. 3.3.2).
• By measuring transmitted light through a suspension
sample by varying either the sample temperature or the
light wavelength (Sects. 3.3.3–3.3.5). Using this
method requires good knowledge of the refractive
index of particles because it allows precise matching
over a very limited range of refractive indices. For this
approach, all variants use the Christiansen effect
(Christiansen 1884, 1885; Raman 1949).
In the following, we are going to review methods that have
been used to match the refractive index of a solid
compound with that of a fluid mixture.
3.3.1 Bulk sample laser method
Nouri et al. (1988) and Budwig (1994) proposed an inge-
nious way of matching the refractive index of their parti-
cles with that of the interstitial fluid. Nouri et al. (1988)
used the refracted beam deviation to match the refractive
index while Budwig (1994) used the reflected beam
intensity instead. A laser beam is shined into a solution
containing a large rod (refraction technique) or a flat plate
(reflection technique) made up of the same material as the
particles. The sample is placed in such a way that the
reflected beam is just a few degrees away from backward
reflection. By varying the composition of the solution (thus
varying its index of refraction), the laser beam passing
through the system is deviated with different degrees of
deflection depending on the mismatch between the rod and
Exp Fluids (2011) 50:1183–1206 1187
123
the fluid. At the same time, the backward reflection
intensity changes and is described by the following
equation:
R ¼ 1� nl=ns
1þ nl=ns
� �2
; ð8Þ
where R is the ratio of the reflected beam power to the
incident beam power and nl; ns are the liquid and solid
refractive index, respectively.
This equation shows that, if the solid and fluid indices
of refraction are perfectly matched (ns ¼ nl), the reflec-
ted beam should shut off. Because of imperfections and
local variations in the refractive index, this is, however,
never achieved in practice. Therefore, the point of best
match is attained when the beam passes through the
system without any deflection (Nouri et al. 1988) or
when the monitored backward reflection of light on the
immersed solid sample reaches a minimum value (Bud-
wig 1994). The next and last step is to measure the fluid
refractive index with a refractometer. Special attention
has to be paid to temperature control and light wave-
length. Indeed, in order to avoid disturbances resulting in
the Christiansen effect (Christiansen 1884, 1885; Raman
1949), temperature must stay constant and light wave-
length must be the same.
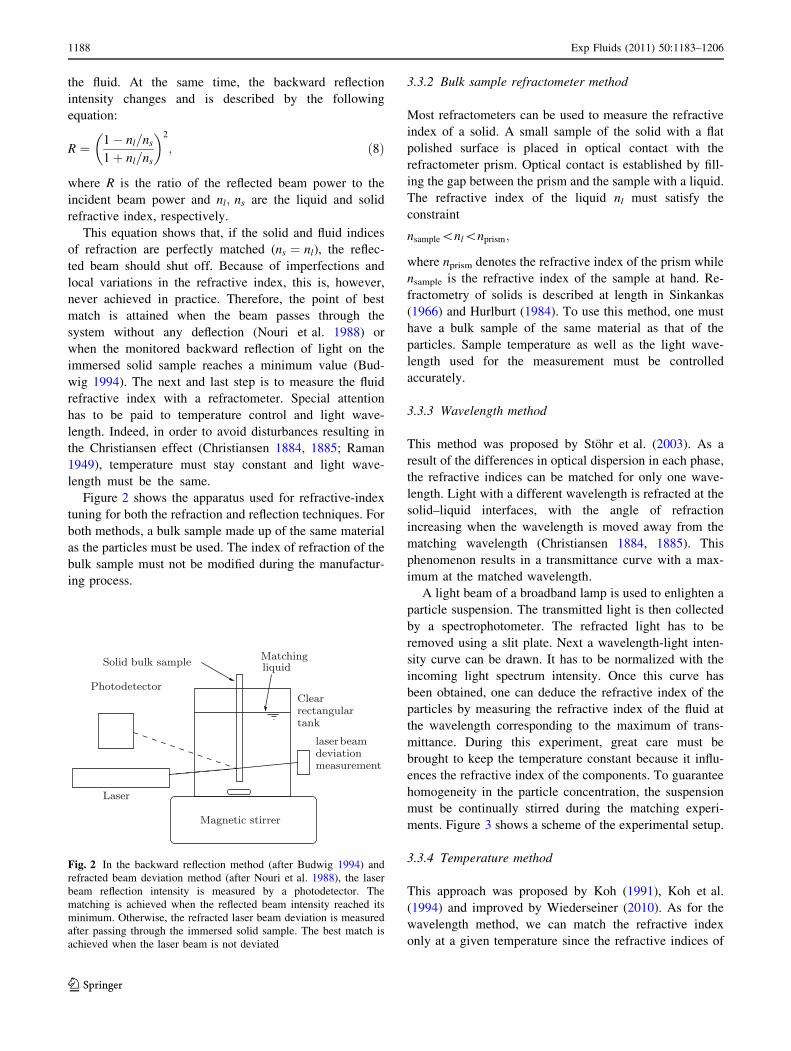
Figure 2 shows the apparatus used for refractive-index
tuning for both the refraction and reflection techniques. For
both methods, a bulk sample made up of the same material
as the particles must be used. The index of refraction of the
bulk sample must not be modified during the manufactur-
ing process.
3.3.2 Bulk sample refractometer method
Most refractometers can be used to measure the refractive
index of a solid. A small sample of the solid with a flat
polished surface is placed in optical contact with the
refractometer prism. Optical contact is established by fill-
ing the gap between the prism and the sample with a liquid.
The refractive index of the liquid nl must satisfy the
constraint
nsample\nl\nprism;
where nprism denotes the refractive index of the prism while
nsample is the refractive index of the sample at hand. Re-
fractometry of solids is described at length in Sinkankas
(1966) and Hurlburt (1984). To use this method, one must
have a bulk sample of the same material as that of the
particles. Sample temperature as well as the light wave-
length used for the measurement must be controlled
accurately.
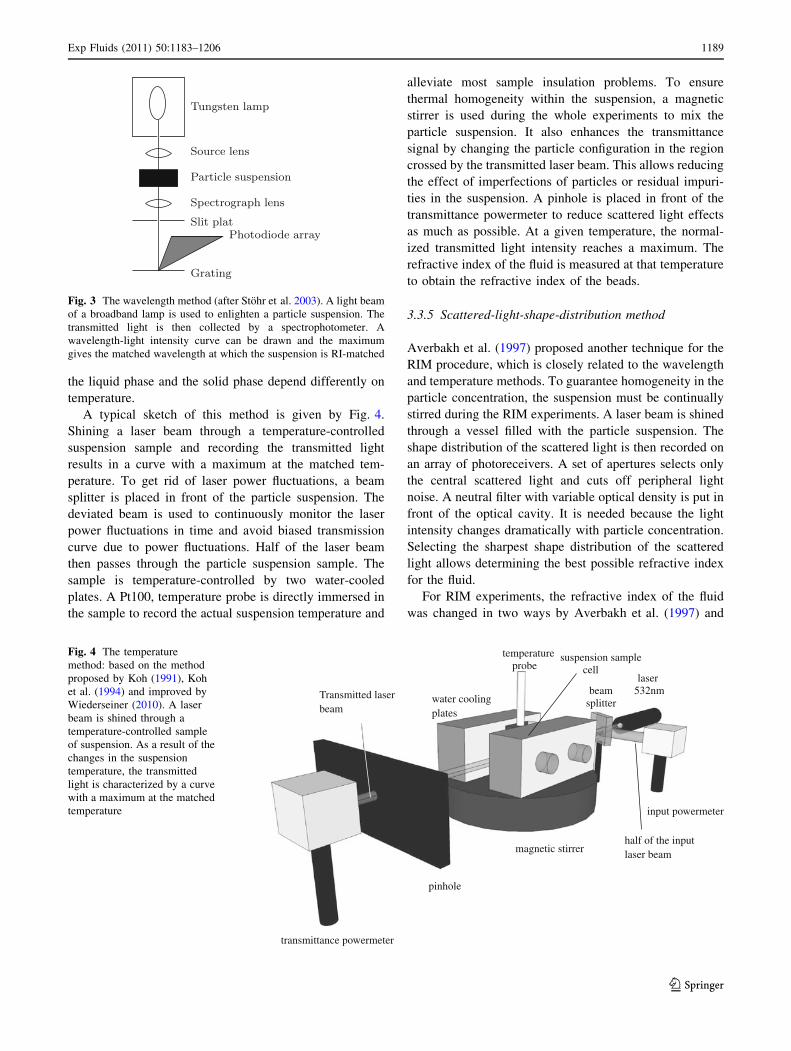
3.3.3 Wavelength method
This method was proposed by Stohr et al. (2003). As a
result of the differences in optical dispersion in each phase,
the refractive indices can be matched for only one wave-
length. Light with a different wavelength is refracted at the
solid–liquid interfaces, with the angle of refraction
increasing when the wavelength is moved away from the
matching wavelength (Christiansen 1884, 1885). This
phenomenon results in a transmittance curve with a max-
imum at the matched wavelength.
A light beam of a broadband lamp is used to enlighten a
particle suspension. The transmitted light is then collected
by a spectrophotometer. The refracted light has to be
removed using a slit plate. Next a wavelength-light inten-
sity curve can be drawn. It has to be normalized with the
incoming light spectrum intensity. Once this curve has
been obtained, one can deduce the refractive index of the
particles by measuring the refractive index of the fluid at
the wavelength corresponding to the maximum of trans-
mittance. During this experiment, great care must be
brought to keep the temperature constant because it influ-
ences the refractive index of the components. To guarantee
homogeneity in the particle concentration, the suspension
must be continually stirred during the matching experi-
ments. Figure 3 shows a scheme of the experimental setup.
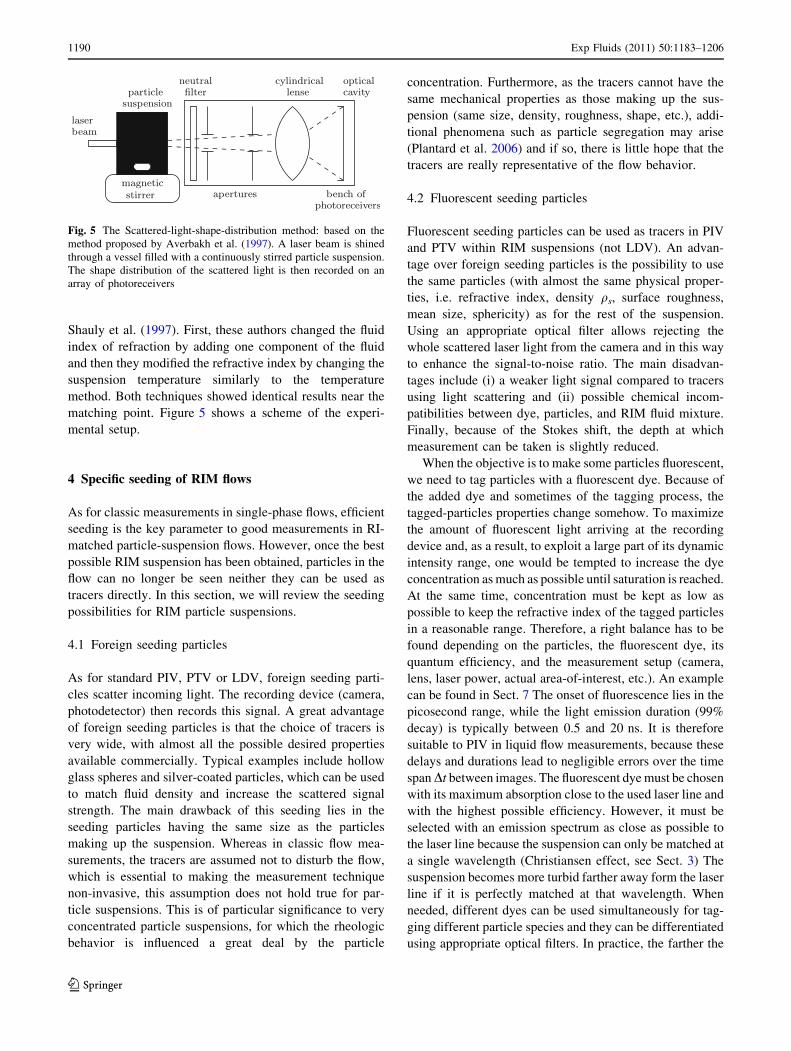
3.3.4 Temperature method
This approach was proposed by Koh (1991), Koh et al.
(1994) and improved by Wiederseiner (2010). As for the
wavelength method, we can match the refractive index
only at a given temperature since the refractive indices of
Fig. 2 In the backward reflection method (after Budwig 1994) and
refracted beam deviation method (after Nouri et al. 1988), the laser
beam reflection intensity is measured by a photodetector. The
matching is achieved when the reflected beam intensity reached its
minimum. Otherwise, the refracted laser beam deviation is measured
after passing through the immersed solid sample. The best match is
achieved when the laser beam is not deviated
1188 Exp Fluids (2011) 50:1183–1206
123
the liquid phase and the solid phase depend differently on
temperature.
A typical sketch of this method is given by Fig. 4.
Shining a laser beam through a temperature-controlled
suspension sample and recording the transmitted light
results in a curve with a maximum at the matched tem-
perature. To get rid of laser power fluctuations, a beam
splitter is placed in front of the particle suspension. The
deviated beam is used to continuously monitor the laser
power fluctuations in time and avoid biased transmission
curve due to power fluctuations. Half of the laser beam
then passes through the particle suspension sample. The
sample is temperature-controlled by two water-cooled
plates. A Pt100, temperature probe is directly immersed in
the sample to record the actual suspension temperature and
alleviate most sample insulation problems. To ensure
thermal homogeneity within the suspension, a magnetic
stirrer is used during the whole experiments to mix the
particle suspension. It also enhances the transmittance
signal by changing the particle configuration in the region
crossed by the transmitted laser beam. This allows reducing
the effect of imperfections of particles or residual impuri-
ties in the suspension. A pinhole is placed in front of the
transmittance powermeter to reduce scattered light effects
as much as possible. At a given temperature, the normal-
ized transmitted light intensity reaches a maximum. The
refractive index of the fluid is measured at that temperature
to obtain the refractive index of the beads.
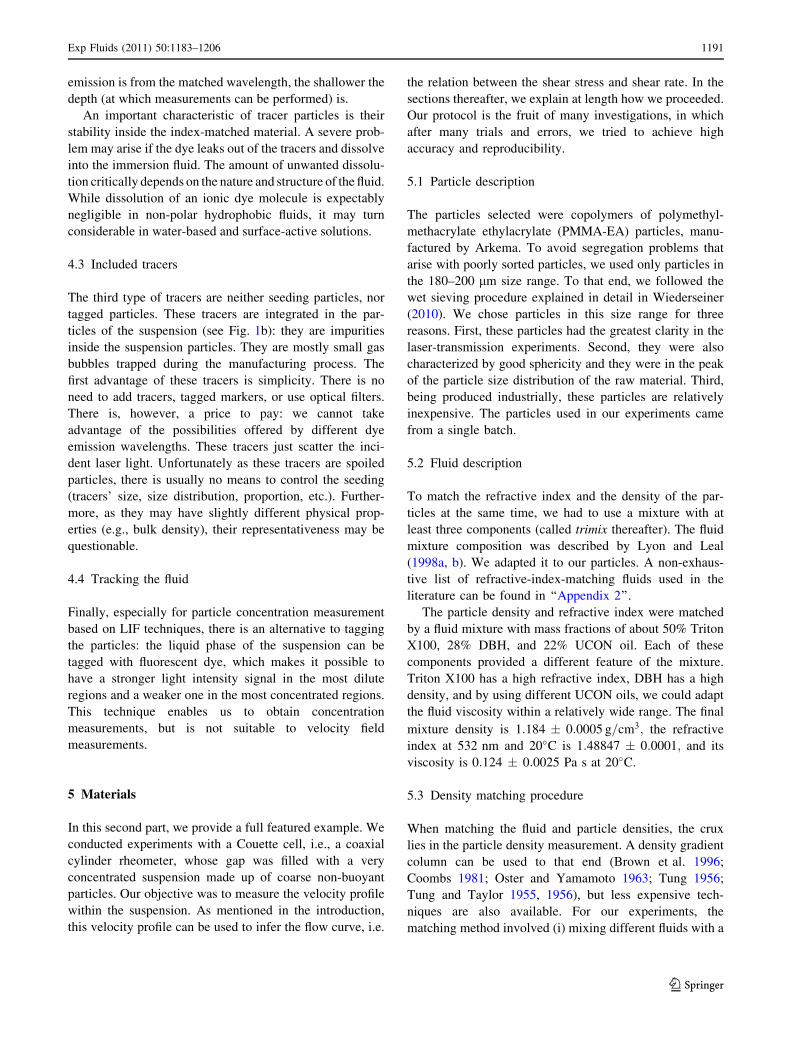
3.3.5 Scattered-light-shape-distribution method
Averbakh et al. (1997) proposed another technique for the
RIM procedure, which is closely related to the wavelength
and temperature methods. To guarantee homogeneity in the
particle concentration, the suspension must be continually
stirred during the RIM experiments. A laser beam is shined
through a vessel filled with the particle suspension. The
shape distribution of the scattered light is then recorded on
an array of photoreceivers. A set of apertures selects only
the central scattered light and cuts off peripheral light
noise. A neutral filter with variable optical density is put in
front of the optical cavity. It is needed because the light
intensity changes dramatically with particle concentration.
Selecting the sharpest shape distribution of the scattered
light allows determining the best possible refractive index
for the fluid.
For RIM experiments, the refractive index of the fluid
was changed in two ways by Averbakh et al. (1997) and
Fig. 3 The wavelength method (after Stohr et al. 2003). A light beam
of a broadband lamp is used to enlighten a particle suspension. The
transmitted light is then collected by a spectrophotometer. A
wavelength-light intensity curve can be drawn and the maximum
gives the matched wavelength at which the suspension is RI-matched
magnetic stirrer
input powermeter
water coolingplates
beamsplitter
pinhole
transmittance powermeter
probetemperature
cellsuspension sample
Transmitted laser beam
half of the input laser beam
laser532nm
Fig. 4 The temperature
method: based on the method
proposed by Koh (1991), Koh
et al. (1994) and improved by
Wiederseiner (2010). A laser
beam is shined through a
temperature-controlled sample
of suspension. As a result of the
changes in the suspension
temperature, the transmitted
light is characterized by a curve
with a maximum at the matched
temperature
Exp Fluids (2011) 50:1183–1206 1189
123
Shauly et al. (1997). First, these authors changed the fluid
index of refraction by adding one component of the fluid
and then they modified the refractive index by changing the
suspension temperature similarly to the temperature
method. Both techniques showed identical results near the
matching point. Figure 5 shows a scheme of the experi-
mental setup.
4 Specific seeding of RIM flows
As for classic measurements in single-phase flows, efficient
seeding is the key parameter to good measurements in RI-
matched particle-suspension flows. However, once the best
possible RIM suspension has been obtained, particles in the
flow can no longer be seen neither they can be used as
tracers directly. In this section, we will review the seeding
possibilities for RIM particle suspensions.
4.1 Foreign seeding particles
As for standard PIV, PTV or LDV, foreign seeding parti-
cles scatter incoming light. The recording device (camera,
photodetector) then records this signal. A great advantage
of foreign seeding particles is that the choice of tracers is
very wide, with almost all the possible desired properties
available commercially. Typical examples include hollow
glass spheres and silver-coated particles, which can be used
to match fluid density and increase the scattered signal
strength. The main drawback of this seeding lies in the
seeding particles having the same size as the particles
making up the suspension. Whereas in classic flow mea-
surements, the tracers are assumed not to disturb the flow,
which is essential to making the measurement technique
non-invasive, this assumption does not hold true for par-
ticle suspensions. This is of particular significance to very
concentrated particle suspensions, for which the rheologic
behavior is influenced a great deal by the particle
concentration. Furthermore, as the tracers cannot have the
same mechanical properties as those making up the sus-
pension (same size, density, roughness, shape, etc.), addi-
tional phenomena such as particle segregation may arise
(Plantard et al. 2006) and if so, there is little hope that the
tracers are really representative of the flow behavior.
4.2 Fluorescent seeding particles
Fluorescent seeding particles can be used as tracers in PIV
and PTV within RIM suspensions (not LDV). An advan-
tage over foreign seeding particles is the possibility to use
the same particles (with almost the same physical proper-
ties, i.e. refractive index, density qs, surface roughness,
mean size, sphericity) as for the rest of the suspension.
Using an appropriate optical filter allows rejecting the
whole scattered laser light from the camera and in this way
to enhance the signal-to-noise ratio. The main disadvan-
tages include (i) a weaker light signal compared to tracers
using light scattering and (ii) possible chemical incom-
patibilities between dye, particles, and RIM fluid mixture.
Finally, because of the Stokes shift, the depth at which
measurement can be taken is slightly reduced.
When the objective is to make some particles fluorescent,
we need to tag particles with a fluorescent dye. Because of
the added dye and sometimes of the tagging process, the
tagged-particles properties change somehow. To maximize
the amount of fluorescent light arriving at the recording
device and, as a result, to exploit a large part of its dynamic
intensity range, one would be tempted to increase the dye
concentration as much as possible until saturation is reached.
At the same time, concentration must be kept as low as
possible to keep the refractive index of the tagged particles
in a reasonable range. Therefore, a right balance has to be
found depending on the particles, the fluorescent dye, its
quantum efficiency, and the measurement setup (camera,
lens, laser power, actual area-of-interest, etc.). An example
can be found in Sect. 7 The onset of fluorescence lies in the
picosecond range, while the light emission duration (99%
decay) is typically between 0.5 and 20 ns. It is therefore
suitable to PIV in liquid flow measurements, because these
delays and durations lead to negligible errors over the time
span Dt between images. The fluorescent dye must be chosen
with its maximum absorption close to the used laser line and
with the highest possible efficiency. However, it must be
selected with an emission spectrum as close as possible to
the laser line because the suspension can only be matched at
a single wavelength (Christiansen effect, see Sect. 3) The
suspension becomes more turbid farther away form the laser
line if it is perfectly matched at that wavelength. When
needed, different dyes can be used simultaneously for tag-
ging different particle species and they can be differentiated
using appropriate optical filters. In practice, the farther the
Fig. 5 The Scattered-light-shape-distribution method: based on the
method proposed by Averbakh et al. (1997). A laser beam is shined
through a vessel filled with a continuously stirred particle suspension.
The shape distribution of the scattered light is then recorded on an
array of photoreceivers
1190 Exp Fluids (2011) 50:1183–1206
123
emission is from the matched wavelength, the shallower the
depth (at which measurements can be performed) is.
An important characteristic of tracer particles is their
stability inside the index-matched material. A severe prob-
lem may arise if the dye leaks out of the tracers and dissolve
into the immersion fluid. The amount of unwanted dissolu-
tion critically depends on the nature and structure of the fluid.
While dissolution of an ionic dye molecule is expectably
negligible in non-polar hydrophobic fluids, it may turn
considerable in water-based and surface-active solutions.
4.3 Included tracers
The third type of tracers are neither seeding particles, nor
tagged particles. These tracers are integrated in the par-
ticles of the suspension (see Fig. 1b): they are impurities
inside the suspension particles. They are mostly small gas
bubbles trapped during the manufacturing process. The
first advantage of these tracers is simplicity. There is no
need to add tracers, tagged markers, or use optical filters.
There is, however, a price to pay: we cannot take
advantage of the possibilities offered by different dye
emission wavelengths. These tracers just scatter the inci-
dent laser light. Unfortunately as these tracers are spoiled
particles, there is usually no means to control the seeding
(tracers’ size, size distribution, proportion, etc.). Further-
more, as they may have slightly different physical prop-
erties (e.g., bulk density), their representativeness may be
questionable.
4.4 Tracking the fluid
Finally, especially for particle concentration measurement
based on LIF techniques, there is an alternative to tagging
the particles: the liquid phase of the suspension can be
tagged with fluorescent dye, which makes it possible to
have a stronger light intensity signal in the most dilute
regions and a weaker one in the most concentrated regions.
This technique enables us to obtain concentration
measurements, but is not suitable to velocity field
measurements.
5 Materials
In this second part, we provide a full featured example. We
conducted experiments with a Couette cell, i.e., a coaxial
cylinder rheometer, whose gap was filled with a very
concentrated suspension made up of coarse non-buoyant
particles. Our objective was to measure the velocity profile
within the suspension. As mentioned in the introduction,
this velocity profile can be used to infer the flow curve, i.e.
the relation between the shear stress and shear rate. In the
sections thereafter, we explain at length how we proceeded.
Our protocol is the fruit of many investigations, in which
after many trials and errors, we tried to achieve high
accuracy and reproducibility.
5.1 Particle description
The particles selected were copolymers of polymethyl-
methacrylate ethylacrylate (PMMA-EA) particles, manu-
factured by Arkema. To avoid segregation problems that
arise with poorly sorted particles, we used only particles in
the 180–200 lm size range. To that end, we followed the
wet sieving procedure explained in detail in Wiederseiner
(2010). We chose particles in this size range for three
reasons. First, these particles had the greatest clarity in the
laser-transmission experiments. Second, they were also
characterized by good sphericity and they were in the peak
of the particle size distribution of the raw material. Third,
being produced industrially, these particles are relatively
inexpensive. The particles used in our experiments came
from a single batch.
5.2 Fluid description
To match the refractive index and the density of the par-
ticles at the same time, we had to use a mixture with at
least three components (called trimix thereafter). The fluid
mixture composition was described by Lyon and Leal
(1998a, b). We adapted it to our particles. A non-exhaus-
tive list of refractive-index-matching fluids used in the
literature can be found in ‘‘Appendix 2’’.
The particle density and refractive index were matched
by a fluid mixture with mass fractions of about 50% Triton
X100, 28% DBH, and 22% UCON oil. Each of these
components provided a different feature of the mixture.
Triton X100 has a high refractive index, DBH has a high
density, and by using different UCON oils, we could adapt
the fluid viscosity within a relatively wide range. The final
mixture density is 1:184 � 0:0005 g=cm3; the refractive
index at 532 nm and 20�C is 1:48847 � 0:0001; and its
viscosity is 0:124 � 0:0025 Pa s at 20�C.
5.3 Density matching procedure
When matching the fluid and particle densities, the crux
lies in the particle density measurement. A density gradient
column can be used to that end (Brown et al. 1996;
Coombs 1981; Oster and Yamamoto 1963; Tung 1956;
Tung and Taylor 1955, 1956), but less expensive tech-
niques are also available. For our experiments, the
matching method involved (i) mixing different fluids with a
Exp Fluids (2011) 50:1183–1206 1191
123

density range close to the PMMA datasheet values and (ii)
observing the time needed for the particles to rise or sink.
The mixture where the particles remained in suspension the
longest gave an estimate of the particle density. The den-
sities of the fluid mixtures were estimated as the averages
of the component densities weighted by the volume frac-
tions of the components in the mixture. When a mixture
was prepared in this way on the basis of the datasheet’s
densities of the fluids, a measurement of the true mixture
density was performed with a high-precision aerometer
(GECO-GERING, 0209 Aerometer DIN 12791 Serie L50,
without Therm., Kl.‘‘H’’, precision of 5� 10�4 g=cm3) in a
temperature-controlled column at 20�C because of the
density variation of the fluid with temperature (see for
example Fig. 6).
We prepared fluids with densities ranging from 1.1800
to 1.1865 g/cm3 by step of 5� 10�4 g=cm3: Because of the
possible small variations in the particle density, we pre-
pared particle-suspension samples with a solid fraction of
0.3 in sealed small bottles with a fluid height of 3 cm (i.e.
on the same order as the depth of the Couette cell for our
experiments). Using a suspension of particles allowed us to
infer the mean particle density, but because of the Boycott
effect and of the reduced sedimentation velocity in
‘‘dense’’ (approximately /[ 0:2) suspensions, the effec-
tive sedimentation velocity was lower than the single par-
ticle velocity at low Reynolds number (Davis and Acrivos
1985):
V1 ¼1
18
ðqp � qf Þgd2p
g
with V?, the terminal sedimentation velocity of an isolated
particle, qp the particle density, qf the fluid density, dp the
particle diameter, and g the fluid viscosity. In an ideal
geometry, the theoretical velocity of a suspension is
(Guyon et al. 2001):
Vsedim ¼ V1ð1� 6:55/Þ:
This expression results from a first-order expansion of the
sedimentation velocity as a function of the solid
concentration / when two-particle interactions are taken
into account. In practice, this velocity depends on the
container features. For example in a spherical vessel, this
velocity becomes:
Vsedim ¼ V1ð1� 3:55/Þ:
It was therefore not possible to a posteriori calculate the
density mismatch from the sedimentation velocity. We
could, however, obtain an upper bound (the terminal
velocity of a single particle). The bottles were immersed
in a thermal bath (20� 0:05�C) for one week. Particle
migration (causing particles to rise or sink) was moni-
tored on a regular basis. In the best-matched fluid, we
could not see any sedimentation effect after a one-week
experiment. Taking a fluid sedimentation of 1 cm/week
(this is faster than what we could observe) and using the
terminal velocity of an isolated particle, we can infer
that the density mismatch was below 10�4 g=cm3. This
value was below the measurement uncertainties of the
fluid density (5� 10�4 g=cm3) when the uncertainties
in the temperature control (�0:05�C) were taken into
account. As the Couette cell and the sedimentation vessel
had similar dimensions, we concluded from this experi-
ment that sedimentation did not disturb our experiments
even though they lasted a few days. Figure 7 shows the
particle-suspension-sedimentation experiment after one
week. The final density of the matching mixture was
1:1840� 5� 10�4 g=cm3; the uncertainty results from
various processes (e.g., the density fluctuations of the
beads within the batch provided by our supplier, errors
in the temperature control, errors in the fluid-density
measurements).
Fig. 6 Density variation of DBH and Triton X100 with temperature
1192 Exp Fluids (2011) 50:1183–1206
123

6 Refractive index matching procedure
6.1 Selection of a RIM technique
In Sect. 3, we presented different methods for matching the
refractive index of a fluid mixture with that of particles. For
the experimental application presented here, we used the
improved temperature method based on the work of Koh
(1991) and Koh et al. (1994); we refer the interested reader
to the doctoral thesis of Wiederseiner (2010), in which the
method was described at length and several improvements
were brought. Here are the main reasons for this choice:
• The improved temperature method allowed us to
prepare directly the suspension at the laser wavelength
used in the FPIV and LIF measurements and not just to
select the clearest suspension to the naked eye.
• It also allowed us to obtain a better index match and
therefore to look farther into the concentrated suspension.
• The only parameter to control was temperature for an
iso-index and iso-density suspension.
• We preferred this technique over the bulk sample
techniques, because we had no guarantee that a bulk
sample of PMMA made up of the material as the particles
had the same refractive index. On the one hand, there are
variations in the refractive index from one manufacture
batch to another one and it was impossible to obtain both
beads and a bulk piece of PMMA from the same batch.
On the other hand, we preferred to use the particles
directly because the bulk piece may change slightly
during the production process of a bulk PMMA piece.
6.2 Experimental protocol
For the index matching experiments, we always started
with binary density-matched fluids (Triton X100/DBH and
UCON oil/DBH mixtures), which were prepared as
explained in Sect. 5.3. This avoided sedimentation effects
in the turbidity experiments
When using the temperature variation technique, we
needed an initial guess for the PMMA refractive index of
the particles. We took the refractive-index value at 20�Cfor PMMA from the literature (Cariou et al. 1986; see also
Fig. 13). We prepared several fluid samples with different
refractive indices around this value (from 1.4830 to 1.4910
in our case). We carried out preliminary turbidity experi-
ments with this set of fluids. As shown in Fig. 8, there was
a narrow peak in the transmittance curve. A four-digit
precision is required in the measurement of the fluid
refractive index if we want to take measurements in a
Fig. 7 The 1-week sedimentation experiment: from left to right, fluid
densities of 1.1830; 1.1835; 1.1840; 1.1850; and 1.1865 g/cm3. The
bright part results from a concentration of particles while the dark part
means that the corresponding local volume is almost free of particles.
In the 1.1840-g/cm3 sample, no unmixing could be noted (in this
experiment, particles and fluid were only density matched to allow
better visualization of settlement)
Fig. 8 The circles show the normalized light transmittance versus the
index of refraction of the fluid at a controlled temperature and a given
laser light wavelength. It shows the narrow interval in the peak of
transmittance where the suspension is transparent. These results were
obtained using the setup described in Sect. 3.3.4 and Fig. 4
Exp Fluids (2011) 50:1183–1206 1193
123

concentrated suspension. Higher precision must be
achieved if the objective is to enhance the field of visibility
within the suspension.
When crudely adjusting the refractive index, we used the
following variant of the Arago–Biot equation (5) based on
the fact that we worked with density-matched components:
ðm1 þ m2Þn12 ¼ m1n1 þ m2n2; ð9Þ
with mi (i = 1, 2) the component mass in the mixture of
either pure fluid.
Although we primarily chose this equation for conve-
nience, it turned out to be quite accurate. For fine tuning,
we proceeded by trial and error by (i) adding a small
amount of one of the binary fluids to increase or decrease
the mixture refractive index and (ii) measuring the
refractive index of the ternary mixture after sufficient
mixing with an Atago RX-5000a refractometer (ATAGO
CO., LTD).
Once a suspension was prepared, a turbidity experiment
was performed (see Fig. 4). We used a continuous wave
Hulk Series 200-mW laser (ChangChun Dragon Lasers
Co., Ltd). A 532-nm laser beam was sent through a 50/50
beam splitter (CVI Melles Griot - France, Part number
BSNP-532-50-1025). The sample was temperature-con-
trolled by two water cooled plates connected to a thermal
bath (Julabo F34-HE circulator). Furthermore, a Pt100
temperature probe was directly immersed into the sample
to record the sample temperature accurately during the
experiments. A typical turbidity experiment temperature
profile involving five ramps is shown in Fig. 9. The offset
between the sample temperature (Fig. 9, red continuous
line) and the thermal bath (Fig. 9, blue dotted curve) is due
to the ambient temperature. The transmittance curve cor-
responding to the temperature profiles of Fig. 9 is shown
on Fig. 10.
As shown by Fig. 11, the temperature gradient dT/dt of
�1:25�C=h was small enough so as to avoid any skewness in
the transmission curves due to thermal inertia. If not, the
differences from the up and down ramps would have been
more significant. From the master curve in Fig. 11, one can
now deduce the temperature at which the ternary-fluid
refractive index matches that of the particles. We still have
to measure the refractive index of the fluid at the maximum
Fig. 9 Thermal control of a typical turbidity experiment involving
five ramps, the offset between the two curves is due to the ambient-
temperature difference. In this experiment, the solid concentration
was /bulk ¼ 15%, the mean particle diameter dp was 200 l m
Fig. 10 Turbidity experiment of a PMMA particle suspension (mean
concentration /mean of 15%, mean particle diameter dp;mean ¼100 l m and laser light wavelength k ¼ 532 nm). The dotes show
the evolution with time of the measured light transmittance and the
line show the suspension sample temperature. A maximum of
transmittance can be found at 19:1� C for all the five temperature
ramps as can be seen on Fig. 11
Fig. 11 Master curve from the five turbidity ramp experiments of
Figs. 9 and 10
1194 Exp Fluids (2011) 50:1183–1206
123

transmittance temperature using a refractometer. For
Fig. 11, the maximum was at 19:10�C. In Fig. 12, several
turbidity experiments were conducted with different ternary
fluid proportions and matching the PMMA particles at dif-
ferent temperatures. As shown in Fig. 12 the refractive index
of our PMMA particles was finally obtained from a linear
interpolation of the turbidity experiments and was estimated
at 1.48847 (at a temperature of 20�C). The variation in the
refractive index with temperature was of approximately
�1:3� 10�4�C�1. This value is in good agreement with
measurements drawn from the literature (Cariou et al. 1986)
with bulk PMMA, as shown by Fig. 13.
Conaghan and Rosen (1972) developed a theory that
quantifies the degree of light scattering in a suspension as a
function of the refractive indices of the two phases. The
theory holds only in the limit of small volume fractions
because only single scattering is considered.
The light transmittance through a sample of thickness
x is defined as:
T � I
I0
¼ e�sx; ð10Þ
where I and I0 denote the suspension transmitted light
intensity and clear fluid transmitted light intensity,
respectively. For a perfectly matched system, we have
T = 1; otherwise, we have T \ 1. The turbidity s is given
by:
s ¼ 3/K
2dp; ð11Þ
where / denotes the particle concentration, K the scattering
coefficient, and dp the particle diameter. Normally, it is
necessary to solve Maxwell’s equation to obtain
K. However for large particles (dp � k), Van De Hulst
(1957) derived the following relation:
K ¼ 2� 4
qsin qþ 4
q2ð1� cos qÞ; ð12Þ
where
q ¼ 2pdpns
knf
ns� 1
��������: ð13Þ
In the equation above, nf and ns are the fluid and solid
refractive indices.
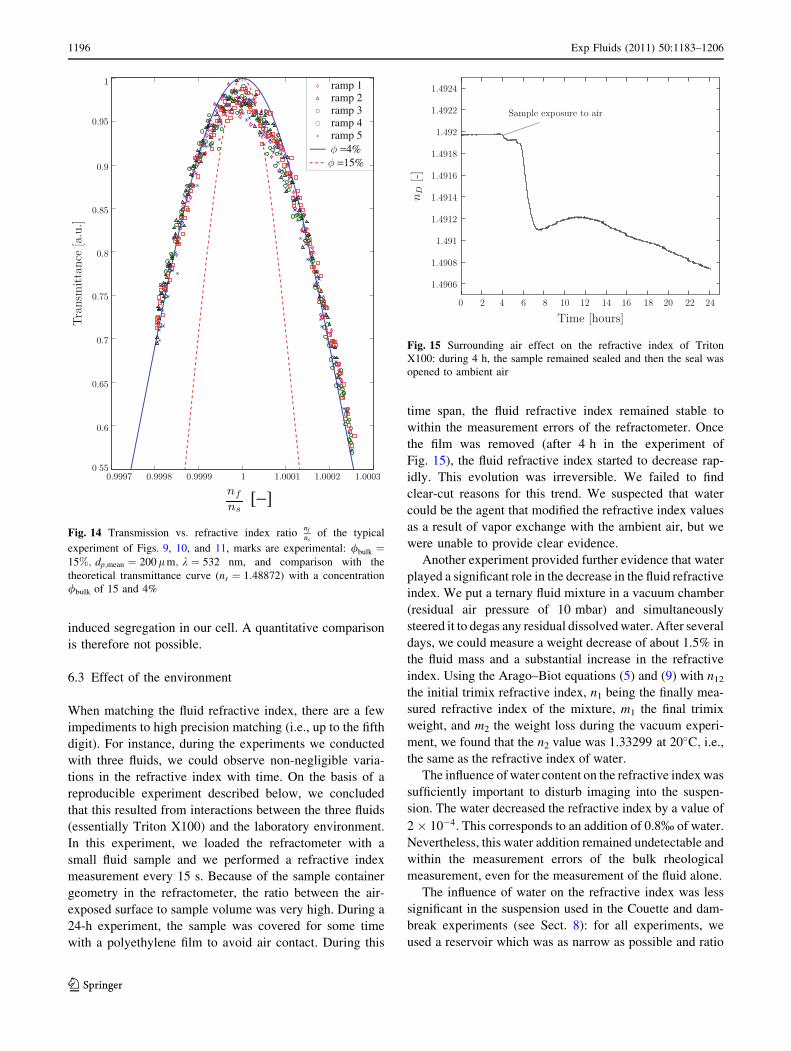
Figure 14 compares Conaghan’s equation with the
experimental data used in Figs. 9, 10, and 11. Two con-
centrations are reported: / = /bulk = 15 and 4%. The
discrepancy between our experimental data and Cona-
ghan’s theoretical trend is likely to come from a partially
satisfied hypotheses in the experiment. One of Conahan’s
assumptions is that the particles are of equal size. Even
though our particles were in a narrow particle-size range
(unsieved 50–300 lm range), they were not of equal size.
Another possible cause is a statistical dispersion of the
particles’ refractive indices. To find the origins of this
discrepancy, we should have conducted simulations and
further experiments with well-sorted suspensions at lower
concentrations and with several batch of particles. As a
corollary, the simulation might provide the possibility of
estimating the dispersion from the experimental results.
The dispersion would indeed be mostly interesting as a
purity criterion of a given batch. Another explanation may
lie in the fact that by stirring the suspension in the laser
beam path, we reduced the particle concentration in the
highly sheared laser beam area. A 4% suspension in
Conaghan’s equation seems to match our experimental
results quite well, but we were unable to quantify shear-
Fig. 12 Refractive index of the PMMA particles deduced from
several turbidity experiments
Fig. 13 Refractive index variation with temperature of solid PMMA
(after Cariou et al. 1986); the solid line is the experimental result of
Cariou et al. (1986) and the crosses represent the experimental results
obtained by Waxler et al. (1979)
Exp Fluids (2011) 50:1183–1206 1195
123
induced segregation in our cell. A quantitative comparison
is therefore not possible.
6.3 Effect of the environment
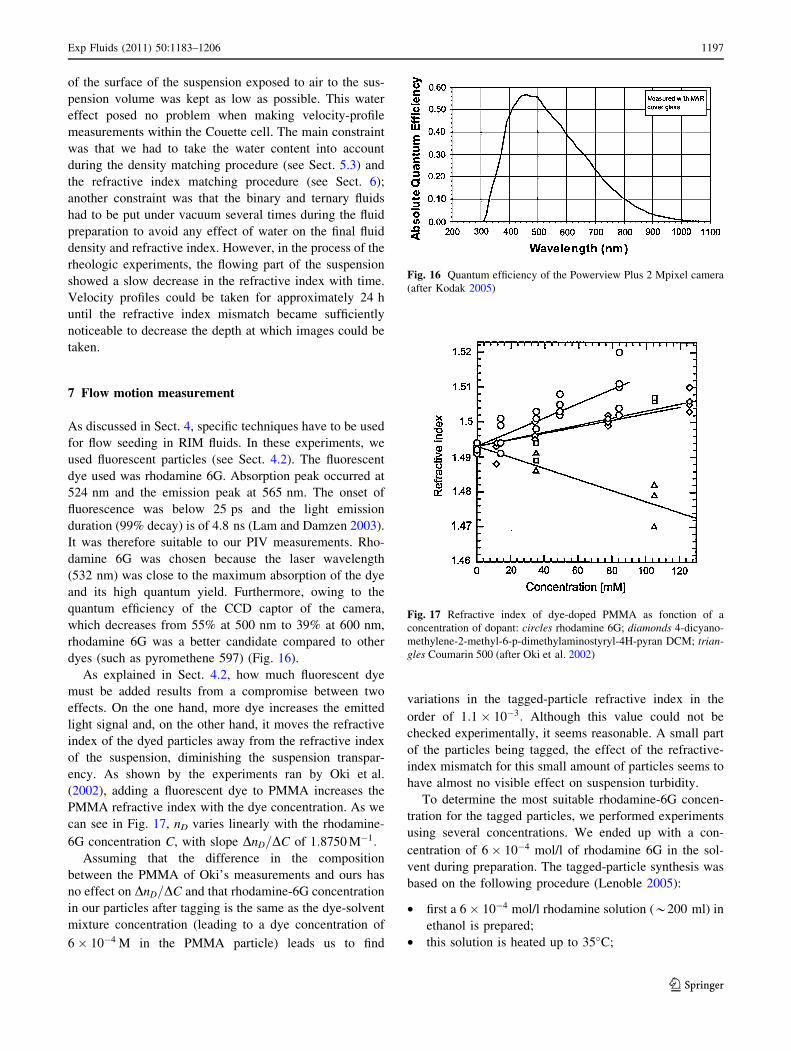
When matching the fluid refractive index, there are a few
impediments to high precision matching (i.e., up to the fifth
digit). For instance, during the experiments we conducted
with three fluids, we could observe non-negligible varia-
tions in the refractive index with time. On the basis of a
reproducible experiment described below, we concluded
that this resulted from interactions between the three fluids
(essentially Triton X100) and the laboratory environment.
In this experiment, we loaded the refractometer with a
small fluid sample and we performed a refractive index
measurement every 15 s. Because of the sample container
geometry in the refractometer, the ratio between the air-
exposed surface to sample volume was very high. During a
24-h experiment, the sample was covered for some time
with a polyethylene film to avoid air contact. During this
time span, the fluid refractive index remained stable to
within the measurement errors of the refractometer. Once
the film was removed (after 4 h in the experiment of
Fig. 15), the fluid refractive index started to decrease rap-
idly. This evolution was irreversible. We failed to find
clear-cut reasons for this trend. We suspected that water
could be the agent that modified the refractive index values
as a result of vapor exchange with the ambient air, but we
were unable to provide clear evidence.
Another experiment provided further evidence that water
played a significant role in the decrease in the fluid refractive
index. We put a ternary fluid mixture in a vacuum chamber
(residual air pressure of 10 mbar) and simultaneously
steered it to degas any residual dissolved water. After several
days, we could measure a weight decrease of about 1.5% in
the fluid mass and a substantial increase in the refractive
index. Using the Arago–Biot equations (5) and (9) with n12
the initial trimix refractive index, n1 being the finally mea-
sured refractive index of the mixture, m1 the final trimix
weight, and m2 the weight loss during the vacuum experi-
ment, we found that the n2 value was 1.33299 at 20�C; i.e.,
the same as the refractive index of water.
The influence of water content on the refractive index was
sufficiently important to disturb imaging into the suspen-
sion. The water decreased the refractive index by a value of
2� 10�4: This corresponds to an addition of 0.8% of water.
Nevertheless, this water addition remained undetectable and
within the measurement errors of the bulk rheological
measurement, even for the measurement of the fluid alone.
The influence of water on the refractive index was less
significant in the suspension used in the Couette and dam-
break experiments (see Sect. 8): for all experiments, we
used a reservoir which was as narrow as possible and ratio
[−]
=15%
ramp 1ramp 2ramp 3ramp 4ramp 5
=4%
Fig. 14 Transmission vs. refractive index rationf
nsof the typical
experiment of Figs. 9, 10, and 11, marks are experimental: /bulk ¼15%; dp;mean ¼ 200 l m; k ¼ 532 nm, and comparison with the
theoretical transmittance curve (ns ¼ 1:48872) with a concentration
/bulk of 15 and 4%
Fig. 15 Surrounding air effect on the refractive index of Triton
X100: during 4 h, the sample remained sealed and then the seal was
opened to ambient air
1196 Exp Fluids (2011) 50:1183–1206
123
of the surface of the suspension exposed to air to the sus-
pension volume was kept as low as possible. This water
effect posed no problem when making velocity-profile
measurements within the Couette cell. The main constraint
was that we had to take the water content into account
during the density matching procedure (see Sect. 5.3) and
the refractive index matching procedure (see Sect. 6);
another constraint was that the binary and ternary fluids
had to be put under vacuum several times during the fluid
preparation to avoid any effect of water on the final fluid
density and refractive index. However, in the process of the
rheologic experiments, the flowing part of the suspension
showed a slow decrease in the refractive index with time.
Velocity profiles could be taken for approximately 24 h
until the refractive index mismatch became sufficiently
noticeable to decrease the depth at which images could be
taken.
7 Flow motion measurement
As discussed in Sect. 4, specific techniques have to be used
for flow seeding in RIM fluids. In these experiments, we
used fluorescent particles (see Sect. 4.2). The fluorescent
dye used was rhodamine 6G. Absorption peak occurred at
524 nm and the emission peak at 565 nm. The onset of
fluorescence was below 25 ps and the light emission
duration (99% decay) is of 4.8 ns (Lam and Damzen 2003).
It was therefore suitable to our PIV measurements. Rho-
damine 6G was chosen because the laser wavelength
(532 nm) was close to the maximum absorption of the dye
and its high quantum yield. Furthermore, owing to the
quantum efficiency of the CCD captor of the camera,
which decreases from 55% at 500 nm to 39% at 600 nm,
rhodamine 6G was a better candidate compared to other
dyes (such as pyromethene 597) (Fig. 16).
As explained in Sect. 4.2, how much fluorescent dye
must be added results from a compromise between two
effects. On the one hand, more dye increases the emitted
light signal and, on the other hand, it moves the refractive
index of the dyed particles away from the refractive index
of the suspension, diminishing the suspension transpar-
ency. As shown by the experiments ran by Oki et al.
(2002), adding a fluorescent dye to PMMA increases the
PMMA refractive index with the dye concentration. As we
can see in Fig. 17, nD varies linearly with the rhodamine-
6G concentration C, with slope DnD=DC of 1:8750 M�1:
Assuming that the difference in the composition
between the PMMA of Oki’s measurements and ours has
no effect on DnD=DC and that rhodamine-6G concentration
in our particles after tagging is the same as the dye-solvent
mixture concentration (leading to a dye concentration of
6� 10�4 M in the PMMA particle) leads us to find
variations in the tagged-particle refractive index in the
order of 1:1� 10�3: Although this value could not be
checked experimentally, it seems reasonable. A small part
of the particles being tagged, the effect of the refractive-
index mismatch for this small amount of particles seems to
have almost no visible effect on suspension turbidity.
To determine the most suitable rhodamine-6G concen-
tration for the tagged particles, we performed experiments
using several concentrations. We ended up with a con-
centration of 6� 10�4 mol/l of rhodamine 6G in the sol-
vent during preparation. The tagged-particle synthesis was
based on the following procedure (Lenoble 2005):
• first a 6� 10�4 mol/l rhodamine solution (*200 ml) in
ethanol is prepared;
• this solution is heated up to 35�C;
Fig. 16 Quantum efficiency of the Powerview Plus 2 Mpixel camera
(after Kodak 2005)
Fig. 17 Refractive index of dye-doped PMMA as fonction of a
concentration of dopant: circles rhodamine 6G; diamonds 4-dicyano-
methylene-2-methyl-6-p-dimethylaminostyryl-4H-pyran DCM; trian-gles Coumarin 500 (after Oki et al. 2002)
Exp Fluids (2011) 50:1183–1206 1197
123

• three to four grams of particles are added to the
solution;
• the whole is kept under continuous steering for 15 min;
• particles are then placed on a sieve (Retsch sieves
200� 25 mm, mesh of 180 lm);
• they are rinsed thoroughly with clean ethanol; and
• finally the tagged beads are dried for a couple of hours
in an air oven at 60�C:
As mentioned in Sect. 4.2, the dye stability on the tag-
ged particles is important. In the present case, the dye
slowly went out of the particles, reducing image contrast
with time. As long as the fluorescence signal of tagged
particles is much stronger as the one of the fluid, this is not
a problem for velocity measurements. However, in the case
of particle concentration measurements, this effect
becomes unacceptable. Nevertheless, to have the best
possible images, we always used fresh suspensions in the
velocity measurements experiments.
8 Experimental results
Typical images of RIM flow are shown in Fig. 18 for two
different experimental setups: (i) the Couette experiment,
in which a suspension filling the gap between two rotating
cylinders is sheared at constant rate and (ii) the dam-break
experiment, which consists in releasing a fixed volume of
suspension down a flume.
We ran experiments in a wide-gap Couette cell, whose
outer-cylinder diameter was 60 mm while the inner-cyl-
inder diameter was 25 mm. For some runs, we replaced
the inner cylinder with a 6-blade vane, whose diameter
was 25 mm. The material was the same as the one
described in Sect. 5. The cell was manufactured in quartz,
which makes it possible to film inside it from the bottom.
Maximum measurement depth was 35 mm in a suspension
with volume fraction of 0.55, i.e. through 350 fluid-par-
ticle interfaces. Figure 19a shows streamlines between the
blades of the vane. The closed paths provided evidence of
significant recirculation in the interblade space. Originally,
vane geometries were used to measure the apparent yield
stresses of dispersions (Russel 1936), but they have been
recently used to measure other rheologic parameters.
Indeed, a clear advantage over a smooth or roughened
inner cylinder is that shear takes place inside the material
and not at a solid boundary (solid boundaries locally
disturb the flow of suspensions as a result of processes
such as particle depletion and slipping). A recent review
of the vane geometry can be found in an article of Barnes
and Nguyen (2001). These authors warned the reader
about the relevance of this tool when applied to high-
viscosity liquids. In particular, since the vane is assumed
to replace a rotating solid body, the material trapped
within the blades should stay stationary (in the frame
related to the blades) and rotates as a solid block. If the
interblade space does not behave as a rigid body, i.e., if
vortices and secondary flows occur, the boundary condi-
tions are changed at the periphery of the blades, which
makes it difficult any viscometric treatment of the data.
The suspension behavior within the blades have been
studied numerically (Savarmand et al. 2007; Potanin
2010), but there has been no experimental investigation to
date. As far as we know, our experiments are the first
report of flow recirculation within vane blades in a Cou-
ette cell. As shown by Fig. 19a, the velocity field exhibits
flow recirculation patterns in the interblade space, con-
firming Barnes’ hypothesis. The spacial resolution allows
us to clearly identify the main vortex just behind each
blade. There seems to be a secondary vortex rotating in
the opposite direction in front of the blade, next to the
central shaft. This recirculation process had a great
influence on the apparent inner cylinder wall slip. In fact,
we were unable to obtain a no-slip condition with the vane
Fig. 18 a Typical PIV image in the Couette cell with a 0.55 volume
fraction coarse particle suspension at 20 mm into the suspension.
b Flow front (dam-break experiment) of a concentrated and refrac-
tive-index-matched suspension with a particle volume fraction of 0.58
and an inclination of 0�, images have been taken from the side at a
depth of 20 mm into the fluid. The suspension flows from right to left
and the bright dots are marked particles advected by the fluid, which
are used as tracers to infer fluid velocity
1198 Exp Fluids (2011) 50:1183–1206
123

geometry, although it is commonly used to fulfill this
condition. The apparent velocity was lower at the
periphery of the vane than at the surface of a sand-blasted
inner cylinder, i.e. there was more slip with the vane. This
observation questions the use of a vane geometry for
concentrated particle suspensions. Figure 19b shows the
velocity profile across the gap for a roughened inner
cylinder. Its angular velocity ranged from 0.01 to 10 rad/s.
The particle volume fraction was / ¼ 0:55: Maximum
measurement depth was 35 mm. In the steady-state regime
(i.e. when shear induced particle diffusion was at
equilibrium), the measured azimuthal-velocity profiles
experienced a sup-exponential decay in the region close to
the inner cylinder. These results are in agreement with
MRI measurements (Ovarlez et al. 2006). However, near
the outer cylinder, we measured an abrupt change in the
profiles. Its origin is not yet clear, and we are unaware of
earlier observations of this change. This kink in the profile
implies that the shear rate _c remains always above a
certain value. This result may corroborate the idea that
there is of a critical shear rate _cc below which no steady
flow is possible, a scenario proposed by Coussot et al.
(2009).
Dam break experiments (here, the sudden release of ten
liters of concentrated suspension) were also carried out in a
channel (3 m length and 10 cm in width). Figures 18b and
20 show typical images of the channel experiments with
the associated velocity field within the leading edge in
concentrated suspension with a volume fraction / ¼ 0:58:
For both the Couette and the dam break experiments,
velocity fields were computed using a modified version of
the open source software called MatPIV (Sveen 2004).
Computations were performed using a multiple-pass
scheme with a sub-window size reduction from 128� 128
to 64� 64 and finally 32� 32 pixels. Signal-to-noise ratio
(SNR), global, local and velocity range filters were used to
reject spurious correlation peaks and therefore wrong
velocity vectors. As the velocity spans over a wide range,
computation of the velocity profile cannot be achieved
using a single set of images within a given length of time
Dt: Indeed if the Dt value was selected so that we are able
to capture the velocity field close to the inner cylinder, the
PIV algorithm could not properly compute the velocity
field near the outer cylinder and vice versa. For this reason,
the velocity profile was obtained using several sets of
images with different Dt:
(a)
(b)
Fig. 19 a Streamlines of the interblade flow recirculations using a
vane geometry: the inner 6-bladed vane has a diameter of 25 mm and
an angular velocity of 1 rad/s, the particle suspension has a volume
fraction of 0.5. The color scale represents the dimensionless velocity
magnitude in the frame of reference attached to the vane (adimen-
sionalized with the apparent outer cylinder velocity. The outer
cylinder rotates clockwise in this frame of reference), b dimensionless
azimuthal velocity profile at several inner cylinder velocities Vi:
0.01 rad/s (red dots), 0.01802 rad/s (blue dots), 0.03246 rad/s (greendots), 0.05848 rad/s (black dots), 0.1054 rad/s (cyan dots),
0.1898 rad/s (majenta dots), 0.342 rad/s (red times symbol),0.6162 rad/s (blue times symbol), 1.11 rad/s (green times symbol),and 2 rad/s (black times symbol). For comparison, the continuous blueline represents the newtonian velocity profile. The velocities are made
dimensionless by dividing them by the inner cylinder velocity (inner
sand-blasted cylinder ø = 25 mm, particle volume fraction / ¼ 0:55)
Fig. 20 Dimensionless velocity magnitude in the front of the flow in
a dam-break experiment of a concentrated particle suspension
(/ ¼ 0:58)
Exp Fluids (2011) 50:1183–1206 1199
123
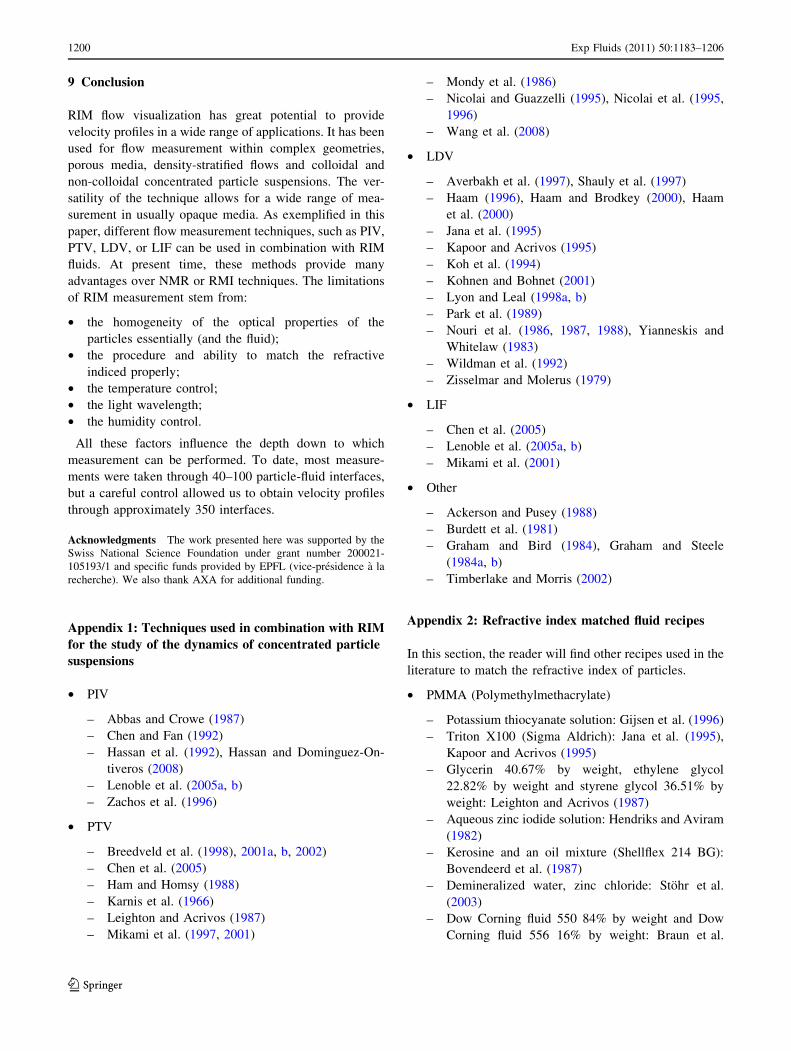
9 Conclusion
RIM flow visualization has great potential to provide
velocity profiles in a wide range of applications. It has been
used for flow measurement within complex geometries,
porous media, density-stratified flows and colloidal and
non-colloidal concentrated particle suspensions. The ver-
satility of the technique allows for a wide range of mea-
surement in usually opaque media. As exemplified in this
paper, different flow measurement techniques, such as PIV,
PTV, LDV, or LIF can be used in combination with RIM
fluids. At present time, these methods provide many
advantages over NMR or RMI techniques. The limitations
of RIM measurement stem from:
• the homogeneity of the optical properties of the
particles essentially (and the fluid);
• the procedure and ability to match the refractive
indiced properly;
• the temperature control;
• the light wavelength;
• the humidity control.
All these factors influence the depth down to which
measurement can be performed. To date, most measure-
ments were taken through 40–100 particle-fluid interfaces,
but a careful control allowed us to obtain velocity profiles
through approximately 350 interfaces.
Acknowledgments The work presented here was supported by the
Swiss National Science Foundation under grant number 200021-
105193/1 and specific funds provided by EPFL (vice-presidence a la
recherche). We also thank AXA for additional funding.
Appendix 1: Techniques used in combination with RIM
for the study of the dynamics of concentrated particle
suspensions
• PIV
– Abbas and Crowe (1987)
– Chen and Fan (1992)
– Hassan et al. (1992), Hassan and Dominguez-On-
tiveros (2008)
– Lenoble et al. (2005a, b)
– Zachos et al. (1996)
• PTV
– Breedveld et al. (1998), 2001a, b, 2002)
– Chen et al. (2005)
– Ham and Homsy (1988)
– Karnis et al. (1966)
– Leighton and Acrivos (1987)
– Mikami et al. (1997, 2001)
– Mondy et al. (1986)
– Nicolai and Guazzelli (1995), Nicolai et al. (1995,
1996)
– Wang et al. (2008)
• LDV
– Averbakh et al. (1997), Shauly et al. (1997)
– Haam (1996), Haam and Brodkey (2000), Haam
et al. (2000)
– Jana et al. (1995)
– Kapoor and Acrivos (1995)
– Koh et al. (1994)
– Kohnen and Bohnet (2001)
– Lyon and Leal (1998a, b)
– Park et al. (1989)
– Nouri et al. (1986, 1987, 1988), Yianneskis and
Whitelaw (1983)
– Wildman et al. (1992)
– Zisselmar and Molerus (1979)
• LIF
– Chen et al. (2005)
– Lenoble et al. (2005a, b)
– Mikami et al. (2001)
• Other
– Ackerson and Pusey (1988)
– Burdett et al. (1981)
– Graham and Bird (1984), Graham and Steele
(1984a, b)
– Timberlake and Morris (2002)
Appendix 2: Refractive index matched fluid recipes
In this section, the reader will find other recipes used in the
literature to match the refractive index of particles.
• PMMA (Polymethylmethacrylate)
– Potassium thiocyanate solution: Gijsen et al. (1996)
– Triton X100 (Sigma Aldrich): Jana et al. (1995),
Kapoor and Acrivos (1995)
– Glycerin 40.67% by weight, ethylene glycol
22.82% by weight and styrene glycol 36.51% by
weight: Leighton and Acrivos (1987)
– Aqueous zinc iodide solution: Hendriks and Aviram
(1982)
– Kerosine and an oil mixture (Shellflex 214 BG):
Bovendeerd et al. (1987)
– Demineralized water, zinc chloride: Stohr et al.
(2003)
– Dow Corning fluid 550 84% by weight and Dow
Corning fluid 556 16% by weight: Braun et al.
1200 Exp Fluids (2011) 50:1183–1206
123

(1991), Peurrung et al. (1995), Rashidi et al.
(1996), Stohr et al. (2003)
– Dow Corning fluid 550 and Dow Corning fluid 200:
Johnston et al. (1975)
– Dow Corning fluid 556 98% by weight and Dow
Corning fluid 200 2% by weight: Stohr et al. (2003)
– Demineralized water, zinc chloride and Triton
X100 (Sigma Aldrich): Breedveld et al. (1998,
2001a, b, 2002), Krishnan et al. (1996), Timberlake
and Morris (2002)
– 1,1,2,2 tetrabromoethane (Eastman Kodak) 14.07%
by weight, polyalkylen glycol (UCON oil 75 H
90’000) 35.66% by weight, Triton X100 (Sigma
Aldrich) 50.27% by weight and Tinuvin 328 (Ciba
Specialty Chemicals) 0.1% by weight: Abbott et al.
(1993), Averbakh et al. (1997), Graham et al.
(1991), Milliken et al. (1989), Shauly et al. (1997)
– Decahydronaphthalene, tetrahydronaphthalene and
cyclohexylbromide: Chaudhuri et al. (2008), Gao
and Kilfoil (2007)
– Decahydronaphthalene, tetrahydronaphthalene and
carbon tetrachloride: Kegel and van Blaaderen
(2000)
– Decahydronaphthalene, tetrahydronaphthalene:
Ackerson and Pusey (1988)
– Cyclohexylbromide and decahydronaphthalene:
Dibble et al. (2006), Wang et al. (2008), Weeks
et al. (2000)
– Cyclohexylbromide, decahydronaphthalene and tet-
rabutyl- ammonium chloride: Kaufman and Weitz
(2006)
– Polyalkylene glycol oil (UCON oil 50-HB-5100,
Union Carbide) and 1,1,2,2 tetrabromoethane
(Aldrich Chemical Company): Graham and Bird
(1984)
– Di-butylphtalate: Yianneskis and Whitelaw (1983)
– para-cymene: Haam (1996), Haam et al. (2000),
Hassan and Dominguez-Ontiveros (2008)
– Tetraline and 40% by weight turpentine: Horvay
and Leuckel (1984), Kapoor and Acrivos (1995),
Liu et al. (1989, 1990), Nouri et al. (1986, 1987,
1988); Thompson (1990)
– Polyglycol oil (UCON oil 50-HB-5100, Union
Carbide) 33.7% by weight, terpineol 41.8% by
weight, 1,1,2,2 tetrabromohethane (Aldrich Chem-
ical Company)24.4% by weight and Tinuvin (Ciba
Geigy) 0.1% by weight: Mondy et al. (1986)
– L42 organosilicone fluid (Union Carbide Co.) 27%
by weight and 550 fluid (Dow chemical Co.) 73%
by weight: Dybbs and Edwards (1984), Northrup
et al. (1991a, b, 1993)
– Ethyl and benzyl alcohol: Hassan and Dominguez-
Ontiveros (2008)
– Aqueous sodium iodide solution and glycerin: Zerai
et al. (2005)
– Aqueous sodium iodide solution (60% concentra-
tion): Hassan and Dominguez-Ontiveros (2008),
Okumura et al. (2005), Parker and Merati (1996),
Uzol et al. (2002), Yuki et al. (2008)
– 1,6 dibromohexane (Aldrich caltalogue no. D4,100-
7), poly-alkylen glycol (UCON oil 75 H 450) and
Triton X100 (Sigma Aldrich): Lyon and Leal
(1998a, b), Wiederseiner (2010)
– Hexadecane and microscope oil (Sigma-Aldrich
S150): Lenoble et al. (2005a, b)
– Aqueous solution of potassium thiocyanate and
ammonium thiocyanate: Budwig et al. (1993a)
– Tetrachloroethylene: Kannemans (1979)
• PS (polystyrene)
– 1-methylnaphthalene (Aldrich catalogue number
M5,680-8), 1-chloronaphthalene (Aldrich C5,765-
0), polyalkylene glycol (UCON oil 75-H-90’000,
Dow Chemicals Co.): Koh (1991), Koh et al. (1994)
– 1-methylnaphthalene 28% by volume, 1-chloro-
naphthalene 31% by volume and tetraline 41 % by
volume: Cui and Adrian (1997)
• PVA (Polyvinyl acetate)
– Polyglycol oil (UCON oil 50-HB-5100, Union
Carbide) and 4% by volume tetrabromohethane:
Karnis et al. (1966)
• Nylon
– Pale 4 oil (oxidized castor oil, Baker Castor oil Co.)
and tetrabromoethane: Karnis et al. (1966)
• Glass
– Glycerine and water: Park et al. (1989)
– Soddard solvent and mineral oil: Park et al. (1989)
– Glycerol: Cenedese and Viotti (1996), Moroni and
Cushman (2001)
– Esso Marcol 82 and Primol 352: Saleh et al. (1992,
1993)
– Dow Corning fluid 550 and Dow Corning fluid 556:
Wang and Khalili (2002), Yarlagadda and Yogana-
than (1989)
– Oil (Pharma 5, DEA) and a light protective liquid
(Eusolex, Merck): Kohnen and Bohnet (2001)
– Tetrechloroethylene and Freon113: Varty (1984)
– Methylbenzoate at 25�C: Zisselmar and Molerus
(1979)
– Light fuel oil and 30% by volume of palatinol C:
Durst et al. (1979)
– Xylen and 44% by volume and Varsol: Elphick
et al. (1984)
Exp Fluids (2011) 50:1183–1206 1201
123
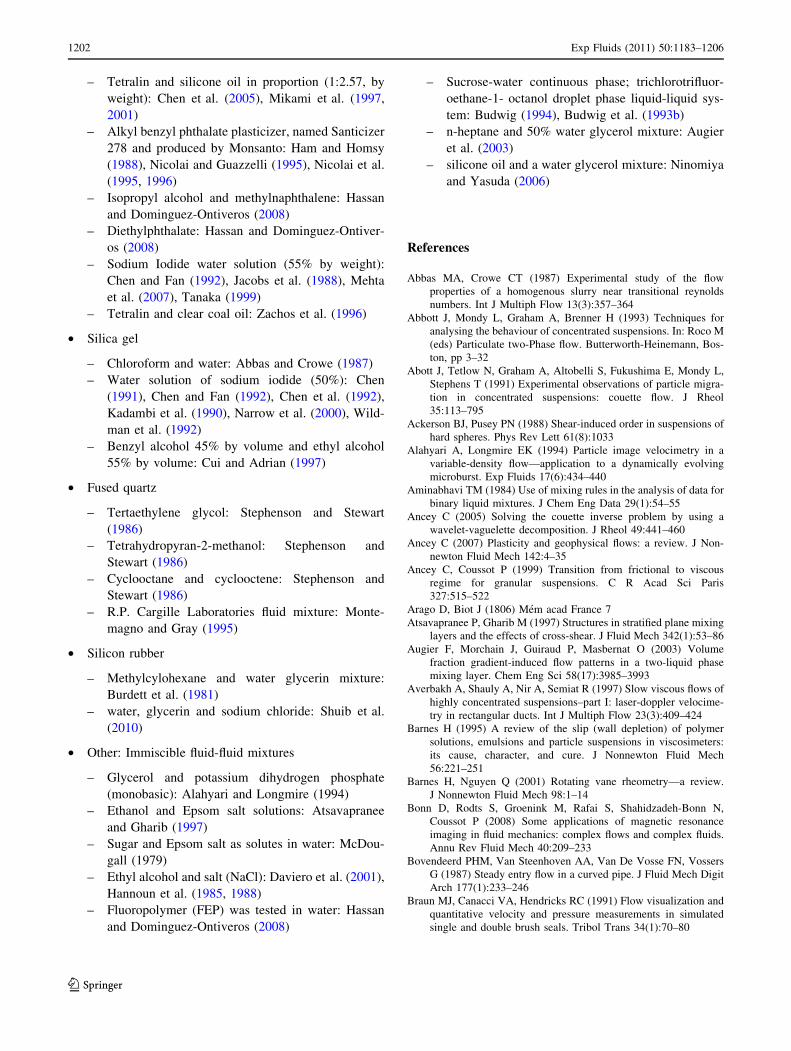
– Tetralin and silicone oil in proportion (1:2.57, by
weight): Chen et al. (2005), Mikami et al. (1997,
2001)
– Alkyl benzyl phthalate plasticizer, named Santicizer
278 and produced by Monsanto: Ham and Homsy
(1988), Nicolai and Guazzelli (1995), Nicolai et al.
(1995, 1996)
– Isopropyl alcohol and methylnaphthalene: Hassan
and Dominguez-Ontiveros (2008)
– Diethylphthalate: Hassan and Dominguez-Ontiver-
os (2008)
– Sodium Iodide water solution (55% by weight):
Chen and Fan (1992), Jacobs et al. (1988), Mehta
et al. (2007), Tanaka (1999)
– Tetralin and clear coal oil: Zachos et al. (1996)
• Silica gel
– Chloroform and water: Abbas and Crowe (1987)
– Water solution of sodium iodide (50%): Chen
(1991), Chen and Fan (1992), Chen et al. (1992),
Kadambi et al. (1990), Narrow et al. (2000), Wild-
man et al. (1992)
– Benzyl alcohol 45% by volume and ethyl alcohol
55% by volume: Cui and Adrian (1997)
• Fused quartz
– Tertaethylene glycol: Stephenson and Stewart
(1986)
– Tetrahydropyran-2-methanol: Stephenson and
Stewart (1986)
– Cyclooctane and cyclooctene: Stephenson and
Stewart (1986)
– R.P. Cargille Laboratories fluid mixture: Monte-
magno and Gray (1995)
• Silicon rubber
– Methylcylohexane and water glycerin mixture:
Burdett et al. (1981)
– water, glycerin and sodium chloride: Shuib et al.
(2010)
• Other: Immiscible fluid-fluid mixtures
– Glycerol and potassium dihydrogen phosphate
(monobasic): Alahyari and Longmire (1994)
– Ethanol and Epsom salt solutions: Atsavapranee
and Gharib (1997)
– Sugar and Epsom salt as solutes in water: McDou-
gall (1979)
– Ethyl alcohol and salt (NaCl): Daviero et al. (2001),
Hannoun et al. (1985, 1988)
– Fluoropolymer (FEP) was tested in water: Hassan
and Dominguez-Ontiveros (2008)
– Sucrose-water continuous phase; trichlorotrifluor-
oethane-1- octanol droplet phase liquid-liquid sys-
tem: Budwig (1994), Budwig et al. (1993b)
– n-heptane and 50% water glycerol mixture: Augier
et al. (2003)
– silicone oil and a water glycerol mixture: Ninomiya
and Yasuda (2006)
References
Abbas MA, Crowe CT (1987) Experimental study of the flow
properties of a homogenous slurry near transitional reynolds
numbers. Int J Multiph Flow 13(3):357–364
Abbott J, Mondy L, Graham A, Brenner H (1993) Techniques for
analysing the behaviour of concentrated suspensions. In: Roco M
(eds) Particulate two-Phase flow. Butterworth-Heinemann, Bos-
ton, pp 3–32
Abott J, Tetlow N, Graham A, Altobelli S, Fukushima E, Mondy L,
Stephens T (1991) Experimental observations of particle migra-
tion in concentrated suspensions: couette flow. J Rheol
35:113–795
Ackerson BJ, Pusey PN (1988) Shear-induced order in suspensions of
hard spheres. Phys Rev Lett 61(8):1033
Alahyari A, Longmire EK (1994) Particle image velocimetry in a
variable-density flow—application to a dynamically evolving
microburst. Exp Fluids 17(6):434–440
Aminabhavi TM (1984) Use of mixing rules in the analysis of data for
binary liquid mixtures. J Chem Eng Data 29(1):54–55
Ancey C (2005) Solving the couette inverse problem by using a
wavelet-vaguelette decomposition. J Rheol 49:441–460
Ancey C (2007) Plasticity and geophysical flows: a review. J Non-
newton Fluid Mech 142:4–35
Ancey C, Coussot P (1999) Transition from frictional to viscous
regime for granular suspensions. C R Acad Sci Paris
327:515–522
Arago D, Biot J (1806) Mem acad France 7
Atsavapranee P, Gharib M (1997) Structures in stratified plane mixing
layers and the effects of cross-shear. J Fluid Mech 342(1):53–86
Augier F, Morchain J, Guiraud P, Masbernat O (2003) Volume
fraction gradient-induced flow patterns in a two-liquid phase
mixing layer. Chem Eng Sci 58(17):3985–3993
Averbakh A, Shauly A, Nir A, Semiat R (1997) Slow viscous flows of
highly concentrated suspensions–part I: laser-doppler velocime-
try in rectangular ducts. Int J Multiph Flow 23(3):409–424
Barnes H (1995) A review of the slip (wall depletion) of polymer
solutions, emulsions and particle suspensions in viscosimeters:
its cause, character, and cure. J Nonnewton Fluid Mech
56:221–251
Barnes H, Nguyen Q (2001) Rotating vane rheometry—a review.
J Nonnewton Fluid Mech 98:1–14
Bonn D, Rodts S, Groenink M, Rafai S, Shahidzadeh-Bonn N,
Coussot P (2008) Some applications of magnetic resonance
imaging in fluid mechanics: complex flows and complex fluids.
Annu Rev Fluid Mech 40:209–233
Bovendeerd PHM, Van Steenhoven AA, Van De Vosse FN, Vossers
G (1987) Steady entry flow in a curved pipe. J Fluid Mech Digit
Arch 177(1):233–246
Braun MJ, Canacci VA, Hendricks RC (1991) Flow visualization and
quantitative velocity and pressure measurements in simulated
single and double brush seals. Tribol Trans 34(1):70–80
1202 Exp Fluids (2011) 50:1183–1206
123

Breedveld V, Van Den Ende D, Tripathi A, Acrivos A (1998) The
measurement of the shear-induced particle and fluid tracer
diffusivities in concentrated suspensions by a novel method.
J Fluid Mech 375(1):297–318
Breedveld V, Van Den Ende D, Bosscher M, Jongschaap RJJ,
Mellema J (2001) Measuring shear-induced self-diffusion in a
counterrotating geometry. Phys Rev E 63(2):021,403
Breedveld V, Van Den Ende D, Jongschaap R, Mellema J (2001)
Shear-induced diffusion and rheology of noncolloidal suspen-
sions: time scales and particle displacements. J Chem Phys
114(13):5923–5936
Breedveld V, Van Den Ende D, Bosscher M, Jongschaap RJJ,
Mellema J (2002) Measurement of the full shear-induced self-
diffusion tensor of noncolloidal suspensions. J Chem Phys
116(23):10529–10535
Brown JM, Kadlubowski BM, Forney LJ, Sommerfeld JT (1996)
Density gradient columns: dynamic modeling for linear profiles.
Rev Sci Instr 67(11):3973–3980
Budwig R (1994) Refractive index matching methods for liquid flow
investigations. Exp Fluids 17(5):350–355
Budwig R, Elger D, Hooper H, Slippy J (1993) Steady flow in
abdominal aortic-aneurysm models. J Biomech Eng Trans
ASME 115(4):418–423
Budwig R, Martinez J, Carlson T (1993b) Hydrodynamic and mass
transfer characteristics of acoustically levitated and oscillated
droplets. Bull Am Phys Soc 33
Burdett ID, Webb DR, Davies GA (1981) A new technique for
studying dispersion flow, holdup and axial mixing in packed
extraction columns. Chem Eng Sci 36(12):1915–1919
Callaghan PT (1999) Rheo-NMR: nuclear magnetic resonance and the
rheology of complex fluids. Rep Progr Phys 62(4):599–670
Cariou JM, Dugas J, Martin L, Michel P (1986) Refractive-index
variations with temperature of PMMA and polycarbonate. Appl
Optics 25(3):334–336
Cenedese A, Viotti P (1996) Lagrangian analysis of nonreactive
pollutant dispersion in porous media by means of the particle
image velocimetry technique. Water Resour Res 32(8):2329–2343
Chaudhuri P, Gao Y, Berthier L, Kilfoil M, Kob W (2008) A random
walk description of the heterogeneous glassy dynamics of
attracting colloids. J Phys Condens Matter 20(24):244,126–
0953-8984
Chen RC (1991) Experimental and numerical studies of solid-liquid
multiphase flow in pipes. PhD thesis, Case Western Reserve
University
Chen RC, Fan LS (1992) Particle image velocimetry for character-
izing the flow structure in three-dimensional gas-liquid-solid
fluidized beds. Chem Eng Sci 47(13–14):3615–3622
Chen RC, Tzeng JW, Reese J, Fan LS (1992) Bed flow structure of a
three-dimensional three-phase fluidized bed. In: AIChE Annual
Meeting, Miami Beach
Chen B, Mikami F, Nishikawa N (2005) Experimental studies on
transient features of natural convection in particles suspensions.
Int J Heat Mass Transf 48(14):2933–2942
Christiansen C (1884) Untersuchungen nber die optischen Eigens-
chaften von fein verteilten Korpern. Ann Phys Chem
23:298–306
Christiansen C (1885) Untersuchungen nber die optischen Eigens-
chaften von fein verteilten Korpern. Ann Phys Chem 24:439–
446
Conaghan B, Rosen S (1972) The optical properties of two-phase
polymer systems: single scattering in monodispese, non-absorb-
ing systems. Polym Eng Sci 12(2):134–139
Coombs SH (1981) A density-gradient column for determining the
specific gravity of fish eggs, with particular reference to eggs of
the mackerel scomber scombrus. Mar Biol 63(1):101–106
Coussot P (2005) Rheometry of pastes, suspensions and granular
materials. Wiley, New York
Coussot P, Raynaud J, Ancey C (2003) Combined MRI-rheometry
determination of the behavior of mud suspensions. In: Chen C,
Rickenmann D (eds) Debris flow mechanics and mitigation
conference. Mills Press, Davos, pp 291–301
Coussot P, Tocquer L, Lanos C, Ovarlez G (2009) Macroscopic vs.
local rheology of yield stress fluids. J Nonnewton Fluid Mech
158:85–90
Cui M, Adrian R (1997) Refractive index matching and marking
methods for highly concentrated solid-liquid flows. Exp Fluids
22:261–264
Dale D, Gladstone F (1858) Phil Trans 148:887
Dale D, Gladstone F (1864) Phil Trans 153:317
Daviero GJ, Roberts PJW, Maile K (2001) Refractive index matching
in large-scale stratified experiments. Exp Fluids 31(2):119–126
Davis RH, Acrivos A (1985) Sedimentation of noncolloidal particles
at low reynolds numbers. Annu Rev Fluid Mech 17(1):91
Dibble CJ, Kogan M, Solomon MJ (2006) Structure and dynamics of
colloidal depletion gels: coincidence of transitions and hetero-
geneity. Phys Rev E 74(4):041403
Durst F, Keck T, Kleine R (1979) Turbulence quantities and reynolds
stress in pipe flow of polymer solutions measured by two-
channel laser-doppler anemometry. In: Proceedings of 6th
symposium on Turbulence, Rolla
Durst F, Mnller R, Jovanovic J (1988) Determination of the
measuring position in laser-doppler anemometry. Exp Fluids
6(2):105–110
Dybbs A, Edwards RV (1984) An index-matched flow system for
measurements of flow in complex geometries. In: Proceedings of
2nd international symposium on application of LDA to fluid
mechanics, Lisbon, pp 171–184
Einstein A (1906) Eine neue Bestimmung der Moleknldimensionen.
Ann Phys 19:289
Einstein A (1911) Berichigung zu meiner Arbeit: ‘‘Eine neue Bestim-
mung der Moleknldimensionen’’. Ann Phys 34(339):591–592
Elkins CJ, Alley MT (2007) Magnetic resonance velocimetry:
applications of magnetic resonance imaging in the measurement
of fluid motion. Exp Fluids 43:823–858
Elphick RV, Martin WW, Currie IG (1984) Application of lda to high
reynolds number cross flow. In: Proceedings of 2nd international
symposium on application of LDA to fluid mechanics, Lisbon
Fukushima E (1999) Nuclear magnetic resonance as a tool fo study
flow. Annu Rev Fluid Mech 31(1):95–123
Gao Y, Kilfoil ML (2007) Direct imaging of dynamical heterogene-ities near the colloid-gel transition. Phys Rev Lett 99(7):078301
Gijsen FJH, Palmen DEM, van der Beek MHE, van de Vosse FN, van
Dongen MEH, Janssen JD (1996) Analysis of the axial flow field
in stenosed carotid artery bifurcation models—LDA experi-
ments. J Biomech 29(11):1483–1489
Graham A, Bird R (1984) Particle clusters in concentrated suspen-
sions. 1. experimental observations of particle clusters. Ind Eng
Chem Fundam 23:406–410
Graham A, Steele R (1984) Particle clusters in concentrated
suspensions. 2. information theory and particle clusters. Ind
Eng Chem Fundam 23:411–420
Graham A, Steele R (1984) Particle clusters in concentrated
suspensions. 3. prediction of suspension viscosity. Ind Eng
Chem Fundam 23:420–425
Graham A, Altobelli S, Fukushima E, Mondy L, Stephens T (1991)
Note: NMR imaging of shear induced diffusion and structure in
concentrated suspensions udergoing couette flow. J Rheol
35(1):191–201
Guyon E, Hulin JP, Petit L (2001) Hydrodynamique physique. EDP
Sci
Exp Fluids (2011) 50:1183–1206 1203
123

Haam SJ (1996) Multiphase research on solid-liquid dispersion. PhD
thesis, The Ohio State University
Haam SJ, Brodkey RS (2000) Motions of dispersed beads obtained by
particle tracking velocimetry measurements: part II. Int J
Multiph Flow 26(9):1419–1438
Haam SJ, Brodkey RS, Fort I, Klaboch L, Placnik M, Vanecek V
(2000) Laser doppler anemometry measurements in an index of
refraction matched column in the presence of dispersed beads:
part I. Int J Multiph Flow 26(9):1401–1418
Ham JM, Homsy GM (1988) Hindered settling and hydrodynamic
dispersion in quiescent sedimenting suspensions. Int J Multiph
Flow 14(5):533–546
Handley D (1957) Studies of the motion of particles in liquid fluidised
beds. PhD thesis, University of Leeds
Hannoun IA, Fernando HIS, List El (1985) Matching the refractive
index in density stratified flows. Technical report, California
Institute of Technology
Hannoun IA, Fernando HJS, List EJ (1988) Turbulence structure near a
sharp density interface. J Fluid Mech Digit Arch 189(1):189–209
Hassan YA, Dominguez-Ontiveros EE (2008) Flow visualization in a
pebble bed reactor experiment using PIV and refractive index
matching techniques. Nucl Eng Des 238(11):3080–3085
Hassan YA, Blanchat TK, Seeley CH Jr, Canaan RE (1992)
Simultaneous velocity measurements of both components of a
two-phase flow using particle image velocimetry. Int J Multiph
Flow 18(3):371–395
Heller W (1945) The determination of refractive indices of colloidal
particles by means of a new mixture rule or from measurements
of light scattering. Phys Rev 68(1-2):5–10
Heller W (1965) Remarks on refractive index mixture rules. J Phys
Chem 69(4):1123–1129
Hendriks F, Aviram A (1982) Use of zinc iodide solutions in flow
research. Rev Sci Instr 53(1)
Hopkins LM, Kelly JT, Wexler AS, Prasad AK (2000) Particle image
velocimetry measurements in complex geometries. Exp Fluids
29(1):91–95
Horvay M, Leuckel W (1984) LDA measurement of liquid swirl flow
in converging swirl chamber with tangential inlets. In: Proceed-
ings of 2nd international symposium on application of LDA to
fluid mechanics, Lisbon
Hurlburt C (1984) The jewler’s refractometer as a mineralogical tool.
Am Mineral 69:391–398
Jacobs DA, Jacobs CW, Andereck CD (1988) Biological scattering
particles for laser doppler velocimetry. Phys Fluids 31(12):
3457–3461
Jana SC, Kapoor B, Acrivos A (1995) Apparent wall slip velocity
coefficients in concentrated suspensions of noncolloidal parti-
cles. J Rheol 39(6):1123–1132
Johnston W, Dybbs A, Edwards R (1975) Measurement of fluid
velocity inside porous media with a laser anemometer. Phys
Fluids 18(7):913–914
Kadambi JR, Chen RC, Bhunia S, Dybbs AZ, Edwards RV, Rutstein
A (1990) Measurement of solid-liquid multiphase flow using
refractive-index matching technique. In: Laser anemometry—
advances and applications, pp 477–487
Kannemans H (1979) Principles of lda measurements in a fully
transparent pump. In: Fluid mechanics silver jubilee conference,
Glasgow
Kapoor B, Acrivos A (1995) Sedimentation and sediment flow in
settling tanks with inclined walls. J Fluid Mech Digit Arch
290(1):39–66
Karnis A, Goldsmith HL, Mason SG (1966) The kinetics of flowing
dispersions: I. concentrated suspensions of rigid particles.
J Colloid Interface Sci 22(6):531–553
Kaufman LJ, Weitz DA (2006) Direct imaging of repulsive and
attractive colloidal glasses. J Chem Phys 125(7):074716
Kegel WK, van Blaaderen A (2000) Direct observation of dynamical
heterogeneities in colloidal hard-sphere suspensions. Science
287(5451):290–293
Kodak (2005) Kodak KAI-2020/KAI-2001 CCD timing specification
version 1.1 evaluation board kit 4h0691
Koh C (1991) Experimental and theoretical studies on two-phase
fows. PhD thesis, California Institute of Technology
Koh C, Hookham P, Leal L (1994) An experimental investigation of
concentrated suspension flows in a rectangular channel. J Fluid
Mech 266:1–32
Kohnen C, Bohnet M (2001) Measurement and simulation of fluid
flow in agitated solid/liquid suspensions. Chem Eng Technol
24(6):639–643
Krishnan GP, Beimfohr S, Leighton DT (1996) Shear-induced radial
segregation in bidisperse suspensions. J Fluid Mech Digit Arch
321(1):371–393
Kubo K, Aratani T, Mishima A, Yano T (1978) Photographic
observation of flow pattern in voids of packed-bed of spheres.
J Chem Eng Jpn 11(5):405–407
Lam SY, Damzen MJ (2003) Characterisation of solid-state dyes and
their use as tunable laser amplifiers. Appl Phys B Lasers Optics
77(6):577–584. doi:10.1007/s00340-003-1285-5
Leighton D, Acrivos A (1987) Measurement of shear-induced self-
diffusion in concentrated suspensions of spheres. J Fluid Mech
177:109–131
Lenoble M (2005) Ecoulement et segregation dans des pates
granulaires modele. PhD thesis, Universite Bordeaux 1
Lenoble M, Snabre P, Pouligny B (2005) The flow of very
concentrated slurry in a parallel-plate device: influence of
gravity. Phys Fluids 17:073,303
Lenoble M, Snabre P, Pouligny B (2005b) Shearing a granular pate in
a couette device: flow and size segraegation. In: Powders and
grains, pp 621–624
Liu CH, Nouri JM, Whitelaw JH, Tse DGN (1989) Particle velocities
in a swirling, confined flow. Combust Sci Technol
68(4–6):131–145
Liu CH, Vafidis C, Whitelaw JH, Margary R (1990) Flow in the
coolant passages of an internal combustion engine cylinder head.
Exp Fluids 10(1):50–54
Lorentz HA (1906) Theory of electrons. Teubner, Leipzig
Lyon M, Leal L (1998) An experimental study of the motion of
concentrated suspensions in two-dimensional channel flow. part
1. monodisperse systems. J Fluid Mech 363:25–56
Lyon M, Leal L (1998) An experimental study of the motion of
concentrated suspensions in two-dimensional channel flow. part
2. bidisperse systems. J Fluid Mech 363:57–77
McDougall TJ (1979) On the elimination of refractive-index varia-
tions in turbulent density-stratified liquid flows. J Fluid Mech
Digit Arch 93(1):83–96
Mehta M, Kadambi JR, Sastry S, Sankovic JM, Wernet MP, Addie G,
Visintainer R (2007) Particle velocities in the rotating impeller
of a slurry pump. In: Fedsm 2007: Proceedings of the 5th joint
AMSE/JSME fluids engineering summer conference, vol 1,
pp 369–378
Mewis J, Wagner NJ (2009) Current trends in suspension rheology.
J Non-Newton Fluid Mech 157(3):147–150
Mikami F, Chen B, Nishikawa N (1997) Visualization of the flow
features of natural convection in particle suspensions. Theor
Appl Mech 46:341–348
Mikami F, Chen B, Nishikawa N (2001) Visualization and PTV study
of natural convection in particle suspensions (simultaneous
measurements of velocity, temperature and interface between
particle-free fluid and suspension). JSME Int J Ser B Fluids
Therm Eng 44(1):30–37
Milliken WJ, Gottlieb M, Graham AL, Mondy LA, Powell RL (1989)
The viscosity-volume fraction relation for suspensions of rod-
1204 Exp Fluids (2011) 50:1183–1206
123
like particles by falling-ball rheometry. J Fluid Mech Digit Arch
202(1):217–232
Mondy LA, Graham AL, Majumdar A, Bryant LE (1986) Techniques
of measuring particle motions in concentrated suspensions. Int J
Multiph Flow 12(3):497–502
Montemagno CD, Gray WG (1995) Photoluminescent volumetric
imaging: a technique for the exploration of multiphase flow and
transport in porous media. Geophys Res Lett 22
Moroni M, Cushman JH (2001) Three-dimensional particle tracking
velocimetry studies of the transition from pore dispersion to
fickian dispersion for homogeneous porous media. Water Resour
Res 37
Narrow TL, Yoda M, Abdel-Khalik SI (2000) A simple model for the
refractive index of sodium iodide aqueous solutions. Exp Fluids
28(3):282–283
Nguyen TT, Biadillah Y, Mongrain R, Brunette J, Tardif JC, Bertrand
OF (2004) A method for matching the refractive index and
kinematic viscosity of a blood analog for flow visualization in
hydraulic cardiovascular models. J Biomech Eng 126(4):
529–535
Nicolai H, Guazzelli E (1995) Effect of the vessel size on the
hydrodynamic diffusion of sedimenting spheres. Phys Fluids
7(1):3–5
Nicolai H, Herzhaft B, Hinch EJ, Oger L, Guazzelli E (1995) Particle
velocity fluctuations and hydrodynamic self-diffusion of sedi-
menting non-brownian spheres. Phys Fluids 7(1):12–23
Nicolai H, Peysson Y, Guazzelli E (1996) Velocity fluctuations of a
heavy sphere falling through a sedimenting suspension. Phys
Fluids 8(4):855–862
Ninomiya N, Yasuda K (2006) Visualization and piv measurement of
the flow around and inside of a falling droplet. J Vis
9(3):257–264
Northrup MA, Kulp TJ, Angel SM (1991) Application of fluorescent
particle imaging to measuring flow in complex media. Anal
Chim Acta 255(2):275–282
Northrup MA, Kulp TJ, Angel SM (1991) Fluorescent particle image
velocimetry—application to flow measurement in refractive
index-matched porous-media. Appl Optics 30(21):3034–3040
Northrup MA, Kulp TJ, Angel SM, Pinder GF (1993) Direct
measurement of interstitial velocity-field variations in a
porous-medium using fluorescent-particle image velocimetry.
Chem Eng Sci 48(1):13–21
Nouri J, Whitelaw J, Yianneskis M (1986) An investigation of
refractive-index matching of continuous and discontinuous
phases. In: 3rd International symposium on applications of laser
anemometry to fluid mechanics
Nouri JM, Whitelaw JH, Yianneskis M (1987) Particle motion and
turbulence in dense two-phase flows. Int J Multiph Flow
13(6):729–739
Nouri J, Whitelaw J, Yianneskis M (1988) A refractive-index
matching technique for solid/liquid flows. In: Laser anemometry
in fluid mechanics, selected papers from the 3rd international
symposium on application of laser-doppler anemometry to fluid
mechanics
Oki Y, Yoshiura T, Chisaki Y, Maeda M (2002) Fabrication of a
distributed-feedback dye laser with a grating structure in its
plastic waveguide. Appl Optics 41(24):5030–5035
Okumura M, Yuki K, Hashizume H, Sagara A (2005) Evaluation of
flow structure in packed-bed tube by visualization experiment.
Fusion Sci Technol 47(4):1089–1093
Oster G, Yamamoto M (1963) Density gradient techniques. Chem
Rev 63(3):257
Ouriev B (2000) Ultrasound doppler based in-line rheometry of
highly concentrated suspensions. PhD thesis, ETHZ
Ouriev B (2002) Investigation of the wall slip effect in highly
concentrated disperse systems by means of non-invasive uvp-pd
method in the pressure driven shear flow. Colloid J
64(6):740–745
Ovarlez G, Bertrand F, Rodts S (2006) Local determination of the
constitutive law of a dense suspension of noncolloidal particles
through magnetic resonance imaging. J Rheol 50(3):259–292
Park JT, Mannheimer RJ, Grimley TA, Morrow TB (1989) Pipe flow
measurements of a transparent non-newtonian slurry. J Fluids
Eng Trans ASME 111(3):331–336
Parker J, Merati P (1996) An investigation of turbulent taylor-couette
flow using laser doppler velocimetry in a refractive index
matched facility. J Fluids Eng Trans ASME 118(4):810–818
Peurrung LM, Rashidi M, Kulp TJ (1995) Measurement of porous
medium velocity fields and their volumetric averaging charac-
teristics using particle tracking velocimetry. Chem Eng Sci
50(14):2243–2253
Plantard G, Saadaoui H, Snabre P, Pouligny B (2006) Surface-
roughness-driven segregation in a granular slurry under shear.
Europhys Lett 75(2):335
Potanin A (2010) 3D simulations of the flow of thixotropic fluids, in a
large-gap Couette and vane-cup geometries. J Nonnewton Fluid
Mech 165:299–312
Raman C (1949) The theory of the christiansen experiment. Proc
Indian Natl Sci Acad 29:381–390
Rashidi M, Peurrung L, Tompson AFB, Kulp TJ (1996) Experimental
analysis of pore-scale flow and transport in porous media. Adv
Water Resour 19(3):163–180
Russel J (1936) Studies of thixotropic gelation. part II. The
coagulation of clay suspensions. Proc R Soc Lond A 154:550–
560
Saleh S, Thovert JF, Adler PM (1992) Measurement of two-
dimensional velocity fields in porous media by particle image
displacement velocimetry. Exp Fluids 12(3):210–212
Saleh S, Thovert J, Adler P (1993) Flow along porous media by
partical image velocimetry. AIChE J 39(11):1765–1776
Savarmand S, Heniche M, Bechard V, Bertrand F, Carreau P (2007)
Analysis of the vane rheometer using 3D finite element
simulation. J Rheol 51:161–177
Shauly A, Averbakh A, Nir A, Semiat R (1997) Slow viscous flows of
highly concentrated suspensions—part II: particle migration,
velocity and concentration profiles in rectangular ducts. Int J
Multiph Flow 23(4):613–629
Shindo Y, Kusano K (1979) Densities and refractive indices of
aqueous mixtures of alkoxy alcohols. J Chem Eng Data
24(2):106–110
Shuib A, Hoskins P, Easson W (2010) Flow regime characterization
in a diseased artery model. World Acad Sci Eng Technol 62:110
Sinkankas J (1966) Mineralogy. D Van Nostrand Company, Prince-
ton, pp 226–233
Stahr M, Roth K, JShne B (2003) Measurement of 3d pore-scale flow
in index-matched porous media. Exp Fluids 35(2):159–166
Stephenson JL, Stewart WE (1986) Optical measurements of porosity
and fluid motion in packed beds. Chem Eng Sci 41(8):
2161–2170
Sveen J (2004) An introduction to matpiv (http://www.folk.uio.
no/jks/matpiv/)
Tanaka M (1999) Visualization of flow in a cubic packing of spheres.
In: 9th International topical meeting on nuclear reactor thermal
hydraulics, San Fransisco
Tasic AZ, Djordjevic BD, Grozdanic DK, Radojkovic N (1992) Use
of mixing rules in predicting refractive indexes and specific
refractivities for some binary liquid mixtures. J Chem Eng Data
37(3):310–313
Thompson BE (1990) Refractive index matching techniques in
complex rocket-engine flow configurations. Technical report
Timberlake B, Morris J (2002) Concentration band dynamics in free-
surface couette flow of a suspension. Phys Fluids 14:1580–1589
Exp Fluids (2011) 50:1183–1206 1205
123

Tung LH (1956) Correction. J Polym Sci 19(93):598
Tung LH, Taylor WC (1955) A rapid method of constructing density
gradient tubes. J Polym Sci 17(85):441–442
Tung LH, Taylor WC (1956) An improved method of preparing
density gradient tubes. J Polym Sci 21(97):144–147
Uzol O, Chow YC, Katz J, Meneveau C (2002) Unobstructed particle
image velocimetry measurements within an axial turbo-pump
using liquid and blades with matched refractive indices. Exp
Fluids 33(6):909–919
Van De Hulst HC (1957) Light scattering by small particles. Wiley,
New York
Varty RL (1984) A new system for index-matched laser-anemometer
measurements. J Phys E Sci Instr 17(12):1124–1126
Walters K (1975) Rheometry. Chapman and Hall, London
Wang DC, Khalili A (2002) Flow visualization and quantitative
measurements inside porous media by particle image velocime-
try. Opt Technol Image Process Fluids Solids Diagn
5058:232–239
Wang P, Song C, Briscoe C, Makse HA (2008) Particle dynamics and
effective temperature of jammed granular matter in a slowly
sheared three-dimensional couette cell. Phys Rev E 77(6):
061309
Waxler R, Horowitz D, Feldman A (1979) Optical and physical
parameters of plexiglay 55 and lexan. Appl Opt 18:101
Weeks ER, Crocker JC, Levitt AC, Schofield A, Weitz DA (2000)
Three-dimensional direct imaging of structural relaxation near
the colloidal glass transition. Science 287(5453):627–631
Wiederseiner S (2010) Rheophysics of concentrated particle suspen-
sions in a couette cell using a refractive index matching
technique. PhD thesis, Ecole Polytechnique federale de
Lausanne
Wiener O (1910) Leipzig Ber 62:256
Wildman DJ, Ekmann JM, Kadambi JR, Chen RC (1992) Study of the
flow properties of slurries using the refractive index matching
technique ldv. Powder Technol 73(3):211–218
Yarlagadda A, Yoganathan A (1989) Experimental studies of model
porous media fluid dynamics. Exp Fluids 8(1):59–71
Yianneskis M, Whitelaw J (1983) Velocity characteristics of pipe and
jet flow witch high particle concentrations. Technical report FS/
83/22, Imperial College
Yuki K, Okurnura M, Hashizume H, Toda S, Morley NB, Sagara A
(2008) Flow visualization and heat transfer characteristics for
sphere-packed pipes. J Thermophys Heat Transf 22(4):632–648
Zachos A, Kaiser M, Merzkirch W (1996) PIV measurements in
multiphase flow with nominally high concentration of the solid
phase. Exp Fluids 20(3):229–231
Zerai B, Saylor BZ, Kadambi JR, Oliver MJ, Mazaheri AR, Ahmadi
G, Bromhal GS, Smith DH (2005) Flow characterization through
a network cell using particle image velocimetry. Transp Porous
Media 60:159–181
Zisselmar R, Molerus O (1979) Investigation of solid-liquid pipe flow
with regard to turbulence modification. Chem Eng J
18(2):233–239
1206 Exp Fluids (2011) 50:1183–1206
123