Reforming the UK Family Tax and Benefit System
109
Reforming the UK Family Tax and Benefits System Peter Saunders edited by Natalie Evans
-
Upload
policy-exchange -
Category
Documents
-
view
216 -
download
2
description
Written by Peter Saunders and edited by Natalie Evans Reforming the UK Family Tax and Benefits System reveals that the average middle-income family today pays £6,016 in tax and National Insurance contributions, but gets back £5,383 as social security and family payments. This unnecessary churning has undermined family independence and self-reliance and turned four-fifths of the nation’s families (around 5.5 million households) into welfare claimants.
Transcript of Reforming the UK Family Tax and Benefit System
Reforming the UKFamily Tax andBenefits SystemPeter Saundersedited by Natalie Evans
£10.00ISBN: 978-1-906097-49-3
Policy ExchangeClutha House10 Storey’s GateLondon SW1P 3AY
www.policyexchange.org.uk
PolicyExchange
Reformingthe
UKFam
ilyTaxand
BenefitsSystem
British families have changed radically over the last 40 years: marriage rates have
fallen, cohabitation outside marriage has become the norm, divorce has risen and
the number of children being raised by sole parents has escalated. As politicians of
all parties have attempted to respond to these changes, UK family policy has gone
through a period of major reform and substan(al upheaval. Since 1997 in par(cular,
both the method and level of support provided to families through the tax and
benefits system has been changed significantly.
Through a detailed analysis of the development of family support in the UK, this
report argues that we have ended up with a system that is very costly, often unfair,
and which undermines the independence and self-reliance of families rather than
promoting it.
We identify where family policy has gone wrong – often with good intentions – and
suggest a number of key policy recommendations. In particular, families should be
allowed to retain more of their own income, rather than relying on hand-outs from
the government. This requires reform to the tax credits system, changes to child
benefit and child care allowances, and a restoration of tax allowances for children
and married couples so that more families can achieve the level of self-reliance that
used to be the norm in Britain.
COVER HDS.qxp 14/10/09 16:15 Page 1

Reforming the UKFamily Tax andBenefits System
Peter SaundersEdited by Natalie Evans
Policy Exchange is an independent think tank whose mission is to develop and promote new policy ideas which will foster a free society
based on strong communities, personal freedom, limited government, national self-confidence and an enterprise culture. Registered
charity no: 1096300.
Policy Exchange is committed to an evidence-based approach to policy development. We work in partnership with academics and other
experts and commission major studies involving thorough empirical research of alternative policy outcomes. We believe that the policy
experience of other countries offers important lessons for government in the UK. We also believe that government has much to learn
from business and the voluntary sector.
Trustees
Charles Moore (Chairman of the Board), Theodore Agnew, Richard Briance, Camilla Cavendish, Richard Ehrman, Robin Edwards, Virginia
Fraser, George Robinson, Andrew Sells, Tim Steel, Alice Thomson, Rachel Whetstone and Simon Wolfson.
PX Tax and Family:Layout 2 17/6/09 15:10 Page 1

About the authors
Peter Saunders was until 1999 Professor of Sociology at the University of Sussex,where he is still Professor Emeritus. Since then he has been Research Manager atthe Australian Institute of Family Studies in Melbourne, and Social ResearchDirector at the Centre for Independent Studies in Sydney. His books include ANation of Home Owners; Capitalism – A Social Audit; SocialTheory and the Urban Question; UnequalBut Fair?; Introduction to British Politics; and Australia’sWelfare Habit and How to Kick It. He isnow back in the UK working as an independent consultant and specialising insocial policy.
Natalie Evans is Deputy Director at Policy Exchange, responsible for the outputand strategic direction of the research team.
Prior to joining Policy Exchange she was Head of Policy at the BritishChambers of Commerce. She has also previously been Deputy Director at theConservative Research Department specialising in welfare and social policy issues.
2 | policyexchange.org.uk
© Policy Exchange 2009
Published by
Policy Exchange, Clutha House, 10 Storey’s Gate, London SW1P 3AY
www.policyexchange.org.uk
ISBN: 978-1-906097-49-3
Printed by Heron, Dawson and Sawyer
Designed by SoapBox, www.soapboxcommunications.co.uk
PX Tax and Family:Layout 2 17/6/09 15:10 Page 2

Contents
Acknowledgements 4Executive summary 5
1 What is Family Policy For? 82 What Should Family Policy Do? 213 How Should Assistance be Delivered? 324 Tax Allowances for Dependents 425 What Support do Families Get? 496 Are Tax Credits Working? 597 Problems with the New Tax and Benefits System for Families 678 What can we Learn from Other Countries? 839 Ten Modest Proposals 91
Appendix: Can we Afford It? 107
policyexchange.org.uk | 3
PX Tax and Family:Layout 2 17/6/09 15:10 Page 3

Acknowledgements
I am grateful to Julian Chant, for the rigorous background research work he didfor this project. I would also like to thank Mike Brewer, Lawrence Kay and PatriciaMorgan for full and very helpful comments on an earlier draft; Natalie Evans forguidance and assistance throughout the project as well as editing the final text;and Policy Exchange for making the opportunity possible to carry out this work.
Policy Exchange would like to thank the Peter Cruddas Foundation for theirfinancial support.
4 | policyexchange.org.uk
PX Tax and Family:Layout 2 17/6/09 15:10 Page 4

policyexchange.org.uk | 5
Executive summary
British society has gone through a ‘Great Disruption’ in the last 40 years, andchanges in family life have been at the heart of it. Marriage rates have fallen,cohabitation outside marriage has become the norm, divorce has risen, fertilityrates have plummeted, ex-nuptial births have multiplied, and the number of chil-dren being raised by sole parentshas escalated. The traditional malebreadwinner pattern has alsodisintegrated as women haveincreased their level of workforceparticipation.
These changes have under-mined the system of familysupport that was put in place byBeveridge after the War. At thattime, the vast majority of childrenwere raised by married parents who usually stayed together and who commonlylived on a single wage. Apart from helping a tiny number of widowed familieswho lost their main breadwinner, the main task for family policy was to ensurethat husbands’ earnings were adequate for them to support their dependents. Thiswas achieved by giving married men tax allowances in respect of their wives andchildren, thereby reducing the amount of income tax they had to pay, and bygiving their wives a weekly cash benefit – the ‘Family Allowance’ – to supplementthe housekeeping.
Following the ‘Great Disruption’, however, these arrangements were called intoquestion, for increasing numbers of households had only one parent and nobreadwinner. Today, only 5% of couples with dependent children have no adultworker, but 40% of lone parents do not work, and of those that do, few earnenough to cover the full costs of maintaining themselves and raising their chil-dren. For many sole parent families, government benefits have replaced thefinancial support that used to be provided by husbands. The result has been ahuge increase in government spending.
Even though birth rates have been falling for much of the last 30 years,government spending on families with children has risen strongly – a 143%increase in real terms since the 1970s. In part, this is because New Labour hasfollowed a deliberate policy of increasing financial support for families withchildren, but most of the increase – 60% of it – has been caused by the rise inthe number of sole parent families. Most of the increased spending is not there-fore making families any better off than they used to be; it is simplycompensating for the absence of husband-fathers who used to support theirfamilies and no longer do.
“Most of the increased spending is not making
families any better off than they used to be; it is
simply compensating for the absence of husband-
fathers who used to support their families and no
longer do”
PX Tax and Family:Layout 2 17/6/09 15:10 Page 5

6 | policyexchange.org.uk
Reforming the UK Family Tax and Benefits System
It is right that people with children should be helped with the costs of rais-ing them, but the way taxes and benefits for families have changed toaccommodate the radical shifts that have occurred in family life has createdmany new problems. We have ended up with a system that is very costly, oftenunfair, and which undermines the independence and self-reliance of familiesrather than promoting it.
The case for assisting families with the costs of raising their children rests onthe principle of ‘horizontal equity.’ This recognises that children have a claim ona portion of their parents’ income, which means that a worker with children isearning less for him or herself than a comparable worker on the same wage withno dependents. Equitable taxation requires that his or her earnings should be
taxed less (e.g. by giving childrenand dependent partners their owntax-free income allowances andpermitting them to transfer theseto the person who earns theincome on their behalf).
Recent family policy hasneglected this horizontal equityprinciple. So much emphasis has
been placed on redistributing incomes vertically (from richer to poorer families)that equitable tax treatment of non-parents and parents at each level of incomehas been forgotten. The result is that middle-income families have lost out incomparison with single people, and families relying on just one income havebeen particularly hard-hit. Britain ranks high in international league tables meas-uring the generosity of family support for lower income families, but because wehave neglected the horizontal equity principle, families on average earnings havegone backwards.
One of the biggest mistakes in UK family policy was scrapping tax allowancesfor spouses and dependent children. They have been replaced with ‘tax credits’which are now costing £20 billion per year (up from £2.3 billon in 1997) andwhich in most cases are little more than glorified welfare benefits. Instead ofspending their own money raising their children, as they used to do, manyparents now pay higher taxes to the government, and then have to apply to gettheir money back as fortnightly hand-outs. The average middle-income familytoday pays £6,016 in tax and NI contributions, but gets back £5,383 as socialsecurity and family payments. This unnecessary churning has undermined familyindependence and self-reliance and turned four-fifths of the nation’s families (5.5million households) into welfare claimants.
This report proposes the following changes:
� Tax allowances for dependent children and for non-working spouses shouldbe restored. This would allow working parents to keep more of what theyearn, rather than going to the state for top-ups, and it would reduce wastefulchurning and ‘middle class welfare’.
� Tax credits should be retained, but cut back so they are only claimed by low-income working families (the group for whom they were originallyintended). The purpose of tax credits has become confused because the
“We have ended up with a system that is very
costly, often unfair, and which undermines the
independence and self-reliance of families rather
than promoting it”
PX Tax and Family:Layout 2 17/6/09 15:10 Page 6

government has been using them to reduce poverty as well as to reward work.Families now qualify for tax credits even if they do not have a job, and this hasundermined work incentives rather than strengthening them. Tax creditsshould have only one purpose, which is to boost the income of low-incomefamilies who work. Families where nobody is employed should not be eligi-ble for tax credits (they should get welfare supplements for their children, asused to be the case before 2003).
� The tax credits system should also be overhauled. There should be a singlefamily tax credit, normally payable annually in arrears so as to eliminate theoverpayments problem and reduce fraud. The so-called ‘couple penalty’should be ended by taking account of partners when calculating tax creditpayments. Tax credits should reflect the number of hours work people do. Itis unfair that part-time employment of just 16 hours per week can be toppedup to almost the equivalent of a full-time take-home wage. To ensure thatpeople who work more hours get more support than those who work fewerhours, tax credits should be calculated on hourly rates, not total wages.
� There should also be changes to Child Benefit, child care subsidies andparental leave. Evidence suggests that children up to two years of age benefitfrom being raised at home, but for older children, formal child care can gener-ate significant benefits. It therefore makes sense to enable those parents whowant to stay home to look after their children to do so for the first three years,but after that, there is no reason why taxpayers should subsidise parents to stayat home rather than go to work. Child Benefit could be ‘front-loaded’ ontothe first three years to help defray the cost of lost wages when a parent stayshome. Current child care subsidies could be replaced by a ‘Parenting CareAllowance’ for the first three years, which could be used by parents to buychild care or to offset lost wages, whichever they prefer. A new ‘Life CourseSavings’ scheme could also enable prospective parents to build up tax-freesavings to replace lost earnings during periods of extended parental leave.
� Once their youngest child turns three, parents who cannot support themselvesshould be expected to work rather than claim welfare. This should apply to allfamilies: sole parents as well as couple families should be expected to achieveself-reliance after their children turn 3, and welfare should play only a second-ary role in their family finances. Absent fathers should help pay for the upkeepof their children, just as other fathers are expected to do, and those who failto maintain child support payments should be prosecuted.
In the current economic climate there is no scope for additional government spend-ing, so the proposals outlined in this report are intended to be broadly ‘revenue-neutral.’ There should be no additional spending, just a different pattern ofspending. In particular, the aim should be to shift families from relying on gov-ernment hand-outs to greater reliance on their own earnings, aided by more gen-erous, family-based, tax allowances.
policyexchange.org.uk | 7
Execu9ve summary
PX Tax and Family:Layout 2 17/6/09 15:10 Page 7

1What is the Family For?
The ‘Great Disruption’The American political analyst, Francis Fukuyama, has described the period of the1960s through the 1990s as marking ‘a Great Disruption’ in western societies.1 Inaddition to declining levels of trust, weakening community ties and spirallingcrime rates, this disruption was manifested in a dramatic shift in the norms and val-ues governing family life. In the last 40 years, western family patterns have beentransformed.
It is a sociological truism that the family is the core institution of any society.In addition to providing adults with emotional gratification and economic secu-rity, families play a crucial role in raising the young and therefore in transmittingthe culture of the society from one generation to the next. If family life changes,the socialisation process is almost certain to be affected, and the effects will be feltacross the board: in schools, in places of employment, in levels of crime and anti-social behaviour in local communities, and in patterns of government socialexpenditure.
The indicators of the upheaval that has occurred in family life in Britain overthe last 40 years are all now wearily familiar:2
� Marriage rates have plummeted:The annual number of marriages in Englandand Wales increased steadily (other than during the two World Wars) from1838 (when civil registration began) until 1970. Since then, the number ofcouples getting married each year has fallen by one-third, to just 236,980 in2006.
� Cohabitation outside marriage has become normal and widely accepted:Married couples still outnumber cohabiting couples (11.6 million against 2.2million), but more than 10% of working-age people today cohabit, and thisrepresents a five-fold increase in 30 years. More than half of cohabitingcouples later marry (the proportion of couples who live together beforegetting married has risen from 2% in 1960 to 75% today), but thesemarriages are less likely to last.
� Divorce has increased: There were 24,000 divorces in Britain in 1958. Thisrose to 56,000 in 1969 and reached 125,000 in 1972 following the reformof the divorce laws. Today, there are 155,000 divorces each year, and aboutfour in ten marriages now end in divorce. Although the divorce rate has beenfairly stable (at around 12 divorces per annum for every 1000 married people)since peaking in the mid-1980s, Britain’s rate is one of the highest in the EUand is significantly above the EU average.
8 | policyexchange.org.uk
1 Fukuyama F (1999), The Great
Disruption, Simon & Schuster.
2 The following statistics are
taken from: Centre for Social Jus-
tice, Family Law Review, Interim
Report, November 2008; Cabinet
Office Strategy Unit and Depart-
ment for Children Schools and
Families, Families in Britain: An
evidence paper, December 2008;
OECD, Babies and Bosses, 2007,
Table 2.2; Smallwood S (2004),
‘Characteristics of sole registered
births and the mothers who regis-
ter them’ in Population Trends,
no.117; Kirby J (2005), The price
of parenthood , Centre for Policy
Studies; Department of Health,
Abortion statistics England and
Wales 2007, Statistical Bulletin,
Table 1.
PX Tax and Family:Layout 2 17/6/09 15:10 Page 8

� Fertility rates have dropped: In 1970, the total fertility rate (the number ofchildren born to an average woman over her lifetime) stood at 2.43 in the UK.This was comfortably above the 2.1 required to replace the population eachgeneration. By 2001, it had fallen to 1.63 – significantly below replacementrate – although it has since recovered to 1.9 in 2007. The fall in fertility inBritain has not been as great as in many other countries. In the OECD as awhole, the total fertility rate fell from 2.70 in 1970 to 1.63 in 2005. Part ofthe explanation lies in delayed childbirth (women are having babies later, andmany leave it too late to have the size of family they had hoped for). But therise in abortions has also been a major factor (up from 55,000 – five per thou-sand fertile women – in England and Wales in 1969 to over 200,000 – nearly19 per thousand fertile women – today).
� Births outside of marriage have multiplied: Fewer than 10% of all live birthsin 1971 were to unmarried parents. Today the figure is over 40%. Thisincrease is partly accounted for by the switch from marriage to cohabitation,but in only one-quarter of ex-nuptial births is the father living at the sameaddress as the mother. Of the remainder, half have a father living at a differ-ent address, and half have no father named on the birth certificate. Substantialnumbers of children are today born to unmarried mothers who have little orno contact with the father.
� The number of children raised by sole parents has escalated:The rise in ex-nuptial births has combined with the increase in divorces and cohabitationbreak-ups to produce an increasing number of children being raised in soleparent (normally fatherless) households. In 1975, 10% of families with chil-dren were headed by a sole parent. Today it is 27%. There has also been anincrease in the number of children being raised in step and ‘blended’ (two setsof children from earlier relationships) families (up from 1 in 15 in 1990 to 1in 10 in 2001). A recent government report describes step families as “one ofthe fastest growing family form [sic] in the UK”.3
� Female workforce participation has risen: As a result the traditional ‘malebreadwinner’ model of family life has disintegrated. In particular, part-timeemployment of women with dependent children has become increasinglycommon, and demands for pre-school and out-of-school-hours care has esca-lated as increasing numbers of families try to reconcile the demands of twojobs with the responsibilities of raising young children.
All of this is well-known, and many reports have been written attacking or de-fending the impact of these changes on family wellbeing. While some of thesechanges have been associated with improvements in people’s lives (e.g. we cannow escape from unhappy marriages more easily, and women who want to de-velop careers outside the home now have more opportunity to do so), others haveundoubtedly diminished overall levels of happiness and life satisfaction.
We know, for example, that married couples are richer, happier and more satis-fied with life than cohabiting couples,4 yet marriage has been declining whilecohabitation has been increasing. For children, too, the overall balance sheetappears more negative than positive, for children raised in sole parent, step or‘blended’ families tend on average to be disadvantaged on a wide range of meas-ures as compared with those raised by natural parents in a stable marriage, yet
policyexchange.org.uk | 9
What is the Family For?
3 Cabinet Office Strategy Unit and
Dept for Children Schools and
Families, Families in Britain: An
evidence paper London, Decem-
ber 2008, p.26
4 Ibid, p.85.
PX Tax and Family:Layout 2 17/6/09 15:10 Page 9

marriage has been declining while sole parent and step families have been grow-ing rapidly.5
This report does not attempt yet another analysis of how changes in familylife have affected children’s wellbeing. Our focus is more limited than that. Ithas to do with the shifts in public policy that the ‘Great Disruption’ has trig-gered.
More specifically, we shall trace the way government financial support for fami-lies has changed in response to the shifts that have occurred in family life sinceWorld War II. We shall ask why governments spend so much money supportingthe nation’s families, what they are trying to achieve, what effects their expendi-ture is actually having, and whether the current policy mix is appropriate giventhe changed context of family life in the contemporary period. In this way, weshall try to work from first principles to identify ways in which the governmentmight secure better outcomes by changing some of the ways it provides financialsupport for families.
The post-war legacy of family support policiesWhen Beveridge put in place the foundations of Britain’s modern welfare state inthe 1940s, the overwhelming majority of children were raised by their two natu-ral parents. These parents were almost invariably married to each other, and wereunlikely to separate.
The public policy problem which Beveridge had to address was simple: how toensure that these married couples had sufficient income to cover the costs of rais-ing their children.
Most families at that time relied for their income on one, full-time, male wage.There was a complementary (though in some views, unequal) division of labourbetween husband and wife whereby the man worked outside the home for awage, while the woman worked inside the home, bringing up the children andmanaging the domestic budget.6
The normal pattern was that part of the man’s wage would go to his wife tocover ‘housekeeping,’ which included personal items for herself and the chil-dren (some families regarded the housekeeping money as the wife’s ‘wage’).7
There was an implicit understanding that he would continue to provide finan-cially for her throughout their lives, so she could sacrifice her own futurecareer knowing that her husband had made a binding commitment throughmarriage to provide for her, even after the children had grown up and lefthome.
Two kinds of problems could arise in these arrangements. One was if a mandied, for his dependents might then be left with no source of income. This even-tuality was covered in some cases by insurance, or by membership of a friendlysociety or other mutual aid association offering widows’ and orphans’ benefits.8
In other cases, bereaved women had to rely on Poor Law assistance until thegovernment introduced Widows’ and Orphans’ benefits in 1925.9
The second kind of problem arose when men were working, but did not earnhigh enough wages to cover the essential costs of supporting their children and adependent spouse. Because the level of a man’s wage was determined by the value
10 | policyexchange.org.uk
Reforming the UK Family Tax and Benefits System
5 Much of the evidence on child
wellbeing in sole parent, step and
‘blended’ families is reviewed in
Dennis N and Erdos G (1993),
Families without fatherhood, In-
stitute of Economic Affairs, Lon-
don, 2nd edition; Morgan P
(1999), Farewell to the family?,
Institute of Economic Affairs, Lon-
don, 2nd edition; Maley B (2001),
Family and Marriage in Australia,
Centre for Independent Studies,
Sydney; Social Justice Policy
Group, Breakthrough Britain,
vol.1: Family Breakdown, Centre
for Social Justice, July 2007; La-
yard R and Dunn J (2009), A Good
Childhood, The Children’s Society,
London.
6 Differentiation of roles between
husband and wife does not neces-
sarily indicate inequality of power
or status between them. Some
thinking seems to imply that men
and women cannot be equal un-
less they both share equally in all
family functions, including paid
work and child nurturing. Not
only do many couples not wish to
adopt such a pattern (see Hakim
C (1996), Key Issues in Women’s
Work, London: Athlone Press),
but there are longstanding socio-
logical arguments that families
might function most effectively
when one specialises in ‘external’
and ‘instrumental’ activities while
the other focuses more on ‘inter-
nal’ and ‘expressive’ ones (e.g.
Parsons T and Bales R (1955),
Family, socialization and interac-
tion process, Illinois: Free Press).
7 Pahl J (1980), ‘Patterns of
money management within mar-
riage’ in Journal of Social Policy,
vol 9, pp.313-335.
8 Green D and Cromwell L (1984),
Mutual Aid or Welfare State, Allen
& Unwin.
9 For a history, see Strickland P
and Vidler G (1998), Widows’
Benefits, Research Paper 98/100,
House of Commons Library.
PX Tax and Family:Layout 2 17/6/09 15:10 Page 10
of his labour to an employer, without reference to his domestic circumstances,there was no guarantee that a man with a large family would earn enough to paythe rent and put food on the table, particularly if he was low-skilled. There wasalso the possibility that a man earning an adequate wage may nevertheless fail tohand over a large enough proportion of his earnings for his wife to be able tolook after herself and their children adequately.
Public policy responded to this problem of how to support the living standardsof dependents of employed men in two ways.
First, governments tried to keep low-paid men with family commitments outof the income tax system. From before the First World War, there was a policy togive family men additional tax allowances which were not available to otherworkers who did not have family responsibilities, in order to reduce their taxliabilities.
The principle that underpinned these concessions was the more people whodepended on a single wage, the less tax should be deducted from it. A single manwas given a tax-free allowance which effectively recognised that he should not betaxed until he had earned a subsistence income from which he could maintainhimself. A married man with a wife and children to support was therefore givena higher tax-free allowance so that he could not only afford to feed, clothe andhouse himself, but he could also secure the subsistence of the other familymembers who depended upon his wage.
This was done by giving family men a ‘Married Man’s’ allowance (to help withtheir wives’ needs), and child tax allowances (to help cover the needs of theirdependent children) in addition to their own personal tax-free allowance. Withmore mouths to feed, they were allowed to earn more money before incurringincome tax liabilities.
The second way the government responded to the problem of inadequatefamily incomes was to give families with dependent children a flat-rate top-up.This was done by a ‘Family Allowance’ (later changed to the ‘Child Benefit’),which was introduced by Beveridge in 1943.
Family Allowance boosted the income of every family in the country, irrespec-tive of their circumstances. It was originally limited to families with two or morechildren, for Beveridge believed that a working man’s full-time wage wasadequate to provide for a spouse and one child, but it was subsequently extendedto cover the first child as well. Today, it actually pays more for the first than forsubsequent children.
The Family Allowance introduced by Beveridge had two key features. First, itwas a universal, flat-rate payment which did not vary according to people’s finan-cial circumstances. From the richest family to the poorest, everyone qualified forthe same amount.
This may seem inefficient from an economic point of view, for many familieswere clearly earning enough without needing additional government assistance.But by insisting on flat-rate universalism, rather than targeting the most needy,Beveridge was attempting to minimise the negative impact that receipt of govern-ment payments can have on people’s willingness to work.10
Beveridge understood that when the government tops-up people’s incomes,there will always be some workers who respond by reducing the amount of work
policyexchange.org.uk | 11
What is the Family For?
10 Nolan P (2006), ‘Tax relief for
breadwinners or caregivers?’ in
Journal of Comparative Policy
Analysis, vol.8, No.2, pp.167-183.
Child benefit actually pays more for the firstthan for subsequent children.
PX Tax and Family:Layout 2 17/6/09 15:10 Page 11
12 | policyexchange.org.uk
Reforming the UK Family Tax and Benefits System
11 This is true in most developed
countries, not just in Britain.
Shirley Gabel and Sheila Kamer-
man review family policies in 21
countries and conclude:
“Whereas the primary goal of
family benefits at the close of the
1970s was to supplement the in-
come of families with children,
the current goals of family poli-
cies have expanded to include
balancing work and family re-
sponsibilities; providing incentives
to work; enhancing and strength-
ening the development of young
children; targeting help to fami-
lies considered most vulnera-
ble…” (‘Investing in children’ in
Social Service Review, June 2006,
p.260-1). This expansion of aims
directly reflects changes in family
form and structure.
they do (this is what economists call a ‘substitution effect’) because they canachieve the same living standard with less effort than before.
In addition to this substitution effect, government payments that are targetedspecifically on the poor can also have a serious, negative impact on work incen-tives for those who want to improve their incomes. This is because ‘means tested’benefits effectively ‘reward’ those with least money and penalise people as theirearnings rise. For as long as you remain poor, you are eligible for a benefit, butonce your earnings start to rise, government help tapers off, which means you canfind yourself working longer hours or doing more difficult work for very littleextra net income.
It was this disincentive effect created by means testing that Beveridge wantedto avoid by insisting that Family Allowances should be universal and flat-rate . Bygiving everyone the same amount per child, there would be no penalty on thosewho worked harder to increase their incomes, and no penalty on people movingfrom unemployment or sickness back into paid work. Work disincentives wouldnot be avoided completely (there would still be some substitution effect), butthey would be minimised.
The second, key feature of Beveridge’s Family Allowance was that it was a cashpayment made on a regular basis to the person who was caring for the children(almost always the mother).This effectively gave wives their own source of funds,independent of any money handed over by their husbands.
Unlike tax allowances, which benefited the husband and which may or maynot be handed on to the wife and children, the Family Allowance went directly tothe ‘principal carer’, which (it was assumed) increased the likelihood that themoney would be spent to the benefit of the children.
Of course, the social reforms introduced in the 1940s went much further thanjust introducing Family Allowances. A new system of National Insurance was setup to strengthen people’s protection against poverty in the event of sickness,widowhood, old age or unemployment; and the National Health Service offeredhealth and dental care on the basis of ‘need’ rather than capacity to pay. All of thisimpacted on the nation’s families.
But in terms of direct financial assistance, the crucial elements of family policyafter World War II were tax allowances for workers with families (to reduce thetax levied on incomes which had to be shared among several family members),and a universal family payment (to top-up the incomes of all families, irrespec-tive of their financial circumstances).
This system of financial support reflected a society where children were almostall being raised in two-parent families, where most families had one adult in paidemployment and one at home raising the children, and where divorces were rareand unemployment was low.
By the time the ‘Great Disruption’ had run its course, however, none of thisheld true any longer. Over the last 40 years, family life has been turned upsidedown, and successive governments have been struggling to develop new policieswhich more adequately reflect the very different circumstances in which manypeople in Britain now live.11 This has resulted (among other things) in an explo-sion of government spending which has spectacularly gathered pace in the lastfew years.
PX Tax and Family:Layout 2 17/6/09 15:10 Page 12
The rising cost of family supportThe level of government financial support for families hardly changed in Britainbetween 1975 and 1990. Real spending rose from £10 billion in 1975 to £12 bil-lion in 1984, and then fell back again. But after 1990, spending began to accel-erate rapidly, and it has risen markedly since 1997, when New Labour came topower.
It has been estimated that government spending on ‘child-contingent support’for families (i.e. financial assistance paid only to people with children) rose bymore than 50% in real terms between1997 and 2003, reaching £22 billionby 2003.12
In 2003, the UK government spentan average of £32.57 per week in cashpayments and tax allowances for everychild in the country. This representedabout 15% of the average UK house-hold’s disposable income. Although thiswas comparable with the level of support offered in many other European coun-tries,13 it represented a huge jump on previous levels of support in the UK. Backin 1975, each child got only £13.41 (expressed in 2003 prices).
Indexed to prices, government-financed family support rose by 143% from1975 to 2003 (indexed to earnings, it rose by 62%). Most families have bene-fited, but the lion’s share of this increase has gone to sole parent families. Theaverage couple with one child saw its child-contingent receipts from governmentrise from 3.4% to 5.7% of their combined total disposable earnings between1975 and 2003, but the average sole parent with one child saw her/his child-contingent government payments increase from 14.7% of disposable income in1975 to 32.7% in 2003.14
All this increased spending means financial support for families with childrennow absorbs a greater slice of the government’s budget than ever before (up from3.4% to 4.7% of total government spending since 1975). Expressed as a propor-tion of GDP, government family spending is up from 1.5% to 2.0%.15
On the face of it, this huge rise in government spending on children seemsodd, for economic growth means that average real incomes have been rising overtime. We might therefore have expected people’s need for government aid to havefallen rather than increased. Moreover, declining fertility rates mean that thenumber of children in the country has been shrinking. Fewer children shouldhave led to less government spending, not more. The fact that spending hascontinued to go up means that smaller numbers of children are now attractingmuch higher per capita levels of expenditure than they did in the past.
Part of the explanation for this apparent paradox lies in a change in politicalpriorities. Since 1999, Labour governments have set as a major policy target thereduction of child poverty rates. They have pursued this aim by increasing theflow of cash transfers to lower-income families (particularly sole parents). Onereason why a smaller number of children is having much more money spent onthem is that policy has shifted towards a more aggressive income redistributionagenda.
policyexchange.org.uk | 13
What is the Family For?
12 Adam S and Brewer M (2004),
Supporting Families, Bristol: Pol-
icy Press. Brewer M, Ratcliffe A
and Smith S (2008), Does welfare
reform affect fertility?, Institute
for Fiscal Studies, Working paper
08/09.
13 This is about the same level of
spending as in Ireland, France,
Germany and Denmark, but is
rather more than in Sweden, Italy,
Spain and the Netherlands. See
Corak M, Lietz C and Sutherland H
(2005), ‘The impact of tax and
transfer systems on children in
the European Union’, Innocenti
Working Paper, Florence: UNICEF,
p.20.
14 Adam and Brewer (2004),
p.15.
15 Ibid, p.54.
“The fact that spending has continued to go up
means that smaller numbers of children are now
attracting much higher per capita levels of
expenditure than they did in the past”
PX Tax and Family:Layout 2 17/6/09 15:10 Page 13

A bigger part of the explanation, however, lies in the fallout from the ‘GreatDisruption’. Before the 1960s, almost all families with children had their ownsource of earnings (the adult male worker). The government’s task was thereforerelatively manageable: to top up the earnings of the poorest and biggest families,and support the few families where the death of the principal breadwinner threat-ened penury.
Today, by contrast, many families have no earnings of their own – 1.7 millionchildren are growing up in families where nobody has a job.16 Changes in thelabour market over the last 30 years have driven up the number of couples withchildren where neither adult has a job. And changes in family life have led toincreased numbers of single-parent families where it is often difficult for one adultto combine full-time paid employment with child-rearing responsibilities. Wherea husband used to be principal provider, the government now has to step in.
Table 1 shows that almost all families with children receive some financialassistance from the government today, but heavy dependency on government(defined as receiving half or more of total income from the state) is concentratedamong sole parents. Fewer than one-in-ten couple families with children have torely on government to provide them with half or more of their weekly income,but more than half of sole parents do so.
14 | policyexchange.org.uk
Reforming the UK Family Tax and Benefits System
16 Department for Work and Pen-
sions, In work, Better off, Cm
7130, 2007.
Table 1: Dependency on government financial support bydifferent types of households, 2006
Household type No state support 50% or more of income fromgovernment
% %
One adult working age
Male 63 26
Female 69 22
Two adults working age 77 6
Sole parents
One child 2 54
2 children 1 63
3+ children – 76
Couple families
One child 5 10
2 children 2 8
3 children 1 19
All households 30 29
Source: Department for Work and Pensions, Family Resources Survey 2006-07 Office of National Statistics 2007, Table 3.9. ‘State
support’ includes child benefit and state pension as well as means-tested welfare benefits and tax credits.
PX Tax and Family:Layout 2 17/6/09 15:10 Page 14

The reason for this high level of state dependency among sole parents is thatthey tend either not to work at all, or only to work part-time. In 2008, only 5%of couples with dependent children did no paid work, as compared with 40% ofsole parents.17
The result can be seen in Table 2, which identifies the proportion of householdincome that comes from their own activities (paid employment, self-employmentor investments), as against the proportion that comes from government payments(including tax credits). Couples with children on average generate 90% of theirhousehold income from their own earnings, and in this they differ hardly at allfrom childless couples. Indeed, couples with children are more self-reliant onaverage than single people without children. Sole parents, by contrast, rely ongovernment for 50% of their income and generate only 42% from their ownearnings.
Government assistance for families has therefore increased in the last 30 yearsmainly because of the huge increase in the number of sole parent families, most ofwhich cannot support themselves unaided. It has been estimated that 60% of theincreased per capita government spending on supporting children between 1978and 1999 came about because of the changes in family patterns that occurredduring that period. Only 40% is explained by more generous policies.18
Why should we support the cost of other people’schildren?With so much public money now being directed at people with children, it is im-portant to ask why the government should be involved at all in the family supportbusiness.
Most people who have children choose to become parents. Presumably theyanticipate that the pleasures of having children will outweigh the costs they incur.This means the money they spend on parenthood raises their overall levels of
policyexchange.org.uk | 15
What is the Family For?
17 Office for National Statistics,
Work and worklessness among
households, ONS, August 2008,
Table 1.
18 Adam and Brewer (2004),
pp.13-14.
Table 2: Proportion of weekly income sourced from ownearnings and from government payments, 2006
Household type Household earnings Government payments
% %
One adult working age
Male 86 10
Female 83 10
Two adults working age 91 7
Sole parents 42 50
Couple with children 90 8
All households 76 21
Source: Department for Work and Pensions, Family Resources Survey 2006-07 Office of National Statistics 2007, Table 3.12
PX Tax and Family:Layout 2 17/6/09 15:10 Page 15

happiness and wellbeing (what economists call their ‘welfare’). This being thecase, why should the rest of us be required to compensate them for the expensesthey incur in pursuing this greater happiness?
A recent survey undertaken by Policy Exchange and Ipsos-MORI asked parentsand non-parents whether people who choose to have children should get helpfrom other taxpayers with the cost of raising them.19 Given that British govern-ments have given parents tax concessions for more than one hundred years, andthat family allowances (Child Benefit) have been given to parents for more thansixty years, we anticipated strong public support for family assistance. In fact,however, opinion is surprisingly polarised (Table 3).
Public opinion appears to be almost equally divided. If anything, slightly morepeople believe taxpayers should not be expected to contribute than believe thatthey should (47% against 43%). Not surprisingly, this pattern reverses amongparents (parents are more likely to favour taxpayer support than non-parents).But even here, opinion is still quite evenly split, and although the relationshipbetween parental status and belief in taxpayer support for families is statisticallysignificant, it is certainly not strong.
With levels of ambivalence like this in the population as a whole, and evenamong parents, it should not just be assumed that family assistance is a ‘good thing’which governments should continue to offer indefinitely. Just because people withchildren have received support in the past does not mean they should continue toreceive support in the future. People are more affluent than they were one hundredor even 50 years ago, and we have seen that family life has also changed dramati-cally. Perhaps the case for supporting parents was strong in the past, but hasweakened over time. The arguments should certainly be examined afresh.
Whenever the question is explicitly raised of why parents with dependent chil-dren should receive financial support from the rest of society, three kinds ofanswers are commonly offered. Only one is ultimately convincing:
16 | policyexchange.org.uk
Reforming the UK Family Tax and Benefits System
19 Fieldwork conducted 9-15 Jan-
uary 2009. Stratified sample
comprising 573 parents and 1,454
others (total sample size = 2,027).
Data reweighted to be represen-
tative of population as a whole
(weighted N=2035).
Table 3: Views of parents and non-parents regarding taxpayersupport for families with children
Which of these statements comes Parent Non-parent Total
closest to your view? % % %
People who choose to have children 43 49 47should not expect other taxpayers tohelp with the cost of raising them
All taxpayers should contribute something 47 41 43to help parents with the cost of raisingtheir children
Total 29 71 100
N (weighted) = 2035. P<0.05
Source: 2009 Policy Exchange/IPSOS-MORI Family Priorities Survey
TEXT HDS:Layout 2 22/6/09 14:12 Page 16
i. Alleviate child poverty and sufferingOne possible reason for supporting families is to improve the quality of children’slives. Unlike adults, who can be held responsible for their own actions, children areat the mercy of their parents when it comes to their standard of living. Wider so-ciety therefore has a responsibility to safeguard their welfare.
A child being raised in a poor or deprived family bears no responsibility for hisor her plight; nor is it in his or her power to change their circumstances, for theyare very much dependent on the actions of their parent(s) or guardian(s). Thewider community might therefore be thought to have a duty to intervene toensure that children enjoy a minimum acceptable level of welfare.
There is also a powerful, longer-term argument for safeguarding children’swelfare, for a blighted childhood often results in a blighted adulthood. We knowthat the early years of a child’s life crucially influence both cognitive and behav-ioural development. If all individuals are to have the opportunity to fulfil theirpotential, it is important to ensure that young children are not deprived of thematerial and emotional supports they need in their formative years.
It can also be argued that it is in all our interests that other people’s childrenget a decent start in life, for those who grow up in more deprived homes are morelikely to get involved in crime and anti-social behaviour later on, as well as beingmore vulnerable to unemployment, ill-health and teenage pregnancy. All suchbehaviours impose a financial burden on taxpayers, so there is a simple economicefficiency argument in favour of preventive intervention early in children’s lives.20
For all of these reasons, it makes sense for governments to act to try to reducechildhood deprivation.
However, this makes the case for anti-poverty programmes, not for pro-familypolicies. If the concern is simply to keep children out of poverty, this can in prin-ciple be achieved by adopting policies that target poverty rather than policies thattarget families. As Stuart Adam and Mike Brewer observe: “This redistributioncould be achieved by a tax and benefit system that did not recognise children atall: if households with children tend to be poor, a progressive or pro-poor trans-fer system will benefit them more in any case.”21
Current family assistance programmes direct money to almost all families withchildren. Most of the children in these families are not poor. If we want a compellingargument in favour of general family assistance, therefore, we need to look elsewhere.
ii. Reduce free riding and compensate parents for the value of the publicgoods they createA second argument in favour of government transfers to people with children is thatchildren are not only ‘private goods’ who bring pleasure to their parents. They arealso what economists call ‘merit goods’ who bring benefits to everyone else.22 Seen inthis way, it is not fair to expect parents to meet the full cost of raising their children,for everyone else is gaining from the ‘positive externalities.’ Unless we all make a fi-nancial contribution to the costs, non-parents will end up ‘free-riding’ on parents.
This is less an ethical argument than an economic one. It is an established princi-ple in economics that, where possible, the value of ‘externalities’ should be built intothe prices people pay and receive for goods and services. If your activities are creat-ing negative externalities for other people then you should compensate them; if youare creating positive externalities, they should pay you. If the value of externalities is
policyexchange.org.uk | 17
What is the Family For?
20 Banks J and Brewer M (2002),
Understanding the relative gen-
erosity of government financial
support to families with children,
Institute for Fiscal Studies, Work-
ing Paper 02/02 p.10.
21 Adam and Brewer (2004), p.4.
22 Greener K and Cracknell R
(1998), ‘Child Benefit’, House of
Commons, Research Paper 98/79,
p.17.
PX Tax and Family:Layout 2 17/6/09 15:10 Page 17

not priced, producer behaviour will be distorted. In the case of positive externalities,producers might stop supplying merit goods altogether if they have to bear all thecosts while strangers take a free ride enjoying the benefits.
Parents who produce children create benefits for everyone else. Most funda-mentally, other people’s children give us all a future.The 2006 film Children of Men
explored what our world would be likeif people suddenly became infertile andstopped having children.The result wasa collapsing society of misery, hopeless-ness and terror as people faced thereality of their impending extinction asa society and a species.
More directly and less dramatically, wealso benefit from others choosing parenthood because children are the next genera-tion of workers, consumers and taxpayers. We all need younger people growing upbehind us to create the new wealth that will finance the health care and pensions thatwe expect to receive when we grow older and stop working. This is precisely whygovernments throughout the western world are so concerned about falling fertilityrates, for as the population ages, a ‘top-heavy’ demographic structure will put extraburdens on a smaller working generation as they try to support an increasingly largecohort of retirees.
All of this is true, but the key economic question is whether people reallywould stop having children if the subsidies were withdrawn. This seems unlikely,in which case the economic argument for compensating them for the value of thepublic goods they are providing looks much weaker.
We shall see later that pro-natalist policies which offer financial inducementsto people to have children can have some impact on birth rates, particularly at thelower end of the income distribution. However, it is almost certainly the case thatmost parents in Britain would still have children even if there were no govern-ment assistance available.23
If this is the case, then spending more than £20 billion a year on income trans-fers to families is economically irrational, for most people would still havechildren without this help. Subsidising parents to encourage them to have chil-dren is like subsidising a company to continue production when it would carryon even without government hand-outs. Much of this assistance seems to beunnecessary (what economists call a ‘deadweight cost’).
iii. Restore horizontal equityThe final argument for helping parents with the costs incurred in raising their chil-dren is rooted in the proposition that every individual citizen has a right to a sub-sistence income. Where possible, individuals are expected to earn this money forthemselves, in which case the state should not tax them until they have achievedthis minimum income level.Where they cannot earn an income for themselves, thecommunity provides it, through the agency of the state.
This principle of a right to a basic, subsistence income logically applies to allindividuals, be they children or adults.This is because a child needs a certain mini-mum income if it is to feed and clothe itself, just as an adult does. The onlydifference is that a child relies on its parents to provide this income until it is in a
18 | policyexchange.org.uk
Reforming the UK Family Tax and Benefits System
23 Adam S, Brewer M and Reed H
(2002), The benefits of parenting,
Institute for Fiscal Studies, Com-
mentary No.91.
“The key economic question is whether people
really would stop having children if the subsidies
were withdrawn”
PX Tax and Family:Layout 2 17/6/09 15:10 Page 18
position to generate an income for itself. This means that parents are required tosupply a subsistence income, not only for themselves, but also for their children.
Once people become parents, we require them (by law, as well as by conven-tion) to spend some of their money fulfilling various functions on behalf of theirchildren. In the end, they have no choice in this, because the society invests chil-dren with certain enforceable rights over their parents (e.g. the right to be fed,clothed, housed and educated). A parent who fails to deliver on these services canbe charged with neglect.
But if we insist that parents should devote a certain slice of their income totheir children, it follows that we should also recognise that part of their incomeis not, in this sense, theirs. It is earned by them on behalf of their child. Thismeans that if two adults earn the same income, but one has children while theother does not, the former is earning less for him or herself than the latter, inwhich case he or she should be taxed less, or should be eligible for higher welfarepayments. Peter MacDonald makes the point clearly:
“Taking two couples on the same level of income, the couple with children has considerablyhigher expenses than the couple without children, expenses that, by law, cannot be set aside. Theprinciple of horizontal equity argues that, in recognition of the social value of children, the tax-transfer system should redress this discrepancy.”26
policyexchange.org.uk | 19
What is the Family For?
24 Discussed in D’Addio A and D’Er-
cloe M (2005), ‘Trends and determi-
nants of fertility rates in OECD
countries’ in Social Employment
and Migration Working Papers,
No.27, OECD, p.49.
25 National Statistics, Household
Income,
http://www.statistics.gov.uk/cci/n
ugget.asp?id=334
26 MacDonald P (2003), ‘Reform-
ing family support policy in Aus-
tralia’ in People and Place vol.11,
no.2, p.3.
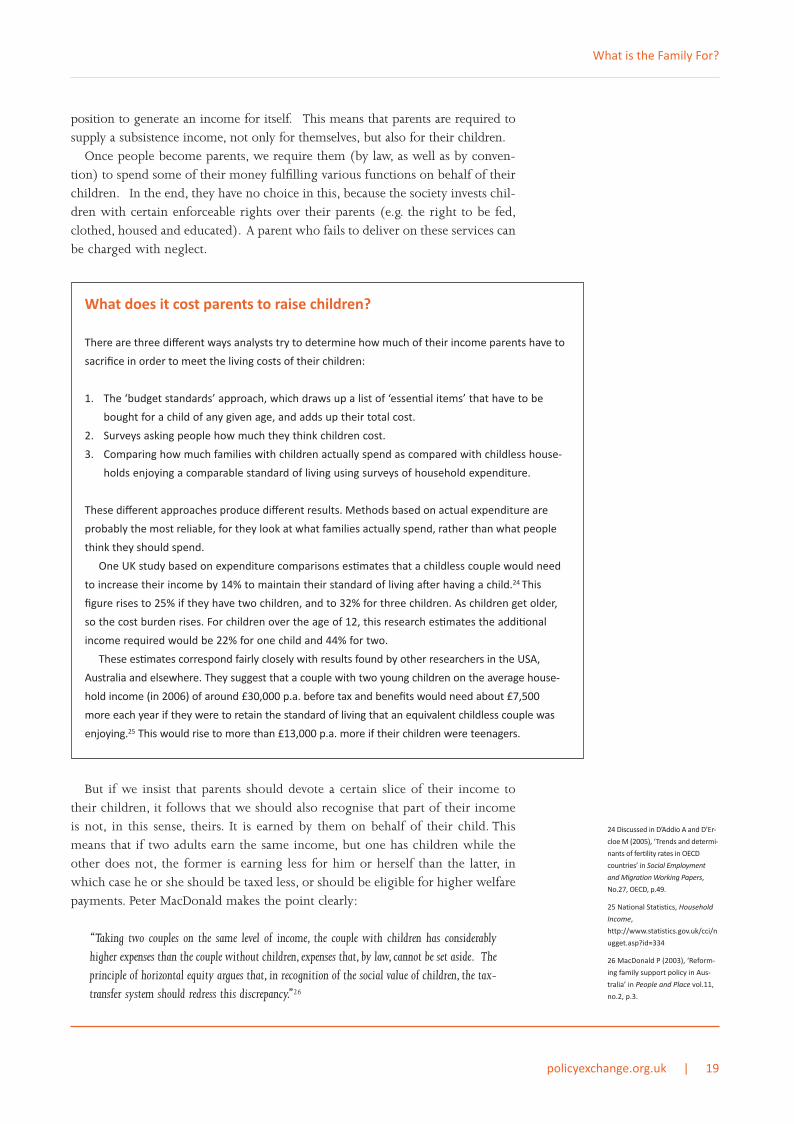
What does it cost parents to raise children?
There are three different ways analysts try to determine how much of their income parents have to
sacrifice in order to meet the living costs of their children:
1. The ‘budget standards’ approach, which draws up a list of ‘essen/al items’ that have to be
bought for a child of any given age, and adds up their total cost.
2. Surveys asking people how much they think children cost.
3. Comparing how much families with children actually spend as compared with childless house-
holds enjoying a comparable standard of living using surveys of household expenditure.
These different approaches produce different results. Methods based on actual expenditure are
probably the most reliable, for they look at what families actually spend, rather than what people
think they should spend.
One UK study based on expenditure comparisons es/mates that a childless couple would need
to increase their income by 14% to maintain their standard of living a er having a child.24 This
figure rises to 25% if they have two children, and to 32% for three children. As children get older,
so the cost burden rises. For children over the age of 12, this research es/mates the addi/onal
income required would be 22% for one child and 44% for two.
These es/mates correspond fairly closely with results found by other researchers in the USA,
Australia and elsewhere. They suggest that a couple with two young children on the average house-
hold income (in 2006) of around £30,000 p.a. before tax and benefits would need about £7,500
more each year if they were to retain the standard of living that an equivalent childless couple was
enjoying.25 This would rise to more than £13,000 p.a. more if their children were teenagers.
TEXT HDS:Layout 2 22/6/09 14:12 Page 19

The crucial point about this principle is that it applies to all parents, irrespectiveof their income or economic circumstances.27 We do not help with the cost ofchildren because parents need financial assistance (although some might), norbecause we benefit indirectly from their fecundity (although we do), but be-cause we require parents to spend part of their income looking after other, jun-ior, citizens. One person’s income, therefore, has to be spread among severalother people, and for this, the income earner should be compensated.
We saw earlier that the tax system in Britain used to recognise this core prin-ciple, for workers who had to share their wages with dependent familymembers paid less tax than equivalent workers who had only themselves tosupport.
Today, however, every worker earning up to £100,000 per year is entitled tothe same annual tax-free earnings allowance (worth £6,035 in 2008/09), irre-spective of whether or not they have family dependents. This tax-free allowanceeffectively represents a minimum subsistence income level – by allowing eachworker to retain £500 per month before paying tax, the government is recog-nising that people need this amount just to keep body and soul together.
But workers with dependent children have to use their income to ensure thesubsistence of their children as well as themselves. Once they have paid for theneeds of their children, their net income remaining to cover their own subsis-tence is obviously a lot lower than that enjoyed by equivalent workers who haveno family responsibilities.28 Yet in Britain today, they pay exactly the sameamount of tax (although if they qualify for welfare, the government compen-sates them with additional cash benefits).
One way the cost of raising children could be recognised is by giving childrentheir own tax-free allowance, which their parents could then claim on theirbehalf. This would mean that working parents would pay less tax than equivalentworkers who do not have to share their incomes in this way. This additional taxallowance would not represent an anti-poverty subsidy, nor a pro-natalist incen-tive, but an equitable adjustment to reflect the fact that several people depend onthat one income:
“Looked at in this way, tax reliefs for spouses or children are not to be seen as subsidies or asincentives but as achieving a greater measure of equity as between one type of taxpayer andanother.”29
As we have seen, the UK tax system used to recognise this horizontal equity prin-ciple. This is no longer the case, however, and later in this report we shall considerwhether our current ‘individually-based’ income tax system needs revising to makeit consistent with the horizontal equity condition.
20 | policyexchange.org.uk
Reforming the UK Family Tax and Benefits System
27 Indeed, it could be argued that
higher-earning families should re-
ceive more than lower earners,
since they will pay more to raise
each child than a poorer family
will, so they will fall proportion-
ately further behind an equiva-
lent, childless household. See
Adam, Brewer and Reed (2002),
p.14.
28 Immervoll H, Kleven HJ,
Kreiner C and Verdelin N (2008),
An evaluation of the tax-transfer
treatment of married couples in
European countries, Unpublished
paper, London School of Econom-
ics, p.1.
29 Draper D and Beighton L
(2008), Taxation of married fami-
lies, London: Care, p.29.
Proposition 1Although public opinion is evenly divided on whether taxpayers should assist parents with the costs of
raising their children, the principle of horizontal equity requires that all parents should be compensated
for having to share their income with addi9onal dependents. This means that tax should be levied on
incomes according to the number of family members who depend upon them for their sustenance.
PX Tax and Family:Layout 2 17/6/09 15:10 Page 20

2What Should Family Policy Do?
Should governments try to influence the way families behave?If there is a strong case for helping parents meet the costs of raising their children,the next question to ask is whether or not this assistance should be given uncon-ditionally. Is it appropriate for governments to use the financial leverage repre-sented by expenditure of more than £20 billion every year to promote or detercertain kinds of parenting, or even certain patterns of relationships?
In a liberal society, there is a power-ful argument in favour of governmentsremaining neutral when it comes tofamily policies. Governments thatprovide cash assistance to familiesshould scrupulously avoid gettinginvolved in the ‘private realm’ of familylife, for different people have differentideas about how to live their lives, andnone of us want politicians telling ushow to go about it.
There are, however, two equally powerful arguments pointing the other way.Firstly, family policy should have regard for the interests of children, who
cannot make their own judgements about the best way to live, and who are gener-ally at the mercy of the decisions made by their parents. It is one thing forgovernments to allow adults to live their lives at they see fit, but if this impactsnegatively on the welfare of their children, there may be an overwhelming casefor intervening to change what they are doing.
Secondly, achieving policy neutrality is easier said than done, for whenevergovernments take money away from one set of people and direct it to another,they inevitably send out signals about ‘appropriate’ and ‘inappropriate’ behav-iour. Family policies will always end up influencing people’s behaviour in oneway or another, even if they do not intend to. It is simply not possible to spendmore than £20 billion a year on family transfers and not influence people’sbehaviour.
Failing to impose conditions on receipt of money is no more ‘neutral’ thanimposing conditions. If a government gives money indiscriminately to ‘irrespon-sible’ parents as well as to ‘responsible’ ones, then it is making a moral statementjust as much as if it laid down strict rules of eligibility which excluded certainkinds of parents from receiving payments. Tolerating bad parenting is no more‘neutral’ than penalising it. And just as conditionality is likely to promote one
policyexchange.org.uk | 21
“ It is one thing for governments to allow adults
to live their lives at they see fit, but if this impacts
negatively on the welfare of their children, there
may be an overwhelming case for intervening to
change what they are doing”
PX Tax and Family:Layout 2 17/6/09 15:10 Page 21
kind of behaviour, so unconditionality is likely to promote another. PatriciaMorgan makes the point clearly:
“By rewarding some behaviours and penalising others, tax and welfare systems affect the pref-erence and behaviour of individuals not just through hard cash calculations but by(unavoidably) embodying and promoting certain values and assumptions. In other words, theysend out messages where something that pays a penalty is perceived as unworthy and that whichreceives a bonus is to be approved and emulated.”30
We have already encountered one example of how government payments can un-intentionally promote undesirable behaviour in our discussion of the ‘moral haz-ard’ problem encountered by attempts to boost the incomes of poorer people.Offered an income supplement, some people will simply reduce the amount ofpaid work they do. This leaves them no better off financially, reduces levels of eco-nomic activity in the economy as a whole, and increases the burden on taxpayers.Over time, it might also encourage others to follow this example.
This is a seemingly intractable problem encountered by policies aimed atboosting the incomes of the poor.31 The OECD calculates that for every 1%increase in poverty reduction achieved by welfare states in the advanced countries,the number of jobless families increases by 0.63%, yet we know that joblessnessis itself a major cause of poverty. In the UK, this problem is even worse: here, a1 point reduction in poverty increases the proportion of jobless families by 0.92of a point. The OECD concludes: “More generous support to poor families isassociated with higher levels of family joblessness.”32
Benefits targeted at particular groups such as sole parents encounter similarproblems. More spending increases the attractiveness of these benefits and swellsthe number of people applying for them. It also legitimises and normalises thebehaviour to which they attach, so over time, the number of claimants multipliesand policies intended to reduce neediness end up increasing it. Internationalcomparisons suggest, for example, that for every €1000 above the European aver-age a country spends supporting sole parents, the probability of a woman in thatcountry becoming a single mother increases by 2%.33
This ‘signalling’ process works in reverse, as well. Introducing targeted benefitsencourages the behaviour in question; removing them discourages it. Scrappingtax allowances for married couples, for example, signifies that marriage is nolonger officially favoured, and the result is likely to depress the marriage rate ascohabitation or sole parenting become more ‘normal’ and accepted.
It is therefore difficult for governments to devise ‘neutral’ family expenditure poli-cies. This being the case, if any spending policy is likely to influence the way peoplebehave, why not at least try to influence behaviour in a desirable rather than unde-sirable direction? If we know that certain practices are beneficial to the wellbeing ofchildren, for example, why not use family policies to promote and encourage them?
One problem with this is that governments do not necessarily know what thebest practices are. Experts may believe today that a particular kind of parenting isbeneficial and should be promoted, but later research may lead to a change ofmind. The history of British public policy is littered with examples of granddesigns promoted by governments at huge cost but which were later found tohave been ill-advised, or even disastrous.
22 | policyexchange.org.uk
Reforming the UK Family Tax and Benefits System
30 Morgan P (2007), The war be-
tween the state and the family, In-
stitute of Economic Affairs, p.124.
See also Social Justice Policy
Group, Breakthrough Britain,
vol.1: Family Breakdown, Centre
for Social Justice, July 2007, p.85.
31 The trade-off between poverty
relief and work incentives is un-
avoidable outside of a universal
payments system: “No miraculous
solution can be advanced short of
paying benefit to everybody or
nobody” (Taylor M (1998), ‘Mod-
ernisation of Britain’s tax and
benefit system’, Budget paper
no.2). Mike Brewer finds that the
UK Labour Government’s desire
to reduce child poverty has com-
promised financial work incen-
tives: Welfare reform in the UK,
Institute for Fiscal Studies, Work-
ing Paper No.20/07, 2007, p.27.
32 See Whiteford P and Adema W
(2007), What works best in reduc-
ing child poverty: A benefit of
work strategy?, OECD Social em-
ployment and migration Working
Paper No.51, p.37.
33 This estimate controls for
inter-country variations in age,
education, unemployment, wages
and tolerance of sole parenthood.
Morgan (2007), p.109-10.
PX Tax and Family:Layout 2 17/6/09 15:10 Page 22

There is also the problem of unintended and unanticipated consequences. Themore government sets its mind to promoting a particular outcome, the morecertain we can be that it will also generate many other results, at least some ofwhich are likely to be harmful.
What is more, family policy is an area where governments are likely to haveincompatible objectives. As we shall see, some of the outcomes governmentsmight want to pursue through family policies can only be achieved by under-mining other, equally desirable, ones. Politicians talk about ‘balancing’ thedemands of work and family, for example, but this rhetoric often disguises someuncomfortable and unavoidable dilemmas. For example:
� We cannot strengthen women’s participation in the labour market and at thesame time enable mothers to stay at home to nurture their young children. Weknow that women who stay off work for more than four or five months afterhaving a baby begin to jeopardise their future careers,34 but we also know thatchildren in their first year of life develop much better if they are looked afterat home than if they are placed in formal childcare.
� We cannot make the tax system fairer for single-earner couples without reduc-ing the rewards to those partners who want to engage in paid work, forhelping those who live off one income inevitably means reducing the relativerewards that come from having two.
We shall consider these and other similar dilemmas in more detail later in this re-port.
What might family policy try to achieve?If, cautiously, we accept that governments might try to ‘nudge’ people in certain de-sirable directions through their family support policies, then what are the appro-priate outcomes it should be aiming to promote?
Should family policy promote marriage?There is overwhelming social scientific evidence that, other things being equal,children are better off in all sorts of ways if they are raised by their two natural par-ents, rather than by one parent, or in a reconstituted step or ‘blended’ family.35
Should governments therefore use family policy to promote married parenthood,or at least to try to support stable coupled parenting?
Children of sole parents are on average born with lower birth weights thanthose brought up by both of their natural parents. They are also more prone toSudden Infant Death Syndrome, are more likely to be neglected or abused, expe-
policyexchange.org.uk | 23
What Should Family Policy do?
34 Even providing more generous
child payments appears to de-
press women’s labour force par-
ticipation, for the extra cash
reduces their need to earn
money: Dex S and Joshi H (1999),
‘Careers and motherhood: poli-
cies for compatibility’ in Cam-
bridge Journal of Economics
vol.23, pp.641-59.
35 A ‘blended’ family is one
where both adult partners bring
children from a previous relation-
ship into the new household. For
sources reviewing the evidence
on sole parents, step and
‘blended’ families, see footnote 5.
Proposition 2Any a:empt to redistribute income among different kinds of families and households will end up en-
couraging some kinds of lifestyle choices over others. There is no neutral policy. Governments should
ensure that family support expenditures do not encourage or sustain ill-advised pa:erns of family life
among those who receive them.
PX Tax and Family:Layout 2 17/6/09 15:10 Page 23

rience more academic problems at school, have lower average reading and mathsscores, have worse truancy records, are more likely to drink, smoke and takedrugs in adolescence, are more prone to depression and mental illness as theygrow older, report more long-term emotional and behavioural problems, aremore likely to suffer unemployment as adults, have higher rates of poverty andhomelessness as adults, are more likely to break the law and to end up in prison
by the age of 30, and are more likely tobecome parents at a young age and torepeat the cycle they have gone throughby themselves having children withouta resident partner.
In many cases, these outcomes areeven worse for children raised in step or‘blended’ families.
It is sometimes argued that theseproblems simply reflect lack of money. Sole parents tend to have lower incomesthan couple families, and a low income can itself result in adverse social andpsychological outcomes for children. But the evidence indicates that the parentalsituation exerts an additional, independent effect on child wellbeing, over andabove the effect attributable to the income of the parent. Topping up the incomesof sole parents is not going to make the differences in child wellbeing measuresdisappear.
There is also clear evidence that parents are more likely to stay together if theyare married than if they merely co-habit. Nearly one-third of parents who arecohabiting or are ‘closely involved’ separate before their child’s third birthday, and43% split by the time the child turns five. These proportions compare with just6% and 8% respectively of married parents.36
There is an element of self-selection here, of course: more committed couplesare more likely to marry, and more committed couples tend to stay together moresuccessfully. But the pattern is not entirely explained by self-selection – it appearsthat the very fact of marrying itself contributes to the success and longevity of arelationship.37
So children are likely to fare better if their parents stay together, and theirparents are more likely to stay together if they are married. Put the two pieces ofinformation together and we have a seemingly compelling argument for thegovernment to adopt family support policies which favour married parents.
Despite this, New Labour in particular has been loath to draw any value judge-ments about family forms, and it has explicitly distanced itself from supportingwhat it calls the “nuclear family ideal advocated by some”. It seeks to normalisesole parenting by assuring us that sole parent rates today are similar to those inthe fifteenth century, and it problematises married parenting by insisting that “thenuclear family ideal” peaked in the 1950s and is now in retreat.38 It insists thatfamilies should be supported “regardless of form or structure.”39
Britain’s Labour government acknowledges that children raised in sole parentand step and ‘blended’ families tend to do worse on a wide range of outcomesthan children raised by their two natural parents, but it immediately insists that“increased pluralism of family structures need not lead to poorer outcomes”.40
It claims that the problem is mainly financial, and that what damages children
24 | policyexchange.org.uk
Reforming the UK Family Tax and Benefits System
36 Social Justice Policy Group,
Breakthrough Britain, vol.1: Fam-
ily Breakdown, 2007, p.9; Social
Justice Policy Group, Family Law
Interim Report, November 2008,
p.7.
37 Social Justice Policy Group,
Family Law Interim Report, No-
vember 2008, p.12,21.
38 Cabinet Office Strategy Unit
and Department for Children
Schools and Families, Families in
Britain: An evidence paper, De-
cember 2008, p.18.
39 Ibid, p.108.
40 Ibid, p.84.
“Children are likely to fare better if their
parents stay together, and their parents are more
likely to stay together if they are married”
PX Tax and Family:Layout 2 17/6/09 15:10 Page 24

is not the absence of one parent, but the souring of the relationship betweenparents.
The Conservatives, by contrast, have recently suggested that married couplesshould once again be favoured by the tax system.41 They are likely to find strongpublic support for such a policy, for a poll conducted in April and May 2007found 80% of people agreeing that the tax and benefits system should offer extrasupport for people who are married.42 The problem, though, is that those whomiss out as a result of such a policy are likely to be more vociferous than themajority who approve of it.
Should family policy try to promote higher fertility?Although the UK government is concerned about the impact of falling birth rateson the ageing of the population, promoting increased fertility is not an explicitobjective of family policy in this country. This is partly because Britain’s fertilityrate is not plummeting as much as the rates in many other OECD countries (seeTable 4). It may also have something to do with the continuing association in manypeople’s minds between pro-natalist policies and the rhetoric of German Nazismand Italian fascism.
Britain’s total fertility rate (given as 1.8 in Table 4, but now a little higher at1.9) is considerably below replacement level, but it is in countries like Japan andKorea, where women of childbearing age are now having an average of just 1.3children each, that the fertility issue is dominating the family policy agenda. InKorea, a ‘Master Plan’ has been introduced which aims to raise fertility by increas-ing support for childcare, expanding maternity leave and introducing pensionscheme credits for workers who have children.43 Similarly in Japan, the ‘AngelPlan’ has tried to raise fertility by improving access to child care and makingworkplaces more family-friendly.44
Interestingly, some of the policies introduced in these countries are not dissim-ilar from the family policies pursued in recent years in the UK. The professedrationale is, however, very different. Here, the explicit aim of policies likesubsidised childcare and family tax credits is not to encourage women to havechildren, but is to tackle high levels of child poverty and to raise the employmentrate of sole parents. On both of these measures, Britain compares poorly withmost other countries.45
policyexchange.org.uk | 25
What Should Family Policy Do?
41 The proposal is for a married
couple’s allowance that would
raise couples’ incomes by £32 per
week. See Brewer M, Francesconi
M, Gregg P and Grogger J (2009),
‘In-work benefit reform in a cross-
national perspective’ in The Eco-
nomic Journal, vol.119, p.F2.
42 Social Justice Policy Group,
Breakthrough Britain, vol.1: Fam-
ily Breakdown, 2007, p.6.
43 OECD, Facing the future:
Korea’s family, pension and health
policy challenges, 2007.
44 National Institute of Popula-
tion and Social Security Research,
Child related policies in Japan,
2004. Japan also pays a modest
Child Allowance to families, and
offers tax allowances for depend-
ents.
45 OECD. Babies and Bosses,
2007, p.13.
Table 4: Fertility rates, women’s employment and childpoverty, comparing UK with other OECD countries
Total fertility rate Employment/population ratio Child poverty
All women Sole parents %
UK 1.80 66.8 56.2 16.2
OECD 1.63 56.8 70.6 12.0
Source: OECD, Babies and Bosses (2007), Table 1.1.
PX Tax and Family:Layout 2 17/6/09 15:10 Page 25

Even though the British government has not made increased fertility one of itspriorities, there is some evidence that the increasing generosity of familypayments since 1999 has contributed to a small increase in the birth rate. Thiseffect has been concentrated on poorly-educated women, for they were the mainbeneficiaries of the new tax credits which are targeted at poorer, and thereforegenerally less well-educated, families. Poorly-educated women received an aver-age 46% increase in family benefits, and they responded by producing 45,000more children than they otherwise would have done.46 Better-educated women,by contrast, have received much less of the government’s cash, and they areanyway unlikely to have more children simply because the government startsproviding more generous benefits.47
Most research around the world claims to find little effect of governmentfamily expenditure on overall fertility levels, although the evidence is mixed.48
Some North American studies have found that tax breaks can have some impact,but the OECD finds little association between the amount of horizontal redistrib-ution taking place through a country’s tax and benefit system and its total fertilityrate.49 Commentators have often linked France’s increased fertility rate since 1995to its increasingly generous child cash benefits, but some analysts suggest thechanges in government family payments there played almost no part in raising thebirth rate.50
It is much the same picture with other kinds of family help, such as subsidisedchildcare or enhanced parental leave. Although help with childcare costs mightmake parenting more attractive to career women, there is no evidence of a strongrelationship between the cost of childcare in a country and its fertility rate.51
Indeed, the UK has one of the most expensive childcare systems in Europe (as apercentage of household income), but as we have seen, our fertility rate is abovethe European average.
The OECD has attempted to model the combined effect of family tax and bene-fits, parental leave and childcare policies on international fertility rates. It predictsthat the UK could increase its fertility rate to replacement level (2.1 per woman)if it increased its tax/benefit subsidies to families and reduced childcare costs. Butthe authors of the OECD report warn that their findings should be treated “withcaution”, and even if their modelling is reliable, the cost of such a policy wouldbe huge if it were to reach its target. On the OECD’s estimates, it would take a25% increase in the value of tax/benefit transfers to families just to raise the fertil-ity rate in the UK by 0.05 children per woman.52
The conclusion from all of this research is that the impact of family policies onfertility rates is generally fairly weak, and research evidence linking the two isoften inconclusive or even contradictory.53 In the case of parental leave, the asso-ciation actually runs the ‘wrong’ way (i.e. fertility falls as parental leave becomesmore generous).54 However, economic incentives do seem to have some impacton fertility levels among lower-income groups.
Should family policy promote female labour market participation?The entry of more women into the labour force has been one of the main socialchanges to have occurred in Britain in the last 50 years. Full-time female employ-ment rates have actually remained fairly stable ever since the mid-nineteenth cen-tury (the percentage of women of working age employed full-time fell from 42%
26 | policyexchange.org.uk
Reforming the UK Family Tax and Benefits System
46 Brewer M, Ratcliffe A and Smith
S (2008), ‘Does welfare reform af-
fect fertility? Institute for Fiscal
Studies Working Paper 08/09.
47 Kirby J (2005), The price of par-
enthood, Centre for Policy Studies.
48 Similar policies also often have
different effects in different coun-
tries. In the UK and the Nether-
lands, for example, families have
adopted a ‘one and a half bread-
winner’ model which means their
fertility decisions are unlikely to be
influenced by policy changes (like
subsidised long-hours child care, or
more generous maternity leave). In
other countries (like France, Den-
mark or Belgium), by contrast, such
policies might have a bigger effect.
Fukuda N (2003), Three worlds of
pronatalism?, Tokyo: National Insti-
tute of Population and Social Secu-
rity Research, Working Paper Series
(E), no.18.
49 Review by Sleebos J (2003),
‘Low fertility rates in OECD coun-
tries’ in OECD Labour Market and
Social Policy Occasional papers,
No.15, p.44. However, Anna d’Ad-
dio and Marco d’Ercole (‘Trends
and determinants of fertility rates
in OECD countries’ Social, Employ-
ment and Migration Working
Paper 2005, OECD) find little effect,
and the National Institute of Popu-
lation and Social Security Research
report, Child related policies in
Japan, finds no correlation be-
tween levels of government spend-
ing on families and national fertility
rates, comparing 13 different coun-
tries.
50 The Allocation Parentale d’Édu-
cation, worth €500 per month for
three years to parents of newborn
children, was extended from three-
to two-child families in 1994, but
the belief that this helped raise fer-
tility “should be taken with a grain
of salt” (Laroque G and Salanie B
(2004), ‘Fertility and financial in-
centives in France’ in CESifo Eco-
nomic Studies vol.50, p.448).
51 D’Addio A and D’Ercole M
(2005). Sleebos (2003) reports a
“positive” but “small” effect (p.44).
52 D’Addio A and D’Ercole M
(2005), p.65.
53 Even Sleebos, who offers the
‘subjective’ judgement that family
policies do have some positive ef-
fect on fertility, admits that: “Find-
ings are often inconclusive and
contradictory” and that “few gen-
eralisations can be drawn” (p.48).
54 D’Addio A and D’Ercole M
(2005).
PX Tax and Family:Layout 2 17/6/09 15:10 Page 26

in 1851 to 32% in 1901, hit 30% in 1951, and then rose to 36% in 1994).55 Part-time female employment has, however, expanded significantly since the 1950s,rising from 11% in 1951 to 44% in 1995, and this has helped push Britain’s over-all rate of female workforce participation to well above the OECD average (Table 4).
Since the 1970s, government policies have been strongly supportive of womenworking. Equal pay and equal opportunity laws, rights to maternity leave, themove to individual rather than family taxation, and increased childcare supporthave all been important in supporting women who want to combine family andcareer. The single-earner family, where the husband works for a wage while thewife stays home to raise the children, has become an exception. Even amongcouples whose children are below school age, only 33% now have a full-timeworking father with the mother at home; 32% combine a male full-time wagewith female part-time employment, and 25% have both partners working full-time.56
As the number of households containing two adult earners has increased, so ithas become more difficult for single earner families to keep their heads abovewater. House prices, for example, have been partly driven up by the enhancedspending power of dual earner households. The move to dual earner families isthus self-reinforcing: the more of them there are, the harder it becomes not tojoin them.
Two principal factors account for governments’ enthusiasm in promotingfemale employment. One is the ageing population, for the impact of falling birthrates on economic output can be countered by expanding the size of the work-force by drawing on other pools of potential labour. This can be done byencouraging existing workers to delay retirement, by raising employment levelsamong groups like the disabled, or by sponsoring increased immigration byyoung, overseas workers; but the biggest pool of unused labour waiting to betapped has been women with family responsibilities.
According to the OECD: “In all countries, increasing female employment isemphasised as being crucial for maintaining economic growth and/or affordablepension systems.”57 The report goes on to suggest that this has been a particularlyimportant consideration in Britain, but we are not alone in this. Concern aboutfuture output has led the EU to set its member states a formal target of a 60%female employment rate by 2010 (a figure Britain has already passed).58
The other reason governments have wanted to increase female workforceparticipation is a concern to promote ‘gender equity’. For women to achieveequality with men, it is assumed that they must participate in paid labour to thesame extent as men do.
Research by the UK Cabinet Office Women’s Unit actually shows that manywomen in Britain have no desire to work in full-time careers. Women are evenlydivided over whether they believe being a housewife is less fulfilling than paidwork, while one-third think that home and family should be a woman’s majorfocus in life. Full-time mothers generally tell researchers that it is their choice toremain home and raise their children, and only 5% of mothers say they wouldchoose to work full-time if there was no financial need to do so.59
Overseas, too, research has found that many women do not want to work full-time while they are raising their children. In France, when child benefits becamemore generous, women responded by reducing their participation in paid work.60
policyexchange.org.uk | 27
What Should Family Policy Do?
55 Hakim C (1996), Key Issues in
Women’s Work.
56 Jaumotte F (2003), ‘Female
labour force participation’, OECD
Economics Department Working
Papers No.376, Table 1.
57 Facing the future, OECD, 2007,
p.28.
58 Babies and Bosses (2007),
p.14.
59 Hakim C, Bradley K, Price E and
Mitchell L (2008), Little Britons: Fi-
nancing Childcare Choice, Policy
Exchange.
60 Dex and Joshi (1999), p.645.
PX Tax and Family:Layout 2 17/6/09 15:10 Page 27

In Sweden, women with young children deserted the state nursery system indroves once they were offered the alternative of extended parental leave thatallowed them to stay at home and look after their infant children themselves.61
Despite what women say they want, however, academics and policy-makersthroughout the western world have been on a mission for the last 30 years to‘free’ them from domestic labour, uncouple their dependency on a male wage,and get them into full-time careers of their own. As an earlier Policy Exchangereport concluded:
“The Government talks about providing choice for women, but in practice its policy is designedto encourage mothers to choose paid work in preference to full-time motherhood, even if that iswhat they prefer.”62
This can only be done, of course, if some way is found to look after young chil-dren for extended periods while both their parents are at work. The drive to raisefemale employment rates thus necessarily entails policies designed to increase thesupply of affordable childcare.
There is a lot of evidence that young children – particularly those in their firstyear of life – are best looked after by a parent or family carer, rather than in insti-tutions. Common sense wisdom concurs: 80% of Britons think young childrenshould be looked after at home by a parent rather than being placed with a child-minder or a day nursery.63
Older children, from around age three onwards, do seem to benefit from timespent outside the home in nurseries or pre-school: they learn to socialise withother children, they benefit from exposure to new learning environments, andthose from more deprived backgrounds in particular can make real cognitive,social and emotional gains as a result of the additional stimuli and structured playopportunities they encounter.64
But at one – or even two – years of age, children’s emotional and intellectualdevelopment can easily be impaired if they are left on a regular basis in long-hours institutional care. This is the time when the ‘emotional brain’ is beingformed (created in the first 18 months) and when synapse formation in the visualcortex is occurring (completed by age two).65 Young children exposed to longand sustained periods of institutional care generate higher levels of stresshormone which can damage brain development. They reveal more social andbehavioural problems, both at the time and later, as a result.66
Modern neuroscience is clear that, in the first year or two of life “intimate,loving, one-to-one interaction” is an “essential input to the child’s emotional,physical and cognitive development.”67 This cannot be delivered by long hoursinstitutional care, no matter how well it is financed or how professionally it ismanaged.68 Even childcare advocates now admit that removing infants from theirparents and putting them into institutional care in the first year of life is proba-bly harmful.69
Faced with this evidence, those pushing for higher levels of female workforceparticipation have started to advocate more generous leave entitlements forparents in the first year of their child’s life, so that parents can stay at home to lookafter their babies without leaving the labour market. A well-publicised report byUNICEF, for example, recently drew attention to the deleterious effects of childcare
28 | policyexchange.org.uk
Reforming the UK Family Tax and Benefits System
61 Adamson P (2008), The Child-
care Transition, UNICEF, Innocenti
Research Centre, Report No.8,
p.15.
62 Hakim et al (2008), Little
Britons, p.19.
63 Social Justice Policy Group,
Breakthrough Britain Vol.1: Fam-
ily Breakdown, (2007) p.6.
64 Babies and Bosses (2007),
chapter 6; Kamerman S et al
(2003), ‘Social Policies, family
types and child outcomes in se-
lected OECD countries’, OECD So-
cial, Employment and Migration
Working Papers No.6; Hansen K
and Hawkes D (2009), ‘Early child-
care and child development’ in
Journal of Social Policy vol 38,
p.211-39.
65 Social Justice Policy Group,
Breakthrough Britain Vol.1: Fam-
ily Breakdown (2007), p.16.
66 Social Justice Policy Group,
Breakthrough Britain Vol.1: Fam-
ily Breakdown, p.76.
67 Adamson P (2008), The Child-
care Transition, p.6.
68 It is sometimes argued that
the problems with childcare could
be resolved if the government
spent more money on providing a
higher level of care with higher
levels of staffing and better train-
ing. This would still fail to match
the quality of interaction between
a full-time parent and her/his in-
fant, however. It would also be
hugely expensive. As Patricia
Morgan points out: “‘High quality,
low-cost childcare’ is a contradic-
tion in terms. Its expense (even if
the personnel could be found to
provide it) would outweigh the
worth of the mother’s labour
elsewhere” (Family policy, family
changes, p.109).
69 “Child development is nega-
tively affected when an infant
does not receive full-time per-
sonal care...for at least the first 6
to 12 months of his/her life” (Ba-
bies and Bosses, (2007) p.109).
PX Tax and Family:Layout 2 17/6/09 15:10 Page 28
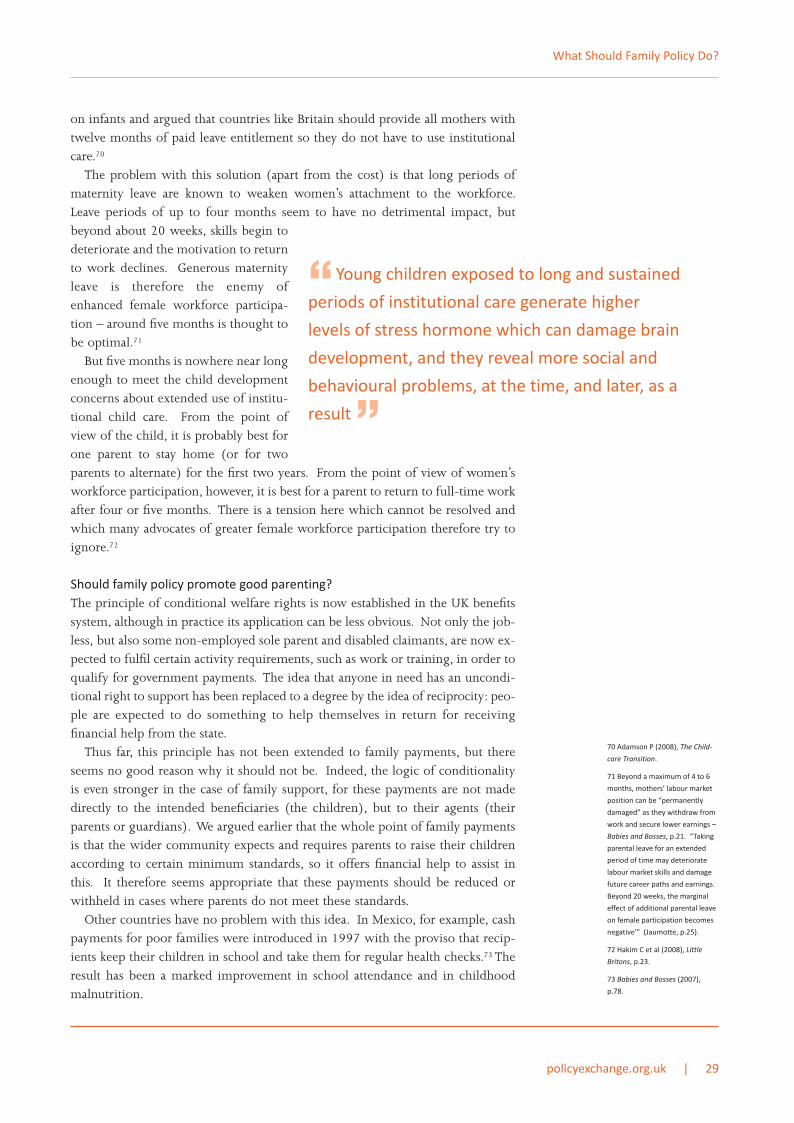
on infants and argued that countries like Britain should provide all mothers withtwelve months of paid leave entitlement so they do not have to use institutionalcare.70
The problem with this solution (apart from the cost) is that long periods ofmaternity leave are known to weaken women’s attachment to the workforce.Leave periods of up to four months seem to have no detrimental impact, butbeyond about 20 weeks, skills begin todeteriorate and the motivation to returnto work declines. Generous maternityleave is therefore the enemy ofenhanced female workforce participa-tion – around five months is thought tobe optimal.71
But five months is nowhere near longenough to meet the child developmentconcerns about extended use of institu-tional child care. From the point ofview of the child, it is probably best forone parent to stay home (or for twoparents to alternate) for the first two years. From the point of view of women’sworkforce participation, however, it is best for a parent to return to full-time workafter four or five months. There is a tension here which cannot be resolved andwhich many advocates of greater female workforce participation therefore try toignore.72
Should family policy promote good parenting?The principle of conditional welfare rights is now established in the UK benefitssystem, although in practice its application can be less obvious. Not only the job-less, but also some non-employed sole parent and disabled claimants, are now ex-pected to fulfil certain activity requirements, such as work or training, in order toqualify for government payments. The idea that anyone in need has an uncondi-tional right to support has been replaced to a degree by the idea of reciprocity: peo-ple are expected to do something to help themselves in return for receivingfinancial help from the state.
Thus far, this principle has not been extended to family payments, but thereseems no good reason why it should not be. Indeed, the logic of conditionalityis even stronger in the case of family support, for these payments are not madedirectly to the intended beneficiaries (the children), but to their agents (theirparents or guardians). We argued earlier that the whole point of family paymentsis that the wider community expects and requires parents to raise their childrenaccording to certain minimum standards, so it offers financial help to assist inthis. It therefore seems appropriate that these payments should be reduced orwithheld in cases where parents do not meet these standards.
Other countries have no problem with this idea. In Mexico, for example, cashpayments for poor families were introduced in 1997 with the proviso that recip-ients keep their children in school and take them for regular health checks.73 Theresult has been a marked improvement in school attendance and in childhoodmalnutrition.
policyexchange.org.uk | 29
What Should Family Policy Do?
70 Adamson P (2008), The Child-
care Transition.
71 Beyond a maximum of 4 to 6
months, mothers’ labour market
position can be “permanently
damaged” as they withdraw from
work and secure lower earnings –
Babies and Bosses, p.21. “Taking
parental leave for an extended
period of time may deteriorate
labour market skills and damage
future career paths and earnings.
Beyond 20 weeks, the marginal
effect of additional parental leave
on female participation becomes
negative’” (Jaumotte, p.25).
72 Hakim C et al (2008), Little
Britons, p.23.
73 Babies and Bosses (2007),
p.78.
“Young children exposed to long and sustained
periods of institutional care generate higher
levels of stress hormone which can damage brain
development, and they reveal more social and
behavioural problems, at the time, and later, as a
result”
PX Tax and Family:Layout 2 17/6/09 15:10 Page 29

In Australia, receipt of the lump-sum maternity payment is conditional onhaving one’s child vaccinated. More controversially, pilot programmes have beentaking place in various remote Aboriginal communities where there are seriousproblems of child abuse, drug taking and alcohol bingeing. Both welfare andfamily payments have been tied to fulfilling conditions around school attendance,child abuse, substance abuse and housing tenancy, and similar, larger-scale trialsin eight localities across the country are now under way.74
In Britain, the Blair government proposed in 2002 that Child Benefit shouldbe taken away from parents whose children were persistently truanting fromschool, but the proposal met with fierce resistance from lobby groups whichargued that this would be detrimental to the welfare of the children and wouldpunish parents who might be blameless. A former director of the ChildPoverty Action Group pointed out that, ”The many objectives of Child Benefithave never included the inculcation of good behaviour”, and the governmentbacked off.75
This response points to an inherent problem in conditional schemes like this:that money is often withdrawn from very needy families, and the children canend up suffering. In Australia, the introduction of work requirements for soleparents with older children hit precisely this problem.Those who failed to partic-ipate had their payments stopped, and the federal government had then to enlistthe help of the third sector to monitor the impact on their children and to makeemergency payments where necessary.76
There is, it seems, a choice between two evils. On the one hand, it seems heart-less to withhold payments from families where parents fall short of requiredstandards, particularly as this may well mean their children suffer. But on theother, it is clearly wrong and counter-productive to continue handing out familypayments to parents who manifestly are failing to meet the minimum parentingstandards the rest of us expect and demand, and to do so sends the wrong kindsof messages to the rest of the community.
In his book Neighbours from Hell, the former Minister for Welfare Reform, FrankField, suggests that 200 years of progress in building civility in Britain has beenunraveling as a result of the growth of unconditional welfare rights:
“The unconditionality of much welfare has severed the connection between a person’s actionsand accepting the consequences of that pattern of behaviour...The idea that welfare should bereceived free of conditions is a very recent development. For most of the last 400 years thereceipt of welfare has been dependent on fulfilling a series of conditions. Only since the 1960sdid an opposing idea gain ground…[the] damaging belief that no matter how badly a personbehaves the right to welfare is inviolate.”77
Our failure to attach any requirements to receipt of public funds has underminedthe people who seek to maintain traditional standards of behaviour, and has fuelledthe growth of dysfunctional, anti-social behaviour. Field concludes:
“Unconditional welfare declares that no behaviour is so out of bounds that the right to a mini-mum income is foregone. Taking away the assumption that welfare will always be paidirrespective of a claimant’s behaviour is a crucial part of any successful strategy to re-establishcommon decencies.”78
30 | policyexchange.org.uk
Reforming the UK Family Tax and Benefits System
74 Saunders P (2008), ‘From enti-
tlement to employment’ in Kay L
and Hartwich O (eds), When has-
sle means help, Policy Exchange.
75 Quoted in Bennett F and Dor-
nan P (2006), Child Benefit: Fit for
the future, Child Poverty Action
Group, p.16.
76 Saunders P (2008), ‘From enti-
tlement to employment’.
77 Field F (2003), Neighbours
from hell, Politico’s 2003,
pp.33,95,98.
78 Field F (2006), The ethic of re-
spect: A left-wing cause, Centre
for Independent Studies, Occa-
sional Paper 102, pp.40-42.
PX Tax and Family:Layout 2 17/6/09 15:10 Page 30
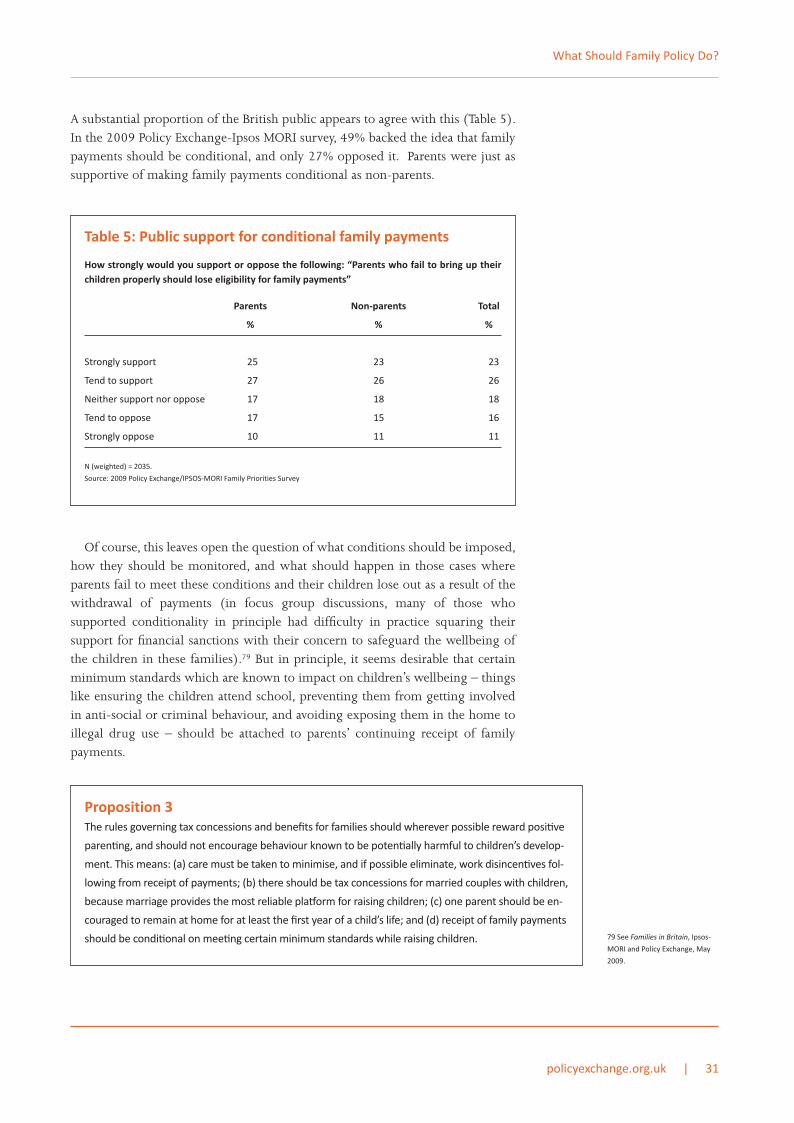
A substantial proportion of the British public appears to agree with this (Table 5).In the 2009 Policy Exchange-Ipsos MORI survey, 49% backed the idea that familypayments should be conditional, and only 27% opposed it. Parents were just assupportive of making family payments conditional as non-parents.
Of course, this leaves open the question of what conditions should be imposed,how they should be monitored, and what should happen in those cases whereparents fail to meet these conditions and their children lose out as a result of thewithdrawal of payments (in focus group discussions, many of those whosupported conditionality in principle had difficulty in practice squaring theirsupport for financial sanctions with their concern to safeguard the wellbeing ofthe children in these families).79 But in principle, it seems desirable that certainminimum standards which are known to impact on children’s wellbeing – thingslike ensuring the children attend school, preventing them from getting involvedin anti-social or criminal behaviour, and avoiding exposing them in the home toillegal drug use – should be attached to parents’ continuing receipt of familypayments.
policyexchange.org.uk | 31
What Should Family Policy Do?
79 See Families in Britain, Ipsos-
MORI and Policy Exchange, May
2009.
Table 5: Public support for conditional family payments
How strongly would you support or oppose the following: “Parents who fail to bring up theirchildren properly should lose eligibility for family payments”
Parents Non-parents Total
% % %
Strongly support 25 23 23
Tend to support 27 26 26
Neither support nor oppose 17 18 18
Tend to oppose 17 15 16
Strongly oppose 10 11 11
N (weighted) = 2035.
Source: 2009 Policy Exchange/IPSOS-MORI Family Priorities Survey
Proposition 3The rules governing tax concessions and benefits for families should wherever possible reward posi9ve
paren9ng, and should not encourage behaviour known to be poten9ally harmful to children’s develop-
ment. This means: (a) care must be taken to minimise, and if possible eliminate, work disincen9ves fol-
lowing from receipt of payments; (b) there should be tax concessions for married couples with children,
because marriage provides the most reliable pla8orm for raising children; (c) one parent should be en-
couraged to remain at home for at least the first year of a child’s life; and (d) receipt of family payments
should be condi9onal on mee9ng certain minimum standards while raising children.
PX Tax and Family:Layout 2 17/6/09 15:10 Page 31
3How Should Assistance beDelivered?
We have now clarified what the overall purpose of a family tax and benefitssystem should be (increased horizontal equity); and we have identified some ofthe objectives it might usefully set for itself (strengthening work incentives,supporting married parenthood, encouraging parental nurturing of infants, andimproving standards of parenting). The next question to ask is how these aimsand objectives might best be delivered.
There are four, basic sets of dilemmas to consider here:
� should assistance be targeted on the poorest families or provided on a univer-sal basis?;
� should it mainly involve benefit payments or tax reductions?;� should it be made in cash or in kind?; and� should it be weighted towards younger or older children?
Targeted or universal payments?If the key aim of family-based cash transfers is to increase horizontal equity, enti-tlement has to be universal. The principle is simple: the more people there are ina family living off any one income, the less that income should be taxed (or themore it should be supplemented) – no matter how large or small it may be.
Prosperous parents are obliged to share their income with their children, justas less well-off parents are. In relative terms, their children probably cost themjust as big a slice of their income, and in absolute terms, they sacrifice a muchlarger sum of money to raising their children than poorer parents do. Seen inthis light, it does not follow that prosperous parents should be compensatedless:
“The horizontal equity arguments for supporting families with children do not immediatelysuggest that child-contingent support should be higher for families with lower incomes...Horizontal equity may even suggest that child-contingent support should be higher for better-off families, because of the extra costs that they face to maintain a higher material livingstandard... Even if notions of inverse means testing are unacceptable, there is no reason to supposethat costs of children are higher in absolute terms for poorer families than for richer ones, andthis again points to universal child benefits,with redistribution goals being achieved through thenon-child-contingent transfer system.”80
32 | policyexchange.org.uk
80 Adam S, Brewer M and Reed H
(2002), The Benefits of Parenting,
IFS Commentary 91, Institute for
Fiscal Studies, pp.14-5.
PX Tax and Family:Layout 2 17/6/09 15:10 Page 32

Some countries recognise this argument for universal assistance in their familysupport systems (Table 6). In Germany and Belgium, for example, family assis-tance ensures that couples with two children get about 10% more income thanequivalent couples without children, and this holds right across the income dis-tribution, from poor families to rich ones. In the Netherlands, the top-up is worthless (between 5 and 7%), and in Ireland it is worth more (between 12 and 16% ),but in both countries, it is given to families right across the income scale.
Elsewhere, however, the supplement to the income of parents with children(relative to childless couples on the same earnings) falls as family incomes rise.In the USA, couples with no earnings get 30% more if they have two childrenthan if they have none, but by the time they reach the average wage, this top-uphas been reduced to 10%. In Denmark, the top-up falls from 22% for coupleswith no earnings to 8% for those on twice average earnings. In Australia, Canadaand Japan, the drop-off is even greater, so by the time families in these countriesachieve twice average earnings, their net income hardly varies whether they havechildren or not.
In the UK, two-child couples on low earnings boost their income by more than20% relative to childless couples as a result of family payments, but this enhance-ment falls to just 7% once they get above average earnings. Britain ranks high in
policyexchange.org.uk | 33
How Should Assistance be Delivered?
Table 6: Additional financial support for couples with childrencompared with childless couples at different levels of earningsin different OECD countries
Earnings as % of average wage
0 50 100 50 200
Strong horizontal equity:
Belgium 11 10 10 10 10
Germany 9 9 9 10 10
Ireland 16 18 13 13 13
Netherlands 5 7 5 5 5
Weak horizontal equity:
Australia 19 16 15 8 3
Canada 17 21 9 5 3
Denmark 22 22 11 6 6
Japan 19 19 4 2 4
UK 19 24 12 7 7
USA 30 25 11 11 11
OECD average 15 14 9 8 7
Source: OECD, Babies and Bosses (2007), Table 4.2.
Assistance at each level of earnings is expressed as the difference between the net incomes of a single-income couple without chil-
dren and a single-income couple with two children.
PX Tax and Family:Layout 2 17/6/09 15:10 Page 33

league tables measuring the generosity of family support for lower income fami-lies, but performs less well when comparing families on average earnings.81
The principle of horizontal equity is not wholly neglected in Britain, for ChildBenefit is a universal payment. Child tax credits, however, are means tested, andin recent years their importance has grown relative to the universal benefit.82 Asa proportion of total financial support for children, Child Benefit fell from 79 to42% between 1979 and 2003.83
Table 6 indicates that in the UK (as in a number of other OECD countries), theprinciple of horizontal equity has been sacrificed to the principle of verticalequity. In other words, as families with children get richer, the governmentbecomes less concerned to help them maintain their living standards vis-a-viscomparable earners without children.
But the family support system was never intended to be an instrument of verti-cal redistribution. Vertical equity can be pursued through a progressive incometax system (a high earner pays proportionately more tax than a low earner) andthrough a redistributive welfare benefits system (poor households qualify forassistance for which more affluent households are ineligible). Family transfers areintended for a different purpose, to compensate parents for part of the costincurred in raising children. To achieve this, they should either allow adults withdependent children to pay less tax, or make them eligible to receive higherpayments, so they end up with a higher net income than single adults on the sameincome.
This is what the German, Belgian, Dutch and Irish systems achieve, but whatthe UK system fails to.
A significant proportion of the British public appears to understand and agreewith the idea that family assistance should be used to increase horizontal, ratherthan vertical, equity. Asked whether government assistance to people with chil-dren should be restricted to poorer families or made available to all parents, halfof the respondents to a recent survey said that support should be universal, whileonly 40% thought it should be targeted (Table 7). Among parents, support foruniversalism was even higher, at 58%.84
34 | policyexchange.org.uk
Reforming the UK Family Tax and Benefits System
81 Bradshaw J and Finch N
(2002), ‘A comparison of child
benefit packages in 22 countries’,
Department of Work and Pen-
sions, Research Report No.174.
Britain ranks 7th overall out of 22
nations.
82 Commission on Families and
the Wellbeing of Children, Fami-
lies and the State. Bristol: Policy
Press, 2005, p.63.
83 Child Poverty Action Group
(2006), Child Benefit.
84 The survey also asked whether
child benefit should be restricted
to lower income families. Only
30% of respondents (and 25% of
parents) thought that it should.
Table 7: Support for universal family assistance
Which of these statements comes Parent Non-parent Total
closest to your view? % % %
Anybody with a dependent child 58 47 50should get some governmenthelp towards the cost of raising it.
Only poor parents should get 33 43 40government help towards the costsof raising their children.
Don’t know 9 10 10
N (weighted) = 2035. p<0.05
Source: 2009 Policy Exchange/IPSOS-MORI Family Priorities Survey
TEXT HDS:Layout 2 22/6/09 14:12 Page 34

Horizontal equity is not the only reason for supporting universal family assis-tance. We saw earlier that a major problem with targeting is that it penalises anyfamily whose members make an effort to improve their income. The more hoursthey work, and the more they train and study to improve their earning capacity,the less help they get from the government.
This disincentive effect is inherent to means testing. Government can try tominimise it by flattening the income taper, so that benefits are withdrawn moregradually as family incomes rise, but the problem never goes away. The more wetry to restrict assistance to those most in need, the more vicious the work disin-centives are likely to be. Advocates of universalism also point to the stigmatisingeffects that can arise in targeted systems.85 These are generally avoided in univer-sal payments.
The obvious problem with universalism, however, is that it is expensive. The UKgovernment is spending more on family assistance today than ever before. If theextra benefits to families that have been introduced in the last ten years were to bespread out more evenly among all families with children, the cost would be crip-pling. A key question, therefore, is not whether we should compensate all familiesfor the costs they incur in raising their children, but whether we can afford to.
Benefits or tax cuts?: The importance of reducing churningThus far, we have discussed government ‘financial assistance’ to families withoutspecifying what form it takes. We saw at the start of this chapter that it has tradi-tionally taken two forms:
� Government payments to families with children (e.g. the universal ChildBenefit, the successor to the ‘family allowance’ introduced after World War II).
� Allowing families with children to retain a bigger slice of their own earningsbefore they start paying tax (e.g. the dependents’ tax allowances, introducedbefore World War I).
We shall see later that the new tax credits system muddies these waters somewhat,but in essence, tax credits also fall into one of these two categories: despite theirrather misleading name, child tax credits are always payments.
There are two main problems with delivering family assistance through taxreductions rather than through direct payments:
� Firstly, families have to be earning in order to take advantage of tax-free earn-ings allowances. Tax breaks for families do not benefit those where nobody isin paid work, and they may only be of limited help to those (e.g. families rely-ing on one part-time earner) with very low earnings. If the tax-free allowanceexceeds the total amount earned, the surplus allowance will not be used.
� Secondly, assistance through tax deductions is directed to the family’s princi-pal earner, who may not be the main carer. If the intention of family assistanceis to help families with the cost of raising their children, it makes more senseif it goes to the adult who is directly responsible for looking after the children– which normally means putting money into the mother’s purse rather thanthe father’s pay packet.
policyexchange.org.uk | 35
How Should Assistance be Delivered?
85 Commission on Families and
the Wellbeing of Children, Fami-
lies and the State. Bristol: Policy
Press, 2005.
PX Tax and Family:Layout 2 17/6/09 15:10 Page 35

But reliance on payments rather than tax deductions brings its own problemswhich arguably outweigh the difficulties attached to tax-based assistance. Perhapsthe key one is that receipt of government payments will over time erode families’sense of their own self-reliance and promote in its place a culture of dependency.
A pound earned has a very different meaning than a pound received in bene-fits.The first signifies independence and points to an ability to care for oneself andone’s family through one’s own efforts; the second signifies dependence on othersand promotes a mentality that looks to the government to resolve one’s problemswhenever difficulties arise.
If we want to strengthen family life, we should not be encouraging greaterdependency on government hand-outs.Yet this is exactly what the new tax cred-its system has been doing.
In Britain today, not only is every family with children eligible to receive ChildBenefit, but the majority also qualify for the child tax credit (which, despite itsname, is a cash benefit, not a tax reduction).
All families earning up to £58,000 a year are eligible to claim the child taxcredit and 82% of them do so.86 5.5 million households, most of whom had neverclaimed welfare benefits before, now receive this payment. Many middle classfamilies have been transformed into welfare claimants as a result (Table 8).87
The irony of this massive growth of middle class welfare is that many of thesenew welfare recipients are paying for their own benefits. Government figuresshow that four out of ten families with children now receive more in ChildBenefit and tax credits than they pay in tax.88 But this means that six in ten arepaying more tax than they receive back in family payments.
Those families who are effectively financing their own benefits would beno worse off financially if the government scrapped all its family paymentsand reduced their tax by the equivalent amount. Indeed, they would be betteroff, for the government racks up substantial administration charges when ittakes tax away and then hands it back as Child Benefit or child tax credits, andthese overheads would be saved if the money were simply left in people’spockets.
36 | policyexchange.org.uk
Reforming the UK Family Tax and Benefits System
86 HM Revenue and Customs, Tax
credits: Improving delivery and
choice, HM Treasury, May 2008.
87 Having argued in favour of uni-
versalism in the previous section,
it might seem odd now to be
complaining about ‘middle class
welfare’. If we favour universal
family assistance, doesn’t this
mean increasing middle class wel-
fare rather than reducing it? But
this only follows if assistance is
provided in the form of cash ben-
efits. If, instead, families are as-
sisted by reducing their tax
liability, this meets the universal
requirement (all families get tax
breaks) while also reducing the
amount of middle class welfare.
88 HM Revenue and Customs, Tax
credits: Improving delivery and
choice. HM Treasury, May 2008,
p.4.
Table 8: Proportion of families receiving government payments
One-parent families Two-parent families All families with children
% % %
Child benefit 96 96 96
Child tax credit 65 54 57
Working tax credit 31 14 19
Income related benefits 56 8 21
No state support 2 3 3
Source: Department for Work and Pensions Family Resources Survey 2006-07, Table 3:19
PX Tax and Family:Layout 2 17/6/09 15:11 Page 36
Not only that, but most families would then be earning and spending theirown money, supporting themselves out of their own earnings, rather than wait-ing for the government to give them hand-outs. They would be self-reliant.
Table 9 identifies the taxes that families with children paid in 2006-07, andthe cash payments and other benefits they received from government. It shows,for example, that the poorest 10% of families with children received, on average,just £5,025 of ‘original income’ in earnings from wages, pensions, investmentsand self-employment. This income was then supplemented by cash transfersfrom the government worth £7,603, which included £1,563 in Child Benefitand £1,700 in tax credits. However, the government also took back £1,297 intax and National Insurance contributions, leaving an average disposable incomeof £11,539.
Looking across the table, from the poorest to the most affluent families, it isinstructive to compare families’ original incomes (before the government getsinvolved) with their disposable incomes (after direct taxes and cash benefits).
The first point to note is that many families around the middle of the incomedistribution end up with much the same disposable income as they had in orig-inal income.
At the 4th income decile, where the average family income before tax andbenefits is £21,332, the average disposable income after tax and benefits is only7% higher at £22,751. At the 5th income decile, the state begins to take more intax than it hands out in cash benefits, but the net impact of its redistributiveefforts is still tiny. An average original income of £26,599 is turned into a dispos-able income of £25,966 – a reduction of just 2%.
The second point to note is how much government activity is going into creat-ing these tiny net changes in family income. In the 5th decile, for example, the
policyexchange.org.uk | 37
How Should Assistance be Delivered?
Table 9: Tax and welfare churning for families of working age withchildren at different income deciles (2006-7)
Equivalised disposable income decile
Bottom 2nd 3rd 4th 5th 6th 7th 8th 9th Top
Average £ pa
Original income 5205 8608 15708 21332 26599 33324 40922 49230 62299 121208
Child benefit 1563 1322 1523 1330 1378 1365 1278 1253 1215 1137
Tax credits * 1700 2217 2602 2526 2047 1549 934 630 395 237
Other benefits 4343 5044 4151 2521 1958 1546 998 775 801 719
Tax & NI** 1297 1984 3709 4958 6016 7773 9645 12279 16004 31429
Disposable income 11539 15207 19870 22751 25966 30011 34487 39609 48706 91873
Source: Francis Jones, ‘The effects of taxes and benefits on household income 2006/07 Economic and Labour Market Review vol.2, no.7, July 2008, Table
21 (Appendix 1)
* Includes Working Tax Credit and Child Tax Credit. Although Child Tax Credit is paid as a cash benefit to all claimants, tax credit income is classified by
the ONS as negative tax payments until all income tax is exhausted, and only the balance is classified as cash benefits. This artificially reduces the amount
of tax families appear to pay as well as reducing the true value of the tax credits they receive as cash payments. In this table, therefore, the value of these
‘negative tax payments’ has been added back into the overall value of tax credits received, and has also been added to the calculation of total tax paid
** Includes employers’ and employees’ NICs, plus council tax net of council tax benefit.
PX Tax and Family:Layout 2 17/6/09 15:11 Page 37

government is taking £6,016 on average from each family in tax and NI contri-butions, and is then giving them back £5,383 as social security and familypayments. For middle income families at least, the government might just as wellleave them alone.
The third point is to compare the value of the family benefits received with theamount of tax and NI paid.89 From the 4th decile of income upwards, all familieswith children pay more in direct taxes than they receive in family payments.90
Even in the 3rd decile, where families receive an average of £4,125 in familypayments, they pay £3,709 in direct taxes – i.e. their tax payments cover 90% ofwhat they receive in family benefits.
The conclusion to draw from all of this is simple. Most families are paying fortheir own family benefits. If the government scrapped all family payments tomor-row, and compensated by reducing families’ tax contributions by the sameamount, at least two-thirds of families would be no worse off, and up to three-quarters would hardly notice any difference in their net incomes.
Cash or kind?In the 2009 Policy Exchange-MORI family survey, respondents were asked howthey thought government assistance for families is best delivered – through cashbenefits, tax reductions, or subsidies to services like child care. In the choice be-tween tax reductions and cash benefits, the former was quite heavily favoured, 63to 37% . However, it was the third option – subsidizing services like childcare –that received most public support (Table 10).
The advantage of providing financial assistance in the form of services (orsubsidies for services) is that the government can be sure how its money is beingspent. This is also, however, the main disadvantage.
Cash, on the other hand, can be spent on anything. There is therefore no guar-antee that money made available to parents so they can buy things for theirchildren will actually be spent in this way. There is precious little evidence on
38 | policyexchange.org.uk
Reforming the UK Family Tax and Benefits System
89 In Table 9, ‘tax credits’ include
Working Tax Credit as well as the
child tax credit, but WTC is tightly
income-tested, so few families
outside the bottom two deciles
are likely to be receiving it. Tax
credits also include tax relief at
source on life assurance premi-
ums, which may slightly inflate es-
timates of CTC received in the
higher income deciles. But to de-
rive reasonably accurate esti-
mates, we can add the value of
‘child benefit’ and ‘tax credits’ to
calculate the approximate total
value of family benefits received
by families from the 3rd decile
upwards.
90 The government’s claim,
quoted earlier, that 4 in 10 fami-
lies pay less tax than they receive
in family payments does not
square with the figures for the
4th decile in Table 9. It may be
that the government’s claim is ex-
cluding NI contributions.
Table 10: Support for universal family assistance
There are different ways support could be given to help parents with the cost of raising children.Which of these three options would you support?
Parents Non-parents Total
% % %
Reduce the tax parents pay 39 36 37
Subsidise services like childcare 40 45 43
Cash benefits 29 19 22
Don’t know 9 11 10
N (weighted) = 2035.
Source: 2009 Policy Exchange/IPSOS-MORI Family Priorities Survey
PX Tax and Family:Layout 2 17/6/09 15:11 Page 38

how recipients of family payments use the money, and even though the UKgovernment has in recent years hugely increased its financial assistance to fami-lies (and in particular, poorer families), we know very little about what impact, ifany, this has had on children’s wellbeing.91
What we do know is that a substantial portion of government financial assis-tance to families actually gets spent on adults, not children. And it is not evenspent on adult necessities. Research for HM Treasury found that couples on aver-age spend at least one-quarter, and perhaps as much as half, of the Child Benefitthey receive on alcohol.92
It follows from this that increasingcash payments to families will not neces-sarily improve the lives of children, andmay well have little effect. Severalresearchers, in the USA as well as inBritain, have found that overall spendingon necessities for children does notdiffer very much between poor homesand more affluent ones. This is because most parents put their children first, andadults will sacrifice their own wants to ensure their children get what they need.93
When governments then increase financial assistance to these families, parents takethe opportunity to buy the things for themselves that they have been going with-out (like alcohol), rather than increasing their spending on the children.
If the aim behind family assistance is to increase horizontal equity, there is noproblem with this, for family payments are meant to compensate parents forhaving to share their incomes with their dependent children. But if the aim is toreduce child poverty and improve child material wellbeing, the fact that a bigchunk of family assistance gets spent on adults looks like a real problem.
One response is to provide assistance with strings attached – either by provid-ing services in kind for parents, or by providing vouchers and subsidies tied tospecific kinds of spending.
Food stamps in the USA are one example – they ensure that federal governmentmoney can only be spent on approved grocery purchases (although a blackmarket in food stamps has often allowed recipients to cash them in at a discount).Australia’s recent experiments with quarantining a portion of welfare payments tocover rent, food and other allowable necessities, is another.
In the UK, all families receive substantial government assistance in the form ofservices in kind. Most of this comes in the form of ‘free’ education and healthcare (which is not really ‘free’, of course, since many families pay for much or allof what they consume through their taxes).
In 2006/07, families with children consumed an average of £5,906 worth ofstate education each year and £3,862 of state health care. The poorest tenth offamilies, whose average disposable income was just £11,539 (Table 9), receivedanother £13,371 in government services, bringing their ‘final income’ to over£20,000. Even the richest 10% of families received government services worth£7,772.94
From the point of view of the consumers of these services, provision in kindrather than in cash has two major drawbacks. First, it pre-empts their choice ofsupplier. If the government provides your child’s schooling, you have to accept
policyexchange.org.uk | 39
How Should Assistance be Delivered?
91 “There is little evidence on
what impact increasing incomes
through extra government trans-
fers has upon children’s wellbe-
ing”. Adam S, Brewer M and Reed
H (2002), The benefits of parent-
ing, p.7.
92 See Blow L, Walker I and Zhu Y
(2005), Who benefits from Child
Benefit?, Department of Econom-
ics, University of Warwick.
93 Banks J and Brewer M (2002),
Understanding the relative gen-
erosity of government financial
support to families with children,
Institute for Fiscal Studies, Work-
ing Paper 02/02, p.11.
94 Jones F (2008), The effects of
taxes and benefits on household
income 2006/07, Table 21, appen-
dix 1.
“ If the aim is to reduce child poverty and
improve child material wellbeing, the fact that a
big chunk of family assistance gets spent on
adults looks like a real problem”
PX Tax and Family:Layout 2 17/6/09 15:11 Page 39

the school you are given; if it provides your health care, you have no choice overyour treatment. If you are happy with what you are given, there is no problem,but if you are not, the lack of alternatives (no right of ‘exit’) means you are lockedinto a service that you have to pay for (through your taxes) but which you cannotchange.
The second problem with provision in kind is that it stops you spending themoney on some other kind of service which might suit your needs better. This,of course, is precisely why governments provide help in this way. They want tosupport one set of parental choices (e.g. to spend £5,000 per year on sendingtheir children to school) and close down another (e.g. to fritter £5,000 awayevery year on alcohol or gambling while leaving the kids uneducated).
Often this pre-emption of parental choices makes sense. But the government’sjudgement of what is best for families is not always self-evidently sensible, andthere are times when it clashes with what parents themselves consider to be bestfor their children.
A clear example where this occurs is childcare.95 For families with very youngchildren, the UK government has substantially stepped up its help paying for pre-school childcare in recent years. In addition, low income workers (in practice,mainly sole parents) can claim up to 80% of their childcare costs, to a maximumvalue of £300 per week, through the Working Tax Credit, while all employees candeduct childcare payments from their gross income to reduce tax and NIC by £55per week, provided their employers offer this option (the so-called ‘electronicvoucher’).
The Early Years Entitlement pays nurseries to provide 12½ hours per week ofpre-school for all 3-4 year old children, and the government is committed tofinancing 3,500 Sure Start children’s centres by 2010, each of which will providechildcare as part of an integrated suite of family services for children aged 0-3.96
38% of three year olds, and 79% of four year olds, now attend maintained nurs-ery schools with free places.97
But all this help is only available to parents who use formal childcare providersof which the government approves. It is not available to those parents who preferto use informal care provided by neighbours or extended family members(although the 2009 budget did introduce NI credits for grandparents who spend20 hours or more each week looking after their grandchildren). Nor is assistanceprovided to parents who prefer to remove themselves from the workforce andlook after their own children at home.
Several commentators have noted that these policies strongly skew parentalchoices towards (a) using formal and state-sector childcare (even though manywomen prefer to use informal and family care)98 and (b) going out to work ratherthan opting for full-time motherhood (even though many women prefer to raisetheir infant children at home).
In cases like this, where there is a clear divergence of preferences in the popu-lation, and where there is no conclusive evidence that children’s interests are bestserved by one strategy rather than another, it would be less restrictive for govern-ment assistance to take the form of cash rather than provision in kind. That way,parents are freed to make their own judgements about what is best for their ownchildren, rather than have the government decide this for them.
40 | policyexchange.org.uk
Reforming the UK Family Tax and Benefits System
95 The childcare support system,
and options for reforming it, have
been examined in detail in an ear-
lier Policy Exchange report, Little
Britons: Financing Childcare
Choice (Hakim C et al, 2008).
96 HM Revenue and Customs,
Help with the costs of childcare,
October 2008; Building a Fairer
Society (2007 Budget), chapter 5,
p.113.
97 Hakim et al (2008), Little
Britons: Financing Childcare
Choice, p.42.
98 Hakim et al (2008), p.19; Social
Justice Policy Group, Break-
through Britain vol.1, 2007, p.26;
Dex and Joshi (1999), p.653.
PX Tax and Family:Layout 2 17/6/09 15:11 Page 40
Younger or older children?The 2009 Policy Exchange-Ipsos MORI family survey asked respondents whetherparents of young children should receive more, less or the same level of financialsupport from government as those with older children. There was little support forskewing assistance towards those with older children (just 9% supported this), butonly 24% thought those with young children should get more.Two-thirds favouredall parents getting the same.
There are, however, quite powerful arguments in favour of paying differentamounts according to the age of the children.
Generally speaking, children cost their parents more money as they grow older.They eat more, they need a room of their own, and they consume more leisurethat has to be paid for. This would seem to indicate that financial assistanceshould be greater for older children than for younger ones, and a number ofcountries (including Australia and New Zealand) reflect this in their childpayment systems.99
However, to these ‘direct costs’ we have to add the ‘indirect costs’ of havingchildren, primary among which is the loss of income when one parent stops paidemployment to look after them. This loss of income is greatest when children arevery small, for many mothers return to the workforce as their children get olderand go to school or into childcare. This suggests that financial assistance shouldbe greater for very young children, and should be reduced as they get older, andthis has indeed been the trend in recent UK family policy.100
There are also ‘economies of scale’ to take into account. A second child does notcost as much as a first, for much of the capital investment (in prams, toys, clothing,etc) has already been made (and the loss of parental income from working mayalready have been absorbed). It might therefore be sensible to pay higher amountsfor a first child than for subsequent ones, and the UK Child Benefit does this.
On balance, it seems sensible to ‘front load’ financial assistance for familiesonto the early years. When children get older, parents can both work, at leastpart-time, and when they reach their teenage years, the children themselves canstart some form of paid employment. The greatest financial sacrifice comes whenpeople start a family, and concentrating most of the help at that point shouldextend their choices about whether to keep working or take time at home to raisethe children, as well as compensating them for some of the additional costs theyincur with new dependents to look after.
policyexchange.org.uk | 41
How Should Assistance be Delivered?
99 Nolan P (2006), ‘Tax relief for
breadwinners or caregivers?’;
D’Addio and D’Ercole (2005).
100 Historically, child tax al-
lowances, family income supple-
ment and family credit all had
lower rates for young children,
but the new child tax credit pays
extra for children under 12
months and the Sure Start mater-
nity grant for low income mothers
has also become more generous.
See Adam S and Brewer M (2004),
Supporting Families, p.26.
Proposition 4Family transfers are intended to compensate parents for part of the cost incurred in raising children,
not to redistribute income between richer and poorer households. At all levels of income, adults with
dependent children should end up with a higher net income than single adults on the same income.
This is best achieved by taxing them less. Giving them family benefits (which they may well have paid
for out of their own tax contribu9ons) is less empowering, and where possible should be avoided. Pro-
vision in kind, rather than cash, also undermines family autonomy. The best strategy for ensuring strong
and autonomous families is to leave them with more of their own money, par9cularly in the early years
of child rearing (when families are o(en hit with increased costs and declining incomes).
PX Tax and Family:Layout 2 17/6/09 15:11 Page 41

4Tax Allowances for Dependents
Having concluded that the best way to assist families is to reduce the amount oftax they have to pay, it is disturbing to discover that family policy in the UK hasfor the last 40 years been headed in precisely the opposite direction.Governments of both main parties have since the 1970s systematically reducedtax breaks for families, and substituted them with cash payments, with the resultthat today, tax concessions for people with children have all but disappeared.101
This makes the UK quite unusual among OECD countries, most of which havesome recognition of family responsibilities in their tax systems.102 Before we lookat our system of cash payments as it operates today, it is important to look backto try to understand how and why governments abandoned tax concessions as amajor route for delivering assistance to families.
The history of tax allowances for children and for spousesWe have already seen that workers with children were until 1975 given an addi-tional tax allowance in recognition of the fact that they had to share their incomewith their dependent children. In addition to this, workers with a dependentspouse similarly enjoyed an additional tax allowance for their partner – this did notdisappear until 2000.
The origin of tax allowances for children dates back as far as income tax itself:they were first introduced in 1798, but then abolished in 1805. Reintroduced in1909, they varied with the age of the child (older children got a bigger allowance).
Unlike family allowance payments, child tax allowances included the first childand continued for as long as children were dependent on their parents’ income,even beyond the age of 18. They were also worth a lot more than the familyallowance payments, particularly for higher-rate taxpayers who could get relief attheir highest marginal rate.103
In effect, child tax allowances meant children had their own tax-free incomeallowance which the family’s principal earner (normally the father) claimed ontheir behalf, along with his own. This allowance disappeared, however, when itwas folded into the new Child Benefit in 1975.
In 2001, the government did briefly resuscitate tax allowances for children inthe form of a new Children’s Tax Credit.104 Unlike the earlier allowance, this wasmeans tested, so higher-rate taxpayers gradually lost their entitlement to it as theirincomes rose. It also worked slightly differently. Whereas the old tax allowancesincreased the total amount a worker could earn before starting to pay tax, thisnew Children’s Tax Credit was deducted from a parent’s overall income tax bill.
42 | policyexchange.org.uk
101 One exception is the child
care tax concession operated by
some employers – see later.
102 Draper D and Beighton L
(2008), Taxation of Married Fami-
lies, p.7.
103 Bennett and Dornan (2006),
section 4.
104 HM Revenue & Customs, Tax
credits: Improving delivery and
choice, HM Treasury, May 2008,
p.9. As we shall see, this Chil-
dren’s Tax Credit replaced the
Married Couple’s tax allowance,
which was scrapped in the same
year.
PX Tax and Family:Layout 2 17/6/09 15:11 Page 42

Like the earlier child tax allowance, the Children’s Tax Credit was ‘non-refund-able.’ In other words, if the value of the credit was greater than your total taxliability, you could not claim the difference. This meant it offered little assistanceto those on very low incomes who were paying little or no income tax. It wasscrapped in 2003 when the new Working Tax Credit and Child Tax Credit wereintroduced.
In addition to claiming enhanced tax allowances in respect of their children,workers had since 1909 been able to claim a tax allowance for a dependentspouse. The logic was the same in both cases: because one income was having tosupport more than one family member, the dependents (be they children or awife) were able to transfer a notional tax-free earnings allowance to the principalearner who could use it to reduce the family’s overall tax liability.
The so-called ‘Married Man’s Allowance’ was optional for couples. If bothhusband and wife were earning, they could choose to be taxed separately, inwhich case they would each receive a single person’s tax-free earnings allowance.But if they wished, they could be taxed jointly, on their combined earnings, andthis generally made sense if only one of them was working. If they exercised thisoption, the principal earner would receive an enhanced tax allowance, worth 1½times the single person’s allowance.105
Widows, widowers and sole parents with dependent children also received anenhanced allowance, called the Additional Personal Allowance, which put themon the same footing as a couple being taxed jointly.
In 1990, the Married Man’s Allowance was scrapped as the government movedto a system of independent taxation where all taxpayers would be taxed separatelyon their own income with their own tax allowance. However, two elements ofthe older system survived for another ten years:
� A ‘Married Couple’s Allowance’ was introduced, which could be claimed byeither a husband or wife if their partner was not using their own personalallowance (this was to ensure that married couples who had been taxed jointlyup to that point did not lose out as a result of the move to independent taxa-tion);
� Sole parents continued to get the Additional Personal Allowance.
But in 2000, both the Married Couple’s Allowance and the Additional Personal Al-lowance for sole parents were also scrapped (except for elderly couples). Theywere replaced by the Children’sTax Credit (discussed above), which was intendedto compensate couples and sole parents for the loss of their tax allowances. Thisin turn gave way to the new Child Tax Credit in 2003, which despite its name isactually a benefit payment, not a tax relief.
For the last nine years, therefore, the UK family support system has containedno provision for tax relief in respect of either dependent partners or dependentchildren. Everybody is now taxed as an individual with no regard for how manyother people may depend upon their income. A married man with a wife athome looking after two young children is subject to exactly the same tax as asingle person working in the same job at the same rate of pay who has no othercalls on his earnings. The principle of horizontal equity has thus been eliminatedfrom our tax system.
policyexchange.org.uk | 43
Tax Allowances for Dependents
105 Draper D and Beighton L
(2008), Taxation of married fami-
lies, CARE, p.12.
PX Tax and Family:Layout 2 17/6/09 15:11 Page 43

There are three main reasons why successive governments phased out taxallowances for dependents. One applies mainly to child tax allowances, one tothe married couple’s allowance, and the third is a problem common to any taxallowance:
� Spousal tax allowances favour marriage and demean women: Feministswho see marriage as a ‘patriarchal institution’ have long been unhappy abouttax breaks for married couples.They favour individual taxation so women arenot treated as ‘dependents’ of men.
� Child tax allowances go to earners, not carers: Tax allowances reduce theamount of income tax a worker pays by raising his or her tax-free earningsthreshold. But there is no guarantee that principal earners who benefit fromthis reduced tax will pass the money on to their non-working partner who isactually caring for the children.
� Tax allowances are ‘regressive’ and non-refundable: Higher earners onhigher marginal income tax rates benefit more from an increased taxallowance than lower earners on lower marginal rates. Moreover, a taxallowance is only worth something if you are paying enough income tax tobenefit from it.
Let us consider each argument in turn.
Spousal tax allowances favour marriage and demeanwomenIt is clearly true by definition that the Married Couple’s Allowance (which wasworth one and a half times the value of the single person’s allowance) only bene-fited couples who were married. But provided there is no bar on couples choos-ing to marry, there is nothing inherently unfair or prejudicial about a provisionlike this, for it is a perk which is potentially available to everyone.The only excep-tion is gay couples, for they cannot get legally married. However, if spousal tax re-lief were extended to gay couples in civil partnerships, there would be nodiscrimination at all.
The real question, therefore, is not whether a spousal allowance discriminatesagainst unmarried couples, but whether there are good grounds for the state tofavour marriage in this way. As we saw in chapter 1, the evidence on child well-being suggests that there may be – at least for couples with children. Researchshows that children are generally better off if they are brought up by both natu-ral parents, and that parents are more likely to stay together if they are married. Acase can therefore be made for favouring married parents, although the argumentfor favouring married couples without dependent children (as was the case withthe Married Couples’ Allowance) seems less obvious.
It might be argued that unmarried couples who successfully stay together toraise their children, should also be favoured by tax breaks. But the problem withextending a spousal allowance to cohabitees is that tax authorities would needlegal proof of their long-term interdependence. Only couples who marry (or signcivil partnerships) have made explicit, contractual ties to each other which can beexternally verified.
44 | policyexchange.org.uk
Reforming the UK Family Tax and Benefits System
PX Tax and Family:Layout 2 17/6/09 15:11 Page 44
As for the argument that treating a spouse as a ‘dependent’ for tax purposes isdemeaning to women, and perpetuates their subordination to men, this mighthave held true when the spousal allowance was limited to husbands claiming forwives, but the Married Couples’ Allowance could be claimed by either spouse onbehalf of the other. In addition married women were not obliged to accept jointtaxation with their husband, for couples were always entitled to opt for individ-ual taxation.
Despite the unconvincing nature of this argument, by the year 2000 itprevailed within government when for the first time, all couples were forced toaccept individual taxation. Joint taxation ceased to be an option.106 Forcingcouples to be taxed individually, whether they like it or not, has encouraged more‘housewives’ to go out to work, which is precisely what proponents of this viewwanted to achieve. According to the OECD:
“Tax systems that assess tax liabilities on individual income as opposed to taxation on the basis of allhousehold income provide greater incentives for partners of already-employed people to work.”107
This is because in an individualised system there is no tax advantage to be lost if ahitherto dependent partner in a couple takes up employment.108
The people who lost out as a result of this change were married couples whoprefer to have one partner stay home and raise their children while the otherearns an income – in other words, traditional nuclear families. Scrapping theMarried Couples’Allowance meant the stay-at-home partner in these families waseffectively stripped of his or her right to transfer their tax-free income allowanceto their partner. The impact of this on family budgets has been considerable.In January 2007, the Institute of Fiscal Studies calculated that as a result of our in-dividualised tax system, a family on an income of £30,000 per year paid £100.66tax each week if the money were all earned by one of them while the other stayedhome, but paid only £74.40 per week (£37.20 each) in tax if they both went outto work and each earned £15,000.109 Viewed as a family unit (which is how thewelfare system would see them), this is clearly unfair, for families on the same in-come, with the same per capita needs, are being taxed by different amounts andare therefore ending up with very different net incomes.
Traditional families, where the husband goes out to work while the wife raisesthe children at home, have been losing out as a result of changes in the tax systemever since the 1970s:
� A single person with no dependents earning the average wage pays roughlythe same proportion of her/his earnings in tax today as 40 years ago.
� One-earner married couples, however, are today paying a lot more tax thanthey did 40 years ago, and although the new tax credits have compensatedthose on the lowest incomes, those on average earnings are paying more thantwice as much tax (net of tax credits) as they did in the 1960s.110
Child tax allowances go to earners, not carersThere is a broad consensus among those who study family policy that cash pay-ments to the principal carer (usually the mother) are more likely to be spent in
policyexchange.org.uk | 45
Tax Allowances for Dependents
106 Patricia Morgan points to the
irony that, under recent changes
to parental leave, a mother can
now transfer part of her mater-
nity leave entitlement to the fa-
ther, yet is not entitled to transfer
her tax-free allowance to him.
From the point of view of the gov-
ernment, therefore, “It is appro-
priate for fathers to mind babies,
but not support families”, Family
policy, family changes, 2006,
p.111 .
107 OECD, Babies and Bosses
(2007), p.83-4. Also Jaumotte F
(2003), p.25.
108 Economists argue this results
in less distortion of behaviour and
greater ‘tax efficiency’ – for a re-
view and evaluation of this litera-
ture see Kleven HJ and Kreiner CT
(2004), A revised efficiency princi-
ple for the taxation of couples,
University of Copenhagen.
Whether this greater incentive to
work actually results in more mar-
ried women working under indi-
vidual-based tax regimes is,
however, debatable. Irene Din-
gledey (in ‘European tax systems
and their impact on family em-
ployment patterns’, Journal of So-
cial Policy vol.30, 2001,
pp.653-72) claims there is no evi-
dence that individual taxation
raises female workforce participa-
tion rates while tax splitting re-
duces them, for women’s
participation rates depend on a
complex combination of different
factors.
109 Brewer M (2007), ‘Supporting
couples with children through the
tax system’ in Robert Chote and
others, The IFS Green Budget, In-
stitute for Fiscal Studies, January
2007, p.224.
110 Draper D and Beighton L
(2008), Taxation of married fami-
lies.
PX Tax and Family:Layout 2 17/6/09 15:11 Page 45

ways that benefit children than tax allowances to the principal earner (usually thefather).111 This was one of the key reasons why child tax allowances were replacedby Child Benefit in the late 1970s, and politicians of all parties now seem con-
vinced there is no good reason forbringing them back again.
When he was Chancellor in 1991,for example, Norman Lamont ruled outany return to child tax allowances onthe grounds that cash benefits are “abetter way of directing help straightinto the pockets of mothers”.112
Similarly, in 1998 David Willetts MP,then Shadow Secretary of State forSocial Security argued that while mostfathers share their earnings with their
family, some fail to pass on tax savings to their partners and children, and to over-come this, state aid should be paid directly to mothers – to “the purse” ratherthan “the wallet”.113 Introducing the new Child Tax Credit (paid to mothers) in2003, Gordon Brown repeated the same argument:
“It is right that all children’s benefits go direct to the mother who often buys the food, purchasesthe kids’ clothes and knows the child’s needs best.”114
Research conducted by the UK government in 2003 found strong public supportfor these views (although the survey focused solely on family benefits and neverexplicitly asked about tax concessions). Asked whether benefits aimed at childrenshould go to the mother or the father, 65% opted for the mother, 34% thought itmade no difference, and only 1% thought they should go to the father. Reinforc-ing this, 70% thought the mother was most likely to use this money for the ben-efit of the children (only 2% thought the father was), and 57% said women arebetter than men at looking after day-to-day household finances.115
Despite apparently strong public support for paying money directly to the carer,we saw earlier that there is precious little evidence on how government moneyflowing to families actually gets spent, and there is no clear evidence that chil-dren’s wellbeing is improved by all these cash benefits. We also saw that, eventhough Child Benefit is paid directly to mothers, much of it does not get spent onthe children, but on adults (although mothers understandably tend to deny thiswhen asked in surveys how they spend the money).116
Having said that, we do know that in many families (particularly more ‘tradi-tional’ ones), money is not regarded as ‘fungible’ (i.e. money is reserved fordifferent kinds of purposes depending on which partner brings it in, and itssource).117 Husbands’ earnings are often spent on transport, holidays and savings,while wives’ money is more commonly spent on day-to-day household items.When times are hard, both fathers and mothers tend to sacrifice their own needsso their children will not go without, but women sacrifice around 1½ times morethan men do.
Research has also found that government payments are more likely thanpersonal earnings to be regarded as a common resource of the whole household:
46 | policyexchange.org.uk
111 For example: Sleebos J
(2003), ‘Low fertility rates in
OECD countries’, OECD Labour
Market and Social Policy Occa-
sional Papers No.15, p.37-8.
112 Budget speech 1991, quoted
in Bennett with Dornan (2006).
113 Willetts D (1998), The benefit
of experience, Centre for Policy
Studies lecture, p.2.
114 HM Treasury Newsroom and
speeches, ‘Balancing work and
family life’, 14 January 2003,
www.hm-
treasury.gov.uk/press_03_03.htm.
115 HM Treasury, ‘New campaign
shows how tax credits shift from
father to mother’, 26 March 2003,
www.hm-
treasury.gov.uk/press_41_03.htm.
116 Research by Edwards, in
1981, claimed mothers spent it on
children’s clothes, general house-
hold goods and trust funds for the
children, while Foreman and Wil-
son in 1995 claimed 75% of the
money goes on items for children.
Both studies are discussed in
Waseem S (2003), ‘Household
monies and decision making’, Pol-
icy Research Paper No.23, Depart-
ment of Families, Housing,
Community Services & Indigenous
Affairs, Commonwealth Govern-
ment of Australia.
117 This and the next paragraph
draw on Waseem’s review of soci-
ological and economic research
(ibid).
“Despite apparently strong public support for
paying money directly to the carer, there is
precious little evidence on how government
money flowing to families actually gets spent, and
there is no clear evidence that children’s wellbeing
is improved by all these cash benefits”
PX Tax and Family:Layout 2 17/6/09 15:11 Page 46

in many cases, Child Benefit is seen by fathers and mothers alike as belonging tothe woman to spend as she sees fit on herself and the children. This would seemto suggest that the politicians are right: government assistance in the form of taxcuts for the principal earner are less likely to filter through to the children thancash payments made directly to the principal carer.
Some interesting econometric modelling appears to further support this.When the old family allowance and child tax allowance were replaced by ChildBenefit in the late 1970s, there was a significant increase in expenditure on chil-dren’s (and women’s) clothing in the economy as a whole.118 The researchersadmit that this may not have been triggered by the policy shift, but rather becausechildren became more focused on fashion branding during the 1980s.Nevertheless, it seems plausible that at least part of this shift in spending occurredbecause government assistance switched from tax breaks to cash payments, andfrom mainly male to mainly female recipients.
Overall, the sociological and economic evidence is suggestive, but notcompelling. Much of it dates from two or three decades ago, when gender roleswithin the family may have been more sharply demarcated than they are today,and when the ‘male breadwinner’ model of family life was more widespread thanit is now. Nevertheless, it does seem that financial support in the form of directcash payments to the mother is more likely to get spent on children than taxconcessions to the father.
This is an important consideration for policy-makers, but should it be (as it hasbecome in recent decades) an overriding one? We saw in the last chapter thatthere are other, very strong reasons for favouring the use of family tax allowances,not the least being that they are less costly to administer, and they reduce ‘churn-ing’ rather than adding to it. It might not be sensible to provide all familyassistance in the form of tax breaks, but this does not mean it should all be givenas cash benefits either.119
By scrapping tax allowances altogether in favour of benefits, governments have putall their eggs in the one basket. They have done so in an attempt to engineer a redis-tribution of income within households, by taking more tax from adults (often men)who earn, and giving more benefits to adults (mainly women) who take the primaryresponsibility for raising the children. This may (as intended) have reduced thedependency of some women on their male partners, but this has only been achievedby making whole families much more dependent on government.
Tax allowances are ‘regressive’ and non-refundableBecause the income tax system is ‘progressive’ (the more you earn, the higher therate you pay on additional income), any system of allowances which reduces peo-ple’s liability to tax is necessarily ‘regressive’ (i.e. it will be worth more to higherthan lower earners).
Politicians and activists on the left have traditionally seen this as a fundamentalflaw in family tax allowances. The Child Poverty Action Group, for example,thinks that because tax breaks disproportionately favour richer families, they mustbe “unfair”.120 But the argument is misleading as it can be argued that if it is ‘fair’to tax higher earners at a higher rate, it must logically also be ‘fair’ to exemptthem at a higher rate too.
policyexchange.org.uk | 47
Tax Allowances for Dependents
118 Lundberg S, Pollak R and
Wales T (1997), ‘Do Husbands and
Wives Pool Their Resources?: Evi-
dence from the United Kingdom
Child Benefit’ in Journal of Human
Resources, Vol. 32.
119 This is the conclusion reached
by Waseem, advising the Aus-
tralian federal government:
“Overall, the review would indi-
cate that the policy of spreading
payments between the two part-
ners should continue.”
120 A Child Poverty Action Group
briefing on child benefit describes
the benefit as “fairer than child
tax allowances” because tax al-
lowances “were worth even more
to higher rate taxpayers (the bet-
ter off)” (Bennett with Dornan,
2006, section 4). Similarly, John
Hills, writing for the Child Poverty
Action Group, asserts that any re-
turn to child tax allowances would
produce “unfair results relative to
the flat-rate child benefit”
(quoted in Greener and Cracknell,
1998, p.23).
TEXT HDS:Layout 2 22/6/09 14:12 Page 47

A more serious concern is that tax allowances are not worth anything to peopleon very low incomes who do not earn enough to benefit from them. This wasthe key justification made by Barbara Castle in 1975 when she replaced child taxallowances with the new Child Benefit:
“What will the child benefit scheme achieve? First and most important the poorer familieswho have not been able to take advantage of child tax allowance in full, if at all, because of theirlow incomes, will in future do so, as the new benefit extends the cash advantage of the allowanceto all these families.”121
This was a powerful argument for reform, but switching to cash benefits was notthe only possible response to it. Rather than scrapping family tax allowances infavour of cash transfers, these allowances could have been made refundable. In otherwords, people earning more than the value of their allowance would pay less tax,while those earning less than the value of their allowance would get the balancerefunded to them as a ‘negative income tax payment’ or a ‘tax credit.’
This solution to the problem has been around for a long time – the idea of aNegative Income Tax was put forward almost 50 years ago by Milton Friedman –but for many years it was fiercely resisted by left-wing and centrist parties.122
Since 1997, however, New Labour has come to embrace refundable tax creditsas a key element in the tax and welfare system, which are in principle no differ-ent from a Negative Income Tax (although we shall see that they have beenimplemented differently in practice). In both negative income tax and a tax creditsystem, people pay tax if they earn above a certain threshold, and they are toppedup with government transfers if they earn below it.
Looking back over the last 30 years, it is ironic that a Labour governmentshould have scrapped child tax allowances in the 1970s on the grounds that theywere regressive, for ever since 1997, New Labour has been struggling to find asystem of family support which does not penalize people when they work harderand earn more. Belatedly, it has embraced the idea of refundable tax credits as away of supporting ‘working families’, yet 30 years ago, it abolished tax allowanceswhich had been supporting working families for many decades.
48 | policyexchange.org.uk
Reforming the UK Family Tax and Benefits System
121 House of Commons debate,
13 May 1975, quoted in Greener
and Cracknell (1998), p.9.
122 Friedman suggested that in
place of the existing array of wel-
fare transfers, a guaranteed basic
minimum income should be deliv-
ered through the tax system. Just
as anybody earning above the tax-
free earnings threshold pays a
given proportion of their addi-
tional income in ‘positive tax,’ so
anyone earning below it could be
topped up at a given rate with a
‘negative tax.’ (Friedman M
(1962), Capitalism and Freedom,
University of Chicago Press,
ch.12). I have discussed some of
the problems with this idea in
Saunders P (2007), The Govern-
ment Giveth and the Government
Taketh Away, Sydney: Centre for
Independent Studies.
Proposition 5Tax allowances for families have all but disappeared in the UK, but governments have rejected them
prematurely. Arguments that family tax allowances ‘unfairly’ favoured married couples, or that they ex-
pressed men’s domina9on over women, or that they ‘unfairly’ benefited more affluent families more
than poorer ones, are not compelling. Other concerns were more significant – that tax breaks may not
filter down to the children in some families, and that families on very low incomes did not get the full
benefit from them – but these worries could have been met without scrapping all allowances. Provided
tax allowances are not the sole means for delivering support to families, they should be an important
element in any family support system that seeks to promote strong, self-reliant families.
PX Tax and Family:Layout 2 17/6/09 15:11 Page 48

5What Support do Families Get?
With the eclipse of tax allowances, government financial support for UK families isnow concentrated on the universal Child Benefit and means tested tax credits. In addi-tion, working parents receive specific assistance with the cost of formal childcare andparental leave rights, and non-employed families are eligible for welfare support.
Universal Child BenefitChild Benefit is a cash payment for which all families with children up to the ageof 16 are eligible (families with young people over 16 and under 20 also qualifyif they are in an approved training scheme or full-time, non-advanced education).It is administered by the Child Benefit Office, which comes under the umbrella ofHMRC (Her Majesty’s Revenue & Customs, previously known as the Inland Rev-enue), and it costs the exchequer more than £10 billion per year.
In 2009, the benefit was worth £20.00 per week for the oldest child, and£13.20 for each subsequent child.123 This money is paid to the principal carer(usually the mother – 96% of claimants are women).124
Child benefit is not means tested – all families qualify, no matter how muchthey earn or how wealthy they are – and it does not count as taxable income.Take-up is estimated at 98%. After the retirement pension, it is the mostcommonly-received benefit in the UK, with 28% of households receiving it.125
Child benefit has its origins in the old Family Allowances which were intro-duced in Britain in 1945. A flat-rate payment was made to the mother (originallythe intention was that the money should be paid to the father, but this wasamended as the Act passed through Parliament), while the principal wage earneralso received a tax allowance for each dependent child. The weekly payment tothe mother was treated as part of the family’s taxable income, so although therewas no means test, it was worth less to those on higher marginal tax rates.Nothing was paid for the first child.126
Family allowances and child tax allowances were both replaced by Child Benefitin 1975. This was a tax-free payment and it was paid for the first, as well as subse-quent, children. The new benefit achieved three things in comparison with thesystem it replaced:127
� By capitalising child tax allowances into a cash payment, it ensured that fami-lies whose incomes had been too low to benefit from these additionalallowances would now get support;
policyexchange.org.uk | 49
123 http://www.direct.gov.uk/en
/MoneyTaxAndBenefits/TaxCred-
itsandChildBenefit/Childbene-
fits/DG_073828
124 Bennett and Dornan (2006).
125 Bennett and Dornan (2006).
126 Greener K and Cracknell R
(1998), Child Benefit, House of
Commons Library Research Paper
98/79.
127 See Barbara Castle’s speech
in the House of Commons, 13
May 1975, quoted in Greener and
Cracknell (1998), pp.8-9.
PX Tax and Family:Layout 2 17/6/09 15:11 Page 49

� By including first and only children, it boosted the incomes of 4 million fami-lies which were already drawing family allowance for their younger children,as well as another 3 million which had only one child;
� By merging a tax allowance with a cash benefit, it created a simpler, singlesystem of family support which was universal in its coverage (and was there-fore consistent with the principle of horizontal equity).
This simplicity however did not last for long. During the 1980s, the real value ofChild Benefit was allowed to fall, and the benefit was frozen for three years be-tween 1988 and 1990. The Conservative Governments were generally disinclinedto fund increases in a universal payment, which they saw as wasteful and inefficient.They preferred to target support on poorer families, which they did through theFamily Income Supplement/Family Credit (discussed below) and by means of spe-cial payments for sole parents.128
In 1991, Child Benefit was raised for the first eligible child, and ever since then,eldest children have received more than their younger siblings (the gap waswidened again in 1999).
Since Labour came to power in 1997, Child Benefit has been increased in realterms, but its significance relative to other family support measures has continuedto decline. In 1979, Child Benefit accounted for 78% of all child-contingent statesupport. It now accounts for less than half.129 As politicians’ support for univer-salism has waned, and their enthusiasm for targeting has increased, Child Benefithas gradually been eclipsed by the continued growth of means tested familypayments.130
It is easy to criticise Child Benefit. It is expensive, and large chunks of moneygo to people who do not need it. Much of the £10 billion or so that is paid outeach year is churned – families pay more tax than is necessary, and then get themoney back in the form of a Child Benefit payment they do not really need. Itwould make more sense to allow these families to retain more of their own earn-ings in return for scrapping their entitlement to this benefit.
But Child Benefit is a policy where good principles collide, so there are alsostrong arguments in its favour:131
� Key is that it recognises the principle of horizontal equity – that families withchildren should be favoured over those without at all levels of income. A flat-rate payment is not the only way this can be achieved (family tax allowancescan do it too), but Child Benefit certainly scores over targeted systems like theChild Tax Credit which phase out for more affluent parents.
� Another compelling argument is the fact that it does not disincentivise workor contribute to the poverty or unemployment traps. Because it is a universal,flat payment which does not get withdrawn as earnings rise, and because it isnot treated as part of taxable income, Child Benefit does not get clawed backby the government as soon as you put in some overtime, secure a promotionor find a part-time job.
� It is also a simple, easy-to-claim benefit which is cheap to administer (just 1.05pin the pound goes in administration costs – one-third of the cost of child taxcredits). It achieves almost 100% take-up (much better than targeted benefits)and it is paid to the principal carer, so is more likely to be spent on the children.
50 | policyexchange.org.uk
Reforming the UK Family Tax and Benefits System
128 The ‘additional child benefit’
was introduced alongside Child
Benefit in 1977 and was paid to
sole parents. In 1981 it became
One Parent benefit. See Morgan
P (2006), Family policy, family
changes, p.105.
129 Adam, Brewer, Reed (2002),
‘The benefits of parenting’.
130 Adam and Brewer (2004),
Supporting Families.
131 Greener and Cracknell (1998),
pp15-17; Bennett and Dornan
(2006), section 3.
PX Tax and Family:Layout 2 17/6/09 15:11 Page 50

If there is to be a government family payment, Child Benefit looks like a reason-able compromise. It also has widespread public support. In the 2009 Policy Ex-change-Ipsos MORI family survey, only 30% of respondents (and only 25% ofparents) thought Child Benefit should be restricted to families on lower incomes.
Benefits for working familiesIn 1971, the then Conservative government introduced Family Income Supple-ment (FIS) as a way of topping-up the earnings of low-income families with at leastone ‘full-time’ adult worker (defined as 30 hours per week, or 24 hours for soleparents).
Up until then, financial assistance for working families had been limited to theflat-rate Family Allowance payment and the Child and Married Man’s taxallowances, as it was assumed that these would be sufficient to ensure that even alow, full-time wage would stretch far enough to cover the needs of families. Theintroduction of FIS marked a change in this thinking.
FIS brought a qualitatively new element into the family support system, forunlike Family Allowance, it was means tested and limited to working families, andunlike tax allowances, it took the form of a direct government transfer payment.This policy innovation was triggered by two growing problems:132
� Evidence from poverty surveys in the 1960s suggested that child poverty wasnot limited to non-working households (as had previously been thought), butwas also affecting families where a low-wage earner was struggling to supporta spouse and several children;
� Rising levels of welfare payments and falling tax-free earnings thresholds werecombining to narrow the gap between the net incomes of low wage workingfamilies and the net incomes of families relying wholly on welfare. The resultwas that work incentives were being eroded.
FIS was therefore intended to combat ‘working poverty’ and to maintain work incen-tives. In the event, however, it created as many problems as it solved. In particular, itfailed to eliminate the‘unemployment trap’ (the situation where people could be bet-ter-off out of work and living on welfare than in-work and paying tax), and becauseit was assessed on a family’s gross income, it also created a new‘poverty trap’.
FIS was calculated at 50% of the difference between a family’s gross income and anupper limit (in 1983, this limit was £85.50 per week for a family with one child, plus£9.50 for each subsequent child up to a maximum of £22). But as a family’s incomeapproached this upper limit, they not only lost 50 pence in the pound of FIS entitle-ment, but they also lost 25 pence Income Tax, 7 pence National Insurancecontribution, and 23 pence in means tested Housing Benefit: a loss of 105p for everyadditional 100p earned. The more they earned, the more they went backwards.133
Take-up, too, was disappointing – only half of those eligible for the benefitactually claimed it (no more than 200,000 families at any one time). But fromsuch small acorns, large oak trees grow. FIS opened up a new channel of govern-ment assistance which no future government would be able to shut down again.Over the next 30 years, the number of people receiving in-work benefits roseeleven-fold.134
policyexchange.org.uk | 51
What Support do Families get?
132 Marsh A (1997), ‘Lowering
the barriers to work in Britain’ in
Social Policy Journal of New
Zealand, Issue 8.
133 Blundell R and Walker I
(2001), ‘Working families’ tax
credit: A review of the evidence,
issues and prospects for further
research’ in Inland Revenue Re-
search Report 1, Inland Revenue.
134 Morgan (2006), Family policy,
family changes, p.106.
PX Tax and Family:Layout 2 17/6/09 15:11 Page 51
In 1986, FIS was replaced by Family Credit.135 In an attempt to reduce the higheffective marginal tax rates associated with FIS, Family Credit was assessed on netrather than gross family earnings, and the taper took account of other meanstested benefits that families might be receiving, like Housing Benefit and CouncilTax Benefit. Nevertheless, the withdrawal taper was still very steep (at least 70pence in the pound) as people’s earnings rose. For families claiming HousingBenefit and/or Council Tax Benefit, every additional pound earned resulted in anet gain of only 15 pence.
Family Credit also reduced the number of hours people had to work in orderto be eligible to claim, from 30 to 24. In 1992, this hours requirement wasfurther reduced to 16 in order to attract more sole parents into part-time work.This meant the government was underwriting a full week’s wage for half a week’swork.136
Because this more generous work condition inevitably encouraged someclaimants to reduce their work commitments,137 a £10 premium was added in1995 for those working at least 30 hours per week. Later reforms also introduceda disregard for maintenance payments up to £15 per week, and an allowanceagainst childcare costs of up to £60 per week for one child, or £100 for two,which was added to the earnings threshold at which Family Credit started to bewithdrawn.
By the time the Conservatives lost office in 1997, around 700,000 people,nearly all of them women (for Family Credit was paid to the mother) were claim-ing Family Credit. 44% of them were sole parents, claimants received an averageof £55 per week and the take-up rate was around 70-80%. Most of those whofailed to claim were close to the upper earnings limit, which meant they wouldhave gained little by claiming.138
Evaluation of Family Credit suggests that, although it still suffered from a seri-ous ‘poverty trap’ due to the high taper rate, it did go some way to restoring theincentive to leave welfare and find employment. A sole parent receiving mainte-nance payments from her former partner and working just 16 hours a week wasnow 60% better off in work than if she stayed on Income Support.139 Rates ofworkforce participation rose, particularly among sole parents, as a result of thisstrengthening of rewards, but overall hours of work fell among existing employ-ees, as a result of the reduced work requirement.140
In 1999, the Blair Labour government replaced Family Credit with the WorkingFamilies’Tax Credit (WFTC). Like its predecessor, eligibility depended on work-ing a minimum of 16 hours per week, and there was an additional payment forthose who worked 30 hours or more. But WFTC was different in several signifi-cant ways:141
� First and most important, it was not paid as a cash benefit to the principalcarer, unless families specifically asked that it should be. Rather, it was a taxcredit, paid directly into the worker’s pay packet by his or her employer whowas then compensated by the tax office;
� Payments were made more generous, particularly for parents with young chil-dren. The earnings point at which the credit started to be withdrawn wasraised (from £70 to £90 per week), and the taper rate was reduced (from 70%to 55%) in order to reduce the effective marginal tax rate on claimants who
52 | policyexchange.org.uk
Reforming the UK Family Tax and Benefits System
135 The 1986 Social Security Act
made three simultaneous
changes to the welfare system. In
addition to replacing FIS with
Family Credit, it replaced Supple-
mentary Benefit with Income
Support and rent rebate with
Housing Benefit (Marsh, 1997,
‘Lowering the barriers to work in
Britain’).
136 Marsh (1997), ‘Lowering the
barriers to work in Britain’.
137 Blundell and Walker (2001).
138 Marsh (1997), ‘Lowering the
barriers to work in Britain’; Mor-
gan (2006), Family policy, family
changes, p.108
139 Marsh (1997), ‘Lowering the
barriers to work in Britain’.
140 Blundell and Walker suggest
Family Credit increased rates of
workforce participation among
sole parents while at the same
time reducing their overall hours
of work.
141 Brewer M and Browne J
(2006), The effect of the Working
Families’ Tax Credit on labour
market participation, Institute for
Fiscal Studies, Briefing Note
No.69; HM Treasury, Tax credits:
Improving delivery and choice,
May 2008.
PX Tax and Family:Layout 2 17/6/09 15:11 Page 52

increased their earnings. The result was that eligibility for assistance waspushed much higher up the income scale;
� The childcare costs disregard was replaced by a childcare tax credit, whichwas added to the WFTC and reimbursed 70% of childcare costs up to £135per week for one child and £200 for two or more (in the case of couples,both partners had to be working a minimum of 16 hours to qualify forthis).
� All child support payments received from an absent parent were disregardedin calculating eligibility for WFTC.
The introduction ofWFTC hugely increased the number of working families claim-ing the government top-up – from 786,000 families claiming Family Credit in Au-gust 1999, the numbers rose to 1,327,000 receivingWFTC in November 2002.142
More than half were sole parents.143
The new rules also increased thenumber of families getting help withtheir childcare costs – up from just32,000 who benefited from the FamilyCredit disregard, to 160,000 claimingthe new childcare tax credit.144
Because the new payment was moregenerous, as well as wider in scope, thecost to the taxpayer rose at an evenfaster rate than the number ofclaimants. In its last year of operation, 1999, Family Credit cost £2.68 billion (in2002 prices). Three years later, WFTC was costing £6.4 billion.145
The WFTC only lasted four years. In 2003, it was replaced by two new taxcredits: a Working Tax Credit (WTC) and a Child Tax Credit (CTC) (which isdiscussed separately below).
Like WFTC, the WTC is paid through the wage packet (although the ‘childcareelement’ of WTC is separated out and paid as a benefit to the principal carer).
Unlike its predecessors, however, the WTC is paid to employed or self-employed workers in low income households, even if they do not have children.It is no longer, therefore, a specifically family-oriented payment, but should ratherbe understood as an anti-poverty measure for low-wage workers, an alternative toraising the minimum wage.
Single people and childless couples qualify for WTC provided they are workingat least 30 hours per week. Sole parents and couples with children qualify if they(each) work 16 hours a week.
The payment itself comprises several different ‘elements’ (Table 11). The ‘basicelement’, worth a maximum of £1,800 pa, is supplemented by other elementsaccording to the circumstances of the claimant. For example, a sole parent orcouple qualify for another £1,770; claimants who work 30 hours get an extra£735; people over 50 who have previously been on welfare get another £1,235(or £1,840 if they work 30 hours); and so on. There is also a childcare element,which covers 80% of childcare costs up to £175 per week for one child, or £300for two or more.146 Add up all the elements which apply to you, and you find yourtotal maximum entitlement.
policyexchange.org.uk | 53
What Support do Families get?
142 Brewer, Ratcliffe, Smith
(2008), p.9.
143 Morgan (2006), p.108.
144 HM Treasury (2008), Tax cred-
its: Improving delivery and choice,
Box 7.1.
145 Brewer and Browne (2006),
p.4.
146 In the case of couples, both
must be working at least 16
hours. As we shall see later, this
rule contributes to the bias in the
tax credits system which favours
families where both parents
work.
“The introduction of WFTC hugely increased
the number of working families claiming the
government top-up – from 786,000 families
claiming Family Credit in 1999, the numbers rose
to 1,327,000 receiving WFTC in 2002”
PX Tax and Family:Layout 2 17/6/09 15:11 Page 53

How much of this entitlement you actually get depends on your income (Table 12).Eligibility forWTC disappears at a rate of 39p in the pound as incomes rise.147 In June2008, a single person without children working 30 hours per week for the minimumwage of £8,612 per annum would have received a WTC top-up of £1,685, but thiswould have tapered down to nothing at earnings just above £12,000. An equivalentchildless couple would have got a £3,455 top-up if they were earning the minimumwage, declining to zero just above £17,000 p.a. (total household income).148
For employed claimants with dependent children, the WTC is combined withthe second new tax credit created in 2003, the Child Tax Credit. As we shall see,this is paid as a cash benefit to the principal carer, not as a top-up to wages.
A claimant’s maximum entitlement is calculated by adding all appropriateelements from each of the two tax credits (seeTable 11), and the amount claimedthen depends on how much the family is earning.149 A two-child family with oneadult working 30 hours a week on the minimum wage would get a top-up of£8,175, almost doubling their gross earnings.150
As a family’s earned income rises, so the Working Tax Credit is phased out. Oncethat has been exhausted, the childcare tax credit (a separate element of WTC) startsto decline, and when that has gone, the Child Tax Credit starts to taper out (first the‘child element’ and then the ‘family element’).151 Payments do not disappear alto-gether, however, until a family is earning a household income of £58,000 per year(or £66,000 if they have a baby under 12 months old).152 This means that nine inten UK families are receiving a tax credit payment from the government.153
54 | policyexchange.org.uk
147 HM Treasury, Working tax
credit and labour supply, Treasury
Economic Working Paper No.3,
March 2008, p.38.
148 HM Revenue & Customs,
WTC2: Child tax credit and work-
ing tax credit – A guide, June
2008, p.18.
149 Non-working families are still
able to claim CTC, but do not re-
ceive WTC (or the childcare ele-
ment of WTC) – see next section.
150 Note that sole parents and
couples with children receive the
same top-up – no additional
amount is payable to cover the
living costs of partners.
151 WTC reduces by 39p in the
pound once the first income
threshold of £6,420 p.a. has been
reached. If both WTC and CTC are
being claimed, CTC reduces by
39p in the pound once all the
WTC has been exhausted (if only
CTC is claimed, it reduces at 39p
in the pound once an income
threshold of £15,575 has been
reached). Once the ‘child ele-
ment’ has been exhausted, the
‘family element’ of CTC continues
to be paid up to a second income
threshold of £50,000, at which
point it is reduced by £1 for every
extra £15 of gross earnings. See
Department of Work & Pensions,
Tax Benefit Model Tables April
2008, DWP, 2008, p.5.
152 HM Revenue & Customs
(2008), WTC2: Child tax credit and
working tax credit – A guide; HM
Treasury (2008), Tax credits: Im-
proving delivery and choice
153 HM Treasury (2008), Tax cred-
its: Improving delivery and choice,
p.22.
Table 11: Working tax credit and child tax credit ‘elements’(2007-08)
Element Value £/year
WTC
Basic 1,800
Addition for couple or sole parent 1,770
Addition if work 30+ hours 735
Addition if disabled 2,405
Addition if severely disabled 1,020
Either: Addition if 50+ returning to work 16-29 hours 1,235
Or: Addition if 50+ returning to work 30+ hours 1,840
Childcare element: 80% of actual cost up to
For one child (£175 per week)
For 2+ children (£300 per week)
CTC
Family 545
Addition for baby under 1 year 545
Addition for each child 2,085
Addition for each disabled child 2,540
Addition for each severely disabled child 1,020
Source: HM Revenue & Customs, WTC2: Child tax credit and working tax credit – A guide, June 2008.
PX Tax and Family:Layout 2 17/6/09 15:11 Page 54

Take-up of WTC in 2005-06 was only 61%, although 82% of the money wasclaimed, suggesting that most of those who were eligible but failed to claim werehigher earners who would only have been entitled to small top-ups.
In all, 2.6 million families received WTC in 2006-07. There were also 305,000childless workers claiming WTC,154 although take-up among this group is verylow, and there are thought to be about a million more eligible non-claimants.155
Some 384,000 families were also in receipt of the childcare element of WTC, andit is estimated that this number had increased to 450,000 by April 2008. Theyreceived an average of £59 each per week.156 Government spending on the childcaretax credit in 2004 was more than 16 times greater than on the childcare disregardunder the old Family Credit in 1998. Analysis suggests that, while this huge increasein government subsidies may have led some parents to shift from informal andfamily care (which does not qualify for the credit) to formal care (which does), ithas had little impact on the overall level of female workforce participation.157
Means tested child benefit: the Child Tax CreditAlthough the ChildTax Credit (CTC) is administratively integrated with theWorkingTaxCredit, it operates in a very different way and on very different principles. Indeed, despiteits name, it is not really a‘tax credit’ at all.158 In essence, it is a second Child Benefit,but onethat is means tested. As such, it represents yet another new departure in the burgeoningarray of financial support measures now offered to families by the UK government.
Back in theThatcher years, the government thought about means testing the ChildBenefit, but rejected the idea. In 2003 the Blair government resuscitated the idea ofmeans testing, but instead of applying income rules to the existing Child Benefit, itcreated a new one, and applied them to that instead. Since then, all families havereceived the same flat-rate amount in Child Benefit, on top of which most have alsoreceived varying amounts of the new payment, confusingly named‘ChildTax Credit.’
policyexchange.org.uk | 55
What Support do Families get?
154 HM Treasury (2008), Tax cred-
its: Improving delivery and choice,
p.21.
155 Mulheirn I and Pisani M
(2008), Working tax credit and
labour supply, Treasury Economic
Working Paper No.3, p.39.
156 HM Treasury (2008), Tax cred-
its: Improving delivery and choice,
p.46.
157 Brewer M (2007), Welfare re-
form in the UK: 1997-2007, Insti-
tute for Fiscal Studies, Working
Paper 20/07 p.11.
158 “The family elements of the
tax credits system, while mas-
querading as tax allowances and
rebates, remain welfare payments
in all but name”. (Kirby J (2005),
The price of parenthood, p.2).
Table 12: Annual combined value of working tax credit andchild tax credit for different household types employed 30hours per week at different levels of earnings (2007-08)
Annual income £ Single Childless One Two Threeperson couple child children children
8,612 (min wage) 1,685 3,455 6,090 8,175 10,265
10,000 1,140 2,910 5,545 7,635 9,725
12,000 360 2,130 4,765 6,855 8,945
15,000 – 960 3,595 5,685 7,775
20,000 – – 1,645 3,73 5,825
30,000 – – 545 545 1,925
40,000 – – 545 545 545
50,000 – – 545 545 545
60,000 – – – – –
Note: Figures for one, two and three child families do not include Child Benefit.
Source: HM Revenue & Customs, WTC2: Child tax credit and working tax credit – A guide, June 2008.
PX Tax and Family:Layout 2 17/6/09 15:11 Page 55

CTC is not really a tax credit because (a) it is paid as a weekly or monthly cashpayment, not as a wage supplement; (b) it is paid to the family’s principal carer,not the person earning the income; and (c) it is paid regardless of whether or notparents are employed. On all three of these criteria, it looks exactly like ChildBenefit. The only difference is that it is means tested on family income. It is paidby HMRC, but the tax office runs it in exactly the same way as the Department ofWork & Pensions administers welfare benefits.159
The government likes to maintain the fiction that CTC is a genuine tax credit,for this allows it to claim that millions of families have been taken out of tax:
“The proportion of families with children paying no net tax has risen from 34% in 1997-98to 42% in 2005-06 when NICs are excluded; the proportion of families paying no net taxincluding NICs has risen from 31% to 39%. The number of families paying net tax has fallenby around 500,000 on either basis.”160
“Four out of ten families with children now pay no net tax.”161
But claims like these are very misleading. CTC is no more a ‘negative tax’ transferthan Child Benefit is, and it should not be treated as if it were. WTC reduces theamount of tax people pay, but CTC does not. Given that WTC is the first of the so-called ‘tax credits’ to taper out as incomes rise, the great majority of families onlyreceive CTC, and they get this as a payment, not a tax reduction.As the governmentcoyly admits:
“Tax credit payable through employers is withdrawn first, so that many families with childrenreceive all their tax credits by direct payment.”162
Workers in families receiving CTC pay just as much tax as anybody else on thesame income. HMRC then hands some or all of this money back again as a cashbenefit. The introduction of CTC has not, therefore, reduced the tax burden onfamilies; it has simply increased tax-welfare churning.
When it introduced the now defunct WFTC in 1999, the government empha-sised the importance of linking tax credits to the receipt of a wage:
“A tax credit will associate the payment in the recipient’s mind with the fact of working, apotentially valuable psychological change.”163
But with the advent of CTC, this link to working has been broken. Just as theWTCis no longer a family payment (because people without children can claim it), sothe CTC is no longer a working payment (because people without jobs can claimit). The government could have achieved exactly the same impact on family in-comes simply by raising the value of the Child Benefit, and applying a generousmeans test to the top end of it.
As Table 11 shows, the CTC consists of a ‘family element’ and a ‘childelement’. Maximum CTC is payable to families with incomes below £15,575,at which point the child element begins to be withdrawn. When all the childelement has gone, CTC is paid at the flat ‘family element’ rate until householdincome exceeds £50,000, when the family element too is withdrawn at a rate
56 | policyexchange.org.uk
Reforming the UK Family Tax and Benefits System
159 Adam and Brewer (2004)
Supporting Families, p.22.
160 HM Treasury, Tax credits: Re-
forming financial support for fam-
ilies, HMSO, March 2005, p.21.
161 HM Treasury (2008), Tax cred-
its: Improving delivery and choice,
p.18.
162 HM Treasury, The child and
working tax credits, HM Treasury,
April 2002, p.35 (emphasis
added).
163 Tayler M (2002), The mod-
ernisation of Britain’s tax and
benefit system, para 1.22.
PX Tax and Family:Layout 2 17/6/09 15:11 Page 56

of £1 for every extra £15 of income. CTC eligibility finally expires altogether ata household income of £58,000. Only one in ten British families is above thiseligibility threshold.
Take-up of CTC has been quite high – 82% of eligible families claim it, and90% of the money available is claimed. Among sole parents, take-up is 95%.164
Around 6 million adults and 10 million children receive tax credit payments fromthe government.165 With one stroke of the legislative wand, the great majority ofBritain’s families have been transformed into welfare claimants.
Other assistanceIn addition to Child Benefit and tax credits, there is a scattering of one-off or in-termittent payments for which all or some families qualify. These include:
� The Sure Start maternity grant. A universal maternity grant was introducedalong with Family Allowances after World War II, but in 1987 it was meanstested. Today it is payable only to families on welfare and working families onlow incomes. It is worth £500 on the birth of a new baby;
� A ‘Health in Pregnancy Grant’, worth £190 and payable to all expectant moth-ers irrespective of income, was introduced in April 2009;
� A government-financed Child Trust Fund voucher, worth £250 at birth (£500for welfare and low income families) and another £250 (£500) at age seven,was introduced in 2003, and is paid to every child. It is put into a tax-freesavings account in the name of the child and can be cashed at age 18. The ideais that it will provide all young adults with an asset which they can use as adeposit on a house, to set up a business, or to help pay for further educationor training, but in practice there is no restriction on how this money can bespent.
Although we are concerned in this report mainly with cash support delivered di-rectly to families through the tax and benefits systems, it is also important to re-member that government delivers a lot of other assistance through other channels.Some of the most important include:
� Help with childcare costs. In addition to the childcare element of the WTC,which provides 450,000 families with a cash payment covering 80% of theirchildcare costs up to £300 per week, the government also allows parents toclaim tax relief on childcare costs by ‘salary sacrificing’ (employers whoparticipate in the scheme agree to deduct a sum for childcare payments fromemployees’ gross earnings before tax is applied). As we saw earlier, thegovernment is also spending huge sums on new Children’s Centres, whichcompete with private sector and voluntary agencies to provide pre-school carefor under-3s, and local authorities are required to offer free nursery places toall 3 and 4 year-olds, as well as providing out-of-school hours care for schoolpupils whose parents are working full-time.
� Statutory Maternity Pay and Maternity Allowance. In 2002, women were giventhe right to 6 months paid, and 6 months unpaid, maternity leave. Men weregiven 2 weeks paid paternity leave.166 The right to paid maternity leave was
policyexchange.org.uk | 57
What Support do Families get?
164 HM Treasury (2008), Tax cred-
its: Improving delivery and choice,
p.20.
165 Ibid, p.19.
166 Family & Parenting Institute,
Parenting Policy: The last 10
years, 2007, p.6.
PX Tax and Family:Layout 2 17/6/09 15:11 Page 57

extended from 6 to 9 months in 2007, and the government is committed toextending it to a full year.167 The cost is borne by employers who reclaim mostof it by reducing their National Insurance contributions. Women are paid90% of their previous salary for the first 6 weeks, then up to £133 per weekfor the next 33 weeks. Self-employed, casual and other workers not entitledto claim Statutory Maternity Pay can claim the Maternity Allowance, which isworth £133 per week for 39 weeks.168
� Welfare support for sole parents.All sole parents used to get a special payment,known as One Parent Benefit, but this was scrapped in 1998 on the groundsthat “support should be on the identifiable needs of children, not on whetherthere happens to be one parent or two”.169 Notwithstanding this principle,however, sole parents are still only expected to work 16 hours per week beforethe government tops them up to the equivalent of a full-time wage (1.1million sole parents receive more in state benefits than they earn fromwork).170 Furthermore, until recently, provided they had school-age children,sole parents had a right to live permanently on Income Support, which alsogave them access to Housing Benefit, Council Tax Benefit, free school mealsand free prescriptions and dental treatment. Under new rules, this workexemption will in future only apply to sole parents whose children are underseven years of age.171
58 | policyexchange.org.uk
Reforming the UK Family Tax and Benefits System
167 2007 Budget, Building a
Fairer Society, Section 5.30.
168 DirectGov, ‘Maternity
Pay’,http://www.direct.gov.uk/en
/Parents/Moneyandworkentitle-
ments/Parentalleaveandpay/DG_
10029290.
169 Gordon Brown, House of
Commons, March 1998, quoted in
Adam, Brewer, Reed, The benefits
of parenting, p.17.
170 58% of sole parents receive
more in benefits than they do in
earnings. This compares with
only 11% of couples. Green D, ‘If
you want welfare, work for it’,
Daily Telegraph, 2 September
2008.
171 Department for Work & Pen-
sions, In work, Better off, DWP,
CM7130, July 2007.
Proposition 6The system of tax allowances and welfare benefits for families has become very complex and very
costly. Child Benefit is a simple, administra9vely efficient payment which does not lead to poverty or
unemployment traps and which is widely understood and popular. The system of tax credits which has
grown up alongside it, as a replacement for the old family tax allowances, is, by contrast, complex,
costly and bewildering. Because tax credits are means tested, generate significant work disincen9ves,
and encompass 90% of the na9on’s families, they have expanded ‘middle class welfare’ and exacer-
bated the problem of tax-welfare churning. Since 2003, the original ra9onale for tax credits has been
lost altogether, as CTC has been uncoupled from employment. Despite its name and the claims the gov-
ernment makes about it, CTC is not a tax credit, but is a second layer, means tested, Child Benefit.
PX Tax and Family:Layout 2 17/6/09 15:11 Page 58

6Are Tax Credits Working?
Child Benefit remains an important element of state support for families, but wehave seen that it has declined in significance as measured by the proportion ofchild-contingent state spending that it absorbs. Tax credits are now at the core ofthe government’s family policy.
The government describes the philosophy that underpins its increasing relianceon tax credits as “progressive universalism”:
“The advent of the new tax credits offers the opportunity to introduce a new approach based onthe principle of progressive universalism. This means supporting all families with children, butoffering the greatest help to those who need it most through a light touch income test.”172
‘Progressive universalism’ is an oxymoron which draws attention to the income redistri-bution agenda which underlies recent changes to family policy. The‘universalism’ is pro-vided by the old child benefit; the‘progressive’ element is delivered by the new tax credits.
In addition to supporting all families with Child Benefit, family policy has beenbroadened to encompass two further objectives which are the specific objectivesof tax credits:
� Reducing child poverty;� Strengthening work incentives.
In each case, we shall see that tax credits have delivered some, but not all, of whatwas hoped for.
Have tax credits reduced child poverty?Patricia Morgan has argued that the move to tax credits marked the demise of fam-ily policy as policy emphasis has shifted away from a concern with supportingfamilies, towards a focus on redistributing incomes; away from increasing ‘hori-zontal equity’ to increasing ‘vertical equity’:
“After reaching its apogee by the mid-twentieth century, family policy in the UK is a story ofdecline and fall. By the end of the last century, it was essentially dead... Instead, the targets ofpolicies that impact on families are poverty and inequality.”173
There is some truth in Morgan’s observation. Since it was elected in 1997, NewLabour’s overriding social policy emphasis has been tackling ‘child poverty.’ On the
policyexchange.org.uk | 59
172 HM Treasury (2002), The child
and working tax credits, p.4.
173 Morgan (2006), Family policy,
family changes, p.92.
PX Tax and Family:Layout 2 17/6/09 15:11 Page 59
face of it, this seems a laudable aim which nobody could disagree with, but inpractice it has entailed a return to an old-fashioned, vertical income redistributionagenda. ‘Poverty’ has been conceptualised and measured in relative terms (thegovernment thinks you are poor if you have significantly less money than mostother people do). Reducing poverty therefore involves redistributing incomesfrom higher and middle-earning households to those towards the bottom of theincome scale. Tax credits have been central to this strategy.
60 | policyexchange.org.uk
Reforming the UK Family Tax and Benefits System
174 This section draws on a more
extensive discussion of problems
in the conceptualisation and
measurement of poverty in Saun-
ders P and Tsumori K (2002),
Poverty in Australia: Beyond the
rhetoric, Centre for Independent
Studies. I will be producing a re-
search note for Policy Exchange
on child poverty which will be
published later this year.
175 Note that, statistically, it does
not matter how far above this ar-
bitrary line they are lifted, as long
as they get above it. In many
countries, many households clus-
ter around this 60% of median in-
come mark. In these cases, it
would be possible to make a sub-
stantial impact on the poverty fig-
ures by increasing the incomes of
a large number of people by a rel-
atively trivial amount. This might
not make much difference to
their living standards, but it will
make a big difference to the coun-
try’s standing in international
poverty league tables.
176 OECD Social Policy Division,
What are equivalence scales?,
http://www.oecd.org/dataoecd/6
1/52/35411111.pdf
The problem with ‘child poverty’174
‘Poverty’ is a slippery concept. Defined in ‘absolute’ terms, it denotes a standard of living below
some basic, minimum level (e.g. an income which is insufficient to buy necessary foodstuffs, hous-
ing, clothing, and so on). Defined in ‘rela9ve’ terms, it denotes a standard of living which is consid-
ered ‘low’ compared with the average or norm enjoyed in the society as a whole.
A family may be in ‘rela9ve poverty’ yet s9ll have enough money to buy the things they need:
they are deemed ‘poor’ because they have less than others around them do. Rela9ve poverty is,
therefore, a distribu9onal phenomenon: whether or not you are poor depends on how much
money you have in comparison with what other people have.
Most academic poverty researchers in western countries focus on ‘rela9ve poverty’, not
absolute poverty, and they have influenced the way their governments address this issue. The
European Union, for example, now defines ‘poverty’ as an income below 60% of the median
income in any given country, the OECD o(en draws its poverty line at 50% of median income,
while others draw it at 50% or 60% of mean income. Whatever the varia9ons between them, these
defini9ons have two immediate consequences:
� Two families enjoying exactly the same standard of living in two different countries may be
classified differently, one as ‘poor’, the other not, depending on what the median income
happens to be in each country;
� Countries (like the Scandinavian na9ons) which have a more compressed income distribu9on as a
result of high taxes and generous welfare benefits will have much lower rela9ve ‘poverty rates’
than countries (like the ‘Anglo’ na9ons) where the income distribu9on is more spread out.
‘Poverty’ defined in this way is inseparable from ‘inequality’, and an9-poverty measures become re-
distribu9on measures under a different name. If (as in the UK since 1997) a government wants to
reduce its poverty rate, it can do it by redistribu9ng incomes in such a way that significant numbers
of people move from just below, to just above, the 60% of median income line.
If ‘poverty’ is a slippery concept, then ‘child poverty’ is even more problema9c.
When assessing whether or not people are ‘in poverty’, researchers adjust actual incomes to
take account of the number of people in their household. They refer to the result as people’s
‘equivalised income.’ Every household member (including the children) is given the same equiv-
alised income, and it is this figure that researchers use to gauge whether or not individuals fall
below the 60% of median income poverty line.175
Assessments of the number of children ‘in poverty’ will vary according to how incomes within
households are equivalised. There is no obviously ‘correct’ way of doing this, and the OECD has at
least three different equivalence scales:176
PX Tax and Family:Layout 2 17/6/09 15:11 Page 60

We saw in Table 4 (page 25) that Britain’s child poverty rate (defined as thenumber of children with an equivalised income below 50% of the median) wassignificantly higher in 2000 (16.2%) than the OECD average of 12.0%. It hadbeen even higher – above 20% – in the mid-1990s, and it had been increasingmore or less steadily ever since the 1970s.178
Britain’s record on child poverty at that time compared poorly with most otherEU countries. In France, child poverty was 7%; in Germany, 13%. TheScandinavian nations averaged only around 3%. Although the UK was not out ofline with other ‘Anglo’ countries (the US figure in 2000 was 21.6%),179 it wasaround the bottom of the EU poverty league tables, and New Labour wanted todo something about it. In March 1999, Tony Blair announced his target of halv-ing child poverty by 2010, and eradicating it by 2020.
Tax credits were to be the main vehicle for achieving this, and they would doit in two ways. First, the child tax credit would boost family incomes directly, andbecause it was means tested, it would have most of its impact on those with thelowest incomes. Secondly, the working tax credit would increase the participationof low income parents (particularly sole parents) in paid work.
It was known that the main cause of poverty is joblessness – in 1999, half ofall the children living in ‘poor’ households in the UK were in families wherenobody worked.180 Poverty in non-employed sole parent households was partic-ularly high, although unemployed couples with children also ran a high risk ofpoverty (Table 13). The OECD estimated that if Britain could reduce the number
policyexchange.org.uk | 61
Are Tax Credits Working?
177 Hirsch D (2009), Ending child
poverty in a changing economy,
Joseph Rowntree Foundation.
178 HM Treasury, Supporting chil-
dren through the tax and benefit
system, November 1999, chart 1.4.
179 Babies and Bosses (2007),
Table 1.1.
180 HM Treasury (1999), Support-
ing children through the tax and
benefit system, p.10.
� Its ‘Oxford scale’ assigns a weight of 1 to the first household member, 0.7 to each addi9onal
adult, and 0.5 to each child.
� Its ‘modified scale’ changes this to 1 for the first member, then 0.5 for each addi9onal adult
and 0.3 for each child.
� Its ‘square root scale’ simply divides total household income by the square root of the number
of people in the household.
The OECD itself warns that choice of equivalence scales depends on value judgements as well as
technical considera9ons, and that poverty es9mates will be affected by this choice. Child poverty
rates, for example, will be higher if you use a scale that gives greater weight to each addi9onal
household member, for the more children a household has, the more each members’ equivalised
income will be depressed.
Equivalising people’s incomes is a sensible and legi9mate procedure (it rests on the same princi-
ple of horizontal equity which in the past led governments to give workers with dependent families
greater tax relief than workers with no dependents). But it inevitably introduces another element
of arbitrariness into the calcula9on of poverty rates. It would be possible to develop an equiva-
lence scale which would define almost none, or almost all, of the children in a country as ‘poor.’
Claiming that 2.9 million Bri9sh children are in poverty177 therefore is almost en9rely meaningless, for
the figure derives from an arbitrary poverty line (60% of median income) and an arbitrary use of equiva-
lence scales. The sta9s9c tells us nothing about how many children are deprived or suffering hardship; nor
does it tell us anything about the quality of life these children are enjoying. All that a sta9s9c like this can
really do is give a benchmark against which changes over 9me in the distribu9on of household incomes
can be measured. In other words, it is more a statement about inequality than a statement about poverty.
PX Tax and Family:Layout 2 17/6/09 15:11 Page 61

of jobless households to Swedish levels (Sweden was the third-best OECDperformer), we could shave more than 3 percentage points off our poverty rate.181
Here, then, was the logic behind introducing a tax credit linked to employment(the WFTC, and later the WTC). The hope was that this would encourage morepeople to take up jobs, and coupled with the child tax credit, would reducepoverty by raising earned incomes as well as benefits in the poorest families.
With the new tax credits in place, the OECD has calculated that a single-earnerfamily in Britain working full-time at the minimum wage and receiving all thebenefits and tax credits to which it is entitled should end up with an equivalisedincome above 60% of the median (one earner couples get 63% of the median,and sole parents get 75%).182 Work full-time, in other words, and you should getenough income to insulate you and your family from the risk of poverty.
This is a significant achievement. The problem, however, is that many peopledo not work full-time, and many still live in families where nobody works at all.
The government’s new tax credits have helped reduce child poverty, but not by asmuch as had been hoped. The Joseph Rowntree Foundation suggests that 1.1 millionchildren will have been taken out of ‘poverty’ between 1998 and 2010 (although itwarns that many of them are hovering ‘very close’ to the poverty line, and could dropback again very easily).183 However, the same report also warns that the governmentis still going to end up 600,000 short of its target of halving child poverty by 2010.
To achieve the 2010 target, the Rowntree report suggests more income redis-tribution is needed. It wants the government to increase the value of the ChildTax Credit by £12.50 per week more than is currently planned. This would addanother £4.2 billion each year to the nation’s tax credit bill (on top of the addi-tional spending of £2 billion already announced in the 2007 and 2008 budgets)– a significant amount even before the recent economic downturn.
Eradicating child poverty is proving to be a very expensive commitment. It isalso a very frustrating one, for progress has slowed, and there are even signs weare going backwards. Most progress was made between 1998 and 2001. Afterthat, things stalled, and in 2005-06, child poverty started increasing again.184
62 | policyexchange.org.uk
Reforming the UK Family Tax and Benefits System
181 Whiteford P and Adema W
(2007), What works best in reduc-
ing child poverty?, OECD Social
Employment and Migration Work-
ing Papers No.51, Table 10.
182 Ibid, Table 11.
183 Hirsch D (2009), Ending child
poverty in a changing economy.
184 Field F and Cackett B (2007),
Welfare Isn’t Working: Child
Poverty, Reform.
Table 13: Poverty rates comparing the UK with the OECD (2000)
UK OECD average
Children 16.2 11.9
Households with children 13.6 10.3
Sole parents (employed) 20.6 19.9
Sole parents (not employed) 62.5 55.2
Couples (both employed) 3.6 4.4
Couples (one employed) 17.6 13.3
Couples (not employed) 37.4 41.5
‘Poverty’ defined as equivalised income below 60% of the median.
Source: Peter Whiteford and Willem Adema, What works best in reducing child poverty? OECD Social Employment and Migration
Working Papers No.51, 2007, Table 3.
PX Tax and Family:Layout 2 17/6/09 15:11 Page 62
The Rowntree Foundation forecasts that on current trends, far from being erad-icated, child poverty in 2020 will be back to 3.1 million, close to where it was in1997. This is why it is urging the government to increase expenditure on CTCstill further but the cost of meeting the 2020 child poverty target already looks tohave spiralled out of reach:
“In 2020, the Government would need to be spending an extra £30 billion a year in order toabolish child poverty. No one believes that anything like this sum will be forthcoming.”185
One reason why, despite the huge levels of expenditure, the government is failingin its mission to eradicate child poverty is that the number of sole parent families(a major risk factor for child poverty) is so large and growing:
� Between 1979 and 2003, the number of children in sole parent families in theUK more than doubled (from 1.4 to 3.2 million).
� Child poverty is much higher in sole parent households than elsewhere. Soleparent families make up 25% of all families with children in Britain, but theycomprise 71% of the families in the lowest income decile.186
� Poverty is high among sole parent families mainly because their work rates areso low. In the 1990s, as few as 40% of UK lone mothers were in employment,compared with about 50% in France and Germany, and over 60% in the USA,Canada, Spain, Italy, Finland and Austria.187 WFTC and WTC helped increasesole parent employment to 56% by 2005,188 but most sole parents are stilleither not in work, or employed part-time, and are not therefore workingenough hours to earn an income to take them and their children above thepoverty line.
Compared with other EU countries, we have a very high proportion of childrenliving with a sole parent (second only to Sweden), and we have the highest pro-portion of children living in sole parent families where the parent is not em-ployed.189 It follows that, no matter how much money we redistribute, we areunlikely to make a big impact on child poverty rates unless we (a) reverse thegrowth of sole parent families and/or (b) get more sole parents into full-timeemployment.
The government acknowledges there is a link between sole parenthood andlow incomes, but it treats it as contingent. According to the Department forChildren, Schools and Families:
“It is not being a sole parent itself that is problematic, but rather the relationship problems thatled to the breakdown and the financial consequences that often follow.”190
But this official line makes no sense, for what the government calls the “financialconsequences” of sole parenthood are inherent to it, and cannot be separated outfrom it.
The point is that one adult generally cannot devote sufficient labour time toearning enough money to sustain the whole family while also devoting the timethat is needed to bringing up the children. This is why there are ‘financial conse-quences.’ The only exceptions to this are:
policyexchange.org.uk | 63
Are Tax Credits Working?
185 Field F and Cackett B (2007),
Welfare Isn’t Working: Child
Poverty, p.15.
186 Cabinet Office Strategy Unit
(2008), Families in Britain: An evi-
dence paper, p.85.
187 HM Treasury (2005), Tax cred-
its: Reforming financial support
for families, Chart 2.3.
188 Gregg P, Harkness S and
Macmillan L (2006), Welfare to
work policies and child poverty,
Joseph Rowntree Foundation.
189 Bradshaw J (2005), A review
of the comparative evidence on
child poverty, Joseph Rowntree
Foundation, p.7.
190 Families in Britain: An evi-
dence paper, 2008, p.86.
PX Tax and Family:Layout 2 17/6/09 15:11 Page 63

� When the parent earns an unusually good wage (which is why sole parent-hood is generally less problematic among the professional classes than lowerdown the socio-economic scale where it is much more common);
� When the second (absent) parent funds the family with generous, regularchild support payments equivalent to the income brought in by a live-in part-ner (which is extremely rare – most sole parents receive nothing from theabsent parent).191
Because neither of these exceptions usually applies, the steady increase in the num-ber of sole parents over the last three or four decades has inevitably been matched
by a steady increase in child povertyrates.
It could be argued (as the RowntreeFoundation does) that it is the govern-ment’s job to counter this bytransferring even more money to thesefamilies. This is precisely what has beenhappening since the 1990s, for policiesfor tackling ‘child poverty’ have in prac-
tice involved policies to assist sole parents. But such a policy is treating thesymptom of the child poverty problem and not its cause, and ultimately it cannotwork.
The growth of sole parenthood is not the only factor contributing to our highrate of child poverty, but it is the single most important one. When parents breakup, or when women have a baby without a committed partner to help raise it, theysignificantly increase their children’s exposure to the risk of poverty. The moreparents who follow this path, the bigger the problem of child poverty becomes.
Politicians are generally loath to acknowledge this. It is safer to celebrate the‘diversity’ of family forms in a neutral and non-judgemental way than to admitthat the spread of sole parenthood is causing major problems. This policy ofdenial means child poverty is unlikely to be solved.
Have tax credits strengthened work incentives?It has become a norm in Britain for sole parents to stay at home until their childrenreach their teens or beyond. Many do not even look for part-time work during thisperiod.192 Half of all sole parents work full or part-time, but the other half live on In-come Support, and half of them have been on Income Support for 8 years or more.193
Table 14 shows that joblessness is much more common among sole parentsthan among couples, no matter how old their children are.
When children are under school age, almost three-quarters of sole parents donot work, yet only 7% of couples with children this age have no adult in employ-ment, and in more than four in ten couples, both parents are going out to workat this time.
Once the children start school, part-time employment among sole parents risesto 37%, but only one in five have full-time jobs, and 43% are still not working atall. Yet among couples, more than half are both employed by the time theiryoungest child reaches 5.
64 | policyexchange.org.uk
Reforming the UK Family Tax and Benefits System
191 In theory, the Child Mainte-
nance and Enforcement Commis-
sion (formerly the Child Support
Agency) ensures that parents con-
tinue to pay for their children’s
upkeep, even after the family
splits up, but in practice 2 out of 3
sole parents receive nothing from
the non-resident parent, and
some (like students and those on
low incomes) are formally ex-
empted (Social Justice Policy
Group, Breakthrough Britain, vol
1: Family Breakdown). Child
maintenance payments should lift
significant numbers of children
out of poverty – in Australia, 25%
of poor children are taken out of
poverty as a result of these pay-
ments – but in the UK the compa-
rable figure is 2.9% (Field and
Cackett, 2007, Welfare isn’t work-
ing, p.6).
192 The OECD notes that in
Britain, “benefit levels are to-
wards the upper end of the range
of OECD countries, and the bene-
fits are available without a work
test until the youngest child is a
teenager. These arrangements
reinforce expectations that moth-
ers should stay out of the labour
force on a very long term basis”
(Whiteford P and Adema W, 2007,
p.34).
193 Kirby J (2005), p.21.
“When parents break up, or when women have
a baby without a committed partner to help raise
it, they significantly increase their children’s
exposure to the risk of poverty”
PX Tax and Family:Layout 2 17/6/09 15:11 Page 64

This norm of joblessness reflects the fact that, until recently, the UK was one ofonly a handful of western countries (the others were Ireland, New Zealand andAustralia) where governments gave sole parents the right to stay on welfare with-out seeking employment until their children reached school leaving age. As theOECD notes:
“In Australia, Ireland,New Zealand and the United Kingdom, the entitlement to income supportplays a key role in explaining low employment levels. In these countries, benefit durations arenot limited and parents can receive benefits without a work test until their youngest child is ateenager. The signal being given to sole parents on income support has been that dependency isexpected. Little effort was made in the past to tell sole parents that work is desirable and bene-ficial to the family as a whole.”194
This disastrous situation has now been reformed, and those claiming benefits willin future have to look for part-time employment when their oldest child gets toseven. This is still generous by European standards, however, and the cultural legacyof the old system continues to depress the participation rate.
Britain’s sole parent employment rate is one of the lowest in the OECD. It hasimproved significantly over recent years, rising from 45.5% in 1997 to 56.5% in2006, the highest rate on record.195 Nevertheless, the UK still comparesunfavourably with most other EU countries and is a long way behind theScandinavians (in Denmark, for example, all sole parents are expected to workprovided childcare is available, and the participation rate is 80%).
The improvement in the UK’s participation rate is partly due to the strength-ening economy in the years prior to 2008, but also reflects the impact of tax
policyexchange.org.uk | 65
Are Tax Credits Working?
194 Babies and Bosses (2007),
p.87.
195 Brewer M (2007), Welfare re-
form in the UK 1997-2007, Insti-
tute for Fiscal Studies, Working
Paper 20/07.
Table 14: Employment status of couple and sole parent familieswith children at varying ages (%)
Age of youngest child
0-4 5-10 11-15 16-19 All
Couples
Self-employed 14 14 18 17 15
Both FT work 14 20 29 36 21
1 FT, 1 PT work 27 34 28 26 29
1 FT, 1 not emp 32 19 15 13 23
Only PT work 6 7 5 5 6
No work 7 5 5 3 6
Sole parents
Self-employed 1 1 3 1 2
FT work 9 19 31 49 22
PT work 19 37 31 29 29
No work 70 43 35 22 49
Source: Department for Work & Pensions, Family Resources Survey 2006-07 Table 7.10
PX Tax and Family:Layout 2 17/6/09 15:11 Page 65

credits.196 The WFTC, which ran from 1999 to 2003, is estimated to haveincreased the UK labour supply by 81,000 individuals (two-thirds of themwomen) and raised the sole parent employment rate by 5 percentage points.197
Combined with the New Deal for sole parents, the WFTC helped almost half amillion sole parents to enter employment after 1997, and reduced the number onbenefits by quarter of a million to 783,000.198
Although tax credits have prompted more sole parents to take up jobs, many ofthem full-time, they have had little net impact on overall work levels among othergroups. Eligibility for tax credits is calculated on family income, so second earn-ers in couples find that their earnings reduce the family’s entitlements. Notsurprisingly, there is a tendency among low-income couple families for thesecond earner (usually the mother) to reduce her hours in response to this, or tostop work altogether, while low income single earners (usually the father) maybe induced to increase their hours.
In every country where tax credits have been introduced, sole parent employ-ment rates have risen, but women in couples have reduced their participation inpaid work.199 In Britain, it has been calculated that WFTC slightly reduced theemployment rate of women in couples by 0.6 percentage points, while raisingthat of men in couples by 0.7 percentage points. While the overall work rate forcouples remained virtually unchanged, there was therefore some reallocation ofpaid employment between partners.200
When eligibility for tax credit support was extended in 2003 to include lowincome workers without children (who were allowed to claim the new WTC),they increased their participation rate by between 2 and 3 percentage points,although some people who were already working reduced their hours to takemore advantage of the top-up.201 As we shall see, it is an inherent feature of in-work benefits like WTC that they reduce the hours people are willing to workeven as they enhance their incentives to take up jobs.
The impact of tax credits on workforce participation has therefore been posi-tive, but patchy. Sole parents have been the big gainers, single people withoutchildren have also increased their likelihood of working, but women in coupleshave slightly reduced their participation.
66 | policyexchange.org.uk
Reforming the UK Family Tax and Benefits System
196 Babies and Bosses (2007),
p.92.
197 Brewer M, Duncan A, Shep-
hard A and Suarez MJ (2005), Did
Working Families’ Tax Credit
work?, HM Revenue & Customs.
198 Freud D (2007), Reducing De-
pendency, increasing opportunity,
Report to the Department for
Work and Pensions, HMSO.
199 Nolan P (2006), Tax relief for
breadwinners or caregivers?,
p.178.
200 Brewer M, Duncan A, Shep-
hard A and Suarez MJ (2005), Did
Working Families’ Tax Credit
work?; Brewer M and Browne J,
The effect of the Working Fami-
lies’ tax Credit on labour market
participation’.
201 Mulheirn I and Pisani M
(2008), Working tax Credit and
labour supply, Treasury Economic
Working Paper No.3.
Proposition 7Growing reliance on tax credits marks a shi( in government priori9es from suppor9ng families with
children, in accordance with the principle of horizontal equity, towards two other objec9ves: reducing
‘child poverty’ and increasing workforce par9cipa9on by adults in jobless households. These objec9ves
are linked, for child poverty is o(en a result of living in a household where no adult is employed. They
also tend to target the same kinds of households, for poverty and joblessness are both much more
common in sole parent families than in other household types. Tax credits have delivered lower child
poverty rates and higher economic par9cipa9on rates in sole parent families, but these successes have
come at the cost of significantly increased public expenditure. Couples with children have generally
gained much less from tax credits, and second earners (usually women) have been slightly disadvan-
taged by them.
PX Tax and Family:Layout 2 17/6/09 15:11 Page 66

7Problems with the New Tax andBenefits System for Families
The Government claims that tax credits have helped reduce the number of chil-dren in ‘relative poverty’ by 600,000 since 1997.202 Coupled with other measureslike increased subsidies for childcare, and stronger eligibility rules for claimingincome support, tax credits have also tempted nearly half a million sole parentsto take up part- or full-time jobs in that same period. These are substantialachievements
There is, however, a downside.The question is whether the gains that have beendelivered to sole parents and low income households are worth the price othershave had to pay.Vastly increased expenditure on tax credits has led to higher taxes.Stronger work incentives for sole parents have weakened support for single-earnercouples. And the new tax credit system has turned many previously self-reliantfamilies into welfare claimants.
CostWhen the Blair government replaced Family Credit with WFTC in 1999, it raisedthe value of payments, lowered the withdrawal rate, introduced a higher earningsdisregard and increased the childcare element. The result was more claimants, eachclaiming on average more money. The overall cost of tax credits increased (in con-stant 2002 prices) from £2.68 billion in 1998-99, to £4.81 billion in 2000-01,and reached £6.46 billion in 2002-03.203
This, however, was only the beginning. Since 2003, when WFTC was itselfsuperseded by CTC and WTC, the total cost of tax credits has spiralled. By 2007-08, £20 billion was being paid out in tax credits.204 The cost of the childcareelement alone increased fifteen-fold between 1997 and 2006.205 Almost three-quarters of the post-1997 increase in expenditure occurred after 2003.
In 2009, the government is spending £13 billion more in real terms on familycash transfers each year than it was in 1997. This is the equivalent of an extra 4pon the standard rate of income tax.206 And we have seen that another £4 billionor so will have to be committed each year if the government is serious aboutmeeting its 2010 child poverty target – funding that seems extremely unlikelygiven the current state of the public finances.
Nor are cash transfers the only aspect of government family support that hasrisen since New Labour came to power in 1997. We saw earlier that the total costof all ‘child-contingent’ government expenditure topped £22 billion in 2003, a
policyexchange.org.uk | 67
202 HM Treasury (2008), Tax cred-
its: Improving delivery and choice,
p.4.
203 Brewer M (2005), p.8.
204 Report of the Comptroller
and Auditor General, appended
to HMRC, 2007-08 Accounts, Lon-
don, Stationery Office, July 2008,
Table 1.
205 HM Treasury (2005), Tax cred-
its: reforming financial support for
families, p.44.
206 Field F and Cackett B (2007),
Welfare isn’t working, p.6.
PX Tax and Family:Layout 2 17/6/09 15:11 Page 67

real increase of 50% in six years. The government claims that by October 2007,families with children had on average gained £1,550 a year in real terms as aresult of all this increased spending since 1997, and that the poorest families were£3,350 better off.207 But if they gained, who lost?
Total income tax receipts have risen from £69 billion in 1996-97 to £147billion in 2007-08.208 At a time when inflation increased by 38%, governmentincome tax revenues more than doubled.209 This is partly due to economic growth– more workers earning more money and therefore paying more tax – but somepeople are also now paying more. If families on average have gained, childlesshouseholds (and some more affluent families) have lost out.
We have seen there is a strong case for redistributing money from people with-out children to families with children in order to increase horizontal equity.Moreover, Table 15 shows that many members of the public support what thegovernment has been doing (although people without children are significantlyless enthusiastic).
But most of the new spending since 1997 has not been directed at increasing‘horizontal equity’ between those with children and those without. It has beenaimed rather at increasing ‘vertical equity’ by redistributing cash from higher tolower income households, irrespective of their family circumstances. Much ofthis spending, in other words, is better understood as support for low incomehouseholds than support for families (even though it is presented as ‘familypolicy’). The cost has been enormous, and to rub salt into the wound, much ofthe money has been paid out to people who were not even entitled to it.
Complexity and fraudUnlike Child Benefit and the old family tax allowances, tax credits are extremelycomplicated. There are two of them – WTC and CTC – for a start. Both are madeup of a number of ‘elements’ and involve various tapers, thresholds and eligibility
68 | policyexchange.org.uk
Reforming the UK Family Tax and Benefits System
207 Bennett and Dornan (2006),
chapter 6.
208 HMRC website,
http://www.hmrc.gov.uk/stats/t_r
eceipt/table2-8.pdf.
209 http://www.statistics.gov.uk
/STATBASE/tsdataset.asp?vlnk=
229&More=Y. d
Table 15: Views of parents and non-parents regarding shifting taxbalance between families and childless workers
Over the last 10 years, people without children have paid more tax so families raising childrencan receive increased support. Do you support or oppose this policy?
Parents Non-parent Total
% % %
Support 51 42 38
Neither support nor oppose 21 17 18
Oppose 23 35 33
No opinion 5 6 6
N (weighted) = 2035. P<0.05
Source: 2009 Policy Exchange/IPSOS-MORI Family Priorities Survey
PX Tax and Family:Layout 2 17/6/09 15:11 Page 68
tests, and they both operate alongside other government welfare payments, likeIncome Support and Housing Benefit, which are administered by a completely dif-ferent department of state (DWP).
It seems unlikely that many potential claimants understand the system, andthose with the least education are often confronted with the most complicatedcalculations (for with a lower income, they become eligible for more elementsand are subject to more tapers). They have little option but to put their trust in‘experts.’
The organisation Working Families warns in its explanatory factsheet that, “Thecalculation for tax credits is very complicated”, and it suggests phoning theirhelpline to get assistance.210 Similarly, one Citizens’ Advice Bureau workerobserved: “The system is very complicated and I can’t see how anyone could navi-gate it on their own without expert advice.”211 According to the National AuditOffice, “Many have found it difficult to understand exactly how much they aredue... The administration of the new tax credits has proved complex in parts,reflecting the underlying design.”212
When tax and benefit systems become overly complex, a number of thingshappen. Bureaucracy multiplies and overhead costs increase accordingly. Peopletake advantage of the opacity of the system by trying to defraud it. And clientsend up confused about what their entitlements are and whether they havereceived too much or too little. From the point of view of the final consumer, itcan seem that the system is operating almost randomly, like a giant fruit machine,paying out here and withholding there in quite unpredictable ways.
One particular problem that has dogged the UK tax credits system from theoutset is widespread over-claiming, resulting in excess payments being made andhalf-hearted attempts by HMRC to get the money back.
The problem arises because (unlike the Earned Income Tax Credit in the USA,on which the old WFTC was loosely based), the decision was taken in Britain topay credits to families prospectively, so that they would get the financial assistanceon a regular basis as they needed it, rather than having to wait for the end of thetax year to receive a lump sum.213 For this to work, HMRC has to calculate thetotal income it expects a claimant to earn over the coming tax year. Normally, thiscalculation is based on what they earned in the previous year.
At the end of the tax year, HMRC works out whether the total amount of taxcredits a household has received accords with its entitlement based on its actualearnings, and an adjustment is made. If a family has claimed too little, it gets thebalance as a lump sum (in 2006-07, 800,000 families were found to have under-claimed a total of £525 million).214 But if a family has claimed too much (a muchmore common occurrence), then it has to repay the difference to the tax office.That, at least, is the theory.
Few families claiming benefits or low income households have ever encoun-tered a system like this. Most have never even completed a PAYE tax return, andalmost none of them keep records of their income or spending. Changes in finan-cial or personal circumstances which impact on their tax credit eligibility arecommon, and in these cases, claimants are expected to notify HMRC each timetheir circumstances change, and to “keep records of income and circumstances,and changes in these, and be aware of often quite complex rules about the report-ing of changes”.215 Unsurprisingly, many do not bother.
policyexchange.org.uk | 69
Problems with the New Tax and Benefits System for Families
210 Working Families, Tax credits
and benefits, April 2008, p.7.
211 Jay H, quoted in Boys Smith
(2006), Reforming welfare, p.71.
212 Quoted in Boys Smith (2006),
Reforming welfare, pp.75-6.
213 HM Treasury (2008), Tax cred-
its: Improving delivery and choice,
p.12.
214 Report of the Comptroller
and Auditor General, appended
to HMRC, 2007-08 Accounts, Lon-
don, Stationery Office, July 2008,
Table 9.
215 Whiteford P, Mendelson M
and Millar J (2003), Timing it
right?, Joseph Rowntree Founda-
tion, p.23.
PX Tax and Family:Layout 2 17/6/09 15:11 Page 69

According to the latest figures, a total of 5.5 million families received tax creditpayments in 2006-07, and 1.3 million of them were given more money than theyshould have been. Each of these over-paid families received, on average, £770more than it was entitled to. The total cost to the taxpayer of wrongly handingout this money was estimated at between £1.3 and £1.5 billion – about 8% of allthe money paid out that year.216
The Auditor General notes that, “Since the tax credits scheme was introduced inApril 2003 it has suffered from high levels of error and fraud.”217 HMRC thinks thatmost cases of overpayment arise through genuine error on the part of claimants,and that no more than 10% of it is the result of deliberate fraud, but this is proba-bly an under-estimate.218 It employs 1,430 staff working purely on compliance.219
More than one-third (37%) of the families who receive too much in tax cred-its under-estimate their income. Another fifth inflate their childcare costs. Aboutone in eight give the wrong information about their work or hours, and the sameproportion again fail to declare the earnings of a live-in partner.220 In 2004-05,the government paid tax credits to 200,000 more ‘sole parents’ than were actu-ally living in the UK at that time, and £305 million was paid out incorrectly intax credits to 90,000 couples who falsely claimed they were sole parents.221
In some cases, the money is clawed back, either through direct payments to thetax office, or by adjusting the following year’s tax credit award. But when HMRCdemands repayment, it can cause genuine hardship, and some claimants take yearsto pay the money back. Sometimes, it never gets returned. Between 2003 and2007, £7.3 billion of debt built up, of which only £2.7 billion has so far beenrecovered. £1 billion has been written off, and HMRC is pessimistic about another£1.8 billion.222
In recent years, overpayments have fallen somewhat (they were estimated at£2.3 billion in the first year of operation), and HMRC is committed to reducingoverpayments to no more than 5%. But it is difficult to reduce the overpaymentproblem significantly for as long as payments are based on forecasts of futureincome and circumstances. There are three inherent problems with a prospectivepayments system like this:
� Volatility: Changes in personal circumstances are common, particularlyamong low income households. A new relationship, a relationship breakdownor a change in working hours can all significantly change a householder’seligibility for tax credits. Claimants are expected to notify the tax office whensuch changes happen, but many fail to do so.
� Unpredictability: It is difficult to predict changes in future income or inexpenditure on things like childcare.
� Moral hazard: Claimants know they stand to gain higher tax credit paymentsif they under-estimate their income, and there is a temptation to artificiallydepress earnings in the period during which income is being assessed. Evenif money that is overpaid has to be paid back the following year, claimants maybe tempted to exploit the rules to get an immediate gain and deal with theconsequences later. Knowing that a certain amount of under-reported incomewill be disregarded, this incentive to over-claim becomes much greater, and ifthere is the possibility of avoiding repayment altogether, the motivation to doso is likely to become compelling.
70 | policyexchange.org.uk
Reforming the UK Family Tax and Benefits System
216 House of Commons Public
Accounts Committee, HM Rev-
enue and Customs: Tax Credits
and Income Tax, Fourteenth re-
port of 2008-09 session, 2 March
2009, London, Stationery Office,
HC311.
217 Comptroller (2008), page R2.
218 According to the House of
Commons Public Accounts Com-
mittee: “The Department’s cur-
rent definition of fraud risks
overstating the level of genuine
error and understating those
cases where claimants are setting
out to exploit the scheme” (p.6).
219 Public Accounts Committee
(2009), p.14.
220 Report of the Comptroller
(2008), Fig.8.
221 Brewer M (2007), Supporting
couples with children through the
tax system, p.225.
222 Public Accounts Committee.
See also Cooke G and Lawton K
(2008), Working out of poverty,
Institute for Public Policy Re-
search, p.53. Cooke and Lawton
suggest all debts should be writ-
ten off and a no claw back rule in-
troduced so, no matter how much
people are overpaid, HMRC never
takes it back.
PX Tax and Family:Layout 2 17/6/09 15:11 Page 70
Overpayments have become a difficult political issue for the government, butrather than solving the problem by tackling its root cause, the government hasaccommodated it through a massive increasein the annual income ‘disregard.’ A claimantcan now under-estimate his or her futureincome by up to £25,000, claim tax creditson this basis, and then keep the money whenit is discovered the following year that theyhave earned much more than they forecast.
It makes sense to have a small disregard,otherwise officials spend countless hourschasing people for small sums which involveno dishonest intent. Back in 2002, theTreasury calculated that a £2,500 disregard should be sufficient to accommodatetypical year-on-year fluctuations of income while “minimising the chances ofoverpaid tax credit”:
“A disregard for rises reduces the number of claimants who may need to have their rewardsreassessed purely because of income changes. Increasing the size of the disregard would furtherreduce the number of those who might need to have their awards reassessed. But a larger disre-gard increases the cost of the new tax credits and reduces the effective targeting of resources.”223
But in 2006-07, the disregard was raised to £25,000 – a 1000% increase! Thischange was introduced as a crude response to the problem of overpayments, andit has worked, to a degree. HMRC thinks the higher disregard has reduced over-payments by about one-third, and this change has been the main driver in the fallin overpayments in the last two years.224 But levering up the disregard treats thesymptom, not the cause, and it “makes a mockery of a supposedly accurately-tar-geted benefit”.225
The Treasury boasts that complaints and disputes about overpayments andclawbacks have fallen by one-third since this change was introduced.226 This ishardly surprising. If government stops chasing people to recover money theyshould never have been given, recipients will stop complaining.
Work disincentivesThere are two ways in which giving people government payments can underminetheir incentive to work:227
� The unemployment trap: if your total income from welfare is not muchlower than the income you can get from working, you may be deterred fromtaking a job;
� The poverty trap: if withdrawal of means tested benefits, combined withincreased income tax payments, means that you lose a large proportion of thenext pound you earn, you may be deterred from increasing work effort.
Tax credits were originally designed to tackle the unemployment trap, and in this theyhave had some success. They achieved this by increasing the income gap between
policyexchange.org.uk | 71
Problems with the New Tax and Benefits System for Families
223 HM Treasury (2002), The child
and working tax credits, p..27.
224 See Report of Comptroller
(2008), para 2.30.
225 Boys Smith (2006), p.76.
226 HM Treasury (2008), Tax cred-
its: Improving delivery and choice,
p.26.
227 HM Treasury (2005), Tax cred-
its: reforming financial support for
families, p.11.
“A claimant can now under-estimate his or her
future income by up to £25,000, claim tax credits
on this basis, and then keep the money when it is
discovered the following year that they have
earned much more than they forecast”
PX Tax and Family:Layout 2 17/6/09 15:11 Page 71

people who were working in low-wage jobs, and people living on welfare. Tax cred-its top up the wages of people in work so they end up with disposable incomes sub-stantially higher than those available to people on welfare. This should then strengthenthe incentive to leave welfare and find a job.
The size of the unemployment trap can be measured by ‘replacement rates’ whichcalculate the proportion of earned income which is replaced by welfare when some-one stops working. The higher the replacement rate, the smaller the relative rewardsfrom employment, and therefore the lower the incentive to find a job.
Table 16 shows how ‘replacement rates’ changed between 1997 and 2004 as aresult of tax and benefit changes. In 1997, a sole parent on welfare could expectto receive 71.9% of what an employed sole parent on the median wage wasgetting. This was significantly more generous than the replacement rates for oneor two-earner couples. However by 2004, this difference had more-or-less disap-peared as sole parent replacement rates fell, and those for couples rose. In theory,this gave sole parents more of an incentive to find a job but reduced the workincentive for couples to a point where the two converged.
This weakening of the unemployment trap had a downside, however, for whenyou top up people on low wages with tax credits and their earnings increase, theystart to lose additional benefits which increases the ‘poverty trap.’ Coupled withthe additional income tax and NICs they have to pay on higher earnings, workersin receipt of in-work payments can find the government taking the lion’s share ofany additional money they earn.
The extent of this problem can be measured by looking at the ‘effective marginaltax rates’ (EMTRs) that people face as their earnings increase i.e. the proportion ofthe next pound you earn that disappears in tax and in withdrawn benefits.
72 | policyexchange.org.uk
Reforming the UK Family Tax and Benefits System
Table 16: Replacement rates and effective marginal tax rates forsole parents and couples on median income, 1997 and 2004
Replacement rate Effective MTR
1997 2004 1997 2004
Sole parents 71.9 65.9 72.5 69.0
Proportion whose rate rose: 21.3% 31.2%
Proportion whose rate fell: 56.7% 46.9%
Couples with children, one earner 62.6 65.5 35.7 42.1
Proportion whose rate rose: 52.7% 45.4%
Proportion whose rate fell: 26.6% 21.0%
Couples with children, two earners 58.5 62.7 33.0 34.9
Proportion whose rate rose: 53.8% 39.4%
Proportion whose rate fell: 6.6% 10.0%
Source: Mike Brewer, ‘Welfare Reform in the UK’, Institute for Fiscal Studies Working Paper 20/07, 2007, Tables 3.1 and 3.2
PX Tax and Family:Layout 2 17/6/09 15:11 Page 72

The problem of high EMTRs has dogged the organisation of in-work benefitsever since the FIS was introduced in the 1970s. It has been compounded by (a)a long-term failure to raise personal tax-free allowances in line with earnings (soworkers now get hit by income tax deductions on a lower wage than they usedto), and (b) the evolution of a plethora of other income-tested benefits, such asHousing Benefit and Council Tax Benefit, which overlap each other and which allphase out as incomes rise.
New Labour’s tax credits reforms have tried to ease this poverty trap problemin two ways. First, the government has rationalised the way the different benefitsinteract with each other, so they do not simply sit on top of one another and allphase out together. Secondly, it has reduced the rate at which payments collec-tively are withdrawn (the so-called ‘taper’), so people can keep a bigger slice ofeach extra pound they earn.
Table 16 shows the net result of these changes. Most sole parents have gained(in 1997, a sole parent on median income lost 72.5p from the next pound theyearned, but this fell to 69p by 2004). EMTRs faced by couples have worsened,however, over the same period.
Before 1997, some workers were in the absurd situation where they becameworse off if they increased their gross earnings.We see fromTable 17 that this canno longer happen. Not only that, but nearly half a million fewer low-incomefamilies now face marginal deductions of 70 pence or more in each extra poundthey earn.228
However, as the number of people facing very high EMTRs has fallen, thenumber getting dragged into a less vicious poverty trap has grown substantially.This is because EMTRs have been reduced by making the income taper shallower.This can only be done by extending eligibility for benefits higher up the incomescale, thereby dragging more people into the payments net.
Table 17 shows that the number of people facing marginal deduction rates of70% or more has been cut from around three-quarters of a million in 1997 tojust 200,000 today, but it also reveals that the number of people facing marginaldeduction rates of 60% or more has mushroomed from around three-quarters ofa million to almost two million. The government likes to draw attention to its
policyexchange.org.uk | 73
Problems with the New Tax and Benefits System for Families
228 HM Treasury (2008), Tax cred-
its: Improving delivery and choice,
p.4.
Table 17: Number of workers facing marginal deduction rates ofover 60% in 1997-98, 2002-03 and 2008-09
Marginal deduction rate (cumalative) 1997-98 2002-03 2008-09
Over 100% 5000 – –
Over 90% 130000 45000 30000
Over 80% 300000 210000 150000
Over 70% 740000 255000 200000
Over 60% 760000 940000 1875000
Source: HM Treasury, Tax credits: Improving delivery and choice May 2008, Table 3.2
PX Tax and Family:Layout 2 17/6/09 15:11 Page 73

success in reducing very high EMTRs on low earners, but this has only beenachieved by massively increasing the number of people facing relatively highEMTRs a bit further up the income distribution. There are now 2½ times as manypeople facing effective marginal tax rates over 60% than there were in 1997.
There is a limit to what any government can achieve in reducing EMTRs. Foras long as we remain committed to a progressive income tax system (you pay ahigher rate if you earn more) and a targeted benefits system (you receive more ifyou earn less), there will always be a problem of high EMTRs at the lower end ofthe income distribution where tax cuts in and benefits taper out. Policy changesin recent years have moderated this problem, and the UK actually compares quitefavourably with many other OECD countries,229 but EMTRs remain high for manylow-income people, and many more people are now affected than was the casebefore.
Whether and how much this matters is not entirely clear. Obviously it is unde-sirable that people on low incomes should lose 60 pence or more of every extrapound they earn, but this may not necessarily deter them from increasing theirhours.230 Economists have found that the decision whether or not to enter workin the first place tends to be much more sensitive to economic rewards and penal-ties than the decision once in employment whether or not to increase hours.231
The unemployment trap, in other words, is much more pernicious than thepoverty trap, and tax credits have in this sense done more good than harm.
There are, however, other features of the tax credits system which also givecause for concern when it comes to weakening the incentive to work. The WTC,combined with the introduction of the minimum wage, now ensures that mostpeople are better off working than on welfare. But there are exceptions to this.
Many British couples rely on ‘one and a half incomes’ (normally, the manworks full time and the woman works part-time to allow her to spend time athome raising the children). But this popular household strategy has been under-mined by the new tax credits system, for second earners in low-incomehouseholds now gain little from working part-time. This is because a family’s taxcredit entitlement is assessed on its total income. If one partner starts to bring inpart-time earnings, these are then added to the existing full-time wage of theother partner, which means the family’s tax credit receipts are likely to dropsubstantially.
The result is that it can be hardly worth the second partner working at all. Itis estimated that 20,000 women and 10,000 men have given up work as a directresult of this disincentive effect in the tax credits system.232
A further problem is that the structure of tax credits appears to be limiting theamount of work sole parents do. We have seen that sole parent workforce partic-ipation rates have risen significantly since 1997, and that this partly reflects thestronger work incentives created by tax credits. However, these incentives fallaway after the minimum tax credit eligibility requirement of 16 hours per weekis reached.233 There is little incentive after that for sole parents to increase theirhours, for the taxpayer can be relied upon to top up a low, part-time wage to alevel closer to a full-time pay packet.
Many sole parents have reduced their total hours to maximise their tax creditentitlement. Research on how sole parents responded when the minimum workhours for Family Credit changed in 1992 shows that the number who found jobs
74 | policyexchange.org.uk
Reforming the UK Family Tax and Benefits System
229 In 2002, a sole parent with
two children who took a full-time
job at two-thirds the average
wage lost 58.9 pence in the
pound in income tax, NICs and re-
duced tax credit and housing ben-
efit, but the equivalent OECD
average deduction was 75.1
pence in the pound. Similarly, a
single earner couple with two
children earning two-thirds the
average wage faced an EMTR of
70.4 pence in Britain, compared
with an OECD average of 82.5
pence. Boys Smith (2006), slide
17.
230 Whether their willingness to
work is necessarily weakened as a
result is a matter of some debate.
In the USA it has been found that,
as EITC phases out, it has no ef-
fect on hours of work, even
though theory suggests it should.
It may be that many people are
unaware of the marginal deduc-
tions they are suffering, for their
total income does continue to in-
crease – see Meyer B (2008), The
US earned Income Tax Credit, its
effects and possible reforms, Insti-
tute for Labour Market Policy
Evaluation, Working Paper No.14,,
p.14.
231 Brewer M, Francesconi M,
Gregg P and Grogger J (2009), In-
work benefit reform in a cross-na-
tional perspective, p.F11.
232 Boys Smith (2006), Reforming
welfare, p.70.
233 Although there is an addi-
tional payment element if people
work for 30 hours.
PX Tax and Family:Layout 2 17/6/09 15:11 Page 74

increased, but the average hours they worked decreased. Before the change, therewas a ‘spike’ in average working hours at 24 hours per week (the old minimumentitlement level); after it, the spike moved to 16 hours (the new one). The samerule carried over into WFTC similarly depressed average working hours comparedwith the pattern that would have prevailed had the credit not been available.234
The significance of all this is that, despite the rhetoric, tax credits have notmoved large numbers of sole parents out of the welfare system. Tax credits havehelped many sole parents move into part-time jobs, but this is a long way fromachieving genuine self-reliance. In 2008, 1.1 million sole parents – 58% of thetotal – were still receiving a greater portion of their income from governmentpayments than from their own earnings (this compares with just 11% ofcouples).235 This is still mass welfare dependency (albeit moderated by supple-ments from paid work), and the 16 hours rule underpins it.
Many of these continuing problems associated with tax credits reflect the factthat they have lost their original focus and purpose. Tax credits today are beingused to deliver two quite distinct objectives which are pulling against eachother:236
� On the one hand, there is the original concern to ensure that work pays morethan welfare. This is achieved by topping up low earnings. For this to work,it is obviously necessary to limit eligibility for tax credits to people who havejobs, and to give bigger rewards to those who work more hours.
� On the other hand, there is the desire to use tax credits to raise people out ofpoverty by giving them more government money. For this to work, thegovernment has had to extend eligibility for CTC to people without jobs, andgive bigger rewards to those with lower incomes, even though they may onlybe working a few hours per week. These measures clearly undermine workincentives.
Tax credits were always meant to be linked to employment – you get a top-up ifyou work. This is what distinguished them from other welfare benefits, like IncomeSupport or Housing Benefit. But this principle has been eroded – partly by chip-ping away at the number of hours someone has to work to be eligible for a credit(reduced from 30 when FIS was introduced, to 24 in Family Credit, and then to16), and partly by making CTC available irrespective of whether somebody worksor not.
In the USA, where modern tax credits originated, the Earned IncomeTax Credit(EITC) has only ever had one objective: to increase work incentives. TheAmericans leave alleviation of poverty to the welfare system. Unlike our CTC,therefore, EITC is not paid to parents who do not work, and unlike our WTC, ithas no 16 hours rule (it tapers in as well as out, so it increases as people increasetheir hours from zero).
Because of this, theAmerican system costs much less than ours. Per head of popu-lation, the US only hands out 60% of the money the UK gives out, and where UKtax credits extend all the way up to families on £60,000 pa, the US system tapers outat an annual income of $33,995 (for one child) and $38,646 (for two). Yet despitethis lower level of spending, the EITC in the US has had a bigger impact on workforceparticipation rates than WFTC, CTC and WTC have had in the UK.237
policyexchange.org.uk | 75
Problems with the New Tax and Benefits System for Families
234 Blundell R and Walker I
(2001), Working Families Tax
Credit, p.41.
235 Green D, ‘If you want welfare,
work for it’, Sunday Times, 2 Sep-
tember 2008.
236 Boys Smith (2006); Brewer
(2007).
237 Boys Smith (2006).
PX Tax and Family:Layout 2 17/6/09 15:11 Page 75

Mike Brewer, who has probably carried out more in-depth analysis of this issuethan anybody else in Britain, leaves us in no doubt that the desire to strengthenwork incentives has been compromised in the UK by the confounding encroach-ment of an anti-poverty agenda:
“Although we have argued that there have [sic] been a set of changes to taxes and benefitsdesigned deliberately to strengthen financial work incentives, the story is more complicated thanthis for at least two reasons. First the expansion of theWFTC and the expansion in the generos-ity of tax credits that followed have generally been weakening the financial work incentives of(potential) second earners in families with children. Second, as well as increasing the generos-ity of tax credits that are conditional on work, welfare benefits for families with children and(after 2003) the child tax credit (which is not work-contingent, and is means tested with anextremely generous earnings disregard) have been increased too. In other words, the extent towhich financial work incentives have been strengthened has been compromised by theGovernment’s desire to achieve broad reductions in relative child poverty.”238
The original rationale behind tax credits – to support and reward hard-workingfamilies – has been lost, for we now have one tax credit that supports families evenif they do not work, and another that supports workers even if they have no fam-ily. This confusion can only be sorted out by disentangling family policy fromanti-poverty policy. It would be better to allow tax credits to incentivise work,which is what they were designed to do, and leave the alleviation of poverty to thewelfare system, which is where such policies have traditionally been based.
UnfairnessThe WTC and the couple penaltyWe have seen that tax credit entitlement is based on various‘elements.’ Table 11 (page54) showed thatWorkingTax Credit has a basic element of £1,800, plus an additionalelement worth £1,770 which both couples and sole parents get. A low income workerwith children and a partner thus receives exactly the same top-up as a sole parent onthe same income with the same number of children but no partner.
76 | policyexchange.org.uk
Reforming the UK Family Tax and Benefits System
238 Brewer (2007), Welfare re-
form in the UK, p.27.
Proposition 8Tax credits were originally intended to strengthen the work incen9ves of low income (and par9cularly
sole parent) families by boos9ng their take-home pay. This original ra9onale has been compromised by
using tax credits to reduce poverty – an objec9ve for which they were not intended. Giving Child Tax
Credit without a work condi9on, and increasing the generosity of payments, have both weakened work
incen9ves rather than strengthening them.
Very high Effec9ve Marginal Tax Rates (EMTRs) have been reduced in the UK, but at the expense of
trapping almost two million people in a 60%+ EMTR band. EMTRs for sole parents have been reduced,
and more sole parents are in work, but their average hours have fallen as a result of the 16 hours rule,
and most are s9ll more reliant on government payments than on their own earnings. Meanwhile,
couples with children are now discouraged from supplemen9ng a full-9me wage with part-9me earn-
ings from the second partner because of the impact this has on their tax credit receipts.
PX Tax and Family:Layout 2 17/6/09 15:11 Page 76

One in nine adults (and one in six children) lives in a couple household whereone adult is in full-time employment while the other has no paid work at all.239
They appear to be losing out:
“The tax credit system favours children who live with a sole parent rather than with bothparents. This occurs because the system expects two adults and a child to live on exactly thesame amount of money as one adult and a child.”240
Critics refer to this failure to allow for the living costs of partners in couples as the‘couple penalty’.241
The couple penalty is the product of the long-term trend in family policy that hasshifted support from couples to sole parents. Ever since the 1970s, when FamilyAllowance was replaced by Child Benefit and Family Income Supplement was intro-duced for low income earners, policy reforms have tended to benefit sole parentsmuch more than couples, and this disparity has become more marked over time.242
The official justification for this skew is that couples enjoy an ‘implicit income’ asa result of the extra time they have available for caring for their children. This is whythe childcare element ofWTC is only payable to couples if they both work at least 16hours per week. If only one of them is working, the other is presumed to be avail-able to look after the children. A single earner couple does not therefore qualify forthe WTC childcare element, even though a single earner sole parent does.243
There is, however, a logical contradiction built into the way tax credits treatsingle-earner couples. On the one hand, the stay-at-home partner is seen ascontributing to the family’s standard of living through their domestic labour. Heor she is here regarded as an ‘economic producer.’ But on the other hand, thatsame partner is ignored when it comes to assessing the family’s cost of living. Heor she is not regarded as an ‘economic consumer.’
For example: the ‘free childcare’ provided by a stay-at-home parent is taken intoaccount when calculating a family’s eligibility for the childcare element of WTCpayments. But the subsistence costs of this partner are not taken into account whencalculating that family’s basic needs. The WTC recognises the ‘free labour’ suppliedby the second partner in a couple, but does not recognise the cost of supplying it.
In chapter 4 we saw that the ‘poverty line’ for any given household varies accord-ing to its composition. The more people who have to live from a given income, thehigher that income needs to be if they are all to escape relative poverty. But the taxcredits system fails to acknowledge this. It thinks one parent with children needsexactly the same income as two parents with children.
This failure to allow for the living costs of the second adult in a couple meansthat, while tax credits have helped reduce poverty rates in sole parent families,they have achieved much less for members of two-parent families:
� Two-parent households have to earn a lot more money to raise themselvesabove the poverty line than comparable sole parent households have to earn.In 2004-05, two parents with two children had to earn £240 a week to get anet income (after tax credits and other benefits are added) of £295 – whichis just above the poverty line for a household of this composition. Yet a soleparent with two children only had to earn £76 per week to achieve a netincome of £230, taking this household above the poverty line.244
policyexchange.org.uk | 77
Problems with the New Tax and Benefits System for Families
239 Draper and Beighton (2008),
Taxation of married families, p.28.
240 O’Neill R (2005), Fiscal policy
and the family, Civitas, p.7.
241 For example: Social Justice
Policy Group, Breakthrough
Britain, p.69; Morgan P (2007),
The war between the state and
the family, p.34.
242 Adam, Brewer and Reed
(2002), The benefits of parenting.
243 Not only does the single
earner couple fail to qualify for
the WTC childcare element that
the sole parent earner gets, but
they will of course pay tax to fi-
nance the extra payment to the
sole parent.
244 Field F and Cackett B (2007),
Welfare isn’t working.
PX Tax and Family:Layout 2 17/6/09 15:11 Page 77

� A couple with two children has to work 74 hours per week at the minimumwage to clear the poverty line, but a sole parent with one child has to workonly 16 hours a week at the minimum wage to achieve a comparable.245
The results of this disparity of treatment by the tax credits system can be seenin Table 18:
� Although children’s risk of ‘poverty’ (defined here rather generously as anincome below 60% of the median) is much lower if they live in a couplefamily than in a sole parent family (23% against 50%), the former have hardlyimproved their situation since 1997 (down to 23% from 25%), whereas thelatter have seen a significant improvement (down to 50% from 64%). Thebiggest winners since 1997 appear to be sole parents and unemployedcouples. Two-parent families where one or both adults work have not gainedat all.
� If we compare sole parent families where the parent works full-time withcouples where one parent works full-time and the other stays home to care forthe children, we see that children raised by two parents are almost twice aslikely to be in poverty as those raised by sole parents (26% against 14%). Thisdisparity is at least partly due to the ‘couple penalty’ in our family tax andbenefits system.246
It has often been suggested that this ‘couple penalty’ in the tax credits system “incen-tivises sole parenthood and acts as a driver towards family breakdown”.247 For exam-ple, if a lone mother earning £10,000 pa meets a new partner earning £25,000, thecouple will be £5,473 worse off if they tell the authorities they are living together.248
78 | policyexchange.org.uk
Reforming the UK Family Tax and Benefits System
245 Morgan P (2007), The war be-
tween the state and the family,
p.72.
246 It is important to remember,
however, that such judgements
depend heavily on the way equiv-
alence scales are applied to differ-
ent kinds of households. There is
research which suggests that chil-
dren of single-earner couples may
suffer less hardship than the
poverty statistics imply, which in-
dicates that the OECD’s equiva-
lence scale may be treating them
too generously (see Brewer M,
Muriel A, Phillips D and Sibieta L,
2008, Poverty and Inequality in
the UK Institute for Fiscal Stud-
ies). Nevertheless, the fact re-
mains that it costs more to
maintain two adults and their
children than one, and this is not
being recognised in the tax credits
system.
247 Social Justice Policy Group
(2007), Breakthrough Britain, p25.
248 Green D (2009), Individualists
who cooperate, Civitas, p.43.
Table 18: Children’s risk of living in ‘relative poverty’, comparingsole parent and couple families in 1997 and 2005
% in household with equivalised income below 60% of median
1997-98 2005-6
Sole parents 64 50
In FT work 14 14
In PT work 42 30
Not employed 84 75
Couples with children 25 23
Both FT work 2 3
One FT, one PT work 6 7
One working FT 27 26
Neither employed 82 74
Relative poverty defined as 60% of median income, calculated after housing costs.
Source: Frank Field and Ben Cackett, ‘Welfare Isn’t Working’ Reform June 2007, Table 5 (based on DWP household data)
PX Tax and Family:Layout 2 17/6/09 15:11 Page 78

Patricia Morgan calculates that working couples are better off living apart than livingtogether for as long as their joint incomes do not exceed £50,000 per annum. Onlyabove that income level does the couple penalty cease to operate.249
Having said that, it is difficult to find conclusive evidence that couples really aredeterred from living together by our tax credits system. There is evidence thatwomen married to low-income men are more likely to get divorced as a result ofWFTC.250 But an overview of the cross-national evidence finds that, “On balance,tax credits have little or no effect on family structure.”251
Nevertheless, we saw earlier in this chapter that there is plenty of evidence thatcouples often claim to be living apart in order to maximise their entitlements.252
In less than a generation, we have gone from a system which encouraged parentsto stay together by giving married couples an additional tax allowance, to onewhich encourages them to live apart, or to pretend to live apart, by basing taxcredit entitlements on joint income while refusing to acknowledge the additionalcosts of maintaining two adults in a household rather than one.
This ‘marriage penalty’ bites hardest at the bottom of the income distribution,for it is here that parents rely most heavily on means tested benefits which areassessed on total household income. The poorer you are, and the more childrenyou have, the more you stand to lose if you get a live-in partner or get married,and the more you stand to gain if you split up.253 A working mum on the mini-mum wage would be 5%-12% better off on her own than if she stayed marriedto a minimum wage husband. Where both she and her husband are unemployed,she would be 20 to 35% better off on her own.254
Individualised income tax and single income couplesNot only are couples disadvantaged by the tax credits system, but couples withonly one earner are also penalised by the way families are assessed for income tax.
With the abolition of couple tax allowances in 2000, the UK adopted an incometax system which is radically individualised. While our system of welfare payments(including tax credits) is still based on assessment of household income, our taxsystem is now based almost entirely on assessment of people’s individual incomes.
Couples who prefer to have one parent at home looking after the childrenwhile the other goes out to work lose out in both systems. In the welfare systemthey get no tax credit payment for the extra adult, and in the tax system they getno allowance for the living costs of the non-earning partner. Just as the non-working partner is invisible when it comes to claiming WTC, so too she or he isinvisible when it comes to claiming allowances against income tax liabilities.
A family tax and benefit system which taxes people as individuals but grantsthem welfare as households generates quite perverse work incentives for single-earner couples:
� If the employed partner is earning a low income, there is little incentive forthe second partner to go out to work, for their extra earnings will result in theloss of means tested welfare benefits and tax credits at a rate of 60p in thepound or more;
� If, on the other hand, the employed partner is earning a high income, therewill be every incentive for the second partner to go out to work, for their extraearnings will be taxed individually, without regard to their partner’s earnings.
policyexchange.org.uk | 79
Problems with the New Tax and Benefits System for Families
249 Morgan P (2007), The war be-
tween the state and the family,
p.73.
250 Fracesconi M, Rainer H and
van der Klaauw W (2007), The ef-
fects of in-work benefit reform in
Britain on couples, University of
Essex.
251 Brewer M, Francesconi M,
Gregg P and Grogger J (2009), In-
work benefit reform in a cross-na-
tional perspective, p.F12.
252 Brewer (2007), Supporting
couples with children through the
tax system, p.224.
253 Immervoll, Kleven, Kreiner
and Verdelin (2008), An evalua-
tion of tax-transfer treatment of
married couples in European
countries, p.22.
254 O’Neill E (2005), Fiscal Policy
and the Family, p.14.
PX Tax and Family:Layout 2 17/6/09 15:11 Page 79
So our family support system deters partners in low income families from supple-menting the family income, even though they need more money; but it encour-ages those in high income families to work rather than stay home and look afterthe children, even though their need for additional income is less.255
Single earner couples in the UK pay much more tax than two-earner coupleswho bring in the same gross household earnings between them. In 2007, forexample, a couple with each partner earning £15,000 pa was paying a total of£74.40 per week in income tax.A single-earner couple with exactly the same totalearnings of £30,000 pa was, by contrast, paying £100.66 tax per week.256
OECD figures show this tax disparity between one- and two-earner couples ishigher in the UK than in any other country.257 The UK tax system ‘stands out’ ascontaining the strongest bias of any OECD nation against single-earner couples.258
For most people in Britain, the tax burden is no heavier than it would be if theywere living anywhere else in the EU, but for a one-earner married couple with chil-dren on the average wage, income tax is 25% higher in the UK than in the rest ofthe EU (it is 40% higher than in the OECD). Across the OECD, one-earner coupleson an average wage pay about half as much tax as single people on the same income,but in the UK they pay three-quarters as much, even after Child Benefit and taxcredit receipts are taken into account.259 And things have been getting worse, fortheir tax burden has increased by 13% in real terms since 2001.260
It is true that, if couples were taxed jointly, many second earners (particularlyin more affluent households) would face higher EMTRs than they do in ourcurrent, individually-based system, for their marginal tax rate would be pushedup by the earnings of their partner.261 However, we shall see in chapter 9 thatmodifying our individually-based system need not necessarily mean switching toa couple-based one, for couples could be given the choice of whether to be taxedseparately or jointly.
Dependency cultureWe have seen that recent family policy reforms have hugely increased the level ofstate spending and at the same time have significantly extended the number ofpeople claiming state benefits.
In 1997 there were 5.4 million people of working age on benefits, plus731,000 people receiving Family Credit – a total of 6.1 million. By 2008, not
80 | policyexchange.org.uk
Reforming the UK Family Tax and Benefits System
255 As the OECD notes: “While
second earner participation in the
UK is strongly discouraged in low-
income families, it is encouraged
in higher income families due to
the individual income tax” – Im-
mervoll, Kleven, Kreiner and
Verdelin (2008), An evaluation of
the tax-transfer treatment of mar-
ried couples in European coun-
tries, p.10.
256 Brewer (2007), Supporting
couples with children through the
tax system, p.224.
257 With a total household in-
come worth 133% of the average
wage, a couple with two children
where only one parent works was
in 2003 paying 19.4% of its earn-
ings in tax. This fell to 12.9% if
the earnings were divided 100/33
between the two parents (i.e. the
‘one and a half’ worker model),
and to 8.5% if the earnings were
evenly split between both parents
67/67. See Babies and Bosses
(2007), Table 4.5.
258 “The UK system stands out by
being much more favourable to
second-earner participation than
all other countries” – Immervoll,
Kleven, Kreiner and Verdelin
(2008), An evaluation of tax-
transfer treatment of married
couples in European countries,
p.7.
259 Draper and Beighton (2008),
Taxation of married families, p.8.
260 Ibid, p.8.
261 Immervoll H and Barber D
(2005), Can parents afford to
work?, OECD Social, Employment
and Migration Working Papers
No.31, p.31. The authors go on to
qualify this, noting that second
earners in high-taxing, individu-
ally-based systems (such as in
Scandinavia) are often worse off
than those in lower-taxing, cou-
ple-based systems (such as the
United States, Spain, or even
France).
Proposition 9The UK has one of the most individualised personal tax systems in the OECD, but eligibility for welfare
payments (including tax credits) is s9ll assessed on household earnings. The perverse result is that fami-
lies on low incomes are generally be:er-off if the parents split up than if they live together. There is also
a specific bias against single-earner couples with children. These couples are disadvantaged in the tax
system because, unlike dual earner couples, they cannot claim an allowance for the non-working part-
ner. They are also disadvantaged in the tax credit system which refuses to acknowledge the living costs
of the non-working partner (even though it takes their labour into account when assessing eligibility for
the childcare tax credit).
PX Tax and Family:Layout 2 17/6/09 15:11 Page 80
counting people who were only claiming Child Tax Credit, this total had grownto 7.3 million (5.2 million on benefits plus 2.1 million on WTC).262
When we add in CTC claimants, we find there are now approaching 6 millionpeople claiming tax credits in addition to the millions more on Income Support,Job Seekers’ Allowance and other working-age payments. Two-thirds of tax creditrecipients only claim CTC, either because they are not working, so are ineligiblefor WTC, or because they are working and are earning too much to qualify forWTC top-ups. Three-quarters of tax credit claimants are in work, and one-thirdof them have incomes over £30,000 per annum. It is estimated that 33% of alltax credit expenditure is spent on the richest half of the population, and that only18% is spent on the poorest quintile.263
Almost half a million families also get the childcare tax credit, which is a sepa-rate element of WTC.264 Most of them are in the middle of the incomedistribution, too, for you have to be employed to qualify for this credit, and mostpoor families are not working: “The vast majority of families that are entitled arenot in poverty, and many are in the top half of the income distribution of fami-lies.”265
Some people think it does not matter that so many middle income familieshave now been locked into claiming what are essentially welfare benefits. Someeven think it is a good thing. In 2005, for example, a group calling itself the‘Commission on Families and the Wellbeing of Children’ issued a report whichasserted:
“People on middle incomes should feel that the state is making some significant contribution tothe cost of bringing up their children...The social solidarity required to sustain adequate protec-tion for the worst-off children is strengthened if some significant benefit is extended to everyfamily.”266
This reasoning repays careful reading. The argument is not that middle class par-ents should get tax or welfare concessions because the wider society has an obli-gation to help with the costs of children; it is rather that middle class parents shouldbe made more dependent on the government so they will support more generouswelfare payments for the less well-off in order to safeguard and extend their ownbenefits.
This cynical argument has long been peddled in social policy circles. Left-lean-ing academics want the middle class to become more dependent on state welfare,even if they do not need help, because they think this will bind them into thesystem and give them a financial interest in maintaining and improving it. It isthought that locking the middle class into welfare strengthens their solidaritywith the poor by making them all claimants together. As one academic succinctlyexplains:
“It is the taxes of the middle classes that ultimately provide most of the revenue on which thewelfare state depends, and it is therefore necessary to give the middle class a stake in the welfaresystem by extending its benefits to them.”267
This is a recipe for spiralling welfare expenditure and extended tax-welfare churn-ing. Many tax credit recipients do not need the money, and we saw earlier that
policyexchange.org.uk | 81
Problems with the New Tax and Benefits System for Families
262 Green D (2009), Individualists
who cooperate, p.41.
263 Boys Smith (2006), Reforming
welfare, p.73.
264 HM Treasury (2008), Tax cred-
its: Improving.
265 Brewer M, Crawford C and
Dearden L (2005), ‘Helping Fami-
lies’, IFS Election Briefing Note
no.7, p.13.
266 Families and the State (2005),
pp.xix, xxv.
267 Somewhat confusingly, this
was written by an Australian aca-
demic who shares my name –
Saunders P (2002), The Ends and
Means of Welfare, Port Mel-
bourne: Cambridge University
Press, p.223. This view was origi-
nally advanced by Robert Goodin
and Julian Le Grand in Not only
the poor (Allen & Unwin 1987)
and has been enthusiastically en-
dorsed by many other social pol-
icy intellectuals ever since.
PX Tax and Family:Layout 2 17/6/09 15:11 Page 81

most are paying for their own benefits through their taxes. Their financial inde-pendence has been eroded quite unnecessarily, and they have been enmeshed in atortuously complex system which is dispensing benefits to millions of people whohave no need of them.
82 | policyexchange.org.uk
Reforming the UK Family Tax and Benefits System
Proposition 10The cost of cash transfers to families has spiralled by £13 billion in the last 12 years – the equivalent of
4p on the standard rate of income tax – yet it is es9mated that at least £4 billion more needs to be
spent each year if the government wants to meet its 2010 child poverty target. Much of the money that
is spent on tax credits is wasted. More than £1 billion is wrongly allocated or fraudulently claimed, yet
rather than back claw this money, the government has increased the income disregard, which has fur-
ther undermined the effec9veness of targe9ng. Many Child Tax Credit claimants are affluent, middle
class families who do not need welfare assistance. They have unnecessarily been turned into welfare
claimants.
PX Tax and Family:Layout 2 17/6/09 15:11 Page 82

8What Can We Learn from OtherCountries?
National differences matter. Policies that work well in one country may not havethe same effects in another. Policies operate differently in different institutionalcontexts and generate different outcomes in different cultural milieu.
Family tax and benefit policies impact very differently in high and low taxcountries, for example, and in different welfare state ‘regimes’ where notions of‘social rights’ vary quite markedly.268 Scandinavians accept levels of taxation thatmany Americans would find outra-geous, while America is prepared totolerate levels of income inequality thatmany Scandinavians regard as uncon-scionable. Such differences are boundto influence the way policy interven-tions work when applied in these twocountries. What is good for Sweden isnot good for America, and vice-versa.
Policies will also have very differenteffects in more individualistic culturesthan in more collectivistic or ‘statist’ ones. The UK, along with other liberal‘Anglo’ nations like the USA and Australia, is one of the most individualisticcultures in the world, and it is a mistake to assume that policies which evolved inmore homogenous and communal cultures (such as those in Scandinavia) wouldwork well here.269
Policies will also generate different outcomes in strongly familistic cultures(such as those in Japan and Korea) than in countries like the UK where family tiesand responsibilities have been attenuating. Policies like subsidised childcare andgenerous parental leave that work well in countries where mothers commonlyreturn rapidly to full-time employment may work less well in countries wherewomen expect to stay home to raise their children, or (as in Britain) where theylook to combine child rearing with part-time employment.
It is therefore a mistake to trawl the world for policies that seem to have certaindesired effects, pluck them out of their context, transplant them to Britain, andexpect them to generate the same outcomes here. One of the problems withmuch of the international comparative research that gets done by OECD andothers is that it uses multivariate modelling to identify cause and effect acrossdifferent countries while rarely, if ever, taking account of the differing cultural
policyexchange.org.uk | 83
268 Goran Esping-Andersen.
269 Saunders P (2001), ‘Australia
is not Sweden’, Policy vol.17,
pp.29-32.
“ It is a mistake to trawl the world for policies
that seem to have certain desired effects, pluck
them out of their context, transplant them to
Britain, and expect them to generate the same
outcomes here”
PX Tax and Family:Layout 2 17/6/09 15:11 Page 83

values of these countries.270 We should be cautious about acting on researchwhich compares half a dozen variables across a couple of dozen countries andthen reports statistically ‘significant’ (yet often quite small) associations betweenthem.
We can, of course, learn from what other countries do, but we should notforget that individual policies mesh with the specific socio-economic environ-ments in which they are implemented.
International trends in family policyThere are some features of family policy that most developed countries share incommon, despite the differences between them. Child benefit is one such exam-ple. Nearly all developed countries make some allowance for the cost of raisingchildren, and most have a universal child benefit paid regardless of income (the ex-ceptions in the EU are Greece, Spain and Italy, where payments are means tested).271
It seems that most countries have recognised the principle of horizontal equityand pursue it by making a flat rate contribution to all parents to help with the costof raising their children.
A second common feature is that government expenditure on family transfershas been increasing in almost every developed country in recent decades, eventhough the number of children has been falling. Higher expenditure on a smallernumber of children led to a rapid rise in spending per child in most countriesfrom 1980 onwards. In the UK, it increased by 25% in two decades, in Franceand Germany by about 70%,while in Finland, Norway, Ireland and Australia it hasmushroomed by well over 100%.272
This increased spending has a variety of different causes. Concern about fallingfertility was a key focus in many far eastern countries, where increased govern-ment spending was designed to encourage women to have more babies. In theAnglo-American nations – what Esping-Andersen calls the ‘liberal’ welfare stateregimes – the main driver was the desire to raise levels of female workforceparticipation, especially among sole parents. And as more women have enteredthe labour market, there has also been a growing concern in many countries to‘balance’ the competing pressures of home and work by increasing spending onparental leave entitlements and childcare support.
In many countries, increased government outlays on support such as childcaresubsidies and early education initiatives, coupled with attempts to strengthenwork incentives through in-work tax credits and other similar measures, havereduced the relative importance of traditional child benefits. We saw that this wasthe case in Britain, but the same thing has happened elsewhere too. In 1980, 66%of all public expenditure on family benefits and services in OECD countries wenton child benefits. By 2001, this was down to 43%.273 It is not that child benefitshave been eroded; rather that other spending programs have grown up aroundthem.
Most governments nowadays are trying to use family policies to achieve awider range of outcomes than was the case in the past. When the primaryconcern was simply to help parents meet the costs of raising their children (thehorizontal equity principle), flat rate child benefits were the main delivery mech-anism. But as governments became more ambitious in their objectives, so they
84 | policyexchange.org.uk
Reforming the UK Family Tax and Benefits System
270 This is a point made by Nobu-
taka Fukuda in a review of how
family allowances, childcare pro-
visions and parental leave entitle-
ments affect fertility rates across
countries: “Policies supporting
childbearing are implemented in
diverse contexts...It is therefore
necessary to investigate whether
or not family-friendly policies
have an influence on fertility be-
haviour in specific social condi-
tions. Most studies on
governmental policies and fertility
behaviour have hitherto em-
ployed variable-oriented – mainly
muiltivariate – quantitative analy-
sis, and thereby the covariation
between an independent and a
dependent variable is examined
with the effects of the remaining
independent variables set con-
stant. However, this method is
not suitable for investigating the
covariation between an inde-
pendent and a dependent vari-
able if the degree of the
association between these two
variables is strongly affected by
the configuration or contextuality
of the remaining independent
variables... social contexts in
which family-friendly policies are
implemented vary greatly across
industrialised countries.” (Three
worlds of protonatalism?, 2003,
pp.3-4).
271 Morgan (2006), Family policy,
Family changes, pp.84-5.
272 Gabel S and Kamerman S
(2006), ‘Investing in children’ in
Social Service Review, pp.239-63,
Table 5.
273 Ibid, p.253.
PX Tax and Family:Layout 2 17/6/09 15:11 Page 84
expanded the range of interventions. We saw in the last chapter how the Blair andBrown governments in Britain built up tax credits, not simply to supplementfamily incomes, but also to tackle child poverty and increase work incentives.They were not alone, for governments around the world have been pushingfamily policy far beyond its traditional focus on horizontal equity:
“Whereas the primary goal of family benefits at the close of the 1970s was to supplement theincome of families with children, the current goals of family policies have expanded to includebalancing work and family responsibilities; providing incentives to work; enhancing andstrengthening the development of young children; targeting help to families considered mostvulnerable due to the age of children, family size or family structure; and preparing young chil-dren for formal schooling...The goals of child and family policies in most countries remainconcentrated on improving the economic situation of children and their families, but these goalshave expanded.”274
Joint versus individual taxationAnother common theme that emerges from a review of international developmentsis the move towards individualised taxation. This has been prompted partly by theargument that women should be taxed on their own incomes without reference totheir partner’s income, and partly by a desire to increase female workforce partic-ipation.
The OECD reports that by 2003, nineteen of its member countries had sepa-rate taxation of spouses, and six more offered this option. Nevertheless, a sizeableminority of countries still had joint taxation for couples, including the UnitedStates, Germany and France.275
To conclude from this that the world has been abandoning joint taxation would,however, be misleading, for unlike the UK, most of the countries that have movedaway from joint taxation still offer a dependent spouse tax allowance to marriedcouples.276 The UK is most unusual in offering no tax allowance for a non-employedspouse or any dependent children. We share this ‘radical individualist’ position withonly a handful of other OECD countries such as Mexico, Greece and Hungary.277
Most of the nations that have moved to ‘individual taxation’ still take accountof family circumstances when assessing the tax owed by couples with children.Some do it by offering the principal earner a spousal allowance (equivalent to theUK Married Couples Allowance that was scrapped in 2000). Others do it bypermitting couples to transfer unused allowances or tax credits between eachother, so that a parent who is not employed can transfer his or her tax-free earn-ings allowance to the one who is. In Denmark and the Netherlands, for example,any part of an allowance not used by one partner can be added to the tax-freeearnings allowance of the other.278 It would therefore be more accurate to say thatthese countries have moved to ‘partially individualised’ (rather than ‘individu-alised’) tax arrangements.279
Countries which operate joint taxation systems go even further than this, ofcourse, for they treat the couple as the basic tax unit. In the USA, for example,married couples can choose to file individually or jointly. Those who file jointlyenjoy higher tax thresholds than those who file individually. There is also a percapita tax deduction for each dependent child.
policyexchange.org.uk | 85
What Can We Learn from Other Countries?
274 Ibid, pp.260-1.
275 Babies and Bosses (2007),
p.84.
276 Jaumotte F (2003), Female
labour force participation, p.8.
277 Draper and Beighton (2008),
Table 3.
278 Hansen H (2006), Documen-
tation of care packages for chil-
dren in OECD’s 2003 Tax/Ben
model, Danish National Institute
of Social Research, Social Policy
and Welfare Services Working
Paper 17; Immervoll and Barber
(2005), Can parents afford to
work?, fn.30.
279 Dingledey I (2001), ‘European
tax systems and their impact on
family employment patterns’ in
Journal of Social Policy, vol.30,
pp.653-72.
PX Tax and Family:Layout 2 17/6/09 15:11 Page 85

In Germany, the income tax liability of married couples is calculated by pool-ing their income, halving it, and applying the relevant tax rate to each part. Thecost of children is additionally recognised by applying a credit to the amount oftax owed (this tax credit is refundable, so families who do not earn enough toclaim this extra allowance against their tax receive it as a cash benefit instead).280
By adding the incomes of both partners together and halving the result, the totaltax liability in families with only one earner, or where one partner earns substan-tially more than the other, is significantly reduced. This overcomes the ‘couplebias’ associated with a radically individualist tax system like that in Britain.
We saw earlier that in the UK, a single-earner couple with total householdearnings of £30,000 pa would pay £26.26p per week (£1,369 per year) more inincome tax than a couple earning the same amount split evenly between them. Ina joint taxation system based on income-splitting, such as that in Germany, thisbias will not occur. In Germany, single-earner and dual-earner couples earningthe same total income will pay the same total amount of tax, irrespective of howthey divide their paid labour between them.
In France, tax-splitting goes even further, for it is based on the whole family,and not just the couple. Ever since the war, French social policy has recognisedand promoted the family unit as an institution in its own right.281 This is reflectedin the tax system, where total household income is divided between all familymembers, children as well as adults (children count as 0.5), before tax is applied.The resultant amount is then multiplied by the number of people in the family toarrive at the total amount owing. In this way, the tax system explicitly recognisesthat in families, incomes may be earned by just one or two members, but theyoften have to be shared among several more.
Tax creditsTax credits for working families were pioneered in the USA in 1975 with the in-troduction of the federal Earned Income Tax Credit (EITC). This initiative beganmodestly but has been expanded several times, and a number of states also nowoffer their own, complementary, programs. EITC now costs the federal governmentmore than the food stamps and TANF (welfare) programs combined.282
Since 1975, tax credits have been adopted in varying guises in eight othercountries,283 but it is in other ‘liberal,’ English-speaking countries that theyhave achieved their strongest following. Not only the UK, but Canada, Australiaand New Zealand have all implemented some sort of tax credit systemintended to boost the incomes of low-income, working families, and therebyat least partially avoid the unemployment trap. But they have done it in differ-ent ways.
USAIn the USA, EITC is part of the tax system.284 It is a refundable credit, so people withno net tax liability claim it as a benefit, and those who pay tax claim it as a rebate.In both cases, the money is claimed as a lump sum at the end of the tax year basedon declared income for that year. The over-payment problem which has plaguedBritish tax credits therefore never arises, for the tax office knows what people haveearned and tops them up accordingly.
86 | policyexchange.org.uk
Reforming the UK Family Tax and Benefits System
280 Hansen H (2005), Documen-
tation of care packages for chil-
dren in OECD’s 2003 Tax/Ben
model; O’Neill R (2005) Fiscal
policy and the family.
281 Revillard A (2006),
‘Work/family policy in France’ in
International Journal of Law, Pol-
icy and the Family vol.20, pp.133-
50. The social security system
established in 1945 guarantees
social rights to all family members
through the workforce participa-
tion of a single breadwinner, and
generous benefits (in addition to
the child allowances built into the
tax-splitting system) have been
paid ever since the war to moth-
ers staying at home and raising
several children. In the 1990s, eli-
gibility for this benefit, the Alloca-
tion Parentale d’Éducation, or
APE, was extended to those with
two children; before that, the
minimum was three. It entitles a
parent to an income of around
€500 a month for three years
after the birth of an infant. See
Laroque G and Salanié B (2004),
Fertility and financial incentives in
France, CESifo Economic Studies
vol.50, pp.423-50.
282 Brewer M (2001), Comparing
in-work benefits and the reward
to work for families with children
in the US and the UK, Fiscal Stud-
ies vol.22, pp.41-77.
283 Boys Smith (2006), Reforming
welfare.
284 What follows is based on
Meyer B (2008), The US Earned
Income Tax Credit.
PX Tax and Family:Layout 2 17/6/09 15:11 Page 86
This retrospective payments system is obviously less flexible than the Britishone, for there is no immediate adjustment when personal circumstances change.It requires people on low incomes to wait for their top-ups rather than gettinghelp immediately through their weekly pay packet (as in the case of the WTC) ortheir fortnightly bank transfer (as in the case of CTC). Yet despite these apparentdisadvantages, surveys find the great majority of American recipients prefer thingsthis way and would not want to move to a weekly or monthly based system.Indeed, recipients can apply to receive up to $1,750 of their EITC in advance eachyear, but few do.285
Another major difference between the UK and US systems is that only peoplewho are in paid work and on low incomes are eligible to claim the US tax credit.As in the UK’s WTC, childless workers can claim EITC, but the amount they get isvery small (up to $438 pa). Nearly a quarter of claimants do not have children,but they receive only 6% of all the money that is paid out.
In 2008-09, an American family with one child could claim tax credit if theirincome was below $33,995; a family with two children could earn up to$38,646. The maximum amount payable to a one-child family is $2,917 pa; forthose with two or more children it is $4,824.286 Half of all the money paid outgoes to sole parents.
In the US system there is no equivalent of Britain’s 16 hour rule. Instead,payments are phased in at 40 cents in the dollar over the first $11,790 of incomeuntil they reach a plateau of $4,716 (for those with one child, payments phase inat 34 cents in the dollar up to an income of $8,390, reaching a plateau of$2,853). The credit remains at this value until pre-tax earnings reach $15,390,when the credit is phased out at 21 cents in the dollar (16 cents for one-childfamilies).
This taper is much shallower than the one in Britain, so it generates a smallerwork disincentive. Indeed, the evidence suggests that the higher EMTR on workerswho start to lose the tax credit has virtually no effect on the number of hours theyare willing to work, even though economic theory tells us that it should.287 This maybe explained by the way EITC is paid as an end-of-year lump sum, so there is noimmediate tax credit impact from increasing (or decreasing) hours. The end-of-year tax credit appears to many recipients like an annual reward for working, andthe link between the number of hours worked in any one week, and the size of thelump sum received at the end of the tax year, appears tenuous. The EITC thus has apositive impact on the decision to participate in the labour force, but does not havemuch of a negative effect on the number of hours people work.288
Like the UK, system, however, EITC does contain a disincentive to marry orremain together as a couple, for income is assessed on a household basis and thereis no deduction for second earners.
Because it applies retrospectively, and because there are only three paymentsschedules (for those with no, one or two or more children), the EITC is muchsimpler to administer than the UK system. Even so, the full EITC rulebook is still56 pages long. It also requires all claimants to complete a tax return. Applicantscomplete a single form, which asks for details of the children living with them,and this is appended to their annual tax return. As in the UK, there is a highdegree of error in claims, most of it arising from people falsely claiming that achild resides with them when it does not.
policyexchange.org.uk | 87
What Can We Learn from Other Countries?
285 Brewer, Comparing in-work
benefits and the reward to work
for families with children in the US
and the UK, p.66.
286 IRS website,
http://www.irs.gov/individuals/ar
ticle/0,,id=150513,00.html
287 Meyer (2008), pp.13-14.
288 Brewer (2001), Comparing in-
work benefits and the reward to
work for families with children in
the US and the UK, p.66-7.
PX Tax and Family:Layout 2 17/6/09 15:11 Page 87

CanadaThe Canadians first introduced a refundable child tax credit in 1978, but the pres-ent Canada Child Tax Benefit dates from 1998. It consists of two elements: thebasic Child Tax Benefit is paid (according to household income) to some 80% ofCanadian families, and a supplement is paid to low-income families.289
The Canadian child tax benefit system is like the British CTC, in that it is paidirrespective of the employment status of the parent, and is normally paid to themother. Like the US EITC, however, it is assessed as part of the annual tax return
and is paid in arrears (although unlikethe US system, it is not paid as a singlelump sum, but is spread over the nexttax year in twelve monthly payments,by cheque or direct bank transfer).
There are no mid-year adjustmentsfor changes in household income in theCanadian system, although changes infamily circumstances (e.g. a marriage,divorce or birth of a child) are takeninto account, and these affect almost a
quarter of all claims each year. If a family’s income drops, they may be eligible foremergency social assistance payments (administered by the provinces), but thisaffects only 6% of the caseload. Everybody else must wait for the following year’sadjustment.
Despite this time lag, the system’s lack of responsiveness to changing house-hold incomes has never become a political issue in Canada, any more than it hasin the US.290 Although the UK government has fretted about the lack of respon-siveness of ‘fixed’ systems, such as those in the US and Canada where tax creditsare paid in arrears, this is not experienced as a problem in the countries wheresuch systems operate.291
AustraliaAustralia’s Family Tax Benefit comprises two different payments: ‘Part A’ is meanstested on household income and is claimed by most families, while ‘Part B’ is a flatrate payment made to single-earner families (sole parents or couples with onlyone earner) to compensate for the loss of a second tax-free earnings allowance. Asin Canada, there is no requirement that recipients have a job. FamilyTax Benefit ispaid to the principal carer (normally the mother) and can be claimed as a fort-nightly cash payment, or as an end-of-year tax adjustment. Overwhelmingly,claimants opt for the fortnightly payment, which makes it look very like any otherstate benefit.
In an attempt to reduce EMTRs, the Australian federal government in 2005reduced the income taper at the bottom end of the income scale from 30 cents to20 cents in the dollar, but it remains at 30 cents for higher income earners (whocan also face an income tax rate as high as 46.5%). As in Britain, reducing thetaper has brought more families at the top end into the system, so nine out of tenAustralian families now receive the Part A payment.292
As in Britain, Australian claimants have to forecast their income for the comingyear, and this led to major overpayment problems in the early years of the system,
88 | policyexchange.org.uk
Reforming the UK Family Tax and Benefits System
289 Whiteford P, Mendelson M
and Millar J (2003), Timing it
right? Tax credits and how to re-
spond to income changes, Joseph
Rowntree Foundation.
290 Whiteford P, Mendelson M
and Millar J (2003), Timing it
right? Tax credits and how to re-
spond to income changes, Joseph
Rowntree Foundation, p11.
291 “The Government has de-
cided that any advantages of a
fixed system would be out-
weighed by the loss of flexibility
and the delay with which income
and other changes would feed
through to awards” (HM Treasury,
Tax credits: Improving delivery
and choice, Appendix A, p.69).
292 Maley B and Saunders P, Tax
reform to make work pay, in
Saunders P (ed), Taxploitation:
The case for income tax reform,
Sydney: Centre for Independent
Studies, Sydney, 2006.
“Although the UK government has fretted about
the lack of responsiveness of ‘fixed’ systems, such as
those in the US and Canada where tax credits are
paid in arrears, this is not experienced as a problem
in the countries where such systems operate”
PX Tax and Family:Layout 2 17/6/09 15:11 Page 88

just as it did in Britain. When the tax office tried to claw these overpaymentsback, it opened up a major political issue which the government resolved bygiving every family an additional lump sum which in most cases was generousenough to cover their repayment arrears.293
This pragmatic response has now been written into the rules of the system, so aregular supplement is paid, net of end-of-year adjustments, as an annual lumpsum.294 The Australian system is in this sense a hybrid of the US and UK systems,for like the UK, it requires income to be predicted in advance and it pays fortnightlythroughout the year, but like the US system, it withholds at least part of the paymentas a lump sum paid annually in arrears after claimants’ exact income is known.
Cash versus provision in kindMost OECD countries subsidise institutional childcare in one way or another, andmost make legal provision for some form of paid maternity and/or parental leave.The ‘Anglo’ nations tend to be among the least generous providers on both counts(Australia and the US are the only countries that do not have paid maternity leave),while the Scandinavians – the countries identified in Esping-Andersen’s taxonomyas the ‘social democratic welfare regimes’ – tend to be at the forefront of both ofthese trends.295 Sweden, for example, offers heavily subsidised childcare and gen-erous leave provisions to encourage women to remain in, or return to, the work-force.296 As a result, female workforce participation rates are generally higher thanelsewhere, although they are not as high as the official statistics indicate.297
A detailed analysis of childcare and parental leave policies lies beyond the remitof this report, but it is appropriate to draw attention to two Scandinavian coun-tries – Finland and Norway – where women have the right to ‘trade in’ theirentitlement to use state-subsidised childcare in exchange for an enhanced cashallowance which enables them to stay at home to look after their own children.
In Norway, all parents with children aged between 12 and 36 months are eligi-ble for a flat-rate, tax-free monthly payment known as the ‘Cash For Care’ (CFC)payment.298 This is payable to parents who choose not to use full-time, publicly-subsidised, day care. The policy is intended to compensate parents who do notuse subsidised child care, to increase the choices available to them between workand family, and to encourage parents to spend more time at home with their chil-dren when they are very young.
Norwegian mothers have the right to one year’s paid maternity leave at 80% ofsalary, plus two more years unpaid leave after that. The CFC payment provides anadditional incentive to them to stay at home during this period to raise the childthemselves, and has proved extremely popular. About four out of every five moth-ers claim CFC, and 80% of them receive the full benefit, which means they makeno use of institutional childcare at all. It is estimated that CFC has reduced moth-ers’ labour supply to the economy by between 4 and 5% , although most mothersreturn to work when the CFC ends. It has also been found that CFC leads womento delay childbirth (so it has a negative impact on fertility rates), which increasesmarital stability by a small but statistically significant extent.
In 2003, CFC was worth €5,500 per annum, which was equivalent to about8% of average household earnings. This was roughly the cost incurred by the statein subsidising a full-time place in a childcare centre.
policyexchange.org.uk | 89
What Can We Learn from Other Countries?
293 Whiteford P, Mendelson M
and Millar J (2003), Timing it
right? Tax credits and how to re-
spond to income changes, Joseph
Rowntree Foundation.
294 HM Treasury (2008), Tax cred-
its: Improving delivery and choice.
pp.13 and 43.
295 For data on government ex-
penditure on childcare, and leave
entitlements, in different OECD
countries, see Jaumotte F (2003),
Female labour force participation,
Table 5. For a summary of inter-
national childcare provisions, see
Immervoll and Barber (2005), Can
parents afford to work?, Table A2.
296 Patricia Morgan goes so far as
to suggest that Swedish policy has
“involved the comprehensive po-
litical control of family life, where
Sweden has made just about the
most concerted attempt in history
to engineer the freedom of
women from child rearing respon-
sibilities and the demise of the
traditional family” (Family policy,
family changes, 2006, p.19).
297 Morgan reports that, on any
given day, 20% of the women who
are recorded as in paid employ-
ment are actually away from work
on paid leave. For mothers of
children under three, it is 48%
(Family policy, family changes,
2006, p.57). Similarly, Jonathon
Bradshaw confirms that “The
Nordic countries actually “hide”
some of their workless sole par-
ents by generous parental leave
arrangements” (A review of the
comparative evidence on child
poverty, Joseph Rowntree Foun-
dation, 2005, p.13).
298 Hardoy I and Schøne P
(2005), Cash for care: More work
for the stork?, Institute for Social
Research; Hardoy I and Schøne P
(2008), ‘Subsidizing stayers? Ef-
fects of a Norwegian child care re-
form on marital stability’ in
Journal of Marriage and the Fam-
ily vol.70, pp.571-84.
PX Tax and Family:Layout 2 17/6/09 15:11 Page 89

Similarly in Finland, a Homecare Leave Allowance (HLA) was introduced in the1980s for families who chose not to use state-subsidised childcare.299 In 2006,the basic allowance was worth around €300 per month for the first child, withanother €100 for each additional child under three. The municipalities then addto this as they stand to make savings when women choose not to use their child-care facilities. The average allowance is worth about 40% of average femaleearnings.
The HLA proved highly popular from the outset. As in Norway, Finnish moth-ers have a right to three years of maternity leave, and only half of all mothers withchildren under three remain working. One-third stay at home throughout the firstthree years of their child’s life.
90 | policyexchange.org.uk
Reforming the UK Family Tax and Benefits System
299 Hakim C et al (2008), Little
Britons, pp.28-9.
Proposition 10There may be lessons we can learn from other countries. Nearly all developed countries support par-
ents with a child benefit payment, although this has become less significant as spending has increased
on other family policies. The UK’s highly-individualised tax system is unusual, for most other countries
which require couples to be taxed separately s9ll allow non-employed spouses to transfer their al-
lowances to their partners, and in joint tax systems, like those in Germany and France, income-spli;ng
explicitly recognises that family incomes have to be shared among several dependents. Our tax credits
system is also dis9nc9ve, and the combina9on of no work requirement, prospec9ve payment, and
broad eligibility makes it very different from the US system on which it was originally modelled. Some
countries allow parents to cash in the value of state childcare services if they do not wish to use them,
but no such provision exists in the UK.
PX Tax and Family:Layout 2 17/6/09 15:11 Page 90

9Ten Modest Proposals
UK family policy has gone through a period of major reform and substantialupheaval. In the area of family tax credits alone, David Willetts MP calculates that,in the last 10 years, five new credits have been created (WFTC, Disabled Person’stax credit, Childcare tax credit, Children’s tax credit, and Baby tax credit), fourwere later scrapped, and two additional, new ones were then introduced (CTCandWTC).300 Similarly in childcare, “One initiative has followed another in dizzy-ing succession, without the Government even waiting for the results of its ownimpact assessments.”301
Perpetual policy revolution is a sign of bad governance. Not only does it taketime for policies to bed down, but radical change creates a heavy burden of newadministration costs, and the public gets confused as to their responsibilities andentitlements when rules and programmes keep changing.
We should, therefore, avoid the temptation to tear up the existing system offamily tax and benefits and start again with a blank sheet. We have a system of taxcredits, so we should try to make it work better rather than scrapping it. We havemoved to an individualised tax system, so we should find ways to allow fordependents within this rather than moving to a French-style joint system. Weshould try to build on what we have, and where possible, any new elementsshould only be added onto this system if they have been tried and tested, eitherhere in Britain, or overseas.
What follows, therefore, is not a radical blueprint for reform. It is, rather, a setof ten modest proposals which would help achieve the basic objectives of a pro-family fiscal and welfare policy without throwing the whole of the existingsystem into further disarray.
1. A spousal tax allowance for those who want itThe abolition of the Married Couple’s Tax Allowance in 2000 was a mistake, andthere are three good reasons for reintroducing it in some form:
� There is overwhelming evidence that children’s wellbeing is maximised whenthey are raised by the same two parents from birth to maturity. Parents aremore likely to stay together if they are married. It is therefore appropriate forthe state to signal its support for married parenthood by giving marriedcouples (and couples in civil partnerships) tax breaks that are not available tothose who do not marry.
� In the very early years of a child’s life (certainly the first 12 months, and prob-ably up to 36 months) it is desirable that it be looked after at home by one or
policyexchange.org.uk | 91
300 Quoted in Boys Smith (2006),
Reforming Welfare, p.68.
301 Hakim C et al (2008), Little
Britons, p.11.
PX Tax and Family:Layout 2 17/6/09 15:11 Page 91

both parents. But when one parent (usually the mother) stays at home to lookafter young children, she has to depend on the income generated by the otherparent (usually the father). The tax system should recognise this by reducingthe tax payable on an income which has to be shared. This is essential in anytax system committed to the principle of horizontal equity.
� Every adult (and every child too) has a right to a basic, subsistence incomebefore being taxed. When a parent stays at home, his or her right to a tax-free allowance is lost unless the allowance can be transferred to anotherfamily member who is working. This creates an unjustifiable and undesir-able inequity of tax treatment between single-earner and dual-earnercouples. This can only be rectified by allowing the stay-at-home partner totransfer some or all of their tax-free earnings allowance to the workingpartner.
Proposing that married couples and those in civil partnerships should be entitledto an additional tax allowance does not mean moving back from an individual toa joint taxation system. As we have seen, most OECD countries now have individ-ually-based taxation, but they still retain tax allowances for partners in coupleswho want to claim them. Horizontal equity can therefore be restored without re-verting to joint taxation (e.g. the income-splitting of the French or German mod-els), but it can only be done in one of two ways:
� We could allow parents the option of transferring unused personal allowancesbetween them (as in Denmark and the Netherlands);302
� We could allow one partner to claim an additional couple allowance (as inAustralia, Ireland or the USA).
The first of these options may be unnecessarily generous, for it means a singleearner could claim a double tax-free allowance, even though two adults can live to-gether more cheaply than two single people can. The basic, subsistence incomeneeded to maintain a couple is higher than that for a single person, but is not twiceas high. Introducing a couple allowance worth, say, one and a half times the sin-gle allowance (or allowing a spouse to transfer half the personal allowance, whichamounts to the same thing) therefore seems the more sensible option.
There are three crucial points to note about this proposal to reintroduce aMarried Couple’s Allowance (MCA) in revised form:
� The allowance is intended to compensate single-earner couples where onlyone allowance is being used and the other is going to waste. It would there-fore be for couples to decide whether they each wished to retain their ownpersonal allowance, or if one wanted to relinquish half of their personalallowance in order for the other to claim an enhanced couple allowance.
� The allowance would only be available to couples with dependent children.Childless married couples (and childless couples in civil partnerships)would not be eligible because there is no compelling reason why the stateshould seek to encourage childless couples to marry rather than cohabit orlive apart. There is also no reason why both partners in a childless coupleshould not earn their own income, so the horizontal equity argument does
92 | policyexchange.org.uk
Reforming the UK Family Tax and Benefits System
302 This was also proposed by
the British Conservative Party in
2007 for basic rate taxpayers with
children under six years of age –
Brewer (2007), Supporting cou-
ples with children through the tax
system, p.229.
PX Tax and Family:Layout 2 17/6/09 15:11 Page 92

not apply in this case. If a married couple is sufficiently affluent for one tostay at home all day, even though there are no children to look after, it isdifficult to see why taxpayers should be expected to provide additional assis-tance.
� The allowance would only be available to parents who share a contractuallybinding relationship of mutual obligation to each other – i.e. to those who aremarried or in civil partnerships. Couples who have no binding claim on eachother’s income cannot expect taxpayers to alleviate the costs of supporting anon-working partner.The reintroduction of the MCA would reinforce a publicnorm that, when people have children, they should make a binding commit-ment to each other as well as to their offspring.303
It has been estimated that a MCA worth half an additional single person’s allowancewould cost £1.6 billion per year in tax foregone if it were given to all marriedcouples, but this would fall to just £750 million if (as proposed) it were limitedto married couples with children.304
2. A transferable tax allowance for dependent childrenChild tax allowances were scrapped in the UK in 1975, when they were foldedinto a new and more generous Child Benefit.As with the later abolition of the Mar-ried Couple’s Allowance, this was a mistake, and should be reversed.
There were three main reasons for abolishing child tax allowances:305
� Low-income families were not benefiting from child tax allowances, for theydid not earn enough money to take advantage of them. However, now that wehave refundable tax credits to top up the earnings of these families, this argu-ment no longer holds. Tax credits can be used after child tax allowances havebeen applied to top up the incomes of families which are still below someminimum acceptable threshold.
� Tax allowances are worth more to high earners than to basic rate taxpayers.This is true but irrelevant. If it is right to levy a higher marginal rate on higherearners, then it is also right that legitimate allowances should be claimed atthe highest marginal rate.
� Child tax allowances often went to fathers when it was mothers who weremainly responsible for caring for the children. This is an important consider-ation, but (a) if both parents are working, they should be able to nominatewhich of them receives the allowance; and (b) even if child tax allowanceswent to the father, Child Benefit still goes to the mother, so carers will still havea direct payment made to them.
policyexchange.org.uk | 93
Ten Modest Proposals
303 The Conservatives have
stated their intention to reinstate
some version of the MCA for the
same reason. See Winnett R, ‘To-
ries to give tax break to married
couples’, Daily Telegraph, 23 Au-
gust 2008.
304 Social Justice Policy Group
(2007), p.71.
305 HM Treasury (2005), Tax cred-
its: Reforming financial support
for families, p.18; Building a fairer
society p.110; Greener K and
Cracknell R (1998), Child Benefit,
p.30.
Proposal 1Introduce an op9onal Married Couple’s Allowance, (MCA) worth 50% more than the single person’s al-
lowance. Married couples (and couples in civil partnerships) with dependent children could choose
whether to retain their two single allowances, or relinquish half of one while the other spouse claims
the addi9onal MCA. Couples would nominate either the husband or wife to be the MCA claimant.
Es)mated cost= £750 million per year
PX Tax and Family:Layout 2 17/6/09 15:11 Page 93

The key reason for making the change back to child tax allowances is to restoreself-reliance to more families.306 We have argued that a pound earned, retained andspent on one’s own family is far preferable to a pound given up in tax and thenchurned back in the form of a fortnightly welfare payment. Wherever possible, statefinancial support for families should involve leaving them with more of their ownmoney, rather than taxing them and then returning the cash in some other form.307
The way to do this is to take more families out of tax by raising their total tax-free earnings allowance. This is what we used to do 30 or 40 years ago by givingworkers with family responsibilities both a married couple’s and children’s taxallowances. If we did this again today, it would take some low-income workingfamilies out of the tax system while reducing the total tax burden of those onhigher incomes. This would obviate the need to top up middle-income familieswith tax credits, which are welfare payments in all but name and which shouldbe limited to those on low incomes.
Family payments (mainly tax credits) have been the main driver of the growth ofmiddle class welfare. They have also created most of the incentive problems associ-ated with the ‘poverty trap’ and high EMTRs as in-work benefits phase out. Toreverse the trend to middle class welfare, and to restore work incentives to low andmiddle income earners, it is desirable wherever possible to substitute familypayments with additional tax allowances. This would leave tax credits as a supple-mentary system aimed at boosting the incomes of low-paid working families(which was their original purpose) rather than as means tested supplements to theuniversal Child Benefit payment (which is what they have effectively become).
There are around 11.3 million children living in households in Britain whereat least one parent is earning (although not all of these parents are earningenough to pay income tax). If each of these children were given a tax-freeallowance worth half the adult allowance (£3,017), working parents on the basictax rate would end up paying about £600 less income tax each year for each oftheir children. The total cost to the Treasury would be up to £7.7 billion in taxrevenues foregone.308 Much of this would be recouped by reduced tax creditpayments (see Proposal 6, below).
3. Limit tax credits to families who work, and pay them as an annual lump sumnet of family tax allowances receivedIf working families were allowed to retain a bigger slice of their earnings, by claim-ing a married couple’s allowance and/or by claiming child tax allowances, they wouldobviously end up paying significantly less income tax than they do at the moment.We
94 | policyexchange.org.uk
Reforming the UK Family Tax and Benefits System
306 This has also been argued by
Kirby J (2005), The price of parent-
hood, p.44.
307 Saunders P (2007), The gov-
ernment giveth, and the govern-
ment taketh away, Centre for
Independent Studies; Morgan P
(2007), The war between the
state and the family.
308 The current adult tax al-
lowance is £6,035, so each child
would be eligible to claim £3,017.
At the basic 20% tax rate, this
would be worth £603 p.a. per
child (more for higher rate taxpay-
ers). According to ‘The Poverty
Site’, there are 11.3 million chil-
dren in working households (plus
1.8 million in workless house-
holds) – see www.poverty.org.uk/
18/index.shtml. There are some
23 million basic rate taxpayers
and 3.7 million higher rate taxpay-
ers (Nugent H, ‘20% increase in
higher rate taxpayers’, The Times,
30 January 2008). If we assume
that 14% of the 11.3 million chil-
dren in working families have par-
ents paying tax at the higher rate,
this means about 1.6 million
would claim 40% of £3,017 (total
cost = £1.9 billion) with the re-
maining 9.7 million claiming at
20% (total cost = £5.8 billion).
This assumes that all 9.7 million
are earning enough to pay basic
rate tax – in reality, the total cost
would be slightly less.
Proposal 2Reintroduce child tax allowances. Each dependent child should be en9tled to its own tax-free earnings
allowance worth 50% of the single adult allowance. This reflects the claim that each child makes on the
family income in order to secure its own subsistence. Because children do not work and earn this
money themselves, their tax-free allowance should be claimed on their behalf by either parent, pro-
vided they are working. In this way, more working families would achieve financial self-reliance without
needing to claim tax credit payments from the government.
Es)mated cost = £7.7 billion per year
PX Tax and Family:Layout 2 17/6/09 15:11 Page 94

might nevertheless decide that some of them still needed income top-ups, in whichcase tax credits will need to be retained. Tax credits would, however, operate on amuch more modest scale than presently, for with family tax allowances in place, farfewer working families would qualify for tax credit payments (for their income wouldbe assessed net of the value of tax allowances received), and those who did qualifywould receive smaller amounts.
Non-working families would nolonger receive tax credits, for thesystem would be refocused so that itonce again rewards only those whowork.309 This used to be the principlethat underpinned earlier tax credits:Family Income Supplement, FamilyCredit and Working Families Tax Creditwere all in-work benefits aimed at boost-ing the take-home income of poorer working families and therefore increasingthe gap between their standard of living and that achieved by comparable fami-lies who did not work. The same is also true of the US Earned Income Tax Credit,on which our system was originally modelled.
Until 2003, the various tax credit schemes operated in Britain had one, coreobjective, which was to reward work. The new system has lost sight of this objec-tive and is trying to achieve two often-incompatible things. On the one hand, itwants to strengthen incentives for families to work; on the other, it wants toreduce child poverty.
These objectives are not necessarily incompatible, for the principal cause of childpoverty is joblessness (which is often associated with sole parenthood). Strengtheningwork incentives for adults in families – particularly for sole parents, who commonlydo not work – is therefore a sensible plank in any anti-poverty strategy.
But the new Child Tax Credit is not set up to do this, because it is paid whetheryou work or not. Working Tax Credit still functions as a reward for working, butChild Tax Credit does not, and because it is means tested on household income,it is actually less generous if you do work than if you do not. Added to this itcreates marriage disincentives too, for a mother will get more CTC if she livesalone with her children than if the father lives with her.
Of course, if CTC were limited to working parents, parents in the welfaresystem would have to be given extra benefits to cover the costs of their childrenas well as themselves. The amount paid to Income Support and JSA claimants withdependent children would therefore have to be increased to make up for their lostCTC payments. This effectively means going back to 2003, when parents onwelfare received an additional ‘child element’ worth £38.50p per week for eachdependent child under the age of 18.310
The net impact of this change on the government budget will therefore be close toneutral – the saving on tax credits by taking 1.8 million non-working families out ofthe system, will be roughly matched by the increased spending on welfare benefits asa result of reinstating the child element in JSA and Income Support payments.
If the net result is more-or-less the same, why bother making the change? Theanswer is that tax credits need to be seen as an unambiguous reward for working,just as they are in the USA, rather than just another in an array of state benefits.
policyexchange.org.uk | 95
Ten Modest Proposals
309 For a similar argument, see
Boys Smith (2006), Reforming
Welfare, and Kirby J (2005), The
price of parenthood.
310 Department for Social Devel-
opment, http://www.dsdni.gov.uk
/jsa_background_information.pdf,
Annex 6, Table 1A.
“Tax credits need to be seen as an
unambiguous reward for working, just as they are
in the USA, rather than just another in an array of
state benefits”
PX Tax and Family:Layout 2 17/6/09 15:11 Page 95
Limiting them to people who work means we could get back to paying tax cred-its through the wage packet, as was the case with WFTC before 2003 (since 2003,WTC has been paid by employers who then claim it back from HMRC, but CTChas been paid as a state benefit). Alternatively, part or all of the tax credit couldbe paid (as in the US and Australia) as an end-of-year tax adjustment.
This latter option is in many respects the preferable one, for it (a) saves onadministration costs for government and employers; (b) avoids the currentoverpayment problems in the tax credits system; (c) represents a clear andtangible ‘reward for working’ each year, and (d) helps low income families tosave.
It is vital that we resolve the overpayments problem and reduce the level offraud in the existing system. This is necessary, partly because of the distresscaused to families who unwittingly over-claim and then have to pay the moneyback, and partly because of the cost to taxpayers (the total amount overpaid up to2008 was £7.3 billion, of which only £2.7 billion has been returned).
The fundamental flaw in the system derives from the commitment to ‘flexible’prospective payments, for these can only work by making predictions of futureincomes that will often turn out to be wrong. Things could be, and are being,done to improve the accuracy of these predictions, but large sums will still befraudulently or erroneously paid out for as long as tax credits are paid in advance.The obvious solution is to learn from the Americans and Australians and holdback at least part of a family’s tax credit entitlement until the end-of-tax-yearreconciliation when their exact entitlement can be calculated.
In most cases, payment in arrears should not result in undue hardshipbecause families will be paying substantially less tax each week than they docurrently (as a result of the reintroduction of child tax allowances). Many ofthose who currently claim tax credits will no longer do so, for they will be ableto retain more of their own earnings instead, and even those on lower incomeswho continue to receive tax credit top-ups will claim less, because of theirlower tax burden. With fewer families relying on smaller pay-outs, delayingpayment until the end of the tax year becomes more feasible than it mightotherwise be.
However, low-paid, part-time workers moving out of welfare could suffer iftheir entire tax credit top-up were delayed to the end of the tax year. For exam-ple, a sole parent moving from income support onto a minimum wage job for16 hours per week would lose the whole of the welfare payment they had beenreceiving, but would have to wait up to twelve months to get the compensatingtax credit payment. To avoid problems like this, it may still be necessary to paytax credits in advance to new claimants up to the point where the fortnightlysum payable matches the amount otherwise payable by welfare benefits, withthe remainder paid as a lump sum at the end of the tax year.
Many analysts agree that a major problem facing low-income families is theirinability to save (which is why the child trust funds were introduced), so payingpart or all of the tax credit entitlement as a lump sum at the end of the tax yearcould be seen as positively advantageous for many recipients. And as we saw inthe case of the US, receiving a lump sum tax adjustment will be regarded by manyrecipients as a ‘reward for working’ and may have a stronger impact on workforceattachment rates than the present system of fortnightly top-ups.
96 | policyexchange.org.uk
Reforming the UK Family Tax and Benefits System
PX Tax and Family:Layout 2 17/6/09 15:11 Page 96

Deferring tax credit payments to the end of the tax year would generate somesignificant savings to the government, both in reducing erroneous payments andin cutting overheads. Savings of around £1 billion per annum could be antici-pated.311
A successful crackdown on fraud would also generate savings. HMRC currentlyonly prosecutes what it calls ‘serious’ cases of fraud involving “organised attackson the system”, and 165 prosecutions were brought in 2007-08.312 But whereclaimants are found to have deliberately defrauded the system (e.g. by failing todeclare a live-in partner’s earnings), prosecutions should always be considered. Atthe very least, financial penalties should be imposed, and eligibility for tax cred-its should be withdrawn, at least for a fixed period.
4. Base tax credit payments on the number of hours worked above the 16 hourthresholdInsisting on a work requirement for recipients of tax credits begs the question ofhow much work should be expected. The current rule for receipt of Working TaxCredit is that parents must work 16 hours to be eligible, while single people andchildless couples have to work 30. This is not ideal, for it discourages claimantsfrom working more than the relevant threshold of hours.
We have seen that sole parents can end up with something approaching a full-time wage simply by working 16 hours and then allowing the government to topthem up with tax credits. When they were required to work 24 hours, modalworking time clustered around 24; when the requirement was cut to 16, modalworking time fell to 16.
There are three possible ways round this problem:
� We could copy the American EITC and taper tax credits in, as well as taperingthem out. Credits would then rise as incomes rise above zero, before reach-ing a plateau and then falling. This would avoid any clustering of work around16 hours and give an incentive to increase work hours across the low incomerange. However, applied to the UK system, it would create a grey area wherepeople could be claiming both welfare and tax credit (for the 16 hours ruleclearly demarcates ‘welfare’ from ‘employment’).There would also still be theproblem that a worker on a higher hourly rate may choose to trade off earnedincome against hours and let the tax credit make up some of the difference.
� We could raise the minimum hours eligibility to ensure that people workcloser to a full-time week before getting top-ups. This has recently beenproposed by David Green who argues that sole parents (other than widowsand widowers) “should normally be required to work to the extent necessary
policyexchange.org.uk | 97
Ten Modest Proposals
311 We saw earlier that overpay-
ments currently cost around £1
billion, most of which would be
saved by moving to end of year
lump sum payments. There
would also be some administra-
tive and staffing savings in HMRC
as a result of simplifying the sys-
tem.
312 Report of the Comptroller
(2008), para.2.18 and Table 7.
Proposal 3Reintegrate CTC and WTC into a single tax credit available only to working families, and pay it mainly as
an end-of-year lump sum. This means the £25,000 earnings disregard should be scrapped. Families on
welfare where nobody is working would be compensated for the loss of CTC by including an element
for the costs of children to JSA and Income Support.
Es)mated saving = £1 billion per year
PX Tax and Family:Layout 2 17/6/09 15:11 Page 97

to avoid welfare dependency”.313 He suggests that, once their youngest childstarts school, sole parents should work at least 35 hours per week for 47 weeksa year before getting a ‘hard-work top up’ (WTC would be scrapped). The keyproblem with this suggestion is that there would be little incentive for soleparents to take part-time work (which is why the 16 hour rule was intro-duced), and those taking full-time jobs would have to find and pay forout-of-school hours care in the afternoons and during school holidays.
� Tax credits could be restructured so that they top up earnings on an hourly-wage basis, rather than on an aggregate-wage basis. If tax credits topped upthe hourly wage rate, the total amount paid to a family would increase propor-tionate to the number of hours worked above the 16 (or 30) hour minimumthreshold.314 A reform like this would not only strengthen work incentives, butit would also cost less than our existing system, for people working relativelysmall numbers of hours would no longer be so generously supplemented.
We believe that the third of these options is the most desirable one.If workers are allowed to retain more of their earned income as a result of the
proposed new tax allowances, full-time work by one adult earning the minimumwage should generate an income sufficient to raise most families above thegovernment’s poverty line. However, families whose principal earner works lessthan full-time may not earn enough to provide them and their children with anadequate income. Provided they work at least 16 hours per week (in the case ofsole parents), or 30 hours between them (in the case of couples), they would stillqualify for top-ups under the reform outlined here, but the fewer hours theywork above these thresholds, the smaller will be the total value of the top-upsthey receive (because it is their hourly rate, and not their total income, whichattracts the tax credit supplement).
It is plainly unfair and counter-productive to use tax credits to raise theincomes of part-time workers to a level close to that achieved by comparablepeople who work full-time, yet this is what we are doing at the moment. Theproposed change would rectify this anomaly.
There are three possible problems with making a change like this:
� There is a danger of reintroducing the unemployment trap, for parents whowork part-time (say, 16 hours per week) will get a smaller top-up than theydo now, which means their total income will fall closer to the amount theycould get on welfare by not working at all. Tax credits would still need toensure that the minimum income for families working part-time still exceedsthat available to comparable families living on benefits.
� Sole parents with very young children might be induced to work full-time inorder to maximise their tax credit entitlement, and this could harm theirchild’s development and wellbeing. This problem could be overcome if (asoutlined below) Child Benefit were amended, and a new Parenting CareAllowance were introduced, so that more financial support is made availablefor parents with children under three years of age who do not work.
� There may be practical problems, for the tax office would need to know howmany hours each claimant has worked over the year, as well as how muchmoney they have been paid, in order to work out their tax credit eligibility.
98 | policyexchange.org.uk
Reforming the UK Family Tax and Benefits System
313 Green D (2009), Individualists
who cooperate, p.67.
314 A similar proposal has been
made and evaluated in America
by MaCurdy T and McIntyre F
(2004), Helping Working-Poor
Families, Employment Policies In-
stitute.
PX Tax and Family:Layout 2 17/6/09 15:11 Page 98

Employers would therefore need to keep records of the hours worked by theiremployees, and self-employed and professional workers would have to self-certify. But hours have to be checked in the existing system (HMRC has todetermine whether claimants have reached the existing 16/30 hour eligibil-ity thresholds), so basing payments on hours worked should be feasible.
This change could result in significant savings to public expenditure as tax creditpayments are reduced to those working shorter hours. It is difficult to gauge thescale of these potential savings, for we do not know how many people currentlyworking just 16 hours per week would increase their hours in order to boost theirtax credit top-up. In the USA it has been estimated that switching to a tax creditassessed on hourly wage-rates would result in 20% savings on the existing EITCbudget.315 If the same were true here, we could be looking at expenditure savingsof up to £4 billion per year, but this should be regarded as a very tentative estimate.
5. End the ‘couple penalty’ in the tax credits systemTurning tax credits back into top-ups for low-income working families would helpto overcome the work disincentives which have grown up in the current tax creditsystem, but there are other problems with it, too, which need to be addressed. Akey one is the ‘couple penalty’.
We have seen that the income tax system penalises all single earner couplefamilies by failing to allow for the costs of the non-working parent. This unfair-ness is compounded for low-wage couples by the fact that the tax credits systemalso fails to allow for the costs of a non-working parent. Just as the solution in thecase of income tax is to give couples the option of claiming a Married Couple’sAllowance, so too the tax credits system should include an additional element fora non-working spouse.
The same conditions which would attach to the MCA would attach to this newnon-working spouse element in the tax credits system too, and for the samereasons. Thus, it would only be available to couples with dependent children, andit would be limited to parents who are married or in civil partnerships. It wouldbe calculated after taking the value of the MCA into account.
Like the MCA, a spousal element in the tax credits system would contribute tohorizontal equity by ensuring that a low-income worker with a spouse and chil-dren to support would take home a bigger slice of his/her gross earnings than acomparable worker with fewer or no dependents. However, both these changeswould tend to depress the rate of female workforce participation, for they increasethe incentive to have only one earner and they reduce the incentive for secondearners to work more hours to increase the family income.316 Seen from the
policyexchange.org.uk | 99
Ten Modest Proposals
315 MaCurdy and McIntyre
(2004), p.17.
316 Brewer M (2007), Supporting
couples with children through the
tax system, p.227. Mike Brewer
notes in a personal communica-
tion that introducing a couple ele-
ment into the tax credits system
would create sharp work disin-
centives for second earners, for it
is difficult to see how such a
credit could be phased out when
the second parent starts to work.
This is true, but it is important to
remember that the number of
families affected will be signifi-
cantly smaller than at present.
This is because the reintroduction
of child and married couple al-
lowances will boost family take-
home incomes and remove many
households from the tax credits
system altogether.
Proposal 4Reintegrate Child Tax Credit into the Working Tax Credit so that paid employment is restored as a condi-
9on of eligibility for tax credit payments. Retain the current 16 and 30 hours minimum eligibility rules,
but change the calcula9on of tax credit payments so that they are scaled according to the average
hourly wage over the assessment period, rather than according to aggregate weekly earnings.
Es)mated saving = £3-4 billion per year
PX Tax and Family:Layout 2 17/6/09 15:11 Page 99

perspective of the child’s development, this may not represent a ‘downside,’ forchild wellbeing is likely to increase if one parent stays home in the early years.
This is less true as children grow older, and we have seen that, the longerwomen remain out of the labour market, the more their long-term careers suffer.As time goes on, therefore, the balance of the argument shifts, and for familieswith older children (over the age of three), there is no strong case for using otherpeople’s taxes to enable and encourage one parent to stay home.
How big should the tax credit supplement be for a non-earning spouse? TheInstitute for Public Policy Research says couples should get one-third more thansole parents with the same number of children since equivalised poverty linesdraw the line for a couple about one-third higher.317 The Social Justice PolicyGroup says the tax credit for couples should be about 60% higher, since this is thepremium paid to couples in the social security system. This would raise averagepayments by £32 a week at a coat of £3 billion.318 If (as proposed here), thesupplement were limited to married couples and those in civic partnerships, werepaid at only 50% (to make it consistent with the proposed MCA), and werereduced to take account of the value of the MCA, the cost would be significantlylower than this – perhaps around £1.2 billion.319
6. Reduce middle class welfareIn addition to the work disincentives, fraud, wastefulness, and the couple penalty,the other main problems with the current system of tax credits are its cost (an in-crease in just 10 years from £2 billion to £20 billion) and its inefficiency (taxingmiddle class families with one hand, and then giving the money back with theother).These problems must also be addressed.
Two of the proposals outlined above would do much to reduce the size of thetax credits budget. Limiting tax credits to working families would knock outwelfare claimants and take us back to the eligibility rules operating in 2003(when the total cost of WFTC was around £6 billion). However, most or all ofthe money saved on tax credits would have to go on increased welfare benefits, sothe net impact on government finances would be small.320
Reintroducing family tax allowances – the MCA and child allowances – wouldalso enable spending on tax credits to be slashed, for we could then take themiddle classes out of the tax credit system altogether. Net government expendi-ture will still rise, for the cost of the new MCA and child allowances would exceedthe savings under the tax credits budget (because high income families notcurrently eligible for CTC would in principle qualify for these tax allowances).Moreover, if the new MCA and non-employed spousal element in the tax creditssystem resulted in a decline in female workforce participation, tax revenues wouldfall accordingly.321
100 | policyexchange.org.uk
Reforming the UK Family Tax and Benefits System
317 Cooke G and Lawton K
(2007), Working out of poverty,
Institute for Public Policy Re-
search, p.58.
318 Social Justice Policy Group
(2007), p.70.
319 The £3 billion estimate of the
Social Justice Policy Group is de-
flated by 20% (because the value
of the partner element is 20%
lower), and then by another 20%
(on the assumption that no more
than 80% of couple claimants will
be married). The result is then re-
duced by a further £750 million
(the value of the MCA), leaving a
final estimate of £1.17 billion.
320 At the 2003 rate of £38.50
per child per week, the 1.8 million
children in workless families
would generate an increased wel-
fare spend of £3.6 billion per year.
Against this would be set a CTC
saving of roughly the same
amount, for CTC pays £2,635 for
one child in a workless family, and
1.8 million children paid at this
rate comes to £4.7 billion. Given
that some children are paid less
than this (for a second child at-
tracts CTC of only £2,085), and
that the 2003 welfare rate has to
be upgraded for inflation, the fig-
ures roughly balance out.
321 The more we move from a
pure individual to a pure joint sys-
tem of taxation, the more we
achieve horizontal equity, but the
greater the disincentives become
for second earners (normally
women) to take up employment.
See Jaumotte F (2003), Female
labour force participation, p.25.
Proposal 5Introduce a ‘non-working spouse’ element into the tax credits system for married couples where one
partner stays at home to look a(er dependent children. This should be paid net of the Married Couple’s
Allowance.
Es)mated cost = £1.2 billion per year
PX Tax and Family:Layout 2 17/6/09 15:11 Page 100

Nevertheless, with tax allowances restored for dependent children and adependent spouse, fewer families would need additional support from tax cred-its, so these would be concentrated solely on poorer families. The long eligibilitytail up to families with combined incomes as high as £60,000 could therefore bedrastically curtailed.
The size of the savings would obviously depend on how tightly the newincome test was drawn. We have seen that, per head of population, the AmericanEITC costs only 60% of what the UK spends on tax credits because it tapers outmuch earlier, yet it has had a bigger impact on rates of workforce participation.If the UK emulated the US income test, the cost of our tax credits system wouldplummet from £20 billion per annum to a figure closer to £12 billion.
To achieve savings on this scale, eligibility for tax credits would need to berestricted to families in the bottom half of the income distribution. This shouldsave one-third of what we are currently spending (for it is estimated that one-third of current spending goes to the most affluent 50% of families).322 With atotal tax credit budget of £20 billion per year, this would amount to annualsavings of almost £7 billion.
7. Frontload Child Benefit on the first three years and make it conditional on ‘re-sponsible parenting’It would make sense to restructure Child Benefit so that most of the money is paidin the first three years of a child’s life. This has been proposed by Labour’s FrankField, endorsed by a Conservative Party policy group, and is supported by morethan half of the British public.323 The logic behind this proposal is that, as childrenget older, both parents can return to work, at least part-time, whereas in the firsttwo or three years (when it is most desirable for the child to be raised at home),families incur a considerable income sacrifice in addition to the direct costs in-curred in having a new infant. Front-loading the Child Benefit would help defraythese expenses.
Child Benefit for the first child is currently worth £20.00 per week (second andsubsequent children get £13.20). Typically, a first child might therefore attract anaverage of about £1,000 per year in Child Benefit for 18 years (a total of£18,000), while later children get around £650 (a total of just under £12,000).
If half of this money were brought forward to the first three years, it wouldmean a first child would qualify for £3,000 per year for the first three years(approximately £58 per week), dropping to £600 per annum after that, andsubsequent children would get nearer £2,000 per year (£40 per week) for thefirst three years, and £400 per year thereafter.
This enhanced Child Benefit would be paid, as of right, to every family. Thereis a danger, however, that increased payments in the early years might encourage
policyexchange.org.uk | 101
Ten Modest Proposals
322 Nicholas Boys-Smith esti-
mates from Treasury data that
33% of all tax credit spending
goes to families in the top half of
the income distribution – Reform-
ing Welfare (2006), pp.73-4.
323 Social justice Policy Group
(2007), Breakthrough Britain,
pp.72-3.
Proposal 6Eliminate ‘middle class welfare’ from the tax credits system, and reduce tax-welfare churning, by re-
structuring the tax credit taper so it cuts out before families move into the upper half of the earn-
ings distribu9on.
Es)mated saving = £7 billion per annum
PX Tax and Family:Layout 2 17/6/09 15:11 Page 101

irresponsible parents to have more children for the wrong reasons (we sawearlier that economic incentives may have some impact on fertility rates amonglower-income groups). There is therefore a case for making the enhancedpayments conditional. Where there is evidence of a child being raised in apotentially harmful environment (e.g. where a parent is abusing drugs or alco-hol, or fails to make the child attend school regularly), some or all of the benefitmight be withheld until the situation improves. Such conditionality would needto be based on clear, measurable and objective criteria – things like school atten-dance records or officially-recorded indicators of neglect – to avoid thepossibility of capriciousness.324
In the long run, this proposal is revenue-neutral, for over the first 18 years ofa child’s life, it will receive the same total amount of Child Benefit as it does now.There would, however, be an initial ‘budget-shock’ during the transitional, phase-in stage of this reform, for children currently over the age of three wouldcontinue to receive the existing ‘flat’ payment while those under three receivedthe enhanced, front-loaded, payment with no compensating saving elsewhere.The greatest additional burden would occur three years into the new system,when the government would be spending £3.3 billion more on Child Benefitthan it does at the moment.325 After that, the cost would gradually decline, until,in year 18, it returned to its current level.
8. Replace current childcare subsidies with a Parenting Care AllowanceThe front-loading of Child Benefit could be coupled with a change to the way for-mal childcare is currently subsidised.
As things stand, parents who choose to raise their children at home not onlysacrifice the earnings of the main carer, but they also subsidise through their taxesthe childcare costs of other parents who decide to keep working. Moreover,parents who prefer to use informal care (e.g. grandparents or neighbours) loseout relative to those who use formal, approved care, yet these are often the lessaffluent families.
One possible answer to inequities like this is to offer a cash allowance toparents who do not use formal childcare, so that they can pay for informal care,or offset loss of earnings by caring for their children themselves. This wasproposed in 2005 by the Conservative Party,326 and we have seen that someEuropean countries do something similar. Parents who do not use state-subsidised childcare are offered a cash equivalent so they can stay home and lookafter their infants themselves.
A simpler version of the same idea was put forward in a 2008 Policy Exchangereport which proposed that existing state childcare subsidies (like the childcareelement of the WTC and employer childcare ‘electronic vouchers’) should bescrapped and replaced with a new, universal ‘Parenting Care Allowance’ for all
102 | policyexchange.org.uk
Reforming the UK Family Tax and Benefits System
324 The Social Justice Policy
Group (2007) makes a similar rec-
ommendation, proposing that the
enhanced part of the Child Bene-
fit be made subject to health visi-
tors and other professionals being
satisfied that infants and young
children are making good
progress (pp.72-3). Knowing that
money is at stake could lead par-
ents to put pressure on these pro-
fessionals, however, and the
proposal sounds rather heavily in-
terventionist. It might be better
simply to withhold payment if
there is formal evidence of speci-
fied kinds of behaviour – e.g. illicit
drug use – or neglect.
325 Assuming (for the sake of
simplicity) a £10 billion annual
spend on Child Benefit, and equal
cohort sizes each year, each co-
hort currently receives £0.56 bil-
lion each year. Under the new
system, cohorts 1 to 3 will receive
£1.67 billion per year, reducing to
£0.33 billion per year after the
age of three. In the third year of
operation, therefore, there will be
three cohorts of under-threes,
each receiving £1.67 billion rather
than the existing £0.56 billion,
with no older cohorts receiving
the reduced level of £0.33 billion.
326 Brewer M, Crawford C and
Dearden L (2005), Helping Fami-
lies, p.21.
Proposal 7Keep Child Benefit as a universal, flat-rate payment, but restructure it so that half the total value is
paid in the first three years of a child’s life, condi9onal on ‘responsible paren9ng.’
Es)mated cost = Nil (long-term); maximum £3.3 billion (in Year 3)
PX Tax and Family:Layout 2 17/6/09 15:11 Page 102

parents with children aged 0-3.327 This benefit would not be means tested andwould not be contingent on working. It would be worth around £55 per weekfor each child, tax-free, and could be spent on childcare or for any other purposeas the parents see fit.
The logic behind this proposal is that parents are generally the best people tojudge how to raise their children. With the money in their pockets, parents ofyoung children could choose whether to continue working while paying for child-care, or leave the workforce for a while in order to raise their children at home anduse the money to help soften the financial blow from the loss of an income.
The problem, of course, is the cost. The Policy Exchange report Little Britons esti-mated that around £1.5 billion would be saved by winding up the WTC childcareelement, electronic vouchers and the Sure Start Maternity Grant, and another £0.5billion might be saved in administration costs. But set against these savings, a newParenting Care Allowance would cost £5.4 billion if it were untaxed, or £4.1 billionif it were taxed. The net additional cost would therefore amount to between £2.1billion and £3.9 billion per year, depending on whether admin savings materialiseand the new PCA is taxed. At the very least, it would probably cost around £3 billion.
Taken together, a front-loaded Child Benefit, plus a new Parenting Care Allowance(in place of existing childcare subsidies) would boost family incomes in the firstthree years of a child’s life by as much as £120 a week. This amount of money wouldgive parents a real choice about how to balance the demands of family and career.
9. Investigate the feasibility of Parental Leave Savings and Loans schemes forfamilies who want themThe proposals outlined so far go a long way to enabling parents who want to lookafter their young children at home to do so, without prejudicing the choice be-tween staying at home and continuing to work. Couples who want to raise theirown children would be able to replace a sizeable chunk of the lost second incomewith the enhanced early years Child Benefit and the new Parenting Care Allowance,they could boost their earnings by claiming MCA and child tax allowances, andthose on a low income would also qualify for tax credit support, including a newnon-working spouse element.
The decision to leave work for an extended period in order to raise childrenwill, nevertheless, still involve significant loss of income for many families. Thiscould be relieved by increasing existing paid leave entitlements.328 But any signifi-cant extension of existing paid leave entitlements will increase an already heavyburden on employers and taxpayers at a time when the economy can ill afford it.It will also transfer more money from poor single people to rich couple families,and will do nothing to encourage a culture of self-reliance.
policyexchange.org.uk | 103
Ten Modest Proposals
327 Hakim C et al (2008), Little
Britons. A similar proposal has
been made by Dex S and Joshi H
(1999), Careers and motherhood,
p. 656.
328 Grandparents Plus, Rethink-
ing family life: Exploring the role
of grandparents and the wider
family, March 2009, www.grand-
parentsplus.org.uk.
Proposal 8Scrap the childcare element of the Working Tax Credit, as well as the employer-based childcare
‘electronic vouchers’ and the Sure Start maternity grant, and replace with a new Paren9ng Care Al-
lowance, paid to all parents in the first three years of a child’s life as an addi9on to the Child Bene-
fit, and worth approximately £55 per week, per child.
Es)mated net cost = £3 billion
PX Tax and Family:Layout 2 17/6/09 15:11 Page 103

A better solution could be to develop a new system of tax-favoured savingsinstruments so that parents can make provision for their career breaks in advance.For those who fail to save enough, there might also be parental leave loans,modelled loosely on the existing student loans scheme.
The problem of financing parental leave is basically one of how to ‘smoothincomes’ over an expensive but largely predictable period of the life cycle. Likestudents in higher education, new parents need to replace an income for a rela-
tively short and clearly-defined period.They will normally have been earningbefore stopping work to have children,and they will normally also expect toreturn to work and resume earningsafterwards. This means that they shouldbe in a position to save, prior to havinga child, and/or to borrow during theperiod of leave with a view to paying
the money back later, when they return to the workforce.The UK already has tax-exempt savings schemes (principally, the Individual
Savings Accounts, or ISAs). We also pioneered tax-exempt savings accounts forchildren (the child trust funds). These schemes exempt interest from tax,although tax still has to be paid on the earnings which create the initial deposits.
What we propose is a ‘family savings’ instrument which would allow employ-ees to ‘salary sacrifice’ up to a certain limit each year so that neither their deposits,nor the interest earned, are taxed. This money could then be drawn to provide areplacement income (which would be taxed as it is drawn) for a period up tothree years after the birth of a child (if a parent wants to care for the child athome), or to pay for childcare (if he/she wishes to return to work earlier).
There is a precedent. In 2006, the Netherlands introduced a tax-free savingsscheme to finance extended, unpaid parental or other family leave. Called the ‘LifeCourse Savings Scheme’ it seeks to encourage employees to take more responsi-bility for themselves by saving for extended periods out of the labour force, suchas parental leave. The scheme is voluntary, and the Dutch government gives taxrelief of up to €650 per month.329
For parents who have not saved, a loan scheme might also be introduced tocover extended parental leave.330 As in the case of student loans, interest could becharged at a preferential rate and repayments deferred until household incomepasses a certain threshold point (say, average earnings). To ensure gender equity,both parents would need to be held responsible for repaying loans, irrespective ofwhich of them takes the time out from paid employment.
104 | policyexchange.org.uk
Reforming the UK Family Tax and Benefits System
329 Moss P and Wall K (2007), In-
ternational Review of leave poli-
cies and related research 2007,
Department for Business Enter-
prise and Regulatory Reform, Em-
ployment Relations Research
Series N.80.
330 This has been proposed by
Australian economist, Andrew
Leigh ‘A HECS on everything’, Aus-
tralian Financial Review, 6 May
2008.
Proposal 9Research is needed into the viability and likely cost of a voluntary, tax-exempt Life Course Savings
scheme to enable working families to save for extended periods of parental leave and/or childcare
costs. Research should also consider the viability of a discre9onary Parental Leave Loan, made avail-
able at preferen9al interest rates to either parent in a couple (provided they have previously been
ac9ve in the labour market) and for which both are jointly liable.
“What we propose is a ‘family savings’ instrument
which would allow employees to ‘salary sacrifice’ up
to a certain limit each year so that neither their
deposits, nor the interest earned, are taxed”
PX Tax and Family:Layout 2 17/6/09 15:11 Page 104

10. Decouple family policy from anti-poverty programs and apply the same financialexpectations to all parentsWe have seen that an anti-poverty agenda has come to dominate family policy. Thishas two main consequences:
� Family policy has increasingly been equated with providing increased finan-cial assistance – in particular, to ‘poorer’ sole parent families;
� Other aspects of family policy, such as the desirability of strengthening familyties, promoting greater self-reliance of families, and ensuring horizontalequity, have been forgotten or abandoned.
Most financial assistance for families is now provided in the form of tax credits. Butsince 2003, the function and purpose of tax credits has become hopelessly con-fused. Notwithstanding the continuing rhetoric about helping ‘working families’,we now have one tax credit (CTC) which does not require that you work, and an-other (WTC) which does not require that you have any family responsibilities.
This confusion has arisen because tax credits have increasingly been directed atreducing poverty. As originally conceived, tax credits were supposed to reducepoverty indirectly, by promoting greater participation in paid work, but since2003, they have been used to reduce poverty directly, by giving more money tofamilies with little or no income of their own. This means tax credits are nowmade available to people whether they are employed or not. This enhances theirincomes, but the initial cause of their poverty goes uncorrected.
This extension of tax credits has built a contradiction into the heart of contem-porary family policy. Giving non-employed families more money erodes workincentives, reduces the relative advantage of working over non-working, and rein-forces dependency. Extending tax credits to people who do not work has in thisway destroyed their rationale and turned them into just another welfare payment.
Much of the money spent on tax credits has gone to sole parent families. Thisis because sole parents have, on average, much higher rates of joblessness (andtherefore higher levels of child poverty) than other family types.
Since 1997, Labour governments have tried to reduce rates of sole parentjoblessness, but they have refused to recognise that the rising rate of sole parent-hood is itself the major cause of the poverty problem. They have therefore beenfocusing on the symptom while ignoring the principal cause of the problem theyclaim to be tackling. Politicians in all parties should be brave enough to breakfrom the comfortable myth that pretends that all family arrangements are equallypositive. Policy must acknowledge that family structure is itself a major cause offamily poverty, and begin addressing this directly.
Governments have achieved significant success in raising what was anextremely low rate of workforce participation among sole parents (althoughmoving people from welfare into just 16 hours of employment per week is rarelyenough to sustain genuine financial independence). New eligibility rules shouldalso help weaken the culture of dependency which has grown up as a result ofsole parents having a right to remain on Income Support until their children leaveschool (from October 2008, sole parents have been required to look for workonce their youngest child passes the age of 12, and in 2010, those with childrenas young as seven will have to register as available for work).
policyexchange.org.uk | 105
Ten Modest Proposals
PX Tax and Family:Layout 2 17/6/09 15:11 Page 105

All of this is positive, but there is scope for taking these reforms further. Theproposals outlined above would make it possible for all families to raise their chil-dren at home up to the age of three if they wish to do so, but beyond this age,there is no reason in principle why parents should not be in work, at least part-time. We have seen that in many couple families, both parents work when theirchildren are three, and the children do not suffer – and may well benefit – if theyare placed in child care at this age. What is good for couples should be good forsole parents too. Taxpayers should not be expected to subsidise parents to stay athome once their children pass three years of age, whether they are couples or soleparents.
Another key factor contributing to high poverty rates among sole parents isthat absent fathers too often fail to meet their financial responsibilities forsupporting their children. Families should draw first on their own resourcesbefore seeking additional financial assistance from taxpayers, and this principleapplies just as much to parents who live apart as to those who remain together.It is wrong that lone mothers claim financial support from taxpayers to replaceincome they should be getting from the father of their child, and it is wrong thattax credits get calculated disregarding income support payments from an absentpartner.
To rectify this, the state should ensure that sole parents (other than widows andwidowers) receive regular receipt of adequate child support from the absentparent. These receipts should count as assessable income when calculating eligi-bility for state assistance. This right to child support should be reinforced by legalsanctions as necessary. The 1948 National Assistance Act provided for fathers tobe traced and prosecuted if they abandoned their families without makingadequate financial provision for them. Every year until 1982 there were 500 to600 such prosecutions, about 10% of which resulted in prison sentences.331 Butafter that, criminal prosecution fell out of favour, and predictably, defaults havemultiplied ever since.
Parents must be required to fulfil their financial responsibility to maintain theirchildren until they reach maturity, irrespective of whether they separate orcontinue to live together. In jobless sole parent families, where child support isinsufficient, state welfare should play a secondary role in supplementing thefamily income, but any offer of state assistance should be calculated on the basisof both parents’ incomes.332
106 | policyexchange.org.uk
Reforming the UK Family Tax and Benefits System
331 Green D (2009), Individualists
who cooperate, p.66.
332 Kirby J (2005), The price of
parenthood, p.44.
Proposal 10Family tax credits should have one aim – to improve work incen9ves and rewards for low income
families. They should not also be used as an instrument of an9-poverty programmes, for this under-
mines their effec9veness. High rates of rela9ve poverty among sole parent families should be tack-
led by increasing work requirements for all welfare parents with children over three years of age,
and by enforcing child support responsibili9es of absent parents. Governments should acknowledge
that sole parenthood is inherently linked to high poverty risk and is itself therefore part of the prob-
lem that has to be tackled.
PX Tax and Family:Layout 2 17/6/09 15:11 Page 106

Appendix: Can We Afford It?
With government budgets under enormous pressure as a result of the economicrecession, it would be fatuous to publish a set of reform proposals which requiredany substantial increase in government expenditure. The proposals set out in thisreport aim to change the form of government expenditure on families withoutadding to the already burgeoning size of the family policy budget. In particular,the aim is to reduce the amount of money going to families as governmentpayments, and to balance this by reducing the amount of tax families have to pay.
The proposals which entail increased government expenditure are:
� The restored Married Couple’s Tax Allowance: £0.75 billion;� The restored Dependent Child Tax Allowances: £7.7 billion;� A new Spousal Allowance in the tax credit system: £1.2 billion;� A new Parenting Care Allowance: around £3.0 billion (net of savings on
current child care expenditure).
This adds up to approximately £12.7 billion of expenditure each year. In addition,front-loading Child Benefit would cost up to £3.3 billion in the early years, butwould be revenue-neutral in the long term.
The proposals which entail reduced government expenditure are:
� End-of-year tax credit payments to eliminate overpayments and reduce fraud:-£1 billion;
� Hours-based tax credit top-ups to reduce subsidies to part-time workers: -£4billion;
� Termination of tax credits for more affluent families: -£7 billion.
These annual savings amount to around £12 billion. Comparing this with the es-timated costs of between £13 billion and £16 billion (depending on the timing ofthe Child Benefit front loading), there is clearly a potential overspend in this pack-age of proposals. To avoid this, and to achieve revenue-neutrality, some combina-tion of the following should be considered:
� Cut-back more sharply on middle class welfare by limiting tax credit eligibil-ity to families significantly below average incomes;
� Introduce a less generous Parenting Care Allowance by capping the initial costof the proposal at the £2 billion saved from scrapping existing childcare subsi-dies;
� Delay the introduction of front-loaded Child Benefit, or phase-in the changeover a period of years.
policyexchange.org.uk | 107
PX Tax and Family:Layout 2 17/6/09 15:11 Page 107

Reforming the UKFamily Tax andBenefits SystemPeter Saundersedited by Natalie Evans
£10.00ISBN: 978-1-906097-49-3
Policy ExchangeClutha House10 Storey’s GateLondon SW1P 3AY
www.policyexchange.org.uk
PolicyExchange
Reformingthe
UKFam
ilyTaxand
BenefitsSystem
British families have changed radically over the last 40 years: marriage rates have
fallen, cohabitation outside marriage has become the norm, divorce has risen and
the number of children being raised by sole parents has escalated. As politicians of
all parties have attempted to respond to these changes, UK family policy has gone
through a period of major reform and substan(al upheaval. Since 1997 in par(cular,
both the method and level of support provided to families through the tax and
benefits system has been changed significantly.
Through a detailed analysis of the development of family support in the UK, this
report argues that we have ended up with a system that is very costly, often unfair,
and which undermines the independence and self-reliance of families rather than
promoting it.
We identify where family policy has gone wrong – often with good intentions – and
suggest a number of key policy recommendations. In particular, families should be
allowed to retain more of their own income, rather than relying on hand-outs from
the government. This requires reform to the tax credits system, changes to child
benefit and child care allowances, and a restoration of tax allowances for children
and married couples so that more families can achieve the level of self-reliance that
used to be the norm in Britain.
COVER HDS.qxp 14/10/09 16:15 Page 1