Reforming School Discipline - Amazon Web Services
61
Reforming School Discipline: School-Level Policy Implementation and the Consequences for Suspended Students and their Peers Matthew P. Steinberg Assistant Professor of Education University of Pennsylvania Johanna Lacoe Researcher Mathematica Policy Research July 17, 2017 The authors thank the School District of Philadelphia for providing the data used in this paper and seminar participants at the University of Arkansas Department of Education Reform Seminar Series for helpful comments. Authors contributed equally; Steinberg (corresponding author) may be contacted at [email protected]; Lacoe may be contacted at [email protected].
Transcript of Reforming School Discipline - Amazon Web Services
Reforming School Discipline: School-Level Policy Implementation and the Consequences for
Suspended Students and their Peers
Matthew P. Steinberg Assistant Professor of Education
University of Pennsylvania
Johanna Lacoe Researcher
Mathematica Policy Research
July 17, 2017
The authors thank the School District of Philadelphia for providing the data used in this paper and seminar participants at the University of Arkansas Department of Education Reform Seminar Series for helpful comments. Authors contributed equally; Steinberg (corresponding author) may be contacted at [email protected]; Lacoe may be contacted at [email protected].
Reforming School Discipline
1 Steinberg & Lacoe
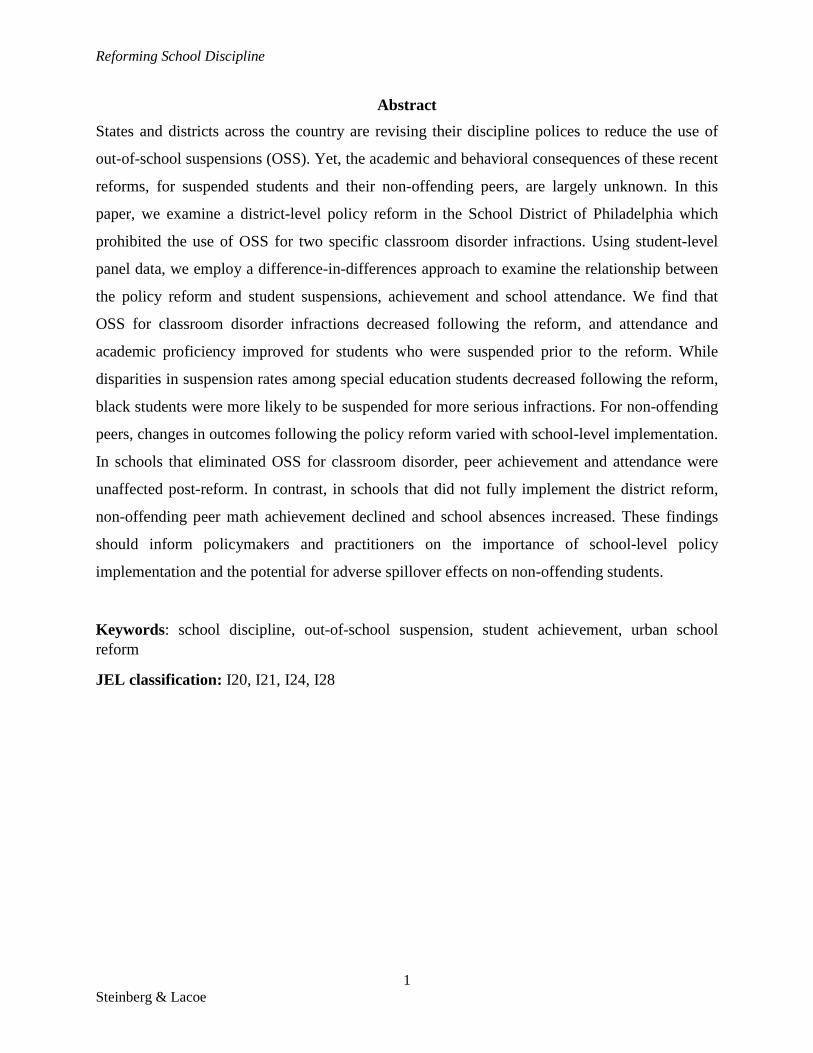
Abstract States and districts across the country are revising their discipline polices to reduce the use of
out-of-school suspensions (OSS). Yet, the academic and behavioral consequences of these recent
reforms, for suspended students and their non-offending peers, are largely unknown. In this
paper, we examine a district-level policy reform in the School District of Philadelphia which
prohibited the use of OSS for two specific classroom disorder infractions. Using student-level
panel data, we employ a difference-in-differences approach to examine the relationship between
the policy reform and student suspensions, achievement and school attendance. We find that
OSS for classroom disorder infractions decreased following the reform, and attendance and
academic proficiency improved for students who were suspended prior to the reform. While
disparities in suspension rates among special education students decreased following the reform,
black students were more likely to be suspended for more serious infractions. For non-offending
peers, changes in outcomes following the policy reform varied with school-level implementation.
In schools that eliminated OSS for classroom disorder, peer achievement and attendance were
unaffected post-reform. In contrast, in schools that did not fully implement the district reform,
non-offending peer math achievement declined and school absences increased. These findings
should inform policymakers and practitioners on the importance of school-level policy
implementation and the potential for adverse spillover effects on non-offending students.
Keywords: school discipline, out-of-school suspension, student achievement, urban school reform
JEL classification: I20, I21, I24, I28

Reforming School Discipline
2 Steinberg & Lacoe
Introduction Recent criticism of zero-tolerance approaches to school discipline, which employ out-of-
school suspension (OSS) for even minor student misconduct, has led states and districts to revise
their discipline polices in favor of more tempered responses to misbehavior aimed at keeping
students in the classroom. As of May 2015, 22 states and the District of Columbia had revised
their laws to require or encourage schools to limit the use of exclusionary discipline practices,
implement supportive (i.e., non-punitive) discipline strategies that rely on behavioral
interventions such as restorative justice and school-wide positive behavioral interventions and
supports (SWPBIS), and provide support services such as counseling, dropout prevention, and
guidance services for students experiencing academic or behavioral problems (U.S. Department
of Education, 2015). By the 2015–16 school year, 23 of the 100 largest school districts
nationwide had implemented policy reforms requiring non-punitive discipline strategies and/or
limits to the use of suspensions (Steinberg and Lacoe, 2017).
Nationwide, out-of-school suspensions are disproportionately centered on minority
students and students who receive special education services. Racial disparities in suspensions
begin as early as preschool, with black children comprising 18 percent of enrollment in
preschools but 48 percent of preschool children experiencing one or more suspensions, according
to the federal Office for Civil Rights (U.S. Department of Education, Office of Civil Rights,
2014). These disparities extend through primary, middle, and high school, where black students
comprise 16 percent of all enrolled students but 34 percent of students suspended once, and 43
percent of students receiving multiple out-of-school suspensions (Steinberg and Lacoe, 2017).
Furthermore, gaps in suspension rates between black and white students have grown over time,
doubling between 1989 and 2010 (Losen et al., 2015). This growth in the discipline gap may, in
part, be attributed to the implementation of zero-tolerance approaches to school discipline, which

Reforming School Discipline
3 Steinberg & Lacoe
have been shown to be associated with increases in suspensions and expulsions among black
youth (Curran, 2016; Curran, 2017; Hoffman, 2014). Youth receiving special education services
also experience higher rates of suspension; in 2011, students with disabilities were suspended at
twice the rate of nondisabled students (U.S. Department of Education, Office of Civil Rights,
2014).
Increasingly, out-of-school suspensions have been used as a response to lower-level,
nonviolent student behavior (Steinberg and Lacoe, 2017; Lacoe and Steinberg, 2017a).
Nationwide, insubordination (i.e., the refusal to obey a teacher’s directions) has accounted for an
increasing share of all serious disciplinary actions—that is, suspensions for five or more days,
transfers to specialized schools, and expulsion—from 22 percent during the 1999–2000 school
year to 43 percent in 2007–08 (Steinberg and Lacoe, 2017). Over this same time period, the
proportion of serious disciplinary actions for more serious student misconduct (such as
possession of alcohol, drugs, or a weapon) declined from 50 to 22 percent. In California, nearly
half of all suspensions issued by public schools statewide during the 2011–12 school year were
for “willful defiance,” a category of student misconduct that includes refusal to remove a hat or
turn off a cellphone, or not wearing the school’s uniform (Watanabe, 2013).
While states and districts have recently implemented policy reforms to reduce the use of
out-of-school suspensions, the academic and behavioral consequences of these reforms are
largely unknown. In this paper, we examine a district-level policy change in the School District
of Philadelphia (SDP). Beginning in the 2012-13 school year, SDP instituted dramatic changes to
its discipline code of conduct, emphasizing intervention rather than exclusionary practices for
less serious student misconduct. Following the reform to its student code of conduct, SDP
formally prohibited the use of OSS for two types of non-violent student misconduct – failure to

Reforming School Discipline
4 Steinberg & Lacoe
follow classroom rules and the use of profane or obscene language or gestures. Throughout this
paper, we refer to these two infractions as “classroom disorder.”
To understand the relationship between SDP’s district-level policy reform and student
outcomes, this paper addresses the following questions: (1) Did the implementation of the
district’s policy reform vary across schools? (2) Were there educational and behavioral
consequences to limiting suspensions for classroom disorder infractions for offending students –
those suspended for classroom disorder– and their school peers? To address these questions, we
employ panel data for grade 3-12 SDP students in the 2011-12 through 2013-14 school years.
We first explore the extent to which the policy reform was implemented across schools within
SDP, and whether disparities in suspension rates decreased for key subgroups of students
following the policy change. Next, leveraging the policy change to the district’s student code of
conduct, we employ a difference-in-differences strategy to examine whether the policy reform
reduced the use of OSS and whether these reductions translated into changes in student
achievement and school attendance for suspended students and their non-offending peers.
We find that OSS for classroom disorder in Philadelphia decreased following the policy
change; however, racial disproportionality in OSS remained relatively unchanged. We also find
that the district’s policy reform benefitted students who were previously suspended, reducing the
probability, times, and days of suspension, with the reduction in OSS concentrated among
classroom disorder infractions targeted by the district’s policy reform. Further, for students who
were suspended for classroom disorder infractions in the pre-reform period, school absences
declined following the district’s policy reform, and the likelihood that they achieved academic
proficiency in math modestly improved.
Reforming School Discipline
5 Steinberg & Lacoe
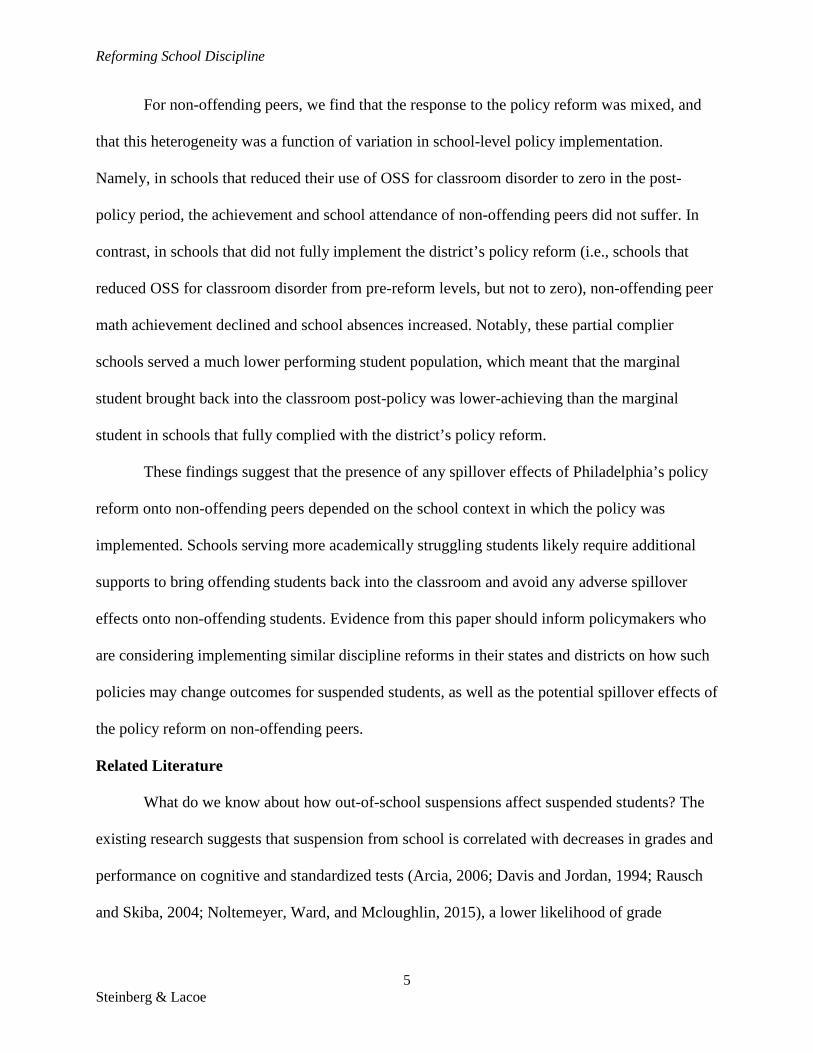
For non-offending peers, we find that the response to the policy reform was mixed, and
that this heterogeneity was a function of variation in school-level policy implementation.
Namely, in schools that reduced their use of OSS for classroom disorder to zero in the post-
policy period, the achievement and school attendance of non-offending peers did not suffer. In
contrast, in schools that did not fully implement the district’s policy reform (i.e., schools that
reduced OSS for classroom disorder from pre-reform levels, but not to zero), non-offending peer
math achievement declined and school absences increased. Notably, these partial complier
schools served a much lower performing student population, which meant that the marginal
student brought back into the classroom post-policy was lower-achieving than the marginal
student in schools that fully complied with the district’s policy reform.
These findings suggest that the presence of any spillover effects of Philadelphia’s policy
reform onto non-offending peers depended on the school context in which the policy was
implemented. Schools serving more academically struggling students likely require additional
supports to bring offending students back into the classroom and avoid any adverse spillover
effects onto non-offending students. Evidence from this paper should inform policymakers who
are considering implementing similar discipline reforms in their states and districts on how such
policies may change outcomes for suspended students, as well as the potential spillover effects of
the policy reform on non-offending peers.
Related Literature
What do we know about how out-of-school suspensions affect suspended students? The
existing research suggests that suspension from school is correlated with decreases in grades and
performance on cognitive and standardized tests (Arcia, 2006; Davis and Jordan, 1994; Rausch
and Skiba, 2004; Noltemeyer, Ward, and Mcloughlin, 2015), a lower likelihood of grade

Reforming School Discipline
6 Steinberg & Lacoe
promotion (Marchbanks et al., 2014) and high school completion (Balfanz, Byrnes, and Fox,
2015; Rumberger and Losen, 2016; Noltemeyer, Ward, and Mcloughlin, 2015), and lower
university entrance scores (Cobb-Clarke et al., 2015). More recent work finds that out-of-school
suspension reduces both math and ELA achievement by approximately 0.05 standard deviations
(Lacoe and Steinberg, 2017b). Beyond the immediate changes in academic performance, being
suspended is also associated with an increased likelihood of other negative life outcomes,
including adult criminal victimization, criminal involvement, and incarceration (Wolf and
Kupchik, 2016). Given the increasing prevalence of suspensions for non-violent disorder
infractions, concern also rests on whether such practices affect academic outcomes. To our
knowledge, the empirical evidence on the relationship between suspensions for classroom
disorder infractions and student outcomes is limited to one paper. Leveraging student-level panel
data and both student fixed effects and instrumental variable approaches, the authors find that
suspensions for classroom disorder infractions decrease both math and ELA achievement, and
that the effects are substantive enough to reduce the likelihood that a suspended student achieves
academic proficiency (Lacoe and Steinberg, 2017b).
One of the primary critiques of discipline policy reforms which aim to reduce the use of
suspensions is the potential for unintended negative consequences on the school and classroom
environment, and in particular, on non-offending peers (e.g., Petrilli, 2016). A small but growing
body of evidence suggests that the academic performance of non-offending students and feelings
of safety among all students is related to the school’s approach to discipline. One study finds that
greater school-level use of exclusionary discipline, such as suspensions, is associated with
declines in the achievement of non-suspended students (Perry and Morris, 2014). Other studies
show that students report lower levels of safety (Lacoe, 2015; Steinberg et al., 2011) and teachers

Reforming School Discipline
7 Steinberg & Lacoe
report more crime and disorder (Steinberg et al., 2011) in schools with higher suspension rates.
Further, students who report feeling unsafe in the classroom have lower academic achievement
(Lacoe, 2016).
However, there is little empirical evidence on the efficacy of recent discipline policy
reforms aimed at reducing the use of suspensions. Prior work from Philadelphia finds that, at the
district level, discipline policy reform successfully decreased the use of suspensions for lower-
level, non-violent student misconduct while also reducing the prevalence of more serious student
misconduct (Lacoe and Steinberg, 2017a). While Lacoe and Steinberg (2017a) considered
whether the policy reform was an effective approach to reduce the overall use of suspensions at
the district level, the authors were unable to distinguish between effects on suspended students
and their peers. Additional evidence comes from Chicago Public Schools, which implemented a
districtwide policy reform aimed at reducing the length of out-of-school suspensions for more
serious student misconduct. Among a sample of ninth grade students only, evidence from
Chicago finds that reductions in suspension length increased learning time for offending students
(i.e., those students subject to longer suspensions for more serious misconduct) without
adversely affecting the achievement of their non-offending peers or the overall school climate
(Mader, Sartain and Steinberg, 2016). Because the policy reform in Chicago only reduced
suspension length, it represents a very different approach to discipline reform than the policy
enacted in Philadelphia, which prohibited OSS for specific, lower-level infractions. Notably,
neither of these existing studies explored variation in school-level implementation of the
district’s discipline policy reform.
This paper addresses the existing gap in our understanding of discipline policy reforms in
the following ways. First, we examine the relationship between a policy reform aimed at

Reforming School Discipline
8 Steinberg & Lacoe
reducing the use of suspensions for lower-level, non-violent infractions and suspension usage,
student achievement, and school absences. Second, we explore school-level implementation of
the district’s policy reform, revealing variation in the extent to which schools serving different
student populations implemented the reform. Further, we quantify how this heterogeneity in
implementation may have differentially changed the achievement and school attendance of non-
offending peers. Finally, we provide evidence on the efficacy of the discipline policy reform in
reducing disparities in the use of suspension for students of different racial backgrounds and
disability status. As districts and states across the nation adopt school discipline reforms, greater
attention must be given to the influence that discipline policy reforms, which target different
types of student behavior, may have on individual students as well as their school peers.
Discipline Policy Reform in Philadelphia
In August 2012, the School District of Philadelphia held a summit of school principals to
identify preventative strategies to improve the overall climate of safety in their schools. In
addition, a private Philadelphia foundation funded a two-year fellowship to develop a “school
safety and climate strategy” for the district, based on collaboration among the School District;
Philadelphia Departments of Behavioral Health, Police, and Human Services; and student and
parent representatives (Snyder, 2012). These reform efforts resulted in changes to the SDP’s
Code of Student Conduct and the provision of greater principal autonomy in handling more
serious student misconduct.
Beginning in September 2012, the new code of conduct emphasized reducing
punishments for lower level student infractions. Specifically, as of the 2012-13 school year, out-
of-school suspensions were formally prohibited for two types of non-violent student misconduct:
(i) failing to follow classroom rules and disruption; and (ii) using profane or obscene language or

Reforming School Discipline
9 Steinberg & Lacoe
gestures. In the pre-policy year (2011-12), a student who committed either of these infractions
was subject to 1-3 days of out-of-school suspension. In the post-policy period, the maximum
allowable punishment (in place of suspension) for these behavioral infractions was in-school
intervention, such as in-school suspension or other disciplinary responses that kept students in
school.1
Figure 1 shows the prevalence of OSS in the pre- and post-policy years. Across the
district, 15 percent of grade 3-12 students received at least one OSS in the pre-policy year; in
2012-13, the first post-policy year, the overall OSS rate declined to 13.2 percent, with a modest
increase in the second post-policy year (2013-14). To contextualize Philadelphia’s OSS rate, 6.4
percent of all students nationally received at least one OSS in the 2011-12 school year (Steinberg
and Lacoe, 2017).
The decline in the OSS rate in Philadelphia was driven by changes in the use of
suspension for classroom disorder infractions – classroom disruption and profanity – targeted by
the district’s policy reform. While suspensions for classroom disorder infractions accounted for a
non-zero share of out-of-school suspensions in the post-policy period (we later discuss variation
in the extent of policy implementation across Philadelphia schools), we observe a significant
decline in the prevalence of classroom disorder OSS. Indeed, in the 2011-12 school year, 5
percent of all grade 3-12 students were suspended for either classroom disruption or profanity; in
the first post-policy year, this rate declined by nearly half, to 2.7 percent (see Figure 1, Panel A).
This is particularly notable as the rate of OSS for other infractions (i.e., suspensions for more
1 For more serious offenses (i.e., non-conduct infractions) —such as theft, harassment and bullying, breaking and entering, robbery, and extortion—maximum punishments were changed from expulsion to suspension (potentially paired with assignment to a disciplinary school, or another type of transfer). The code reforms also gave school administrators greater discretion in determining punishments. Before, the maximum suspension length was 10 days, but the new code stated that in the case of a serious infraction, a principal or assistant principal could give a suspension for up to 5 school days (Lacoe and Steinberg, 2017a).

Reforming School Discipline
10 Steinberg & Lacoe
serious student misconduct) remained relatively unchanged over this period. Further, classroom
disorder OSS, which accounted for 25 percent of all suspensions in the pre-policy year, declined
by 50 percent – to 15 percent – in the post-policy period (see Figure 1, Panel B).
<Figure 1 about here>
Figure 2 provides additional insight into the post-policy decline in the use of OSS for
classroom disorder infractions. We find that the number of students exposed to at least one
classroom disorder OSS declined by half across the distribution of times suspended for
classroom disorder infractions (see Figure 2, Panel A). We also observe a significant decline in
the number of days of classroom disorder OSS students were exposed to in the post-policy
period (see Figure 2, Panel B). Notably, the decline in classroom disorder OSS – at the margin of
both number of suspensions and days suspended – was concentrated in the first post-policy year,
with little (to no) incremental change in the second post-policy year.
<Figure 2 about here>
Data & Sample
We employ longitudinal, student-level administrative data for students in grades 3–12
attending a traditional (i.e., non-charter) SDP public school in any year during the 2011-12
through 2013-14 school years.2 The data contain detailed information on student demographics
(age, race/ethnicity, and gender), enrollment, attendance, discipline records, scores on state
achievement tests, free or reduced-price lunch (FRPL) status, disability (special education)
status, and English language learner (ELL) status.
Student enrollment data include unique student and school identifiers which allow us to
follow students across schools and years. Data on attendance include measures of the total
2 While administrative records for charter school students were unavailable to the researchers, charter schools enact their own discipline policies and are therefore not subject to SDP’s student code of conduct.

Reforming School Discipline
11 Steinberg & Lacoe
number of days enrolled and the total number of excused and unexcused absences. Student
discipline data are reported at the infraction-level, allowing us to observe each behavioral
infraction a student commits that corresponds to an OSS. For each OSS, we observe the length of
the suspension in days, the specific type of student misconduct (i.e., the behavioral reason for the
suspension) and the corresponding SDP code of student conduct rule number associated with the
student misconduct. This detailed, infraction-level information allows us to distinguish
suspensions due to classroom disorder infractions that were the target of the district’s policy
reform – a student’s failure to follow classroom rules or the use of profane or obscene language
or gestures – from suspensions due to other infractions.3
Student test score data provide the primary measure of student achievement. These data
include scaled scores and proficiency levels for math and English language arts (ELA). Student
test scores are from the Pennsylvania System of School Assessment (PSSA), and are available
for all students in grades 3 through 8.4 In all analyses of student achievement, we standardize the
scaled scores at the subject*grade*year level.
Table 1 summarizes the demographic characteristics of SDP grade 3-12 students in the
pre- (2011-12) and post-policy (2012-13) school years. SDP serves a largely minority and
economically disadvantaged student population, with 76 percent of grade 3-12 students who are
black or Hispanic in the pre-policy year, and 65 percent of grade 3-12 students receiving free or
3 Other infractions that are subject to suspension in SDP include: Aggravated assault (documented serious bodily injury); Assault of school personnel; Breaking and entering school property; Destruction and/or theft of property (less than $1,000); Destruction and/or theft of property (totaling $1,000 or more); Extortion; Fighting (two students engaged in mutual combat); Harassment/bullying/cyber-bullying/intimidation; Instigation or participation in group assaults; Mutual fight (w/ documented serious bodily injury); Possession of a weapon; Possession of alcohol or drugs - intent to distribute; Possession of alcohol or drugs – intent to use; Possession or use of fireworks/incendiary devices/explosives; Robbery; Sexual acts (consensual); Sexual acts (non-consensual); Simple assault (documented unprovoked attack by one student on another); and Threatening students/staff with aggravated assault. 4 In 2012-13, the SDP began testing high school (grades 9 through 12) students on the state Keystone exams. Since test score data for high school students are unavailable to the researchers, achievement estimates are for students in at least one tested grade (i.e., grades 3 through 8).
Reforming School Discipline
12 Steinberg & Lacoe
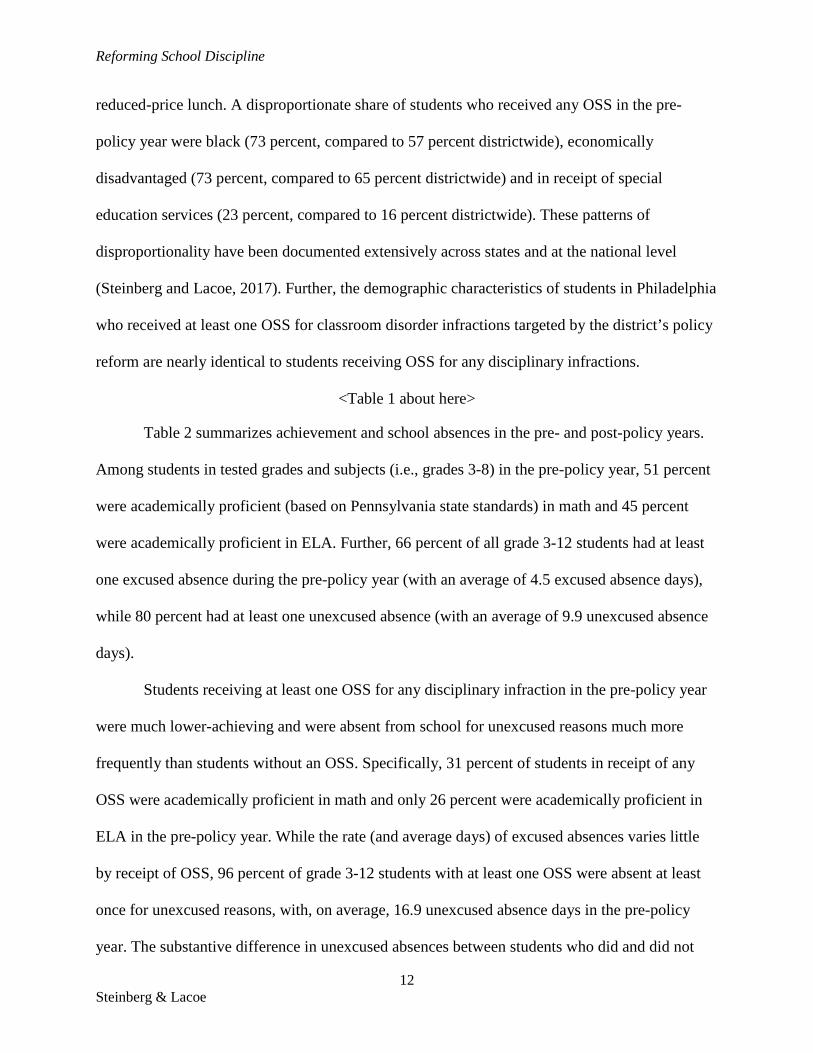
reduced-price lunch. A disproportionate share of students who received any OSS in the pre-
policy year were black (73 percent, compared to 57 percent districtwide), economically
disadvantaged (73 percent, compared to 65 percent districtwide) and in receipt of special
education services (23 percent, compared to 16 percent districtwide). These patterns of
disproportionality have been documented extensively across states and at the national level
(Steinberg and Lacoe, 2017). Further, the demographic characteristics of students in Philadelphia
who received at least one OSS for classroom disorder infractions targeted by the district’s policy
reform are nearly identical to students receiving OSS for any disciplinary infractions.
<Table 1 about here>
Table 2 summarizes achievement and school absences in the pre- and post-policy years.
Among students in tested grades and subjects (i.e., grades 3-8) in the pre-policy year, 51 percent
were academically proficient (based on Pennsylvania state standards) in math and 45 percent
were academically proficient in ELA. Further, 66 percent of all grade 3-12 students had at least
one excused absence during the pre-policy year (with an average of 4.5 excused absence days),
while 80 percent had at least one unexcused absence (with an average of 9.9 unexcused absence
days).
Students receiving at least one OSS for any disciplinary infraction in the pre-policy year
were much lower-achieving and were absent from school for unexcused reasons much more
frequently than students without an OSS. Specifically, 31 percent of students in receipt of any
OSS were academically proficient in math and only 26 percent were academically proficient in
ELA in the pre-policy year. While the rate (and average days) of excused absences varies little
by receipt of OSS, 96 percent of grade 3-12 students with at least one OSS were absent at least
once for unexcused reasons, with, on average, 16.9 unexcused absence days in the pre-policy
year. The substantive difference in unexcused absences between students who did and did not
Reforming School Discipline
13 Steinberg & Lacoe
receive an OSS is notable, given prior evidence that unexcused absences are associated with
lower educational attainment and delinquent behavior in youth (Baker, Sigmon and Nugent,
2001). The patterns of achievement and unexcused absences among students who received at
least one OSS for classroom disorder infractions are again nearly identical to students receiving
OSS for any disciplinary infractions.
<Table 2 about here>
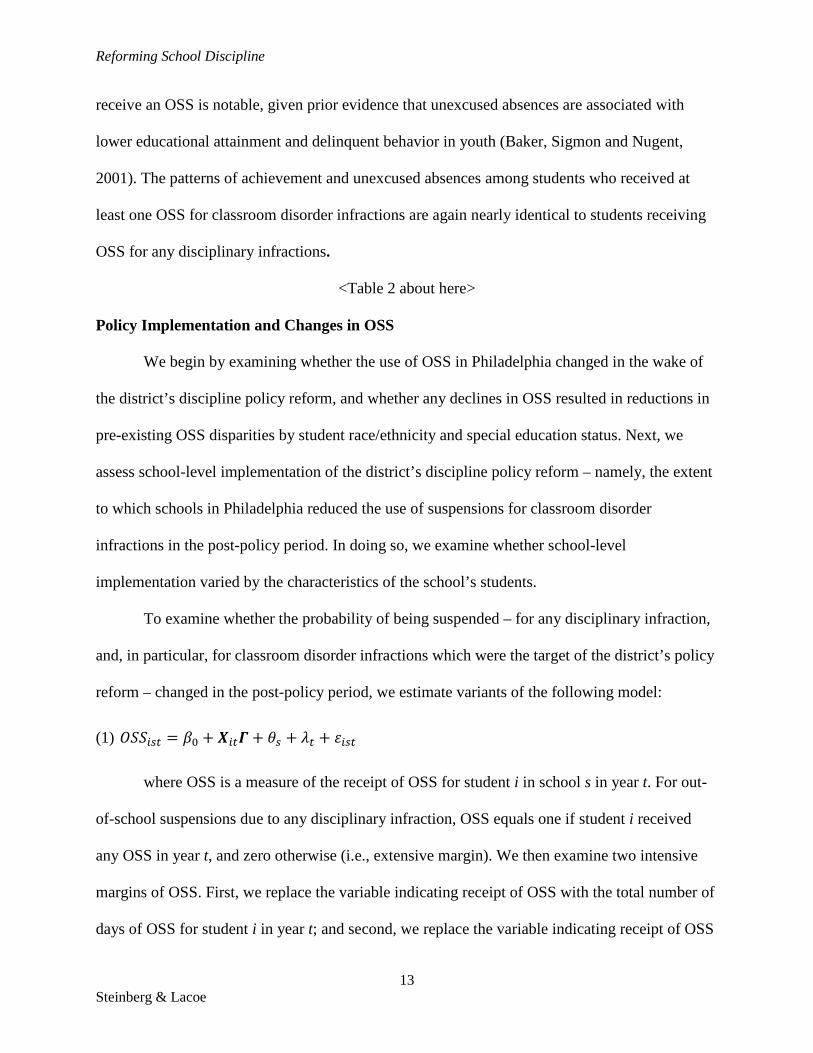
Policy Implementation and Changes in OSS
We begin by examining whether the use of OSS in Philadelphia changed in the wake of
the district’s discipline policy reform, and whether any declines in OSS resulted in reductions in
pre-existing OSS disparities by student race/ethnicity and special education status. Next, we
assess school-level implementation of the district’s discipline policy reform – namely, the extent
to which schools in Philadelphia reduced the use of suspensions for classroom disorder
infractions in the post-policy period. In doing so, we examine whether school-level
implementation varied by the characteristics of the school’s students.
To examine whether the probability of being suspended – for any disciplinary infraction,
and, in particular, for classroom disorder infractions which were the target of the district’s policy
reform – changed in the post-policy period, we estimate variants of the following model:
(1) 𝑂𝑂𝑂𝑖𝑖𝑖 = 𝛽0 + 𝑿𝑖𝑖𝜞 + 𝜃𝑖 + 𝜆𝑖 + 𝜀𝑖𝑖𝑖
where OSS is a measure of the receipt of OSS for student i in school s in year t. For out-
of-school suspensions due to any disciplinary infraction, OSS equals one if student i received
any OSS in year t, and zero otherwise (i.e., extensive margin). We then examine two intensive
margins of OSS. First, we replace the variable indicating receipt of OSS with the total number of
days of OSS for student i in year t; and second, we replace the variable indicating receipt of OSS

Reforming School Discipline
14 Steinberg & Lacoe
with the total number of times student i was suspended in year t. The variable X captures
observable student characteristics, including age, race, gender, grade level, FRPL status, ELL
status and special education status, and the variables 𝜃𝑖 and 𝜆𝑖 represent school and year fixed
effects, respectively. We cluster the standard errors at the school-by-year level to account for
correlation across students within the same school during the same academic year. In equation
(1), interest centers on the year fixed effects (𝜆𝑖), which provide insight into the extent to which
the probability (and days and times) of OSS changed in the post-reform period.
Next, we estimate equation (1) for OSS for classroom disorder infractions targeted by the
policy change – failure to follow classroom rules and the use of profane/obscene language or
gestures. In these models, OSS equals one if student i received an OSS for either type of
classroom disorder infraction in year t, and zero otherwise (i.e., extensive margin).5 All other
variables are defined as in equation (1).
As previously discussed, out-of-school suspensions – both nationally and in Philadelphia
– tend to be disproportionately centered on minority students and students with disabilities (see
Table 1). To gain insight into whether the disproportionate use of OSS in Philadelphia during the
pre-policy period changed with the introduction of the district’s policy reform, we re-estimate
equation (1) by interacting student demographic characteristics – in particular, student race and
special education status – with the year effects.
Did exposure to classroom disorder OSS change following the implementation of the
policy reform? Figure 3 shows the extent to which OSS for both classroom disorder and other
student infractions changed in the post-policy period. In 2011-12, the pre-policy year, the percent
of a school’s students receiving any classroom disorder OSS was, on average, 4.9 percent (see
Figure 3, Panel A); in 2012-13, the first post-policy year, the mean percent of a school’s students 5 Like all OSS, we also examine two intensive margins of conduct OSS – times and days of conduct OSS.

Reforming School Discipline
15 Steinberg & Lacoe
receiving any classroom disorder OSS declined by half, to 2.4 percent (see Figure 3, Panel B).
This post-policy change represents a significant decline in the use of suspensions for low-level
student misconduct. For infractions not targeted by the district’s policy reform, 12.3 percent of a
school’s students, on average, received at least one OSS in 2011-12; the average school-level
exposure rate for OSS for other infractions was 11.6 percent in the 2012-13 school year. Notably,
school-level exposure to OSS for other infractions remained relatively unchanged in the first
post-policy year, suggesting that there was little (if any) substitution away from classroom
disorder OSS to suspensions for more serious student misconduct across all grade 3-12 students.
<Figure 3 about here>
Table 3 summarizes evidence of the post-policy change in OSS, for all infractions and
those targeted by the district’s policy reform. In the first post-policy year, the districtwide OSS
rate declined by 1.3 percentage points, with no evidence of any additional change in the OSS rate
by the second post-policy year. Though the total number of suspensions declined in the first post-
policy year by approximately 2 per 100 students (an 8 percent decline), there was no
commensurate change in the number of suspension days. Instead, there was a modest increase in
the total number of suspension days – on the order of 8 days per 100 students – by the second
post-policy year. Focusing on OSS for classroom disorder, we find significant declines in the use
of OSS in the post-policy period. Specifically, the district’s policy reform was associated with a
2.2 percentage point (or 44 percent) decrease in the classroom disorder OSS rate, 3 fewer
classroom disorder suspensions (per 100 students), and 5 fewer days of suspension (per 100
students) in the first post-policy year. In contrast, we find a concurrent increase in days of OSS

Reforming School Discipline
16 Steinberg & Lacoe
for other infractions.6 While there is no evidence of an incremental change in classroom disorder
OSS in the second post-policy year, suggesting that any policy-related changes in classroom
disorder OSS were concentrated in the first post-policy year, we do find increases in the rate,
times, and days of OSS for other infractions in the second post-policy year.
< Table 3 about here >
Did the disproportionate use of OSS, by student race and special education status, change
in the post-policy period? In Table 4, we explore whether OSS rates, times, or days changed for
students of different racial and ethnic backgrounds relative to white students. In the first post-
policy year, black students experienced an increase in the number of days suspended for any
infraction, on the order of 8 days per 100 students, relative to their white peers (Table 4, column
7). In the second post-policy year, there were additional increases in the number and days of
suspension for black, Hispanic, and other race students. The OSS rate also increased for students
who identify as other race relative to white students. Overall, the policy change did not reduce
racial disproportionality in the use of OSS. Instead, there were modest increases in the number
and days of OSS for black students following the policy change, with those increases
concentrated in the second post-policy year.
We find a decrease in the disproportionate use of classroom disorder OSS for black
students relative to their white peers, and that these declines are concentrated in the first post-
policy year. However the reduction in the classroom disorder OSS rate (and days of classroom
disorder OSS) for black students relative to their white peers did not translate into a reduction in
the overall use of OSS. In fact, the relative decline in classroom disorder OSS (between black,
Hispanic and other race students relative to their white peers) was smaller in magnitude than the
6 In results not presented here (but available from the authors), these changes in classroom disorder OSS are invariant to the inclusion of student characteristics or school fixed effects, suggesting that the policy reform was largely exogenous to these characteristics (given that the reform was at the district-level).

Reforming School Discipline
17 Steinberg & Lacoe
relative increase in the use of OSS for other infractions. These findings suggest that the observed
improvement in the disproportionality of classroom disorder OSS may have resulted from
schools shifting punishments for minority students away from classroom disorder OSS to OSS
for other infractions in the post-period.
< Table 4 about here >
High rates of OSS are also a concern for special education students. In Table 5, we
examine whether the disproportionate use of OSS, both overall and for classroom disorder
infractions targeted by the policy reform, changed for special education students relative to their
general education peers. Overall, we find that there was no change in the OSS rate, number, or
days of suspension for students in special education. When we consider OSS for classroom
disorder infractions, we find significant and substantive decreases in all three measures of
classroom disorder OSS. Given that we do not find any evidence of offsetting increases in OSS
for other infractions for special education students, these results suggest that the policy reform
was associated with a reduction in the disproportionate use of classroom disorder OSS for special
education students.
< Table 5 about here >
Though the districtwide OSS rate for classroom disorder declined by half in the post-
policy period – from 5.0 to 2.7 percent (see Figure 1, Panel A) – it was not reduced to zero,
reflecting the fact that the policy reform was not fully implemented districtwide. Indeed, 185 of
the 238 schools (77.7 percent) open in both pre- and post-reform years reduced their OSS rates
for classroom disorder in 2012-13 from non-zero levels in 2011-12, of which 43 schools (18.1
percent) reduced classroom disorder OSS to zero in the post-policy year (see Figure 4). Of note

Reforming School Discipline
18 Steinberg & Lacoe
is that 12 schools (5.0 percent) had zero OSS for classroom disorder in both the pre- and post-
policy years.
<Figure 4 about here>
Table 6 summarizes the characteristics of each of four school types, based on the extent
of school-level policy implementation. These school types include: (i) “non-compliance schools”
that did not reduce their use of classroom disorder OSS from pre-reform levels; (ii) “partial
compliance schools” that reduced their use of classroom disorder OSS to non-zero levels; (iii)
“full compliance schools” that reduced their use of classroom disorder OSS to zero; and (iv) “no
classroom disorder OSS schools” that had zero OSS for classroom disorder in both the pre- and
post-policy years. Among non-compliers, the classroom disorder OSS rate in fact increased, on
average, by 2.67 percentage points, effectively doubling the proportion of students receiving
classroom disorder OSS from 3 percent in 2011-12 to 6 percent in 2012-13. For partial
compliers, the classroom disorder OSS rate declined, on average, by 3.2 percentage points,
reducing the share of students receiving classroom disorder OSS from 6 percent, on average, in
2011-2 to 3 percent in 2012-13. Among full compliers the classroom disorder OSS rated
declined, on average, by 2.5 percentage points.
<Table 6 about here>
The student composition of schools varies substantially by level of policy
implementation. A larger share of minority and academically struggling students attended non-
complier schools compared to schools that implemented (in part or in whole) the district’s policy
reform. Indeed, in the pre-policy year, 85 percent of students in these schools were black or
Hispanic, compared to 76 percent in partial complier schools and 70 percent in full complier
schools (see Table 6, Panel B). Further, students in non-complier schools scored 0.11 standard
Reforming School Discipline
19 Steinberg & Lacoe
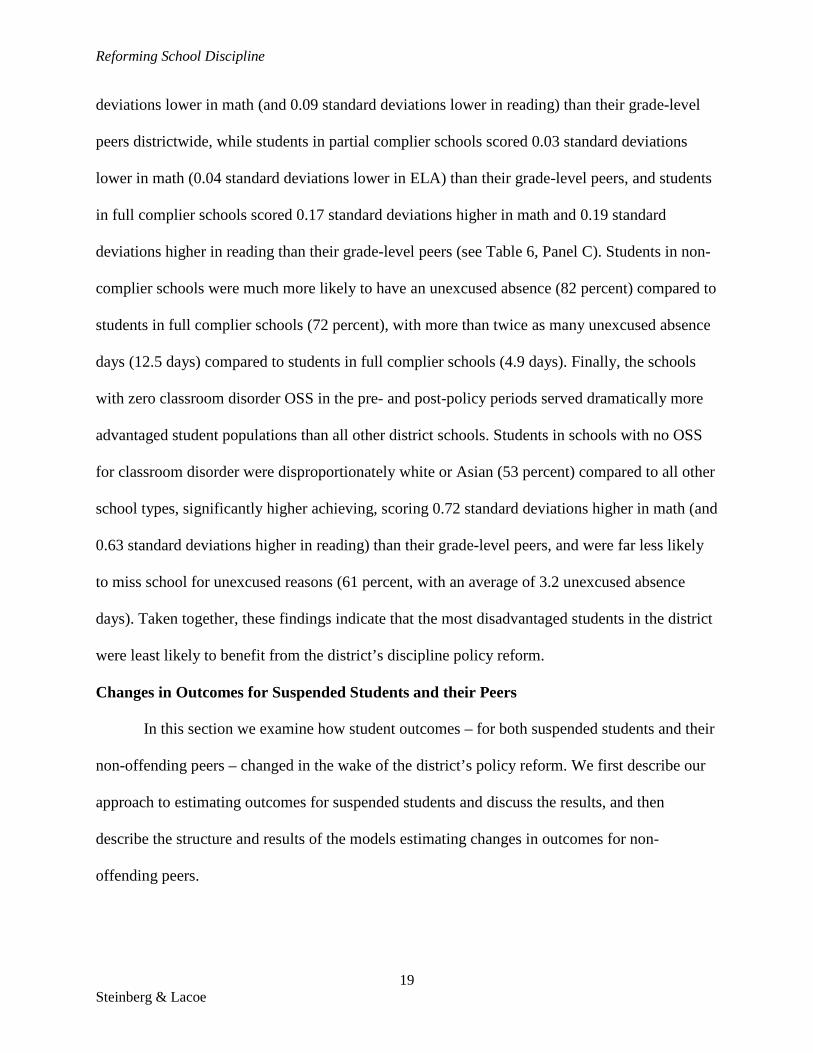
deviations lower in math (and 0.09 standard deviations lower in reading) than their grade-level
peers districtwide, while students in partial complier schools scored 0.03 standard deviations
lower in math (0.04 standard deviations lower in ELA) than their grade-level peers, and students
in full complier schools scored 0.17 standard deviations higher in math and 0.19 standard
deviations higher in reading than their grade-level peers (see Table 6, Panel C). Students in non-
complier schools were much more likely to have an unexcused absence (82 percent) compared to
students in full complier schools (72 percent), with more than twice as many unexcused absence
days (12.5 days) compared to students in full complier schools (4.9 days). Finally, the schools
with zero classroom disorder OSS in the pre- and post-policy periods served dramatically more
advantaged student populations than all other district schools. Students in schools with no OSS
for classroom disorder were disproportionately white or Asian (53 percent) compared to all other
school types, significantly higher achieving, scoring 0.72 standard deviations higher in math (and
0.63 standard deviations higher in reading) than their grade-level peers, and were far less likely
to miss school for unexcused reasons (61 percent, with an average of 3.2 unexcused absence
days). Taken together, these findings indicate that the most disadvantaged students in the district
were least likely to benefit from the district’s discipline policy reform.
Changes in Outcomes for Suspended Students and their Peers
In this section we examine how student outcomes – for both suspended students and their
non-offending peers – changed in the wake of the district’s policy reform. We first describe our
approach to estimating outcomes for suspended students and discuss the results, and then
describe the structure and results of the models estimating changes in outcomes for non-
offending peers.
Reforming School Discipline
20 Steinberg & Lacoe
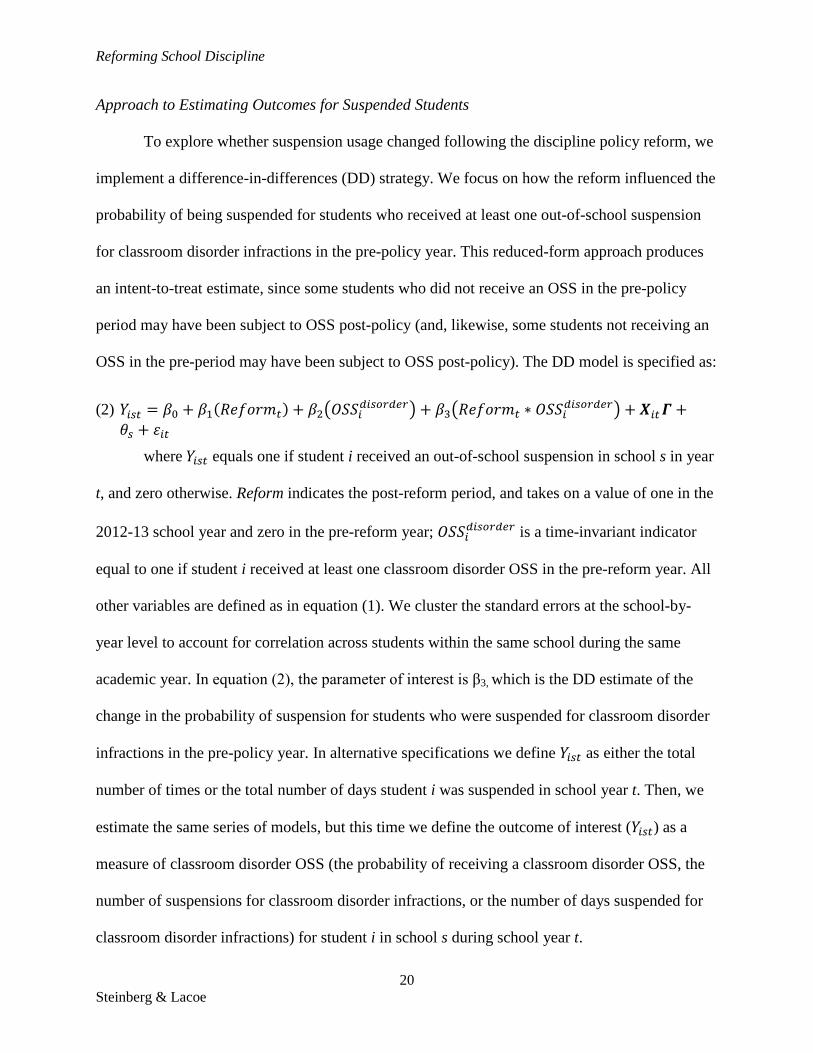
Approach to Estimating Outcomes for Suspended Students
To explore whether suspension usage changed following the discipline policy reform, we
implement a difference-in-differences (DD) strategy. We focus on how the reform influenced the
probability of being suspended for students who received at least one out-of-school suspension
for classroom disorder infractions in the pre-policy year. This reduced-form approach produces
an intent-to-treat estimate, since some students who did not receive an OSS in the pre-policy
period may have been subject to OSS post-policy (and, likewise, some students not receiving an
OSS in the pre-period may have been subject to OSS post-policy). The DD model is specified as:
(2) 𝑌𝑖𝑖𝑖 = 𝛽0 + 𝛽1(𝑅𝑅𝑅𝑅𝑅𝑅𝑖) + 𝛽2�𝑂𝑂𝑂𝑖𝑑𝑖𝑖𝑑𝑑𝑑𝑑𝑑� + 𝛽3�𝑅𝑅𝑅𝑅𝑅𝑅𝑖 ∗ 𝑂𝑂𝑂𝑖𝑑𝑖𝑖𝑑𝑑𝑑𝑑𝑑� + 𝑿𝑖𝑖𝜞 +𝜃𝑖 + 𝜀𝑖𝑖
where 𝑌𝑖𝑖𝑖 equals one if student i received an out-of-school suspension in school s in year
t, and zero otherwise. Reform indicates the post-reform period, and takes on a value of one in the
2012-13 school year and zero in the pre-reform year; 𝑂𝑂𝑂𝑖𝑑𝑖𝑖𝑑𝑑𝑑𝑑𝑑 is a time-invariant indicator
equal to one if student i received at least one classroom disorder OSS in the pre-reform year. All
other variables are defined as in equation (1). We cluster the standard errors at the school-by-
year level to account for correlation across students within the same school during the same
academic year. In equation (2), the parameter of interest is β3, which is the DD estimate of the
change in the probability of suspension for students who were suspended for classroom disorder
infractions in the pre-policy year. In alternative specifications we define 𝑌𝑖𝑖𝑖 as either the total
number of times or the total number of days student i was suspended in school year t. Then, we
estimate the same series of models, but this time we define the outcome of interest (𝑌𝑖𝑖𝑖) as a
measure of classroom disorder OSS (the probability of receiving a classroom disorder OSS, the
number of suspensions for classroom disorder infractions, or the number of days suspended for
classroom disorder infractions) for student i in school s during school year t.
Reforming School Discipline
21 Steinberg & Lacoe
Next, we examine whether academic achievement and school engagement (as measured
by both excused and unexcused absences) changed following the discipline policy reform.
Again, we focus on suspended students – those students who received at least one out-of-school
suspension in the pre-policy year for classroom disorder infractions. We re-estimate equation (2)
with each student-level outcome – student achievement (in math and ELA) and school absences
– for student i in school s during school year t.
This DD approach examines the change in outcomes between students who received a
classroom disorder OSS in the pre-reform year and students who did not. There are two main
limitations to this approach. First, we are unable to observe the underlying behaviors that lead to
suspensions in our data. Therefore, we are unable to distinguish the degree to which changes in
student outcomes reflect a behavioral change induced by the policy reform (that resulted in fewer
suspensions) from a reduction in the use of suspension as a response to (similar) levels and types
of student misbehavior. Second, all traditional public schools in Philadelphia were subject to the
district’s policy reform. Because the reform was not randomly assigned to schools within the
district, we are unable to conduct a DD approach which would compare changes in outcomes for
students exposed to the policy reform to students in schools not subject to the reform. Therefore,
estimates described in equation (2) differ from a more typical setting in which a DD approach
may be employed – namely, where treatment status is not a function, in part, of a pre-policy
condition, such as receipt of classroom disorder OSS. Given this, we conduct multiple robustness
checks to ensure that pre-reform achievement trends evolved similarly across the two groups,
and that non-random student enrollment patterns – either entry into or exit from the district in the
pre- and post-policy years – do not drive the results we attribute to the policy.

Reforming School Discipline
22 Steinberg & Lacoe
Changes in Outcomes for Suspended Students
To what extent did the district’s policy reform result in changes to the probability of
receiving an OSS, conditional on receiving a classroom disorder OSS in the pre-policy period?
Table 7 summarizes these results. We find that the probability of receiving an OSS in the post-
policy period declined by 0.55 percentage points (Table 7, column 1). Further, the number of
times students were suspended, on average, following the policy reform declined by 1.5
suspensions (Table 7, column 4), and the number of suspension days declined by 2.5 days (Table
7, column 7). The policy reform induced an even larger response on classroom disorder OSS –
the probability of receiving a classroom disorder OSS declined by 0.88 percentage points in the
post-policy year (Table 7, column 2), with declines in both the number of times students received
classroom disorder OSS (1.2 classroom disorder suspensions) and the number of days of
classroom disorder OSS assigned (2 days) (Table 7, columns 5 and 8). Though the policy reform
did not reduce classroom disorder OSS to zero, as intended, there was a large and consistent
decrease in the use of OSS for classroom disorder infractions following the policy reform.7
While the overall decline in OSS is driven by decreases in classroom disorder OSS, we also
observe smaller, but significant declines in OSS for other infractions following the policy change
(Table 7, columns 3, 6, and 9).
< Table 7 about here >
Did the decrease in suspension usage following the policy reform translate into improved
learning and engagement among offending students? In table 8, we extend the DD models to
examine whether math and ELA achievement changed following the reform. For students who
7 The estimates are nearly identical in magnitude and significance across specifications that do and do not include controls for student characteristics and school fixed effects, suggesting that variation in these factors do not drive our estimates of the change in classroom disorder OSS following the policy reform. These results are available from the authors upon request.
Reforming School Discipline
23 Steinberg & Lacoe
were suspended for a classroom disorder infraction in the pre-policy period, there are no
significant changes in math or ELA achievement in the post-period (Table 8, Panel A, columns 3
and 6). However, there is a marginally significant improvement in math proficiency for
previously suspended students in the post-period (Table 8, Panel B, column 3).
< Table 8 about here>
The policy reform does appear to have triggered a significant behavioral response among
students who were suspended for a classroom disorder infraction in the pre-policy year. In Table
9, we show that total days absent decreased by 1.5 days following the policy reform (column 3).
Though the change in excused absences is statistically significant (a 0.76 day decrease, shown in
column 6), it differs little in magnitude from the change in unexcused absences for these students
(a 0.69 day decrease, shown in column 9). Importantly, this reduction in total days absent is
independent of the total number of school days recovered due to a reduction in suspension days.
Therefore, the policy reform is related to an increase in school attendance of approximately 4
days – 2.5 days due to fewer OSS days (see Table 7) plus 1.5 days due to fewer days absent from
school. In sum, for offending students, we observe little influence of the district’s policy reform
on their academic achievement, but a significant decrease in days absent from school.
< Table 9 about here>
Finally, we link estimates of the relationship between the discipline policy reform and the
achievement of suspended students (in grades 3-8 with available test data) to both (a) the
reduction in suspension days and (b) the reduction in school absence days due to the district’s
discipline policy reform.8 Among students in grades 3-8 (with available achievement data), we
find that the number of any suspensions declined by 1.3 (and decreased classroom disorder OSS
8 Results for the relationship between the discipline policy reform and suspension days and absence days for the achievement sample of students (i.e., students in grades 3-8) are available from the authors upon request.

Reforming School Discipline
24 Steinberg & Lacoe
by 1.2 suspensions) following the policy reform, corresponding to a reduction of 2.1 suspension
days for any infraction (and 1.95 fewer suspension days for classroom disorder infractions).
Further, excused absences declined by 0.5 days (with no significant change in unexcused
absence days). Taken together, following Philadelphia’s discipline reform is related to a decline
in school absences by approximately 2.5 days (including reduced suspension and excused
absence days) for previously suspended students, and a modest, marginally significant increase
in the probability of passing math exams (the ELA estimate is equal in magnitude, but not
significant; see Table 8). These results are consistent with other evidence on how marginal
changes in school-year length may improve student achievement (e.g., Goodman, 2014). Further,
estimates of policy-induced improvements in math and reading achievement of 0.02 standard
deviations, though not statistically different from zero, are equivalent in magnitude to estimates
of the (negative) effect of receiving a two-day classroom disorder OSS on student achievement
(Lacoe and Steinberg, 2017a).
Robustness Checks
One concern related to the DD strategy is that the achievement of suspended students –
those suspended for classroom disorder infractions in 2011-12 – evolved differently from non-
suspended students prior to the 2011-12 school year. Variation in pre-2011-12 achievement
trajectories across suspended (i.e., those treated by the 2012-13 district-level reform) and non-
suspended students would bias the DD estimates. Figures A1 and A2 show that pre-2011-12
trends in student achievement, for math and ELA, evolved similarly for both suspended students
and their non-suspended peers.9
9 For students present in the 2011-12 school year, we observe their annual ELA and math achievement scores going back to the 2008-09 school year. For these students, we present the trend in student achievement based on student-level proficiency (i.e., whether the student met or exceeded state learning standards in math and ELA). We use student-level proficiency for a number of reasons. First, we do not observe the population of grade 3-8 students in

Reforming School Discipline
25 Steinberg & Lacoe
Further, since our primary estimates are based on students present in the district during
the immediate pre- and post-policy years, an additional concern is that non-random student
enrollment patterns – either entry into or exit from the district in these years – drive the results
we attribute to the policy reform. To address concerns that estimates of district-level policy
reform are due to student enrollment patterns rather than the reform itself, we examine the
sensitivity of our results to alternative student samples. We construct three alternative samples
based on student tenure in the district;10 these samples include: (a) students present in SDP in
each year during the 2008-09 through 2012-13 school year period; (ii) students present in SDP in
each year during the 2009-10 through 2012-13 school year period; and (iii) students present in
SDP in each year during the 2010-11 through 2012-13 period (see Table A1 for a summary of
students in each of the three alternative samples). For each sample, we compare the change in
outcomes following the policy reform for students who received a classroom disorder OSS pre-
policy (2011-12) to students who did not.
We find that estimates of the relationship between the policy reform and OSS –the
probability of a classroom disorder suspension, the number of classroom disorder suspensions,
and the number of days suspended for a classroom disorder infraction – are robust to these
alternative student samples (see Table A2; Table 7 presents results for the primary sample). We
also find nearly identical results for the achievement outcomes, in both math and ELA, for the
alternative samples (Table A2) compared to the primary student sample (Table 8). Finally, we
find very slight differences in the attendance results (Table A3). For the primary sample, students Philadelphia who were tested on state accountability exams during the pre-2011-12 period. As a result, the norming population of tested students in grades 3-8 changes over time during the pre-reform period. Student-level proficiency provides a comparable measure of student achievement both within and across schools years in the pre-2011-12 period, and avoids concerns related to variation in the underlying population of tested students in the district (from which to generate standardized achievement scores). 10 The primary sample used in the analysis includes all students in grades 3-12 in the 2011-12 and 2012-13 years (and in grades 3-8 for the achievement sample). Information on the enrollment records for these students, which go back to the 2008-09 school year, allow us to identify student tenure in the district.
Reforming School Discipline
26 Steinberg & Lacoe
who had been suspended prior to the reform were absent 1.45 fewer days following the policy
reform (Table 9). Though estimates based on the alternative samples are only marginally
significant, they are statistically similar in magnitude with the primary results, suggesting
approximately 1 less day of absence, on average, post-policy. These findings indicate that our
primary results are robust to these alternative samples of students (who were present for longer
periods of time in the district), and suggest that our results are not driven by sample construction
or systematic differences in the outcomes of students entering or exiting the district at the same
time as the policy change went into effect.
Approach to Estimating Outcomes for Non-Offending Peers
A primary critique of policies that aim to reduce the use of suspensions is the potential
for unintended, negative consequences for non-offending students. Indeed, the academic and
behavioral outcomes of non-offending students – those who share schools and classrooms with
students who are suspended for low-level disciplinary infractions – may be affected by the
presence (or absence) of their offending peers. However, the direction of spillover effects on
non-offending peers, ex ante, is unclear. For instance, if students who remain in the classroom in
lieu of a suspension are disruptive to other students, peer achievement and attendance may
suffer. At the same time, if previously suspended students require more academic attention, this
additional attention would crowd out instructional time devoted to other students, and could also
affect non-offending peer outcomes. Alternatively, if the frequency of suspensions reflects
disorder within the school and classroom, then fewer suspensions should be related to improved
peer achievement and attendance. Finally, if less exclusionary discipline is positively related to
the school engagement of prior offenders, then we might also expect improvements in peer
outcomes (Arum, 2003; Mitchell and Bradshaw, 2013). Though we are unable to directly

Reforming School Discipline
27 Steinberg & Lacoe
attribute any one (or more) of these potential explanations to changes in non-offending peer
outcomes, they provide important context for any observed peer effects.
To explore changes in non-offending peer outcomes following the policy reform, we
leverage variation in the degree of school-level implementation of the district-level reform.
Students in two types of schools were exposed to a reduction in the schoolwide classroom
disorder OSS rate following the district-level policy change. These groups are: (i) full
compliance schools which reduced the classroom disorder OSS rate from non-zero levels in
2011-12 to zero in the 2012-13 school year; and (ii) partial compliance schools which reduced
their classroom disorder OSS rate from non-zero levels in 2011-12 to non-zero levels during the
2012-13 school year.
We compare the change in outcomes for non-offending peers (i.e., students with no OSS
in either the pre- or post-policy periods) to a third group of students – non-offending students in
schools with no classroom disorder OSS in either the pre- or post-policy years. Students
attending this third group of schools were not exposed to a change in suspension rates over the
study period. We specify the model as:
(3) 𝑌𝑖𝑖𝑖 = 𝛽0 + 𝛽1(𝑅𝑅𝑅𝑅𝑅𝑅𝑖) + 𝛽2(𝐹𝐹𝐹𝐹𝐹𝑅𝑅𝐹𝐹𝐹𝐹𝐹𝐹𝑅𝑖) + 𝛽3(𝑃𝐹𝑅𝑃𝐹𝐹𝐹𝐹𝑅𝑅𝐹𝐹𝐹𝐹𝐹𝐹𝑅𝑖) +𝛽4(𝑅𝑅𝑅𝑅𝑅𝑅𝑖 ∗ 𝐹𝐹𝐹𝐹𝐹𝑅𝑅𝐹𝐹𝐹𝐹𝐹𝐹𝑅𝑖) + 𝛽5(𝑅𝑅𝑅𝑅𝑅𝑅𝑖 ∗ 𝑃𝐹𝑅𝑃𝐹𝐹𝐹𝐹𝑅𝑅𝐹𝐹𝐹𝐹𝐹𝐹𝑅𝑖) + 𝑿𝑖𝑖𝜞 + 𝜃𝑖 +𝜀𝑖𝑖𝑖
The analytic sample includes non-offending peers in these three school types: full
compliance, partial compliance, and no classroom disorder OSS schools. The variable Reform
takes the value of 1 in the post-period (2012-13) and zero in the pre-reform year (2011-12). The
variable FullCompliance takes the value of 1 if a student attends a school that reduced the
classroom disorder OSS rate to zero in the post-policy period and 0 if the student is in either a
partial compliance or comparison school; and PartialCompliance takes the value of 1 if a student

Reforming School Discipline
28 Steinberg & Lacoe
is in a school that reduced the classroom disorder OSS rate (but not to zero) in the post period
and 0 if the student is in either a full compliance or comparison school. The parameters of
interest are 𝛽4 – the DD estimate for students attending full compliance schools (relative to
students attending no classroom disorder OSS comparison schools), and 𝛽5 – the DD estimate
for students attending partial compliance schools (relative to students attending no classroom
disorder OSS comparison schools). All other variables are defined as in equation (1), and we
cluster the standard errors at the school-by-year level.
We consider estimates of 𝛽4 and 𝛽5 as upper and lower bounds, respectively, on the
spillover effect for non-offending peers. Specifically, these estimates provide insight into the
range of the spillover effect, which likely varies as a function of school-level implementation.
Though 𝛽4 provides the best estimate of changes in achievement and attendance of non-
offending peers following the reform, it is based on a particular sample of schools – those that
fully complied with the district’s policy reform. These schools served different student
populations than schools that partially complied with the policy reform along two important
dimensions. First, full compliance schools had lower levels of classroom disorder OSS in the
pre-policy period than partial compliance schools; therefore the marginal reduction in classroom
disorder OSS in the post-policy years may differentially influence peer outcomes. Second,
student composition – in particular, pre-policy achievement – differed between full compliance
and partial compliance schools; therefore, the marginal student who is brought back into the
classroom in the post-policy year (in lieu of a classroom disorder OSS) will be a lower-
performing, more disadvantaged student. As a result, the estimate of the influence of the policy
change among full compliance schools will represent an upper bound of the peer effect – the
effect of full implementation in a relatively well-functioning school environment. In contrast, the
Reforming School Discipline
29 Steinberg & Lacoe
estimate for partial compliance schools will reflect a lower bound of the peer effect – the effect
in schools facing greater challenges in implementing the policy (and which serve a more
disadvantaged student population). Together, both margins are critical for policymakers to
consider when designing and implementing discipline policy reforms, given that some schools
may be better able to implement district-level reforms.
Changes in Outcomes for Non-Offending Peers
The estimated relationship between the district’s policy reform and outcomes for non-
offending students varied as a function of school-level policy implementation. Table 10 presents
evidence on the change in non-offending peer math and ELA achievement following the policy
reform. We find that math achievement among non-offending peers attending partial compliance
schools declined in the wake of the district policy reform, on the order of -0.06 standard
deviations (Panel A, Column 3). The decrease was large enough to reduce the likelihood that
these students would achieve academic proficiency in math. We find no change in these
students’ ELA achievement following the policy reform. In contrast, in schools that fully
complied with the policy reform, we find little change in peer achievement following the reform.
The small, marginally significant decrease in peer ELA achievement (-0.02 standard deviations)
does not result in lower ELA proficiency rates for non-offending students in these schools, nor is
it statistically different from the estimates for students in partial compliance schools.
< Table 10 about here>
In Table 11, we present estimates of changes in peer absences following the policy
reform. Again, the results vary by the extent of school-level policy implementation. For students
in full compliance schools, there is no change in peer absences. However, absences increased in
the wake of the policy-reform for non-offending peers in partial compliance schools (an increase

Reforming School Discipline
30 Steinberg & Lacoe
of 0.45 days absent, representing a 3 percent increase for the average student). The overall
change in absences is driven by a large increase in unexcused absences among peers (0.78 days,
representing an 8 percent increase in unexcused days absent), and a small, offsetting decrease in
excused absences (0.32 days).11 These results suggest that the conditions in schools that were not
able to fully comply with the policy change may have led non-offending peers to stay home from
school more frequently. Overall, we find no detrimental effect of the policy change on non-
offending peers in schools that fully complied with the policy. However, we find consistent
evidence that the policy reform is negatively related to the academic achievement and school
attendance of non-offending peers in schools that did not fully comply with the district’s policy
reform.
< Table 11 about here>
Variation in the relationship between the policy reform and outcomes for non-offending
students in full and partial compliance schools may be due to several factors. First, as discussed
in the policy implementation section, students in full and partial compliance schools are exposed
to different underlying suspension rates (see Table 6). In fact, prior to the policy change, students
in partial compliance schools were exposed to classroom disorder OSS rates that were, on
average, twice as large as the classroom disorder OSS rate that students in full compliance
schools experienced. Even after the policy change, students in full compliance schools were
exposed to the same classroom disorder OSS rate that was present in full compliance schools
before the policy was implemented. This is consistent with evidence that schools with lower
suspension rates implemented a statewide bullying law with greater fidelity than schools with
higher suspension rates (Hall and Chapman, 2016). Second, partial and full compliance schools
11 These results are consistent in magnitude and significance when estimated on the achievement sample, which includes non-offending students in grades 3-8 (n=80,735), and are available from the authors upon request.

Reforming School Discipline
31 Steinberg & Lacoe
served different student populations. Specifically, the academic achievement of students in
partial compliance schools was significantly lower than in the full compliance schools in the pre-
reform period. Therefore, the marginal student remaining in the classroom in lieu of being
suspended in the post-reform period will be, on average, lower performing. Finally, schools that
are unable to fully comply with the policy reform and reduce classroom disorder OSS to zero are
likely struggling with different (and more prevalent) patterns of student misbehavior. As a result,
these schools may lack the resources and practices to respond to student misconduct in ways that
promote a school environment that is conducive to learning for all students.
Though we acknowledge that these factors may be related to whether (and the extent to
which) schools complied with the district reform, concerns related to bias in the estimate on peer
achievement may be less severe than this suggests. Namely, we show that non-offending peer
achievement, by school compliance status, evolved similarly during the pre-reform period (see
Figure A2). While schools differ in terms of their student populations and OSS rates, the similar
pre-reform achievement trends for non-offending peers mitigate some concern related to the DD
approach for estimating peer effects.
Conclusion
The School District of Philadelphia was among the first districts nationwide to reform its
student code of conduct in an effort to reduce out-of-school suspensions for classroom disorder
infractions. In this paper, we find that the classroom disorder OSS rate, the number of classroom
disorder suspensions, and the number of days students were suspended for classroom disorder
infractions declined in the wake of the policy reform. These reductions translated into lower
overall OSS rates in Philadelphia following the policy reform. The reform also resulted in
improvements in classroom disorder OSS rates for students in special education, narrowing the

Reforming School Discipline
32 Steinberg & Lacoe
disparity in OSS rates relative to general education students. In contrast, the reform effort was
less successful in narrowing racial and ethnic disparities in OSS.
Though suspensions for classroom disorder infractions in the pre-policy period were
typically short in duration – two days of missed school, on average – students who were
suspended for classroom disorder infractions in the pre-policy year experienced marginal
increases in math proficiency and improved attendance following the policy change. These
results support the idea that limiting the use of OSS as a disciplinary response to low-level
misconduct is beneficial for students who would have otherwise been suspended. For non-
offending peers, the results varied as a result of school-level policy implementation. Evidence
that policy implementation was not uniform across schools in Philadelphia underscores the fact
that a school’s capacity to reduce its use of OSS may be constrained by differences in pre-reform
misconduct rates as well as academic achievement among the school’s students. The degree of
implementation fidelity is a critical factor in understanding how the policy influenced outcomes
for non-offending peers. We find that in schools that fully complied with the policy, there was no
change in the achievement or attendance of non-offending peers. In contrast, in schools that
partially complied with the policy, peer achievement and attendance suffered.
These results provide important evidence to inform policymakers as they consider school
discipline policy reform. While the policy reform was effective at reducing classroom disorder
OSS, it was less effective at addressing racial disparities in the use of OSS. Specifically, while
classroom disorder OSS declined for black students following the policy change, a larger,
offsetting increase in OSS for other infractions resulted in overall increases in suspensions for
these students, relative to their white peers. The change could be due to an increase in infractions
other than classroom disorder by this group of students in the post-policy year. However, we
Reforming School Discipline
33 Steinberg & Lacoe
only observe this pattern for black students, and to a lesser extent Hispanic and other race
students, relative to white students, making it unlikely that underlying changes in student
behavior are driving increases in racial disproportionality. Alternatively, these patterns could be
the result of school administrators re-categorizing infractions that would have been labeled
classroom disorder infractions prior to the policy change, as other infractions in the post-policy
year, in order to use OSS as a disciplinary consequence for student misbehavior. Evidence on the
potential misuse of such policy reforms should inform the design of discipline policy and require
district leaders to be more vigilant about school-level practices that may exacerbate (or, at
minimum, do nothing to reduce) pre-reform disparities in OSS.
Second, the potential for adverse spillover effects on non-offending peers depends
critically on the school context in which district-level policy is implemented. Estimates of the
relationship between district policy reform and outcomes for non-offending peers leverage
variation in school-level implementation of the district reform. One limitation of this strategy for
uncovering peer effects is the non-random selection of schools into compliance status. This non-
random selection is likely a function of differences in school-level capacity to implement the
district-level reform. In particular, capacity constraints may result from cross-school differences
in available human capital to address student misconduct, the academic and behavioral needs of
students, as well as the potential misalignment between the district’s policy goal to eliminate
classroom disorder OSS and the ways in which school leaders respond to and implement district-
level reforms. We further acknowledge that we do not observe whether schools incorporated
alternative approaches to OSS, such as restorative justice practices, SWPBIS, or other alternative
discipline strategies that aim to keep students in school (i.e., in-school suspension). If schools
differentially implemented these alternative approaches by compliance status in the year of the

Reforming School Discipline
34 Steinberg & Lacoe
district-level reform, then such changes in discipline practices may account for some part of the
estimated peer effects.
Still, our results point to the need for district leaders to provide greater support for
educators and school leaders tasked with implementing discipline reform in schools with higher
pre-reform OSS rates and which serve more academically struggling students. Though some
school leaders and principals in Philadelphia may not have been fully aware of the policy change
or may even have resisted its implementation by continuing to suspend students for low-level
offenses, few additional resources (such as in-school counselors or support staff) were provided
to school principals to support the policy change.12 This is in light of evidence that changing
school discipline practices can be difficult and requires appropriate professional development,
technical assistance and administrative support to ensure that schools are able to successfully
implement alternative approaches (Skiba and Losen, 2016). Therefore, policymakers focused on
changing the statutory penalties for low-level, student misconduct (i.e., code of conduct reforms)
should couple these reforms with school-based resources that support teacher training in
alternative discipline strategies. For example, alternative strategies such as Positive Behavioral
Interventions and Supports (PBIS) target a school’s overall social culture and provide intensive
behavior supports, and have been shown to successfully decrease suspensions (Bradshaw,
Mitchell, and Leaf, 2010) and improve student perceptions of school safety (Horner et al., 2009).
Ultimately, schools struggling the most with student misconduct require additional district
support to successfully implement discipline reform and to ensure that non-offending students
are not adversely affected by such reforms.
12 Authors’ correspondence with Rachel Holzman, Philadelphia’s Deputy Chief of Student Rights and Responsibilities (March 23, 2015).
Reforming School Discipline
35 Steinberg & Lacoe
References Arcia, E. (2006). Achievement and enrollment status of suspended students: Outcomes in a large,
multicultural school district. Education and Urban Society, 38(3), 359-369.
Arum, R. (2003). Judging school discipline: The crisis of moral authority. Cambridge, MA: Harvard University Press.
Baker, M. Sigmon, J. & Nugent, M. (2001). Truancy reduction: Keeping students in school. Office of Justice Programs, U.S. Department of Justice.
Balfanz, R., Byrnes, V., & Fox, J. H. (2015). Sent home and put off track: The antecedents, disproportionalities, and consequences of being suspended in the 9th grade. In Closing the school discipline gap: Equitable remedies for excessive exclusion, ed. D. Losen, 17-30.
Bradshaw, C. P., Mitchell, M. M., & Leaf, P. J. (2010). Examining the effects of schoolwide positive behavioral interventions and supports on student outcomes results from a randomized controlled effectiveness trial in elementary schools. Journal of Positive Behavior Interventions, 12(3): 133–148.
Cobb-Clark, D. A., Kassenboehmer, S. C., Le, T., McVicar, D., & Zhang, R. (2015). Is there an educational penalty for being suspended from school? Education Economics, 23(4), 376-395.
Curran, F. C. (2016). Estimating the Effect of State Zero Tolerance Laws on Exclusionary Discipline, Racial Discipline Gaps, and Student Behavior. Educational Evaluation and Policy Analysis, 38(4), 647-668.
Curran, F. C. (2017). The Law, Policy, and Portrayal of Zero Tolerance School Discipline: Examining Prevalence and Characteristics Across Levels of Governance and School Districts. Educational Policy, 1-39.
Davis, J. E., & Jordan, W. J. (1994). The effects of school context, structure, and experiences on African American males in middle and high school. The Journal of Negro Education, 63(4), 570-587.
Goodman, J. (2014). Flaking out: Student absences and snow days as disruptions of instructional time. NBER Working Paper 20221.
Hall, W. J., & Chapman, M. V. (2016). The Role of School Context in Implementing a Statewide Anti-Bullying Policy and Protecting Students. Educational Policy, 1-33.
Hoffman, S. (2014). Zero benefit: Estimating the effect of zero tolerance discipline polices on racial disparities in school discipline. Educational Policy, 28(1), 69-95.
Horner, R. H., Sugai, G., Smolkowski, K., Eber, L., Nakasato, J., Todd, A. W., & Esperanza, J. (2009). A randomized, wait-list controlled effectiveness trial assessing school-wide positive behavior support in elementary schools. Journal of Positive Behavior Interventions, 11(3): 133–144.
Lacoe, J. (2015). Unequally safe the race gap in school safety. Youth Violence and Juvenile Justice, 13(2), 143-168.

Reforming School Discipline
36 Steinberg & Lacoe
Lacoe, J. (2016). Too scared to learn? The academic consequences of feeling unsafe in the classroom. Urban Education, 0042085916674059.
Lacoe, J., & Steinberg, M. (2017a). Rolling back zero Tolerance: The effect of discipline policy reform on suspension usage, school climate, and student achievement. Working paper.
Lacoe, J., & Steinberg, M. (2017b). The impact of out-of-school suspensions on student outcomes. Working Paper.
Losen, D. J., Hodson, C. L., Keith, I. I., Michael, A., Morrison, K., & Belway, S. (2015). Are we closing the school discipline gap?. K-12 Racial Disparities in School Discipline.
Mader, N., Sartain, L., & Steinberg, M. (2016). When suspensions are shorter: The effects on school climate and student learning. Working Paper.
Marchbanks III, M. P., Blake, J. J., Booth, E. A., Carmichael, D., Seibert, A. L., & Fabelo, T. (2014). The economic effects of exclusionary discipline on grade retention and high school dropout. Closing the school discipline gap: Equitable remedies for excessive exclusion, 59-74.
Mitchell, M. M., & Bradshaw, C. P. (2013). Examining classroom influences on student perceptions of school climate: The role of classroom management and exclusionary discipline strategies. Journal of School Psychology, 51(5), 599-610.
Noltemeyer, A. L., Ward, R. M., & Mcloughlin, C. (2015). Relationship between school suspension and student outcomes: A meta-analysis. School Psychology Review, 44(2), 224.
Perry, B. L., & Morris, E. W. (2014). Suspending progress collateral consequences of exclusionary punishment in public schools. American Sociological Review, 79(6) 1067– 1087.
Petrilli, M. J. (2016). Should charter schools be pressured to reduce suspensions? Education Next. Accessed on December 13, 2016 from http://educationnext.org/should-charter-schools-be-pressured-to-reduce-suspensions.
Rausch, M. K., Skiba, R. J., & Simmons, A. B. (2004). The academic cost of discipline: The relationship between suspension/expulsion and school achievement. Center for Evaluation and Education Policy, School of Education, Indiana University, http://www. agi. harvard. edu/Search/SearchAllPapers. php.
Rumberger, R. W., & Losen, D. J. (2016). The high cost of harsh discipline and its disparate impact. Civil Rights Project-Proyecto Derechos Civiles.
Skiba, R. J., & Losen, D. J. (2016). From reaction to prevention: Turning the page on school discipline. American Educator, 39(4), 4.
Snyder, S. 2012, August 13. School summit focuses on violence prevention. The Philadelphia Inquirer. Retrieved from http://articles.philly.com/2012-08-13/news/33183381_1_school-safety-philadelphia-school-district-principals-safer-schools
Steinberg, M. P., & Lacoe, J. (2017). What do we know about school discipline reform? Assessing the alternatives to suspensions and expulsions. Education Next, 17(1).

Reforming School Discipline
37 Steinberg & Lacoe
Steinberg, M., Allensworth, E., & Johnson, D. W. (2011). Student and teacher safety in Chicago public schools: The roles of community context and school social organization. Chicago: Consortium on Chicago School Research.
U.S. Department of Education. (2015). Compendium of school discipline laws and regulations for the 50 states, District of Columbia, and the U.S. territories. Compiled May 2015. Washington, DC: Government Printing Office.
U.S. Department of Education Office for Civil Rights (2014). Data snapshot: School discipline. Retrieved from http://ocrdata.ed.gov/Downloads/CRDC-School-Discipline-Snapshot.pdf
Watanabe, T. 2013, May 14. L.A. Unified bans suspension for ‘willful defiance.’ Los Angeles Times. Retrieved from http://articles.latimes.com/2013/may/14/local/la-me-lausd-suspension-20130515
Wolf, K. C., & Kupchik, A. (2016). School suspensions and adverse experiences in adulthood. Justice Quarterly, 1-24.

Reforming School Discipline
38 Steinberg & Lacoe
Tables & Figures Table 1. Student Characteristics, Pre/Post-Policy
Pre-Policy (2011-12) Post-Policy (2012-13)
All
Students No OSS OSS (All)
OSS (Classroom Disorder)
All Students No OSS
OSS (All)
OSS (Classroom Disorder)
Age 13.0 (2.99)
12.9 (3.04)
13.5 (2.65)
13.7 (2.57)
13.0 (3.00)
13.0 (3.05)
13.5 (2.68)
14.2 (2.53)
Female 0.49 0.51 0.37 0.34 0.48 0.50 0.36 0.35
White 0.14 0.15 0.08 0.08 0.14 0.15 0.07 0.07
Black 0.57 0.55 0.73 0.73 0.56 0.54 0.74 0.75
Hispanic 0.19 0.19 0.17 0.16 0.19 0.19 0.16 0.14
Asian 0.08 0.09 0.01 0.01 0.08 0.09 0.01 0.02
Other 0.02 0.02 0.01 0.01 0.03 0.03 0.02 0.02
FRPL 0.65 0.64 0.73 0.73 0.71 0.70 0.80 0.79
Special Education 0.16 0.15 0.23 0.24 0.16 0.15 0.24 0.23
ELL 0.08 0.09 0.06 0.05 0.08 0.09 0.05 0.05
Students 101,844 86,606 15,238 5,125 98,824 85,735 13,089 2,671
Schools 247 247 245 228 238 238 235 183
Notes. Sample includes all students in grades 3-12 attending traditional public schools. The OSS (All) columns include students with at least one out-of-school suspension for any infraction of the SDP student code of conduct in a given school year. The OSS (Classroom Disorder) columns includes students with at least one out-of-school suspension for either failure to follow classroom rules/disruption or profane/obscene language or gestures. Cells report proportions, except for age which reports mean (standard deviation) in years.

Reforming School Discipline
39 Steinberg & Lacoe
Table 2. Student Achievement and School Absences, Pre/Post-Policy
Pre-Policy (2011-12) Post-Policy (2012-13)
All
Students No OSS OSS (All)
OSS (Classroom Disorder)
All Students No OSS
OSS (All)
OSS (Classroom Disorder)
Math Achievement 0.00 (1.00)
0.08 (1.01)
-0.48 (0.79)
-0.54 (0.76)
0.00 (1.00)
0.08 (1.01)
-0.51 (0.77)
-0.53 (0.75)
Math Proficiency 0.51 0.54 0.31 0.28 0.47 0.50 0.25 0.25
ELA Achievement 0.00 (1.00)
0.09 (1.00)
-0.49 (0.85)
-0.56 (0.82)
0.00 (1.00)
0.08 (1.00)
-0.55 (0.81)
-0.57 (0.79)
ELA Proficiency 0.45 0.48 0.26 0.23 0.42 0.45 0.21 0.20
Excused Absences (Rate) 0.66 0.66 0.68 0.68 0.66 0.66 0.65 0.63
Excused Absences (Days) 4.5 (7.22)
4.5 (7.31)
4.4 (6.69)
4.5 (6.61)
4.5 (7.04)
4.5 (7.09)
4.1 (6.72)
3.8 (6.11)
Unexcused Absences (Rate) 0.80 0.77 0.96 0.97 0.81 0.78 0.96 0.98
Unexcused Absences (Days) 9.9 (16.26)
8.7 (15.46)
16.9 (18.74)
18.4 (18.80)
10.6 (16.53)
9.4 (15.72)
18.4 (19.40)
21.7 (20.24)
Students 101,844 86,606 15,238 5,125 98,824 85,735 13,089 2,671
Schools 247 247 245 228 238 238 235 183
Notes. Sample includes all students in grades 3-12 attending traditional public schools. The OSS (All) columns include students with at least one out-of-school suspension for any infraction of the SDP student code of conduct in a given school year. The OSS (Classroom Disorder) columns includes students with at least one out-of-school suspension for either failure to follow classroom rules/disruption or profane/obscene language or gestures. Cells report proportions, except for Math (English Language Arts-ELA) Achievement which reports mean (standard deviation) in student-level standard-deviation units (standardized at the subject*grade*year level), and Absences (Days) which reports mean (standard deviation) number of absence days. In 2011-12, 57,033 grade 3-8 students had math test data and 56,627 students had ELA test data; in 2012-13, 53,478 grade 3-8 students had math test data and 53,050 students had ELA test data.

Reforming School Discipline
40 Steinberg & Lacoe
Table 3. Post-Policy Change in OSS
OSS Rate Times OSS Days OSS
(1) (2) (3) (4) (5) (6) (7) (8) (9)
All Infractions
Classroom Disorder
Other Infractions
All Infractions
Classroom Disorder
Other Infractions
All Infractions
Classroom Disorder
Other Infractions
Post-Reform (2012-13)
-0.013*** (.004)
-0.022*** (.002)
-0.002 (.004)
-0.02** (.010)
-0.03*** (.004)
0.01 (.008)
0.01 (.024)
-0.05*** (.007)
0.06*** (.021)
Post-Reform (2013-14)
-0.002 (.005)
-0.022*** (.003)
0.010** (.004)
0.01 (.012)
-0.03*** (.005)
0.04*** (.009)
0.08*** (.030)
-0.05*** (.008)
0.13*** (.027)
P-value from F-Test: 2012-13=2013-14 .0065 .9200 .0010 .0047 .7553 .0002 .0044 .9720 .0015
R2 .1012 .0538 .0923 .0975 .0534 .0889 .0831 .0445 .0754
Mean (sd) of DV in Pre-Reform Year (2011-12)
0.15 0.05 0.13 0.27 (.850)
0.07 (.342)
0.20 (.674)
0.58 (1.99)
0.12 (.655)
0.46 (1.69)
Student*Year Observations 303,826 303,826 303,826 303,826 303,826 303,826 303,826 303,826 303,826
Notes. Coefficients reported with robust standard errors (clustered at the school-by-year level). Sample includes all students in grades 3-12 in the 2011-12 through 2013-14 school years. Columns (1)-(3) report coefficients from linear probability models. Post Reform (2012-13) is an indicator variable for the 2012-13 school year; Post Reform (2013-14) is an indicator variable for the 2013-14 school year; the reference category is the pre-reform year, 2011-12. All regressions include school fixed effects and controls for the following student characteristics: age, race, gender, grade level and indicators for FRPL, special education and ELL status. Coefficients statistically significant at the *10%, **5% and ***1% levels.
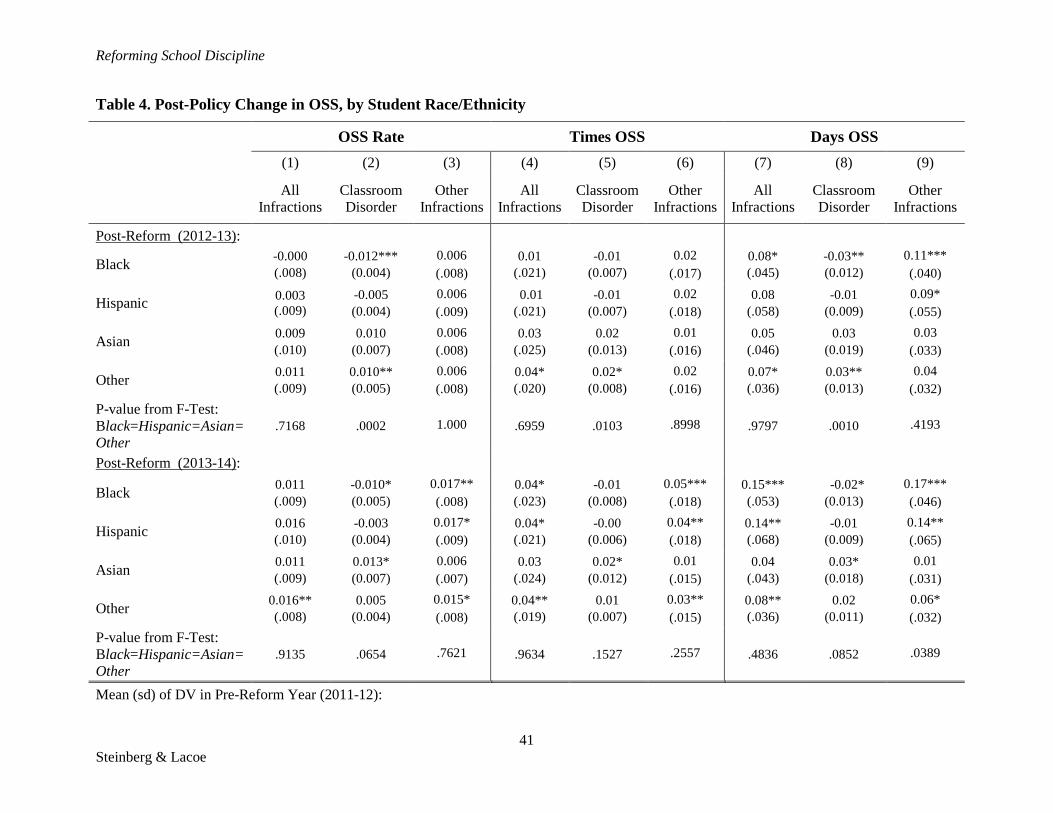
Reforming School Discipline
41 Steinberg & Lacoe
Table 4. Post-Policy Change in OSS, by Student Race/Ethnicity
OSS Rate Times OSS Days OSS (1) (2) (3) (4) (5) (6) (7) (8) (9)
All Infractions
Classroom Disorder
Other Infractions
All Infractions
Classroom Disorder
Other Infractions
All Infractions
Classroom Disorder
Other Infractions
Post-Reform (2012-13):
Black -0.000 (.008)
-0.012*** (0.004)
0.006 (.008)
0.01 (.021)
-0.01 (0.007)
0.02 (.017)
0.08* (.045)
-0.03** (0.012)
0.11*** (.040)
Hispanic 0.003 (.009)
-0.005 (0.004)
0.006 (.009)
0.01 (.021)
-0.01 (0.007)
0.02 (.018)
0.08 (.058)
-0.01 (0.009)
0.09* (.055)
Asian 0.009 (.010)
0.010 (0.007)
0.006 (.008)
0.03 (.025)
0.02 (0.013)
0.01 (.016)
0.05 (.046)
0.03 (0.019)
0.03 (.033)
Other 0.011 (.009)
0.010** (0.005)
0.006 (.008)
0.04* (.020)
0.02* (0.008)
0.02 (.016)
0.07* (.036)
0.03** (0.013)
0.04 (.032)
P-value from F-Test: Black=Hispanic=Asian=Other
.7168 .0002 1.000 .6959 .0103 .8998 .9797 .0010 .4193
Post-Reform (2013-14):
Black 0.011 (.009)
-0.010* (0.005)
0.017** (.008)
0.04* (.023)
-0.01 (0.008)
0.05*** (.018)
0.15*** (.053)
-0.02* (0.013)
0.17*** (.046)
Hispanic 0.016 (.010)
-0.003 (0.004)
0.017* (.009)
0.04* (.021)
-0.00 (0.006)
0.04** (.018)
0.14** (.068)
-0.01 (0.009)
0.14** (.065)
Asian 0.011 (.009)
0.013* (0.007)
0.006 (.007)
0.03 (.024)
0.02* (0.012)
0.01 (.015)
0.04 (.043)
0.03* (0.018)
0.01 (.031)
Other 0.016** (.008)
0.005 (0.004)
0.015* (.008)
0.04** (.019)
0.01 (0.007)
0.03** (.015)
0.08** (.036)
0.02 (0.011)
0.06* (.032)
P-value from F-Test: Black=Hispanic=Asian=Other
.9135 .0654 .7621 .9634 .1527 .2557 .4836 .0852 .0389
Mean (sd) of DV in Pre-Reform Year (2011-12):

Reforming School Discipline
42 Steinberg & Lacoe
OSS Rate Times OSS Days OSS (1) (2) (3) (4) (5) (6) (7) (8) (9)
All Infractions
Classroom Disorder
Other Infractions
All Infractions
Classroom Disorder
Other Infractions
All Infractions
Classroom Disorder
Other Infractions
White 0.08 0.03 0.07 0.15 (.683)
0.04 (.300)
0.11 (.512)
0.29 (1.41)
0.06 (0.516)
0.23 (1.16)
Black 0.19 0.06 0.16 0.35 (.932)
0.09 (.379)
0.26 (.741)
0.77 (2.29)
0.15 (0.757)
0.61 (1.95)
Hispanic 0.13 0.04 0.12 0.25 (.851)
0.06 (.319)
0.19 (.686)
0.48 (1.75)
0.09 (0.538)
0.39 (1.50)
Asian 0.03 0.01 0.02 0.04 (.271)
0.01 (.125)
0.03 (.210)
0.08 (.629)
0.02 (0.218)
0.06 (.541)
Other 0.08 0.02 0.07 0.14 (.598)
0.03 (.234)
0.11 (.471)
0.27 (1.27)
0.05 (0.377)
0.22 (1.07)
Student*Year Observations 303,826 303,826 303,826 303,826 303,826 303,826 303,826 303,826 303,826
Notes. Each column represents a separate regression. Coefficients reported with robust standard errors (clustered at the school-by-year level). Sample includes all students in grades 3-12 in the 2011-12 through 2013-14 school years. Columns (1)-(3) report coefficients from linear probability models. The omitted reference category includes white students. All regressions include school, year and race fixed effects, and controls for the following student characteristics: age, gender, grade level and indicators for FRPL, special education and ELL status. Coefficients statistically significant at the *10%, **5% and ***1% levels.
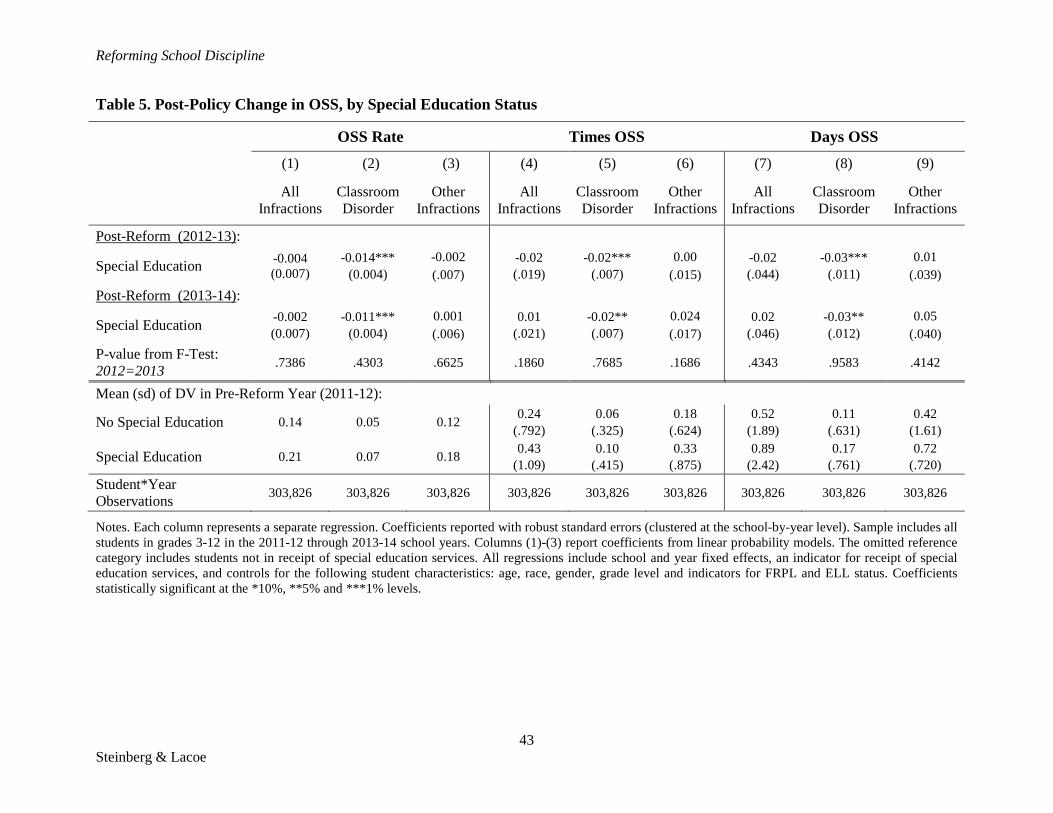
Reforming School Discipline
43 Steinberg & Lacoe
Table 5. Post-Policy Change in OSS, by Special Education Status
OSS Rate Times OSS Days OSS
(1) (2) (3) (4) (5) (6) (7) (8) (9)
All Infractions
Classroom Disorder
Other Infractions
All Infractions
Classroom Disorder
Other Infractions
All Infractions
Classroom Disorder
Other Infractions
Post-Reform (2012-13):
Special Education -0.004 (0.007)
-0.014*** (0.004)
-0.002 (.007)
-0.02 (.019)
-0.02*** (.007)
0.00 (.015)
-0.02 (.044)
-0.03*** (.011)
0.01 (.039)
Post-Reform (2013-14):
Special Education -0.002 (0.007)
-0.011*** (0.004)
0.001 (.006)
0.01 (.021)
-0.02** (.007)
0.024 (.017)
0.02 (.046)
-0.03** (.012)
0.05 (.040)
P-value from F-Test: 2012=2013 .7386 .4303 .6625 .1860 .7685 .1686 .4343 .9583 .4142
Mean (sd) of DV in Pre-Reform Year (2011-12):
No Special Education 0.14 0.05 0.12 0.24 (.792)
0.06 (.325)
0.18 (.624)
0.52 (1.89)
0.11 (.631)
0.42 (1.61)
Special Education 0.21 0.07 0.18 0.43 (1.09)
0.10 (.415)
0.33 (.875)
0.89 (2.42)
0.17 (.761)
0.72 (.720)
Student*Year Observations 303,826 303,826 303,826 303,826 303,826 303,826 303,826 303,826 303,826
Notes. Each column represents a separate regression. Coefficients reported with robust standard errors (clustered at the school-by-year level). Sample includes all students in grades 3-12 in the 2011-12 through 2013-14 school years. Columns (1)-(3) report coefficients from linear probability models. The omitted reference category includes students not in receipt of special education services. All regressions include school and year fixed effects, an indicator for receipt of special education services, and controls for the following student characteristics: age, race, gender, grade level and indicators for FRPL and ELL status. Coefficients statistically significant at the *10%, **5% and ***1% levels.

Reforming School Discipline
44 Steinberg & Lacoe
Table 6. Student Characteristics, by School-Level Change in OSS for Classroom Disorder
Pre-Policy (2011-12) Post-Policy (2012-13)
Non
Compliers Partial
Compliers Full
Compliers
No OSS (Classroom Disorder)
Non Compliers
Partial Compliers
Full Compliers
No OSS (Classroom Disorder)
Panel A: OSS OSS (All) 0.13 0.16 0.11 0.02 0.18 0.14 0.07 0.02 OSS (Classroom Disorder) 0.03 0.06 0.03 0.00 0.06 0.03 0.00 0.00 OSS (Other Infractions) 0.10 0.10 0.08 0.02 0.12 0.11 0.07 0.02 Mean (sd) School-Level Change in OSS (Classroom Disorder) Rate (11/12 to 12/13)
- - - - 2.67 (5.63)
-3.22 (3.35)
-2.53 (2.66)
0.00 (0.00)
Panel B: Demographics
Age 13.3 (3.09)
13.3 (2.98)
11.6 (2.64)
12.4 (2.93)
13.4 (3.05)
13.3 (2.98)
11.7 (2.68)
12.5 (2.93)
Female 0.53 0.47 0.51 0.53 0.52 0.47 0.51 0.53 White 0.08 0.14 0.19 0.27 0.09 0.14 0.19 0.25 Black 0.74 0.56 0.50 0.44 0.71 0.55 0.49 0.44 Hispanic 0.11 0.20 0.20 0.09 0.12 0.21 0.21 0.09 Asian 0.06 0.08 0.07 0.18 0.06 0.08 0.07 0.18 Other 0.02 0.02 0.04 0.02 0.02 0.03 0.05 0.04 FRPL 0.65 0.65 0.65 0.51 0.72 0.72 0.70 0.55 Special Education 0.19 0.16 0.15 0.12 0.18 0.17 0.14 0.12 ELL 0.07 0.09 0.08 0.07 0.06 0.09 0.08 0.08
Panel C: Achievement & Absences
Math Achievement -0.11 (0.93)
-0.03 (0.99)
0.17 (1.01)
0.72 (1.07)
-0.14 (0.92)
-0.06 (0.98)
0.17 (0.99)
0.73 (1.13)
Math Proficiency 0.47 0.50 0.58 0.77 0.41 0.44 0.54 0.73 ELA Achievement -0.09 -0.04 0.19 0.63 -0.13 -0.06 0.17 0.61
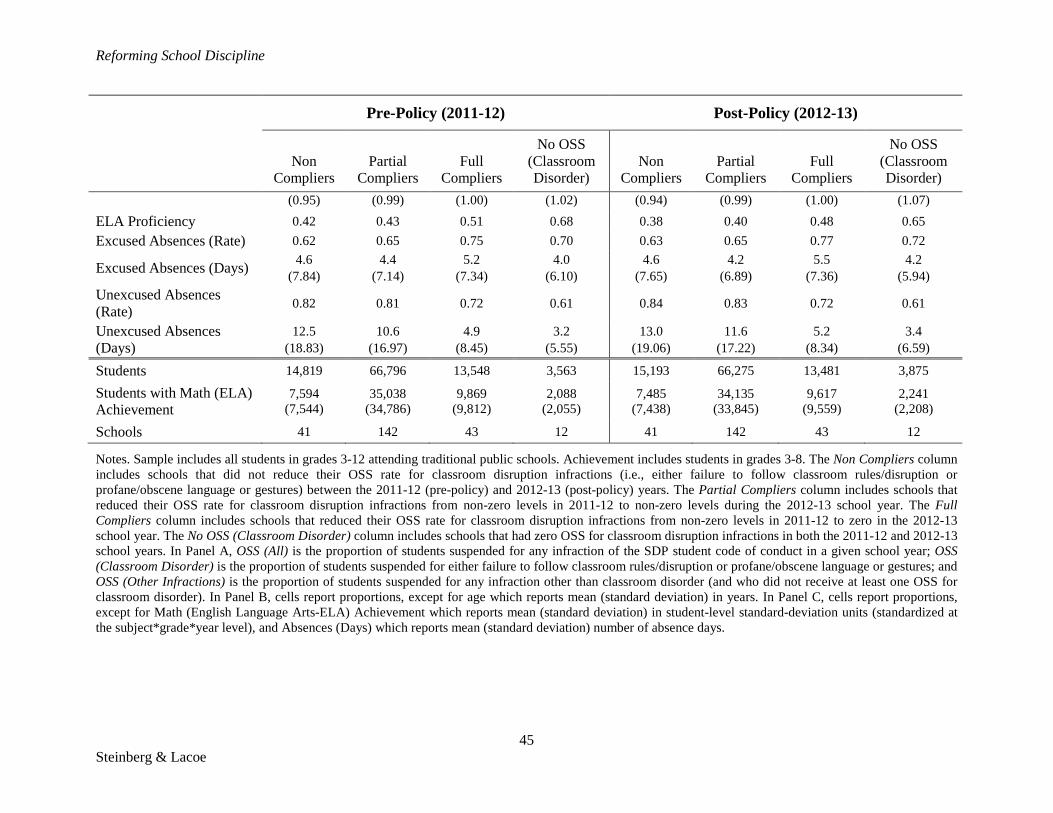
Reforming School Discipline
45 Steinberg & Lacoe
Pre-Policy (2011-12) Post-Policy (2012-13)
Non
Compliers Partial
Compliers Full
Compliers
No OSS (Classroom Disorder)
Non Compliers
Partial Compliers
Full Compliers
No OSS (Classroom Disorder)
(0.95) (0.99) (1.00) (1.02) (0.94) (0.99) (1.00) (1.07) ELA Proficiency 0.42 0.43 0.51 0.68 0.38 0.40 0.48 0.65 Excused Absences (Rate) 0.62 0.65 0.75 0.70 0.63 0.65 0.77 0.72
Excused Absences (Days) 4.6 (7.84)
4.4 (7.14)
5.2 (7.34)
4.0 (6.10)
4.6 (7.65)
4.2 (6.89)
5.5 (7.36)
4.2 (5.94)
Unexcused Absences (Rate) 0.82 0.81 0.72 0.61 0.84 0.83 0.72 0.61
Unexcused Absences (Days)
12.5 (18.83)
10.6 (16.97)
4.9 (8.45)
3.2 (5.55)
13.0 (19.06)
11.6 (17.22)
5.2 (8.34)
3.4 (6.59)
Students 14,819 66,796 13,548 3,563 15,193 66,275 13,481 3,875
Students with Math (ELA) Achievement
7,594 (7,544)
35,038 (34,786)
9,869 (9,812)
2,088 (2,055)
7,485 (7,438)
34,135 (33,845)
9,617 (9,559)
2,241 (2,208)
Schools 41 142 43 12 41 142 43 12
Notes. Sample includes all students in grades 3-12 attending traditional public schools. Achievement includes students in grades 3-8. The Non Compliers column includes schools that did not reduce their OSS rate for classroom disruption infractions (i.e., either failure to follow classroom rules/disruption or profane/obscene language or gestures) between the 2011-12 (pre-policy) and 2012-13 (post-policy) years. The Partial Compliers column includes schools that reduced their OSS rate for classroom disruption infractions from non-zero levels in 2011-12 to non-zero levels during the 2012-13 school year. The Full Compliers column includes schools that reduced their OSS rate for classroom disruption infractions from non-zero levels in 2011-12 to zero in the 2012-13 school year. The No OSS (Classroom Disorder) column includes schools that had zero OSS for classroom disruption infractions in both the 2011-12 and 2012-13 school years. In Panel A, OSS (All) is the proportion of students suspended for any infraction of the SDP student code of conduct in a given school year; OSS (Classroom Disorder) is the proportion of students suspended for either failure to follow classroom rules/disruption or profane/obscene language or gestures; and OSS (Other Infractions) is the proportion of students suspended for any infraction other than classroom disorder (and who did not receive at least one OSS for classroom disorder). In Panel B, cells report proportions, except for age which reports mean (standard deviation) in years. In Panel C, cells report proportions, except for Math (English Language Arts-ELA) Achievement which reports mean (standard deviation) in student-level standard-deviation units (standardized at the subject*grade*year level), and Absences (Days) which reports mean (standard deviation) number of absence days.
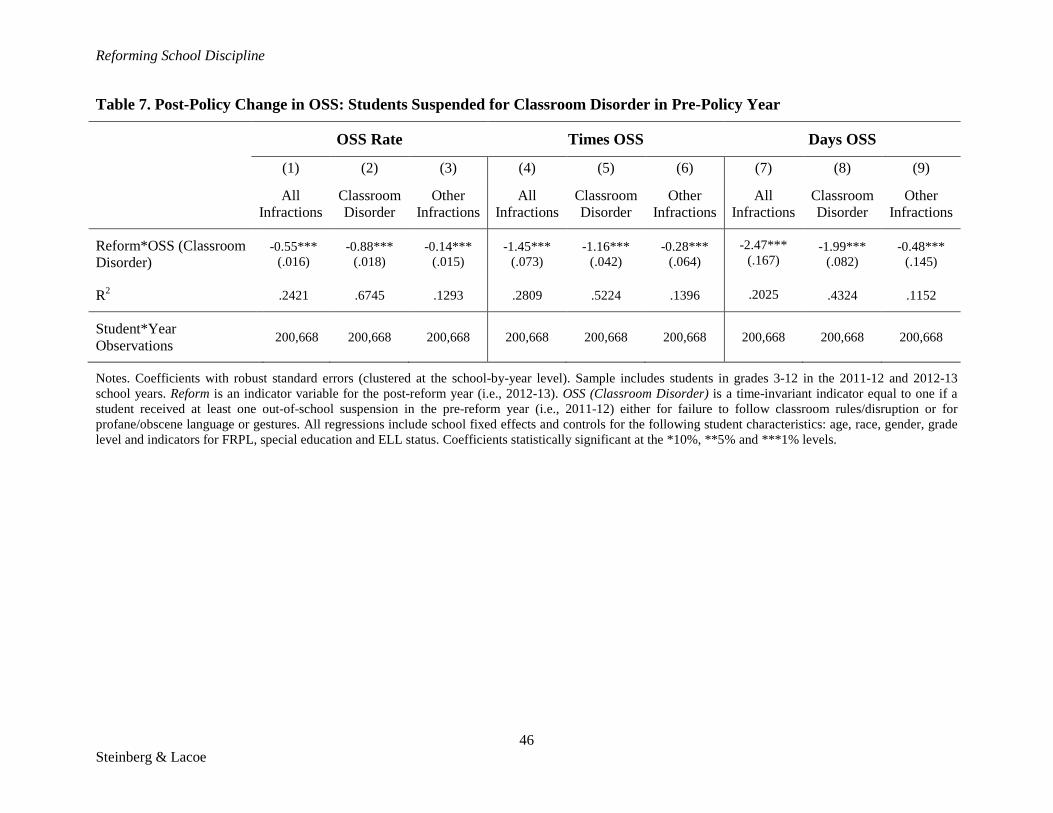
Reforming School Discipline
46 Steinberg & Lacoe
Table 7. Post-Policy Change in OSS: Students Suspended for Classroom Disorder in Pre-Policy Year
OSS Rate Times OSS Days OSS
(1) (2) (3) (4) (5) (6) (7) (8) (9) All
Infractions Classroom Disorder
Other Infractions
All Infractions
Classroom Disorder
Other Infractions
All Infractions
Classroom Disorder
Other Infractions
Reform*OSS (Classroom Disorder)
-0.55*** (.016)
-0.88*** (.018)
-0.14*** (.015)
-1.45*** (.073)
-1.16*** (.042)
-0.28*** (.064)
-2.47*** (.167)
-1.99*** (.082)
-0.48*** (.145)
R2 .2421 .6745 .1293 .2809 .5224 .1396 .2025 .4324 .1152
Student*Year Observations 200,668 200,668 200,668 200,668 200,668 200,668 200,668 200,668 200,668
Notes. Coefficients with robust standard errors (clustered at the school-by-year level). Sample includes students in grades 3-12 in the 2011-12 and 2012-13 school years. Reform is an indicator variable for the post-reform year (i.e., 2012-13). OSS (Classroom Disorder) is a time-invariant indicator equal to one if a student received at least one out-of-school suspension in the pre-reform year (i.e., 2011-12) either for failure to follow classroom rules/disruption or for profane/obscene language or gestures. All regressions include school fixed effects and controls for the following student characteristics: age, race, gender, grade level and indicators for FRPL, special education and ELL status. Coefficients statistically significant at the *10%, **5% and ***1% levels.

Reforming School Discipline
47 Steinberg & Lacoe
Table 8. Post-Policy Change in Achievement: Students Suspended for Classroom Disorder in Pre-Policy Year
Math Achievement ELA Achievement
(1) (2) (3) (4) (5) (6)
Panel A: Standardized
Reform -0.01 (.058)
-0.01 (.037)
-0.03*** (.005)
-0.01 (.056)
-0.01 (.036)
-0.03*** (.004)
OSS (Classroom Disorder)
-0.56*** (.037)
-0.33*** (.026)
-0.22*** (.018)
-0.59*** (.038)
-0.35*** (.029)
-0.24*** (.019)
Reform*OSS (Classroom Disorder)
0.00 (.056)
0.03 (.040)
0.02 (.024)
-0.01 (.056)
0.03 (.043)
0.02 (.027)
R2 .0116 .2818 .3746 .0130 .2766 .3676
Panel B: Proficiency
Reform -0.05** (.022)
-0.05*** (.013)
-0.06*** (.002)
-0.03 (.022)
-0.03** (.013)
-0.04*** (.002)
OSS (Classroom Disorder) -0.24*** (.014)
-0.16*** (.011)
-0.11*** (.010)
-0.23*** (.016)
-0.15*** (.013)
-0.11*** (.010)
Reform*OSS (Classroom Disorder)
0.02 (.022)
0.03* (.017)
0.02* (.013)
0.01 (.024)
0.02 (.019)
0.02 (.014)
R2 .0100 .1860 .2430 .0081 .1963 .2521
Student Characteristics X X X X
School FE X X
Student*Year Observations 110,511 110,511 110,511 109,677 109,677 109,677
Notes. Coefficients with robust standard errors (clustered at the school-by-year level) are reported. Sample includes students in grades 3-8 with available test data in the 2011-12 and 2012-13 school years. Reform is an indicator variable for the post-reform year (i.e., 2012-13). OSS (Classroom Disorder) is a time-invariant indicator equal to one if a student received at least one out-of-school suspension in the pre-reform year (i.e., 2011-12) either for failure to follow classroom rules/disruption or for profane/obscene language or gestures. In Panel A, achievement is standardized at the subject*grade*year level; coefficients reported in standard deviation units. In Panel B, achievement is a binary indicator variable for whether a student met Pennsylvania state proficiency standards; coefficients reported are from linear probability models. Student characteristics include age, race, gender, grade level and indicators for FRPL, special education and ELL status. Coefficients statistically significant at the *10%, **5% and ***1% levels.

Reforming School Discipline
48 Steinberg & Lacoe
Table 9. Post-Policy Change in School Absences: Students Suspended for Classroom Disorder in Pre-Policy Year
All Absences Excused Absences Unexcused Absences
(1) (2) (3) (4) (5) (6) (7) (8) (9)
Reform 0.73
(0.990) 0.37
(.569) 0.64*** (.116)
0.02 (.186)
-0.05 (.179)
-0.11 (.077)
0.70 (1.06)
0.42 (.642)
0.76*** (.137)
OSS (Classroom Disorder) 8.99*** (.592)
6.96*** (.536)
6.02*** (.318)
0.04 (.169)
0.28 (.172)
0.42*** (.144)
8.96*** (.601)
6.68*** (.497)
5.60*** (.313)
Reform*OSS (Classroom Disorder)
0.60 (0.848)
-1.04 (.819)
-1.45*** (.474)
-0.83*** (.219)
-0.81*** (.224)
-0.76*** (.207)
1.42* (.859)
-0.23 (.771)
-0.69 (.475)
R2 .0118 .1446 .2029 .0002 .0364 .0724 .0157 .1717 .2602
Student Characteristics X X X X X X
School FE X X X
Student*Year Observations 200,668 200,668 200,668 200,668 200,668 200,668 200,668 200,668 200,668
Notes. Coefficients with robust standard errors (clustered at the school-by-year level). Sample includes students in grades 3-12 in the 2011-12 and 2012-13 school years. Reform is an indicator variable for the post-reform year (i.e., 2012-13). OSS (Classroom Disorder) is a time-invariant indicator equal to one if a student received at least one out-of-school suspension in the pre-reform year (i.e., 2011-12) either for failure to follow classroom rules/disruption or for profane/obscene language or gestures. Student characteristics include age, race, gender, grade level and indicators for FRPL, special education and ELL status. Coefficients statistically significant at the *10%, **5% and ***1% levels.

Reforming School Discipline
49 Steinberg & Lacoe
Table 10. Post-Policy Change in Achievement: Non-Offending Peers
Math Achievement ELA Achievement (1) (2) (3) (4) (5) (6) Panel A: Standardized
Reform -0.00 (.215)
-0.03 (.098)
0.02 (.020)
-0.02 (.180)
-0.01 (.097)
-0.01 (.009)
Full Complier -0.52*** (.156)
-0.33*** (.080)
-0.18*** (.018)
-0.40*** (.142)
-0.24*** (.088)
-0.30*** (.020)
Partial Complier -0.69*** (.153)
-0.44*** (.078)
-0.79*** (.038)
-0.60*** (.135)
-0.39*** (.083)
-0.82*** (.026)
Reform*Full Complier -0.02 (.234)
-0.02 (.116)
-0.03 (.023)
-0.01 (.206)
-0.02 (.119)
-0.02* (.013)
Reform*Partial Complier -0.04 (.230)
-0.05 (.111)
-0.06*** (.021)
-0.00 (.196)
-0.01 (.109)
-0.01 (.010)
P-value from F-Test: Reform*Full=Reform*Partial
.8486 .7141 .0278 .9380 .9448 .5300
R2 .0272 .2929 .3727 .0216 .2831 .3632
Panel B: Proficiency
Reform -0.05 (.070)
-0.04 (.031)
-0.04*** (.008)
-0.04 (.008)
-0.03 (.035)
-0.03*** (.009)
Full Complier -0.18*** (.052)
-0.11*** (.027)
-0.08*** (.024)
-0.15** (.060)
-0.09*** (.033)
-0.11*** (.019)
Partial Complier -0.25*** (.049)
-0.16*** (.024)
-0.33*** (.026)
-0.23*** (.056)
-0.16*** (.029)
-0.37*** (.022)
Reform*Full Complier 0.00 (.080)
0.00 (.040)
-0.00 (.009)
-0.01 (.086)
-0.01 (.045)
-0.01 (.010)
Reform*Partial Complier -0.01 (.075)
-0.02 (.035)
-0.02** (.008)
0.01 (.081)
-0.00 (.039)
-0.00 (.009)
P-value from F-Test: Reform*Full=Reform*Partial
.7355 .5334 .0030 .7729 .6729 .0135
R2 .0177 .1974 .2432 .0126 .2094 .2548
Student Characteristics X X X X
School FE X X
Student*Year Observations 80,735 80,735 80,735 80,067 80,067 80,067
Notes. Coefficients with robust standard errors (clustered at the school-by-year level) are reported. Sample includes students in grades 3-8 with available test data in the 2011-12 and 2012-13 school years and who did not receive an out-of-school suspension. Reform is an indicator variable for the post-reform year (i.e., 2012-13). Full Complier equals one if a student is in a school that reduced their OSS rate for classroom disorder from non-zero levels in 2011-12 to zero in the 2012-13 school year. Partial Complier equals one if a student is in a school that reduced their
Reforming School Discipline
50 Steinberg & Lacoe
OSS rate for classroom disorder from non-zero levels in 2011-12 to non-zero levels during the 2012-13 school year. All comparisons are to students in schools with zero OSS for classroom disorder in both 2011-12 and 2012-13. In Panel A, achievement is standardized at the subject*grade*year level; coefficients reported in standard deviation units. In Panel B, achievement is a binary indicator variable for whether a student met Pennsylvania state proficiency standards; coefficients reported are from linear probability models. Student characteristics include age, race, gender, grade level and indicators for FRPL, special education and ELL status. Coefficients statistically significant at the *10%, **5% and ***1% levels.

Reforming School Discipline
51 Steinberg & Lacoe
Table 11. Post-Policy Change in School Absences: Non-Offending Peers
All Absences Excused Absences Unexcused Absences
(1) (2) (3) (4) (5) (6) (7) (8) (9)
Reform 0.45 (.764)
0.23 (1.65)
0.31** (.157)
0.26 (.392)
0.25 (.356)
0.18* (.093)
0.19 (.693)
-0.02 (1.83)
0.14 (.108)
Full Complier 2.66*** (.701)
2.51** (1.22)
0.61 (.396)
0.42 (.300)
0.42 (.290)
-1.08** (.460)
1.31* (.670)
1.39 (1.40)
-0.73*** (.145)
Partial Complier 6.60*** (1.04)
4.24*** (1.26)
17.36*** (.610)
1.36*** (.339)
1.12*** (.354)
1.34*** (.294)
6.18*** (1.06)
3.82*** (1.39)
18.44*** (1.573)
Reform*Full Complier 0.21 (1.05)
0.02 (1.77)
0.03 (.200)
-0.01 (.515)
-0.07 (.505)
0.00 (.146)
0.22 (1.04)
0.09 (2.01)
0.03 (.171)
Reform*Partial Complier 0.55 (1.48)
0.45 (1.81)
0.45** (.224)
-0.34 (.459)
-0.39 (.425)
-0.32** (.141)
0.88 (1.52)
0.84 (2.02)
0.78*** (.221)
P-value from F-Test: Reform*Full=Reform*Partial
.8172 .6664 .0396 .4310 .4528 .0366 .6711 .5340 .0016
R2 .0149 .1311 .1830 .0036 .0408 .0737 .0243 .1560 .2381
Student Characteristics X X X X
School FE X X
Student*Year Observations 144,772 144,772 144,772 144,772 144,772 144,772 144,772 144,772 144,772
Notes. Coefficients with robust standard errors (clustered at the school-by-year level) are reported. Sample includes students in grades 3-12 in the 2011-12 and 2012-13 school years and who did not receive an out-of-school suspension. Reform is an indicator variable for the post-reform year (i.e., 2012-13). Full Complier equals one if a student is in a school that reduced their OSS rate for classroom disorder from non-zero levels in 2011-12 to zero in the 2012-13 school year. Partial Complier equals one if a student is in a school that reduced their OSS rate for classroom disorder from non-zero levels in 2011-12 to non-zero levels during the 2012-13 school year. All comparisons are to students in schools with zero OSS for classroom disorder in both 2011-12 and 2012-13. Student characteristics include age, race, gender, grade level and indicators for FRPL, special education and ELL status. Coefficients statistically significant at the *10%, **5% and ***1% levels.

Reforming School Discipline
52 Steinberg & Lacoe
Figure 1. OSS Summary, by Infractions Targeted by District Policy Reform
Panel A: OSS Rate
Panel B: OSS for Classroom Disorder
Notes. Sample includes all students in grades 3-12 attending traditional public schools. Classroom Disorder includes two types of student misconduct (per SDP’s Student Code of Conduct): (a) Disruption, or “failure to follow classroom rules/disruption;” and (b) Profanity, or “Profane/obscene language or gestures.” Other Infractions include suspensions related to all student misconducts other than Disruption and Profanity. In 2011-12, 27,903 out-of-school suspensions were given to students in grades 3-12; in 2012-13, 23,584 out-of-school suspensions were given to students in grades 3-12; in 2013-14, 26,838 out-of-school suspensions were given to students in grades 3-12. Vertical line indicates year of policy reform (2012-13 school year).
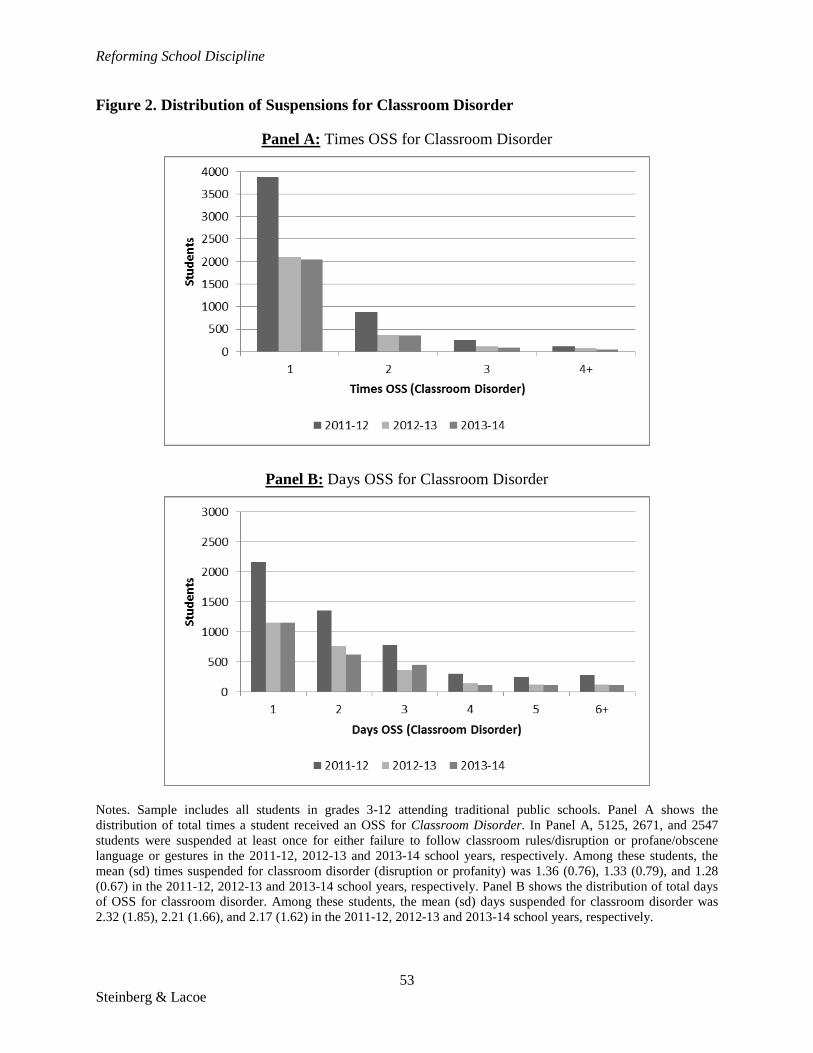
Reforming School Discipline
53 Steinberg & Lacoe
Figure 2. Distribution of Suspensions for Classroom Disorder
Panel A: Times OSS for Classroom Disorder
Panel B: Days OSS for Classroom Disorder
Notes. Sample includes all students in grades 3-12 attending traditional public schools. Panel A shows the distribution of total times a student received an OSS for Classroom Disorder. In Panel A, 5125, 2671, and 2547 students were suspended at least once for either failure to follow classroom rules/disruption or profane/obscene language or gestures in the 2011-12, 2012-13 and 2013-14 school years, respectively. Among these students, the mean (sd) times suspended for classroom disorder (disruption or profanity) was 1.36 (0.76), 1.33 (0.79), and 1.28 (0.67) in the 2011-12, 2012-13 and 2013-14 school years, respectively. Panel B shows the distribution of total days of OSS for classroom disorder. Among these students, the mean (sd) days suspended for classroom disorder was 2.32 (1.85), 2.21 (1.66), and 2.17 (1.62) in the 2011-12, 2012-13 and 2013-14 school years, respectively.

Reforming School Discipline
54 Steinberg & Lacoe
Figure 3. School-Level Distribution of OSS Exposure, by OSS Type
Panel A: 2011-12 (Pre-Policy) Panel B: 2012-13 (Post-Policy)
Notes. Scatterplots show the school-level distribution of the percent of a school’s students with any OSS for classroom disorder (x-axis) and the percent of a school’s students with any OSS for other infractions (y-axis). In Panel A, there were 247 schools in the 2011-12 school year; the mean (sd) percent of a school’s students with any OSS for classroom disorder is 4.91 (4.94) and the mean (sd) percent of a school’s students with any OSS for other infractions is 12.32 (8.99). In Panel B, there were 238 schools in the 2012-13 school year; the mean (sd) percent of a school’s students with any OSS for classroom disorder is 2.39 (4.10) and the mean (sd) percent of a school’s students with any OSS for other infractions is 11.59 (8.86). The lines denote the mean of the variables.
010
2030
4050
OS
S (O
ther
Infra
ctio
ns) (
%)
0 10 20 30OSS (Classroom Disorder) (%)
010
2030
4050
OS
S (O
ther
Infra
ctio
ns) (
%)
0 10 20 30 40OSS (Classroom Disorder) (%)

Reforming School Discipline
55 Steinberg & Lacoe
Figure 4. School-Level Exposure to OSS for Classroom Disorder, Pre and Post-Policy
Panel A: OSS Rate for Classroom Disorder Panel B: OSS Days for Classroom Disorder
Notes. In Panel A, figure shows the school-level distribution of the percent of a school’s students with any OSS for classroom disorder. Of the 238 schools in the 2012-13 school year, 185 schools (77.7 percent) reduced the OSS rate (from non-zero levels in 2011-12) for student infractions targeted by the policy change, of which 43 schools (18.1 percent) reduced the OSS rate for classroom disorder to zero in the post-policy year (2012-13); and 12 schools (5.0 percent) had a zero OSS rate for classroom disorder in both the 2011-12 and 2012-13 school years. In Panel B, figure shows the school-level distribution of OSS days (on a per-capita basis) for classroom disorder. Of the 238 schools in the 2012-13 school year, 186 schools (78.2 percent) reduced OSS days (per-pupil) for classroom disorder from non-zero levels in 2011-12, of which 43 schools (18.1 percent) reduced OSS days for classroom disorder to zero in the post-policy year (2012-13); and 12 schools (5.0 percent) had zero OSS days for classroom disorder in both the 2011-12 and 2012-13 school years. In 7 cases, schools that reduced the OSS rate for classroom disorder experienced increases in OSS days (per-pupil) for classroom disorder; and in 8 cases, schools that increased the OSS rate for classroom disorder experienced decreases in OSS days (per-pupil) for classroom disorder.
010
2030
40O
SS
(Cla
ssro
om D
isor
der)
(%),
2012
-13
0 10 20 30OSS (Classroom Disorder) (%), 2011-12
0.2
.4.6
.81
OS
S (C
lass
room
Dis
orde
r) D
ays
(Per
-Pup
il), 2
012-
13
0 .2 .4 .6 .8OSS (Classroom Disorder) Days (Per-Pupil), 2011-12
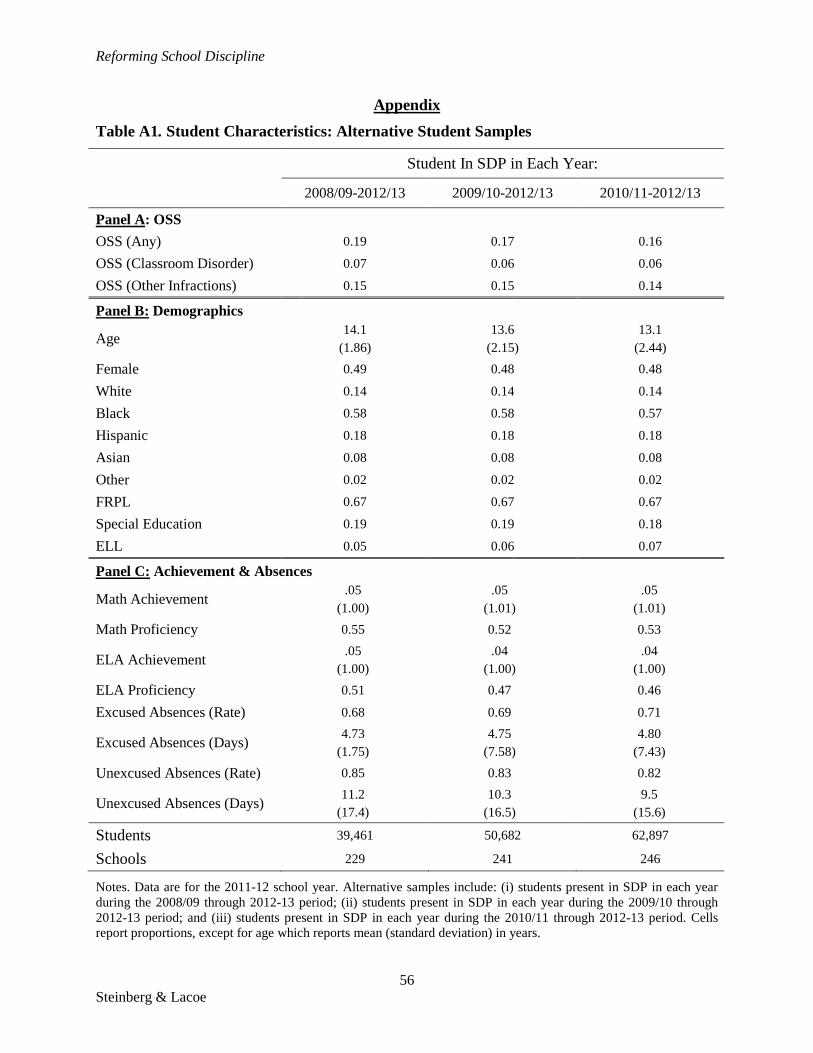
Reforming School Discipline
56 Steinberg & Lacoe
Appendix Table A1. Student Characteristics: Alternative Student Samples
Student In SDP in Each Year:
2008/09-2012/13 2009/10-2012/13 2010/11-2012/13
Panel A: OSS
OSS (Any) 0.19 0.17 0.16
OSS (Classroom Disorder) 0.07 0.06 0.06
OSS (Other Infractions) 0.15 0.15 0.14
Panel B: Demographics
Age 14.1 (1.86)
13.6 (2.15)
13.1 (2.44)
Female 0.49 0.48 0.48
White 0.14 0.14 0.14
Black 0.58 0.58 0.57
Hispanic 0.18 0.18 0.18
Asian 0.08 0.08 0.08
Other 0.02 0.02 0.02
FRPL 0.67 0.67 0.67
Special Education 0.19 0.19 0.18
ELL 0.05 0.06 0.07
Panel C: Achievement & Absences
Math Achievement .05 (1.00)
.05 (1.01)
.05 (1.01)
Math Proficiency 0.55 0.52 0.53
ELA Achievement .05 (1.00)
.04 (1.00)
.04 (1.00)
ELA Proficiency 0.51 0.47 0.46
Excused Absences (Rate) 0.68 0.69 0.71
Excused Absences (Days) 4.73 (1.75)
4.75 (7.58)
4.80 (7.43)
Unexcused Absences (Rate) 0.85 0.83 0.82
Unexcused Absences (Days) 11.2 (17.4)
10.3 (16.5)
9.5 (15.6)
Students 39,461 50,682 62,897
Schools 229 241 246
Notes. Data are for the 2011-12 school year. Alternative samples include: (i) students present in SDP in each year during the 2008/09 through 2012-13 period; (ii) students present in SDP in each year during the 2009/10 through 2012-13 period; and (iii) students present in SDP in each year during the 2010/11 through 2012-13 period. Cells report proportions, except for age which reports mean (standard deviation) in years.
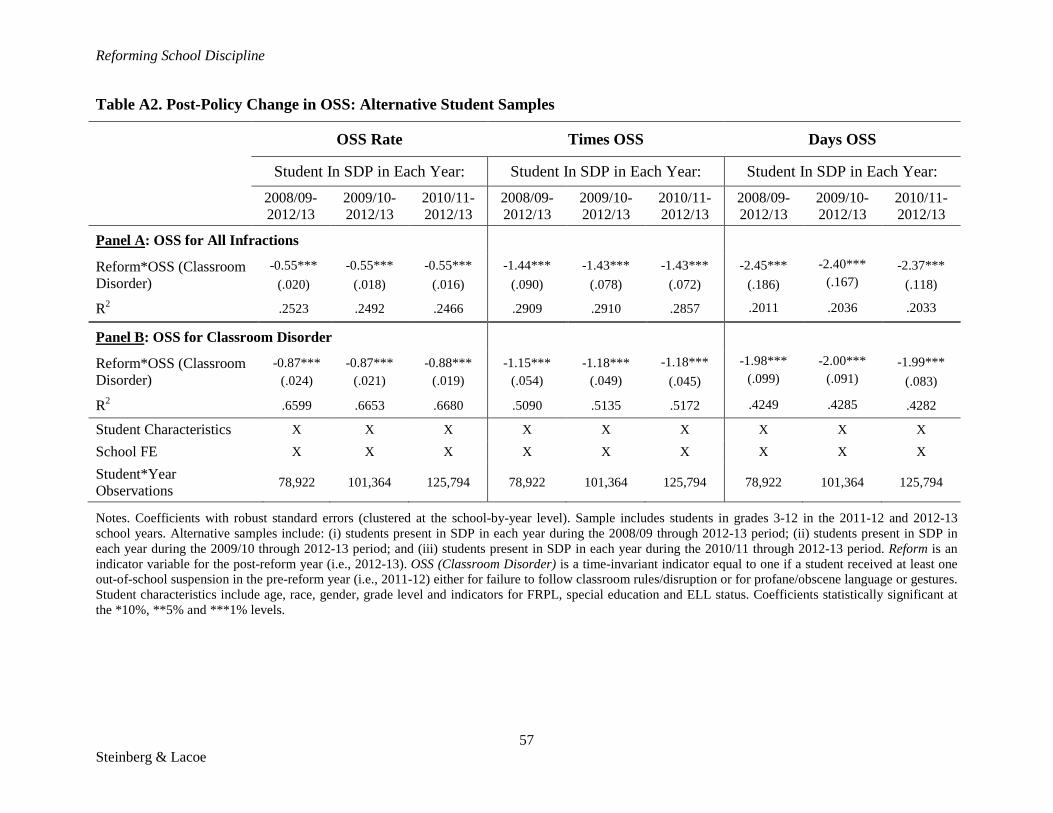
Reforming School Discipline
57 Steinberg & Lacoe
Table A2. Post-Policy Change in OSS: Alternative Student Samples
OSS Rate Times OSS Days OSS
Student In SDP in Each Year: Student In SDP in Each Year: Student In SDP in Each Year:
2008/09-2012/13
2009/10-2012/13
2010/11-2012/13
2008/09-2012/13
2009/10-2012/13
2010/11-2012/13
2008/09-2012/13
2009/10-2012/13
2010/11-2012/13
Panel A: OSS for All Infractions
Reform*OSS (Classroom Disorder)
-0.55*** (.020)
-0.55*** (.018)
-0.55*** (.016)
-1.44*** (.090)
-1.43*** (.078)
-1.43*** (.072)
-2.45*** (.186)
-2.40*** (.167)
-2.37*** (.118)
R2 .2523 .2492 .2466 .2909 .2910 .2857 .2011 .2036 .2033
Panel B: OSS for Classroom Disorder
Reform*OSS (Classroom Disorder)
-0.87*** (.024)
-0.87*** (.021)
-0.88*** (.019)
-1.15*** (.054)
-1.18*** (.049)
-1.18*** (.045)
-1.98*** (.099)
-2.00*** (.091)
-1.99*** (.083)
R2 .6599 .6653 .6680 .5090 .5135 .5172 .4249 .4285 .4282
Student Characteristics X X X X X X X X X
School FE X X X X X X X X X
Student*Year Observations 78,922 101,364 125,794 78,922 101,364 125,794 78,922 101,364 125,794
Notes. Coefficients with robust standard errors (clustered at the school-by-year level). Sample includes students in grades 3-12 in the 2011-12 and 2012-13 school years. Alternative samples include: (i) students present in SDP in each year during the 2008/09 through 2012-13 period; (ii) students present in SDP in each year during the 2009/10 through 2012-13 period; and (iii) students present in SDP in each year during the 2010/11 through 2012-13 period. Reform is an indicator variable for the post-reform year (i.e., 2012-13). OSS (Classroom Disorder) is a time-invariant indicator equal to one if a student received at least one out-of-school suspension in the pre-reform year (i.e., 2011-12) either for failure to follow classroom rules/disruption or for profane/obscene language or gestures. Student characteristics include age, race, gender, grade level and indicators for FRPL, special education and ELL status. Coefficients statistically significant at the *10%, **5% and ***1% levels.

Reforming School Discipline
58 Steinberg & Lacoe
Table A3. Post-Policy Change in Achievement: Alternative Student Samples
Math Achievement ELA Achievement
Student In SDP in Each Year: Student In SDP in Each Year:
2008/09-2012/13
2009/10-2012/13
2010/11-2012/13
2008/09-2012/13
2009/10-2012/13
2010/11-2012/13
Panel A: Standardized
Reform -0.06*** (.011)
-0.05*** (.009)
-0.04*** (.007)
-0.06*** (.009)
-0.05*** (.007)
-0.04*** (.007)
OSS (Classroom Disorder)
-0.25*** (.027)
-0.24*** (.022)
-0.23*** (.020)
-0.27*** (.026)
-0.27*** (.023)
-0.26*** (.022)
Reform*OSS (Classroom Disorder)
0.03 (.038)
0.04 (.031)
0.03 (.027)
0.03 (.042)
0.04 (.035)
0.04 (.031)
R2 .4346 .4252 .4067 .4360 .4162 .3956
Panel B: Proficiency
Reform -0.06*** (.005)
-0.06*** (.004)
-0.05*** (.003)
-0.05*** (.005)
-0.04*** (.004)
-0.04*** (.003)
OSS (Classroom Disorder) -0.13*** (.013)
-0.12*** (.011)
-0.12*** (.010)
-0.13*** (.015)
-0.12*** (.012)
-0.12*** (.011)
Reform*OSS (Classroom Disorder)
0.02 (.019)
0.03 (.016)
0.03** (.015)
0.02 (.023)
0.02 (.018)
0.03* (.016)
R2 .2884 .2790 .2703 .3083 .2938 .2783
Student Characteristics X X X X X X
School FE X X X X X X
Student*Year Observations 33,280 49,995 68,679 33,255 49,966 68,618
Notes. Coefficients with robust standard errors (clustered at the school-by-year level) are reported. Sample includes students in grades 3-8 with available test data in the 2011-12 and 2012-13 school years. Alternative samples include: (i) students present in SDP in each year during the 2008/09 through 2012-13 period; (ii) students present in SDP in each year during the 2009/10 through 2012-13 period; and (iii) students present in SDP in each year during the 2010/11 through 2012-13 period. Reform is an indicator variable for the post-reform year (i.e., 2012-13). OSS (Classroom Disorder) is a time-invariant indicator equal to one if a student received at least one out-of-school suspension in the pre-reform year (i.e., 2011-12) either for failure to follow classroom rules/disruption or for profane/obscene language or gestures. In Panel A, achievement is standardized at the subject*grade*year level; coefficients reported in standard deviation units. In Panel B, achievement is a binary indicator variable for whether a student met Pennsylvania state proficiency standards; coefficients reported are from linear probability models. Student characteristics include age, race, gender, grade level and indicators for FRPL, special education and ELL status. Coefficients statistically significant at the *10%, **5% and ***1% levels.

Reforming School Discipline
59 Steinberg & Lacoe
Table A4. Post-Policy Change in School Absences: Alternative Student Samples
All Absences Excused Absences Unexcused Absences
Student In SDP in Each Year: Student In SDP in Each Year: Student In SDP in Each Year:
2008/09-2012/13
2009/10-2012/13
2010/11-2012/13
2008/09-2012/13
2009/10-2012/13
2010/11-2012/13
2008/09-2012/13
2009/10-2012/13
2010/11-2012/13
Reform -0.44** (.206)
-0.30* (.174)
-0.22 (.143)
-0.58*** (.147)
-0.49*** (.124)
-0.45*** (.104)
0.14 (.251)
0.18 (.211)
0.23 (.173)
OSS (Classroom Disorder)
5.56*** (.371)
5.59*** (.350)
5.43*** (.349)
0.03 (.208)
0.11 (.186)
0.22 (.183)
5.52*** (.344)
5.47*** (.338)
5.21*** (.336)
Reform*OSS (Classroom Disorder)
-0.71 (.545)
-0.95* (.501)
-0.81 (.496)
-0.28 (.290)
-0.43* (.262)
-0.48* (.247)
-0.43 (.517)
-0.51 (.497)
-0.33 (.491)
R2 .2104 .2155 .2143 .0761 .0760 .0750 .2564 .2668 .2704
Student Characteristics X X X X X X X X X
School FE X X X X X X X X X
Student*Year Observations 78,922 101,364 125,794 78,922 101,364 125,794 78,922 101,364 125,794
Notes. Coefficients with robust standard errors (clustered at the school-by-year level). Sample includes students in grades 3-12 in the 2011-12 and 2012-13 school years. Alternative samples include: (i) students present in SDP in each year during the 2008/09 through 2012-13 period; (ii) students present in SDP in each year during the 2009/10 through 2012-13 period; and (iii) students present in SDP in each year during the 2010/11 through 2012-13 period. Reform is an indicator variable for the post-reform year (i.e., 2012-13). OSS (Classroom Disorder) is a time-invariant indicator equal to one if a student received at least one out-of-school suspension in the pre-reform year (i.e., 2011-12) either for failure to follow classroom rules/disruption or for profane/obscene language or gestures. Student characteristics include age, race, gender, grade level and indicators for FRPL, special education and ELL status. Coefficients statistically significant at the *10%, **5% and ***1% levels.
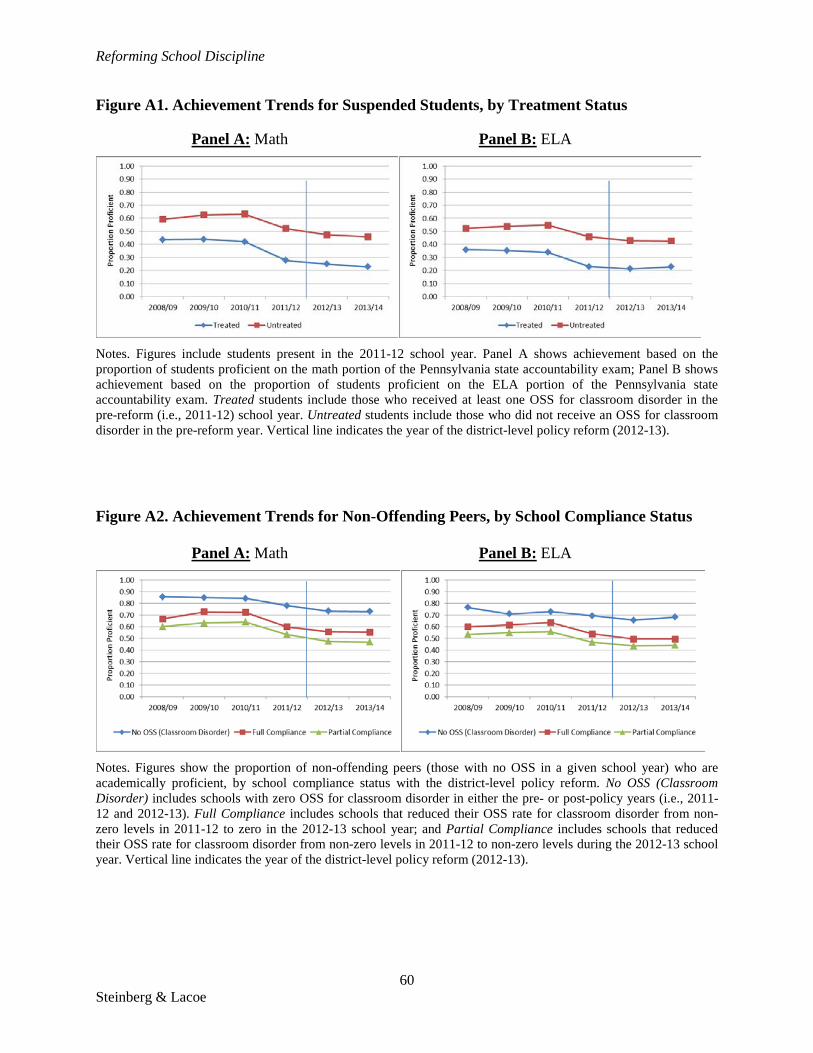
Reforming School Discipline
60 Steinberg & Lacoe
Figure A1. Achievement Trends for Suspended Students, by Treatment Status
Panel A: Math Panel B: ELA
Notes. Figures include students present in the 2011-12 school year. Panel A shows achievement based on the proportion of students proficient on the math portion of the Pennsylvania state accountability exam; Panel B shows achievement based on the proportion of students proficient on the ELA portion of the Pennsylvania state accountability exam. Treated students include those who received at least one OSS for classroom disorder in the pre-reform (i.e., 2011-12) school year. Untreated students include those who did not receive an OSS for classroom disorder in the pre-reform year. Vertical line indicates the year of the district-level policy reform (2012-13).
Figure A2. Achievement Trends for Non-Offending Peers, by School Compliance Status
Panel A: Math Panel B: ELA
Notes. Figures show the proportion of non-offending peers (those with no OSS in a given school year) who are academically proficient, by school compliance status with the district-level policy reform. No OSS (Classroom Disorder) includes schools with zero OSS for classroom disorder in either the pre- or post-policy years (i.e., 2011-12 and 2012-13). Full Compliance includes schools that reduced their OSS rate for classroom disorder from non-zero levels in 2011-12 to zero in the 2012-13 school year; and Partial Compliance includes schools that reduced their OSS rate for classroom disorder from non-zero levels in 2011-12 to non-zero levels during the 2012-13 school year. Vertical line indicates the year of the district-level policy reform (2012-13).