Reflections on High School Students’ Graphing Skills and ... · 55 Gültepe / Reflections on High...
29
Received: February 4, 2015 Revision received: July 5, 2015 Accepted: January 14, 2016 OnlineFirst: February 15, 2016 Copyright © 2016 EDAM ISSN 1303-0485 eISSN 2148-7561 www.estp.com.tr DOI 10.12738/estp.2016.1.2837 February 2016 16(1) 53-81 Research Article KURAM VE UYGULAMADA EĞİTİM BİLİMLERİ EDUCATIONAL SCIENCES: THEORY & PRACTICE Citation: Gültepe, N. (2016). Reflections on high school students’ graphing skills and their conceptual understanding of drawing chemistry graphs. Educational Sciences: Theory & Practice, 16, 53–81. http://dx.doi.org/10.12738/estp.2016.1.2837 1 Correspondence to: Nejla Gültepe (PhD), Department of Science Education, Dumlupınar University Kütahya, Turkey. Email: [email protected] Abstract Graphing subjects in chemistry has been used to provide alternatives to verbal and algorithmic descriptions of a subject by handing students another way of improving their manipulation of concepts. Teachers should therefore know the level of students’ graphing skills. Studies have identified that students have difficulty making connections with the graphs of different variables to chemistry concepts and the real world. This study has been conducted to establish how students who excel at chemistry graphing problems interpret them in order to determine whether those who are unsuccessful encounter problems due to concepts or a deficiency in graphing skills and to present students’ levels with these problems. This is a qualitative study guided by the purposive sampling method with the aim of analyzing high school students’ graphing skills and exploring how they relate these skills and conceptual understandings while drawing chemistry graphs. The sample (n = 67) included students in Turkey in the 11th grade. Data was collected using an achievement test. This test had five questions regarding chemical reaction, solubility, freezing depression of water, ionization of weak acids, and ionization energy. Each question was formed in two stages. The first stage consisted of five graphing questions independent of concepts in chemistry; the second stage involved composing five chemistry graphs. Students with good levels of conceptual understanding were concluded to have strong graphing skills and students with poor conceptual understanding were unsuccessful with their chemistry graphs. Drawing more accurate chemistry graphs was also discovered as a need of students who had excellent conceptual knowledge but were unable to apply accurate chemical principles or rules even though they had been capable of drawing the correct graph type. Misconceptions were also observed to underlie the challenges students encountered in drawing graphs. Keywords Conceptual understanding • Graphing skills • Chemistry graphs • Chemistry education Nejla Gültepe 1 Dumlupınar University Reflections on High School Students’ Graphing Skills and Their Conceptual Understanding of Drawing Chemistry Graphs
Transcript of Reflections on High School Students’ Graphing Skills and ... · 55 Gültepe / Reflections on High...

Received: February 4, 2015Revision received: July 5, 2015Accepted: January 14, 2016OnlineFirst: February 15, 2016
Copyright © 2016 EDAMISSN 1303-0485 eISSN 2148-7561
www.estp.com.trDOI 10.12738/estp.2016.1.2837 February 2016 16(1) 53-81
Research Article
KURAM VE UYGULAMADA EĞİTİM BİLİMLERİ EDUCATIONAL SCIENCES: THEORY & PRACTICE
Citation: Gültepe, N. (2016). Reflections on high school students’ graphing skills and their conceptual understanding of drawing chemistry graphs. Educational Sciences: Theory & Practice, 16, 53–81. http://dx.doi.org/10.12738/estp.2016.1.2837
1 Correspondence to: Nejla Gültepe (PhD), Department of Science Education, Dumlupınar University Kütahya, Turkey. Email: [email protected]
Abstract
Graphing subjects in chemistry has been used to provide alternatives to verbal and algorithmic descriptions
of a subject by handing students another way of improving their manipulation of concepts. Teachers should
therefore know the level of students’ graphing skills. Studies have identified that students have difficulty making
connections with the graphs of different variables to chemistry concepts and the real world. This study has
been conducted to establish how students who excel at chemistry graphing problems interpret them in order
to determine whether those who are unsuccessful encounter problems due to concepts or a deficiency in
graphing skills and to present students’ levels with these problems. This is a qualitative study guided by the
purposive sampling method with the aim of analyzing high school students’ graphing skills and exploring how
they relate these skills and conceptual understandings while drawing chemistry graphs. The sample (n = 67)
included students in Turkey in the 11th grade. Data was collected using an achievement test. This test had five
questions regarding chemical reaction, solubility, freezing depression of water, ionization of weak acids, and
ionization energy. Each question was formed in two stages. The first stage consisted of five graphing questions
independent of concepts in chemistry; the second stage involved composing five chemistry graphs. Students with
good levels of conceptual understanding were concluded to have strong graphing skills and students with poor
conceptual understanding were unsuccessful with their chemistry graphs. Drawing more accurate chemistry
graphs was also discovered as a need of students who had excellent conceptual knowledge but were unable to
apply accurate chemical principles or rules even though they had been capable of drawing the correct graph type.
Misconceptions were also observed to underlie the challenges students encountered in drawing graphs.
Keywords
Conceptual understanding • Graphing skills • Chemistry graphs • Chemistry education
Nejla Gültepe1
Dumlupınar University
Reflections on High School Students’ Graphing Skills and Their Conceptual Understanding of Drawing
Chemistry Graphs

54
EDUCATIONAL SCIENCES: THEORY & PRACTICE
Special importance was attached to science education in the Turkish education system in the 1960s in order to catch up with the scientific and technological developments that were occurring especially in European countries; up-to-date science programs were designed and new understanding was brought to these programs through the application of the scientific method as opposed to the context of unnecessary learning and rote memorization that had been included (Ergül, 1999). In order to increase the retention and meaningfulness of scientific knowledge, many concrete materials such as maps, charts, pictures, and graphs of concepts in addition to laboratories have been utilized. Since graphing is an indispensable element of science and social studies, students need to know from an early age how to use graphs and understand the different types (İnan, İnan, & Aydemir, 2014). The skill of using graphs is separated into three areas: interpretation, modeling, and conversion. Interpretation is about expressing the relevant graph orally, modeling is about expressing an observed state through graphs, and conversion is about drawing a different graph that expresses the same state as a given graph. All of these skills require using different types of intelligence. Individuals with mathematical-logical or visual-spatial intelligence need to see patterns in their learning to organize their information and see what they are learning (Seçken & Yörük, 2012). Visualization can be addressed through graphs that symbolize words or concepts and give more idea of the meaning of these words or concepts beyond their sound; thus, graphical representations play a special role in mathematics and science practice (Fuini & Gray, 2000). Different skills are essential in this century in terms of science and mathematics. One of the most important skills is the ability to work with data. This is exemplified by making inferences from given data, finding trends, critiquing and using data to support and rebut claims, ensuring complex relations (dual, triple, quadruple, etc.) between multivariate data, representing results in the quickest way, generating clear and perceptible data displays, and clarifying data assessment and analysis (Glazer, 2011; Kelly, Jasperse, & Westbrooke, 2005).
Dori and Hameiri (2003) claimed that chemical education is a complex human endeavor that involves deep understanding of diverse concepts and requires a mental transfer between several modes of representation. Chemistry, being an experimental science, requires chemistry classroom schedules to involve experiments in laboratories. However, secondary schools do not have enough labs for chemical experiments, their equipment is insufficient for investigations, or they have no visual materials for effectively learning chemistry. Graphs are a tool of chemistry classes that can be used to express relations between most chemistry concepts. Therefore, students’ proper comprehension and interpretation of the relations between chemistry concepts is directly related to their successful understanding and interpretation of graphs (Seçken & Yörük, 2012).

55
Gültepe / Reflections on High School Students’ Graphing Skills and Their Conceptual Understanding of Drawing Chemistry Graphs
Many researchers believe that inadequate graphing skills are a serious barrier to comprehending the concepts of mathematics and science (Lapp & Cyrus, 2000). Therefore, students’ ability to interpret graphs and graphically represent scientific phenomena is critical. Science concerns the study of naturally occurring phenomena, and mathematics has allowed us to describe these phenomena in terms of equations that allow us to predict the behavior of systems as their conditions change. For this reason, mathematical knowledge is necessary for expressing scientific laws and solving problems (Güzel, 2004). A well-drawn graph provides a bridge between the two disciplines as it provides a convenient way of visualizing mathematics and science together. Graphs are overwhelmingly used in science education and laboratories in particular as they convey knowledge that most datasets cannot display alone. They contribute to a better understanding of the concepts of chemistry like ideal gas laws, solubility, chemical equilibrium, reaction rate, and colligative properties of solutions. It is therefore quite significant for a student to have enhanced graphing and interpretation skills. Students have difficulty in drawing graphs and interpreting them using scientific language (Roth & Bowen, 2003). Lapp and Cyrus (2000) listed some difficulties students experience while drawing and interpreting graphs: (a) prior knowledge of the a graph’s content, (b) inadequacy in contextually comprehending concepts, (c) inadequate knowledge about the language and rules of graphs or inadequate skills in putting knowledge into practice, and (d) problems in defining variables and connecting graphs with variables. Background knowledge is useful for building new knowledge, yet sometimes it can hamper learning. Conceptual forms and a mastery of skills can affect subsequent learning. Previous knowledge that may influence graphing aptitude, like hardships or misconceptions regarding graphing, previous beliefs, or previous content knowledge, becomes expressed in graphs (Schwartz, Sears, & Chang, 2007). Although graphing skills are taught extensively in mathematics classes, students are often unable to apply these skills to scientific concepts. Since showing the relationship between content-related variables is important in science, science education researchers have put additional emphasis on students’ blind spots in representing and interpreting scientific events in graphs (Lehrer & Schauble, 2007). However, many research studies about graph interpretation have centered upon the use of graphs to display mathematical functions with few studies on graph interpretation in a scientific setting (Glazer, 2011).
In studies which investigated the relation between students’ conceptual understanding of subjects in science and mathematics classes and their drawing and interpretation skills regarding graphs (Hadjidemetriou & Williams, 2002; Roth, Bowen, & McGinn, 1999), understanding graphs related to scientific concepts was stated to be directly associated with the skills of graphing, understanding, and interpretation, and that teaching topics related to students’ graphing and interpretation before a lecture may enhance the level of their comprehension of scientific concepts

56
EDUCATIONAL SCIENCES: THEORY & PRACTICE
and their school performance. Additionally, research has shown clearly that those who draw graphs and interpret them are highly influenced by content in their interpretation of data. For example, a student’s familiarity with content affects their ability to analyze and greatly influences the ways that students less skilled in graphing can interpret them (Roth & Bowen, 2003).
In everyday life, graph interpretation is an essential skill for all students while drawing a graph is not. People who work and are specialized in the fields of science, engineering, and academic research need this skill (Glazer, 2011). Leinhardt, Zaslavsky, and Stein (1990) mentioned the difference between drawing and interpretation; interpretation is an activity that includes reaction to certain data (graphs, equations, datasets) and drawing is an activity that includes constituting new parts that have not been given. Graph interpretation and drawing are substantial elements in science learning. Yet we still do not know much about how students form graphs or select the most suitable form to represent their data. There have been many studies examining students’ alternative conceptions of graph interpretation. However, not many studies have examined students’ misconceptions about graph drawing except mathematically (Leinhardt et al., 1990). Not many researchers have examined the aptitude of drawing graphs or related decisions such as selecting the most suitable graph type. In studies conducted particularly with high school students, not much has been reported on the aptitude of drawing graphs and tables that make use of data, on selecting the exposition of data (students’ choice of graphing representations), on combining graph skills, or on associating different types of graphs that can be applied in introductory science courses (Shah & Hoeffner, 2002). In this respect, students should first gain and develop graph-drawing and interpretation skills to prepare for further subjects and classes (Bou Hamdan, 2010). The literature includes studies on of students’ (Padilla, McKenzie, & Show, 1986) and teachers and pre-service teachers’ (Bowen & Roth, 2005; Çelik & Sağlam-Arslan, 2012) knowledge level regarding drawing and interpreting graphs, as well as the difficulties they experience (Bowen & Roth, 1998). When studies on graphs are examined, they can mainly be seen to involve physics and mathematics (i.e., Testa, Monroy, & Sassi, 2002) with a limited number on chemistry and biology (i.e., Adams & Shrum, 1990; Seçken & Yörük, 2012). The present study consists of five topics (chemical reactions, the solubility rate of a solution containing salt, the periodic table, the freezing point of salt water, and ionization of weak acids) with the hope that they will contribute to studies regarding science education research. It may not always be true that students in chemistry classes with the ability to draw and interpret graphs will also be good at making scientific sense of the concepts related to the graphs, specifying the controlled variable accurately, or connecting variables properly. On the contrary, even if students can construct concepts correctly, they may have difficulty drawing and interpreting graphs, be unable to draw and interpret graphs, or be unable to fully experience conceptual understanding because

57
Gültepe / Reflections on High School Students’ Graphing Skills and Their Conceptual Understanding of Drawing Chemistry Graphs
of anxiety. This research is a qualitative study of the extent to which students’ graphing skills and conceptual understanding of chemistry affect their success in drawing chemistry graphs.
Method
ParticipantsThe study was conducted at a science high school in Çankırı, Turkey. There were
four 11th grade classes and all the students from these classes participated in the study. The 67 participating students (29 girls, 38 boys), who were attending a science high school, had received high scores on the High School Entrance Examination. The chemistry class students’ average level of success was similar: approximately 30 % of the students in each classroom were quite accomplished in all subjects whereas about 35% of them had received poor scores. The researcher taught the chemistry classes for the 10th grade as well as the 11th grade which comprised the sample group, and the assessment stage had established that students had problems with these skills. The teaching methods of the class involved applying concepts, in-class discussions, question-and-answers, and narration. The topic of functions from the 9th-grade mathematics curriculum and the 11th-grade analytical geometry classes are mainly taught by drawing graphs. Two of the classes were taught by the same mathematics teachers; the other two analytical geometry classes were taught by two different teachers. Thereby the study was conducted with students who had been taught science and mathematics and had had the necessary practice. The study, which intended to specify whether these problems occurred due to insufficient graphing or determination skills, improper interpretation of variables, or conceptual misunderstandings, applied the purposive sampling method.
Research Design This study was designed from among the qualitative research approaches as a
phenomenological research. Phenomenological designs focus on phenomena that we are aware of yet do not have in-depth or elaborate comprehension of. They can occur in different forms like phenomena, incidents, experiences, perceptions, and situations (Yıldırım & Şimşek, 2005). The phenomenological design has been used to introduce the difficulties confronted in graphing skills based on the graphs students had drawn and to reveal in-detail how much students’ conceptual understanding and graphing skills affected their success at solving chemistry problems that included graphs. The achievement test prepared by the researcher for this study was applied to all the classes concurrently over a period of 45 minutes. The study was designed in such a way to include the graphs of ordinal and nominal data for reversible and irreversible

58
EDUCATIONAL SCIENCES: THEORY & PRACTICE
reactions. When the topics within this context were observed, the dissociation of weak acids could be seen to fall under the 11th grade curriculum. Aside from this, although solubility belongs to the 9th grade curriculum, students need to know the concepts of equilibrium for the 11th grade curriculum for proper comprehension. Moreover, the topics of ionization energy and freezing point depression from the10th grade curriculum were included within the ordinal data graphs. While teaching equilibrium in aqueous solutions, exercises on periodic properties, the colligative properties of strong basic solutions, and solubility were emphasized. After this unit, the test was applied. No introduction of the questions had occurred at the beginning of the course but the students had been informed that they would be take part in a research study.
Data CollectionThe achievement test applied in the study contained five questions, each of which
was formed of two items. Within each pair, one question asked the students to draw the appropriate graph regarding a given condition independent of chemistry concepts. The second part required students to use their conceptual knowledge about the topic to draw a graph and re-identify the variables of the graph. In order to gain deeper understanding of the students’ performance and increase the reliability of their answers, students were required to state their interpretation of the chemistry topic. The questions were designed by the author and a high school chemistry teacher. They were then analyzed by a science educator and two chemistry teachers who gave their opinions on the appropriateness of the test questions, duration for answering them, and clarity of the language. Test items are given in Appendix A. The reliability of the test was .84 for this study.
Data AnalysisThis was a qualitative study based on a data resolution methodology with the aim
of analyzing high school students’ graphing skills and conceptual understanding by exploring how they related these variables while drawing chemistry graphs. For the analysis, a scoring scheme was developed to measure student performance; the rubrics are given in Table 1. Assessment criteria included whether the given statements had been transferred into the graphs correctly, whether the axes had been specified correctly, whether the graph types (bar or line; linear or parabolic) had been determined correctly with regard to the types of data (nominal/ordinal), and whether the concepts and relations between concepts had been interpreted correctly and proper graphs drawn. The maximum score on the graphing questions was 20 for those not including chemistry concepts and 25 for those that did. The scoring criteria scale was verified by a science educator and a chemistry teacher. To test intercoder reliability, a question-by-question analysis to achieve consensus was conducted and the mean score was used in cases of disagreement.

59
Gültepe / Reflections on High School Students’ Graphing Skills and Their Conceptual Understanding of Drawing Chemistry Graphs
Table 1EvaluationCriteriaofGraphDrawing(G)andChemistryGraphDrawing(C)
Evaluation Criteria1 2 3 4 5
G C G C G C G C G CAble to transfer the given statement/chemical event to the graph 1 1 1 1 1 1 1 1 1 1Able to define the x and y axes 1 1 1 1 1 - 1 1 1 1Able to choose an appropriate graph (bar graph, line graph) for the given data/statement
1 1 1 1 1 1 1 1 1 1
Graph points were connected using the most appropriate lines (function could be linear or curved
1 1 1 1 1 1 1 1 1 1
Interpretation - 1 - 1 - 1 - 2 - 1Total 4 5 4 5 4 4 4 6 4 5
During the qualitative analysis of data, median and percentage distribution calculations were employed. Students were assigned to a category according to their median. The student characteristics for each category regarding median values are given below.
• Category 1: Students’ scores were above the median for general graph drawing and chemistry graph drawing.
• Category 2: Students’ scores were above the median for general graph drawing; the median student score and the students’ scores were below the median for drawing chemistry graphs.
• Category 3: The median student score and students’ scores were below the median for general graph drawing; students’ scores were above the median for drawing chemistry graphs.
• Category 4: The median student score and students’ scores were below the median for general and chemistry graph drawing.
Results and DiscussionThis section involves a general assessment in which the qualitative analysis of the
students’ responses has been made. In this assessment, the graphing scores (mean [M]
Table 2DescriptiveStatisticResultsofStudents’GeneralGraphDrawing(G)andChemistryGraphDrawing(C)
Questions Test item M SD1 1G 2.07 .77
1C 1.27 1.232 2G .97 .91
2C 2.40 1.503 3G 2.86 .76
3C 1.12 1.094 4G 1.90 1.27
4C 1.76 1.465 5G 2.79 1.25
5C 2.37 1.17

60
EDUCATIONAL SCIENCES: THEORY & PRACTICE
= 10.59; median [Mdn] = 10.00; standard deviation [SD] = 4.96, minimum = 4.00, maximum = 20) were higher than the chemistry graph drawing scores (M = 8.92, Mdn = 9.00, SD = 6.45, minimum = 1, maximum = 25). Descriptive statistic results according to test items are given in Table 2.
Students’ responses were analyzed to expose their graph-drawing skills and conceptual understanding of chemistry graphs. The students’ performance category results for the test items are shown in Table 3 and Figure 1. Students’ responses were analyzed to expose how they drew the general graphs in terms of graphing skills and how they drew the chemistry graphs in terms of graphing skills and conceptual understanding. Findings of characteristic differences for students’ categories are presented below.
Table 3Student Performance Categories for Test Items
Test itemsCategories (%)
Category 1 Category 2 Category 3 Category 4Question_1 (1G and 1C) 41.79 13.44 1.49 43.28Question_2 (2G and 2C) 23.88 4.48 32.84 38.80Question_3 (3G and 3C) 40.30 20.90 0 38.80Question_4 (4G and 4C) 22.39 23.88 2.97 50.76Question_5 (5G and 5C) 35.82 16.42 13.43 34.33
Category 1Students who fell into the first category (i.e. Cat1_S1) drew graphs correctly,
constructed the types of graphs and variables in the graphs accurately, and also understood the concept of the chemical phenomena in the microscopic world.
A high percentage of students were able to succeed not only at the macroscopic level but also at the microscopic level regarding graphs. For Question 1, 41.79% of
Figure 1: Student performance categories for test items.

61
Gültepe / Reflections on High School Students’ Graphing Skills and Their Conceptual Understanding of Drawing Chemistry Graphs
the students correctly drew the graphs and defined the axes for both 1G & 1C. For instance, Cat1_S1, Cat1_S2, Cat1_S3, and Cat1_S4’s graphing performances were very high for both items in the first question (Table 4).
Table 4ExamplesofStudentResponsesfor1Gand1CinCategory1
1G 1CCat1_: Horizontal axis: Time; Vertical axis: Price.
Cat1_S1: Rate becomes maximum the time reaction starts. Because of the decrease of concentration of oxygen in time, the rate will decrease; in other words, the amount of accumulating product in time has an increase with a declining rate. Horizontal axis: Time; Vertical axis: mass of CO2.
Cat1_S2: Horizontal axis: Year; Vertical axis: Increase of price.
Cat1_S2: Horizontal axis: Time; Vertical axis: Rate of combustion. The amount of solid carbon decreases as the reaction proceeds. The probability that the reactants will collide and react is decreased, causing a slower reaction.
Cat1_S3: Horizontal axis: Time; Vertical axis: Price.
Cat1_S3: Horizontal axis: Time; Vertical axis: Rate of CO2 formation. The formation of carbon dioxide is decreased over time because carbon is con-sumed. The graph becomes horizontal as the reaction stops when one of the reactants is all used up.
Cat1_S4: Horizontal axis: Time; Vertical axis: Price.
Cat1_S4: Horizontal axis: Time; Vertical axis: Pressure of CO2 formation. Partial pressure of CO2 increases during the combustion of solid carbon at constant pressure and temperature.
These students not only successfully drew the parabolic graphs that reflected the rate expression and perfectly defined the axes in the graphs of both items, but they also succeeded in reflecting their concepts about the changes in chemical reactions and chemical kinetics in the graph of the second item. For instance, Cat1_S1, Cat1_S2, and Cat1_S3 comprehended the rate of the reaction at the molecular level because they had accurately defined parabolic location of the slopes and variables in the graphs. Most

62
EDUCATIONAL SCIENCES: THEORY & PRACTICE
of the students in this category defined the horizontal axis as time and the vertical axis as price for the graph of the first item and the horizontal axis as time and vertical axis as the amount of composing product, rate of composing product, or pressure of CO2 for the graph of the second item. For Question 2, which required the students to think microscopically, 23.88% of the students drew the graphs correctly. Students drawing a straight line in the first item and a curved line that increased with a declining rate in the second item indicated their comprehension of the rate of change of dissolution over time within the first category. Moreover, they defined the slopes accurately regarding the expression for the first item and reflected the relationship between the dissolving rate and surface area on the dissolving rate graph for the second item. Question 2 and the responses of Cat1_S2, Cat1_S3, and Cat1_S4 are shown in Table 5.
Table 5ExamplesofStudentResponsesfor2Gand2CinCategory1
2G 2CCat1_S2: Horizontal axis: Time; Vertical axis: HeightSpring Autumn
Cat1_S2: Horizontal axis: Time; Vertical axis: Amount of dissolved sugar. Particle size affects the dissolving rate of sugar. The greater the surface area of the sugar (powdered sugar), the faster it dissolves.
Cat1_S3: Horizontal axis: Time; Vertical axis: Height.
Cat1_S3: Horizontal axis: Time; Vertical axis: Change of mass. Powdered sugar dissolved faster than others because its minimal surface area.
Cat1_S4: Horizontal axis: Time; Vertical axis: Height.
Cat1_S4: Horizontal axis: Time; Vertical axis: Amount of solute. Powder sugar will dissolve faster and sugar cubes will dissolve slower over the same time interval. It relates with the surface area of sugar.
The students’ performance on the topics of carbon combustion, effect of the particle size of sugar on solubility, and ionization of HF (Q1, Q2, & Q4) in which students were required to think at a particular level did not qualify for a high percentage of Category 1. Question 4, which examined students’ graphing skills and knowledge of the ionization percentage of weak acids, also required students to

63
Gültepe / Reflections on High School Students’ Graphing Skills and Their Conceptual Understanding of Drawing Chemistry Graphs
think submicroscopically; 22.39% of the students drew graphs accurately for both of the question items. All students in this category were able to define the changes using the correct curve-shapes and variables in the graphs. In the second item of the question, most students in this category were able to describe the solution of HF acid in water submicroscopically, stating that HF acid was weak so it could not completely ionize thus leaving both acids and ions in the solution. They drew the proper graphs correctly which showed the increase in the amount of product over time for the second item and which showed the decrease in the water in an emptying glass and increase in water in a filling glass for the first item. The second graph they drew tended toward a maximum amount when all the solid reactant was used up and the graph became horizontal. This same reason related to the graph in the first item as the graph moved towards a minimum amount when all the water in glass was emptied and towards a maximum amount when the glass was completely full, thus also becoming horizontal. They defined the gradient correctly as a measure of of the reaction rate for the second item and as a measure of the flow rate of water for the first. Few students made drawings, but most of them made explanations through expressions. It was remarkable that in so doing they used proper scientific language. For Question 4, Cat1_S1 and Cat1_S3’s responses are given in Table 6. Students who comprehended chemistry concepts at the molecular level were concluded to be more successful in transferring their concepts into the chemistry graphs they had drawn.
Table 6ExamplesofStudentResponsesfor4Gand4CinCategory1
4C 4GCat1_S1: Cat1_S1: Weak acids do not ionize 100% in water. Since acid molecules
are polar, de-ionized parts dissolve molecularly. In weak acid solutions, ions and molecules stay together. Horizontal axis: Time; Vertical axis: Amount of matter.
Cat1_S3: Horizontal axis: Time; Vertical axis: Level of water.
Cat1_S3: Weak acids do not ionize 100% in water. Hence, 0.09 M out of 0.1 m HF solution will be left un-ionized. Since acid molecules are polar, de-ionized parts dissolve molecularly. Its ionization rate will slow down over time. The ion concentration of H+ and F- will rise. Horizontal axis: Time; Vertical axis: Concentration.

64
EDUCATIONAL SCIENCES: THEORY & PRACTICE
The explanations they made were qualified and included certain principles. For instance, the second item of Question 3 was designed to assess students’ understanding of the freezing temperature of water containing nonvolatile substances. Students with a better understanding of this concept were able to answer the question; 40.30% of the students drew graphs for both items. The Category 1 responses obtained from the students are provided in Table 7.
Table 7ExamplesofStudentResponsesfor3Gand3CinCategory1
3G 3CCat1_S2: Horizontal axis: Month. Cat1_S2: As the number of ions increase, the freezing point falls. If AlCl3
and C6H12O6 dissolve in equal numbers of moles, AlCl3 lowers the freezing point more than NaCl. As for C6H12O6, it lowers the freezing point less.
Cat1_S5: Horizontal axis: Month; Vertical axis: The price paid.
Cat1_S5: The fall in freezing temperature depends on the particle number of the dissolving solid. When C6H12O6 dissolves, the solution involves one particle; when NaCl dissolves, the solution involves two; when AlCl3 dis-solves, the solution involves three particles.
Cat1_S1: Horizontal axis: Month; Vertical axis: remaining debt.
Cat1_S1: As the glucose dissolves, there will be a particle in the solution. As aluminum chloride dissolves, there are four particles, one aluminum ion and three chloride ions. Each ion lowers the freezing point of water by a unit.
From these responses, we see that the students provided more complete, precise, high-quality explanations for the questions. They drew the graph of y = kx to describe a positive linear relationship and defined the values in the horizontal and vertical axes, the value of k = 1 for C6H12O6 and k = 4 for AlCl3. They stated their reasoning to be the number of ions “as the number of ions increases, the freezing point drops.”

65
Gültepe / Reflections on High School Students’ Graphing Skills and Their Conceptual Understanding of Drawing Chemistry Graphs
They stated that glucose primarily dissolved molecularly, that aluminum chloride and sodium chloride dissolved through ionization, and that the solutions included 1, 4, and 2 ions, respectively, or they showed this in their reaction statement. Students defined the slopes and variables accurately regarding the expressions and drew straight lines for both items in Question 3. If the students did not have the detailed knowledge that each particle in the solution lowered the freezing point of water to a certain extent, they could not have drawn the graph in the second item. Cat1_S1 and Cat1_S5 connected data with a plotted-line graph of y = kx and defined k = 2 for Mehmet, k = 3 for Ali, and k = 5 for Ayşe. They stated their reasoning to be that as the number of installments increased, the number of remaining installments decreased. Cat1_S2 connected the data with a line plot. They accurately constructed graphs and labeled the horizontal axis as the independent variable and the vertical axis as the dependent variable.
For Question 5, 35.82% of the students drew graphs for both items. As an example, the successful students who drew graphs with all the details reflecting the phenomena are shown in Table 8.
Students with high graphing skills performance used the most appropriate graph type for the questions. They were expected to draw a bar graph in 5G that contained ordinal and
Table 8ExamplesofStudentResponsesfor5Gand5CinCategory1
5G 5CCat1_S3 and Cat1_S5: There is no ratio between the value so the type of graphic should be a bar. Horizontal axis: Age; Vertical axis: Height.
Cat1_S3 and Cat1_S5: Horizontal axis: Atomic number; Vertical axis: Ionization energy. When an atomic radius decreases, ionization energy in-creases. Across a period, atomic radii decrease on the periodic table. This is due to the outer shell electron that is being removed being more strongly attracted to the nucleus as we go across the period, hence more energy is required to remove it.
Cat1_S2: Horizontal axis: Age; Vertical axis: Height.
Cat1_S2: Changes of Ionization Energy in Periodic Table; I A<III A<II A<IV A<VI A<V A<VII A<VIII A. The ionization energy generally in-creases as we move from alkali metals to noble gases. Since IIA and V A have the property of spherical symmetry, they have greater ionization energies than III A and VI A.

66
EDUCATIONAL SCIENCES: THEORY & PRACTICE
unrelated data and to draw a line graph that contained ordinal and related data in 5C. For instance, Cat1_S5, Cat1_S2, and Cat1_S3 drew a bar graph for the first item; however, they connected the second item’s points directly as proportionally increasing lines. Highly successful students in the science and mathematics classes fell into this category. Individuals who are able to understand complex relations between interrelated concepts and ideas can be said to have the skills of reasoning through induction and deduction, of applying the scientific method and identifying connections and relations, and having strong logical/mathematical intelligence; individuals who can think visually and express figures and spatial features through graphs can be said to have strong visual/spatial intelligence (Silver, Strong, & Perini, 1997). Concordantly, the success of students in this category on general graphing questions and chemistry problems including graphs may be attributed to their strong logical-mathematical and/or visual-spatial intelligence potentials.
Category 2The students with better graphing-skills performances tended to draw graphs
successfully. The students who had misconceptions about chemical phenomena and who could not adequately interpret the interactions of particles in the micro-world were unable to draw the chemistry graphs accurately even if they had used the basic principles to correctly draw the graphs and define the axes for the first items of the general questions.
For Question 1, 23.88% of the students graphed the first and second items of the question and defined the axes in the first item; however, they could not relate the conceptual understanding correctly with the chemistry graph drawing (Table 9). When the answers were examined, students could be seen to succeed at plotting the correct type of graph (curved line) for the first item and at defining and locating variables on the proper axes (independent variable for horizontal axis and dependent variable for vertical axis); however, their drawing was insufficient for the chemistry graph which consisted of a chemical reaction and chemical kinetics because they had misconceptions (i.e., Cat2_S2 and Cat2_S3 for the second item).
The volume of the reaction container does not change because the number of gas particles does not change when the combustion reaction of a carbon solid with oxygen gas occurs at a constant pressure and temperature. The reaction rate decreased because the reactants were being used up. According to Cat2_S2, for instance, the volume of the container increased. One student interpreted the graph as “carbon is a solid, its density is greater than the formed gas. Hence the volume increases until the reaction is complete.” The student’s graph indicated that the temperature rose until the reaction was completed; however, the temperature continued to rise after the completion of the reaction. The student related the variables incorrectly when determining the changes in the chemical reaction because the student had unrelated, incomplete data [“the solid is denser than the liquid for most substances” (see Table 9)]. For Question 2, 4.48% of the students drew the graph

67
Gültepe / Reflections on High School Students’ Graphing Skills and Their Conceptual Understanding of Drawing Chemistry Graphs
correctly for the first item but they could not draw the graph in the second item due to the misconceptions they had. When the students’ graphs for the second item were examined, it was evident that they had defined the slopes accurately regarding their conceptual knowledge “as contact surface increases, the dissolved amount increases over time as well.” Moreover, their line graphs indicated the inaccuracy of their definition of rate for a particular structure. However, placing the dissolved amount of each sugar with the same amount on different points of the vertical axis could be an indicator of their misconception that “powdered sugar dissolves more” (i.e., Cat2_S2) or their insufficiency in graphing skills (see Table 10).
For Question 3, 20.90% of the students drew the graph correctly for the first item but they could not draw the graph for the question’s second item because they had misconceptions about the definitions of chemical concepts. The students with inaccurate concepts who did not get full points retrieved correct knowledge of the freezing point of salt water but used it inappropriately to draw the chemistry graph. For instance, the declarative knowledge of Cat2_S3 and Cat2_S4 was not enough to draw the graph about the freezing point of water with salt. Cat2_S1 used a similar explanation and irrelevant knowledge to draw her graph (Table 11).
Table 9ExamplesofStudentResponsesfor1Gand1CinCategory2
1G 1CCat2_S1: Horizontal axis: Year; Vertical axis: Increase of price.
Cat2_S1: Horizontal axis: Temperature; Vertical axis: Amount of matter.
Cat2_S2: Horizontal axis: Time; Vertical axis: Price.
Cat2_S2: Horizontal axis: Temperature; Vertical axis: Volume. A gas re-leases during the complete combustion of solid carbon. The solid is denser than the gas and their masses are equal; therefore, the volume increases. It does not pass through the origin because there is volume of matter in the container in the beginning. Pressure does not change. The reaction is exothermic. Therefore, temperature increases.
Cat2_S3: Horizontal axis: Year; Vertical axis: Price.
Cat2_S3: Horizontal axis: Time; Vertical axis: Rate.

68
EDUCATIONAL SCIENCES: THEORY & PRACTICE
Table 11ExamplesofStudentResponsesfor3Gand3CinCategory 2
3G 3CCat2_S1: Horizontal axis: Amount of money; Vertical axis: Payment.
Cat2_S1: AlCl3: Common ion decreases the solubilty; C6H12O6: As adding substance, the freezing point decreases fast.
Cat2_S3: Cat2_S3: : The more the number of ions increases, the more the freezing point lowers.
Cat2_S4: Cat2_S4: The more the number of ions increases, the more the freezing point lowers.
Table 10ExamplesofStudentResponsesfor2Gand2CinCategory2
2G 2CCat2_S2: Horizontal axis: Sea-sons; Vertical axis: Rate of growth.
Cat2_S2: Horizontal axis: Time; Vertical axis: mass of sugar. Cube sugar < Granulated sugar < Powdered sugar.
Cat2_S1: Horizontal axis: Growth in grass; Vertical axis: Absolute humidity.
Cat2_S1: Horizontal axis: Time; Vertical axis: Amount of sugar. Cube sugar < Granulated sugar < Powdered sugar.

69
Gültepe / Reflections on High School Students’ Graphing Skills and Their Conceptual Understanding of Drawing Chemistry Graphs
Although there was a perfect linear relationship between the variables for the two items of this question, Cat2_S4 drew a straight line for the first item but drew a curved line for the second. If the student had the detailed knowledge that each particle in the solution lowered the freezing point of water to a certain extent, the student would not have made this mistake. Consequently, having correct piecemeal concepts and high performance in drawing graphs did not help 3C be correctly solved. Knowing declarative knowledge did not guarantee that students would be able to use it easily to draw graphs containing chemical concepts because they had misconceptions of the definitions of chemical concepts. Some other responses obtained from Category 2 for Questions 4 and 5 are presented in Table 12. These students had no concept (i.e., Cat2_S5) or held misconceptions (i.e., Cat2_S4) concerning the periodic increase of ionization energy from top to bottom in the periodic table. Besides, the graph that Cat2_S4 drew showed the concentration of HF to be 0.09 M, and H+ and F- were 0.01 M after the completion of ionization. At the time of equilibrium, the concentration of each particle had become constant. Nevertheless, when the representational graph of HF ionization at a particular level was examined, the misconception that HF was a poorly dissolving solid could be understood. Hence, Cat2_S4’s accurate drawing of the ionization graph did not mean that his model about the ionization of weak acids at a particular level would be correct. When this student’s graphs from Questions 3, 4, and 5 were examined altogether, he could not be observed to have constructed his chemistry graphs correctly even though he was capable of drawing the correct type of graphs, placing the data on the graphs, and labeling the axes accurately.
This category also included students with weak or average scores who had difficulty in understanding topics in chemistry. Students’ graph drawing performance showed their success levels in chemistry class and their conceptual understanding levels. Four students from the sample group in this category were unsuccessful in chemistry and had decided to study Turkish or mathematics at the university. A study conducted by Selamet (2014) displayed that students’ high mathematics scores had a significant effect on reading and interpreting graphs. People with strong visual-spatial intelligence have the ability to display visual and spatial ideas as graphs; to comprehend, manipulate, and draw mental models to the tiniest detail spatially; to be able to relate objects in space; and to read tables and diagrams well. Visual-spatial intelligence is substantial for understanding mathematics (Silver, Strong, & Perini, 1997). Concordantly, students in this category can be stated to have strong spatial intelligence.

70
EDUCATIONAL SCIENCES: THEORY & PRACTICE
Table 12ExamplesofStudentResponsesfor4Gand4CinCategory 2Students’ responses for Question 4Cat2_S3: Horizontal axis: Time; Vertical axis: Decrease in the first glass (Graph 1), increase in the second glass (Graph 2).
Cat2_S3: No drawing
Cat2_S4: Horizontal axis: Time; Vertical axis: Increase in wa-ter level (first graph)/decrease in water level (second graph).
Cat2_S4: Horizontal axis: Time; Vertical axis: Concentration.
Cat2_S5: Horizontal axis: Time; Vertical axis: Height of water. Base area of the container is small, that of the upper area is big. Water level of the first container first rises rapidly, it drops slowly in the second container. Finally, their levels become equal.
Cat2_S5: Horizontal axis: Substances; Vertical axis: Number of particles. I observe that the bond between HF weakens. Electrons start to move freely. We can see that hydrogen bonds are built during interaction with water.
Students’ responses for Question 5Cat2_S2: Horizontal axis: Age; Vertical axis: Height. Cat2_S2: Horizontal axis: Atomic number; Ver-
tical axis: Ionization energy.
Cat2_S5: Horizontal axis: Age; Vertical axis: Height.
Cat2_S4: Horizontal axis: Age; Vertical axis: Height.Horizontal axis: Atomic number; Vertical axis: Ionization energy. Ionization energy decreases from bottom to top on the periodic table.

71
Gültepe / Reflections on High School Students’ Graphing Skills and Their Conceptual Understanding of Drawing Chemistry Graphs
Category 3As for the students who had unsuccessfully drawn graphs and who had lacked the
rules for drawing graphs, they might draw chemistry graphs correctly due to their chemically accurate understanding of the concepts.
Some students performed well on chemistry graphs yet could not successfully draw graphs for the first items of the questions. A slightly lower percentage of students fell into Category 3 for all questions except Question 2. When the students’ drawings for the first item of Question 2 were examined, almost all students were understood to have gone through some difficulties for the first item of the question. Most of the students in this category related solubility rate to the number of particles in the second item of the question and had drawn an accurate graph. However, 19.40% of the students defined the locations on the vertical axis with different values while determining the solubility amount of sugars over time. Very few students made correct interpretations about this phenomenon. Therefore, they could draw the chemistry graphs even without an adequate mastery of graphing skills. Examples of students’ drawings are given below (Table 13). Students that drew the graphs parabolically for the second item could be considered to comprehend the change of dissolution rate over time at a particular level.
In the first part of the question, the students’ graphs did not represent the statement. This might be the result of their inability to convey in the graph the knowledge that dissolution rate increase as contact surface increases yet solubility does not change, or their inadequacy in drawing graphs. For instance, Cat3_S1, Cat3_S2, Cat3_S3, and Cat3_S4 did not draw the graphs that indicated the change in the dissolution rate of each sugar with different contact surfaces over time, yet they drew graphs that compared the contact surfaces and dissolution rates. Cat3_S4 defined the horizontal axis as the dependent variable. Students managed to represent the relation between particle size and dissolution rate correctly yet they did not explain their reasons at a particular level. The graph Cat3_S5 drew for the first item of the question indicated that as temperature rose, the height of grass decreased parabolically. In fact, the statement “as the temperature rose it grew in longer periods” should have been displayed through a line graph and the growth of grass in summer time should have been represented through fewer slopes compared with spring time. Their inadequate mastery of graphing skills was a major stumbling block in drawing chemistry graphs. For the second item of the question, Cat3_S5 drew the accurate graph parabolically, drew the parabolic slopes correctly, and demonstrated the dissolution masses on equal points; these were indicators that the student comprehended the dissolution state at a particular level. That there were no students in Question 3 for this category, one student for Question 1, two students for Question 4, and nine students for Question 5 might indicate that they could not make sense of chemical concepts in the micro world or their skills were not adequate to draw proper graphs (i.e., Cat3_S4).

72
EDUCATIONAL SCIENCES: THEORY & PRACTICE
Cat3_S2 drew a linear graph for the second item of Question 2 which represents piecemeal knowledge (“as contact surface rose, dissolution rate increased”). This might be the result of the student’s inability to molecularly comprehend dissolution. Examples of the students’ graph drawings for Questions 1, 4, and 5 are given in Table 14. Yet when the graphs this student drew for the first part of the question, their interpretations for the second part of Question 4, and their inability to convey
Table 13ExamplesofStudentResponsesfor2Gand2C
2G 2CCat3_S1: Horizontal axis: Fre-quency of cutting; Vertical axis: Temperature.
Cat3_S1: Horizontal axis: Mass of sugar; Vertical axis: Rate of dissolution.
Cat3_S2: Horizontal axis: Tempera-ture; Vertical axis: Cutting time.
Cat3_S2: Horizontal axis: Surface area; Vertical axis: Dissolution rate. De-crease particle size increases surface area and increases dissolving. There-fore, water dissolves cube sugar the slowest.
Cat3_S3: No drawing. Cat3_S3: Horizontal axis: Surface area of sugar; Vertical axis: Dissolution rate. Sugar with less surface area dissolves slower and sugar with more surface area a faster reaction.
Cat3_S4: Horizontal axis: Months; Vertical axis: Height of grass.
Cat3_S4: Horizontal axis: Surface area of sugar; Vertical axis: Time. Sugar with a larger surface area dissolves faster.
Cat3_S5: Horizontal axis: Tem-perature; Vertical axis: Growth in the grass.
Cat3_5: Horizontal axis: Time; Vertical axis: Amount of sugar dissolved. The sugar cube dissolves slower in water because the surface area is small-er, unlike the granulated sugar that has a large surface area and dissolves much faster in water because collision is more likely to occur between sugar and water.

73
Gültepe / Reflections on High School Students’ Graphing Skills and Their Conceptual Understanding of Drawing Chemistry Graphs
interpretations in the graphs were examined altogether, Cat3_S2’s inadequacy at drawing graphs could be seen as an obstacle for correctly conveying their conceptual knowledge in the graphs. In the first part of Question 5, Cat3_S4 could not locate age data in the graph according to an increase on the horizontal axis; as for Cat3_S6, the student did not draw an age-height graph. These students were somehow able to locate an indication of the periodical change of ionization energies of atoms on the intersection points in the graph they had drawn for the first part. For the graph
Table 14ExamplesofStudentResponsesfor1Gand1C,4Gand4C,and5Gand5CinCategory 3
1G 1CCat3_S4: Horizontal axis: Time; Vertical axis: Price. The price increases in the first five years. It also increases again. The increase will be slower.
Cat3_S4: Horizontal axis: Time; Vertical axis: CO2.
4G 4CCat3_S1: Horizontal axis: Number of installments; Vertical axis: Amount of installment.
Cat1_S1: Horizontal axis: Time; Vertical axis: Concentra-tion. HF is a weak acid so only partially dissociates. At equilibrium, both HF and F- are present in solution.
Cat3_S2: Horizontal axis: Time; Vertical axis: in-crease (Graph 1), descent (Graph 2).
Cat3_S2: As the particule number of HF decreases, the total number of particles increase. Because HF is a weak acid and cannot fully ionize in water, there are HF, H+, F-. No graph drawing.
5G 5CCat3_S4: Horizontal axis: Age; Vertical axis: Height. Cat3_S4: Horizontal axis: Atomic number; Vertical axis:
Ionization energy.
Cat3_S6: The number of energy levels increases as you move down a group just as the number of electrons increases. Each subsequent energy level is further from the nucleus than the last. Therefore, the atomic radius increases as the group and energy levels increase.
74
EDUCATIONAL SCIENCES: THEORY & PRACTICE
drawn in the second part, Cat3_S4 correctly conveyed their chemical knowledge (“moving across a period on the periodic table, ionization energy increases”) as did Cat3_S6 (“moving down a group, ionization energy decreases”). Cat3_S4’s graphs for Question 1 could be similarly interpreted. In general, the students with low graph-drawing skills performance were identified as having difficulties with graphing questions such as misplaced variables and data, the inability to determine the type of graph (i.e., concave, convex, linear, curved), and variables. Potentially successful learners in Category 3 may need to be taught and practice more about drawing and interpreting graphs so as to strengthen their visual/spatial intelligence.
Category 4Some results about the low performance of students in drawing both types of graphs
and comprehending the chemical phenomenon are worrisome because the percentage of students in Category 4 was higher than expected. It was evident that students in this category lacked the relevant knowledge for attributing correct reasons to the chemical phenomenon; however, they also lacked the rules for drawing graphs, had misconceptions about chemical concepts, or had no conceptual understanding at all.
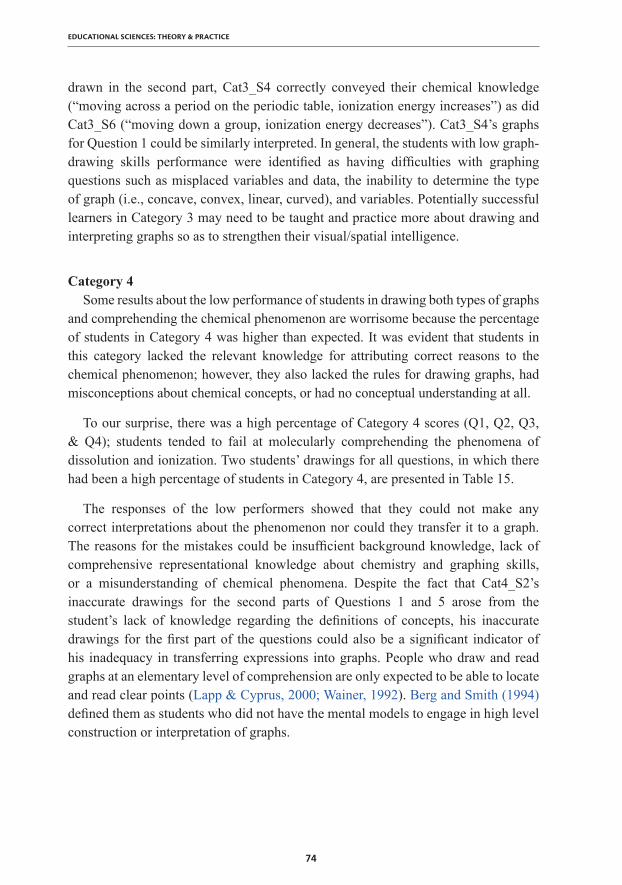
To our surprise, there was a high percentage of Category 4 scores (Q1, Q2, Q3, & Q4); students tended to fail at molecularly comprehending the phenomena of dissolution and ionization. Two students’ drawings for all questions, in which there had been a high percentage of students in Category 4, are presented in Table 15.
The responses of the low performers showed that they could not make any correct interpretations about the phenomenon nor could they transfer it to a graph. The reasons for the mistakes could be insufficient background knowledge, lack of comprehensive representational knowledge about chemistry and graphing skills, or a misunderstanding of chemical phenomena. Despite the fact that Cat4_S2’s inaccurate drawings for the second parts of Questions 1 and 5 arose from the student’s lack of knowledge regarding the definitions of concepts, his inaccurate drawings for the first part of the questions could also be a significant indicator of his inadequacy in transferring expressions into graphs. People who draw and read graphs at an elementary level of comprehension are only expected to be able to locate and read clear points (Lapp & Cyprus, 2000; Wainer, 1992). Berg and Smith (1994) defined them as students who did not have the mental models to engage in high level construction or interpretation of graphs.

75
Gültepe / Reflections on High School Students’ Graphing Skills and Their Conceptual Understanding of Drawing Chemistry Graphs
Table 15Examples of Student Responses for Questions 1-5 in Category 4
1G 1CCat4_S1: Horizontal axis: Time; Vertical axis: Price.
Cat4_S1:No answer
Cat4_S2: Horizontal axis:Time; Vertical axis: Price. The slope’s angle decreases.
Cat4_S2: Horizontal axis: Temperature; Vertical axis: Volume. When car-bon is burned, gas is produced. Density of the solid is more than that of gas. Masses of the solid and gas are equal; accordingly, the volume increases.
2G 2CCat4_S1: Horizontal axis: Time; Vertical axis: Grass.
Cat4_S1: Granulated sugar < Cube sugar < Powdered sugar.
Cat4_S2: Horizontal axis: Months; Vertical axis: Time.
Cat4_S2: Horizontal axis: Time; Vertical axis: Dissolving sugar.
3G 3CCat4_S1: No drawing Cat4_S1: No drawingCat4_S2: Horizontal axis: Time; Vertical axis: Installment.
Cat4_S2: Freezing point changes regularly.No drawing
4G 4CCat4_S1: Horizontal axis; Time; Vertical axis: Height.
Cat4_S1:
Cat4_S2: Horizontal axis: Time; Vertical axis: Level of water.
Cat4_S2: Horizontal axis: Time; Vertical axis: Number of ions.
76
EDUCATIONAL SCIENCES: THEORY & PRACTICE
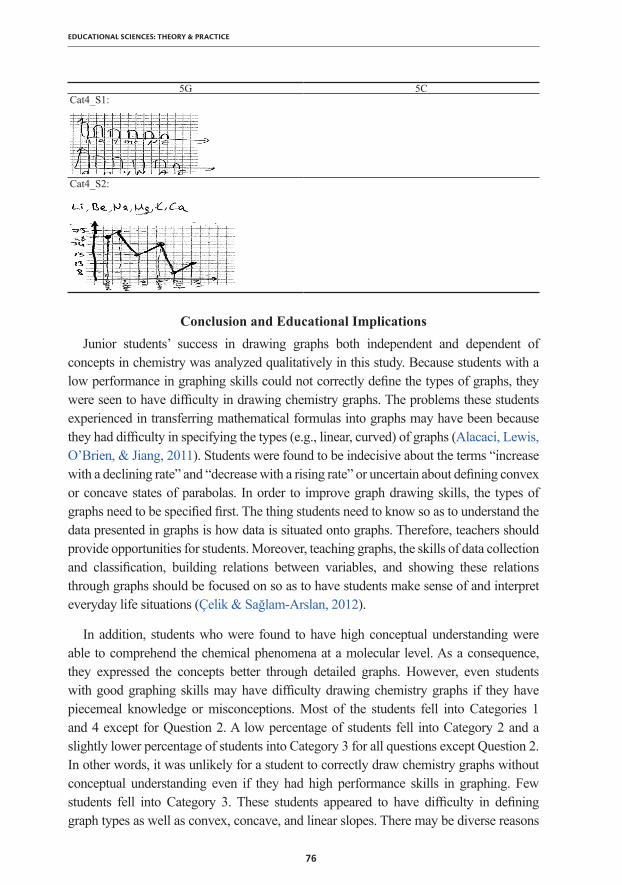
Conclusion and Educational ImplicationsJunior students’ success in drawing graphs both independent and dependent of
concepts in chemistry was analyzed qualitatively in this study. Because students with a low performance in graphing skills could not correctly define the types of graphs, they were seen to have difficulty in drawing chemistry graphs. The problems these students experienced in transferring mathematical formulas into graphs may have been because they had difficulty in specifying the types (e.g., linear, curved) of graphs (Alacaci, Lewis, O’Brien, & Jiang, 2011). Students were found to be indecisive about the terms “increase with a declining rate” and “decrease with a rising rate” or uncertain about defining convex or concave states of parabolas. In order to improve graph drawing skills, the types of graphs need to be specified first. The thing students need to know so as to understand the data presented in graphs is how data is situated onto graphs. Therefore, teachers should provide opportunities for students. Moreover, teaching graphs, the skills of data collection and classification, building relations between variables, and showing these relations through graphs should be focused on so as to have students make sense of and interpret everyday life situations (Çelik & Sağlam-Arslan, 2012).
In addition, students who were found to have high conceptual understanding were able to comprehend the chemical phenomena at a molecular level. As a consequence, they expressed the concepts better through detailed graphs. However, even students with good graphing skills may have difficulty drawing chemistry graphs if they have piecemeal knowledge or misconceptions. Most of the students fell into Categories 1 and 4 except for Question 2. A low percentage of students fell into Category 2 and a slightly lower percentage of students into Category 3 for all questions except Question 2. In other words, it was unlikely for a student to correctly draw chemistry graphs without conceptual understanding even if they had high performance skills in graphing. Few students fell into Category 3. These students appeared to have difficulty in defining graph types as well as convex, concave, and linear slopes. There may be diverse reasons
5G 5CCat4_S1:
Cat4_S2:

77
Gültepe / Reflections on High School Students’ Graphing Skills and Their Conceptual Understanding of Drawing Chemistry Graphs
for this such as an inability to distinguish continuous or discrete data, incompetence in mathematically defining equalities through certain graphs, or incompetency in correctly defining variables or locating axes. Students like this could not correctly draw chemistry graphs even if they had high conceptual understanding about the related non-chemistry graph. To illustrate, the concept of rate concept was prominent in Questions 1, 2, and 4 where they were expected to draw graphs with curved lines and where the vertical axes represented a change in quantity. A student was successful when the task required nothing more than applying a rule, yet they failed when the task required integrating process skills such as graphing, comprehending the chemical events in a micro world, or reasoning. For instance, students had problems with transferring their knowledge onto the graphs in Questions 2 and 5 even if they knew that “as the contact surface of a substance increases, the dissolution rate increases as well” or “ionization energy rises from left to right and top to bottom in the periodic table.” It can also be deduced that graph and scientific literacy skills affect students’ interpretations of graphs. Students with higher scores for the first items of the test questions were more likely to provide detailed definition to their graphs; also, students who were more likely to come up with explanations in the second items of the test questions were more likely to provide detailed responses.
It is my view that graphing skills and conceptual understanding should influence each other and that effective instruction should address both. In other words, apart from conceptual thinking, the drawing and interpretation of graphs make essential contributions to understanding chemistry. Therefore, if students are taught to draw and interpret graphs before the concepts, their achievement in chemistry will deepen. Representing concepts and relations between concepts through graphs ensures more success and meaningful learning in science. Additionally, mastery in the skill of graphing is obtained over time; simultaneous learning is not restricted to a certain phase in the course of learning. Studies have suggested that one of the best approaches for students to acquire the underlying scientific concepts and skills is to attain more complicated ways of understanding and practicing graphing skills (interpretation and drawing) over many years at increasingly higher mastery levels (Michaels, Shouse, Schweingruber, & National Research Council, 2007). Graph interpretation should be emphasized and allocated more instructional and laboratory time, especially in science classes such as physics, biology, and chemistry, as well as in assessment and evaluation activities at high schools. We can discourage students from merely memorizing formulas, thereby improving their graph interpretation skills. In this way, their success can be enhanced in classes where mostly numbers are used and interpreted. A data array could be presented to students or they could be required to define variables and make interpretations on the general features of a graph that represent the relation between items or to discover developments on an analytical plane. It should not be overlooked that while carrying out such applications, graphs should be presented on the basis of and selected from everyday life situations so that students’ graphing skills can improve more easily (Dugdale, 1993).

78
EDUCATIONAL SCIENCES: THEORY & PRACTICE
Teachers definitely do not have the chance to teach students with different needs through different methods, but they should show students how to understand a topic that they cannot understand using their strongest type of intelligence. In other words, teachers should provide opportunities for students to use their strengths and natural phases rather than waiting for objects that relate to their weak phases (Campbell, 1997). Attainment or improvement of graphing skills and the skills of interpreting and drawing graphs related to the relationship between concepts are only possible through constructivist teaching methods in which learning opportunities are created through different intelligence areas as opposed to traditional approaches. The studies, observations, and interviews that have been conducted show that when learning opportunities are connected with different intelligence areas then students’ academic success can increase, then they can become aware of their own learning strategies and gain self-confidence (Blythe & Gardner, 1990). In order to teach effective and meaningful concepts along with skill attainment in science education, one must apply practices where relations between concepts are built forward and backward alongside the verbal presentation of concepts; organize activities towards cause and effect relations; use concept maps, diagrams and graphs; and apply practices such as estimating and comparing diagrams or graphs whether relevant or irrelevant to scientific concepts. The reflections of students’ conceptual understanding and graphing skills on graphed chemistry problems including graphs were examined over graphs formed by ordinal and nominal data. Since the researcher had taught the classes within the research for two years, the findings were related to the teaching methods he had applied. Students were distributed into Category 2, Category 3, and predominantly into Category 4. The first reason for this may be insufficient practices towards mentally expanding their understanding of diagrams and concepts, even if class discussions and methods such as question-answer had provided students with an environment where they could be active. The second reason for this might be not creating a learning environment after defining students’ intelligence types and styles of learning and understanding styles. In this respect, activities such as concept maps; mental diagrams; problem solving; modeling, defining, interpreting and formulating experiment-ready data; and transferring these into graphs and tables may create efficient learning environments that appealing to different learning styles and intelligence types. In such environments, reflecting on the success of their graphing skills and conceptual understanding in chemistry problems including graphs can be investigated in different grades and in terms of gender. Further studies showing histogram graphs can be conducted about the relation between reaction rates, gas evolution reactions, and variables such as temperature. Researches may also be comprised of studies on different topics in 9th grade, vocational high schools, or other high schools for students taking mainly Turkish and mathematics classes, in different grades such as middle schools or high schools, or with students studying in chemistry education or chemical engineering departments at universities.

79
Gültepe / Reflections on High School Students’ Graphing Skills and Their Conceptual Understanding of Drawing Chemistry Graphs
ReferencesAdams, D. D., & Shrum, J. W. (1990). The effects of microcomputer-based laboratory
exercises on the acquisition of line graph construction and interpretation skills by high school biology students. Journal of Research in Science Teaching, 27(8), 777–787.
Alacaci, C., Lewis, S., O’Brien, G. E., & Jiang, Z. (2011). Pre-service elementary teachers’ understandings of graphs. Eurasia Journal of Mathematics, Science & Technology Education, 7(1), 3–14.
Berg, C. A., & Smith, P. (1994). Assessing students’ abilities to construct and interpret line graphs: Disparities between multiple-choice and free-response instruments. Science Education, 7, 527–554.
Blythe, T., & Gardner, H. (1990). A school for all intelligences. Educational Leadership, 47(7), 33–37.
Bou Hamdan, D. K. (2010). An inquiry-based modeling approach to developing graphing skills in seventh grade biology (Master’s thesis, Lebanese American University). Retrieved from https://ecommons.lau.edu.lb:8443/xmlui/bitstream/handle/10725/137/Diana_Bou_Hamdan_Thesis.pdf?sequence=1
Bowen, G. M., & Roth, W.-M. (1998). Lecturing graphing: What features of lectures contribute to student difficulties in learning to interpret graphs? Research in Science Education, 28, 77–90.
Bowen, G. M., & Roth, W.-M. (2005). Data and graph interpretation among pre-service science teachers. Journal of Research in Science Teaching, 42(10), 1063–1088.
Campbell, L. (1997). How teachers interpret MI Theory. Educational Leadership, 55(1), 14–19.Çelik, D., & Sağlam-Arslan, A. (2012). Öğretmen adaylarının çoklu gösterimleri kullanma
becerilerinin analizi [Analysis of teacher candidates’ translating skills in multiple representations]. İlköğretim Online/Elementary Education Online, 11(1), 239–250.
Dori, J. Y., & Hameiri, M. (2003). Multidimensional analysis system for quantitative chemistry problems: Symbol, macro, micro, and process aspects. Journal of Research in Science Teaching, 40(3), 278–302.
Dugdale, S. (1993). Functions and graphs: Perspectives on students’ thinking. In T. A. Romberg, E. Fennema, & T. P. Carpenter (Eds.), Integrating research on the graphical representation of functions (pp. 101–130). Hillsdale, NJ: Erlbaum.
Ergül, N. R. (1999). Fen bilgisi öğretim programının değerlendirilmesi [Evaluation of the science curriculum]. UludağÜniversitesiEğitimFakültesiDergisi, 7(1), 231–238.
Fuini, L., & Gray, R. A. (2000). Using debriefing activities to meet the needs of multiple-intelligence learners. Book Report, 19(2), 44–47.
Glazer, N. (2011). Challenges with graph interpretation: A review of the literature. Studies in Science Education, 47(2), 183–210.
Güzel, H. (2004). Genel fizik ve matematik derslerindeki başarı ile matematiğe karşı olan tutum arasındaki ilişki [The relationship of achievement in physics and mathematics withattitudes toward mathematics]. TürkFenEğitimiDergisi,1(1), 49–58.
Hadjidemetriou, C., & Williams, J. S. (2002). Children’s graphical conceptions. Research in Mathematics Education, 4, 69–87.
İnan, H. Z., İnan, T., & Aydemir, T. (2014). Okul öncesi dönem çocuklarına bilimsel süreç becerilerinin kazandırılması [Teaching the scientific process skills to preschool children]. In M. Metin (Ed.), Okul öncesi dönemde fen ve teknoloji eğitimi [Pre-school science and technology education] (Vol. 4, pp. 75–95). Ankara, Turkey: PegemA.

80
EDUCATIONAL SCIENCES: THEORY & PRACTICE
Kelly, D., Jasperse, J., & Westbrooke, I. (2005). Designing science graphs for data analysis and presentation: The bad, the good, and the better (Department of Conservation Technical Series 32). Wellington, New Zealand: Department of Conservation.
Lapp, D. A., & Cyrus, V. F. (2000). Using data-collection devices to enhance students’ understanding. Mathematics Teacher, 93(6), 504–510.
Lehrer, R., & Schauble, L. (2007). Contrasting emerging conceptions of distribution in contexts of error and natural variation. In M. C. Lovett & P. Shah (Eds.), Thinking with data (pp. 149–76). New York, NY: Taylor & Francis.
Leinhardt, G., Zaslavsky, O., & Stein, M. K. (1990). Functions, graphs, and graphing: Tasks, learning, and teaching. Review of Educational Research, 60(1), 1–64.
Michaels, S., Shouse, A. W., Schweingruber, H. A., & National Research Council. (2007). Ready,set,SCIENCE!PuttingresearchtoworkinK–8scienceclassrooms. Washington, DC: National Academies Press.
Padilla, M. J., McKenzie, D. L., & Show, E. L., Jr. (1986). An examination of the line graphing ability of students in grades seven through twelve. School Science and Mathematics, 86, 20–26.
Roth, W.-M., & Bowen, G. M. (2003). When are graphs worth ten thousand words? An expert study. Cognition and Instruction, 21(4), 429–473.
Roth, W.-M., Bowen, G. M., & McGinn, M. K. (1999). Differences in graph-related practices between high school biology textbooks and scientific ecology journals. Journal of Research in Science Teaching, 36, 977–1019.
Schwartz, D. L., Sears, D., & Chang, J. (2007). Reconsidering prior knowledge. In M. C. Lovett & P. Shah (Eds.), Thinking with data: 33rd Carnegie symposium on cognition (pp. 319–344). Mahwah, NJ: Erlbaum.
Seçken, N., & Yörük, N. Z. (2012). An analysis of relations between concerns about the use of graphs in chemistry classes and multiple intelligences in terms of different variables. International Journal of New Trends in Arts, Sports & Science Education, 1(2), 142–156.
Selamet, C. S. (2014). Beşincisınıföğrencilerinintablovegrafikokumaveyorumlamabaşarıdüzeylerinin incelenmesi [The examination of reading and interpretation achievement levels of fifth grade students about frequency tables and graphs] (Master’s thesis, Kocatepe University, Kocaeli, Turkey). Retrieved from https://tez.yok.gov.tr/UlusalTezMerkezi/
Shah, P., & Hoeffner, J. (2002). Review of graph comprehension research: Implications for instruction.EducationalPsychologyReview, 14, 47–69.
Silver, H., Strong, R., & Perini, M. (1997). Integrating learning styles and multiple intelligences. EducationalLeadership. September, 22–27.
Testa, I., Monroy, G., & Sassi, E. (2002). Students’ reading images in kinematics: The case of real-time graphs. International Journal of Science Education, 24, 235–256.
Wainer, H. (1992). Understanding graphs and tables.EducationalResearcher,21(1), 14–23.Yıldırım, A., & Şimşek, H. (2005). Sosyalbilimlerdenitelaraştırmayöntemleri [Qualitative
analysis in social sciences] (5th ed.). Ankara, Turkey: Seçkin Yayıncılık.

81
Gültepe / Reflections on High School Students’ Graphing Skills and Their Conceptual Understanding of Drawing Chemistry Graphs
Appendix A: Test ItemsAssess the expressions below that are independent from each other and draw separate graphs regarding these conditions. Label the axes clearly with the variables you determine. Write down your interpretations and as-sumptions for the second item.1G. Prices are rising slower than the last five years.1C. An amount of solid carbon is burned.Assess the expressions below that are independent from each other and draw the separate graphs regarding these conditions. Label the axes clearly with the variables you determine. Write down your interpretations and assumptions for the second item.2G. Grass grows faster in spring and must be cut every week. But when the weather is dry and hot, they can be cut less frequently.2C. Ayşe puts the same amount of cube sugar, granulated sugar, and powdered sugar into water with the same volume and temperature to dissolve them. She observes the changes in sugar masses that dissolve over time.Assess the following expression and draw the graph regarding the condition. Label the axes clearly with the variables you determine.3G. A product is worth 300TL. Ayşe pays it in installments of 60TL; Ali of 100TL; and Mehmet of 150 TL. Draw a suitable graph reflecting the conditions above according to the specific variables given.3C. The graph below shows the freezing depression of water containing a solid (NaCl). Hereunder, how would the change in the freezing temperature of water in the solution be formed with the dissolution of C6H12O6 and AlCl3 salts? Amount of dissolved substance (mole/L water)
Freezing point (0C) NaCl4G. Selim sets up the mechanism on the right side filling one of the plastic glasses with water and connecting it with the empty one with the help of a straw. In this activity, Selim observes the changes in water level in the glasses and draws a data graph. What does the data graph that Selim draws look like?4C. The graph below is about the concentration of particles in the 0.1 M hydrofluoric acid (HF) solution before and after the ionization of hydrofluoric acid and the bar graph that is colored black represents hydrofluoric acid con-centration (HF), The polka dot one represents hydrogen ion (H+) concentration, the rectilinear one represents fluo-ride ion (F-) concentration in the graph. Imagine you could see individual particles and the dissolution of this acid in water sub-microscopically. Draw the solution containing these particles. Convert the bar graph into a line graph.
5G. Draw a graph of the family members’ age-height.
Azime Hakkı Ali Yeşim Elif Nil 58 75 15 34 8 135C. Suppose that the graph you drew above were ionization energy –an atomic number graph belonging to the main groups of elements. How would you locate the main groups of elements you determined in the places you specified in graph 5G using the periodic table given below so as to form a periodical change regarding ionization energy?