Reflection Phase Shift of Metal - Hong Kong University of ...
22
Experimental Problem– E2 Reflection Phase Shift of Metal Wing Yim Tam (譚永炎)
Transcript of Reflection Phase Shift of Metal - Hong Kong University of ...

Experimental Problem– E2
Reflection Phase Shift of Metal
Wing Yim Tam (譚永炎)
• Introduction • Theory • Supporting Experiment • Experimental Setup • Results • Acknowledgements
E2: Reflection Phase Shift of Metal

• Natural materials have refractive indexes (n) larger than that of vacuum, i.e. n > 1
• Maxwell’s Equations do not exclude n to be other values, e.g. negative or zero
• Meta-materials, fabricated in the nano-scales, can have exotic refractive indexes, e. g. negative or complex values
• Phenomena such as negative refraction or
cloaking (invisibility) are possible
Introduction

Negative Refraction
(a) Positive vs. negative refraction. Photo taken from T. Tac and X. Zhang, Nature 480, 42-43, (2011). (b-d) Taken from “Photorealistic images of objects in effective negative-index materials”, Optics Express 14,
1842-1849 (2006). (e) Taken from “Visible-frequency hyperbolic meta-surface”, Nature 522, 192-196 (2015).
(a)
(b) (c) (d)
rod in air rod in water n=1.3
rod in NR water n = -1.3
(e)

• Measuring the refractive indexes of meta-materials is important for possible applications of the materials(1)
• Metals have complex refractive indexes due to absorptions
𝑛𝑛� = 𝑛𝑛 + 𝑖𝑖𝑖𝑖
• Measurement of reflection phase shift (φ) can give information of the
refractive index, i.e. at normal incidence(2) 𝜙𝜙 = arctan ( 2𝑘𝑘
1−(𝑛𝑛2+𝑘𝑘2))
• For glass, reflection phase shift φ is 180o (or π radians) at normal incidence
• For metals, the reflection phase shift can take different values, depending
on the absorptions
Introduction
References: 1) V. M. Shalaev, “PHYSICS: Transforming Light”, Science 322 (5900): 384–386 (2008). 2) A. Dubois, “Effects of phase change on reflection in phase-measuring interference microscopy”, App. Opt.
43, 1503-1507 (2004).

• Phase measurement in the optical wavelengths is challenging
• Needs high precision e. g. a 10% measurement requires accurate optical
path of 0.1 x wavelength ~ 65 nm for visible light! • Interference is a good method e.g. Fabry-Perot laser interferometry
Introduction

Theory Consider an ideal air-gap Fabry-Perot etalon as shown in the figure below:
Path difference of beams 1 and 2 for reflection interference = AB+BC-AE = L/cos(θ) + L/cos(θ) –ACsin(θ) = 2L/cos(θ) – 2Ltan(θ)sin(θ) = 2L[1-sin2(θ)]/cos(θ) = 2Lcos(θ) (Distances from E and C to the detector are assumed to be the same.)
For a two-beam approximation, the reflection interference intensity I(θ) can be written as below:
1 2 1 22 cos(2 cos ), 2 /sI I I I I kL kθ φ π λ= + + + =
2 cos 2 π 2 cos2
m sm skL mm L θ φ
λ πθ φ+ = ⇒ = +
For constructive interference (corresponding to reflection peak intensity):
φs
I1 I2 Incident
wavelength λ

Theory
• Choose the integer part of 2𝐿𝐿cos𝜃𝜃𝑚𝑚𝜆𝜆
(Trunc(2𝐿𝐿cos𝜃𝜃𝑚𝑚𝜆𝜆
)) as the interference order m
• Thus a plot of
m vs. 1/λ for fixed incident angle or m vs. cosθm for fixed wavelength will give a straight line. The slope of the line will give the air-gap spacing L, and the y-intercept will give the average phase φs/2π. • The normalized reflection phase 𝜙𝜙𝑠𝑠 = φs/2π is thus defined within (-1, 0)
2 cos 2 π 2 cos2
m sm skL mm L θ φ
λ πθ φ+ = ⇒ = +

Supporting Experiment
Schematic of Titanium- (Ti ~ 200 nm thick) coated air-gap etalon. Normal incidence (θ = 0o) and measure reflectance for wavelengths between 450 to 850 nm.
L
0 1 2
θ phase φs
substrate (glass)
top glass
Ti
0.05
0.10
0.15
0.20
16 µm 34 µm 55 µm
Refle
ctan
ce
1.2 1.4 1.6 1.8 2.00.3
0.4
0.5
0.6
1/λ (1/µm)
Refle
ctan
ce
18 µm 36 µm 57 µm
(b) Ti
(a) glass

Supporting Experiment
1.2 1.4 1.6 1.8 2.0
-0.50
-0.45
-0.40
φ fit (L
=0)
1/λ (1/µm)
glass Ti glass Johnson & Christy
This technique is now published(1) and has been applied to the measurement of 1D Berry phase (Z-phase) in photonic crystals(2). 1) “Measurement of reflection phase using thick-gap Fabry–Perot etalon,” T. K. Yung,. W. Gao, H. M. Leung, Q. Zhao, X. Wang, and W. Y. Tam, App. Opt. 55, 7301-7306 (2016). 2) “Determination of Zak phase by reflection phase in 1D photonic crystals”, Wensheng Gao, Ming Xiao, C. T. Chan and Wing Yim Tam*, Optics Letters 40, 5259-5262 (2015).
1.2 1.4 1.6 1.8 2.080
100
120
140
Peak
/Tro
ugh
orde
r
1/λ (1/µm)
Peak Trough Linear fit
Lfit = 36.293 +/- 0.001<φfit> = -0.307 +/- 0.002
80
100
120
140
Peak Trough Linear fit
Lfit = 33.804 +/- 0.001<φfit> = -0.347 +/- 0.002Pe
ak/T
roug
h or
der
glass
Ti
After corrections for numerical aperture effects

Experimental Setup • It would be difficult to require students to
achieve the same precision as in our experiment using the simple setup for this reflection phase shift experiment
• Here we fix the wavelength and vary the incident angle
• Due to the difficulties in this experiment, e. g. mis-alignment, non-uniform air-gap, non-parallelism of the top and bottom plates, we only look for qualitative results
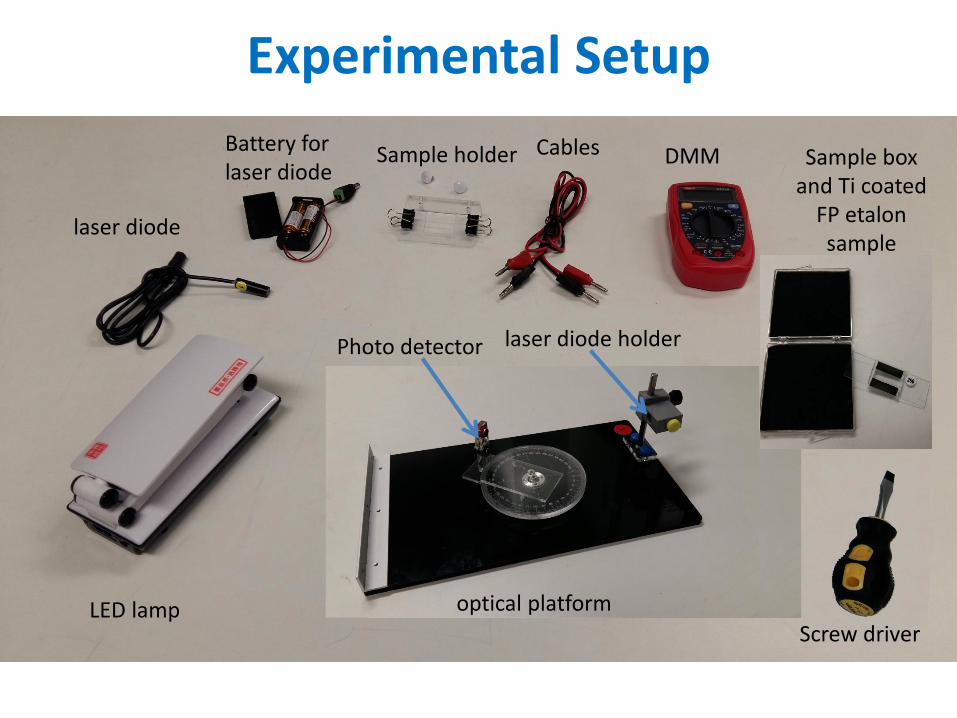
Experimental Setup
LED lamp
laser diode
Battery for laser diode
Sample holder Cables DMM Sample box and Ti coated
FP etalon sample
Screw driver optical platform
Photo detector laser diode holder
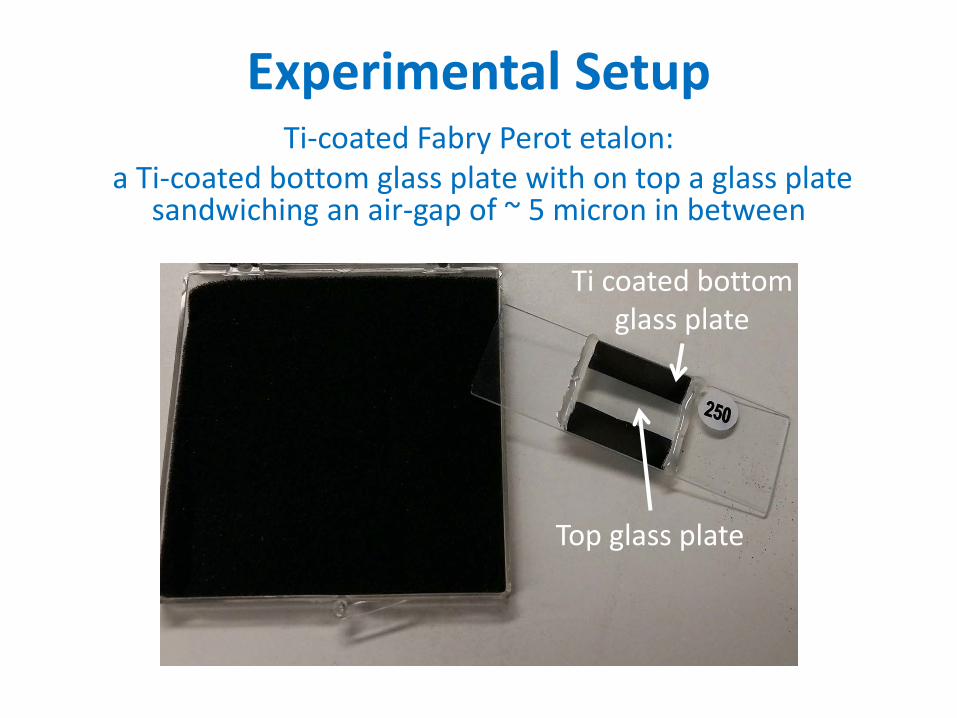
Experimental Setup Ti-coated Fabry Perot etalon:
a Ti-coated bottom glass plate with on top a glass plate sandwiching an air-gap of ~ 5 micron in between
Top glass plate
Ti coated bottom glass plate

Experimental Setup Sample
mounted on the sample
holder
Ti-coated etalon
Laser beam
Photo-detector
Sample number
Sample mounted on the sample
holder
Ti-coated etalon
Laser beam
Photo-detector
Sample number
Angular scale
Rotary disk
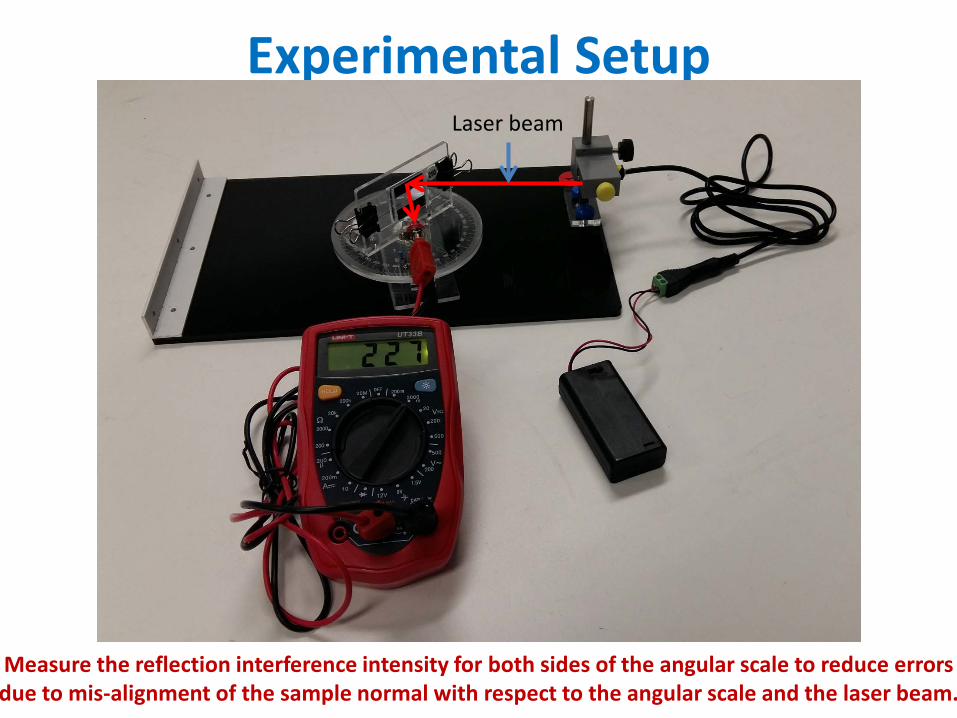
Experimental Setup Laser beam
Measure the reflection interference intensity for both sides of the angular scale to reduce errors due to mis-alignment of the sample normal with respect to the angular scale and the laser beam.

Experimental Result Ti etalon #5
Figure E2_1
Figure E2_2

Experimental Result Ti etalon #5
Figure E2_1
Figure E2_2

Experimental Result Ti etalon #5
Peak # LHS θLHS
(degree) Peak # RHS θRHS
(degree) Θaverage
(degree) cos θaverage
Interference Order
m
7 19.5 8 17.25 18.5 0.948 14 6 29 7 26.75 28 0.883 13 5 36.25 6 34 35.38 0.815 12 4 42 5 40 41.25 0.752 11 3 47.75 4 45.5 46.88 0.684 10 2 52.75 3 50.25 51.63 0.621 9 1 57.5 2 55 56.5 0.552 8 1 59.25

Experimental Result Ti etalon #5
Air-gap spacing L = 0.65x15.17/2 = 4.93 +/- 0.06 µm Normalized reflection phase 𝜙𝜙𝑠𝑠 = -0.39 +/- 0.05
Error of reflection phase due to α = 1o mis-alignment = 2L sinθ sinα/λ ~ 0.13
Peak # LHS Peak # RHS cos θaverage
Interference Order
m
7 8 0.948 14 6 7 0.883 13 5 6 0.815 12 4 5 0.752 11 3 4 0.684 10 2 3 0.621 9 1 2 0.552 8 1
Experimental Result
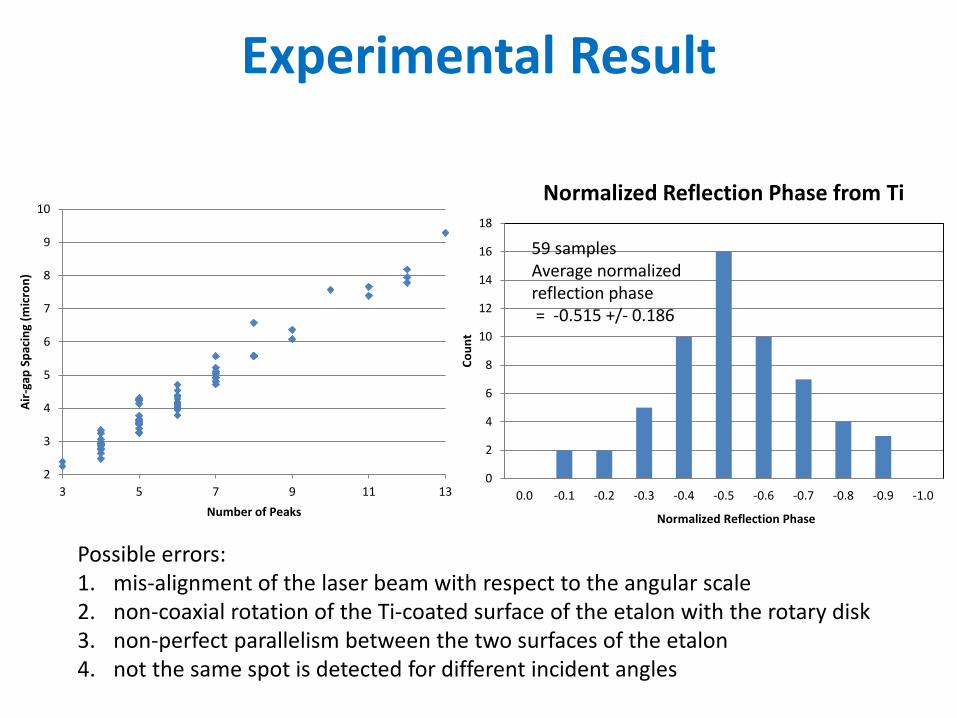
Possible errors: 1. mis-alignment of the laser beam with respect to the angular scale 2. non-coaxial rotation of the Ti-coated surface of the etalon with the rotary disk 3. non-perfect parallelism between the two surfaces of the etalon 4. not the same spot is detected for different incident angles
0
2
4
6
8
10
12
14
16
18
0.0 -0.1 -0.2 -0.3 -0.4 -0.5 -0.6 -0.7 -0.8 -0.9 -1.0
Coun
t
Normalized Reflection Phase
Normalized Reflection Phase from Ti
59 samples Average normalized reflection phase = -0.515 +/- 0.186
2
3
4
5
6
7
8
9
10
3 5 7 9 11 13
Air-
gap
Spac
ing
(mic
ron)
Number of Peaks

Acknowledgements • All experimental technical staffs
– Mr. LEUNG Ka Lun – Dr. FUNG Ho Ting (Tony) – Dr. SU Yumian – Mr. TAM Chi Ming (Eric) – Mr. HO C. M (Walter) – Dr. GAO Wensheng (Vincent) (sample fabrication for E2)
• Electrical and Mechanical Fabrication Unit of HKUST – Mr. CHEUNG S. K. (Kelvin) – Mr. WONG C. C. (William)
• All APhO 2016 academic Committee (PHYSICS, HKUST) Profs: S. DU, Y. HAN, G. B. JO, K. T. LAW, I. K. SOU, Y. WANG,
Michael WONG, and also Dr. S. K. CHEUNG (Secretary)

Thanks