ReferW: 1t-L.t--t • ( ~~ n D v ' .I dJ''
173
rJ 5 L f a.:;::u . of Cal/fomla Environmental Restoration Project. MS M992 Los Alamos, New Mexico 87545 505-667 -0808/FAX 505-665-47 47 Mr. Benito Garcia NMED-HRMB P.O. Box 26110 . Santa Fe, NM 87502 rtment of Energy Los Area Office, MS A316 Environmental Restoration Program Los Alamos, New Mexico 87544 505-667 -7203/FAX 505-665-4504 Date: September 30, 1997 ReferW: 1t-L.t- -t • (_ n D v v "' . ,, , .I • . . - dJ'' p_;J. " r . SUBJECT: SUBMITTAL OF RFI REPORTs FOR PRSs IN TAs 0, 1, 3, 10, 1 , 15, 16, 19, 33, 36, AND 73 Dear Mr. Garcia: Enclosed are two copies of each of the Los Alamos National Laboratory's Resource Conservation and Recovery Act Facility Investigation Reports for Potential Release Sites in Technical Areas 0, 1, 3, 10, 11, 13, 15, 16, 19, 33, 36, and 73. One copy of each report is for your information and the second copy of each should go to your technical branch. The list of reports submitted is itemized on the following page. If you have any questions, please contact Dave Mcinroy at (505) 667-0819 or Joe Mose at (505) 667-5808. · · cer; Manager LANUE Project . . JJITT/ss Sincerely, ,_-,- \ r -r- \ '-> Theodore J. Taylor, Program Manager · DOE/LAAO Enclosures ( 1) RFI Reports for PRSs in T As 0, 1, 3, 1 0, 11 , 13, 15, 16, 19, 33, 36, and 73 (2) Certifications An Equal Opportunity Employer/Operated by the Unlver //IIIII IIIII IIIII IIIII II/IIIII 3449
Transcript of ReferW: 1t-L.t--t • ( ~~ n D v ' .I dJ''

rJ
5 L
f
~~ a.:;::u . ~~~lverslty of Cal/fomla
Environmental Restoration Project. MS M992 Los Alamos, New Mexico 87545 505-667 -0808/FAX 505-665-47 47
Mr. Benito Garcia NMED-HRMB P.O. Box 26110 . Santa Fe, NM 87502
rtment of Energy Los .~. nos Area Office, MS A316 Environmental Restoration Program Los Alamos, New Mexico 87544 505-667 -7203/FAX 505-665-4504
Date: September 30, 1997
ReferW: ~~~J~~~~t~ 1t-L.t--t • (_ ~~ n D v v "'
. ,, , .I I~- • h-.\~~-! . . -
~~ ~:~:J~~ dJ'' ~~ p_;J. ~ " ·~ ft.J:, -~_ r ~?~~~7
. ~ SUBJECT: SUBMITTAL OF RFI REPORTs FOR PRSs IN TAs 0, 1, 3, 10,
1 , ~.3, 15, 16, 19, 33, 36, AND 73
Dear Mr. Garcia:
Enclosed are two copies of each of the Los Alamos National Laboratory's
Resource Conservation and Recovery Act Facility Investigation Reports for Potential
Release Sites in Technical Areas 0, 1, 3, 10, 11, 13, 15, 16, 19, 33, 36, and 73. One
copy of each report is for your information and the second copy of each should go to
your technical branch. The list of reports submitted is itemized on the following page.
If you have any questions, please contact Dave Mcinroy at (505) 667-0819 or
Joe Mose at (505) 667-5808.
· · cer;
~ r:\a~~m Manager LANUE Project
. .
JJITT/ss
Sincerely,
,_-,- \ r -r-\ '-> ~L__~
Theodore J. Taylor, Program Manager · DOE/LAAO
Enclosures ( 1) RFI Reports for PRSs in T As 0, 1, 3, 1 0, 11 , 13, 15, 16, 19, 33, 36, and 73
(2) Certifications
An Equal Opportunity Employer/Operated by the Unlver
//IIIII IIIII IIIII IIIII II/IIIII 3449

, d Mr. Benito Garcia -2- September 30, 1997 EM/ER:97 -395
_ Reports
-r:" ~~ /" RFI RPTTAO: PR~2)
v v NFA RPT TAs 0, 73: PRS 0-034(a,b), 73-001(b), 73-004(c,d) . / ·
RFI RPTTA 1: PRS 1-001(s,u), 1-007(1) r I
RFI RPT TA 3: PRS 3-004(c,d),3-007, 3-014(o), 3-049(b), 3-052(b), 3-056(k), / C-03-014, 3-014(k,l,m) ""
/ RFI RPT TA 3, PRS 3-054(e), C-3-006, CMR -'
"' / RFI RPT TA 10: 10-008 1;.
Addendum RFI RPTTA 15: PRS C-15-001, C-15-007
RFI RPTTA 19:19-001 , 19-003, C-19-001 L / Addendum RFI RPT TA 36: PRS 36-005 ..,.
RFI RPT TA 16: 16-024(c,d,f,g,k,m,o,p-s) 16-025(b2,d,g,h,j,k,m,n,o,y), / 16-034(c,d,e,f,l,m), C-16-005, C-16-017 \,...
\ RFI RPT TAs11, 1~ 16: PRSs 11-012(a,b), 13-003(a), 16-006(c,d), 16::010(8)\ / 16:02 (_a), :1 ~26(c,d,..v) , ~ 6--028(a), 6..030(~) :i v
/ RFI RPT TA 33: PRSs 33-002(b,c), 33-003(b), 33-004(k), 33-006(a), 33-00B(a,b), "" 33-011 (d), 33-013, 33-017

- Mr. Be'!nito Garcia EM/ER:97 -395
Cy (w/ encs. ): G. Allen, CST-7, MS E525 M. Gilgosch, LAAO, MS A316 G. Gould, EES-15, MS J495 D. Griswold, AL-ERD, MS A906 J. Harry, EES-5, MS M992
. B. Koch, LAAO, MS A316 D. Krier, EES-1, MS D462 R. Michelotti; CST -7~ MS E525 J. Mose, LAAO, MS A316 D. Neleigh, EPA, R.6, 6PD-N C. Rodriguez, CIO/ER, MS M769 T. Taylor, LAAO, MS A316 J. VVhite, ESH-19, MS .K490 S. Dinwiddie, NMED-HRMB M. Leavitt, NMED-GWQB J. Parker, NMED-OB G. Saums, NMED-SWQB S. Yanicak, NMED-AIP, MS J993 RPF, MS M707
Information Copy: T. Baca, EM, MS J591 D. Bradbury, EM/ER, MS M992 J. Canepa, EM/ER, MS M992 T. Glatzmaier, DDEES/ER, MS M992 T. Longo, DOE-HQ, EM-453 D. Mcinroy, EM/ER, MS M992 J. Plum, LAAO, MS A316 S. Rae, ESH-18, MS K497 G. Rael, AL-ERD, MS A906 J. Vozella, LAAO, MS A316 EM/ER File, MS M992
-3- September 30, 1997

•
Name:
Name:
CERTIFICATION
I certify under penalty of law that these documents and all attachments were prepared under my direction or supervision in accordance with a system designed to assure that qualified personnel properly gathered and evaluated the information submitted. Based on my inquiry of the person or persons who manage the system, or those persons directly responsible for gathering the information, the information submitted is, to the best of my knowledge and belief, true, accurate, and complete. I am aware that there are significant penalties for submitting false information, including the possibility of fine and imprisonment for knowing violation.
se , rogram Manager En iron e I Restoration Project Los Alamos National Laboratory
or
Tom Baca, Program Director Environmental Management Los Alamos National Laboratory
Joseph Vozella, Acting Assistant Area Manager of Environmental Projects DOE-Los Alamos Area Office
or
Theodore J. Taylor, Program Manager Environmental Restoration Program DOE-Los Alamos Area Office

\ ,\ \ \991
··~-~~~~~:~~~~j.
LANL 3/1082/16
UBRARYCOPY

RFI Report
EXECUTIVE SUMMARY
This Resource Conservation and Recovery Act (RCRA} facility investigation (RFI} report discusses Phase I investigations, results, and recommendations for 12 potential release sites (PASs} within Technical Area 16 (TA-16}, which is located in the southwestern quadrant of Los Alamos National Laboratory (LANL}. This site has been used from 1944 to the present. Past and present activities at this site have centered around the development, processing, fabrication, and testing of explosive components used in the United States' nuclear weapons program.
Of the 12 PASs, 5 are outfalls from sumps or other drainage systems. Three PASs are components of septic systems. The remaining PASs include high explosives (HE} magazines and an HE burn pad.
Phase I sampling at this site was conducted primarily in 1995. Surface and/or subsurface samples were collected at each PRS. All samples were soil and/or tuff samples; no water sampling was conducted. Samples were analyzed for a combination of HE, metals, volatile organic compounds (VOCs}, semivolatile organic compounds (SVOCs}, total uranium, and other radionuclides. Appendix B lists the details of the data analysis, including any problems that arose during analysis. Many of the metals analyses were qualified, therefore requiring manual examination, due to poor duplicate recovery during analysis. In general, this problem did not affect the decisions made at these sites. Some data missed holding times by a few days and are qualified as estimated values; however, very few data were rejected for serious problems. Data that were rejected were not used. The overall data quality is assessed to be good.
The primary objective of Phase I investigation at these sites was to determine, using biased sampling, if a release had occurred within a PRS. At many PASs, Phase I data also was designed to support a preliminary risk assessment and to bound the extent of contamination. Analytical results would determine if a release had caused contamination at levels above screening action levels (SALs} and/or background upper tolerance limits (UTLs}. Phase I investigation results would then lead to further decisions and actions, such as a Phase II investigation to obtain more data, accelerated cleanup leading to the final remedy for the site, or a recommendation for no further action (NFA} as a final remedy for the site. If contamination did occur, another Phase I investigation objective was to identify chemicals of potential concern (COPCs}.
TA-16 RFI Report September 29, 1997

RFI Report
The decisions made for each PAS are summarized below and shown in Table ES-1. This table
also identifies the section of this report in which each PAS is discussed in detail. All decisions
assume a continued industrial scenario for this area.
• PASs 11-012(a,b) are two former HE magazines located near TA-16-370, a metal forming
building. No contamination was present at levels above SALs. These sites are recommended
for human-health NFA.
• PASs 13-003(a), is a septic system located near T A-16-340, an HE processing building. The
PAS could not be positively located during sampling and is believed to have been removed.
Further sampling in the area is not possible. The site is recommended for human-health
NFA.
• PAS 16-006(c) is a septic system associated with TA-16-370. It is recommended for human
health NFA because all constituents present above SALs were bounded during the
Phase I investigation and contaminants were not present at levels that represent a
significant risk to humans under an industrial scenario.
• PAS 16-006(d) is a septic system associated with TA-16-380, an HE inspection building. It
is recommended for human-health NFA because no constituents were present at levels
above SALs.
• PAS 16-01 O(a) is an HE burn pad located at the TA-16 Burning Ground. This PAS partially
overlaps PAS 16-016(c). Barium is present at levels above SALs. The locations containing
barium contamination will be considered in PAS 16-016(c), a former barium nitrate pile and
potential source of barium contamination, which will be recommended for cleanup in a
separate report. PAS 16-01 O(a) is recommended for human-health NFA because no other
constituents are present at levels above SALs.
• PAS 16-021 (a) is the outfall from floor drains in TA-16-450, a non-HE processing building.
This PAS is recommended for human-health NFA because no constituents were present at
levels above SALs. Arsenic, which was present at levels greater than UTLs, is only slightly
above the UTL value.
• PAS 16-026(c) is the outfall from two sumps associated with TA-16-305, an HE storage
building. It is recommended for human-health NFA. Polynuclear aromatic hydrocarbons
(PAHs) were the only constituents found at levels greater than SALs. PAHs above SALs at
this site are due to runoff from asphalt pavement.
September 29, 1997 ii TA-16 RFI Report

RFI Report
• PRS 16-026(d) is the outfall from two sumps associated with TA-16-303, an HE storage
building. It is recommended for human-health NFA. PAHs were the only constituents found
at levels greater than SALs. PAHs above SALs at this site are due to runoff from asphalt
pavement.
• PR 16-026(v) is the outfall from TA-16-460, an analytical chemistry laboratory. It is
recommended for human-health NFA because all constituents present above SALs were
not present at levels that represent a significant risk to human health under an industrial
scenario. PAHs above SALs at this site are due to runoff from asphalt paving.
• PRS 16-028(a) is the south drainage from the TA-16 Burning Ground. HEs were present
above SALs in one sample, but the extent of contamination was bounded during the Phase I
investigation. This PRS is recommended for human-health NFA because the constituents
at this site do not pose a significant risk to human health.
• PRS-16-030(g) is the outfall from a sump associated with TA-16-380, an HE powder
inspection building. PAHs and lead were present above SALs. PAHs above SALs at this site
are due to runoff from asphalt pavement. The lead level did not pose a risk to human health
under an industrial scenario. Therefore, this PRS is recommended for human-health NFA.
PRS HSWA
11-012(a) No
11-012(b) No
13-003(a) Yes
16-006{c) Yes
16-006{d) Yes
16-01 O(a) Yes
16-021 (a) Yes
16-026(c) Yes
16-026{d) Yes
16-026(v) Yes
16-028(a) Yes
16-030(g) No
TA-16 RFI Report
TABLE ES-1
SUMMARY OF PRSs
NFA CRITERIA RATIONALE
5 Constituents below SALs.
5 Constituents below SALs.
1 PRS not located by sampling.
5 No significant risk to human health.
5 Constituents below SALs.
5 Contaminants transferred to PRS 16-016(c). All other constituents are below SALs.
5 Constituents below SALs.
5 No significant risk to human health.
5 No significant risk to human health.
5 No significant risk to human health.
5 No significant risk to human health.
5 No significant risk to human health.
iii
SECTION
5.1
5.1
5.2
5.3
5.4
5.5
5.6
5.7
5.8
5.9
5.10
5.11
September 29, 1997

RFI Report
THIS PAGE LEFT INTENTIONALLY BLANK
September 29, 1997 iv TA-16 RFI Report

RFI Report
CONTENTS
EXECUTIVE SUMMARY ••..........•.•........•.......•.••....................•.•......•.•..........•........•......••....•.•••.•••.....•••..•..••.•. i
1.0 INTRODUCTION •...•......•.•.•.......••.....•..........•.•........•.•...........•......•.•.•...••.••.••.....•••••.•••..•..•.••...•..•......•••. 1
1.1 General Site History ........................................................................................................................ 1
1.2 RFI Overview .................................................................................................................................. 5
1.3 Field Activities ................................................................................................................................. 5
2.0 ENVIRONMENTAL SETTING ............................................................................................................. 7
2.1 Climate ............................................................................................................................................ 7
2.2 Geology ........................................................................................................................................... 7
2.2.1 Geologic Setting ........................................................................................................................ 7
2.2.2 Soils ....................................................................................................................................... 8
2.3 Hydrology ....................................................................................................................................... 9
2.3.1 Surface Water ........................................................................................................................ 9
2.3.2 Groundwater ........................................................................................................................ 10
2.4 Biological Surveys ......................................................................................................................... 12
2.5 Cultural Survey .............................................................................................................................. 12
3.0 APPROACH TO OAT A ASSESSMENT AND ANALYSES .............................................................. 13
3.1 Sample Analyses .......................................................................................................................... 13
3.1.1 Analytical Methods ............................................................................................................... 14
3.1.2 Data Validation ..................................................................................................................... 14
3.2 Process for Identification of COPCs .............................................................................................. 16
3.2.1 Inorganic Chemicals ............................................................................................................. 16
3.2.2 Radionuclides ....................................................................................................................... 17
TA-16 RFI Report v September 29, 1997

RFI Report
3.2.3 Organic Chemicals ............................................................................................................... 18
3.2.4 Risk-Based Screening Assessment ..................................................................................... 18
3.3 Human Health Assessment ........................................................................................................... 19
3.3.1 Risk Due to Background ...................................................................................................... 19
3.3.2 Risk Assessment .................................................................................................................. 21
3.4 Ecological Assessment ................................................................................................................. 21
4.0 RESULTS OF QUALITY ASSURANCE/QUALITY CONTROL ACTIVITIES .•.••.•.•.....•••••••••.•..••..•.•• 21
4.1 Inorganic Analyses ........................................................................................................................ 24
4.2 Radiochemical Analyses ............................................................................................................... 26
4.3 Organic Analyses .......................................................................................................................... 27
5.0 SPECIFIC RESULTS, CONCLUSIONS, AND RECOMMENDATIONS ........................................... 30
5.0.1 Constituents Without SALs .................................................................................................. 31
5.0.1.1 Polynuclear Aromatic Hydrocarbons ........................................................................... 31
5.0.1.2 2-Amino-4,6-dinitrotoluene and 4-Amino-2,6-dinitrotoluene ........................................ 31
5.0.1.3 Triaminotrinitrobenzene ............................................................................................... 33
5.0.1.4 Volatile Organic Compounds ....................................................................................... 33
5.1 PRSs 11-012(a,b) ......................................................................................................................... 33
5.1.1 History .................................................................................................................................. 33
5.1.2 Description ........................................................................................................................... 34
5.1.3 Previous Investigations ........................................................................................................ 34
5.1.4 Field Investigation ................................................................................................................ 34
5.1.5 Evaluation of Inorganic Chemicals ....................................................................................... 37
5.1.6 Evaluation of Radionuclides ................................................................................................. 37
September 29, 1997 vi TA-16 RFI Report

RF/ Report
5.1 . 7 Evaluation of Organic Chemicals ......................................................................................... 37
5.1.8 Risk-Based Screening Assessment ..................................................................................... 38
5.1.9 Human Health Risk Assessment .......................................................................................... 38
5.1.1 0 Preliminary Ecological Assessment ..................................................................................... 38
5.1.11 Conclusions and Recommendation ..................................................................................... 38
5.2 PRSs 13-003(a,b) ......................................................................................................................... 39
5.2.1 History .................................................................................................................................. 39
5.2.2 Description ........................................................................................................................... 40
5.2.3 Previous Investigations ........................................................................................................ 40
5.2.4 Field Investigation ................................................................................................................ 40
5.2. Evaluation of Inorganic Chemicals ....................................................................................... 43
5.2.6 Evaluation of Radionuclides ................................................................................................. 43
5.2.7 Evaluation of Organic Chemicals ......................................................................................... 43
5.2.8 Risk-Based Screening Assessment ..................................................................................... 43
5.2.9 Human Health Risk Assessment .......................................................................................... 43
5.2.1 0 Preliminary Ecological Assessment ..................................................................................... 43
5.2.11 Conclusions and Recommendation ..................................................................................... 43
5.3 PRS 16-006(c) .............................................................................................................................. 44
5.3.1 History .................................................................................................................................. 44
5.3.2 Description ........................................................................................................................... 44
5.3.3 Previous Investigations ........................................................................................................ 45
5.3.4 Field Investigation ................................................................................................................ 45
5.3.5 Evaluation of Inorganic Chemicals ...................................................................................... .47
TA-16 RFI Report vii September 29, 1997

RFI Report
5.3.6 Evaluation of Radionuclides ................................................................................................. 49
5.3.7 Evaluation of Organic Chemicals ......................................................................................... 49
5.3.8 Risk-Based Screening Assessment ..................................................................................... 51
5.3.9 Human Health Risk Assessment .......................................................................................... 53
5.3.1 0 Preliminary Ecological Assessment ..................................................................................... 53
5.3.11 Conclusions and Recommendation ..................................................................................... 54
5.4 PRS 16-006(d) .............................................................................................................................. 54
5.4.1 History .................................................................................................................................. 54
5.4.2 Description ........................................................................................................................... 55
5.4.3 Previous Investigations ........................................................................................................ 55
5.4.4 Field Investigation ................................................................................................................ 55
5.4.5 Evaluation of Inorganic Chemicals ....................................................................................... 59
5.4.6 Evaluation of Radionuclides ................................................................................................. 59
5.4.7 Evaluation of Organic Chemicals ......................................................................................... 59
5.4.8 Risk-Based Screening Assessment ..................................................................................... 60
5.4.9 Human Health Risk Assessment .......................................................................................... 60
5.4.1 0 Preliminary Ecological Assessment ..................................................................................... 60
5.4.11 Conclusions and Recommendation ..................................................................................... 60
5.5 PRS 16-01 O(a) .............................................................................................................................. 62
5.5.1 History .................................................................................................................................. 61
5.5.2 Description ........................................................................................................................... 61
5.5.3 Previous Investigations ........................................................................................................ 61
5.5.4 Field Investigation ................................................................................................................ 62
September 29, 1997 viii TA-16 RFI Report

RFI Report
5.5.5 Evaluation of Inorganic Chemicals •.•••.••....•.•.•••.•••••••••••.•••••••••••••••.••••••••••••••••••••••••••••••••••••.•• 66
5.5.6 Evaluation of Radionuclides •••••.•••.•••••.•. ooooooooooooooo• ooooooooooooooo•••ooooo•o•o•••o•o······o····oooo••oooooooo•••oo 66
5.507 Evaluation of Organic Chemicals oooooooooooooooooooooooooooooo••o••ooo•o······•oooo·····oo·····•oooo····ooo•••ooooo••oooo66
505.8 Risk-Based Screening Assessment ooo .• o •• oo oo•o·····•oooooooooo•••oooooo•·····o•o•o····•oo•••o••ooooo••ooooo•••oooooo• 68
505.9 Human Health Risk Assessment ••• oooooo•••oooooooooo o•o··· oooooo•o·····•ooooo•o···•oooooo····•ooooo• ••• oooo••·o· ooooooo• 69
505010 Preliminary Ecological Assessment oooooooooooo•o•ooooooooooooo oo•···•ooooo•····o•ooo•o····•oooooooo•••ooooooo• oooooooo• 69
5.5011 Conclusions and Recommendation oooo•••oooooooo• .••••• oooooooo•o····•oo•o•••ooooooooooo•o••ooooooo •• o.ooooooo••oooooo 69
5o6 PRS 16-021(a) ••• o.oooooooo•···•ooooooo•o••oooooooooooooooooooooooo••o•oooooooo•o•ooo•·····•ooo•··•oooooooooo•···•oooooo •• ooooooo•••oooo•ooo69
506.1 History •• o.oooooooooo•···•oooooooo••ooooooooooooooooooooooooooooo ooooo• .o.oooooooooooooooooo•••ooooooooo•o•••ooooooooooooooo••oo••ooooooo 70
50602 Description •o····ooooooooooooo•·· oooooooooOoOOooooo 000000000000 ooooooooooooooooooooooo•••ooooooooooo•o••ooooooooooooo ooooooooooooooooo 70
5o6o3 Previous Investigations ooooooooo•••ooooooooooooooooooooooo•o••oooooooooooooooooooooooooo•o••oo••oooo•···ooooooooo••oooooooooooo 70
5o6o4 Field Investigation ooooooOooo oooooooooooooooooooooooooooooooooo•••o•ooooooooooo•o·····•oooooo••·o·•·oooooo•••oooooooo•···•ooooooooo 71
50605 Evaluation of Inorganic Chemicals ooooooooooooooooooooo••ooooooooooooooo•···ooooooooo••o•o•o•oo••o••oooooo•o••ooooooooooo 74
506.6 Evaluation of Radionuclides oooo•····•oooooo 000000 oooooooooooooooooo oooooooooo••••oooooooooo••·••ooooooooooooooo•o·· 0000 ooooo 75
5o6o7 Evaluation of Organic Chemicals •oooooooooooooooooooooooooooooooooo .• o.ooooooooooo••ooooooooooo••oooooooooooooooooooooooo 75
5o6o8 Risk-Based Screening Assessment oooooooooooooooooooooo ooooooooooooooooooooooo• •• o.oooooooooooooo ooooo• 000000000000 0 .o 75
5o6.9 Human Health Risk Assessment oooooooooooooooooooooooooooooooooooooooooooo•o•••ooooooo•o••oooooooooooooooooooooooooooooo 76
50601 0 Preliminary Ecological Assessment ooooooooooooooooooooooooooooooooooo•o···•oooooo·····ooooo•••o•oooo oooooooooooooooo 000 76
506011 Conclusions and Recommendations oooooooooooooo•••oooooooooooooo•o••oooooooooo•····o•ooo••oooooooooo•o•oooooooooooooo 76
507 PRS 16-026(c) oooooooooooooooooooooooooooooooooooooooooooooooooooooooooooooooooooooooooooooooooooooooooooooooooooooooooooooooooooooooooooooo 76
50 7 01 History oo •• o.oooooooooooooooooooooooooooooooooo 00000 ooooooooooooooooooo oooooooooooooooooooooooo 000000 ooooooo••oooooooo• 0 000000 000000 ooooo 76
50702 Description ooOOOOoOOoooooooooooooooooooooooooooooooooooooooooooooooooooooooooooooooooooooooooooooooooOOOOoooooooooooooooooooooo••ooooo 77
50703 Previous Investigations ooooooooooooooo••ooooooooooooooooooooooooooooooooo••ooooo••ooooooo••o•••ooooo•••ooooooo••ooooooooooooooo 77
TA-16 RFI Report ix September 29, 1997

RFI Report
5.7.4 Field Investigation ................................................................................................................ 77
5.7.5 Evaluation of Inorganic Chemicals ....................................................................................... 79
5.7.6 Evaluation of Radionuclides ................................................................................................. 81
5.7.7 Evaluation of Organic Chemicals ......................................................................................... 81
5.7.8 Risk-Based Screening Assessment ..................................................................................... 83
5.7.9 Human Health Risk Assessment .......................................................................................... 83
5.7.10 Preliminary Ecological Assessment ..................................................................................... 84
5. 7.11 Conclusions and Recommendations .................................................................................... 84
5.8 PRS 16-026(d) .............................................................................................................................. 84
5.8.1 History .................................................................................................................................. 85
5.8.2 Description ........................................................................................................................... 85
5.8.3 Previous Investigations ........................................................................................................ 85
5.8.4 Field Investigation ................................................................................................................ 85
5.8.5 Evaluation of Inorganic Chemicals ....................................................................................... 89
5.8.6 Evaluation of Radionuclides ................................................................................................. 89
5.8.7 Evaluation of Organic Chemicals ......................................................................................... 89
5.8.8 Risk-Based Screening Assessment ..................................................................................... 91
5.8.9 Human Health Risk Assessment .......................................................................................... 92
5.8.1 0 Preliminary Ecological Assessment ..................................................................................... 94
5.8.11 Conclusions and Recommendations .................................................................................... 94
5.9 PRS 16-026(v) .............................................................................................................................. 94
5.9.1 History .................................................................................................................................. 95
5.9.2 Description ........................................................................................................................... 95
September 29, 1997 X TA-16 RF/ Report

RF/ Report
5.9.3 Previous Investigations ........................................................................................................ 95
5.9.4 Field Investigation ................................................................................................................ 96
5.9.5 Evaluation of Inorganic Chemicals ....................................................................................... 99
5.9.6 Evaluation of Radionuclides ................................................................................................. 99
5.9.7 Evaluation of Organic Chemicals ....................................................................................... 100
5.9.8 Risk-Based Screening Assessment ................................................................................... 102
5.9.9 Human Health Risk Assessment ........................................................................................ 103
5.9.1 0 Preliminary Ecological Assessment ................................................................................... 105
5.9.11 Conclusions and Recommendation ................................................................................... 105
5.1 0 16-028(a) South Drainage ........................................................................................................... 105
5.1 0.1 History ................................................................................................................................ 1 05
5.1 0.2 Description ......................................................................................................................... 106
5.1 0.3 Previous Investigations ...................................................................................................... 106
5.1 0.4 Field Investigation .............................................................................................................. 106
5.1 0.5 Evaluation of Inorganic Chemicals ..................................................................................... 11 o
5.1 0.6 Evaluation of Radionuclides ............................................................................................... 110
5.1 0. 7 Evaluation of Organic Chemicals ....................................................................................... 11 0
5.1 0.8 Risk-Based Screening Assessment ................................................................................... 114
5.1 0.9 Human-Health Risk Assessment ....................................................................................... 115
5.1 0.1 0 Preliminary Ecological Assessment ................................................................................... 117
5.1 0.11 Conclusions and Recommendations .................................................................................. 117
5.11 PRS 16-030(g) ............................................................................................................................ 117
5.11.1 History ................................................................................................................................ 118
TA-16 RFI Report xi September 29, 1997

RFI Report
5.11.2 Description ......................................................................................................................... 118
5.11.3 Previous Investigations ...................................................................................................... 118
5.11.4 Field Investigation .............................................................................................................. 118
5.11.5 Evaluation of Inorganic Chemicals ..................................................................................... 122
5.11.6 Evaluation of Radionuclides ............................................................................................... 122
5.11. 7 Evaluation of Organic Chemicals ....................................................................................... 122
5.11.8 Risk-Based Screening Assessment ................................................................................... 124
5.11.9 Human Health Risk Assessment ........................................................................................ 125
5.11.1 0 Preliminary Ecological Assessment ................................................................................... 126
5.11.11 Conclusions and Recommendation ................................................................................... 126
6.0 REFERENCES .........................................•...............................•............................•.............•......•.... 128
APPENDIX A. ANALYTICAL SUITES .............................•.•............•.................•..............•.•.................. A-1
APPENDIX B. DATA VALIDATION ...................................................................................................... B-1
APPENDIX C. FIELD SCREENING METHODS ................................................................................... C-1
September 29, 1997 xii TA-16 RFI Report
. I

RFI Report
LIST OF TABLES
Table 3.1.2-1 Definition of Data Qualifiers Assigned During Baseline Validation .................................... 15 Table 3.4.1-1 Risk Due to Background Concentrations of Soillnorganics Assuming
a Residential Scenario ....................................................................................................... 20
Table 4.0-1 1995 Field QA Samples at T A-16 ...................................................................................... 22
Table 5.0-1 PRSs in This TA-16 Report ............................................................................................... 31
Table 5.1.4-1 Summary of Request Numbers for Laboratory Samples Taken at PRSs 11-012(a,b) .............................................................................................................. 35
Table 5.1.4-2 Summary of Positive PID Screening Results .................................................................... 37
Table 5.1.7-1 PRS 11-012(b) Soil Concentrations for Detected Organic Analytes ................................. 38
Table 5.2.4-1 Summary of Request Numbers for Laboratory Samples Taken at PRSs 13-003(a,b) .......................................................................................................... 41
Table 5.3.4-1 Summary of Request Numbers for Laboratory Samples Taken at PRS 16-006(c) ...... ; ... .47
Table 5.3.5-1 lnorganics with Concentrations Greater Than Background UTL for PRS 16-006(c) ...................................................................................................... 49
Table 5.3.7-1 PRS 16-006(c) Soil Concentrations for Detected SVOC Analytes .................................... 50
Table 5.3.7-2 PRS 16-006(c) Soil Concentrations for Detected VOC Analytes ...................................... 51
Table 5.3.8-1 MCE Calculation for PRS 16-006(c) .................................................................................. 52
Table 5.4.4-1 Positive Field Screening Results Using a PID for Organic Vapor Analysis ....................... 56
Table 5.4.4-2 Summary of Request Numbers for Laboratory Samples Taken at PRS 16-006(d) ........... 57
Table 5.4.5-1 lnorganics with Concentrations Greater Than Background UTL for PRS 16-006(d) ......... 59
Table 5.4.7-1 PRS 16-006(d) Soil Concentrations for Detected Organic Analytes ................................. 60
Table 5.5.4-1 Summary of Request Numbers for Laboratory Samples Taken at PRS 16-010(a) ........... 63
Table 5.5.4-2 Screening Results for PRS 16-010(a) ............................................................................... 65
Table 5.5.5-1 lnorganics with Concentrations Greater Than Background UTLs for PRS 16-010(a) ............................................................................................................. 66
Table 5.5.7-1 PRS 16-010(a) Soil Concentrations for Detected Organic Analytes ................................. 67
Table 5.5.8-1 MCE Calculation for PRS 16-010(a) .................................................................................. 68
TA-16 RFI Report xiii September 29, 1997

, I
RFI Report
Table 5.6.4-1 Summary of Request Numbers for Laboratory Samples Taken at PAS 16-021 (a) ............ 72
Table 5.6.4-2 Positive Screening Values ................................................................................................. 74
Table 5.6.5-1 lnorganics with Concentrations Greater Than Background UTLs for PAS 16-021 (a) ....... 74
Table 5.6.7-1 PAS 16-021 (a) Soil Concentrations for Detected Organic Analytes ................................. 75
Table 5.7.4-1 Summary of Request Numbers for Laboratory Samples Taken at PAS 16-026(c) ........... 79
Table 5.7.5-1 lnorganics with Concentrations Greater Than Background UTLs for PAS 16-026(c) ....... 81
Table 5.7.7-1 PAS 16-026(c) Soil Concentrations for Detected Semivolatile Organic Compounds ........ 82
Table 5.7.7-2 PAS 16-026(c) Soil Concentrations for High Explosives ................................................... 83
Table 5.8.4-1 Summary of Request Numbers for Laboratory Samples Taken at PAS 16-026(d) ........... 87
Table 5.8.5-1 lnorganics with Concentrations Greater Than Background UTLs for PAS 16-026(d) ....... 89
Table 5.8.7-1 PAS 16-026(d) Soil Concentrations for Detected Semivolatile Organic Compounds ....... 90
Table 5.8.7-2 PAS 16-026(d) Soil Concentrations for High Explosives ................................................... 91
Table 5.8.8-1 MCE for PAS 16-026(d) .................................................................................................... 92
Table 5.8.9.1-1 Comparison of Noncarcinogenic COPCs to Industrial Soil PRGs ..................................... 93
Table 5.9.4-1 Summary of Request Numbers for Laboratory Samples Taken at PAS 16-026(v) ........... 97
Table 5.9.5-1 lnorganics with Concentrations Greater Than Background UTLs for PAS 16-026(v) ....... 99
Table 5.9.7-1 PAS 16-026(v) Soil Concentrations for Detected Volatile Organic Analytes ................... 100
Table 5.9.7-2 PAS 16-026(v) Soil Concentrations for Detected Semivolatile Organic Analytes ........... 101
Table 5.9.7-3 PAS 16-026(v) Soil Concentrations for Detected High Explosive Analytes .................... 102
Table 5.9.8-1 MCE Calculation for PAS 16-026(v) ................................................................................ 103
Table 5.10.4-1 Field Screening Results ................................................................................................. 108
Table 5.10.4-2 Summary of Request Numbers for Laboratory Samples Taken at PAS 16-028(a) ....... 108
Table 5.10.5-1 lnorganics with Concentrations Greater Than Background
UTLs for PAS 16-028(a) ................................................................................................ 111
Table 5.10.7-1 PAS 16-028(a) Soil Concentrations for Detected Semivolatile
Organic Analytes ............................................................................................................ 112
Table 5.10.7-2 PAS 16-028(a) Soil Concentrations for Detected Volatile Organic Analytes ................... 113
September 29, 1997 xiv TA-16 RFI Report

RFI Report
Table 5.10.7-3 PRS 16-028(a) Soil Concentrations for Detected High Explosive Analytes ................... 113
Table 5.1 0.8-1 MCE Calculation for PRS 16-028(a) .............................................................................. 115
Table 5.1 0.9-1 Comparison of COPCs to Industrial Soil PRGs ............................................................. 116
Table 5.11.4-1 Summary of Request Numbers for Laboratory Samples Taken at PRS 16-030(g) ................................................................................................ 120
Table 5.11.5-1 lnorganics with Concentrations Greater Than Background UTLs for PRS 16-030(g) ................................................................................................ 122
Table 5.11.7-1 PRS 16-030(g) Soil Concentrations for Detected Organic Analytes ............................. 123
Table 5.11. 7-2 PRS 16-030(g) Soil Concentrations for Detected HE Analytes .................................... 124
Table 5.11.8-1 MCE Calculation for PRS 16-030(g) .............................................................................. 125
TA-16 RFI Report XV September 29, 1997

RFI Report
LIST OF FIGURES
Fig. 1.1-1 Location of TA-16 within Los Alamos National Laboratory, Los Alamos County,
New Mexico ........................................................................................................................ 2
Fig. 1.1-2 Location of T A-16 with respect to Laboratory T As and surrounding land holdings ............ 3
Fig. 1.1-3 Location map of TA-16 (S-Site) and TA-28 (Magazine Area A) ......................................... 4
Fig. 2.3.1-1 Topography, springs, seeps, National Wetlands Inventory, and LANL-defined
wetlands associated with National Pollution Discharge Elimination System
(NPDES) HE outfalls (active and inactive) at TA-16 ......................................................... 11
Fig. 1.1-3 Location map of PRSs presented in this report ................................................................ 32
Fig. 5.1.4-1 Screening and laboratory sample locations at PRSs 11-012(a,b) .................................... 36
Fig. 5.2.4-1 Screening and laboratory sample locations at PRSs 13-003(a,b) .................................... 42
Fig. 5.3.4-1 Sample locations for PRS 16-006(c) ................................................................................ 48
Fig. 5.4.4-1 Screening and laboratory sample locations at PRS 16-006(d) ......................................... 58
Fig. 5.5.4-1 Screening and laboratory sample locations at PRS 16-010(a) ......................................... 64
Fig. 5.6.4-1 Sample locations at PRS 16-021(a) ................................................................................. 73
Fig. 5.7.4-1 Screening and laboratory sample locations associated with PRS 16-026(c) ................... 80
Fig. 5.8.4-1 Screening and laboratory sample locations at PRS 16-026(d) ......................................... 88
Fig. 5.9.4-1 Sample locations at PRS 16-026(v) .................................................................................. 98
Fig. 5.10.4-1 Sample locations at PRS 16-028(a) ............................................................................... 109
Fig. 5.11.4-1 Sample locations at PRS 16-030(g) ............................................................................... 121
September 29, 1997 xvi TA-16 RFI Report
'I

RFI Report
1.0 INTRODUCTION
1.1 General Site History
Technical area 16 (TA-16} and associated TAs (11, 13, 24, 25, 28, 29, 37) are located in the
southwestern corner of the Laboratory (Fig. 1.1-1 and Fig. 1.1-2). TA-16 contains 2 410 acres
or 3.8 square miles. The land is a portion of that which was acquired by the Department of Army
for the Manhattan Project in 1943. It was used prehistorically by the ancestral Indians of the
Pajarito Plateau, and prior to World War II, for farming and a sawmill operation. TA-16 is
bordered by Bandelier National Monument along New Mexico (NM) State Highway 4 to the
south and the Santa Fe National Forest along NM State Highway 501 to the west (Fig. 1.1-3).
To the north and east, it is bordered by TAs 8, 9, 14, 15, and 49. TA-16 is fenced and posted
along NM State Highway 4. Water Canyon, a 200-ft-deep ravine with steep walls, separates
State Highway 4 from active sites at TA-16. Canon de Valle forms the northern border of TA-16.
Security fences surround the HE production facilities.
TA-16 was established to develop explosive formulations, to cast and machine explosive
charges, and to assemble and test explosive components for the US nuclear weapons program.
Almost all of the work was conducted in support of the development, testing, and production
of explosive charges for the implosion method. Present-day use of this site is essentially
unchanged, although facilities have been upgraded and expanded as explosive and
manufacturing technologies have advanced.
Many of the PRSs included in this report are outfalls from HE sumps. Sumps separate insoluble
pieces of HE from the liquid they are suspended in by taking advantage of the difference in
density between HE and water. HE floats to the surface where it is removed and disposed of;
the water beneath the HE flows from the outfall, carrying potential contamination from
dissolved HE into the drainage. Further discussion of HE sumps can be found in Subsection
5.2.1 of the Operable Unit (OU) 1082 work plan (LANL 1993, 1 094}. Other outfalls included in
this report, such as septic systems, have potential contaminants based on the specific
activities conducted in their associated buildings. Contamination in a septic system could be
due to a range of activities within a building or within the area surrounding a building. Other
PRSs in this report were firing sites and incineration sites. Contaminants at these sites include
metals as well as HE and burn products from the combustion of HE.
A comprehensive table of the potential contaminants that were expected at this site prior to
beginning fieldwork is contained in Chapter 4 of the second addendum to the Resource
Conservation and Recovery Act (RCRA) facility investigation (RFI) Work Plan for OU 1082
TA-16 RFI Report 1 September 29, 1997

RFI Report
~-----l
- - - Los Alamos County I 1--~
r-, __ ..J vZZ. Los Alamos National Laboratory
I L--------~ - TA-16
0 1 2 miles ,..._ __ ______
SANTA FE
NATIONAL
FOREST
cARTography by A. Kron 6/13193
To Santa Fe
INDIAN
;----------,-----, ("' T~erraAmarilla I TAOS 1
@ I COUNTY( I I \ I RIO ARRIBA COUNTY \ Taos I 1 @
I <, J ~----~ ~ I
______ l__ ~_?~~AMOS CO-~/ ~=-~ -~ ~os Alamos • 1
-._I --- Santa Fe 1
Los Alamos
Grants . • Albuquerque
NEW MEXICO Socorro
@
I SANDOVAL I II I COUNTY I SANTA
I FE I L_'--- Bem~lillo@ --!COUNTY!
\ Albuquerttue@ I \ ~---\~ERN_,.AQ~LO ~ 1
COUNTY
Fig. 1.1-1. Location of TA-16 within Los Alamos National Laboratory, Los Alamos County, New Mexico.
September 29, 1997 2 TA-16 RFI Report
, I

RFI Report
SANTA FE NATIONAL FOREST
SANTA FE ,---------------l
' ' NATIONAL
~~~s:~~~Q~~~:: --- ' 74 --73- I ___ _,
C::::::::~-1--__..:~ - ..__ ............. .............. ............
o~l"""""15-;;iio~.;._5-iiii1~~-~2 miles
cARTography by A. Kron 1/31/96
- - - - - Los Alamos National Laboratory boundary
-- ---- ----- Technical area boundary
---- Maier caved roads
___ ,r---,
SAN ILDEFO INDIAN 1-.t,
RESERVATION .,
70 ''-\ .__ I
/ /
/ /-
'- -", I -, ... ,., ,:.
33
I ---"" I ~--I 1 I I I.,.,-"" \,
Fig. 1.1-2. Location of T A-16 with respect to Laboratory T As and surrounding land holdings.
TA-16 RFI Report 3 September 29, 1997

~ ~ t:t ~ 1\) jO .... :g "'
.to,
~ I ....
0)
:::0 :!! :::0 ~ 0 ., ....
II j; I I
"'/1 <::lll (<) I Qj
1!!1a·( !!I <i)/
TA-29 (Magazine Area B)
;/ oJ STATE ROAD 4
To White Rock
430
Pressing
~~ 4 2 1
TA-28 (Magazine Area A)
Fig. 1.1-3. Location map of TA-16 (S-Site) and TA-28 (Magazine Area A).
101~413 41~
££) ~ ~~
HE Machining
Incoming Shipments
TA-13 (P-Site)
Burning Ground
0 500 1000ft l!l!l!l!l!l!l!l!l!l!l
cARTography by A. Kron
Powder Inspection
6/13193
~ ~ ~ c ~

RF/ Report
(LANL 1995, 1342). This table includes a wide range of HE used at LANL over the years, as well as standard industrial solvents, metals, and a few radionuclides.
1.2 RFI Overview
The sampling plans for the PRSs discussed in this document are contained in the RFI Work
Plan for OU 1082 (LANL 1993, 1094). This work plan was submitted to Environmental Protection Agency (EPA) Region 6 in July 1993. A notice of deficiency (NOD) was received in July 1994. LANL's response was submitted to the Los Alamos Area Office of the Department of Energy (DOE) in August 1994. EPA's approval of the work plan, with modifications, was received during December 1994 (Taylor 1995, 1357).
The technical approach of this plan included phased sampling to locate the sources of contamination associated with LANL activities. Contaminants detected during Phase I reconnaissance sampling may be subject to subsequent sampling to ensure that contamination is investigated in compliance with the Hazardous & Solid Waste Amendments (HSWA) Module VIII of the LANL RCRA Facility Permit (EPA 1990, 0306).
The conceptual model for this site is referenced in Subsection 4.3 of the RFI Work Plan for OU 1082 (LANL 1993, 1094 ). The primary exposure routes for continued industrial operations include ingestion, inhalation, dermal contact, and external radiation. HE detonation is also a
concern under an industrial scenario.
1.3 Field Activities
The fieldwork for the PRSs in this report began in April 1995 and ended in October 1995. Additional samples at PRS 16-006(d) during 1996 and at PRS 16-028(a) during 1997. All fieldwork was conducted by ICF Kaiser Engineers. All applicable LANL Environmental Restoration (ER) SOPs (LANL 0875) were followed, unless otherwise noted in Chapter 5 of this
document.
Laboratory analysis samples were screened for radioactivity, HE, and the presence of organic vapors. Radioactive screening was conducted with a 2x2 Nal2 detector. Screening for organic vapors was conducted with a photoionization detector (PID) with an 11.7 eV lamp. HE screening was conducted using a spot test kit. The spot test has a nominal detection limit
of 100 ppm, above which the test results are considered positive and below which the test results are considered negative. The test changes color to indicate the presence of HE above or below that limit (see Appendix C).
TA-16 RFI Report 5 September 29, 1997

RFI Report
Sampling at these PASs involved surface and subsurface sampling. A few PASs required only
surface sampling because of the nature of the presumed contamination. Surface samples were
collected with a spade and a scoop. Because many of the PASs in this AFI report are outfalls,
they have very similar sampling plans. Two boreholes were drilled near the outfall for surface
and subsurface sampling. Surface samples were collected further down the drainage. Where
possible, subsurface samples were collected with a hand auger. Generally, the hand auger was
used to collect samples down to the soil-tuff interface. Deeper borehole samples were
collected with a split spoon using a drill rig. Borehole depths reached 9ft below the soil surface.
The purpose of field screening was to bias samples to locations with the highest contamination
and to aid in bounding the extent of contamination. Screening was also needed to ensure
compliance with shipping requirements for explosive materials. HE spot test results were
frequently relied upon for biasing laboratory sampling locations.
All sampling data were loaded into a field 4-D database that was later uploaded to the Facility
for Information Management, Analysis, and Display (FIMAD).
Land surveys were conducted between January and March 1995 and finished in June 1996. All
surface samples were taken to an approximate depth of 6 in. within a diameter of 6 to 8 in. VOC
samples were taken from a depth of greater than 6 in.
Field quality assessment (QA) samples, in the form of collocated and performance evaluation
(PE) samples, were collected as specified and defined in the site-specific quality assurance/
quality control (QA/QC) plan for the fiscal year (FY) 95 TA-16 field campaign (ICF Kaiser 1995,
15-16-628). Collocated surface samples, designated as field duplicates in the AFI work plan,
were established less than 1 ft north of their respective RFI-mandated sample locations. Split
subsurface samples were collected from 1- to 2-ft intervals of core.
The PE samples were collected for these reasons:
• to check for contamination that may have been introduced from ambient conditions or
improper handling procedures,
• to evaluate matrix effects on analytical laboratory recovery of inorganics and radioactive
constituents, and
• to evaluate the overall process of sample handling and analysis.
September 29, 1997 6 TA-16 RFI Report

RFI Report
2.0 ENVIRONMENTAL SETTING
The environmental setting of the Laboratory is described in Subsection 2.4 of the Installation Work Plan (IWP) for Environmental Restoration (LANL 1995, 1164). A discussion of the
environmental setting, including climate, geology, hydrology, and a conceptual hydrogeologic model for the area and surroundings, is presented in Chapter 3 of the RFI work plan for OU 1082 (LANL 1993, 1 094). A summary of that and new data collected since 1993 is presented in the following sections.
2.1 Climate
Los Alamos County has a semiarid, temperate, mountain climate. Summers are generally sunny with moderate, warm days and cool nights. High altitude, light winds, clear skies, and dry atmosphere allow mean summer temperatures to range from 60°F to 68°F at TA-16. Winter mean temperatures typically range from 30°F to 37°F. The average annual rainfall in the area of TA-16 is estimated to range from 18 to 20 in. (Bowen 1990, 0333). Of this total, approximately 40% occurs as brief, intense thunderstorms during July and August.
2.2 Geology
2.2.1 Geologic Setting
A detailed discussion of the geology of the entire Los Alamos area can be found in Subsection
2.5.1 of the IWP (LANL 1995, 1164). The geology of TA-16 is described in Subsection 3.4 of the RFI work plan (LANL 1993, 1 094). However, significant additional information about the geology of TA-16 has become available during the last 3 years. These new data are described
below.
The operations area at TA-16 is bounded on the south by Water Canyon and on the north by Canon de Valle. Canon de Valle is a tributary of Water Canyon; they join at the east end of
TA-16. Water Canyon drains into the Rio Grande approximately 7 miles east of the easternmost
boundary of TA-16.
Operational areas at TA-16 are located on the mesa tops, which are composed of Unit 4 (Qbt4) of the Tshirege Member of the Bandelier Tuff. Unit 3 (Qbt3) of the Tshirege Member of the Bandelier Tuff crops out on the mesa tops at the east end of TA-16 and in the bottoms and walls of Canon de Valle and Water Canyon. Correlation of recent mapping at Material Disposal Area P (MDA-P) with the recently released bedrock geologic map of Rogers (Rogers 1995, 1353)
TA-16 RFI Report 7 September 29, 1997

RFI Report
suggests that mesa top portions of TA-16 are underlain by approximately 80-110 ft of Unit 4 of
the Tshirege Member of the Bandelier Tuff.
At MDA-P, Qbt4 is a lithologically complex unit consisting of the following material in ascending
order: {1) a poorly indurated, white to light gray, nonwelded ignimbrite; {2) an indurated, light
tan, nonwelded, cliff-forming tuff overlain by a broad bench; {3) a varicolored, nonwelded, cliff
forming tuff with devitrified base and a 1O-ft-thick glassy upper part; (4} a crystal-rich surge bed
up to 1 ft thick; and (5) a hard, densely welded tuff that forms the cap rock for the mesa (Broxton
et al. 1996, 1305}. The latter subunit correlates with Unit Qbtf and the first 3 units correlate with
Unit Qbte of Rogers (Rogers 1995, 1353}. The crystal-rich surge bed was mapped by Rogers
as the boundary between her Units Qbte and Qbtf. This high-permeability sandy parting may
represent a possible perched zone - provided it also overlies a low-permeability zone.
Examination of this contact in the walls of Canon de Valle suggests that the surge bed is
discontinuous. The Rogers subunit Qbte contains a unit characterized by horizontal fractures
that also may represent a possible perched-flow pathway.
The Qbt3 in Canon de Valle that is adjacent to MDA-P consists of two hard, pinkish-brown,
partially to moderately welded, cliff-forming ignimbrites that are separated by a soft, pinkish
orange, nonwelded, slope-forming tuff. The uppermost subunit within Unit 3 contains significant
horizontal fractures.
Detailed information about the mineralogy, modes, whole-rock chemistry, and outcrop
characteristics of Unit 3 and Unit 4 at TA-16 are provided in Broxton et al. (Broxton et al. 1996,
15-16-1305}.
A large, near-vertical fault, the Frijoles segment of the Pajarito fault zone, has been mapped
to the west of OU 1082. This fault is the largest segment of the Pajarito fault system in the Los
Alamos area, with down-to-the-east displacement ranging up to 400ft during the last 1.1 million
years. Fault zones may provide pathways for water flow.
2.2.2 Soils
A detailed discussion of soils in the Los Alamos area can be found in Subsection 2.5.1.3 of the
IWP (LANL 1995, 1164}. Soil at TA-16 is described in Subsection 3.4.3.2 of the RFI work plan
(LANL 1993, 1 094}.
September 29, 1997 8 TA-16 RFI Report

RFI Report
A recent study of background soils on the north and south slopes of Canon de Valle near the
TA-16 burning ground suggests that {1) soil horizons ranged from 40 to 237 em in depth;
{2) soils are poorly developed and consist of A-R, A-Bw-R, or A-Bw-C soil profiles; and {3) soils
are classified as Lithic Ustorthents, Typic Haplumbredt, Cumulic Haplumbredt, Typic Ustochrept,
and Udic Paleoustalf (McDonald et al. 1996, 1354).
2.3 Hydrology
The hydrology of the Pajarito Plateau is summarized in Subsection 2.5.2 of the IWP
(LANL 1995, 1164). Site-specific conditions are summarized below.
The shallowest depth to groundwater at TA-16 is unknown. Shallow perched aquifers at
TA-16 are likely to be quite heterogeneous. Several moderate-depth (up to 200ft) boreholes
drilled at the TA-16 burning ground near MDA-P did not encounter a saturated zone. The depth
to the regional aquifer at TA-16 is estimated to be greater than 1 000 ft.
Four deep groundwater wells to the regional aquifer are scheduled in and around TA-16 as part
of sitewide hydrogeologic studies scheduled for FY98 to FY05. These four wells will be drilled
in the following locations: {1) in Canon de Valle near MDA-P, (2) at the confluence of Canon
de Valle and Water Canyon, {3) at NM State Highway 501 and Canon de Valle, and (4) at
NM State Highway 501 and Water Canyon.
2.3.1 Surface Water
Surface water issues at TA-16 are described in Subsection 3.5.1 of the RFI work plan
(LANL 1993, 1 094). Additional information about surface water that was collected since 1993,
is summarized below. Figure 2.3.1-1 shows the locations of surface water reaches, possible
wetlands, springs and seeps, and other features relevant to surface water investigations
at TA-16.
Perennial and intermittent surface water exists at many locations at TA-16, due to both natural
and anthropogenic sources. Canon de Valle contains what appears to be a perennial reach: the
surface water between the TA-16-260 outfall and a location beyond MDA-P has flowed
continuously since initial investigations in 1992. Several small saturated areas are present in
small tributary drainages to Canon de Valle and Water Canyon. Many of these zones are due
to the discharge of process waters from TA-16 operations. Process water discharges at most
of the TA-16 NPDES outfalls, including that at TA-16-260 outfall, were shut off during 1996
and 1997.
TA-16 RFI Report 9 September 29, 1997

RFI Report
Surface water in many of these locations has been analyzed as part of Framework Studies
surface water characterization activities, sampling was performed by New Mexico Environment
Department (NMED) Agreement in Principle (AlP) personnel as part of their surveillance
activities, and as part of non-RFI hydrogeologic sampling at TA-16. These data are provided
in Appendix C of the RFI report for PRSs 16-003(k) and 16-021 (c), which was submitted in
September 1996 (Environmental Restoration Project, 1996, 1419). Information on constituents
above background in surface waters is summarized below.
Certain surface waters in Canon de Valle are contaminated with several constituents at levels
above drinking water standards and above background levels. Barium in Canon de Valle
ranges from 2 to 3 ppm, which is above the New Mexico drinking water maximum concentration
level (MCL) of 1 ppm. The high explosive RDX is also consistently found at levels above
100 ppb, which is greater than the New Mexico drinking water MCL for that constituent. Several
other constituents in Canon de Valle are at levels above regional spring background, including
HMX, chlorine, sodium, and manganese.
Other surface waters at TA-16 that have anomalously high levels of constituents include the
pond behind the 90s-Line, which contains barium at levels above the MCL, and a surface water
zone at K-Site, which contains barium and boron above background levels.
2.3.2 Groundwater
Groundwater issues at TA-16 are described in Subsection 3.5.2 of the RFI Work Plan (LANL
1993, 1 094). Additional information about groundwater that was collected or reinterpreted
since 1993, is summarized below.
Borehole SHB-3 (near the tritium facility on Fig. 1.1-3)(Fig. 2.3.1-1 ), which was drilled in
November 1991, encountered perched groundwater that was hypothesized to have been
derived from a depth of 750-350 ft. (Gardner et al. 1993, 0848). This water may represent a
perched zone or it could represent the regional aquifer. Water samples were taken from SHB-
3 during the summer of 1993. These data show sporadically elevated values of lead, phosphate,
rubidium, and ammonium relative to background spring data (Blake et al. 1995, 1355). Static
water depth in SHB-3 was roughly 664 ft during 1992 (Environmental Protection Group
1994, 1179).
September 29, 1997 10 TA-16 RFI Report

i1 I ....
0'1
:X:. :!:! :X:. lb
"tJ 0 ., -
.... ....
~ ~ t:r ~ 1\) ~ .... ~ "'
& 8000· .. · ..:~
~
·::~~·~=::~,
s~~o co .1g
.. ~~· • '\v
74oo
. . . . . . . . . . .
?,roo.. K-Site
r:fl• .. 1'2! :
··· ..... · ..
>aq, ..... -?q,
··· .......... ..
. 7200 .. ··· ···· ....... .
····.1aao ..... . .·;:: ·· .. ~:<:\ .....
.: ., : 'J:: i / / / .·,
·:·/<,::·
\.v ·. ·. ·~z .. · ......... ·
,, ¥ Possible wetland associated with outfall
<'x<)( Perennial reach of stream
Possible wetlands:
\ Primarily linear
-~:·.,··;:.;, .••••... ~;.~'\?·S~~~:r-~~-idr :···ei£~ ~Area cARTography by A. Kron 9/19/96
PSS 1 A: Palustrine, shrub-scrub, broadleaf deciduous, temporarily flooded PUSCh: Palustrine, unconsolidated shore, seasonally flooded, diked/empounded
Fig. 2.3.1-1. Topography, springs, seeps, National Wetlands Inventory, and LANL-defined wetlands associated with National Pollution Discharge Elimination System (NPDES) HE outfalls (active and inactive) at TA-16.
~ ~ ~ c :t

RFI Report
Several springs and seeps have been identified at TA-16 during the past four years. SWSC Line
and the Burning Ground spring discharge from within the uppermost, platy, subunit of Tshirege
Unit 3. Martin spring apparently discharges from the lower portion of Tshirege Unit 4 (Figure
2.3.1-1 ). All the springs and seeps are contaminated with constituents (e.g., barium, boron,
HE, solvents) at levels above background. All these springs are also contaminated at levels
above drinking water criteria for RDX. Martin spring appears to be the most highly contaminated.
The presence of these springs suggests the existence of one or more perched zones at a
shallow level beneath TA-16.
2.4 Biological Surveys
Biological surveys were performed at TA-16 prior to sampling.
Appendix B to the RFI work plan for OU 1082 (LANL 1993, 1 094) and Raymer
(1996, 15-16-621) describe the results of field surveys for threatened, endangered, and
sensitive species. Ten plant and animal species of concern were identified in those surveys:
Jemez Mountain salamander, northern goshawk, peregrine falcon, Mexican spotted owl, broad
billed hummingbird, pine marten, meadow jumping mouse, spotted bat, checker lily, and wood
lily. Appropriate notifications and mitigation measures for each species were also identified in
Appendix B to the RFI work plan. One of these species is known to reside in Canon de Valle
(Dunham 1996, 15-16-622; Raymer 1996, 15-16-621)
2.5 Cultural Survey
The methods and techniques used for this survey conform to those specified in the Secretary
of the Interior's Standards and Guidelines for Archaeology and Historic Preservation (National
Park Service 1983, 0632). A cultural resource survey was also conducted in the area of the
PRSs in this RFI report, as required by the National Historic Preservation Act (amended), in
1992.
Appendix A to the RFI work plan (LANL 1993, 1 094} identifies 33 cultural sites that are eligible
for inclusion on the National Register of Historic Places under Criterion D within OU 1082.
However, that Appendix also notes that the attributes that make these sites eligible for
inclusion on the National Register will not be affected by ER project sampling activities.
September 29, 1997 12 TA-16 RFI Report

RF/ Report
3.0 APPROACH TO DATA ASSESSMENT AND ANALYSES
The approach to data assessment used by the ER Project is described in the "Technical
Approach to Data Assessment for ER Project Site Characterization Decisions" (Knudsen et al.
1996, 1299). The approach includes
• sampling and analysis design,
• field investigation and collection of field and QA samples,
• chemical and radiological analyses of samples and reporting of analytical data,
• routine verification and validation of analytical data,
• organization of field and analytical data into PRS-specific data packages,
• exploratory data analysis,
• focused validation when necessary to further assess questionable data,
• comparison of validated analytical results with LANL background data,
• comparison of validated analytical results with SALs,
• assessment of human health risk, and
• formulation of decisions.
The following subsections provide overviews of the methods used to complete these steps for
the PRSs discussed in this RFI report.
3.1 Sample Analyses
Samples were collected in accordance with the sampling design specified in the RFI Work Plan
for OU 1082 (LANL 1993, 1 094). During the sampling activities, field data were collected for
each sample. This data includes unique sample identification number, location number, time
and date of collection, soil type, sampling anomalies, etc. Field screening analyses were
completed using volatile organic methods (photoionization detector[PID]), metals methods
(X-ray fluorescence [XRF] and laser induced breakdown spectrometry [LIBS]), the
HE spot test for explosives, and gamma radioactivity detection (sodium iodide detector). All
samples requiring chemical and radiochemical analyses and chain-of-custody documentation
were submitted to the sample management office (SMO) for analyses.
TA-16 RFI Report 13 September 29, 1997

RFI Report
3.1.1 Analytical Methods
The field screening methods are described in Appendix C.
All laboratory samples were analyzed by contract analytical laboratories using methods
specified in ER SMO analytical subcontracts (LANL 1995, 1278}. The allowed methods are
current EPA SW-846 and Contract Laboratory Program (CLP) methods or equivalent.
All solid samples for inorganic and organic analyses were digested using EPA's 3050 digestion
procedure (EPA 1992, 1207). The subcontracts specify LANL-approved methods for
radiochemical analyses according to the technologies identified in the subcontract (e.g.,
americium-241 by alpha spectroscopy, tritium by liquid scintillation, or multiple isotopes by
gamma spectroscopy). Samples for uranium analysis were prepared by a total digestion
procedure comparable to LANL method ER320, "Uranium in Environmental Matrices-KPA"
(Gautier 1417), and analyzed by ICPMS.
Analytical method selection is described in Appendix IV of the ER Project Quality Assurance
Project Plan Requirements for Sampling and Analysis (QAPP) (LANL 1996, 1292). For each
analyte, quantitation or detection limits are specified as contract-required estimated quantitation
limits (EQLs) for organic chemicals and radio nuclides and estimated detection limits (EDLs} for
inorganic chemicals. These limits are included in Appendix Ill of the ER Project QAPP, along
with the target analytes for each analytical suite, and their appropriateness for the investigations
described in this report is discussed in Chapter 4.
The following analytical suites were used for the sample analyses in this RFI report: inorganic
chemicals, total uranium, radionuclides, VOCs, SVOCs, HE, as well as an expanded HE suite.
A list of the target analytes for which analyses were performed for the purpose of this report
can be found in Appendix A. Because TA-16 has been used for decades for the study of
experimental HE, an expanded HE analysis was conducted at some PRSs to indicate whether
a broader range of less common HE might be contaminants at TA-16.
3.1.2 Data Validation
Data verification and baseline validation procedures are used to determine whether analytical
data packages had been generated according to specifications and contain the information
necessary to determine data sufficiency for decision-making. Data verification includes
ascertaining that data packages are complete, including results for all requested analyses and
all supporting information such as chromatograms.
September 29, 1997 14 TA-16 RFI Report

RFI Report
For analytical data used for decisions discussed in this RFI report, baseline data validation was
performed under the auspices of the SMO as described in the ER Project Quality Assurance
Project Plan Requirements for Sampling and Analysis (QAPP) (LANL 1996, 1292). The product
of this process is a validation report, including data qualifiers that designate potential
deficiencies for affected results. Each data qualifier is accompanied by a reason code that
provides information about how the deficiency might impact data use. Data qualifiers assigned
by baseline validation, together with their reason codes, are also recorded in FIMAD. The
validation report is used in the decision-making process, and it may also be used to direct a
focused validation for evaluating the usability of the data of interest.
Data may be qualified for a variety of reasons during the baseline validation process, each of
which may or may not limit the use of data for a specific purpose. It is important to recognize
that qualified data (i.e., a result together with its assigned data qualifiers) generally have great
utility. The baseline validation procedure is designed to provide information about the reason
the qualifier has been applied and what its potential impact is on the affected data. The object
is not to reject data but rather to ensure that its merit is understood and that the data are used
appropriately. The use of qualified data in this report is consistent with EPA guidance
(EPA 1992, 1166) and is further discussed in Section 4.0.
Data qualifiers used in the LANL ER Project baseline validation process are defined in
Table 3.1.2-1.
TABLE 3.1.2-1
DEFINITION OF DATA QUALIFIERS ASSIGNED DURING BASELINE VALIDATION
u Analyte was not detected above the reported EQL.
J Analyte was positively identified, but the result is estimated to be more uncertain than would normally be expected for that analysis.
w Analyte was not detected; the associated value is an estimate of the detection limit or quantitation limit.
J+ Analyte was positively identified, result is likely biased high.
J- Analyte was positively identified, result is likely biased low.
p Professional judgment should be applied, depending on proposed use of the data.
PM Professional judgment should be applied prior to using the data. Manual review of the raw data is recommended.
R Sample results are rejected due to serious deficiencies in the ability to analyze the sample and meet QC criteria. Any results qualified as "R" should be further evaluated for relevance for data use. Thus "R" implies "PM".
RPM Sample results should not be used without further review of the raw data.
A Missing required QC data, or QC results not available to the baseline validator.
TA-16 RFI Report 15 September 29, 1997

RFI Report
Focused validation was performed on several data packages as a follow up to the baseline
validation. The purpose of a focused validation is to determine the adequacy of reported results
for their intended use when
• the data have been qualified as deficient or as requiring professional judgment during the
verification/baseline validation process, or
• the data quality assessment process requires additional information about the variability or
uncertainty of the reported data or data quality prior to making a data use decision.
Results of the data quality assessment process, including a review of baseline and focused
validation results, are presented in Chapter 4 of this RFI report. Qualifiers assigned by baseline
and focused validation are shown in the analytical results tables included in Chapter 5 of this
RFI report. Summaries of data quality evaluations and focused validation of analytical data
relevant to this RFI report are given in Appendix B.
3.2 Process for Identification of COPCs
3.2.1 Inorganic Chemicals
Detected inorganic chemicals are compared with natural background distributions to determine
if they should be retained as COPCs or eliminated from further consideration. Background
comparison geochemistry issues, field identification of soil horizons, and statistical tests for
background comparisons are discussed by Ryti et al. (1996, 1298}. The inorganic background
data used in this RFI report are from that document. The most recent screening values for use
in the "hot measurement comparison" (Ryti et al, 1996, 1298} were used. The UTLs are updated
as more background information becomes available; the current values are available in FIMAD.
The "all horizons" background soil screening values were used for soil samples because the
soil master horizon could not be identified in the disturbed material sampled for the investigations
described herein.
In this report, comparisons between site data and background data are performed by comparing
each observed concentration datum with a chemical-specific background screening value that
is either an upper tolerance limit (UTL) or the maximum reported concentration in the
background data sets. The maximum reported concentration is used only for chemicals that
are reported as undetected in most background samples (including mercury, antimony,
cadmium, and selenium). The derivation of these background screening levels is discussed by
September 29, 1997 16 TA-16 RFI Report

RFI Report
Ryti et al. (1996, 1298}. Inorganic chemicals below these background screening levels are not
reported in the Chapter 5 data tables. In the case of analytes that were never detected in
background samples (such as silver}, all detected results are considered to be above
background and are reported in Chapter 5.
The "all horizons" background soil screening values were used for soil samples. The underlying
tuff unit for the sampled locations at TA-16 is Bandelier Tuff Unit 4, also known as Qbt4. The
Qbt4 soil screening values were used for tuff samples. This Qbt4 UTL was calculated with
significantly fewer samples and has not been calculated for the complete metals suite. Those
samples collected at the soil/tuff interface were typically compared to tuff UTLs because
generally those UTLs are more conservative.
3.2.2 Radionuclides
Comparing reported radiochemical results with minimum detectable activities and background
data is necessary to determine the presence of radionuclides and to distinguish concentrations
of radionuclides associated with Laboratory operations from those attributable to global fallout
or to naturally occurring radionuclides and those used as indicators of the quality of the
radiological measurement process. Determination of detection status by comparison with
minimum detectable activities and other criteria is discussed in Section 4.2.
Detected radio nuclides are retained as COPCs or eliminated from further consideration based
on a comparison with natural or anthropogenic background distributions. Methods for these
comparisons together with radionuclide background data are provided in (Environmental
Restoration Decision Support Council and Earth Science Council1997, 1414} and reviewed in
Chapter 4. Sources of background data cited in that document include Longmire et al.
(1995, 1266} and Fresquez et al. (1996, 1360}.
In this report, comparisons between site data and background data are performed by comparing
each observed concentration datum with a radionuclide-specific background screening value
calculated as an upper tolerance limit (UTL} for the background data. Radionuclides detected
below these background screening levels are not reported in the Chapter 5 data tables. In the
case of radionuclides for which there are no applicable background data and no other guidance
(as defined in Section 4.2), all detected results are considered to be above background and are
reported in Chapter 5.
TA-16 RFI Report 17 September 29, 1997

RFI Report
3.2.3 Organic Chemicals
Background data are not available for organic chemicals. Organic chemicals positively
identified in one or more samples have been carried forward to the screening assessment
process for the PRSs in this RFI report. Chemicals not detected in any sample have been
removed from further consideration.
Based on previous investigations conducted by the ER Project, polycyclic aromatic hydrocarbons
(PAHs) have been detected at multiple PRSs across the Laboratory and its surrounding area.
In most cases, the presence of PAHs is not related to historical PRS operations, but rather is
attributable to non-PRS activities such as run-off from asphalt roads, parking lots, or roofs;
combustion of fossil fuels; or forest fires (ATSDR 1995, 55663; Bradley et al. 1994, 1144;
Edwards 1983, 55636). Potential site contaminants were evaluated prior to conducting risk
based screening assessment (Section 3.2.4}, and the identification of potential contaminants
took into consideration the frequency, magnitude and location at which these chemicals were
detected and the presence of obvious, non-PAS-related sources. Only those chemicals
believed or suspected to be attributable to a PAS-associated release are carried forward in the
screening assessment.
3.2.4 Risk-Based Screening Assessment
Inorganic chemicals and radionuclides that exceed background and organic chemicals positively
identified in one or more samples and believed or suspected to be attributable to a
PAS-associated release require further evaluation if they also exceed SALs. SALs for
nonradioactive chemicals are based on EPA Region 9 preliminary remediation goals (PRGs)
for residential soil, and are applied to soil and shallow tuff samples in this report. The decision
to identify a chemical as a COPC when a SAL is not available is made on a case-by-case basis,
taking into account the availability of process knowledge and toxicological information.
If more than one COPC is present at the site, the potential for additive effects of chemicals
present below SALs must be considered. In this report, the method for performing an MCE
summarized in the policy document Risk-Based Corrective Action Process (Dorries 1996,
1297} is followed. These comparisons are the last quantitative steps in the screening assessment
process for human health concerns. If COPCs remain after this step, then further evaluation
is required. If no COPCs remain after this step and the data set is sufficient to support the
decision, an NFA recommendation may be proposed based on human health concerns.
September 29, 1997 18 TA-16 RF/ Report
, I

RFI Report
If COPCs remain after the screening assessment, several options exist for the PRS. A further
site-specific evaluation may lead to eliminating a COPC without going into a formal risk
assessment. The site may be proposed for further sampling to more completely characterize
the site or for remediation if it is cost effective to proceed without a risk assessment. A risk
assessment may be conducted to determine if the remaining COPCs present an unacceptable
human health risk. For the sites considered in this report for which COPCs have been
identified, the first of these options has been selected.
3.3 Human Health Assessment
3.3.1 Risk Due to Background
Background risks can result from inorganics that are naturally occurring at a site. Calculation
of background risks using the same methodology as site risk estimates provides a frame of
reference for risk levels calculated at a site. This information provides a basis for determining •
risk-based remediation goals, which in some circumstances may be set at target risks
comparable to background rather than default values (i.e., cancer risk of 1 E-6 or hazard index
of 1 ). Background risks can also affect decisions at sites that have constituents for which there
is a threshold of toxicity. For some inorganics, background intakes may be near a toxicity
threshold such that incremental intakes associated with contamination may be unacceptable.
Background risks calculated here use the same exposure assumptions by which SALs are
calculated. SALs are based on health-protective assumptions for a residential scenario
(EPA 1995, 1307}. For soil exposure, the pathways include incidental soil ingestion, inhalation
of resuspended dust, and dermal contact with soil. Because background soil data represent
geographically diverse locations, background risks are estimated for both a median concentration
and the UTL from the entire background data set to present the range of potential risk
associated with different soil constituent concentrations found in and around Los Alamos. The
background risks based on the SAL residential exposure model are provided in Table 3.4.1-1.
Risks due to background concentrations are presented for both noncarcinogenic and
carcinogenic outcomes. The potential for adverse noncarcinogenic health effects is estimated
by a hazard quotient. Intakes leading to a hazard quotient less than 1 are not associated with
adverse health effects. None of the median background concentrations result in hazard
quotients greater than 1. The hazard quotient of the UTL concentration for manganese exceeds
1 (1.9}. However, given the unlikely occurrence of this concentration, the conservative
assumptions in the exposure assessment, the margin of safety in the reference dose, and the
TA-16 RFI Report 19 September 29, 1997

RFI Report
TABLE 3.4.1-1
RISK DUE TO BACKGROUND CONCENTRATIONS OF SOIL INORGANIC$ ASSUMING A RESIDENTIAL SCENARI08
SOIL SOIL CONCENTRATION INORGANIC (mg/kg) HAZARD QUOTIENT LIFETIME CANCER RISK
Median UTL Median UTL Median UTL
Aluminum 10000 38700 0.13 0.5 ncb nc
Antimony 0.6 1.0 0.019 0.032 nc nc
Arsenic 4.0 7.82 0.18 0.36 1.2E-5 2.4E-5
Barium 130 315 0.025 0.059 nc nc
Beryllium 0.895 1.95 0.0027 0.0059 6.4E-6 1.4E-5
Cadmiumc 0.20 2.7 0.0053 0.071 1.4E-10 1.9E-9
Chromiumd 7.2 16.1 0.00009 0.0002 nc nc
Cobalt 6.0 19.2 0.0013 0.0042 nc nc
Copper 5.75 30.7 0.0021 0.011 nc nc
Lead 12 23.3 0.03 0.058 nc nc
Manganese 320 714 0.84 1.9 nc nc
Mercury 0.05 0.1 0.0022 0.0043 nc nc
Nickel 7.0 15.2 0.0047 0.01 nc nc
Selenium 0.3 1.7 0.00078 0.0045 nc nc
Thallium 0.2 1.0 0.033 0.16 nc nc
Uranium 0.9 1.87 0.0039 0.0081 nc nc
Vanadium 21 41.9 0.039 0.078 nc nc
Zinc 30.7 50.8 0.0013 0.0022 nc nc
a Risk estimates are based on reference doses, slope factors, and EPA Region 9 default exposure assumptions effective in April 1996.
b nc = noncarcinogen c Cancer risks for cadmium are based solely on inhalation of resuspended dust. d Naturally occurring chromium is assumed to exist in a trivalent state.
September 29, 1997 20 TA-16 RFI Report
'I

RFI Report
exceedance of less than a factor of two, this intake estimate is not expected to be associated
with adverse health effects.
Four of the background inorganics provided in Table 3.4.1-1 are also carcinogens. According
to the default exposure assumptions used for SALs, the lifetime cancer risks due to background
residential soil exposure are estimated at 1 to 2 in 100 000 for arsenic and beryllium.
These background risk estimates provide a frame of reference for a risk-based screening
assessment and site decisions. If a site-specific risk assessment is necessary to further
evaluate risks, background risks can also be calculated using the site/scenario-specific
assumptions to assist in the remedial action decisions for the site.
3.3.2 Risk Assessment
No quantitative site-specific human health risk assessments were performed for these PASs.
In several cases, site data were compared to industrial preliminary remediation goals in
qualitative risk assessments.
3.4 Ecological Assessment
In cooperation with the New Mexico Environment Department (NMED) and EPA Region 6, the
Laboratory ER Project is developing an approach for ecological risk assessment. Further
discussion of ecological risk assessment methodology will be deferred until the ecological
exposure unit methodology being developed has been approved. When completed, the
ecological risk assessment will be provided as an attachment.
4.0 RESULTS OF QUALITY ASSURANCE/QUALITY CONTROL ACTIVITIES
This section reviews the impact on data usability of laboratory quality control (QC) results
summarized in Appendix B of this report, as well as results from field QA samples and the
overall performance of the HE field screening methods.
A total of 90 laboratory samples are associated with the twelve PASs included in this report.
With the exception of one follow-up sample for PRS 16-006{c) collected in 1996 and 4 samples
for PRS 16-028{a) collected in 1997, all were collected in the 1995 field season and analyzed
by a single contract laboratory. The 90 samples discussed in this report were batched together
with 121 other samples collected by Field Unit 3 during the same time periods, so some of the
laboratory QC results (in particular, matrix spikes and duplicate analyses) may have been
obtained from samples that are not discussed in this report. Such results are considered
TA-16 RFI Report 21 September 29, 1997

RFI Report
relevant for the analyses of samples in the same analytical batches, and are included in the
reviews of this Chapter and Appendix B.
Twelve field duplicate pairs of samples and two PE samples were collected during the 1995
field season and submitted with the other samples discussed in this report. Field duplicates of
surface samples were collocated with the original samples (type CO in Table 4.0-1 }, while field
duplicates of subsurface samples were splits collected after the sample material was
homogenized in a aluminum bowl (SP). Two rinsate samples (type EB) were collected at the
end of the season. While not all of the samples listed in Table 4.0-1 are associated with the
PASs discussed in this report, all were collected by the same field teams in the same field
season. Thus the results may be used to assess problems, if any, associated with the
collection, handling and shipping of the samples considered in this report.
LANL quality control (QC) requirements for all routine sample analyses performed by external
subcontractor laboratories are given in the Environmental Restoration Project analytical
services statement of work (SOW) (LANL 1995, 1278}. For routine organic and inorganic
SAMPLE
0316-95-0259
0316-95-0504
0316-95-2000
0316-95-2001
0316-95-2010
0316-95-2011
0316-95-2012
0316-95-2013
0316-95-2014
0316-95-2015
0316-95-2016
0316-95-2017
0316-95-2018
0316-95-2019
0316-95-2020
0316-95-2021
a NA = Not Applicable b See text
September 29, 1997
TABLE 4.0-1
1995 FIELD QA SAMPLES AT TA-16
TYPEb LOCATION PRS
co 16-1587 16-003(a)
SP 16-2166 16-02602)
PE NAa NA
PE NA NA
SP 16-1526 16-021(a)
co 16-1456 16-026(b)
co 16-1382 16-021 (c)
co 16-1383 16-021 (c)
SP 16-1453 16-026(b)
SP 16-1379 16-021 (c)
SP 16-1582 16-020
co 16-2167 16-01 O(a)
SP 16-1290 16-01 O(k)
SP 16-1236 16-010(m)
EB NA NA
EB NA NA
22
RELATED SAMPLE
0316-95-0256
0316-95-0502
NA
NA
0316-95-021 0
0316-95-0118
0316-95-0030
0316-95-0031
0316-95-0111
0316-95-0044
0316-95-0483
0316-95-0392
0316-95-0378
0316-95-0380
split spoon samples
hand auger samples
TA-16 RFI Report

RFI Report
analyses, the LANL requirements are based either on requirements contained in the EPA
Contract Laboratory Program (CLP) SOW or guidance provided in the EPA SW-846 procedures.
LANL requirements for the routine radiochemical analyses have been adapted from the EPA
requirements for organic and inorganic analyses. Batch-specific QC samples, such as blank,
matrix spike, and duplicate samples, must be analyzed at a frequency of one QC sample for
each instrumental method, each sample matrix, and/or each analytical batch, whichever is
more frequent. The inorganic and radiochemical methods also require the analysis of a
laboratory control sample with each analytical batch. Known amounts of surrogates are added
to most organic analyses, and their recovery during analysis provides a sample-specific QC
measure. The LANL requirements for the frequency of non-batch specific QC procedures and
samples, such as initial calibration and continuing calibration verification, adhere to EPA
requirements for each specific organic and inorganic instrumental technique.
In addition to reporting results for QC samples and other QC procedures, analytical laboratories
routinely supply qualifier codes with their results indicating which results may be affected by
problems indicated by out-of-control QC results. These laboratory qualifiers, included in
FIMAD, are to be distinguished from data qualifiers added by baseline or focused validation,
which are discussed below. Batch-specific QC indicators (e.g., results for duplicate, blank,
spike and laboratory control samples), surrogate and tracer recoveries, and laboratory
qualifiers are also available in FIMAD. Non batch-specific QC indicators are not provided
electronically in LANL's current electronic deliverable but are discussed below.
All of the data discussed in this report have also undergone baseline validation by data
validators, who have access to all of the QA/QC indicators reported by the analytical laboratories
including non batch-specific indicators such as initial and continuing calibration results. Where
these indicators suggest that a result is of less than expected accuracy or precision, this is
communicated to the data user both in hard copy validation reports and also by the assignment
of data qualifiers which are recorded in FIMAD. Table 3.1.2-1 provides definitions of the data
qualifiers used. As discussed in Section 3.1.2, the purpose of data qualification is not to reject
data but rather to ensure that its merit is understood and that the data are used appropriately.
"U", meaning that the analyte was analyzed for but not detected, is the most common laboratory
qualifier. For the sake of efficiency, baseline validators do not copy a laboratory "U" qualifier
into the data qualifier field in FIMAD. If they agree with the laboratory "U", they leave the data
qualifier field blank. Therefore, where the data qualifier field is empty and the laboratory
qualifier is "U", the result is accepted as a non-detect.
TA-16 RFI Report 23 September 29, 1997

RFI Report
After "U", the most commonly occurring laboratory and data qualifier is "J", indicating that the
result is "estimated" (see Table 3.1.2-1 ). While there are other reasons why a result may be "J"
qualified, by far the most common one is that the result lies between the instrument detection
limit (IDL) and the estimated quantitation limit (EQL). Below the EQL, quantitation is less
precise than above the EQL. Thus the "J" qualifier most often indicates that a chemical has
been detected, but at levels so low that it cannot be well quantified. This is not an indication
of any deficiency in the data beyond the limitations inherent in the analytical method.
"J"-qualified results are used freely in this report. Where the "J" qualifier has been assigned for
some other reason, that is noted in Appendix B.
Where baseline validation or preliminary review of the data has indicated a need, additional
focused data validation has been performed on some of the data discussed in this report. The
purpose of focused data validation is specifically to assess the implications (if any) of identified
deficiencies in the data for the decisions considered in this report. The results of focused data
validation and consequent modifications to the data qualifiers assigned by the baseline
validators are discussed in detail in the following subsections.
4.1 Inorganic Analyses
A total of 90 samples were submitted for inorganic analyses, including cyanide for four of the
samples. Batch-specific QC samples include at least one matrix spike and duplicate analysis
per batch (for which material from one of the customer's samples is used), plus preparation
blanks and in some cases laboratory control samples prepared by the analytical laboratory.
QA/QC results for these analytical requests are summarized in Appendix B, Table B-3. The
methods used were adequate to detect all analytes at concentrations below their screening
action levels, and most within background concentration levels. The QA/QC results were
satisfactory for most requests. Exceptions are itemized in Table B-3 and further discussed
below. Overall the data are judged to be of adequate quality for the uses to which it is put in
Chapter 5 of this report. The remainder of this subsection discusses the results of focused
validation and problematic areas in more detail.
Inorganic chemicals that are not readily detected at background concentrations by the methods
used are antimony, cadmium, mercury, selenium, silver and thallium. Other chemicals which
cannot be well quantified over at least part of their background range are beryllium, nickel,
cobalt and sodium. When not reported as undetected, these chemicals are frequently qualified
as "B" (estimated) by the analytical laboratory. Another common baseline data qualifier in
these cases is "P", often applied because the duplicate analysis was not within control limits
September 29, 1997 24 TA-16 RFI Report
, I

RFI Report
(indicated by a laboratory qualifier of "*"). Duplicate recoveries outside control limits are not
surprising when the chemical is present at background concentrations and these background
levels are near the detection limit for the analytical methods. These "P" qualifiers have been
replaced by "J" during focused validation. In general, these "J" qualifiers do not seriously
impact the usability of the data because the "estimated" results are well within background
levels. The few exceptions are evaluated in site-specific context in Chapter 5.
Low spike recoveries for chromium and lead were reported in request 924, which included
samples from PRSs 16-026(v) and 16-030(g). Chromium was identified above background in
PRSs 16-026(v) and 16-030(g), but in no case was it greater than 20% of its SAL. Lead was
identified above background in PRS 16-026(v), with a maximum value of 25% of SAL in one of
the samples from request 924, and above SAL in 16-030(g) in a sample that did not come from
request 924.
Low spike recoveries for chromium in request 1392 also led to some results for PRSs 16-026(v)
and 16-028(a) being qualified as "J-". However, there is no evidence for a release of chromium
at PRS 16-028(a), which also includes 4 samples analyzed in another request. Results for PRS
16-028(a) samples in request 1392 are uniformly below 4 mg/kg.
Mercury was detected in the blank sample for request 981, which included one sample from
PRS 16-026(v). Mercury was reported at the quantitation level, 0.1 mg/kg, in this sample; this
result was "U" qualified by baseline validation because of the blank contamination. However,
mercury was detected at levels of up to 9.2 mg/kg in other samples from this PRS.
Relative standard deviations (RSDs) for inorganic chemicals, as measured by field duplicates
and collocated samples, were generally less than 10%, indicating that local heterogeneity and
sample collection and handling procedures did not contribute significantly to variability in the
results. (RSDs up to 20% in laboratory duplicates are considered acceptable for most inorganic
analytes, and field duplicates can be expected to be more variable than laboratory duplicates.)
Iron, magnesium, and zinc were below performance acceptance limits for PE sample
0316-95-2000, whereas antimony, not one of the spiked chemicals, was reported at
11.4 mg/kg. None of these chemicals have been noted as problems at TA-16, however.
Mercury was reported about 25% above the upper performance acceptance limit for PE sample
0316-95-2001. This may indicate that mercury observations of 0.09 to 0.17 mg/kg in four
samples from PRS 16-006(c), which were included in the same laboratory batch, are spurious
results. Mercury was not detected in any of the remaining five samples from PRS 16-006(c).
Mercury was also reported as estimated at 0.07 mg/kg (below the EQL) in PRS 11-012(b)
TA-16 RFI Report 25 September 29, 1997

RFI Report
sample 0311-95-0014 from this batch, a result which is considered spurious and not reported in Chapter 5.
Calcium, iron, and sodium were reported in both rinsate samples at estimated quantities up to 309 ug/1 for calcium in the hand-auger rinsate (0316-95-2021 ). In the split-spoon rinsate sample (0316-95-2020), 2.1 ug/1 of lead was reported, and 34.1 ug/1 of zinc was reported in the hand-auger rinsate sample. Imperfect decontamination may have caused slight upward bias in inorganic results for some samples.
4.2 Radiochemical Analyses
A total of 22 of the field samples discussed in this report were analyzed for total uranium, and 16 for other radionuclides by gamma spectroscopy. Batch-specific QC samples for isotopic
analyses usually include a duplicate analysis using material from one of the customer's samples and a preparation blank prepared by the analytical laboratory. Batch-specific QC for
total uranium is similar to that used for inorganic analyses.
The methods used were adequate to detect all analytes implicated by historical information
below their screening action levels and most within background concentration levels. Baseline validation identified no problems with any of these analyses. Overall the data are judged to be of adequate quality for the decisions in Chapter 5 of this report.
All uranium results but one were below the UTLs for soil and tuff (Qbt4) samples prepared for analysis by a total digestion method such as was used for these samples. The only gamma spectroscopy analytes detected were K-40 and Cs-137. Potassium-40 is naturally present in geologic materials, and is used solely as a radiological process indicator (Environmental
Restoration Decision Support Council and Earth Science Council 1997, 1414). Cesium-137 was detected in four samples near the rim of the canyon below outfall PRS 16-006(c), but the reported results for these surface samples were below the background screening level of 1.65 pCi/g, which represents a regional background level due to atmospheric testing in the 1960s.
The relative standard deviations for eight field duplicate pairs measured for total uranium were less than 15%, indicating that local heterogeneity and sample collection and handling procedures did not significantly increase variability in the results.
In the split-spoon rinsate sample (0316-95-2020), 58.4 ug/1 of total uranium was reported. Imperfect decontamination may have caused slight upward bias in total uranium results for some samples.
September 29, 1997 26 TA-16 RF/ Report
, 'I

RFI Report
One rinsate sample was analyzed by gamma spectroscopy. This sample did not contain radionuclide contamination.
4.3 Organic Analyses
A total of 85 of the field samples discussed in this report were analyzed for SVOCs, and 39 were
analyzed for VOCs. Of the 77 samples analyzed for high explosives, 20 were analyzed for TATB, PETN, nitroguanidine, and nitroglycerin, in addition to the standard HE suite. Qualifications placed on these results by routine data validation are summarized in Appendix B, Tables B-2, B-4, and B-6, of this report.
Volatiles: Laboratory QC samples for volatiles typically include duplicate and matrix spike analyses performed on sample material provided by the customer, and blank and blank spike analyses on samples prepared by the laboratory. Sample-specific indicators-surrogates and internal standards-are also used.
Blank contamination by common laboratory contaminants such as methylene chloride and
acetone was noted in the majority of the data packages. Other problems were more sporadic and, overall, did not affect the data used for decision making as described in Chapter 5. The extensive problems mentioned in connection with request number 1391 in Table B-6 are all associated with samples from PRS 16-020, which is not included in this report. Volatile contamination was not a problem for any of the TA-16 PRSs investigated.
Request number 249 listed 1 ,2,3-trichloropropane as detected in sample 0316-95-0213,
associated with PRS-16-021 (a). Focused validation showed no analytical evidence of 1 ,2,3-trichloropropane in the raw data for this sample. The error is being corrected by the laboratory and the electronic information in FIMAD will be altered to show this correction.
Few volatile organic compounds were detected in the field duplicate pairs, but those that were reported (primarily acetone, trichlorofluoromethane, and p-lsopropyltoluene) had RSDs of less than 20%, indicating that local heterogeneity, and sample collection and handling procedures did not significantly increase variability in the results.
No volatile organic compounds were detected in the two rinsate samples.
Semivolatiles: Laboratory QC samples for volatiles typically include duplicate and matrix spike
analyses performed on sample material provided by the customer, and blank and blank spike analyses on samples prepared by the laboratory. Sample-specific indicators-surrogates and internal standards-are also used.
TA-16 RFI Report 27 September 29, 1997

RFI Report
Phthalate contamination of method blanks was noted in many of the data packages. Phthalates
are also common in the environment, at low levels.
The semivolatile data for PRS 16-01 O(a} samples 0316-97-0383 through -0390 from request
1154 were rejected because holding times were missed by 35 days. However, no semivolatile
compounds apart from a phthalate were detected in any sample from this PRS, including five
for which the analyses were accepted. Phthalate contamination was reported in the associated
method blanks.
PAHs, which were detected in up to five field duplicate pairs, were replicated in such pairs to
within 30% (and on average within 10% to 15%). Variability of this magnitude, whether due to
local heterogeneity in the soil or to other aspects of the sampling and analysis process, does
not significantly affect the usability of the data when results are far below SALs. In other cases,
decisions were based on a set of measurements from a site that vary by two orders of
magnitude. Relative to this level of variability within a PRS or exposure unit, the observed
differences between field duplicate results were insignificant.
Benzo(b)fluoranthene was incorrectly reported as benzo(k)fluoranthene in PE sample
0316-95-2000. As the former compound is more toxic than the latter, this type of error could
lead to false negative conclusions at a site. However, the PAHs at TA-16 are invariably found
in groups, including several with SALs as low or lower than that of benzo(b)fluoranthene. Risk
at these sites is usually driven by benzo(a)pyrene, which was reported within performance
acceptance limits in both PE samples. All compounds were within performance acceptance
limits in the other PE sample, 0316-95-2001, although, as reported in Table B-4, this sample
had to be diluted and reanalyzed due to the presence of compounds at levels outside the
calibration range.
No semivolatile organic compounds were detected in the two rinsate samples, apart from
bis(2-ethylhexyl)phthalate at low levels that may have been associated with blank contamination.
However, surrogate recoveries were low for the split-spoon rinsate (0316-95-2020), and non
detected values are qualified "RPM" (Table 8-4, request number 1436.) These rinsate data
were not used for decision purposes.
High Explosives: Laboratory QC samples for volatiles typically include a duplicate analysis
performed on sample material provided by the customer, and analyses of blank and spiked
samples prepared by the laboratory. Matrix spikes are also included in the standard
HE analyses, but not in the extended suite. Sample-specific indicators-surrogates and internal
standards-are also used. Laboratory control samples are not required and their absence,
September 29, 1997 28 TA-16 RFI Report

RFI Report
although noted in many cases by the baseline data validators (see Appendix B), is not
considered a deficiency.
Many of the HE results were qualified "P" or "PM" (i.e., professional judgment should be applied
prior to using the data} by the baseline data validators. Most of the observed problems related
to the high levels of HE contamination in some of the samples batched with the samples
discussed in this report. Those samples required numerous dilutions and, in some cases,
special sample preparation techniques, which complicated the interpretation of the high
performance liquid chromatography (HPLC} chromatograms. Surrogate recoveries were
sometimes affected by the high concentrations of TNT and RDX (especially in confirmation
column results, where the surrogate elutes at almost the same time as RDX}. Quantitative
results for samples with low to moderate levels of HE, which includes all samples discussed
in this report, are considered valid.
The various forms of dinitrotoluene (DNT} were measured in field duplicate pairs with RSDs
ranging up to 40%, whereas HMX, RDX, and TNT had RSDs below 15%. This level of variability
could be a problem for 2,4-DNT, which has a very low SAL, but it is acceptable for HMX, RDX,
and TNT, which are the most significant HE contaminants at TA-16. Usually at least one of the
latter HE contaminants is present when 2,4-DNT is present at levels of concern, so that no
decisions will depend solely on unreliable measurements of 2,4-DNT.
Recoveries of 84% to 99% were obtained for five nitroaromatics in PE sample 0316-95-2001.
For sample 0316-95-2000, 89% recovery of the 2,4-DNT in a semi-volatile PE material was
reported and measured using the standard HE analytical procedure. Spurious RDX, TNT, and
tetryl hits on the second column (but not the primary column} were also reported for PE sample
0316-95-2000.
HMX and RDX were detected at less than 0.5 ug/1 in the hand-auger rinsate sample
(0316-95-2021 }, and TNT was detected at less than 0.25 ug/1 in both rinsate samples. Although
these levels of residual contamination would be unlikely to affect field results, they may
indicate that it is difficult to remove all traces of HE from sampling equipment. Therefore, HE
analyses could be biased high.
TA-16 RFI Report 29 September 29, 1997

RFI Report
5.0 SPECIFIC RESULTS, CONCLUSIONS, AND RECOMMENDATIONS
This report discusses the 1995 sampling and analysis for 12 potential release sites (PRSs)
located at Technical Area 16 (TA-16). Site information, results of analyses, evaluation of
contamination, and human-health no further action (NFA) recommendations for these PRSs
are presented in this section. Table 5.0-1 summarizes the PRSs. Figure 5.0-1 shows PRS
locations.
TABLE 5.0-1
PRSs IN THIS TA-16 REPORT
SECTION PRSID LOCATION PRS TYPE RECOMMENDATION
5.1 11-012(a,b) TA-11 Magazine foo!Qrints NFA, Criterion 5 5.2 13-003 a TA-16-340 Inactive septic tank NFA, Criterion 1 5.3 16-006 c) TA-16-370 SeQtic ~stem NFA, Criterion 5 5.4 16-006 d TA-16-380 Septic system NFA, Criterion 5 5.5 16-010 a Burning Ground Flash_Qad NFA, Criterion 5 5.6 16-021 a TA-16-450 Floor-drain outfall NFA, Criterion 5 5.7 16-026 c TA-16-305 HE sum_Q_ outfall NFA, Criterion 5 5.8 16-026 d TA-16-303 HE sump outfall NFA, Criterion 5 5.9 16-026 v TA-16-460 HE sum_Q_ outfall NFA, Criterion 5 5.10 16-028 a Burning Ground Drainage NFA, Criterion 5 5.11 16-030(q TA-16-380 HE sum_Q_ outfall NFA, Criterion 5
PRS in this report are proposed for human-health NFA based on two criteria:
• Criterion 1 "The site cannot be located or has been found not to exist, is a duplicate PRS,
or is located within and therefore, investigated as part of another PRS."
• Criterion 5 "The PRS has been characterized or remediated in accordance with current
applicable state or federal regulations, and the available data indicate that contaminants
pose an acceptable level of risk under current and projected future land use."
All PRS discussed in this report remain eligible for further characterization and cleanup based
on ecological risk, surface water concerns, or other regulatory criteria. None of the PRSs
described in this report are being proposed for removal from the HSWA Module.
Administrative procedure (AP) 4.5 Part 8 was filled out for all of the PRS presented in this
report during August 1997. PRS 16-026(v) and 16-028(a), which appear in this report, were
directly identified as high-priority sites for surface water issues. PRS 16-016{c), which is
down gradient from PRS 16-01 O(a), and PRS 16-003(m), which is the sump associated with
drainage 16-030{g), are high-priority PRSs for surface water that are associated with PRS
presented in this report.
September 29, 1997 30 TA-16 RFI Report

RFI Report
5.0.1 Constituents Without SALs
Constituents without adequate toxicological criteria to calculate SALs were detected at
multiple PRSs described in this report. The rationale for eliminating these constituents as
COPCs is provided in this section, rather than in the individual PRS write-ups.
5.0.1.1 Polynuclear Aromatic Hydrocarbons
A select group of polynuclear aromatic hydrocarbons (PAHs) without SALs were detected at
the PRSs presented in this report at low detection frequencies, and at low concentrations (low
parts per million). Infrequent detections of these compounds at low concentrations do not
represent a contamination problem posing a potential risk to human health or the environment.
SALs are not available for these compounds due to the absence of EPA-accepted toxicity
criteria to calculate screening values. In general, the potential impacts from the low
concentrations of these compounds is addressed during the evaluation of the PAHs that do
have toxicity criteria and SALs. The PAHs consist of a large family of compounds with a rather
large range of toxic potency. In calculating site risks, EPA and most state agencies separate
the PAH into two categories: carcinogens and noncarcinogens. Carcinogenic PAHs are
evaluated by considering the available data on the carcinogenic potency of different PAHs to
develop toxicity equivalency factors (TEFs) for the individual PAHs. These TEFs indicate the
carcinogenic potency of each compound relative to benzo(a)pyrene (BaP). Consequently, the
PAHs analyzed that do have SALs encompass a substantial portion of the risk due to low levels
of these compounds in soils.
The list of PAHs without SALs in this report includes benzo(g,h,i)perylene, a noncarcinogenic
PAH; phenanthrene, a noncarcinogenic PAHs very similar to pyrene; and 2-methylnaphthalene,
a noncarcinogenic PAH very similar to naphthlene. All of the non-carcinogenic PAHs have
SALs greater than 1000 mg/kg. The other non-carcinogenic PAHs without SALs are likely to
have SALs of equivalent magnitude. Because the PAHs without SALs were detected infrequently
and at concentrations that are orders of magnitude below SALs for similar compounds; the
evaluation of PAHs is considered to be complete after the evaluation of PAH with SALs
available.
5.0.1.2 2-Amino-4,6-dinitrotoluene and 4-Amino-2,6-dinitrotoluene
2-Amino-4,6-dinitrotoluene (2 ADNT) and 4-Amino-2,6-dinitrotoluene (4 ADNT) are microbial
reduction products of the nitro groups on the TNT molecule. Hence, they are frequently found
at low-levels in association with TNT contamination in soils. Neither 2-ADNT or 4-ADNT are
TA-16 RF/ Report 31 September 29, 1997

~ ~ tr ~ 1\) ~10 ...... ~ "'
~
~ I ......
Ol
:::0 ::!:! :::0 .g 0 ., -
\ // ,._,
!/ JSrATF ROAD 4 To ""'•~~~~~~~~~~~~
TA-29 (Magazine Area B)
430
Pressing
TA-28 (Magazine Area A)
Fig. 5.0-1. Location map of PRSs presented in this report.
HE Machining Burning
387 Ground
PAS 16-010(a) r'\P--=----386'~~~~390
-. §§9 1409 392
38~
~~ Raw Materials ~~ Processing
394 !02 )7 ~06 ~ PAS 16-028(a)
341 340 478
-~ r-===; _ ~ ~n TA-13 ~~PRs~;-oo3(a,b) (P-Site)
~J~531 r )~·532 HE Casting
Plastics
Incoming Shipments
Forming 372
0 500 1000 ft II I I I I II I " I I I I I I I I " cARTography by A. Kron
6113/93
~ ~ ~ c :::t

RF/ Report
used in the synthesis of organic compounds or as industrial products, and there has therefore been little interest in their toxic effects on humans or laboratory animals. The limited amount of data on these compounds suggest that they are less toxic than TNT (Layton et al. 1987, 15-16-447). The TNT SAL is 15 mg/kg. Both 2-ADNT and 4 ADNT are found at levels less than 0.3 mg/kg at all PRSs in this report. The presence of these constituents at these levels do not qualify them as COPCs, nor should the presence of these constituents at these levels
significantly affect an MCE.
5.0.1.3 Triaminotrinitrobenzene
Triaminotrinitrobenzene (TATB) is an insensitive high explosive that is extensively used in modern nuclear weapons systems. No toxicological criteria exist for this compound. However, due to its extreme insolubility-it is soluble only in sulfuric acid and a few other superacids (Gibbs and Popolato 1980, 15-16-369)-it is likely to be inert in the human digestive tract. It was not mutagenic when tested with five strains of Salmonella typhimurium and in Escherichia coli strain WP (Gibbs and Popolato 1980, 15-16-369). Hence, it is likely to present minimal risks to either human or ecological receptors.
5.0.1.4 Volatile Organic Compounds
P-isopropyl toluene was found at levels less than 0.020 mg/kg at one PRS presented in this report (PRS 16-021 (a)). P-isopropyltoluene is also known as p-Cymene. This compound is found in nearly 100 volatile oils including lemongrass, sage, thyme, coriander, and cinnamon (Lewis 1992 15-16-646). It is mildly toxic by ingestion (Lewis 1992 15-16-646}. It is likely that the presence of this compound is due to natural forest litter present at PRS 16-021 (a). It is not
likely that this compound presents a significant risk to human health at a level of 0.020 mg/kg.
5.1 PRSs 11-012(a,b)
PRSs 11-012(a,b) are the sites of former HE storage magazines TA-11-7 and TA-11-8, respectively. These PRSs are recommended for human-health NFA because no constituents were detected above SALs.
5.1.1 History
PRSs 11-012(a,b) are discussed in detail in Subsection 5.16 of the RFI Work Plan for OU 1082
(LANL 1993, 1 094). The magazines were built in 1944-5 and razed by intentional burning in 1960. Information regarding the plan for demolition is found in Penland (1959 15-16-255). High
TA-16 RFI Report 33 September 29, 1997

RFI Report
Explosives (HE), HE impurities, and HE degradation products were the potential contaminants
at these sites. Prior to removal, these magazines were determined to be HE-contaminated
(Penland 1959, 15-16-255). No other types of contamination were noted.
5.1.2 Description
These HE storage magazines were 9- x 11-ft wooden structures with earth berms on three
sides. They were located approximately 225 ft north of TA-16-370 in a level, semi-wooded
region that drains to the east (Figure 5.0-1 ). Evidence of the driveway that led to the magazines
is still visible. The current location of the soil used in the berms is not known.
5.1.3 Previous Investigations
No previous investigations have been performed at these sites.
5.1.4 Field Investigation
The goal of the Phase I investigation was to determine using biased sampling if any constituents
were at a level of concern. The sampling design was biased to detect contaminants by
collecting samples at locations most likely to be contaminated, according to the site conceptual
model. The use of these magazines only for storage of raw HE and finished HE product and the
mode of removal of the magazines by burning during decontamination and decommissioning
(D&D) activities suggested that residual contamination is extremely unlikely at these PRSs.
Therefore limited sampling was proposed to evaluate the presence or absence of contamination.
The site conceptual model for releases at the HE magazines is that contamination is most likely
to have occurred via spillage of HE on the floor of the magazine, followed by dispersal of that
HE to underlying soils either via leakage from cracks in the wood floors or via sweeping out the
doorways of the magazine. It is assumed that such solid-phase discharge would have resulted
in the highest constituent concentrations in near-surface soils (0-0.5 ft). Because these
structures have no plumbing and are located on level ground, it was hypothesized that little
hydrologic head that could have driven constituents into the subsurface would ever have been
present at these sites. Minor dispersal of contaminants to shallow depths(< 18 in.) may have
occurred during removal or grading of the berms surrounding the magazine. This conceptual
model guided sampling and screening locations. Field screening-particularly for the HE,
which are the principal constituents likely to be present at this site-was further used to bias
sample locations, based on this conceptual model. The intent was to submit samples with
positive screening results for laboratory analysis.
September 29, 1997 34 TA-16 RFI Report

RF/ Report
The sampling plan for these sites called for analysis of four surface soil samples, at 0 to 18 in.
depth, to be collected in the four quadrants of each PAS. Prior to sampling, this plan was
modified to collect four samples and field screen each. Samples that screened positive for HE
would be sent for analysis. In the absence of positive field screening, one randomly selected
sample would be sent for laboratory analysis. This deviation is consistent with approved
sampling plans for other similar HE magazines at TA-16 and was proposed verbally to the EPA
Region 6 representatives by the DOE and LANL, and in writing prior to sampling (Jansen and
Taylor 1995, 15-16-627).The EPA representative gave verbal concurrence to these changes.
Table 5.1.4-1 lists the samples analyzed at these PASs. Figure 5.1.4-1 shows the locations of
the screening and laboratory samples at these PASs.
TABLE 5.1.4-1
SUMMARY OF REQUEST NUMBERS FOR LABORATORY SAMPLES TAKEN AT PRSs 11-012{a,b)
\
DEPTH SAMPLE SAMPLE ID LOCATION ID PRS No. (ft) MATRIX SVOCs INORGs
0311-95-0012 11-0008 11-012(a) 1-1.5 Soil 1251a 1252
0311-95-0014 11-0010 11-012(b) 0.5-1 Soil 328 329
a. ER analytical request number
HE
1251
328
The PAS locations were determined based on the presence of gravel roadways and on
topographic indications of the presence of the former magazines.
Four screening samples to a depth of 1.5 ft were collected at each PAS with a hand auger.
These samples were field screened using the HE spot test kit, a sodium iodide detector, and
a PI D. The lower limit of detection for the HE spot test kit is 100 ppm. Since this detection limit
exceeds the SALs for most HE, these results can be used to bias the selection of samples for
laboratory analysis but not to qualify the site as uncontaminated. Positive screening results
from any of these three field methods would be used to bias the selection of samples for
laboratory analysis. The HE and radiation field measurements were negative for all samples.
Four of the eight samples had positive results with the PID. Table 5.1.4-2 identifies those
samples and their values. The samples with the highest PID readings from each PRS were
selected for laboratory analysis. It is important to note that PID is a generic analysis technique.
These instruments often give positive responses to naturally occurring soil gases. Laboratory
analysis of soil samples is necessary to distinguish between soil gas interferences and the
presence of contaminants.
TA-16 RFI Report 35 September 29, 1997

RFI Report
0
Fence
PRS boundary
Contour interval 10 ft
)( Sampling location
0014 Sample number-all sample numbers include the prefix "0311-95-." Sample numbers underlined are laboratol}' samples. Sample numbers not underlined are screening samples. Samples at individual core locations are shown from shallowest to deepest. Organics listed are detected.
25 50 75 It I I I I I I I I I I I I I I I I
Source: FIMAD ARC VIEW, 7/96 Modified by: cARTography by A. Kron 7/19/97
········ ...
'· ........ .
Fig. 5.1.4-1. Screening and laboratory sample locations at PASs 11-012(a,b).
September 29, 1997 36
'I
11-012(af ---9012 'o<V.~0.11
I .....-... I 0009 )()( I
' .· oo1'o '.~ ... _.
TA-16 RFI Report

RFI Report
TABLE 5.1.4-2
SUMMARY OF POSITIVE PID SCREENING RESULTS
SAMPLE 10 LOCATION 10 PRS NUMBER DEPTH (ft) RESULT (ppm)
0311-95-0009 11-0005 11-012(a) 0-1.5 8.0
0311-95-0011 11-0007 11-012(a) 0-1.5 1.5
0311-95-0012 11-0008 11-012(a) 1-1.5 15.0
0311-95-0014 11-0010 11-012(b) 0.5-1 5.0
Some minor deviations from field activities as described in the accepted work plan (LANL 1993,
1 094) were required during field sampling. The depth to tuff at some of the sampling locations
was less than that in the approved work plan. Additionally, cobbles and boulders at the site
interfered with sampling from the surface to the soil tuff interface with hand augers.
5.1.5 Evaluation of Inorganic Chemicals
lnorganics were not present at levels greater than UTLs at PRSs 11-012(a,b).
5.1.6 Evaluation of Radionuclides
Radionuclides were not analyzed for at PRSs 11-012(a,b) because historical evidence indicates
that radioactive material was not stored in HE magazines.
5.1.7 Evaluation of Organic Chemicals
No HE was detected at either of these two sites. Trace levels of organic constituents were
present above detection levels at PRS 11-012(b) only. Table 5.1.7-1 indicates the levels of the
constituents.
TA-16 RFI Report 37 September 29, 1997

RFI Report
TABLE 5.1.7-1
PRS 11-012(b) SOIL CONCENTRATIONS FOR DETECTED ORGANIC ANAL YTES
DEPTH BENZOIC ACID BIS-(2-ETHYLHEXYL) DI-N-BUTYL PHTHALATE
SAMPLE ID (ft) (mg/kg) PHTHALATE (mg/kg) (mg/kg)
SAL N/A 100 000 32 6500
EQL N/A 3.3 0.33 0.33
0311-95-0014 0.5-1 0.056 2.9 0.061
The levels of organic constituents detected were far below SALs and do not present a hazard
at this site. Di-n-butylphthalate and bis-(2-ethylhexyl} phthalate are common plasticizers. Bis
(2-ethylhexyl) phthalate was found in the blank. The concentration found in the sample was
greater than 10 times the value in the blank and it is therefore listed as present in the sample.
5.1.8 Risk-Based Screening Assessment
No chemicals were present at levels above SALs. Visual inspection of the data indicates that
multiple chemical evaluation (MCE) screening would yield a value far less than the target limit
of 1.
5.1.9 Human Health Risk Assessment
No human health risk assessment was performed for PASs 11-012(a,b) because there were no
constituents above SALs.
5.1.10 Preliminary Ecological Assessment
In cooperation with the New Mexico Environment Department (NMED) and EPA Region 6, the
Laboratory Environmental Restoration (ER) Project is developing an approach for ecological
risk assessment. Further ecological risk assessment at this site will be deferred until this site
can be assessed as part of the ecological exposure unit methodology currently being developed.
When completed, the ecological risk assessment will be provided as an attachment.
5.1.11 Conclusions and Recommendation
Each PAS was divided into quadrants and one sample was collected from each quadrant for
a total of eight samples for the two PASs. Of the three field screening techniques employed,
only PID gave positive results. The sample selected for laboratory analysis from each PRS was
September 29, 1997 38 TA-16 RFI Report

RFI Report
the sample with the highest PID measurement value. No inorganic or organic contamination
was found above SALs in these samples. No COPCs were identified. Based on these results,
there is no significant risk to human health at these sites. Because of the lack of hazardous
constituents, these PRSs are recommended for human-health NFA based on NFA Criterion 5.
5.2 PRSs 13-003(a,b)
PRS 13-003(a) is the septic tank associated with a septic system that also includes a leach field
(PRS 13-003[b]). PRS 13-003(a) is structure TA-16-486. These PRSs served TA-16-475 at
TA-13 (P-Site) during the 1940s and early 1950s. Potential Release Site 13-003(a) is proposed
for human-health NFA based upon NFA Criteria 1. PRS 13-003(b) has been partially investigated;
however, addtional sampling will be proposed in a future Phase II sampling and analysis plan.
5.2.1 History
PRSs 13-003(a,b) are discussed in detail in Subsection 5.4 of the RFI work plan (LANL
1993, 1 094).
This septic system served an office and shop building (TA-16-475) associated with implosion
and initiator testing. Engineering drawing ENG-C- 1641, sheet 1 of 7, shows that in 1944 the
building, which had a toilet, lavatory, and small darkroom, was southwest of the septic tank and
leach field. The discharge to this septic system is unknown, although a report states that either
HE or radionuclide contamination might be present in the subsurface soil near the septic
system (Buckland 1948, 15-13-011 ). Engineering drawing ENG-R-5111, sheet 2 of 7, indicates
removal of septic tank TA-16-486 and building TA-16-475 took place in 1951, but does not
indicate removal of the leach field. Building TA-16-475 will be investigated as C-16-049.
According to a 1944 construction drawing, ENG-C 1641, sheet 1 of 7, the leach field was
approximately 100ft northeast of the septic tank. The septic tank was located northeast of TA-
16-343. The PRS boundary was determined on the basis of this 1944 engineering drawing. The
entire area was leveled in the early 1950s when TA-16-340 and its associated structures were
built. Portions of TA-16-340 and its associated structures were built on top of the original
location of the septic tank. Potential contaminants at this site were identified as: HE, HE
degradation products and impurities, metals (particularly silver and barium), uranium, and
laboratory chemicals such as solvents.
TA-16 RFI Report 39 September 29, 1997

RFI Report
5.2.2 Description
The septic tank discharged to the leach field through 4-in. vitreous-clay tile. PRSs 13-003(a,b)
are located in a level and highly industrialized area near TA-16-340 (Figure 5.0-1).
5.2.3 Previous Investigations
No previous investigations have been performed at this site.
5.2.4 Field Investigation
The objective of Phase I sampling at this site was to determine via biased sampling if a release
had occurred from the septic system and drain line and if that release caused contamination
above action levels. The sampling design was biased to detect contaminants by collecting
samples at locations most likely to be contaminated, according to the site conceptual model.
The sampling and analysis plan was also designed to: (1) delineate any contamination above
action levels in both a vertical and downgradient directions to support cleanup activities; and
(2) provide sufficient data to support a preliminary risk assessment. If contamination did occur,
Phase I investigation would also identify all COPCs.
The site conceptual model for releases at this septic system is that the primary release
mechanism to the PRS is by discharge of constituents through the septic tank to the associated
leach field. Locations just below drainlines or drain tiles in the leach field and locations beneath
the drainfield at the soil-tuff interface were hypothesized to represent locales of maximum
potential contamination. It is assumed that discharge in such systems will result in the highest
constituent concentrations either at the proximal or distal ends of the leach field system. The
soil-tuff interface, a location of variation in hydrogeologic properties and a possible site of
interflow, is likely to be a zone of contaminant concentration. This conceptual model guided
selection of sampling and screening localities. Field screening was further used to bias sample
locations, based on this conceptual model.
The conceptual model for this septic system also assumed that the septic system, if it was not
entirely located beneath TA-16-340, could be located using geophysical methods or potholing.
Table 5.2.4-1 lists the samples analyzed at PRSs 13-003(a,b). Figure 5.2.4-1 shows the
locations of the screening and laboratory samples taken at in support of investigation at these
PRSs. As noted below, these samples may not have been taken within the septic system
because no evidence confirming the location of this system was found.
September 29, 1997 40 TA-16 RFI Report

TABLE 5.2.4-1
SUMMARY OF REQUEST NUMBERS FOR LABORATORY SAMPLES TAKEN AT PRSs 13-003(a,b)
LOCATION DEPTH SAMPLE SAMPLE ID ID (ft) MATRIX VOCs SVOCs INORGs HE
0313-95-0001 13-0001 1.5-2.5 Soil 1242a 1242 1243 1242
0313-95-0002 13-0001 3-4 Soil 1242 1242 1243 1242
a. ER analytical request number
RFI Report
URANIUM
1244
1244
The sampling plan for a septic system required two boreholes to be drilled at the proximal and
distal end of the leach field. Two ground penetrating radar (GPR) geophysical surveys were
conducted at this site to locate the drain lines. The survey identified subsurface anomalies at
a depth of 2.5 to 3.5 feet, but these signatures could be due either to the leach field or to utility
trenches in the area. Two drill holes were advanced at the distal end of the PRS and one hole
was advanced and the proximal end of the PRS. These locations did not provide evidence of
the leach field such as engineered fill. Drilling tools could not be safely advanced in other
locations due to the density of underground utilities.
Laboratory samples were collected from the deeper (6.5 ft) distal borehole. Split spoon
samplers were used to collect seven screening samples, two of which were sent for laboratory
analysis. Sample 0313-95-0001 was collected from the depth where the drain line was
expected to be located based on GPR surveys. Sample 0313-95-0002 was collected from the
interval containing the soil-tuff interface. These samples consist of one foot intervals of the soil
column instead of 6 inches as specified in the RFI work plan. This is because the smaller
samples yield insufficient material for the requested analytical suites. All samples were field
screened for HE with the spot test, for radiation with a sodium iodide detector, and for volatiles
with a PID. All field screening results were negative.
Because no other boreholes can be safely drilled in this area, further drilling cannot take place
at this site. Available technology was used to locate the drain lines and septic tank without
success. Analytical samples were collected from the location most likely to have intersected
the drain line. These limited analytical results are not sufficient for making an assessment of
the leach field PRS. Further investigations will require sampling via hand excavation, vacuum
removal of soil, and other less aggressive methods than drilling.
TA-16 RFI Report 41 September 29, 1997

~ iD 3
~ 1\) ~co ..... :g ....,
~
~ I .....
0'1
:::0 :!! :::0 .g 0 .., ....
... ·· ..
... ······->s<e
········· ..... .
,
, , , , , ,
:13-003( a, b)/ ' , ' , ·.. ' , ··... I I
··.. --• I
······... r .. r-' . : Septic Area•,· · · ...
I ·--, .--' I I
' I ' '
Fig. 5.2.4-1. Screening and laboratory sample locations at PRSs 13-003{a,b).
0 ®
·········
Permanent structure
Paved road
PRS boundary
Contour interval 2 ft
Borehole
Sampling location-borehole
0 50 100ft
Source: FIMAD ARC VIEW, 7/96 Modified by: cARTography by A. Kron 7/19/97
0001 Sample number-all sample numbers include the prefix "0311-95-." Sample numbers beginning with a 0 or 2 are laboratory samples. Sample numbers beginning wnh a 1 are screening samples. Samples at individual core locations are shown from shallowest to deepest.
~ ~ ~
c:::l :t

RFI Report
5.2.5 Evaluation of Inorganic Chemicals
lnorganics were not present at levels greater than UTLs at PRSs 13-003(a,b).
5.2.6 Evaluation of Radionuclides
Radionuclides were not present at levels near SALs or UTLs.
5.2.7 Evaluation of Organic Chemicals
Organic constituents were not present above detection levels at PRSs 13-003(a,b).
5.2.8 Risk-Based Screening Assessment
No COPCs were identified during the investigation.
5.2.9 Human Health Risk Assessment
No human health risk assessment was performed for PRSs 13-003(a,b) because there were no
constituents above SALs or UTLs.
5.2.10 Preliminary Ecological Assessment
In cooperation with the New Mexico Environment Department (NMED) and EPA Region 6, the
Laboratory Environmental Restoration (ER) Project is developing an approach for ecological
risk assessment. Further ecological risk assessment at this site will be deferred until this site
can be assessed as part of the ecological exposure unit methodology currently being developed.
When completed, the ecological risk assessment will be provided as an attachment.
5.2.11 Conclusions and Recommendation
PRSs 13-003(a,b) are located in a highly industrialized area. The most likely location of these
PRSs is in an area where significant soil disturbance would have occurred during the
construction of TA-16-340 and its associated utilities. The density of subsurface structures has
made sampling at this site very difficult. Ground penetrating radar was used to locate these
PRSs without success. Sampling was conducted at locations most likely to intersect the septic
system without damaging the active utilities in the leach field PRS. The leach field was not
located, based upon the results of the boreholes.
TA-16 RFI Report 43 September 29, 1997

RFI Report
The septic tank, PAS 13-003(a),has been removed according to engineering drawing ENG-A
5111, sheet 2 or 7, and the Engineering Structure list. No evidence of the leach field was found
during drilling. Consequently, PAS 13-003(a) is proposed for human-health NFA based upon
NFA criterion 1. The leach field, PAS 13-003(b), has not been located. Existing active utilities
prevent further drilling investigations without incurring unacceptable worker risks. LANL
cannot assure that this unit has been removed and that this unit has been adequately
investigated. A Phase II SAP for PAS 13-003(b), which proposes investigation using less
aggressive methods than drilling, will be provided.
5.3 PRS 16-00G(C)
PAS 16-006(c) comprises a septic tank, TA-16-371, and its associated 4-in. vitreous clay pipe
drainline and drainage (LANL 1990, 0145). This septic tank served TA-16-370, which was a
facility used for barium nitrate grinding and non-HE machining. Potential contaminants include
barium, volatile organics, and semivolatile organics originating from machining and barium
nitrate grinding activities in TA-16-370. It is recommended for human-health NFA because the
contamination present at the site is below human-health based levels of concern.
5.3.1 History
PAS 16-006(c) is discussed in detail in Subsection 5.4 of the AFt Work Plan (LANL 1993, 1 094).
Septic tank TA-16-371 was installed in 1953. It served six floor drains, three bathrooms, and
two sinks on the third floor of TA-16-370 (WX Outfall Drawing 13Y-192147). The septic tank is
currently used as a holding tank for water from floor drains and the third floor restrooms. It is
regularly pumped when the building is operational. Building T A-16-370 is currently inactive.
Potential contaminants at this site were identified as: HE, HE impurities and degradation
products, metals (particularly barium from barium nitrate grinding), uranium, and laboratory
chemicals such as solvents.
5.3.2 Description
PAS 16-006(c) is a 1 200-gal., reinforced-concrete septic tank located west of TA-16-370
(Figure 5.0-1 ). A 4-in. vitreous-clay pipe drain line empties to daylight at the rim of Water
Canyon approximately 260 ft south of the septic tank. The clay pipe drains to a soil/cobble
surface for a few feet before discharging into the canyon. The drainline is currently plugged at
the septic tank. It is not known when the drainline was plugged.
September 29, 1997 44 TA-16 RFI Report
, I

TABLE 5.3.4-1
SUMMARY OF REQUEST NUMBERS FOR LABORATORY SAMPLES TAKEN AT PRS 16-00G(c)
SAMPLE ID LOCATION ID DEPTH SAMPLE SVOCs VOCs RAD (ft) MATRIX
0316-95-0289 16-1615 2.5-4 Soil 1192a 1192 1194
0316-95-0290 16-1615 5-6 Qbt4 1192 1192 1194
0316-95-0291 16-1616 o-1 Soil 1251 1251 1253
0316-95-0292 16-1616 1-3.5 Qbt4 1251 1251 1253
0316-95-0293 16-1614 o-o.5 Soil 328 328 330
0316-95-0294 16-1614 0.5-Q.6 Soil 328 328 330
0316-95-0295 16-1612 o-o.5 Soil 328 328 330
0316-95-0296 16-1613 o-o.5 Soil 328 328 330
0316-96-0170 16-2640 o-o.5 Soil 2634 N/A N/A
a. ER analytical request number
5.3.5 Evaluation of Inorganic Chemicals
RFI Report
INORGs
1193
1193
1252
1252
329
329
329
329
2636
Barium was present in one location at a concentration greater than SAL (Table 5.3.5-1 ). All
other inorganics were at levels less than SALs. Samples 0316-95-0294 and -0295 showed
slightly elevated levels of mercury. The PE sample associated with this sample batch also had
an elevated value for mercury. This suggests that the mercury results are higher than the actual
concentrations due to an artifact in the analysis of the samples. In any event, these data are
well below the mercury SAL.
The furthest downgradient sample, 0316-96-0170, did not contain barium at a level above the
UTL. This was an extra sample beyond those prescribed in the RFI work plan. It was designed
to bound the barium contamination in the downgradient direction. Manganese, chromium, and
aluminum were P-qualified due to poor duplicate results. These data should be considered
estimated. With the exception of chromium, these constituents are not known to be potential
TA-16 RFI Report 47 September 29, 1997

RFI Report
1746 : 1748 1749
.. ..
............. 14so·· .···
0289-SVOCs, PAHs, VOCs : i-.'"--.• ~~~~ariu~. chromium, cop~ J
lead, nickel, vanadium, zinc, · y · SVOCs, VOCs .··
1752 1753
Fig. 5.3.4-1. Sample locations for PRS 16-006(c).
September 29, 1997 48
Permanent structure
Paved road
PRS boundary
Contour interval 2 ft
@ Sampling locationborehole
)( Sampling location
0289 Sample number-all sample numbers include the prefix "0316-95-.' Sample numbers beginning wtth a 0 or 2 are laboratory samples. Sample numbers beginning with a 1 are screening samples. Samples at individual core locations shown from shallowest to deepest. Metals listed are above LANL UTLs; organics listed are detected; analytes underlined are above SAL.
TA-16 RFI Report

RFI Report
5.3.3 Previous Investigations
No previous investigations have been performed at this site.
5.3.4 Field Investigation
The objective of Phase I sampling at this site was to determine via biased sampling if a release
had occurred from the septic system and drain line outfall and if that release caused contamination above action levels. The sampling design was biased to detect contaminants by collecting samples at locations most likely to be contaminated, according to the site conceptual model. The sampling and analysis plan was also designed to: 1) delineate any contamination above action levels in both a vertical and downgradient directions to support cleanup activities; and 2) provide sufficient data to support a preliminary risk assessment. If contamination did occur, Phase I investigation would also identify all COPCs.
The site conceptual model for releases at this septic system is that the primary release mechanism to the PAS is by discharge of constituents through the septic tank to the associated drainline and outfall. Locations just below drainlines, locations beneath the drainline at the soiltuff interface, and sediment samples directly downgradient from the outfall were hypothesized to represent locales of maximum potential contamination. It is assumed that discharge in such systems will result in the highest constituent concentrations either at the proximal or distal ends of the drainline. The soil-tuff interface, a location of variation in hydrogeologic properties and a possible site of interflow, is likely to be a zone of contaminant concentration. Non-volatile
constituents (e.g. SVOCs, HE, inorganics) are hypothesized to decrease in concentration vertically into tuff and downgradient from the outfall. Volatile organics are likely to be at higher
concentrations in subsurface samples because they are likely to volatilize in near-surface samples due to temperature fluctuations. This conceptual model guided selection of sampling and screening localities. Field screening was further used to bias sample locations, based on
this conceptual model.
Subsurface samples were collected at the proximal and distal ends of the septic pipe. Sediment samples were collected at the outfall of the pipe as well as at 2.5 ft and 5 ft downgradient from
the outfall. Boreholes were sampled with a split spoon. The borehole at the proximal end was drilled to a depth of 8ft, with the soil-tuff interface at 5 ft. The distal borehole was drilled to a
depth of 3.5 ft, with the soil-tuff interface at 2 ft. Two samples were collected from each hole, one at the soil-tuff interface and one at the estimated depth of the drain line.
TA-16 RFI Report 45 September 29, 1997

RFI Report
The proximal borehole location was determined by examining the exit pipe location in the septic
tank itself. The drill rig was then placed over the estimated location, slightly downgradient from
the septic tank. During drilling there was a grinding noise that is characteristic of drilling
through clay pipe. The drill met refusal temporarily and then advanced as if passing through
a pipe. However, no clay pipe cuttings were retrieved when collecting samples. The field team
believes that the drain pipe was encountered during drilling and samples were collected at the
depth of the pipe.
The drain line pipe was not located while drilling the distal borehole. Physical evidence at the
site, including cobbles and clay pipe fragments, indicate that the field investigation had located
the original pipe alignment and that the drain line probably had been removed in this area. The
expected location of the distal borehole was determined by line of sight from the outfall to the
septic tank. Five borings (potholes) were drilled to a depth of 1 ft into tuff in a line perpendicular
to the expected location to search for backfill or other evidence of the drain line. The initial
pothole was located by line of sight with the outfall and tank. This location had PID readings
slightly above background, which were the highest readings at this site. Based on these results,
the distal borehole analytical sample was collected from this location.
Each core was field screened for HE, radioactivity, and for VOCs at 1 ft intervals. All screening
results except for the PID reading mentioned above, were negative. These screening intervals
were used because 0.5-ft intervals in boreholes did not provide sufficient material for sampling.
Surface samples were collected using the spade and scoop method, and were collected to a
depth of 0.5 ft.
Supplemental sampling was conducted in September 1996 after the RFI Phase I investigation
was complete. Because the Phase I data did not bound the downgradient extent of the
contamination from the outfall, one more downgradient sample {0316-96-0170) was collected
and analyzed for metals and SVOCs. Three locations downgradient from sample 0316-95-0296
were field screened for barium using XRF. The location with the highest field screening result
was selected for laboratory analysis (0316-96-0170).
Table 5.3.4-1 contains information about all samples collected at this site. Figure 5.3.4-1
shows the sample locations.
September 29, 1997 46 TA-16 RFI Report

RF/ Report
TABLE 5.3.5-1
INORGANIC$ WITH CONCENTRATIONS GREATER THAN BACKGROUND UTL FOR PRS 16-006{c)
SAMPLEID DEPTH SOIUROCK BARIUM CHROMIUM COPPER LEAD MERCURY NICKEL VANADIUM (ft) UNIT (mg/kg) (mg/kg) (mg/kg) (mglkg) (mg/kg) (mg/kg) (mg/kg)
LANLUTL N/Aa N/A 315 19.3 15.5 23.3 0.1 15.2 41.9 (all soil)
LANLUTL N/A N/A 56.6 10.9 6.4 11 NCb 8.7 9.5 (Qbt4)
SAL N/A N/A 5300 210 2800 400 23 1 500 540
0316-95-0290 5-6 Qbt4 133 50.1(Pc)_ 334 11.2 0.05 (U\ e
89.2 (J+ ) 17.4
0316-95-0292 1-3.5 Qbt4 18.1 3.1 21.9 1.6 0.05 (U) 1.6 3.7
0316-95-0293 0-0.5 Soil 668 5.2 10.4 22.8 0.09 (U) 2.8 (U) 6.2 (U)
0316-95-0294 0.5-0.7 Soil 2610 13.6 18.2 17.7 0.17 4.7 (U) 9.1
0316-95-0295 0-0.5 Soil 4590 7.9 12.6) 23 0.15 1.9 (U) 8.9
0316-95-0296 0-0.5 Soil 10.2 25.1 23.3 0.11(U) 5.3 (U) 14.2
a. N/A =Not Applicable b. NC = Not Calculated c. P = Professional judgment should be applied, depending on proposed use of the data d. U = Undetected. The listed value is the detection limit e. J+ = Estimated value likely to be high
5.3.6 Evaluation of Radionuclides
Radionuclides were analyzed at PRS 16-006(c). All radionuclides, except potassium-40, were
at levels below SALs. The value for potassium-40 was at a level greater than SAL. However,
this element is a naturally occurring isotope. There is no evidence that it has been used at
LANL. Potassium-40 is only included in the gamma spectroscopy analysis to serve as a QC
measure of the analysis and will not be considered further in the screening analysis.
5.3.7 Evaluation of Organic Chemicals
Benzo(a)pyrene is the only organic compound present above SALs at PRS 16-006(c) (Table
5.3.7-1 ). Other organic constituents were present at levels above detection limits, including a
large number of PAHs and phthalates. Phthalates are commonly used plasticizers.
Table 5.3.7-2 lists the VOCs detected at this PRS. Very few VOCs were detected and all were
present at low levels, some qualified as estimated.
ZINC (mg/kg)
50.8
75.4
23000
206
36.6
65.5
47.8
55
107
TA-16 RFI Report 49 September 29, 1997

~ ~ tt ~ 1\) ~ .... ~ "'
~
~ I ....
0)
::0 ::!:! ::0 Ill
"1::1 0 .., ....
a b
c d
e
TABLE 5.3.7-1
PRS 16-00G{c) SOIL CONCENTRATIONS FOR DETECTED SVOC ANAL YTES
SAMPLE ID DEPTH (FT) ACENAPH·
I ANTHR·
I BENZO(A)·
THENE ACENE ANTHRACENE (mg/kg) (mg/kg) (mg/kg)
SAL N/A 2200 I 18000 I 0.61
CHRYSENE DIBENZOFURAN 1 ,4·DICHLOROBENZENE DI·N·BUTYLPHTHALA TE (mg/kg) (mg/kg)
61 250
0.33 0.33
0.24 (J) 0.35 (U)
NA NA
0.28 (J) 0.038 (J)
0.44(U) 0.44 (U)
2.4 (U) 2.4(U)
0.42 (U) 0.42 (U)
0.99 (U) 0.99 (U)
N/A =Not Applicable NC = Not Calculated
(mg/kg)
3.6
0.33
0.35(U)
NA
0.35(U)
0.05 (J)
2.4 (U)
0.42(U)
_ L__ __ 0.9_9(U)
U = Undetected-the listed value is the detection limit
(mg/kg)
6500
0.33
0.35(U)
NA
0.35{U)
0.054 (J)
2.4(U)
0.42 (U)
0.99(U)
I BENZO(A)·
I BENZO(B)·
PYRENE FLUORAN· (mg/kg) THENE
(mg/kg)
I 0.061 I 0.61
FLUORANTHENE FLUORENE (mglkg) (mg/kg)
2600 2300
0.33 0.33
0.38 0.35(U)
NA NA
0.49 0.065 (J)
0.048 (J) 0.44(U)
2.4 (U) 2.4 (U)
0.42(U) 0.42(U)
0.99(U) 0.99(U)
J = Estimated quantity-result is above the detection limit but below the estimated quantitation limit NA = Not Analyzed
BENZO· BENZOIC {G,H,I)· ACID
PERYLENE (mg/kg) (mg/kg)
~,,..b 100000
INDEN0(1,2,3·CD) NAPHTHALENE PYRENE (mg/kg) (mg/kg)
0.61 1000
0.33 0.33
0.089 (J) 0.039 (J)
NA NA
0.1 (J) 0.064 (J)
0.44 (U) 0.44(U)
2.4(U) 2.4 (U)
0.42 (U) 0.42(U)
0.99(U) 0.99(U)
BENZO(K)· FLUORAN·
THENE (mg/kg)
6.1
PHENANTHRENE (mg/kg)
1\C
0.33
0.26 (J)
NA
0.44
0.44(U)
2.4 (U)
0.42(U)
0.99(U)
BIS{2· ETHYLHEXYL)·
PHTHALATE (mglkg)
32
PYRENE (mglkg)
19000
0.33
0.26 (J)
NA
0.41
0.44(U)
2.4(U)
0.42(U)
0.99(U)
~ ~ ~ c ~

TABLE 5.3.7-2
PRS 16-00G(c) SOIL CONCENTRATIONS FOR DETECTED VOC ANALYTES
SAMPLE ID DEPTH (ft) ACETONE METHYLENE P·ISOPROPYL-(mg/kg) CHLORIDE TOLUENE (mglkg)
(mg/kg)
SAL N/Aa 2100 7.8 Ncf
EQL N/A 0.02 0.005 0.005
0316-95-0289 2.5-4 0.021 (Uc) 0.004 (Jd) 0.005 (U)
0316-95-0290 5-6 0.021 (U) 0.003 (J) 0.005 (U)
0316-95-0291 0-1 0.012 (J) 0.005 (U) 0.014
0316-95-0292 1-3.5 0.02 (U) 0.008 (U) 0.024
a. N/A =Not Applicable b. NC = Not Calculated c. U = Undetected-the listed value is the detection limit d. J = Estimated quantity-result is above the detection limit but below the estimated
quantitation limit
5.3.8 Risk-Based Screening Assessment
RFI Report
Eight inorganic and sixteen organic chemicals were carried forward from the background
comparison and organic constituent evaluation. As described in Chapter 3 of this RFI Report,
analytes are divided into two classes, noncarcinogens and carcinogens, for screening
assessment (depending on which toxicological effect forms the basis of their SAL). This
separation is required in order to evaluate possible additive effects within each class of
chemical.
Barium exceeded its SAL value in surface sample 0136-95-0296. Benzo(a)pyrene exceeded its
SAL value in subsurface samples 0316-95-0289 and 0316-95-0290. The sample results that
exceeded the SAL values are highlighted by black backgrounds in the previous tables. These
two compounds are retained for further evaluation as COPCs.
An MCE calculation was performed using the sum of the maximum concentrations of constituents
detected at levels greater than background UTLs but below SALs. The MCE calculations are
presented in Table 5.3.8-1. The MCE results for noncarcinogens and carcinogens are 0.37 and
1.2, respectively. The MCE value for noncarcinogens is less than unity; therefore, a potential
human health risk based on additive effects is not identified for this class of chemical. The
carcinogenic COPCs that have a normalized value of more than 0.1 at this PRS are chromium,
benzo(a)anthracene, benzo(b)fluoranthene, and indeno(1 ,2,3-cd)pyrene. These compounds
are, therefore, also retained as COPCs for further evaluation.
TA-16 RFI Report 51 September 29, 1997

'I
RFI Report
TABLE 5.3.8·1
MCE CALCULATION FOR PRS 16-006(c)
MAX CONC. SAL NORMALIZED ANALYTE (mg/kg) (mg/kg) VALUE
Noncarcinogenic Effects
Copper 334 2800 0.12
Lead 11.2 400 0.03
Mercury 0.17 23 0.01
Nickel 89.2 1500 0.06
Vanadium 17.4 540 0.03
Zinc 206 23000 0.01
Acenaphthene 0.058 2200 <0.01
Anthracene 0.12 18000 <0.01
Fluoranthene 0.49 2600 <0.01
Fluorene 0.065 2300 <0.01
Naphthalene 0.064 1 000 <0.01
Benzoic Acid 0.67 100 000 <0.01
Dibenzofuran 0.038 250 <0.01
Di-n-butylphthalate 0.054 6500 <0.01
Naphthalene 0.064 1000 <0.01
Pyrene 0.41 19000 <0.01
Acetone 0.012 210000 <0.01
TOTAL 0.37
Carcinogenic Effects
Chromium 50.1 210 0.24
Benzo(a)anthracene 0.21 0.61 0.34
Benzo(b )fluoranthene 0.22 0.61 0.36
Benzo(k)fluoranthene 0.093 6.1 0.02
Chrysene 0.28 61 <0.01
1 A-Dichlorobenzene 0.05 3.6 0.01
lndeno(1 ,2,3-cd)pyrene 0.1 0.61 0.16
Bis(2-ethylhexyl)phthalate 0.42 32 0.01
Methylene Chloride 0.004 7.8 <0.01
TOTAL 1. 2
September 29, 1997 52 TA-16 RFI Report

RFI Report
5.3.9 Human Health Risk Assessment
Six COPCs were identified in the screening assessment from Subsection 5.3.8. They are benzo(a)pyrene, benzo(a)anthracene, benzo(b)fluoranthene, indeno{1 ,2,3-cd)pyrene, chromium, and barium. A quantitative human health risk assessment was not performed for this PAS. However, a qualitative evaluation of these COPCs is presented.
One PAH, benzo(a)pyrene, was detected at twice its SAL in two subsurface samples at the proximal end of the septic pipe. The other PAHs were also detected in the subsurface and range from 16% to 36% of their respective SALs. Additionally, the chromium result for sample 0316-95-0290 is 24% of its SAL. This value was qualified due to poor duplicate recovery. Barium exceeded SAL by 23% in one surface sample near the pipe outfall as shown in Figure 5.3.4-1.
The basis of the SALs is residential exposure to soil contaminants via dermal contact, inhalation and ingestion over a 0.5 acre contaminant source area. These values are computed using dose response estimates for children because they are the most susceptible subset of
the human population.
The samples that have contaminant concentrations of concern were collected at 2.5-4 ft and 5-6ft below the ground surface. There is no current viable pathway that could result in exposure of humans to soils at these depths.
This PAS is located in a heavily industrialized area. This landuse will continue into the
foreseeable future. A more reasonable population to assess for potential exposure from this
PAS is industrial workers. All of the COPes at this PAS are below the EPA Region IX industrial scenario Preliminary Remediation Goal (PRG) values. This includes the surface soil value for
barium near the pipe outfall.
This PRS is recommended for human-health NFA. The basis for the recommendation is current
landuse extending into the foreseeable future, the lack of an exposure pathway for 5 of the 6
COPCs, the acceptability of potential barium exposure under the industrial scenario, and the limited spatial extent of surface contamination within the PAS relative to the exposure model assumption of 0.5 acres.
5.3.1 0 Preliminary Ecological Assessment
In cooperation with NMED and EPA Region 6, the Laboratory ER Project is developing an approach for ecological risk assessment. Further ecological risk assessment at this site will be
TA-16 RFI Report 53 September 29, 1997

RFI Report
deferred until this site can be assessed as part of the ecological exposure unit methodology
currently being developed. When completed, the ecological risk assessment will be provided
as an Attachment.
5.3.11 Conclusions and Recommendation
RFI sampling was conducted at locations biased to represent the area of greatest contamination.
Barium was the only inorganic constituent found at PRS 16-006{c) above SAL. Benzo(a)pyrene
was the only organic constituent found at PRS 16-006{c) above SAL. The COPCs identified in
the human health screening assessment were eliminated in a qualitative risk assessment.
Therefore, PRS 16-006(c) is recommended for human-health NFA.
Contaminant levels are low and the data generally appear to support the site conceptual model.
Soil-tuff interface samples typically show slightly elevated levels relative to shallower samples.
Barium concentrations in sediments at the outfall are at lowest abundances in the farthest
downgradient sample.
The extent of contamination in the downgradient direction has been bounded. The furthest
downgradient sample contains no constituents at levels greater than SAL. Residual PAH at
depth are at very low levels - less than industrial PRGs. Conservative, biased sampling
locations revealed no hazardous constituents. Based on sampling results, there is little risk to
human health or to the environment at this site. Because of the low levels of hazardous
constituents, this PRS is recommended for human-health NFA based on NFA Criterion 5
5.4 PAS 16-00G(d)
PRS 16-006{d) is a septic tank, with associated drain lines, distribution box, and tile leach field,
that serves TA-16-380, a high explosives inspection building. Sampling results identified no
contaminants above SALs at the site and this PRS is recommended for human-health NFA.
5.4.1 History
PRS 16-006(d) is discussed in detail in Subsection 5.4 of the RFI work plan (LANL 1993, 1 094).
TA-16-380 was used to inspect raw HE powder prior to its formulation into HE components. It
is currently used only for storage. The septic tank was constructed in 1952 to serve five floor
drains, two lavatories, and one deep sink on the first floor of TA-16-380 (LANL 1990, 0145;
WX Outfall Drawing 13Y-192091 ). Small amounts of HE and other contaminants could have
entered the septic system from any of these drains. This septic system is still in active use.
September 29, 1997 54 TA-16 RFI Report

RFI Report
Potential contaminants at this site were identified as: HE, HE impurities and degradation
products, metals (particularly barium from barium nitrate), uranium, and laboratory chemicals
such as solvents.
5.4.2 Description
PRS 16-006(d) is a 540-gal., reinforced-concrete septic tank with associated drain lines,
distribution box, and tile leach field located south of TA-16-380 (Figure 5.0-1 ). It is located in
a relatively flat, vegetated area that gradually slopes south and east toward Water Canyon.
According to the engineering drawings, the septic leach field consists of two branches that run
east-west and slightly south of the distribution box. The boundaries for this PRS shown in
Figure 5.4.4.1 do not coincide with the plan view of the septic tank and leach field lines as
determined based on field surveys. In particular, a geophysics survey showed no evidence for
the west branch of this leach field.
5.4.3 Previous Investigations
No previous investigations have been performed at this site.
5.4.4 Field Investigation
The objective of Phase I sampling at this site was to determine via biased sampling if a release
had occurred from the septic system and leach field and if that release caused contamination
above action levels. The sampling design was biased to detect contaminants by collecting
samples at locations most likely to be contaminated, according to the site conceptual model.
The sampling and analysis plan was also designed to: 1) delineate any contamination above
action levels in the vertical direction to support cleanup activities; and 2) provide sufficient data
to support a preliminary risk assessment. If contamination did occur, Phase I investigation
would also identify all COPCs.
The site conceptual model for releases at this septic system is that the primary release
mechanism to the PRS is by discharge of constituents through the septic tank to the associated
leach field. Locations just below leach-field tiles and locations beneath the leach field at the
soil-tuff interface were hypothesized to represent locales of maximum potential contamination.
It is assumed that discharge in such systems will result in the highest constituent concentrations
either at the proximal or distal ends of the leach field. The soil-tuff interface, a location of
variation in hydrogeologic properties and a possible site of interflow, is likely to be a zone of
contaminant concentration. Both heavy-organic contaminants such as high explosives and
TA-16 RFI Report 55 September 29, 1997

RFI Report
SVOCs, and inorganic contaminants, are hypothesized to decrease in concentration vertically
into tuff. This conceptual model guided selection of sampling and screening localities. Field
screening was further used to bias sample locations, based on this conceptual model.
Samples were collected at the distribution box and at the distal end of the east branch of the
leach field (2 boreholes). A geophysics survey located the east branch of the leach field, but
showed no evidence for the west branch of the leach field. Three boreholes were sampled with
a split spoon and two samples were collected from each hole. The two samples were collected
at the soil-tuff interface and at the depth where the drain tiles would be. The borehole at the
distribution box was 6.5 ft deep and penetrated 2.5 ft into tuff. The borehole at the north end
of the leach field was 8.5 ft deep and 4.5 ft into tuff. The borehole at the south end of the leach
field was 9ft deep and 4.5 ft into tuff. Engineering fill was encountered during sampling. The
vitreous-clay pipe of the leach field was located at a depth of 2 ft.
Each sample was field screened for HE, radioactivity, VOCs, and metals. The samples with
positive PID field- screening results are tabulated below in Table 5.4.4-1. All of the HE
screening results were negative. The metals and radioactivity screening results were not
different from background ranges.
SAMPLE ID
0316-95-1674
0316-95-1689
0316-95-1690
0316-95-1694
0316-95-1695
TABLE 5.4.4-1
POSITIVE FIELD SCREENING RESULTS USING A PID FOR ORGANIC VAPOR ANALYSIS
LOCATION ID DEPTH {FT)
16-1617 1-2
16-1618 1-2
16-1618 2-3
16-1618 6.5-7
16-1618 7-8.5
RESULT (ppm)
2
30
160
14
14
The borehole at location 16-1617 is not located at the distribution box itself, but is 11 ft
downgradient from the estimated location of the distribution box. Two attempts to drill closer
to the distribution box resulted in significant volumes of engineering fill gravel in the sample,
as well as difficulty drilling to depth due to subsurface structures associated with the distribution
box. The drilling location represents a likely biased location to find high levels of contamination,
if contamination is present.
September 29, 1997 56 TA-16 RFI Report
, I

RFI Report
Although the RFI work plan called for collecting a sample at the depth of the drain line itself,
this sample was not collected at the borehole near the southern distal end. The sample at the
depth of the drain line could not be recovered, so a sample from the interval directly below the
drain line was sent for laboratory analysis.
The RFI Work Plan called for screening cores at 6-in. intervals. During sampling, cores were
screened on 12-in. intervals in order to provide enough material for a full suite analysis.
Table 5.4.4-2 contains information about all samples collected at this site. Figure 5.4.4-1
shows the sample locations.
a
TABLE 5.4.4·2
SUMMARY OF REQUEST NUMBERS FOR LABORATORY SAMPLES TAKEN ATPRS 16-006(d)
SAMPLE 10 LOCATION 10 DEPTH SAMPLE SVOCs VOCs RAD INORGs (ft) MATRIX
0316-95-0297 16-1617 2-4 Soil 1102a 1102 1108 1106
0316-95-0298 16-1617 4-6.5 Qbt4 1102 1102 1108 1106 0316-95-0299 16-1618 2-3 Soil 1102 1102 1108 1106 0316-95-0300 16-1618 4.5-6.5 Qbt4 1102 1102 1108 1106 0316-95-0301 16-1619 3-4 Soil 1102 1102 1108 1106 0316-95-0302 16-1619 4.5-7 Qbt4 1102 1102 1108 1106
ER analytical request number.
HE
1102
1102 1102 1102 1102 1102
TA-16 RFI Report 57 September 29, 1997

RFI Report
········································
···· ...
··················· ... ···················· .....
, .... 16-006(d) ,' ',, I
' ' I ~ ',,-, 1673 .. ,, . .. 1674~® 1675 ....... . 0297 .... ~-1~6 ---1677 0298--Chromium, SVOC, VOC 1678
1759400
1703 1704 1705 0301 1706
"1707
1688 1689 0299 1690 1691
----1692 I 0300--Chromium, SVOC, VOC
1693~ 1694 1695
\ frl ~ ~-1~1 I I I I
~---1 \ 1 I I I ,.J I
----~..:r \ .. 1 · I
I I
\ ; 16-030(g) ' , , __ ,
0302--Chromium, SVOC, VOC 1708
·"1709 1710 1711
- Permanent structure
Paved road
-~~-Fence
------ PRS boundary
Contour interval 10 ft
® Sampling location-borehole
Sample number-au sample numbers include the prefix "0316-95-." Sample numbers beginning with a 0 or 2 are laboratory samples. Sample numbers beginning with a 1 are screening samples. Samples at individual core locations shown from shallowest to deepest. Metals listed are above LANL UTLs; organics listed are detected.
50 I
7350·········
.·•·· .. ··
100ft I
Source: FIMAD ARC VIEW, 7/96 Modified by: cARTography by A. Kron 7/18/97
Fig. 5.4.4-1. Screening and laboratory sample locations at PRS 16-00G(d).
.............. ·· ..
······· ..... .
September 29, 1997 58 TA-16 RFI Report

RFI Report
5.4.5 Evaluation of Inorganic Chemicals
Table 5.4.5-1 presents the results for inorganic compounds present above UTLs. Three
samples contained chromium at a level greater than UTLs. No other inorganics were present
at levels greater than UTLs at PRS 16-006{d).
TABLE 5.4.5-1
INORGANICS WITH CONCENTRATIONS GREATER THAN BACKGROUND UTL FOR PRS 16-006(d)
CHROMIUM SAMPLE 10 DEPTH (ft) SOIUROCK UNIT (mg/kg)
LANL UTL (Qbt4) N/Aa N/A 10.9
SAL N/A N/A 210 0316-95-0298 4-6.5 Qbt4 21.1 0316-95-0300 4.5-6.5 Qbt4 23.8 0316-95-0302 4.5-7 Qbt4 17
a N/A = Not applicable.
5.4.6 Evaluation of Radionuclides
Radioactivity due to isotopes associated with operations at the facilities were not detected in
the samples. Potassium-40 is a naturally occurring isotope and was detected in these samples.
Radioactive potassium is very common in soil samples all over the world and is often used by
analytical laboratories to confirm that their equipment is functioning properly. There is no
process knowledge at LANL to suggest that potassium-40 was ever used at LANL, much less
at TA-16-380, which was used for HE powder inspection. Potassium-40 will not be considered
further in the screening analysis.
5.4.7 Evaluation of Organic Chemicals
One sample contained bis{2-ethylhexyl)phthalate and acetone at levels above detection limits
but well below SALs. Two samples contained trichlorofluoromethane at levels above detection
limits but well below SALs. Two samples contained bis(2-ethylhexyl) phthalate at levels above
detection limits but well below SALs. Acetone, bis(2-ethylhexyl}phthalate, and
trichlorofluoromethane were all found in the blanks, so the result are probably due to blank
contamination. No other organic constituents, including HE, were present above detection
levels at PRSs 16-006(d). The sample results are presented in Table 5.4. 7-1.
TA-16 RFI Report 59 September 29, 1997

RFI Report
TABLE 5.4.7-1
PRS 16-006(d) SOIL CONCENTRATIONS FOR DETECTED ORGANIC ANALYTES
DEPTH ACETONE ~~~!_2·ETHY LH EX~ L)." TRICtiL..JROFI..UOI'Il.· SAMPLE 1D (ft) (mg/kg) PHTHALATE (mg/kg} METHANE (mg/kg)
SAL N/A6 2100 32 380
EQL N/A 0.02 0.33 0.005
0316-95-0298 4-6.5 0.011 (Ub) 0.35 5.3
0316-95-0300 4.5-6.5 0.023 0.41 5.3 (U)
0316-95-0302 4.5-7 O.Q11 (U) 0.35 6.4
a. N/A =Not Applicable b. U = Undetected-the listed value is the detection limit
5.4.8 Risk-Based Screening Assessment
No chemicals were present at levels above SALs. Visual inspection of the data indicated that
an MCE would not result in a value near unity. No COPCs were identified during the screening
assessment.
5.4.9 Human Health Risk Assessment
No human health risk assessment was performed for PRS 16-006(d) because no COPCs were
identified during Phase I sampling.
5.4.10 Preliminary Ecological Assessment
In cooperation with NMED and EPA Region 6, the Laboratory ER Project is developing an
approach for ecological risk assessment. Further ecological risk assessment at this site will be
deferred until this site can be assessed as part of the ecological exposure unit methodology
currently being developed. When completed, the ecological risk assessment will be provided
as an Attachment.
5.4.11 Conclusions and Recommendation
RFI sampling was conducted at locations biased to represent the area of greatest potential
contamination. The original sampling plan was carried out as accurately as the physical
restrictions of the site would allow. No contamination was found above SALs during Phase I
sampling. No COPCs were identified at PRS 16-006(d). Samples at greatest depth and furthest
downgradient are well-below SALs, so constituents are bounded relative to SALs. Based on
sampling results, there is no significant risk to human health or to the environment at this site.
September 29, 1997 60 TA-16 RFI Report
, I

RFI Report
Because of the low levels of hazardous constituents, this PRS is recommended for human
health NFA based on NFA Criterion 5.
5.5 PAS 16-01 O(a)
Potential Release Site16-010(a), TA-16-386, is an inactive flash pad now used for storage.
This structure was a storage site for a large pile of barium nitrate during the 1950s through
1970s. The barium nitrate pile itself has been designated as PRS 16-016(c). Potential Release
Sites 16-01 O(a) and 16-016(c) overlap. Two sample locations associated with PRS 16-01 O(a)
contained barium at levels above SAL. These two sample locations are located in or near PRS
16-016(c) and will be attributed to PRS 16-016(c) because it is the principal suspected source
of barium contamination. Since the PRSs overlap, it is recommended that the contaminated
portion of 16-01 O(a) be administratively associated with 16-016(c). All of the contamination at
this location will then be addressed in the planning for 16-016(c), which will be cleaned up in
a Voluntary Corrective Measure (VCM) or Voluntary Corrective Action (VCA). PRS 16-01 O(a)
is recommended for human-health NFA.
5.5.1 History
PRS 16-01 O(a) is discussed in detail in Subsection 5.8 of the RFI work plan (LANL 1993, 1 094}.
Potential contaminants at this site were thought to originate from the former barium nitrate pile
(PRS 16-016(c)) and from the burning of HE contaminated material, a source of HE, HE burn
products, and barium. This burn pad was built in 1951. It is not known how long this pad was
used for burning.
5.5.2 Description
PRS 16-010(a) is located at the burning ground at TA-16 (Figure 5.0-1}. It is a fenced, level
region of bare soil covering approximately 215ft x 180ft. It is sparsely vegetated. The level
area drops off steeply to the north. Drainage is to the north toward Canon de Valle through PRS
16-016(c).
5.5.3 Previous Investigations
No previous investigations have been performed at this site.
TA-16 RFI Report 61 September 29, 1997

RFI Report
5.5.4 Field Investigation
The objective of Phase I sampling was to determine, using biased sampling, the nature and
extent of contamination at and around the flash pad. The sampling design was biased to detect
contaminants by collecting samples at locations most likely to be contaminated, according to
the site conceptual model. Existing data from the TA-16 Burning Ground and knowledge that
a barium nitrate pile had been located at this site for roughly 20 years suggested that
contamination at levels greater than SAL for barium was likely. The sampling and analysis plan
was also designed to: 1) delineate any contamination above action levels in both vertical and
downgradient directions to support cleanup activities; and 2) provide sufficient data to support
a preliminary risk assessment. If contamination did occur, Phase I investigation would also
identify all COPCs.
The site conceptual model for releases at this flash pad is that the primary release mechanism
to the PRS was by burning of waste materials and by storage activities in the flash pad.
Because the PRS overlaps with PRS 16-016(c), the barium nitrate pile, barium leaching from
that pile to this PRS was anticipated. Both heavy-organic contaminants such as high explosives
and SVOCs, and inorganic contaminants, are hypothesized to decrease in concentration both
vertically into tuff and downgradient from the PRS. Downgradient localities were part of PRS
16-016(c) sampling. This conceptual model guided sampling and screening locations. Field
screening- particularly for barium, which is the principal constituent likely to be present at this
site- was further used to bias sample locations, based on this conceptual model. The intent
was to submit samples with positive screening results for laboratory analysis.
The EPA approved sampling plan called for a field randomized grid with 20 ft spacing that
covered the PRS area. Field screening was used to locate three sites with the highest barium
concentrations. Radiation and HE screening, as well as visual inspection for stains, were used
to bias sample analysis. At each location selected for laboratory analysis, samples were
collected from the 0 to 0.5-ft, 2-ft, and 5-ft depth intervals. There were no deviations from this
sampling plan.
Table 5.5.4-1 contains information about all laboratory samples collected at this site.
Figure 5.5.4-1 shows the sample locations. The results of the field screening are shown in
Table 5.5.4-2.
September 29, 1997 62 TA-16 RFI Report
, I

a
TABLE 5.5.4-1
SUMMARY OF REQUEST NUMBERS FOR LABORATORY SAMPLES TAKEN ATPRS 16-010{a)
SAMPLE 10 LOCATION ID DEPTH SAMPLE SVOCs HE INORGs (ft) MATRIX
0316-95-0383 16-1343 0-0.5 Soil 1154a 1154 1155
0316-95-0384 16-1343 2-3 Qbt4 1154 1154 1155
0316-95-0385 16-1343 4-5 Qbt4 1154 1154 1155
0316-95-0386 16-1344 0-0.5 Soil 1154 1154 1155
0316-95-0387 16-1344 2-3 Qbt4 1154 1154 1155
0316-95-0388 16-1344 4.5-5.5 Qbt4 1154 1154 1155
0316-95-0389 16-1345 0-0.5 Soil 1154 1154 1155
0316-95-0390 16-1345 2-3 Qbt4 1154 1154 1155
0316-95-0391 16-1345 4-5.5 Qbt4 1154 1154 1155
0316-95-0392 16-2167 0-0.5 Soil 1183 1183 1184
0316-95-0393 16-2167 2-3 Qbt4 1154 1154 1155
0316-95-0394 16-2167 5-6 Qbt4 1154 1154 1155
0316-95-2017 16-2167 0-0.5 Soil 1183 1183 1184
ER analytical request number.
RFI Report
TA-16 RFI Report 63 September 29, 1997

RFI Report
· ........ · ..
1764100
··· ....
Pennanent structure
Paved road
Fence
PRS boundary
Contour interval 2 ft
I . . ... ··
® Sampling location-borehole
0392 Sample number -all sample numbers include the prefix '0316-95-'. Sample numbers beginning
with a 0 or 2 are laboratory samples. Screening samples are located at grid nodes. Samples at
Grid for screening sampling locations
individual core locations shown from shallowest to deepest. Metals listed are above LANL Lrrls; organics listed are detected; analytes underlined are above SALs.
. .. ···
0 25 50 It I I I I I I I I
Source: FIMAD ARC VIEW, 7/96 Modified by: cARTography by A. Kron 7/19/97
Fig. 5.5.4-1. Screening and laboratory sample locations at PAS 16-01 O(a).
September 29, 1997 64 TA-16 RFI Report
'I

RFI Report
TABLE 5.5.4-2
SCREENING RESULTS FOR PRS 16-010(a)
SAMPLE ID Location ID XRF:Ba LIBS: Ba HE Spot Test 0316-95-1496 Grid: 0,0 386ppm 207ppm Negative 0316-95-1497 Grid: 0,20 292 ppm 178ppm Negative 0316-95-1498 Grid: 0,40 690ppm 383ppm Negative 0316-95-1499 Grid: 0,60 3318ppm 2 935ppm Negative 0316-95-1500 Grid: 0,80 1182 ppm 868ppm Negative 0316-95-1501 Grid: 0,100 268ppm 186 ppm Negative 0316-95-1502 Grid: 20,0 294ppm 159ppm Negative 0316-95-1503 Grid:20,20 370ppm 214 ppm Negative 0316-95-1504 16-1343 4624ppm 2884ppm Negative 0316-95-1505 16-1344 4258ppm 2038ppm Negative 0316-95-1506 Grid:20,80 1473ppm 1435ppm Negative 0316-95-1507 16-1345 3645 ppm 2073ppm Negative 0316-95-1508 Grid: 40,0 470ppm 127ppm Negative 0316-95-1509 Grid: 40,20 434ppm 65ppm Negative 0316-95-1510 Grid: 40,40 370ppm 145 ppm Negative 0316-95-1511 Grid: 40,60 1 612 ppm 1 322ppm Negative 0316-95-1512 Grid: 40,80 2753ppm 2365ppm Negative 0316-95-1513 Grid: 40, 1 00 3455ppm 293ppm Negative 0316-95-1514 Grid: 60,0 433ppm 200ppm Negative 0316-95-1515 Grid: 60,20 432 ppm 157ppm N~ative 0316-95-1516 Grid: 60,40 584ppm 212 ppm Negative 0316-95-1517 Grid: 60,60 457ppm 231 ppm Negative 0316-95-1518 Grid: 60,80 482ppm 326ppm Negative 0316-95-1519 16-2167 237ppm 1 336ppm Positive 0316-95-1520 Grid: 80,0 388ppm 95ppm Negative 0316-95-1521 Grid: 80,20 338ppm 84ppm Negative 0316-95-1522 Grid: 80,40 632ppm 262ppm Negative 0316-95-1523 Grid:80,60 522ppm 244ppm Negative 0316-95-1524 Grid: 80,80 543ppm 235ppm Negative 0316-95-1525 Grid: 80, 100 487ppm 194 ppm Negative
TA-16 RFI Report 65 September 29, 1997

RFI Report
5.5.5 Evaluation of Inorganic Chemicals
lnorganics were present at levels greater than UTLs at PRS 16-01 O(a) (Table 5.5.5-1 ). Two
samples contained barium at levels greater than SALs. These two sample locations are very
near PRS 16-016(c).lt is recommended that these locations and their data be administratively
transferred to 16-016(c). No other inorganics were present at levels above SALs.
TABLE 5.5.5-1
INORGANICS WITH CONCENTRATIONS GREATER THAN BACKGROUND UTLs FOR PAS 16-010(a)
a N/A =Not applicable. b J+ = Estimated value likely to be high.
5.5.6 Evaluation of Radionuclides
Radionuclides were not analyzed for at this PRS because process knowledge and historic
records give no indication that radionuclides were ever associated with this facility.
5.5.7 Evaluation of Organic Chemicals
Very few organic constituents were present above detection levels at PRS 16-01 O(a). They are
shown in Table 5.5.7-1. Samples 0316-95-0383 through -0390 missed holding times for SVOC
analysis by approximately 35 days. The SVOC data for these samples were PM-qualified as a
result of missing holding times. These data should be considered as rejected. The rejected data
September 29, 1997 66 TA-16 RFI Report

RFI Report
are included in FIMAD to maintain a complete information record. They were not used to decide
the outcome of this PRS. The remaining SVOC data that did not fail holding times was used to
determine the likelihood of SVOC contamination at this site.
Phthalate contamination was present in the method blank during the SVOC analysis. Samples
0316-95-2017 and 0316-95-0392 were PM-qualified for HE analysis due to the use of a non
standard HE laboratory control standard. Only seven HE compounds were included in the
laboratory control standard instead of the requested fifteen HE compounds. The analytical
results of these seven compounds were all in the acceptable range. The non-standard
laboratory control sample did not affect the use of these samples for decision-making
purposes. The data are considered acceptable without qualification.
Sample 0316-95-0392 tested positive in the screening test for HE and was sent for on-site
laboratory screening. The on-site laboratory screening results indicated that this sample
contained less than 5 ppm of HE; the off-site laboratory analysis for HE showed all
non-detects. Sample heterogeneity or nitrite interferences could explain the difference between
the spot test results, the on-site laboratory results, and the off-site laboratory results (see
Appendix C).
TABLE 5.5.7-1
PRS 16-010(a) SOIL CONCENTRATIONS FOR DETECTED ORGANIC ANAL YTES
SAMPLE DEPTH RDX DI-N-BUTYL-ID (ft) (mg/kg) PHTHALATE
(mglkg)
SAL N/A8 4 6500
EQL N/A 1 0.33
0316-95-0386 0-0.5 0.495 0.4 (Ub)
0316-95-0389 0-0.5 0.256 0.064 (Jc)
0316-95-2017 0-0.5 0.175 (U) 0.68
a. N/A =Not Applicable b. U = Undetected-the listed value is the detection limit. c. J = Estimated quantity-result is above the detection limit but below the
estimated quantitation limit.
TA-16 RFI Report 67 September 29, 1997

RFI Report
5.5.8 Risk-Based Screening Assessment
Five inorganic and two organic chemicals were carried forward from the background comparison
and organic constituent evaluation. As described in Chapter 3 of this RFI Report, analytes are
divided into two classes, noncarcinogens and carcinogens, for the screening assessment,
depending on which toxicological effect forms the basis of their SAL. This separation is
required to evaluate possible additive effects within each class of chemical.
Barium exceeded its SAL value in surface samples 0316-95-0383 and 0316-95-0386. These
two sample locations are very near the boundary for PRS 16-016(c) (Figure 5.5.4-1 ). The
barium nitrate pile, PRS 16-016(c) is the most likely source of barium contamination in this
area. Because these two PRSs share a common history and similar contaminants, these two
locations with high levels of barium will be associated with PRS 16-016{c) and will not be
retained for this assessment. All barium at greater than cleanup levels will be cleaned up in a
PRS 16-016{c) voluntary corrective measure (VCM). The locations where barium was detected
above UTL but below SAL will also be attributed to PRS 16-016{c) and will not be retained for
this assessment.
Visual inspection of the noncarcinogenic (excluding barium) data for constituents that exceed
background UTLs but are less than SALs indicated that MCE screening would yield a value far
less than the target limit of 1. Therefore, these constituents will not be retained for this
assessment. An MCE calculation was performed for carcinogens using the sum of the
maximum concentrations of constituents present at levels greater than background UTLs but
less than SALs. The MCE calculation is presented in Table 5.5.8-1. The MCE result for
carcinogens is 0.3. The MCE value for carcinogens is less than unity; therefore, a potential
human health risk based on additive effects is not identified for this class of chemical.
Chromium and RDX will not be retained as COPCs at this unit.
TABLE 5.5.8-1
MCE CALCULATION FOR PAS 16-010(a)
ANALYTE MAX CONC. SAL NORMALIZED (mg/kg) (mg/kg) VALUE
Carcinogenic Effects
Chromium 36.9 210 0.176
RDX 0.495 4 0.124
TOTAL 0.3
September 29, 1997 68 TA-16 RFI Report

RFI Report
5.5.9 Human Health Risk Assessment
No human health risk assessment was performed for PRS 16-01 O{a). The locations containing
constituents at levels above SALs have been attributed to PRS 16-016{c), the most likely
source of barium in this area, and will be cleaned up as part of the VCM for 16-016{c). The
remaining locations associated with PRS 16-01 O{a) do not contain any constituents at levels
above SALs.
5.5.10 Preliminary Ecological Assessment
In cooperation with NMED and EPA Region 6, the Laboratory ER Project is developing an
approach for ecological risk assessment. Further ecological risk assessment at this site will be
deferred until this site can be assessed as part of the ecological exposure unit methodology
currently being developed. When completed, the ecological risk assessment will be provided
as an Attachment.
5.5.11 Conclusions and Recommendation
RFI sampling was conducted at locations biased to represent the area(s) of greatest
contamination. Although barium was found in two samples at levels above SAL, the two
samples are being attributed to PRS 16-016(c), the most likely source of the barium
contamination. Of the remaining samples, none contained inorganic compounds at levels
above SALs. RDX was found above detection limits, but was well below SAL. Therefore, PRS
16-01 O(a) is recommended for human-health NFA.
Data generally support the site-conceptual model. Barium levels are above SALs, and barium
concentrations are highest in surface samples collected near the former location of the barium
nitrate pile.
The extent of contamination associated with PRS 16-01 O(a) has been bounded. Barium levels
at depth were well below SALs. PRS 16-016{c) received any runoff of contamination that might
otherwise be associated with downgradient contaminant migration from 16-01 O(a). Biased
analysis of sampling locations revealed no hazardous constituents above SALs other than
barium, now attributed to PRS 16-016(c). Based on sampling results, there is little risk to
human health or to the environment at this site. Because of the low levels of hazardous
constituents, this PRS is recommended for human-health NFA based on NFA Criterion 5.
TA-16 RFI Report 69 September 29, 1997

RFI Report
5.6 PRS 16-021(a)
PRS 16-021(a) is an outfall associated with TA-16-450, a materials testing laboratory. This
outfall received effluent from the basement floor drains in the building. This PRS is recommended
for human-health NFA because no contamination was detected above SALs.
5.6.1 History
PRS 16-021 (a) is discussed in detail in Subsection 5.5 of the RFI work plan (LANL 1993, 1 094}.
PRS 16-021 (a) is associated with floor drains in a materials testing laboratory, TA-16-450. TA-
16-450 was built in 1953 to house electroplating operations, although these plans were later
revised. It may have been used as a chemical engineering laboratory and a paint shop, and
recently this building has functioned as a materials testing laboratory. Discharges from this
facility may have included metals, cyanide, acids, paints, solvents, and oils. Potential
contaminants at this site were identified as: HE, HE impurities and degradation products,
metals, and laboratory chemicals.
5.6.2 Description
PRS 16-021(a) discharges east of TA-16-450 to an overgrown area that gently slopes
southeast toward Water Canyon (Figure 5.0-1 ). Visual inspection of the area surrounding the
discharge point indicates that, although the drain is still present, it has not been actively used
for some time. The area at the mouth of the outfall is overgrown and the drain is not in use. No
stream channel has been cut into the soils, so it is reasonable to expect that small volumes of
waste have been discharged via this drain system.
5.6.3 Previous Investigations
No previous investigations have been performed at this site.
September 29, 1997 70 TA-16 RFI Report

RFI Report
5.6.4 Field Investigation
The objectives of Phase I sampling at this site were to confirm the location of the outfall and
to determine via biased sampling if a release had occurred from the drain line causing
contamination above action levels. The sampling design was biased to detect contaminants by
collecting samples at locations most likely to be contaminated, according to the site conceptual
model. Contamination was not anticipated at this site. If contamination did occur, Phase I
investigation would identify any COPCs. Fragments of vitrified clay pipe were found during the
investigation, indicating that the outfall was properly located.
The site conceptual model for releases at this outfall is that the primary release mechanism to
the PRS is by discharge of constituents from the outfall pipe to the downgradient area. It is
assumed that such discharge will result in the highest constituent concentrations near the
outfall. The lack of a well-defined drainage from the outfall suggest that flow rates were small,
and that minimal transport of constituents from the outfall area is likely to have occurred. Non
volatile constituents (e.g. SVOCs, HE, inorganics) are hypothesized to decrease in concentration
vertically into tuff and downgradient from the outfall. Volatile organics are likely to be at higher
concentrations in subsurface samples because they are likely to volatilize in near-surface
samples due to temperature fluctuations. The soil-tuff interface consists of a transition in both
material and hydrogeologic properties that can act as a collection and transport zone for
contaminants. Field screening was further used to bias sample locations, based on this
conceptual model.
The EPA-approved RFI sampling plan called for two hand-augered sample holes: one to be
located at the mouth of the outfall and one to be 5 ft downgradient from the outfall. The location
at the outfall was augered to a depth of 5.5 ft and the downgradient location was augered to
a depth of 5.1 ft. The soil-tuff interface was located at the bottom of each core hole. A sample
was collected near the surface and at the bottom of each core. The area between the building
and outfall was not sampled because the conceptual model suggests that maximum
contamination would be likely at the outfall location.
TA-16 RFI Report 71 September 29, 1997

RFI Report
Five laboratory samples, including a collocated QA/QC sample, were collected from two
locations at this site. Samples are presented in Table 5.6.4-1 and their locations are shown in
Figure 5.6.4-1. Sample 0316-95-2010 was collected at the same location as sample 0316-95-
0210. All samples were collected with a hand auger. Samples were screened for VOCs only;
all positive screening samples are presented in Table 5.6.4-2.
TABLE 5.6.4-1
SUMMARY OF REQUEST NUMBERS FOR LABORATORY SAMPLES TAKEN ATPRS 16-021(a)
SAMPLE 10 LOCATION 10 DEPTH SAMPLE VOCs SVOCs (ft) MATRIX
0316-95-0210 16-1526 0.8-1.5 Soil 249a 249
0316-95-0211 16-1526 5-5.5 Soil 249 249 0316-95-0212 16-1527 0.8-1.5 Soil 249 249 0316-95-0213 16-1527 4.6-5.1 Soil 249 249 0316-95-2010 16-1526 0.8-1.5 Soil 249 249
8 ER analytical request number.
INORGs
252
252 252 252 252
September 29, 1997 72 TA-16 RFI Report

~ I .... 0)
:X:. ::!! :X:. CD
"tJ 0 .., ...
~
~ ~ tr ~ 1\) jO .... :g ......
Fig. 5.6.4-1. Sample locations at PRS 16-021(a)
··········· ··················
................................................................................................ 7590
. .
. ~·-.._ ---- ... .;,; ._ ._._ ._- ._ -----...... ;;~·· .····
...... ·
0 50 100ft I I I I I I I I I I I
. . . . . . . . .
Permanent structure
Paved road
Fence
PRS boundary
Contour interval 2 ft
® Sampling location-borehole r, Sample number-all sample numbers include the prefix "0316-95." Sample numbers beginning with a 0 or 2 are labora1ory samples. Sample numbers beginning wllh a 1 are screening samples. Samples at individual core locations shown from shallowest to deepest. Metals listed are above LANL UTLs; organics listed are detected.
~ ~ ~ ~ ~

RFI Report
SAMPLE ID 0316-95-0210 0316-95-0211 0316-95-0212 0316-95-0213 0316-95-2010
TABLE 5.6.4-2
POSITIVE SCREENING VALUES
LOCATION ID DEPTH (ft) 16-1526 0.8-1.5 16-1526 5-5.5 16-1527 0.8-1.5 16-1527 5-5.5 16-1526 0.8-1.5
PID READING (ppm) 20 50 30 30 20
Due to the elevated PID values, more volatile aliquots (5) were collected at this site than had
been planned (1 ). An aliquot for volatile analysis was collected from both sample locations, at
2 depths at each location. One duplicate was taken. These aliquots were collected from the
0.8- to 1.5-ft interval, rather than the 0- to 0.5-ft interval, to increase the likelihood of detecting
VOCs, if present. This deviation from the original sampling plan is considered to be an
improvement to the original plan.
5.6.5 Evaluation of Inorganic Chemicals
Samples containing inorganics at levels above UTLs are presented in Table 5.6.5-1. The only
inorganics found at levels above UTLs were arsenic, copper, mercury, and zinc. All values were
well below SALs. Arsenic, for which the UTL is used as a screening level, is present only slightly
above the UTL (8 vs. 7.82 ppm). Arsenic in the duplicate of this sample is below the UTL
(5.6 vs. 7.82). The mercury measurement had poor laboratory control during analysis, but
these data were validated without qualification for use in evaluating this PRS.
TABLE 5.6.5-1
INORGANICS WITH CONCENTRATIONS GREATER THAN BACKGROUND UTL FOR PRS 16-021(a)
DEPTH SAMPLE ID (ft)
LANL UTL (all soil) N/Aa SAL N/A
0316-95-021 0 0.75-1.5 0316-95-0211 5-5.5
0316-95-0212 0.75-1.5 0316-95-2010 0.75-1.5
a N/A =Not applicable. b NC = Not calculated.
ARSENIC COPPER (mg/kg) (mg/kg)
7.82 15.5
NCb 2800
5.6 37.2
0.23 (Uc) 70.2
2.3 26.6
8 34.6
c U = Undetected. The listed value is the detection limit.
September 29, 1997 74
MERCURY ZINC (mg/kg) (mg/kg)
0.1 50.8
23 23000
0.14 318
0.08 (U) 70
0.09 (U) 43.9
0.10 (U) I 302 I
TA-16 RFI Report

RFI Report
5.6.6 Evaluation of Radionuclides
Samples from this PRS were not analyzed for radioactive compounds because process
knowledge and facility history do not suggest any use of radionuclides at this PRS.
5.6.7 Evaluation of Organic Chemicals
Organic constituents found at levels above detection limits are listed in Table 5.6.7-1. Note that
the laboratory values are much less than the semi-quantitative readings from the PID during
field screening. All organic constituents levels were well below SALs.
Initially, 1 ,2,3-trichloropropane was detected at a level above its SAL. However, focused
validation of the data showed that this compound was not detected during analysis and the
reported presence of this compound has been attributed to a typographical error made at the
laboratory. 1 ,2,3-trichloropropane will not be considered in the analysis of this site.
SAMPLE ID
SAL
EQL 0316-95-0210REe
0316-95-0211 RE
0316-95-0212 0316-95-0213 0316-95-2010 0316-95-2010RE
a b
N/A =Not applicable. NC = Not calculated. NA = Not analyzed.
TABLE 5.6.7-1
PRS 16-021(a) SOIL CONCENTRATIONS FOR DETECTED ORGANIC ANAL YTES
DEPTH (ft) Benzoic ac1d p-lsopropyltoluene (mg/kg) (mg/kg)
N/Aa 100 000 Ncb N/A 3.3 0.005
0.75-1.5 NAc 0.006 (Jd)
5-5.5 NA 0.006 (Ue)
0.75-1.5 I 0.2 ~J} I 0.006 (U) 4.6-5.1 3.6 (U) 0.006 (U) 0.75-1.5 I 0.33 ~J} I NA 0.75-1.5 NA I 0.01
Tr~chloroethene (mg/kg)
3.2
0.005 0.015 (J)
0.003 (J)
0.04 (U) 0.006 {U)
NA
II 0.003 ~J}
c d e
Estimated quantity. Result is above the detection limit but below the estimated quantitation limit. U = Undetected. The listed value is the detection limit.
5.6.8 Risk-Based Screening Assessment
I
No compounds were present at levels near SALs. Arsenic is present in a single sample at a
level only slightly higher than the UTL. The duplicate of this sample is below the UTL. Arsenic
will not be retained as a COPC. Visual inspection of the data indicated that an MCE would result
in a value well-below unity. No COPCs were identified during the screening assessment.
TA-16 RFI Report 75 September 29, 1997

RFI Report
5.6.9 Human Health Risk Assessment
No risk assessment was performed for this PRS.
5.6.10 Preliminary Ecological Assessment
In cooperation with NMED and EPA Region 6, the Laboratory ER Project is developing an
approach for ecological risk assessment. Further ecological risk assessment at this site will be
deferred until this site can be assessed as part of the ecological exposure unit methodology
currently being developed. When completed, the ecological risk assessment will be provided
as an attachment.
5.6.11 Conclusions and Recommendations
Low flow volumes are believed to have come from this outfall because no drainage channel was
cut into the area surrounding the outfall. RFI sampling was conducted at locations biased to
represent the area(s) of greatest contamination. Sampling results from two surface and two
subsurface locations near this outfall showed little evidence of contamination at hazardous
levels. Pipe fragments and low levels of anthropogenic organic compounds confirmed that
samples were collected near the site of the outfall.
Because of the very low levels of compounds found during analysis, this PRS is recommended
for human-health NFA under NFA Criterion 5.
5.7 PRS 16-026(c)
PRS 16-026(c) is the outfall from two inactive sumps at TA-16-305. The sumps are PRS 16-
029(b) and will be investigated in a later field campaign. There was no contamination above
SALs in the outfall that was attributed to facility activity. Therefore, this PRS is recommended
for human-health NFA.
5.7.1 History
PRS 16-026(c) is discussed in detail in Subsection 5.2 of the RFI work plan (LANL 1993, 1 094).
TA-16-305 is a rest house that serves TA-16-304 and TA-16-306, both of which are used in the
production of plastic components for nuclear weapons. This facility was built in 1953. The rest
house is used for storing raw materials used in the plastics fabrication process, finished plastic
products, and for filament winding of developmental components (LANL 1989, 15-16-362).
September 29, 1997 76 TA-16 RF/ Report

RFI Report
Potential contaminants at this site were identified as: HE, HE impurities and degradation
products, metals, and laboratory chemicals associated with plastics manufacturing.
5. 7.2 Description
PRS 16-026(c) is located south of TA-16-305 (Figure 5.0-1). The outfall drains into a well
defined drainage ditch that parallels the access road. Runoff from the adjacent roadway drains
into the drainage ditch. The area is grassy and slopes gradually to the southeast. The HE
sumps that discharged into this PRS are plugged.
5.7.3 Previous Investigations
A study of HE contamination in soils associated with outfalls was conducted in June 1970
(Baytos 1970, 15-16-278). This study included the analysis of one soil sample from the outfall
at TA-16-305. The analytical results showed no TNT, RDX, or HMX in the soil sample, although
there may have been some unknown HE decomposition products present at low levels.
5. 7.4 Field Investigation
The objective of Phase I sampling at this site was to determine via biased sampling if a release
had occurred from the drain line outfall and if that release caused contamination above action
levels. The sampling design was biased to detect contaminants by collecting samples at
locations most likely to be contaminated, according to the site conceptual model. The sampling
and analysis plan was also designed to: 1) delineate any contamination above action levels in
both a vertical and downgradient directions to support any cleanup activities; and 2) provide
sufficient data to support a preliminary risk assessment. If contamination did occur, Phase I
investigation would also identify all COPCs.
The site conceptual model for releases at this outfall is that the primary release mechanism to
the PRS is by discharge of constituents from the outfall pipe to the downgradient drainage area.
It is assumed that such discharge will result in the highest constituent concentrations near the
outfall and in the downgradient sediment traps, particularly the sediment traps nearest the
outfall. Non-volatile constituents (e.g. SVOCs, HE, inorganics) are hypothesized to decrease
in concentration vertically into tuff and downgradient from the outfall. Volatile organics are
TA-16 RF/ Report 77 September 29, 1997

RFI Report
likely to be at higher concentrations in subsurface samples because they are likely to volatilize
in near-surface samples due to temperature fluctuations. The soil-tuff interface consists of a
transition in both material and hydrogeologic properties that can act as a collection and
transport zone for contaminants. This conceptual model guided sampling and screening
locations by emphasizing samples near the outfall, surface samples, and soil-tuff interface
samples. Field screening- particularly for the HE, which are the principal constituents likely
to be present at this site- was further used to bias sample locations, based on this conceptual
model. The intent was to submit samples with positive screening results for laboratory analysis.
The EPA approved RFI sampling plan for this site called for two boreholes to be drilled near
the outfall. The first borehole was drilled at the outfall. The second borehole was drilled at the
next downstream sediment trap. Samples were collected from the surface interval, the interval
bounding the soil-tuff interface, and the bottom of each borehole. The bottom of each borehole
was located at least 2.5 ft below the soil-tuff interface.
All analytical samples were collected with a hand auger except for the two samples at depth
in the boreholes near the outfall. These were collected with a split spoon. The depth of the
boreholes was 4.5 ft. The soil-tuff interface was located at a depth of 2ft at the borehole at the
outfall, and 1.3 ft at the borehole 13 ft downgradient from the outfall.
Beyond the boreholes, surface locations were screened for HE. All locations screened
negative; a total of three surface laboratory samples were collected at 20-ft intervals. Two
additional surface laboratory samples were collected further downgradient.
One screening sample located 325ft from the outfall was not collected on the specified interval
because the location was beneath an access road. Instead, it was collected from the exit of a
culvert. This screening location was not selected as a laboratory sample location.
All samples from this site were screened for HE, radiation, and volatiles. All samples screened
negative.
Table 5.7.4-1 lists the laboratory samples analyzed at PRS 16-026(c). Figure 5. 7.4-1 shows the
locations of the screening and laboratory samples taken at this PRS.
September 29, 1997 78 TA-16 RFI Report

TABLE 5.7.4-1
SUMMARY OF REQUEST NUMBERS FOR LABORATORY SAMPLES TAKEN ATPRS 16-026(c}
SAMPLE ID LOCATION ID DEPTH SAMPLE VOCs SVOCs HE (ft) MATRIX
0316-95-0121 16-1459 0-0.5 Soil NAa 621b 621
0316-95-0122 16-1459 1.7-2.3 Qbt4 621 621 621
0316-95-0123 16-1459 3.5-4.5 Qbt4 874 874 874
0316-95-0124 16-1655 0-0.5 Soil NA 621 621
0316-95-0125 16-1655 1-1.5 Qbt4 621 621 621
0316-95-0126 16-1655 3.5-4.5 Qbt4 874 874 874
0316-95-0127 16-1460 0-0.5 Soil NA 116 116
0316-95-0128 16-1461 0-0.5 Soil NA 116 116
0316-95-0129 16-1462 0-0.5 Soil NA 116 116
0316-95-0130 16-1463 0-0.5 Soil NA 116 116
0316-95-0131 16-1474 0-0.5 Soil NA 116 116
a. NA = Not Analyzed b. ER analytical request number
5.7.5 Evaluation of Inorganic Chemicals
RFI Report
INORGs
622
622
875
622
622
875
120
120
120
120
120
Data for soil samples were compared to soil UTLs and tuff samples were compared to the tuff UTLs. lnorganics were present at levels greater than UTLs but less than SALs at PRS 16-026(c). Table 5.7.5-1 presents the analytical results for inorganics at levels above UTLs. Some inorganic values are P-qualified because the duplicate recovery was outside the acceptable range. These data should be considered estimated. This qualification does not affect the decision made on the basis of these data.
TA-16 RFI Report 79 September 29, 1997

~ iii' 3 tt ~ 1\) jO .... l8 "'
Q) Q
~ I .... 0)
::0 :!.! ::0 ~ 0 .., -
~~~-
® )(
-, 0124-Lead, zinc, SVOCs, PAHs 0125-Barium, copper, lead, vanadium, TNT,
PAHs · .. 0126-Barium, chromium .· ....
' · )( 0129-Barium, zinc, PAHs . 1018 \ ... ···
' .... ' .. ··
·. ·. ~19',~·<.. . .. .... ,7"'~~---- 16-026(c)
,~,~~j=~~~~~:;~:~~fc · Sample number- I ... ·· .I all sample numbers include _.:
t the prefix "0316-95·. • Sample .'
Fence numbers beginning with a 0 or 2 ·· are laboratory samples. Sample
PRS boundary numbers beginning with a 1 are
Contour interval 2 ft screening samples. Samples at individual core locations are shown from shallowest to r & Sampling location- deepest Metals listed are above
borehole LANL UTLs; organics listed are
Sampling location detected; analytes undertined are above SAL.
·· ................ ··
Fig. 5.7.4-1. Screening and laboratory sample locations associated with PRS 16-026(c).
..···· ····· ............. ·
1025 1026
···~~;;;;;;;;;.~------- .. :_ ·· ..
·· ..
0 ~ 100
Source; FIMAD ARC VIEW, 7/96 Modified by: cARTography by A. Kron 7/19197
~ ~ ~ c :::t

RFI Report
TABLE 5.7.5-1
INORGANICS WITH CONCENTRATIONS GREATER THAN BACKGROUND UTLs FOR PRS 16-026(c)
DEPTH SOIUROCK BARIUM CHROMIUM COPPER LEAD VANADIUM ZINC SAMPLE ID (ft) UNIT (mg/kg) (mg/kg) (mg/kg) (mg/kg) (mg/kg) (mg/kg)
LANL UTL (all soil) N/Aa N/A 315 19.3 15.5 23.3 41.9 50.8 LANL UTL (Qbt4) N/A NIA 56.6 10.9 6.4 11 9.5 75.4 SAL N/A N/A 5300 210 2800 400 540 23000 0316-95-0121 0-0.5 soil 254 8.1 11.8 (P) Pb) 16 148 (J-c,P 0316-95-0122 1.7-2.3 Qbt4 I 183 I 3.9 5.6 (P) (P) 9.6 60.1 (J 0316-95-0123 3.5-4.5 Qbt4 31.2 I 22.7 {Pl I 1.4 0.96 3 17.9 0316-95-0124 0-0.5 soil 156 4.5 6.5(P) I 47.6 {Pl I 11.7 I 58.1 {J-,Pl I 0316-95-0125 1-1.5 Qbt4 245 5.7 7.3 (P) 18.1 (P) 11.6 51.9 (J-,P) 0316-95-0126 3.5-4.5 Qbt4 128 15 (P) 2.3 2.8 4.4 24.7 0316-95-0127 0-0.5 soil 140 5.4 6 18.2 13.3 52.3 0316-95-0129 0-0.5 soil I 633 I 9.4 11.2 16.7 24.1 73.5 0316-95-0131 0-0.5 soil 170 6.6 I 42 I 14.9 19.7 142
a. N/A =Not Applicable b. P = Professional judgment should be applied, depending on proposed use of the data c. J- = Estimated value likely to be low
5. 7.6 Evaluation of Radionuclides
Samples taken from this PRS were not analyzed for radioactive compounds because process
knowledge and facility history does not suggest any use of radionuclides associated with this
PRS.
5.7.7 Evaluation of Organic Chemicals
Table 5.7.7-1 presents the analytical results for SVOCs in the samples. A number of samples
contained PAHs above SAL. No other organic compounds were present at levels above SALs.
Two samples analyzed for SVOCs were PM-qualified due to poor response of the internal
standards. Sample 0316-95-0124RE had one internal standard that deviated from the acceptable
range by less than 5%. Sample 0316-95-0122RE had three internal standards that were
outside the acceptable range, indicating there were sample matrix problems. Detected
compounds in both samples were PM-qualified and should be considered estimated. This
qualification does not affect the use of these data for decision-making purposes, particularly
since only two of a total of eleven samples were qualified for problems associated with QA/QC
analysis. No VOCs were detected at this PRS. TNT was detected in sample 0316-95-0125 at
0.133 mg/kg, which is well below the SAL of 15 mg/kg (Table 5.7.7-2}.
TA-16 RFI Report 81 September 29, 1997

~ <D 3 tr ~ ~ jQ .... :g "''
~
i;! I ....
0)
:::0 ::!:! :::0 Ill "tt 0 .., -
a. b. c. d. e.
TABLE 5.7.7-1
PRS 16-026(c) SOIL CONCENTRATIONS FORDETECTED SEMIVOLATILE ORGANIC COMPOUNDS
DEPTH I Acenaphthene I Anthracene I Benzo(a) anthracene I Benzo(b) fluoranthene I Benzo(k) fluoranthene I Benzo(g,h,i) perylene I Benzo(a)pyrene SAMPLE ID
N/A =Not Applicable NC =Not Calculated J = Estimated quantity-result is above the detection limit but below the estimated quantitation limit. U = Undetected-the listed value is the detection limit. PM = Professional judgment should be applied prior to using the data .
~ ::::; ~ C':l ~
Acid

RFI Report
TABLE 5.7.7-2
PRS 16-026(c) SOIL CONCENTRATIONS FOR HIGH EXPLOSIVES
SAMPLE DEPTH TNT ID (ft) (mg/kg)
SAL N/Aa 15
EQL N/A 0.25 0316-95-0125 1-1.5 0.133
a. N/ A = Not Applicable
5.7.8 Risk-Based Screening Assessment
PAHs were detected at levels above SALs, although all were at concentrations of less than 1
ppm. lnorganics were present at levels less than SALs. The PAHs present above SALs included benzo(a}anthracene, benzo(b)fluoranthene, benzo(a)pyrene, and Dibenzo(a,h}anthracene. These PAHs will be retained as COPCs for further evaluation. Visual inspection of the data for constituents present at levels greater than background UTLS but less than SALs indicated that an MCE would not approach a target value of 1. Therefore, multiple constituent effects for contaminants below SALs are not considered for this PRS.
5.7.9 Human Health Risk Assessment
Three PAHs were identified in the screening assessment presented in Section 5.7 .8. PAHs were detected above SALs at this PRS. The sampling locations where PAHs were detected also receive storm-water runoff from asphalt paved areas such as the road that parallels this PRS boundary. The presence of PAHs in the analytical data from this site is not unexpected because PAHs are found in asphalt and are products of incomplete combustion from motor vehicles. The low concentrations of PAHs at this PRS (less than 1 ppm) are likely to be associated with runoff from the nearby paved areas rather than due to PAS-related
contamination.
Thus, the most likely explanation for the observation of PAHs in these soil samples is that they
represent nonspecific contamination associated with general industrial activities. The "Toxicological Profile for Polycyclic Aromatic Hydrocarbons (PAHs)" (ATSDR 1995, 55663) by
the Agency of Toxic Substances and Disease Registry shows that soil concentrations of PAHs in urban/industrial areas commonly range in the tens to hundreds of mg/kg. The source of these
constituents includes combustion products from organic materials and fossil fuels and runoff from asphalt and roofing tar.
TA-16 RFI Report 83 September 29, 1997

RFI Report
Process knowledge and history for the facilities associated with 16-026(c) suggests that PAHs
were not used in processes in this area. Asphalt is a common source of PAHs that is present
upgradient from the surface soils of this outfall. This material and vehicle emissions are the
likely sources for these contaminant signatures. This constitutes a continuing source of
contaminants and consequently is not within the scope of the Environmental Restoration
project. The PAHs will be dropped as COPCs for this PRS.
5.7.10 Preliminary Ecological Assessment
In cooperation with NMED and EPA Region 6, the Laboratory ER Project is developing an
approach for ecological risk assessment. Further ecological risk assessment at this site will be
deferred until this site can be assessed as part of the ecological exposure unit methodology
currently being developed. When completed, the ecological risk assessment will be provided
as an attachment.
5.7.11 Conclusions and Recommendations
Biased Phase I sampling located sample points likely to show evidence of a release. Inorganic
chemicals were identified above UTL values at this PRS, but are present at levels well-below
SALs. Organic chemicals were detected above SALs, but are associated with continuing
releases from the nearby asphalt roadway. In general, the data collected supports the site
conceptual model. The highest constituent concentrations are generally near the outfall
discharge point rather than in the further downgradient samples or in the samples at the
greatest depth.
Constituents have been bounded relative to SALs. Samples collected at depth and downgradient
within the drainage are well below SALs. This PRS is recommended for human-health NFA
based on NFA Criterion 5.
5.8 PRS 16-026(d)
PRS 16-026(d} is the outfall from two inactive sumps at TA-16-303. The sumps are PRS 16-
029(c) and will be investigated during a later field campaign. There was no contamination
above SALs, other than PAHs derived from a continuing source; therefore, this PRS is
recommended for human-health NFA.
September 29, 1997 84 TA-16 RFI Report

RFI Report
5.8.1 History
PRS 16-026(d) is discussed in detail in Subsection 5.2 of the RFI work plan (LANL 1993, 1 094}.
TA-16-303 is a rest house that serves TA-16-302, an HE casting facility. This facility was built
in 1953. The rest house is used for storing raw materials used in the casting process, and HE
castings produced in TA-16-302 (LANL 1989, 15-16-362}. Potential contaminants at this site
were identified as: HE, HE impurities and degradation products, metals, particularly barium
from baratol casting, and laboratory chemicals such as solvents.
5.8.2 Description
PRS 16-026(d) is located south of TA-16-303 (Figure 5.0-1 ). The outfall drains into a well
defined drainage ditch that parallels the access road. Runoff from the adjacent road drains into
the drainage ditch. The area is grassy and slopes gradually to the southeast. The HE sumps
that discharged into this PRS are plugged.
5.8.3 Previous Investigations
Beginning in 1970, Baytos conducted an extensive study of HE in outfalls at TA-16. One sample
from the TA-16-303 outfall was collected in April 1970. This sample contained 0.02% (by
weight) of HMX and/or RDX, and no TNT (Baytos 1970, 15-16-278). Another sample collected
in December 1970 contained 1.8% (by weight) of HMX and/or RDX, and 0.3% of TNT (Baytos
1970, 15-16-0017).
5.8.4 Field Investigation
The objective of Phase I sampling at this site was to determine via biased sampling if a release
had occurred from the drain line outfall and if that release caused contamination above action
levels. The sampling design was biased to detect contaminants by collecting samples at
locations most likely to be contaminated, according to the site conceptual model. The sampling
and analysis plan was also designed to: 1) delineate any contamination above action levels in
both a vertical and downgradient directions to support cleanup activities; and 2) provide
sufficient data to support a preliminary risk assessment. If contamination did occur, Phase I
investigation would also identify all COPCs.
The site conceptual model for releases at this outfall is that the primary release mechanism to
the PRS is by discharge of constituents from the outfall pipe to the downgradient drainage area.
It is assumed that such discharge will result in the highest constituent concentrations near the
TA-16 RFI Report 85 September 29, 1997

RFI Report
outfall and in the downgradient sediment traps, particularly the sediment traps nearest the
outfall. Non-volatile constituents (e.g. SVOCs, HE, inorganics) are hypothesized to decrease
in concentration vertically into tuff and downgradient from the outfall. Volatile organics are
likely to be at higher concentrations in subsurface samples because they are likely to volatilize
in near-surface samples due to temperature fluctuations. The soil-tuff interface consists of a
transition in both material and hydrogeologic properties that can act as a collection and
transport zone for contaminants. This conceptual model guided sampling and screening
locations by emphasizing samples near the outfall, surface samples, and soil-tuff interface
samples. Field screening- particularly for the HE, which are the principal constituents likely
to be present at this site- was further used to bias sample locations, based on this conceptual
model. The intent was to submit samples with positive screening results for laboratory analysis.
The EPA-approved RFI sampling plan for this site called for two boreholes to be drilled near
the outfall. The first borehole was drilled at the outfall. The second borehole was drilled
approximately 25 ft downstream at the next sediment trap. Samples were collected from the
surface interval, the interval bounding the soil-tuff interface, and the bottom of each borehole.
The bottom of each borehole was located at least 2.5 ft below the soil-tuff interface.
Beyond the boreholes, surface sample locations were screened for HE. At the first negative HE
screening location, a total of three surface laboratory samples were collected at 20-ft intervals.
Two additional surface laboratory samples were collected further downgradient in sediment
traps.
Out of 18 screening samples, 11 analytical samples were collected at this site. All samples
were collected with a hand auger except for the two samples at depth in the boreholes near the
outfall. These were collected with a split spoon. The depth of the borehole at the outfall itself
was 5 ft. The depth of the borehole downgradient from the outfall was 6.5 ft. The soil-tuff
interface is located at a depth of 0.8 ft in the area of this PRS.
All samples from this site were screened for HE, radiation, and volatiles. All samples screened
negative.
Because this PRS is located near other similar PRSs, the full 500ft of this drainage could not
be sampled as described in the original plan. This PRS runs into the drainage from PRS 16-
026(c) after 289ft. Therefore, only 289ft of PRS 16-026(d) was sampled. This does not affect
the outcome of this investigation because any contamination located more than 289ft away are
captured in the investigation of downgradient PRS 16-026(c).
September 29, 1997 86 TA-16 RF/ Report

RFI Report
Table 5.8.4-1 lists the samples analyzed at PAS 16-026(d). Figure 5.8.4-1 shows the locations
of the screening and laboratory samples taken at PRS 16-026(d).
TABLE 5.8.4-1
SUMMARY OF REQUEST NUMBERS FOR LABORATORY SAMPLES TAKEN ATPRS 16-026(~}.
SAMPLE ID LOCATION 1D DEPTH SAMPLE VOCs SVOCs HE {ft) MATRIX
0316-95-0132 16-1465 0-0.5 Soil NAa 546b 546
0316-95-0133 16-1465 0.6-1 Qbt4 546 546 546
0316-95-0134 16-1465 3-5 Qbt4 546 546 546
0316-95-0135 16-1656 0-0.5 Soil NA 546 546
0316-95-0136 16-1656 0.5-0.9 Qbt4 546 546 546
0316-95-0137 16-1656 5-6.5 Qbt4 546 546 546
0316-95-0 138 16-1466 0-0.5 Soil NA 121 121
0316-95-0139 16-1467 0-0.5 Soil NA 121 121
0316-95-0140 16-1468 0-0.5 Soil NA 121 121
0316-95-0141 16-1469 0-0.5 Soil NA 121 121
0316-95-0142 16-1470 0-0.5 Soil NA 121 121
a. NA = Not Analyzed b. ER analytical request number
TA-16 RFI Report 87
INORGs
547
547
547
547
547
547
122
122
122
122
122
September 29, 1997

RFI Report
Fence
PRS boundary
Contour interval 2 ft @ Sampling location
borehole
)( Sampling location
0132 Sample number-au sample numbers include the prefix '0316-95-.' Sample numbers beginning with a 0 or 2 are laboratory samples. Sample numbers beginning with a 1 are screening samples. Samples at core locations shown from shallowest to deepest. listed are above LANL UTLs; organics listed are detected. Underlined chemicals >
0 25 I I I I I I I I I I I
Source: FIMAD ARC VIEW, 7/96 Modified by: cARTography by A. Kron 7/19/97
' ' .. .\ 16-026( d)
·.. ·· .. ' . .., )( 1034 \
. ' ' ' ' ' ' 1035\
)( ' ' ' ' ' ' ' ' ' ·· .. '
·· ... '·
··· ...
. 0142-PAHs, SVOCs
)I( 1 037\-- . , ...... , .. , ........ · ' ' ' ' ' ., ,.
'·. ' ' ' ' ' '
·. ·· ...... ···
' . ' ...
Fig. 5.8.4-1. Screening and laboratory sample locations at PRS 16-026(d).
September 29, 1997 88 TA-16 RFI Report

RFI Report
5.8.5 Evaluation of Inorganic Chemicals
lnorganics were present at levels greater than UTLs but less than SALs at PAS 16-026(d).
Because samples collected at the soil-tuff interface are conservatively compared to the Qbt4
UTL, this can cause certain analytes, such as arsenic, to appear elevated. Table 5.8.5-1
presents the analytical results for inorganics present at levels above UTLs.
TABLE 5.8.5-1
INORGANICS WITH CONCENTRATIONS GREATER THAN BACKGROUND UTL FOR PAS 16-026(d)
SAMPLE ID DEPTH SOIUROC!C ~ .. v-•• ov BARIUM CHROMIUM LEAD VANADIUM (ft) UNIT (mg/kg) (mg/kg) (mg/kg) (mg/kg) (mg/kg)
LANL UTL (all soil) N/Aa N/A 7.82 315 19.3 23.3 41.9
LANL UTLjQbt4) N/A N/A 2.18 56.6 10.9 11 9.5 SAL N/A N/A NCb 5 300 210 400 540
0316-95-0132 0-0.5 soil 1.3 267 5.3 (J0
) 21.9 10.3
0316-95-0133 0.5-1 Qbt4 2.2 263 (J) 17 (J}_ 60.5 10.2 0316-95-0134 3-5 Qbt4 0.35 (U) 100 (J) 40.1 (J) 1.1 1.1 (U) 0316-95-0135 0-0.5 soil 1.2 129 (J) 1.9 (J) 17 5.9 0316-95-0136 0.5-0.8 Qbt4 1.7 I ~:~ ~~~ II
4.3 (J)
I' 79.8 I 7.6
0316-95-0137 5-6.5 Qbt4 0.55(U) : 72.7 {J) 1.3 1.7 (U) 0316-95-0138 0-0.5 soil 1.9 196 4.4 11.9 14.2 0316-95-0140 0-0.5 soil 1.4 155 3.1 5.2 8.3
a. N/A =Not Applicable b. NC = Not Calculated
ZINC (mg/kg)
50.8
75.4 23000
134 (J)
132 (J
20.4 J
57.8 J
55.0 (J
23.1 J
I 80.3 68.3
c. J = Estimated quantity-result is above the detection limit but below the estimated quantitation limit.
5.8.6 Evaluation of Radionuclides
I
Radionuclides were not analyzed for at this PRS because process knowledge and facility
history suggests that there were no radionuclides associated with this PRS.
5.8.7 Evaluation of Organic Chemicals
Table 5.8.7-1 presents the analytical results for SVOCs in the samples. A number of samples
contained PAHs, although the only organic compound present at levels above SALs was
benzo(a)pyrene. Sample 0316-95-0139 had elevated detection limits due to matrix effects in
the sample.
TA-16 RFI Report 89 September 29, 1997

RFI Report
TABLE 5.8.7-1
PAS 16-026(d) SOIL CONCENTRATIONS FOR DETECTED SEMIVOLATILE ORGANIC COMPOUNDS
Dlethyl phthalate Di-n-butyl phthalate Fluoranthene Fluorene Naphthalene Phenanthrene (mg/kg) (mg/kg) (mg/kg) (mg/kg) (mg/kg) (mg/kg)
52000 6 500 2600 2300 1 000 NCb 0.33 0.33 0.33 0.33 0.33 0.33
0.38 (Ud) 0.38 (U) 0.56 0.059 (J) 0.04 (J) 0.42
0.38 (U) 0.38 u 0.82 0.079 (J) 0.058 (J) 0.65 0.74 (U) 0.17 (J 0.74 (U) 0.74 U) 0.74 U) 0.74 (U
0.80 0.35(U 0.35 (U 0.35 U) 0.35 U) 0.35 (U 0.36(U 0.36 u 0.36 (U 0.36 u 0.36 U) 0.36(U 0.34(U 0.34 u 0.12 (J 0.34 u 0.34 UJ 0.13 (J 0.38 (U 0.38 u 0.18 (J 0.38 u 0.38 UJ 0.12 (J 0.054 (J) 0.4(U 0.63 0.04 J 0.4(U 0.47
a. N/A =Not Applicable b. NC = Not Calculated
-~~e (mg/kg) 19000
0.33 1.2
0.970 0.74 (U) 0.35 (U) 0.037 (J) 0.28 (J) 0.26 {J) 0.810
c. J = Estimated quantity-result is above the detection limit but below the estimated quantitation limit. d. U = Undetected-the listed value is the detection limit.
The only VOCs detected during analysis were methylene chloride and trichlorofluoromethane.
However, they were not present in levels greater than the EQL and were also found during
analysis of the analytical blank sample.
Table 5.8.7-2 presents the data for high explosives detected during analysis. RDX is the only
HE present at a level near SAL.
September 29, 1997 90 TA-16 RFI Report

TABLE 5.8.7-2
PRS 16-026{d) SOIL CONCENTRATIONS FOR HIGH EXPLOSIVES
SAMPLE ID DEPTH (ft) 4·ADNT (mg/kg) RDX1mQlkQY SAL N/Aa NCb 4
EQL N/A NC 1 0316-95-0133 0.6-1 0.091 (Uc) 0.174 (U)
0316-95-0136 0.5-0.9 0.168 0.173 (U) 0316-95-0139 0-0.5 0.091 (U) 2.42
a. N/ A = Not Applicable b. NC = Not Calculated c. U = Undetected-the listed value is the detection limit.
5.8.8 Risk-Based Screening Assessment
RFI Report
TNT1mQ7KQ) 15
0.25 0.24
0.196 0.079(U)
The PAH benzo(a)pyrene was detected at levels above SALs. It is a COPC. Other SVOCs were
reported at levels above detection limits but less than SALs.
Arsenic is not included in the MCE since there is no calculated SAL. In addition, only one
sample out of eleven was slightly above UTL. Therefore, arsenic will not be retained as a
COPC. lnorganics were present at levels less than SALs. An MCE was calculated for this PAS
using values for constituents greater than UTLs but below SALs. The results are shown in
Table 5.8.8-1.
The MCE calculation was performed using the sum of the maximum concentrations at this PAS.
The MCE results for noncarcinogens and chemical carcinogens were 0.3 and 1.5, respectively.
Because the MCE value for noncarcinogens is less than unity, a potential human health risk
based on additive effects is not identified for this class of chemical. The carcinogenic COPCs
that have a normalized value of more than 0.1 in the MCE at this PRS are chromium,
benzo(a)anthracene, and RDX. These compounds are, therefore, retained as COPCs for
further evaluation.
TA-16 RFI Report 91 September 29, 1997

RFI Report
TABLE 5.8.8-1
MCE FOR PRS 16-026{d)
ANALYTE MAX CONC. SAL NORMALIZED (mg/kg) (mg/kg) VALUE
Noncarcinogenic Effects
Barium 292 5300 0.055 Lead 79.8 400 0.200
Vanadium 14.2 540 0.026
Zinc 134 23000 0.006
Acenaphthene 0.095 2200 <0.001 Anthracene 0.14 18 000 <0.001 Benzoic Acid 0.15 100 000 <0.001
Di-n-butylphthalate 0.17 6500 <0.001 Diethyl phthalate 0.8 52000 <0.001 Fluoranthene 0.82 2600 <0.001
Fluorene 0.079 2300 <0.001
Naphthalene 0.058 1 000 <0.001
Pyrena 1.2 19000 <0.001
TOTAL 0.3 Carcinogenic Effects
Chromium 72.7 210 0.346
Benzo(a)anthracene 0.31 0.61 0.508
Chrysene 0.41 61 0.007
RDX 2.42 4 0.605
lNf 0.321 15 0.021
TOTAL 1 .5
5.8.9 Human Health Risk Assessment
Two PAHs were identified as COPCs in the screening assessment presented in Section 5.8.8.
One PAH was detected above SALs at this PRS. The sampling locations where PAHs were
detected also receive storm-water runoff from asphalt paved areas such as the road that
parallels this PAS's boundary. The presence of PAHs in the analytical data from this site is not
unusual because PAHs are found in asphalt and are products of incomplete combustion from
motor vehicles. The low concentrations of PAHs at this PRS (less than 1 ppm) are likely to be
associated with runoff from the nearby paved areas rather than due to PAS-related
contamination.
Thus, the most likely explanation for the observation of PAHs in these soil samples is that they
represent nonspecific contamination associated with general industrial activities. The
"Toxicological Profile for Polycyclic Aromatic Hydrocarbons (PAHs)" (ATSDR 1995, 55663) by
the Agency of Toxic Substances and Disease Registry shows that soil concentrations of PAHs
September 29, 1997 92 TA-16 RFI Report

RFI Report
in urban/industrial areas commonly range in the tens to hundreds of mg/kg. The source of these
constituents includes combustion products from organic materials and fossil fuels and runoff
from asphalt and roofing tar.
Process knowledge and history for the facilities associated with 16-026(d) suggests that PAHs
were not used in processes in this area. Asphalt is a common source of PAHs that is present
upgradient from the surface soils of this outfall. This material and vehicle emissions are the
likely sources for these contaminant signatures. This constitutes a continuing source of
contaminants and consequently is not within the scope of the Environmental Restoration
project. The PAHs will be dropped as COPCs for this PAS.
The carcinogenic chemicals analyzed in the MCE had a normalized sum of 1.5. The COPCs that
have a normalized contribution of more than 0.1 relative to SALs at this PAS other than PAHs
are chromium and RDX. Comparison of the maximum concentrations detected for these two
chemicals to preliminary remediation goals (PRGs) for industrial soil published by USEPA
Region IX indicate that concentrations of these carcinogenic compounds in the soil around this
outfall are well below concentrations that would potentially impact human health under an
industrial exposure scenario (Table 5.8.9.1-1 ). Region IX PRGs for industrial soil are
conservatively based on 250 days per year of exposure, an assumption that is highly
conservative for an outfall area along a roadside at TA-16. In addition, the SAL-based MCE
calculation performed in Section 5.8.8 assumes additivity of toxicity endpoints. These maximum
values occur at different locations and depths making simultaneous exposure to these
concentrations extremely unlikely. Based on this qualitative evaluation for the carcinogenic
chemicals detected at this PAS, further human health risk analyses for these chemicals is not
justified. Use of an MCE-type approach, where COPC concentrations are normalized to
industrial PRGs, also suggest little significant carcinogenic risk at this site under and industrial
scenario (Table 5.8.9.1-1 ).
TABLE 5.8.9.1-1
COMPARISON OF NONCARCINOGENIC COPCs TO INDUSTRIAL SOIL PRGs
Max1mum lndustnal So11 Normalized Chemical Concentration PRG Concentration relative to
(mg/kg) (mg/kg) Industrial PRGs
Chromium 73 450 0.16
RDX 2 17 0.12
Sum 0.28
TA-16 RFI Report 93 September 29, 1997

RFI Report
The COPC data collected at this PRS demonstrate that COPCs other than PAHs are bounded
relative to SALs. Downgradient samples have levels of COPCs and other constituents much
less than SALs. The PAHs are an exception, but they are due to non-point source discharge
from the nearby road. The deepest borehole samples are also less than SALs, although
elevated chromium and barium are present at depth. Similar anomalous chromium at depth, at
locations where there has not been a widespread chromium release, are observed in several
drainages described in this report.
5.8.10 Preliminary Ecological Assessment
In cooperation with NMED and EPA Region 6, the Laboratory ER Project is developing an
approach for ecological risk assessment. Further ecological risk assessment at this site will be
deferred until this site can be assessed as part of the ecological exposure unit methodology
currently being developed. When completed, the ecological risk assessment will be provided
as an Attachment.
5.8.11 Conclusions and Recommendations
Biased Phase I sampling located sample points likely to show evidence of a release. Analytical
results established only a single COPC above SALs, the PAH benzo(a)pyrene. PAHs are due
to runoff from the roadway that is adjacent to the PRS. Qualitative evaluation of other COPCs
that are derived from an MCE calculation suggest that the risk to human health is acceptable
under an industrial scenario. These data generally support the site-conceptual model, except
for the anomalous barium and chromium values observed in the deepest samples. These
elevated values may be due to natural high values of these constituents in the subunit of the
Bandelier tuff that underlies this PRS.
Constituents other than PAHs are bounded at depth and downgradient relative to SALs. Only
low levels of PRS-related constituents were found in samples at depth and in the farthest
downgradient samples. Because no constituents are present at levels of concern, this PRS is
recommended for human-health NFA under Criterion 5.
5.9 PRS 16·026(v)
PRS 16-026(v) is an outfall associated with sumps at TA-16-460, a decommissioned analytical
laboratory. Although HE, metals, and PAHs were found in this outfall, they were not found at
levels that pose a threat to human health. Therefore this PRS is recommended for human
health NFA.
September 29, 1997 94 TA-16 RFI Report

RFI Report
5.9.1 History
PAS 16-026(v) is discussed in detail in Subsection 5.2 of the RFI work plan (LANL 1993, 1 094).
PRS 16-026(v) is the outfall from an inactive sump associated with TA-16-460. TA-16-460 was
constructed in 1952. Because this building was an analytical chemistry laboratory, a number
of chemicals could be present in the outfall. In 1968, a small mercury spill occurred in one of
the laboratories, although there was no record that mercury entered the drain system. Although
it is no longer used as an HE laboratory, it is actively used to support bioremediation studies
in greenhouses nearby. Potential contaminants at this site were identified as: HE, HE
impurities and degradation products, metals, and laboratory chemicals such as solvents.
5.9.2 Description
PRS 16-026(v) is located southeast of TA-16-460 (Figure 5.0-1 ). The outfall received effluent
from the HE sump, floor drains, bench drains, sink drains, steam drains, and a drinking fountain
drain. The outfall is currently controlled under National Pollutant Discharge Elimination System
(NPDES) permit, EPA 05A072. The sump outfall has been plugged and no longer receives
effluent. The outfall is in the process of being deleted from the NPDES Permit. The outfall
discharged into a well-defined drainage. Roof drains also discharge into the drainage from a
separate outfall. Parking lot runoff discharges to the drainage.
5.9.3 Previous Investigations
An inventory of the wide range of chemicals used in TA-16-460 was compiled in 1971
(Panowski and Salgado 1971, 15-16-038). The studies and the inventory are discussed in
detail in the RFI Work Plan for OU 1082 (LANL 1993, 1 094).
Several studies of effluent from TA-16 sumps have been performed over the last 30 years. Two
studies involved the outfall associated with PRS 16-026(v). A study of soils in this drainage
showed no barium, HMX, RDX, or TNT (Turner and Schwartz 1971, 15-16-284). In 1988,
Baytos analyzed water samples from this outfall that were released over 10 consecutive
working days. This study showed that 8 ppm of acetone was present in the sump on one day
and 2.2 ppm of methyl ethyl ketone was present in the sump on another day. Suspended solids
ranged from 0 ppm to 2.5 ppm.
TA-16 RFI Report 95 September 29, 1997
RFI Report
5.9.4 Field Investigation
The objective of Phase I sampling at this site was to determine via biased sampling if a release
had occurred from the drain line outfall and if that release caused contamination above action
levels. The sampling design was biased to detect contaminants by collecting samples at
locations most likely to be contaminated, according to the site conceptual model. The sampling
and analysis plan was also designed to: 1) delineate any contamination above action levels in
both a vertical and downgradient directions to support cleanup activities; and 2) provide
sufficient data to support a preliminary risk assessment. If contamination did occur, Phase I
investigation would also identify all COPCs.
The site conceptual model for releases at this outfall is that the primary release mechanism to
the PRS is by discharge of constituents from the outfall pipe to the downgradient drainage area.
It is assumed that such discharge will result in the highest constituent concentrations near the
outfall and in the downgradient sediment traps, particularly the sediment traps nearest the
outfall. Non-volatile constituents (e.g. SVOCs, HE, inorganics) are hypothesized to decrease
in concentration vertically into tuff and downgradient from the outfall. Volatile organics are
likely to be at higher concentrations in subsurface samples because they are likely to volatilize
in near-surface samples due to temperature fluctuations. The soil-tuff interface consists of a
transition in both material and hydrogeologic properties that can act as a collection and
transport zone for contaminants. This conceptual model guided sampling and screening
locations by emphasizing samples near the outfall, surface samples, and soil-tuff interface
samples. Field screening- particularly for the HE, which are the principal constituents likely
to be present at this site- was further used to bias sample locations, based on this conceptual
model. The intent was to submit samples with positive screening results for laboratory analysis.
The RFI sampling plan for this site called for two boreholes to be drilled near the outfall. The
first borehole was drilled at the outfall. The second borehole was drilled at the next downstream
sediment trap. Borehole samples were collected from the surface interval, the interval
bounding the soil-tuff interface, and the bottom of each borehole. The bottom of each borehole
was located at least 2.5 ft below the soil-tuff interface.
The field team was required to deviate slightly from this original plan. Only two samples were
collected in the borehole farther from the outfall because the sediment profile overlaying the
soil-tuff interface was too thin to yield sufficient sample for analysis of two samples. Therefore,
the surface and the soil-tuff interface samples were combined into one sample. This sample
September 29, 1997 96 TA-16 RFI Report

RF/Report
was collected from the 0- to 0.5-ft depth. At the outfall itself, the soil-tuff interface was found
to be very shallow as well; however, a surface sample from the 0- to 0.5-ft interval and an
interface sample from the 0.2- to 1-ft interval were collected.
Beyond the boreholes, sample locations were screened for HE at 1O-ft intervals. At the first
negative HE screening location, a total of three surface laboratory samples were collected at
20-ft intervals. Two additional surface laboratory samples were collected further down gradient.
Out of 14 screening samples, 10 analytical samples were collected at this site. Samples at the
outfall were collected with a Minute Man TM drill rig. The samples in the second borehole were
collected with a split spoon. The depth of the borehole at the outfall itself was 3.5 ft. The depth
of the borehole located 6 ft downgradient from the outfall was 4 ft.
All samples from this site were screened for HE, radiation, and volatiles. Samples 0316-95-
0189 and -0190 screened positive for 2 ppm of VOCs. All other screening results were
negative.
Table 5.9.4-1 summarizes the laboratory samples collected at PRS 16-026(v). Figure 5.9.4-1
shows the locations of these samples.
TABLE 5.9.4-1
SUMMARY OF REQUEST NUMBERS FOR LABORATORY SAMPLES TAKEN AT PRS 16-026(v)
SAMPLE ID LOCATION ID DEPTH SAMPLE VOCs SVOCs HE INORGs {ft) MATRIX
0316-95-0188 16-1513 0-0.5 Soil NAa 923b 923 924
0316-95-0189 16-1513 0.2-1 Qbt4 1391 1391 1391 1392
0316-95-0190 16-1513 2-3.5 Qbt4 1391 1391 1391 1392
0316-95-0191 16-1660 0-0.5 Soil NA 923 923 924
0316-95-0193 16-1660 2.5-4 Qbt4 980 980 980 981
0316-95-0194 16-1514 0-0.5 Soil NA 140 140 141
0316-95-0195 16-1515 0-0.5 Soil NA 140 140 141
0316-95-0196 16-1516 0-0.5 Soil NA 140 140 141
0316-95-0197 16-1517 0-0.5 Soil NA 140 140 141
0316-95-0198 16-1518 0-0.5 Soil NA 140 140 141
a. NA = Not Analyzed b. ER analytical request number
u
925
1393
1393
925
982
142
142
142
142
142
TA-16 RFI Report 97 September 29, 1997

RFI Report
0188-Chromium, copper, lead, mercury, nickel, silver, zinc, PAHs, SVOCs, tetryf 0189-Arsenic, barium, chromium, copper, lead, mercury, nickel, silver, zinc, VOCs, diethylphthalate
· 0190-Barium, beryllium, copper, nickel, zinc,VOCs, PAHs, SVOCs ·
- Permanent structure
--------Paved road
------- PAS boundary
Contour interval 2 ft
········· .... .···············
.. · .. ···········
.···
1761750
\. .··· .. ··
'x 0197-Mercury, PAHs, SVOCs ·. 1115. . '
0198-PAHs, SVOCs 1119
@ Sampling location-borehole
X Sampling location
1116 Sample number-all sample numbers include the prefix '0316-95-." Sample numbers beginning with a 0 or 2 are laboratory samples. Sample numbers beginning with a 1 are screening samples. Samples at individual core locations shown from shallowest to deepest. Metals listed are abcve LANL UTLs; organics listed are detected; analytes unde~ined are abcve SAL.
.··········· .. ... ········
0 50 100 It I I I I I I I I I I I
Source: FIMAD ARC VIEW, 7196 Modified by: cARTography by A. Kron 7/19/97
Fig. 5.9.4-1. Sample locations at PRS 16-026(v).
September 29, 1997 98 TA-16 RFI Report

RFI Report
5.9.5 Evaluation of Inorganic Chemicals
Several metals were found at levels greater than UTLs (Table 5.9.5-1 ). The number of metals
exceeding UTLs decreases with distance from the outfall. Chromium , lead, and zinc were P
qualified in some samples because of poor duplicate spike recovery. These data should be
considered estimated. Mercury was detected in the blanks associated with samples 0316-95-
0190 and -0193. However, the mercury in the analytical samples was below the UTL in sample
-0190 and not detected in sample -0193. Therefore, blank contamination apparently did not
affect these samples.
TABLE 5.9.5-1
INORGANICS WITH CONCENTRATIONS GREATER THAN BACKGROUND UTLs FOR PRS 16-026(v)
SAMPLE ID DEPTH SOIL/ROCK ARSENIC BARIUM BERYLLIUM CHROMIUM COPPER LEAD MERCURY NICKEL SILVER ZINC (It) UNIT (mg/kg) (mg/kg) (mg/kg) (mglkg) (mg/kg) (mg/kg) (mg/kg) (mg/kg) (mg/kg) (mglkg)
LANL UTL (all soil) N/Aa N/A 7.82 315 1.95 19.3 15.5 23.3 0.1 15.2 Ncf 50.8
LANL UTL (Qbt4) NIA N/A 2.18 56.6 1.82 10.9 6.4 11 1\C 8.73 <1 75.4 SAL NJA N/A 1\C 5300 1\C 210 2800 400 23 1500 380 23000 0316·95-0188 0-0.5 soil 3.6 194 0.71(Uc) 26.5 4~ 4.1 26.1 5.3 321
0316-95-0189 0.1-1 Qbt4 2.8 317 0.51 19.6(J-d,P9) 65.8 . 4.3 9.9 5.3 101(P)
0316-95-0190 2-3.5 Qbt4 1.9 190 2 5.5(J- P) 50.4 8.4 0.09 22 o~n•PI 0316-95-0191 o-o.3 soli 1.4 116 0.88 u 24.4 126 64.7 4.2 14.4 7 167 0316-95-0193 2.5-4 Qbt4 1.2 14.6 0.57 160 2.4 1.7(J-,P) 0.1(U) 3.8 0.55 1.31J-,Pl 0316-95-0194 0-0.5 soil 2.1(U} 63.5 1.21U) 14.8 32.8 33.6
** 5.2 4.1 141
0316-95-0195 0-0.5 soil 1.5(U) 68.7 1.2(U} 23.8 53.3 43 6.2(U) 5 157 0316-95-0196 0-0.5 soli 2.3 126 1.1(U) 14.2 19.3 23 7.3(U) 1.7(Ul I 71.9 0316-95-0197 0-0.5 soil 2.1 142 1.1 10.1 11.1 13.4 0 6.2(U} 0.86(Ul 43.9 0316-95-0198 0-0.5 soil 3.2 167 0.66 8.6 8.3 14.1 _I 0.09(U) 6.2 0.65(U) 33.3
a. N/A =Not Applicable b. NC = Not Calculated c. U = Undetected-the listed value is the detection limit. d. J- = Estimated value likely to be low. e. P = Professional judgment should be applied, depending on proposed use of the data.
5.9.6 Evaluation of Radionuclides
Uranium was the only radionuclide analyzed for at this PRS. Uranium was not present at a level
above UTL in any sample.
TA-16 RFI Report 99 September 29, 1997

RFI Report
5.9.7 Evaluation of Organic Chemicals
Table 5.9.7-1 presents the results for VOC analysis at this PRS. Methylene chloride and
trichlorofluoromethane are the only volatile compounds detected. Both were detected at low
levels and the data are qualified as estimated.
TABLE 5.9.7-1
PRS 16-026(v) SOIL CONCENTRATIONS FOR DETECTED VOLATILE ORGANIC ANAL YTES
SAMPLE DEPTH METHYLENE CHLORIDE TRICHLOROFLUOROMETHANE ID (ft) (mg/kg) (mg/kg)
SAL N/Aa 7.8 380
EQL N/A 0.005 0.005 0316-95-0189 0.1-1 0.004 {Jb) 0.007 (J)
0316-95-0190 2-3.5 0.004 (J) 0.013 (J)
a. N/A =Not Applicable b. J = Estimated quantity-result is above the detection limit but below the estimated
quantitation limit.
Several locations contained SVOCs at levels greater than SALs. Many samples analyzed for
SVOCs have J-qualified data. In general, the internal standard responses were poor for most
of the samples in this PRS. Reanalyzed data have been used for two samples. In addition, one
sample was diluted and reanalyzed because one analyte exceeded the calibration range.
Samples 0316-95-0195 and -0196 had high detection limits due to interference from matrix
effects. The data to be used in the assessment of this PRS are shown in Table 5.9.7-2.
Table 5.9.7-3 shows the HE present in the analytical samples from this site. PRS 16-026{v) is
one of the few sites where triaminotrinitrobenzene (TATS) has been detected. TATB is an
explosive used at TA-16 in large quantities; however, it is highly insoluble and therefore not
frequently found in soils associated with HE sumps.
September 29, 1997 100 TA-16 RFI Report

~ I .... 0)
::0 :::!! ::0 (I) "tl 0 .., ....
.... c ....
~ Ci!' 3 0" (I) .., -~ .... ~ "'
a b
c d
e f
TABLE 5.9.7-2 PRS 16-026(v) SOIL CONCENTRATIONS FOR DETECTED SEMIVOLATILE ORGANIC ANALYTES
SAMPLE ID
DEPTH (FT)
N/A =Not applicable . NC = Not calculated.
ACENAPH· I ANTHRA· I BENZO(A)· I BENZO(A)-THENE CENE ANTHRACENE PYRENE
BENZO(G,H,I)·I BENZOIC I BENZO(K)· I BIS(2·ETHYL· PERYLENE ACID FLUORANTHENE HEXYL)PHTHALATE
J = Estimated quantity. Result is above the detection limit but below the estimated quantitation limit. U = Undetected. The listed value is the detection limit. NA = Not analyzed. UJ = The analyte was not positively identified in the sample and the associated value is an estimate of the EQUEDL.
CHRY· SENE
~ ~ ~ \:)
~

RFI Report
TABLE 5.9.7-3
PRS 16-026(v) SOIL CONCENTRATIONS FOR DETECTED HIGH EXPLOSIVE ANAL YTES
SAMPLE DEPTH TETRYL TATB 10 (ft) (mg/kg) (mg/kg)
SAL N/Aa 650 NCb EQL N/A 0.65 NC 0316-95-0188 0-0.5 0.122 NA 0316-95-0194 0-0.5 0.101 10.5 0316-95-0195 0-0.5 0.096 (Uc) 11.1
0316-95-0196 0-0.5 0.096 (U) 2.41
a N/A = Not applicable. b NC = Not calculated. c U = Undetected. The listed value is the detection limit.
5.9.8 Risk-Based Screening Assessment
PAHs were detected at levels above SALs, although all were at concentrations less than 10
ppm. lnorganics were present at levels less than SALs. The PAHs present above SAL include
benzo(a}anthracene, benzo(a)pyrene, benzo(b)fluoranthene, dibenzo(a,h)anthracene, and
indeno(1 ,2,3-cd)pyrene These PAHs are COPCs for this PRS.
Since arsenic was detected slightly above the Qbt4 UTL in a soil-tuff interface sample, which
is a very conservation assessment, arsenic will not be retained as a COPC. Beryllium was
detected slightly above UTL (2.0 vs. 1.82) in one sample and will not be retained as a COPC.
Maximum concentrations of carcinogenic and noncarcinogenic compounds present at levels
greater than background UTLs but less than SALs were used for an MCE. The result of this
MCE is shown in Table 5.9.8-1. The MCE values for the noncarcinogenic and carcinogenic
compounds were 0.9 and 1.4, respectively. The MCE for noncarcinogens is less than the target
value of 1, so none of these constituents will be retained as COPCs. The MCE for carcinogens
is greater than 1, the target action level. This indicates that these compounds are present at
large enough concentrations to warrant further evaluation at PRS 16-026(v). The carcinogenic
COPCs that have a normalized value of more than 0.1 in the MCE at this PRS are chromium,
benzo(k)fluoranthene, and chrysene. These compounds are, therefore, retained as COPCs for
further evaluation.
September 29, 1997 102 TA-16 RF/ Report

RFI Report
TABLE 5.9.8-1
MCE CALCULATION FOR PRS 16·026(v)
MAX CONCENTRATION SAL NORMALIZED
ANALYTE mg/kg mg/kg VALUE
Noncarcinogenic Effects Barium 317 5300 0.060 Copper 412 2800 0.147 Lead 103 400 0.258 Mercury 9.2 23 0.400 Nickel 26.1 1500 0.017 Silver 7.8 380 0.021 Zinc 170 23000 0.007 Trichlorofluoromethane 0.01 380 <0.001 Acenaphthene 1.3 2200 0.001 Anthracene 2.6 18000 <0.001 Fluoranthene 13 2600 0.005 Fluorene 1.6 2300 <0.001 Naphthalene 1.2 1000 0.001 Pyrene 9.7 19000 <0.001 Benzoic Acid 0.59 100000 <0.001 Dibenzofuran 0.83 260 0.003 Diethylphthalate 0.093 52000 <0.001 4-Methylphenol 0.42 330 0.001 Tetryl 0.122 650 <0.001
TOTAL 0.9
Carcinogenic Effects
Chromium 160 210 0.762 Methylene Chloride 0.004 7.81 <0.001 Benzo(k)fluoranthene 2.7 6.1 0.443 Chrvsene 6.9 61 0.113 Bis(2-ethylhexyl)phthalate 2.9 32 0.091
TOTAL 1 .4
5.9.9 Human Health Risk Assessment
A quantitative human health risk assessment was not performed for this PRS. However, a
qualitative evaluation of the COPCs identified in the screening assessment is presented.
The carcinogenic COPCs identified above SALs in the screening assessment include the PAHs
benzo(a)anthracene, benzo(a)pyrene, benzo{b)fluoranthene, dibenzo(a,h)anthracene, and
indeno(1 ,2,3-cd)pyrene. Also included as COPCs from the MCE are chromium, chrysene and
benzo(k)fluoranthene {the concentrations of these chemicals did not exceed a SAL). The PAHs
exceeded their SAL values in three samples at the outfall at a maximum concentration of 6.5
mg/kg. This maximum concentration [benzo(b)fluoranthene] exceeds the SAL by an order of
magnitude. The sampling locations where PAHs were detected also receive storm-water runoff
TA-16 RFI Report 103 September 29, 1997

RFI Report
from asphalt paved areas such as the parking lot to the west of the PRS. The presence of PAHs
in the analytical data from this site is not unusual because PAHs are found in asphalt and are
products of incomplete combustion from motor vehicles. The low concentrations of PAHs at this
PRS (less than 10 ppm) are likely to be associated with runoff from the nearby paved areas and
roof drains rather than due to PAS-related contamination.
The most likely explanation for the observation of PAHs in these soil samples is that they
represent nonspecific contamination associated with general industrial activities. The
"Toxicological Profile for Polycyclic Aromatic Hydrocarbons (PAHs)" (ATSDR 1995, 55663) by
the Agency of Toxic Substances and Disease Registry shows that soil concentrations of PAHs
in urban/industrial areas commonly range in the tens to hundreds of mg/Kg. The source of
these signatures includes combustion products from organic materials and fossil fuels and
runoff from asphalt and roofing tar.
Process knowledge and history for the facilities associated with 16-026(v) suggests that PAHs
were not used in this area. Asphalt and roof tar are common sources of PAHs that are
upgradient from the catchment for this outfall. These materials and vehicle emissions are the
likely sources for these contaminant signatures. Parking lot runoff and roof drain runoff directly
and strongly impact this drainage. This constitutes a continuing source of contaminants and
consequently is not within the scope of the Environmental Restoration Project. The PAHs will
be dropped as COPCs for this PRS.
The maximum chromium value that contributed 0.762 (160 mg/Kg) to the MCE for carcinogens
is from a sample collected 2.5-4 ft below the ground surface. All the other chromium values are
less that 27 mg/Kg. There is no viable exposure pathway for the location of the maximum
chromium values under the current landuse conditions. Industrial use of the site is anticipated
for the foreseeable future. The chromium value is well-below the industrial PRG for chromium.
Therefore, further investigation of chromium as a COPC is not proposed.
COPCs are bounded in the downgradient and vertical directions relative to SALs. Samples at
depth and downgradient samples are all at levels less than SALs. Most constituents show
general decreases in concentration both with increased depth and in the downgradient
direction. Chromium is somewhat anomalous, as is typical in sump drainages, because it
shows its highest value in a sample taken at a depth of 2.4 ft.
September 29, 1997 104 TA-16 RFI Report

RFI Report
5.9.1 0 Preliminary Ecological Assessment
In cooperation with NMED and EPA Region 6, the Laboratory ER Project is developing an
approach for ecological risk assessment. Further ecological risk assessment at this site will be
deferred until this site can be assessed as part of the ecological exposure unit methodology
currently being developed. When completed, the ecological risk assessment will be provided
as an attachment.
5.9.11 Conclusions and Recommendation
Biased samples collected during the Phase I investigation showed no contamination present
at levels likely to pose an unacceptable risk to human receptors under an industrial land use
scenario. Metals were not present above SALs. PAHs were present above SALs but are
associated with continuing releases from nearby parking lots and roof drains.
These data generally support the site-conceptual model, except for the anomalous chromium
value observed in a deep sample. This elevated value may be due to natural high values of
chromium in the subunit of the Bandelier tuff that underlies this PRS.
Contamination at this site is bounded. Both downgradient samples and sample at depth are
present at levels below SALs. This PRS is proposed for a human-health NFA under NFA
criterion 5.
5.10 16-028{a) South Drainage
The south drainage is the main drainage channel from the burning ground at TA-16. It is
designated as PRS 16-028(a) in Addendum I to RFI Work Plan for Operable Unit 1082 (LANL
1994, 1160). One sample location contained HE at a level greater than SAL but less than PRG.
The PRS is recommended for human health NFA.
5.1 0.1 History
The south drainage is discussed in detail in Subsection 5.8 of the RFI Work Plan for Operable
Unit 1082 (LANL 1993 1 094). It is also discussed in Section 6.4 under PRS 16-028(a) of
Addendum I to the RFI Work Plan (LANL 1994, 1160).
The south drainage PRS was established in 1993. In 1994, PRS 16-028(a) was found to be
synonymous with the south drainage PRS. The drainage was suspected to contain various
types of HE contamination and, possibly, barium from the burning ground runoff. Potential
contaminants at this site were identified as HE, HE impurities and degradation products, metals
TA-16 RFI Report 105 September 29, 1997

RFI Report
(particularly barium}, and laboratory chemicals such as solvents that were burned at the
burning ground.
5.1 0.2 Description
PRS 16-028(a} is referred to as the south drainage because it is located on the south end of
the TA-16 Burning Ground (Figure 5.0-1} and provides the only drainage for half the burning
ground. It also marks the southern edge of burning ground activities. The drainage channel is
well defined and is cut into the steep, rocky side of the mesa. PRSs 16-010{c,d,e,f,g,h,j,k,l,m}
are all upgradient of this PRS. Based on Phase I sampling during fiscal year 1995, several of
these PRSs {16-01 O[h,k,l,m]} are contaminated at levels well above SALs for HE. They will be
cleaned up in a future Voluntary Corrective Measure (VCM} or Voluntary Corrective Action
(VCA}. Most of the rest of the upgradient PRSs {16-01 O[c,d,e,f,j]} are active burning units that
currently have interim status under RCRA. PRS 16-01 O(g}, the carbon filter treatment unit, was
proposed for NFA in the RFI Work Plan for OU 1082, and EPA suggested that the unit was
appropriate for removal from the HSWA permit. Drainage from the asphalt roadway runs
directly into PRS 16-028{a}.
5.1 0.3 Previous Investigations
Three extraction procedure (EP} toxicity soil analyses for soluble barium in the south drainage,
taken in February 1987, yielded 26 mg/L at 3ft from the upgradient end of the PRS, 6.6 mg/
L at 20ft, and 2.7 mg/L at 40ft, with a background value of 0.8 mg/L (EIIvinger 1990, 15-16-
372}. Five soil samples taken further downgradient in November 1987 yielded concentrations
of EP toxicity metals, VOCs, and SVOCs below the detection limits of the analytical methods,
except for one sample, which yielded an EP toxicity cadmium value of 0.19 mg/L.
A scoping study of metals in the drainages from the burning ground was performed during the
summer of 1992 (Brown et al. 1992, 15-16-389}. Three soil samples were collected from the
south drainage. Barium concentrations ranged from 941 ppm to 1 420 ppm in the south
drainage.
5.1 0.4 Field Investigation
The objective of the Phase I investigation of this site was to use biased sampling to determine
if a release above action levels had occurred. If a release did occur, COPCs would be identified
during the Phase I investigation.
September 29, 1997 106 TA-16 RFI Report

RF/ Report
The conceptual model for releases at this site is that the primary release mechanism to the PRS
is by run-on of material from the upgradient PRSs at the TA-16 Burning Ground. It is assumed
that such discharge will result in the highest constituent concentrations near the discharge
point and in the downgradient sediment traps, particularly the sediment traps nearest the top
of the drainage. Both heavy organic contaminants, such as high explosives and SVOCs, and
inorganic contaminants are hypothesized to decrease in concentration both vertically into tuff
and downgradient from the outfall. This conceptual model guided sampling and screening
locations by emphasizing samples near the top of the drainage, surface samples, and soil-tuff
interface samples. Field screening, particularly for HE (the principal constituents likely to be
present at this site), was further used to bias sample locations based on this conceptual model.
The intent was to submit samples with positive screening results for laboratory analysis.
The sampling at this site called for field screening of ten randomly selected sediment traps in
the drainage. The field screening would be used to bias selection of five laboratory samples.
Field screening was conducted with an XRF for barium, as well as the HE spot test and radiation
screening.
Ten screening samples that were collected during 1995 were surface soil samples taken from
the 0- to 0.5-ft interval. Subsurface samples were to be collected only if the soil-tuff interface
was located at a depth greater than 0.5 ft. During sampling in FY 1995, the soil-tuff interface
was identified at a depth of less than 0.5 ft, and no subsurface samples were collected.
As a deviation from the approved work plan, four subsurface samples were taken from tuff
during are-sampling field campaign in August 1997. These samples were designed to vertically
bound contamination found during the 1995 sampling. The samples were located at the same
places where the highest levels of COPCs were found during the 1995 sampling. The borehole
at location 1016-1329 reached the soil-tuff interface at a depth of 2ft. Samples were taken from
this location at the soil-tuff interface and at a depth of 4-5ft. The borehole at location ID 16-
1330 reached the soil-tuff interface between 1.1 and 2.1 ft. The identification of the soil-tuff
interface at a depth of less than 0.5 ft during the FY 1995 campaign was apparently an error.
Samples were taken at the soil-tuff interface and at a depth of 4-5 ft.
The results of field screening for barium using XRF are shown in Table 5.1 0.4-1. All of the
barium screening results are below SAL. Field screening with other equipment did not detect
any contamination above background.
TA-16 RFI Report 107 September 29, 1997

RFI Report
TABLE 5.10.4-1
FIELD SCREENING RESULTS
SAMPLE ID LOCATION ID SCREENING METHOD/RESULT
0316-95-1601 16-1329 XRF(Ba): 699 ppm
0316-95-1602 16-2125 XRF(Ba): not detected
0316-95-1603 16-1330 XRF(Ba): 1129 ppm
0316-95-1604 16-2126 XRF(Ba): 545 ppm
0316-95-1605 16-1331 XRF(Ba): 635 ppm
0316-95-1606 16-2127 XRF(Ba): 578 ppm
0316-95-1607 16-1332 XRF(Ba): 674 ppm
0316-95-1608 16-1333 XRF(Ba): 655 ppm
0316-95-1609 16-2128 XRF(Ba): 627 ppm
0316-95-1610 16-2129 XRF(Ba): 577 ppm
Table 5.10.4-2 summarizes the samples collected at this PRS. Figure 5.10.4-1 shows screening
and laboratory sample locations.
TABLE 5.10.4-2
SUMMARY OF REQUEST NUMBERS FOR LABORATORY SAMPLES TAKEN ATPRS 16-028(a)
SAMPLE LOCATION DEPTH SAMPLE VOCs SVOCs HE INORGs ID ID (ft) MATRIX
0316-95-0363 16-1329 0-0.5 Soil NAa 1391b 1391 1392
0316-97-0601 16-1329 1.1-2.1 Tuff 3624R 3624R 3625R 3626R
0316-97-0602 16-1329 4-5 Tuff 3624R 3624R 3625R 3626R
0316-95-0364 16-1330 Q-0.5 Soil NA 1391 1391 1392
0316-97-0603 16-1330 1.1-2.1 Tuff 3624R 3624R 3625R 3626R
0316-97-0604 16-1330 4-5 Tuff 3624R 3624R 3625R 3626R
0316-95-0365 16-1331 Q-0.5 Soil NA 1391 1391 1392
0316-95-0366 16-1332 Q-0.5 Soil NA 1391 1391 1392
0316-95-0367 16-1333 0-0.5 Soil NA 1391 1391 1392
a. NA = Not Analyzed b. ER analytical request number
u
1393
3627R
3627R
1393
3627R
3627R
1393
1393
1393
September 29, 1997 108 TA-16 RFI Report

······ ..... .
1763500
. ... ·· ... ····
... ··
363
......... ···
I I I I I I I
t··· )( ·. : .·· ~ 0363-Barium, PAHs, ADNT,
~ HMX, RDX, TNB, TNT I 1601 I
RFI Report
- Permanent structure Paved road
0 I I I
PRS boundary
Contour interval1 0 ft Sampling location Sample number-au abbreviated sample numbers include the prefix '0316-95-.' Sample numbers beginning
with a 0 or 2 are laboratory samples. Sample numbers beginning with a 1 are screening samples. Samples at individual core locations shown from shalowestto deepest. Metals listed are above LANL UTLs; organics listed are detected; analytes undertined are above SAL.
25 50ft I I I I I I I I
Source: AMAD ARC VIEW, 7/96 Modified by: cARTography by A. Kron 7/19197
~ . 0316-97-0601-Arsenic,barium,copper, nickel, uranium, VOC ~ _.... 0316-97-0602-Barium, copper, nicke_l!_uranium I ... I ·········· .... v )( ~ · ... . '1
.......
11 0364-Barium, zinc, ADNT, HMX 1603 -~ ..
\ 0316-97-0603-Barium, copper, nickel, zinc, uranium, VOC, HMX
·· ... ··· ...
\ 0316-97-0604- Copper, nickel, zinc, uranium, VO(;
16-028(a) \ x \ · I 0365-HMX
South drainage \ 1sos\ '1 ·.
·· ... ·- .... •, •, ··. I . ·.. I I .·' ··.. \ ,.. ~., ····~
' \ ' ' I \ ' \ \ )( \ \ 0366-Barium, lead, TNT, ADNT, HMX
··- ..................... ··
\ 1607 \ \ \
\ ' \ )( \ \ ~
\ 0367-Barium, HMX \ 1608 .\ \ ' ' ' \ '
\ ' \ '
\ . ' \ 1602 )(.. ', \ ......
\ )( 1604 .... ' .... ' .... ' . ---~ ' )(. 1606 .... ', ·.. ····\ ·7360 ...
' • I ' • I
........ ·. . 1609 ~ 1610 /
.... ...; ......... _ __ __ ,, --------
1763400
... ···········
... · ... · ..... ·· ... ·.
Fig. 5.10.4-1. Sample locations at PRS 16-028(a).
TA-16 RFI Report 109 September 29, 1997

RFI Report
5.1 0.5 Evaluation of Inorganic Chemicals
Table 5.10.5-1 shows the metals present at levels above UTLs. Barium, a component of many
explosives, was above its UTL but well below its SAL. Arsenic, copper, lead, nickel, silver, and
zinc were also above UTLs. All values were well below SALs. Arsenic will be carried forward
as a COPC from the evaluation of inorganic chemicals.
Sample 0316-97-0602 was U-qualified for barium due to the presence of barium in the blank.
Copper had poor duplicate recovery in samples 0316-97-0601 through -0604 and wasP-qualified.
Focused validation of these data suggests that they should be J-qualified and considered
estimated.
5.1 0.6 Evaluation of Radionuclides
Uranium was present in one sample at a level slightly greater than the UTL. The value is well
below the SAL.
5.10.7 Evaluation of Organic Chemicals
PAHs were found at levels less than 0.3 mg/kg in one sample (Table 5.1 0. 7-1 ). All the PAH data
were qualified as being estimated concentrations. Benzo(a)pyrene was present at a level
slightly greater than its SAL (0.09 ppm vs. 0.061 ppm). No other PAHs were above SALs.
Tetrachloroethene was detected in three out of four subsurface samples, but at levels well
below SALs {Table 5.1 0.7-2). SVOC data for only one {0316-97-602) of the four samples
collected in 1997 was valid for decision purposes. Data for the other three samples were
rejected. The one sample with valid SVOC data contained no constituents at levels greater than
the detection limit.
September 29, 1997 110 TA-16 RFI Report

);! I .....
01
:::0 ::!! :::0 ~ 0 ., -
..... ..... .....
(/)
~ ~ ~ 1\) ~CQ
..... :g ~
SAMPLE DEPTH SOIUROCK ID (ft) UNIT
LANLUTL N/A8 N/A {all soil)
LANLUTL N/A N/A (Qbt4)
SAL N/A N/A
0316-95-0363 0-0.5 Soil
0316-95-0364 0-0.5 Soil
0316-95-0366 0-0.5 Soil
0316-95-0367 0-0.5 Soil
0316-97-0601 1.1-2.1 Qbt4 I 0316-97-0602 4-5 Qbt4
0316-97-0603 1.1-2.1 Qbt4
0316-97-0604 4.5 Qbt4
a. N/A =Not Applicable b. NC = Not Calculated
TABLE 5.10.5-1
INORGANICS WITH CONCENTRATIONS GREATER THAN BACKGROUND UTLs FOR PRS 16-028(a)
ARSENIC BARIUM COPPER LEAD NICKEL (mg/kg) (mg/kg) (mg/kg) (mg/kg) (mg/kg)
7.82 315 15.5 23.3 15.2
2.18 56.6 6.43 11 8.73
NC 5300 2800 400 1 500
1.09 321 3.68 7.9 3.27
0.755 588 4.97 5.5 2.35
1.43 501 3.93 I 76.6 I 3.75
1.13 368 2.81 6.3 2.83
2.4 II 1770 I 43.4 (P,J) 5.2 12.5
1.7 [3;3 59.1 (P,J) 1.3 12.8
2.0 68.5 (P,J) 3.3 16.5 0
1.3 43.2 73.2 (P,J) 1.8 16.6
c. J = Analyte was positively identified, but the result is estimated to be more uncertain than would normally be expected for that analysis.
d. P = Professional judgment should be applied, depending on proposed use of the data.
SILVER TOTAL (mg/kg) URANIUM
(mg/kg)
NCb 5.45
<1 4.55
315 29
0.494 (Uc) 1.68
0.509 (U) 1.15
0.492 (U) 2.53
0.503 (U) 1.69
0.28 (U) 1.38
0.25 (U) I 4.60
0.49 (U) 1.10
0.29 0.97
ZINC (mg/kg)
50.8
75.4
23000
d 35.1 (P ,J)
I 170 (P,J) I 37.8 (P,J)
i 30.1 (P,J)
52.4
I 68.4
8H:j 8
~ ::z::, ~ ~

~ CD' 3 tr ~ 1\)
~ ... ~ "'
... ... 1\)
~ I ...
Ol
::0 :!! ::0 (I)
""tl 0 .., -
SAMPLE DEPTH ANTHRA· ID (ft) CENE
(mg/kg)
SAL N/A8 18 000
EQL N/A 0.33
0316-95-0363 0-0.5 0.042 (f)
a. N/A =Not Applicable b. NC = Not Calculated
TABLE 5.10.7-1
PRS 16-028(a) SOIL CONCENTRATIONS FOR DETECTED SEMIVOLATILE ORGANIC ANAL YTES
BENZO(a)· BENZO(a)· BENZO(b)· BENZO(k)· CHRYSENE ANTHRACENE PYRENE FLUORANTHENE FLUORANTHENE (mg/kg)
(mg/kg) (mg/kg) (mg/kg) (mg/kg)
0.61 0.061 0.61 6.1 61
0.33 0.33 0.33 0.33 0.33
0.095 (J) - 0.11 (J) 0.056 (J) 0.11 (J)
c. J = Estimated quantity-result is above the detection limit but below the estimated quantitation limit.
FLUOR· PHENAN· ANTHENE THRENE (mg/kg) (mg/kg)
2600 NCb
0.33 0.33
0.26 (J) 0.2 (J)
PYRENE (mg/kg)
19000
0.33
0.22 (J)
~ ~ ~ c ~

TABLE 5.10.7-2
PRS 16-028{a) SOIL CONCENTRATIONS FOR DETECTED VOLATILE ORGANIC ANALYTES
SAMPLE DEPTH TETRACHLOROETHENE ID (ft) (mg/kg)
SAL N/Aa 5.4
EQL N/A 0.0059
0316-95-0363 0-0.5 NAb
0316-97-0601 1.1-2.1 0.230
0316-97-0603 1.1-2.1 1.0
0316-97-0604 4-5 0.024
a. N/A =Not Applicable b. NA = Not Analyzed
RFI Report
HE was found in a number of samples. Table 5.10.7-3 presents the analytical results for
samples containing HE. Only sample 0316-95-0363 contained HE (RDX only) at a level above
SAL. All other samples showed that HE contamination dropped off significantly with distance
from the burning ground, with only very low levels of HMX (< 1 ppm) detected at the farthest
downgradient point. Samples taken at the soil-tuff interface and in tuff also had no or low levels
of HE. Only a single subsurface sample, 0316-97-0603, contained any HE (4.87 mg/kg of
HMX).
TABLE 5.10.7-3
PRS 16-028(a) SOIL CONCENTRATIONS FOR DETECTED HIGH EXPLOSIVE ANAL YTES
SAMPLE DEPTH 2-ADNT 4-ADNT HMX RDX ID (ft) (mglkg) (mg/kg) (mg/kg) (mg/kg)
SAL N/Aa NCb NC 3300 4
EQL N/A 0.26 NC 2.2 1
0316-95-0363 Q-0.5 0.093 0.097 8.22
0316-95-0364 0-0.5 0.081 (Uc) 0.12 1.04 0.174(U)
0316-95-0365 0-0.5 0.081(U) 0.084(U) 0.34 0.174(U)
0316-95-0366 0-0.5 0.171 0.247 0.644 0.175(U)
0316-95-0367 0-0.5 0.081(U) 0.084(U) 0.432 0.174(U)
0316-97-0603 1.1-2.1 0.25(U) 0.25(U) 4.87 1(U)
a. N/A =Not Applicable b. NC = Not Calculated c. U = Undetected-the listed value is the detection limit.
TA-16 RFI Report 113
1,3,5-TNB TNT (mg/kg) (mg/kg)
3.3 15
0.25 0.25
2.33 0.139
0.092(U) 0.089(U)
0.092(U) 0.089(U)
0.093(U) : o,3o1
0.092(U) 0.089(U)
0.25(U) 0.25(U)
September 29, 1997

RFI Report
5.1 0.8 Risk-Based Screening Assessment
Seven inorganic, one radionuclide, and several organic chemicals were carried forward from
the background comparison and organic constituent evaluation. As described in Section 3 of
this report, analytes are divided into three classes for the screening assessment
(noncarcinogens, carcinogens, and radionuclides), depending on which toxicological effect
forms the basis of their SAL. This separation is required to evaluate possible additive effects
within each class of chemical.
RDX and benzo(a)pyrene exceeded their SALs in one sample. These two constituents will be
retained as COPCs for further evaluation. Sample results that exceeded SAL values are
highlighted in black squares in the previous tables.
Arsenic is present at a level slightly higher than the UTL for Qbt4 (2.4 vs. 2.18). However, this
sample was a soil-tuff interface sample. Application of a tuff UTL to this material is an extremely
conservative assumption. The sample value of 2.4 is well below the UTL for arsenic (7.82) in
soils. Because the sample is a mixture of tuff and soil, it is not surprising that arsenic is higher
than the tuff UTL. Arsenic will be dropped as a COPC because it is extremely likely that the
single sample with a value greater than the UTL represents a mixture of arsenic-poor tuff and
arsenic-rich soil.
An MCE calculation was performed using the sum of those maximum constituent concentrations
that exceeded background UTLs but were less than SALs. The MCE results for noncarcinogens
and chemical carcinogens were 1.05 and 0.383, respectively. The MCE value for noncarcinogenic
compounds is equal to or greater than unity; therefore, a potential human-health risk based on
additive effects has been identified for this class of chemicals. The noncarcinogenic COPCs
that have a normalized value of more than 0.1 in the MCE at this PRS are barium, lead, and
1,3,5-trinitrobenzene. These compounds are, therefore, retained as COPCs for further
evaluation. The MCE value for carcinogenic compounds is less than the target value of 1,
indicating that multiple constituents below SALs are not present at levels that pose a risk when
combined. The MCE calculations are presented in Table 5.1 0.8-1.
September 29, 1997 114 TA-16 RFJ Report

RFI Report
TABLE 5.10.8-1
MCE CALCULATION FOR PRS 16-028(a)
ANALYTE MAX SAL NORMALIZED VALUE CONCENTRATION
Noncarcinogenic Effects Barium 588 5300 0.111 Copper 73.2 2800 0.026 Lead 76.6 400 0.191 Nickel 16.6 1 500 0.011 Zinc 170 23000 0.007 Anthracene 0.04 18000 <0.001 Fluoranthene 0.3 2600 <0.001 Pvrene 0.2 19000 <0.001 HMX 8.22 3300 0.002 1 ,3,5-Trinitrobenzene 2.3 3.3 0.697
TOTAL 1.05 Carcinogenic Effects Benzo a)anthracene 0.1 0.61 0.164 Benzo b )fluoranthene 0.056 6.1 0.009 Benzo k)fluoranthene 0.06 6 0.010 Tetrachloroethane 1.0 5.4 0.185 Chrvsene 0.1 61 0.002 2,4,6-TNT 0.2 15 O.D13
TOTAL 0.383
Only a single radionuclide, uranium, was found above UTL, so no MCE for radionuclides was performed.
5.1 0.9 Human-Health Risk Assessment
RDX and benzo(a)pyrene were identified as COPCs in the screening assessment presented in
Section 5.1 0.8. Due to the low concentrations of these compounds, a quantitative human
health risk assessment was not performed for this PRS. However, a qualitative evaluation of
these COPCs is presented.
RDX and benzo(a)pyrene were detected above their respective SALs. Each of these constituents
was detected in one out of five surface samples. The data for these contaminants do not exceed
EPA Region 9 industrial PRGs. These contaminants are removed as COPCs because industrial
land use will continue at this location for the foreseeable future. In addition, this drainage
receives run-on from the upgradient road, suggesting that the PAH is derived from a continuing
source.
TA-16 RFI Report 115 ·September 29, 1997

RFI Report
The noncarcinogenic chemicals analyzed in the MCE had a normalized sum of 1.0. The COPCs
that have a normalized contribution of more than 0.1 at this PRS are barium, lead, and
trinitrobenzene. The maximum concentrations detected for these chemicals were compared
with preliminary remediation goals (PRGs) for industrial soil (as published by EPA Region 9).
This comparison indicates that concentrations of noncarcinogenic compounds in the soil
around this outfall are an order of magnitude below concentrations that would potentially
impact human health under an industrial exposure scenario (Table 5.10.9-1 ). Region 9 PRGs
for industrial soil are conservatively based on 250 days per year of exposure, an assumption
that is highly conservative for an outfall area behind a TA-16 building. In addition, the MCE
calculation assumes additivity. The maximum values for barium, lead, and 1 ,3,5-trinitrobenzene
are from three different sample locations, making simultaneous exposure highly unlikely.
Therefore, based on this qualitative evaluation of the noncarcinogenic chemicals detected at
this PRS, further human-health risk analyses for these chemicals is not justified.
TABLE 5.10.9-1
COMPARISON OF COPCs TO INDUSTRIAL SOIL PRGs
CHEMICAL MAXIMUM INDUSTRIAL SOIL CONCENTRATION PRG
(mg/kg) (mg/kg)
Barium 588 100 000
Lead 77 1 000
1,3,5-trinitrobenzene 2 34
Benzo( a)pyrene 0.1 0.3
RDX 5 17
The three rejected SVOC samples do not significantly affect the decision at this site. The single
valid SVOC sample collected in 1997 sufficiently bounds SVOC contamination in the vertical
direction. The 1995 data bounded the contamination in the downgradient direction.
The data collected at this PRS have determined the extent of contamination relative to SALs.
Both downgradient samples and samples collected at depth are well below SALs. The single
sample that contained PAH at levels greater than SALs had a valid SVOC analysis directly
beneath it. In addition, a trend toward decreasing constituent concentration is seen in both the
vertical and downgradient directions.
September 29, 1997 116 TA-16 RFI Report
I:

RFI Report
5.1 0.1 0 Preliminary Ecological Assessment
In cooperation with NMED and EPA Region 6, the Laboratory ER Project is developing an
approach for ecological risk assessment. Further ecological risk assessment at this site will be
deferred until this site can be assessed as part of the ecological exposure unit methodology
currently being developed. When completed, the ecological risk assessment will be provided
as an attachment.
5.10.11 Conclusions and Recommendations
Five surface soil laboratory samples and four subsurface laboratory samples were collected in
the drainage from the south side of the TA-16 Burning Ground. The south drainage is a well
defined channel, which makes it easy to locate the potential off-site pathway. Laboratory
samples were selected from five field locations, conservatively biased to sediment traps that
screen high for barium. Barium and HE were the potential contaminants most likely to be
present at this site. A second field campaign sampled locations that initially showed the
presence of contamination.
The results show that one sample at the top of the mesa had levels of HE above SAL. RDX and
benzo(a}pyrene were present at levels above SALs. All of the results above SALs were below
EPA Region 9 PRGs. The concentration of contaminants drops off quickly and the last
downgradient sample contained only trace amounts of HMX. Samples at depth show all
constituents at levels less than SALs. Contamination is bounded in the downgradient and
vertical directions relative to SALs.
These data generally support the site-conceptual model: The highest concentrations of
constituents are found nearest the source of contamination at the TA-16 Burning Ground.
This PRS is proposed for human-health NFA based on NFA Criterion 5.
5.11 PRS 16-030(g)
PRS 16-030(g) is the inactive outfall from the sump at TA-16-380, a former HE inspection
building. The contaminants in the outfall include lead, PAHs, and a variety of HE. It is
recommended for human-health NFA because the contaminant concentrations do not pose a
risk to human health.
TA-16 RFI Report 117 September 29, 1997

RFI Report
5.11.1 History
PRS 16-030(g) is discussed in detail in Subsection 5.2 of the RFI work plan (LANL 1993, 1 094).
PRS 16-030(g) is the outfall from the sump at TA-16-380, a former HE inspection facility. The
facility is currently used for storage of classified parts. TA-16-380 was built in 1952 and
continues as an active facility. The building is no longer used for HE inspection. Because this
outfall is from an HE inspection building, HE, HE degradation products and impurities, and
metals were the major potential contaminants at this site. Small chips of HE and HE dust could
have entered the outfall from the sump.
5.11.2 Description
The PRS is located south of TA-16-380 (Figure 5.0-1) on top of a mesa, in a well-defined
drainage that slopes to the south. The drainage historically received effluent from the HE
sumps, from a parking-lot drain, and from the steam-heating system. The sump and steam
heating system discharge have been plugged. The outfall now receives only parking lot runoff.
Drainage from this site is to the south into Water Canyon. This outfall is NPDES permitted under
permit EPA 05A052. The outfall is in the process of being removed from the Laboratory's
NPDES permit.
5.11.3 Previous Investigations
Several studies of effluent from T A-16 sumps have been performed over the last 30 years. The
studies are discussed in detail in the RFI Work Plan for OU 1082 (LANL 1993, 1 094). Three
studies involved the outfall associated with PRS 16-030(g). Studies by Baytos in the 1970s and
early 1980s showed almost no HE in the outfall, except for 0.4% wt HE in one sample in 1985
(Baytos 1970, 15-16-278, through Baytos 1988, 15-16-266). A soil study in this drainage
showed less than 10 ppm of barium, less than 1 ppm of HMX and RDX, and 11 ppm of TNT
(Turner and Schwartz 1971, 15-16-284). During the 1970s, water samples from this outfall
were analyzed as part of the NPDES permit application process. Results showed that effluent
contained 4 to 20 ppm TNT (Rickenbaugh 1979, 15-16-440; LASL 1977, 15-16-380).
5.11.4 Field Investigation
The objective of Phase I sampling at this site was to determine via biased sampling if a release
had occurred from the drain line outfall and if that release caused contamination above action
September 29, 1997 118 TA-16 RFI Report

RF/ Report
levels. The sampling design was biased to detect contaminants by collecting samples at
locations most likely to be contaminated, according to the site conceptual model. The sampling
and analysis plan was also designed to: (1) delineate any contamination above action levels
in both vertical and downgradient directions to support cleanup activities; and (2) provide
sufficient data to support a preliminary risk assessment. If contamination did occur, Phase 1
investigation would also identify all COPCs.
The site conceptual model for releases at this outfall is that the primary release mechanism to
the PAS is by discharge of constituents from the outfall pipe to the downgradient drainage area.
It is assumed that such discharge will result in the highest constituent concentrations near the
outfall and in the downgradient sediment traps, particularly the sediment traps nearest the
outfall. Non-volatile constituents (e.g. SVOCs, HE, inorganics) are hypothesized to decrease
in concentration vertically into tuff and downgradient from the outfall. Volatile organics are
likely to be at higher concentrations in subsurface samples because they are likely to volatilize
in near-surface samples due to temperature fluctuations. The soil-tuff interface consists of a
transition in both material and hydrogeologic properties that can act as a collection and
transport zone for contaminants. This conceptual model guided sampling and screening
locations by emphasizing samples near the outfall, surface samples, and soil-tuff interface
samples. Field screenig-particularly for the HE, which are the principal constituents likely to
be present at this site-was further used to bias sample locations, based on this conceptual
model. The intent was to submit samples with positive screening results for laboratory analysis.
The EPA-approved Phase I investigation of this site called for two boreholes to be drilled near
the outfall. The first borehole was drilled at the outfall. The second borehole was drilled at the
next downstream sediment trap. Borehole samples were collected from the surface interval,
the interval bounding the soil-tuff interface, and the bottom of each borehole. The bottom of
each borehole was at least 2.5 ft below the soil-tuff interface.
Beyond the boreholes, sample locations were screened for HE at 1O-ft intervals downgradient.
At the first negative HE screening location, a total of three surface laboratory samples were
collected at 20-ft intervals. A minimum of two additional surface laboratory samples were
collected further downgradient.
The depth of the borehole at the outfall itself was 12.5 ft. The soil-tuff interface was reached
at 9ft. While collecting sample 0316-95-0268, the soil-tuff interface sample at the outfall, the
field team encountered auger refusal while hand augering at a depth of approximately 1 0 in.
Tuff material was retrieved in sample 0316-95-0268; however, the field team later realized that
TA-16 RFI Report 119 September 29, 1997

RFI Report
the soil-tuff interface was significantly deeper at this site. The hole was resampled and a new
soil-tuff interface sample, 0316-95-0505, was collected with a split spoon. The depth of the
borehole located 16ft downgradient from the outfall was 7ft. The soil-tuff interface was located
at a depth of 4 ft.
Twelve analytical samples were collected at this site. All samples were field screened for
VOCs, radiation, and HE. All field screening results were negative.
The RFI work plan called for the outfall to be screened for a distance of 500 ft down the
drainage. This could not be done because the drainage drops off sharply into Water Canyon
at 450ft. This deviation had no impact on the sampling results because sufficient samples were
collected in the areas most likely to be impacted by constituents from this PRS. All laboratory
samples were collected within 350 ft of the outfall.
Table 5.11.4-1 summarizes the sampling at the site and Figure 5.11.4-1 shows sample
locations.
TABLE 5.11.4-1
SUMMARY OF REQUEST NUMBERS FOR LABORATORY SAMPLES TAKEN AT PRS 16-030(g)
SAMPLE ID LOCATION ID DEPTH SAMPLE VOCs SVOCs HE INORGs (ft) MATRIX
0316-95-0267 16-1606 0-0.5 Soil NAa 923b NA 924
0316-95-0268 16-1606 0.5-1.5 Soil 923 923 923 924
0316-95-0269 16-1606 11-12.5 Qbt4 972 972 972 978
0316-95-0270 16-1668 0-0.5 Soil 923 923 NA 924
0316-95-0271 16-1668 0.5-0.9 Soil 923 923 NA 924
0316-95-0272 16-1668 5-7 Qbt4 1242 1242 1242 1243 . 0316-95-0273 16-1607 0-0.5 Soil NA 215 215 206
0316-95-027 4 16-1608 0-0.5 Soil NA * 215 215 206
0316-95-0275 16-1609 0-0.5 Soil NA * 215 215 206
0316-95-0276 16-1610 0-0.5 Soil NA * 215 215 206
0316-95-0277 16-1611 0-0.5 Soil NA * 215 215 206
0316-95-0505 16-1606 8.5-9.5 Soil 972 972 972 978
a. NA = Not Analyzed b. ER analytical request number * Samples were not analyzed for SVOCs due to laboratory error.
September 29, 1997 120 TA-16 RFI Report

0267-Lead, zinc, PAHs, SVOCs / 0268-Barium, chromium, lead, zinN@-:
ADNT, HMX, TNT, PAHs : \ r rl---._ 0269-Chromium, copper : ® \ f
: )( 0273-l-Copper, lead, ZJnc, ADNT, TATB, TNT 0505-TNB ~ 1 .
I 1122 I ~__j I I
027o-Lead, zinc, HMX, 1 X • . SVOCs, PAHs ~ 0274--;Copper, lead, z1nc
0271-Acetone ~ 1123 \
027~~opper, zinc ~ :-:0275-Copper, lead, DNT, TNT I :\. 1124 \ . · I / . \ ........ . .. .., ·· .. /I I
I I
~ )( : I 1125 I I I I I I I ' ' ....... .... ~ 1126\ .· ..... I )( , ..
' \ ....... "I" ............... \ · ....... ····· \ \
Permanent structure
Paved road
\ \ 16-030(g) \ )( \
1128
.······· ... ··
Fence
PAS boundary
Contour interval 10 It
\ \
)( 1129 ' \ ............................. /··········· . ' '
1759200
0
® Sampling locationborehole
)( Sampling location
1128 Sample number-au sample numbers include the prefix '0316-95-.' Sample numbers beginning with a 0 or 2 are laboratory samples. Sample numbers beginning with a 1 are screening samples. Samples at individual core locations shown from shallowest to deepest. Metals listed are above LANL UTLs; organics listed are detected; analytes underlined are above SAL.
50 100
Source: FIMAD ARC VIEW, 7/96 Modified by: cARTography by A. Kron 7/19/97
Fig. 5.11.4-1. Sample locations at PRS 16-030(g).
TA-16 RFI Report 121
)( ~ 0277 \ 1130 I
I I I I I
)( 1131 1 I .. ... , ...
RFI Report
' . . . . . . . . . . . . . . . . .
September 29, 1997

RFI Report
5.11.5 Evaluation of Inorganic Chemicals
Table 5.11.5-1 shows the metals present at levels above UTLs. Lead is present in one sample
at 9% above its SAL. Lead is also elevated above background in several other samples. Barium
and lead data were P-qualified in one sample because duplicate recovery was poor.
TABLE 5.11.5-1
INORGANICS WITH CONCENTRATIONS GREATER THAN BACKGROUND UTLs FOR PAS 16-030(g)
a N/A =Not applicable. b J+ = Estimated value likely to be high. c P = Professional judgment should be applied, depending on proposed use of the data.
5.11.6 Evaluation of Radionuclides
Radionuclides were not analyzed for at this PRS because process knowledge and facility
history suggests that radionuclides were not associated with this PRS.
5.11.7 Evaluation of Organic Chemicals
The only VOC present at this PRS was acetone. It was found in sample 0316-95-0271 at a
concentration of 0.009 mg/kg, although this value was qualified as estimated. This level of
acetone is below the EQL of 0.02 mg/kg and well below the SAL of 2 000 mg/kg.
PAHs were found in a number of samples. PAHs were present in some samples at levels above
SALs. The data are provided in Table 5.11.7-1. Note that samples 0316-95-0273 through -0277
were not analyzed for SVOCs due to an error at the analytical laboratory. The existing data
shows that PAHs are present in the outfall, but other SVOCs are not present at levels of
concern. Based on the SVOC data available, the PAH contamination decreases with depth.
September 29, 1997 122 TA-16 RFI Report

i;! I ...
0'1
JJ ::!! JJ CD 1l 0 ., -
... ~
~ ~ tt ~ 1\)
.!'l ..... ~ ""'
a b c d
SAMPLE ID
N/A =Not applicable. NC = Not calculated.
TABLE 5.11.7-1
PRS 16-030(g) SOIL CONCENTRATIONS FOR DETECTED ORGANIC ANAL YTES
J = Estimated quantity. Result is above the detection limit but below the estimated quantitation limit. U = Undetected. The listed value is the detection limit.
~ ::::0 ~ ~ :4.

RFI Report
HE was found in a number of samples. Table 5.11.7-2 presents the analytical results for
samples containing HE. No sample contained HE at levels near SALs.
TABLE 5.11.7-2
PRS 16-030(g) SOIL CONCENTRATIONS FOR DETECTED HE ANAL YTES
SAMPLE 10 DEPTH 2-ADNT 4·ADNT 2,4-DNT {ft) (mg/kg) (mg/kg) (mg/kg)
SAL N/Aa NCb NC 0.65
EQL N/A 0.26 NC 0.25 0316-95-0268 0.5-1.5 0.109 0.218 0.058
(Uc) 0316-95-0270 0-0.5 0.078 0.092 0.058
(U) (U) (U) 0316-95-0273 0-0.5 0.076 0.124 0.055
(U) (U) 0316-95-0275 0-0.5 0.078 0.094 0.114
(U) (U) 0316-95-0276 0-0.5 0.075 0.091 0.054
(U) (U) (U) 0316-95-0505 8.5-9.5 0.076 0.091 0.056
{UJ (U) (U)
a N/A =Not applicable. b NC = Not calculated. c d
U = Undetected. The listed value is the detection limit. NA = Not analyzed.
5.11.8 Risk-Based Screening Assessment
HMX TATB (mg/kg) (mg/kg) 3300 NC
2.2 NC 0.356 NAd
1.72 NA
0.167 3.34 (J) (U)
0.171 1.99 (U) (U)
0.166 1.94 (U) 1U)
0.165 NA {l.D_
1,3,5-TNB TNT (mg/kg) (mg/kg)
3.3 15
0.25 0.25 0.086 0.309
(U)
0.086 0.091 (U) (U)
0.095 0.206 (U)
0.097 0.109 (U)
0.094 0.478 (U)
0.184 0.089 (U)
Five inorganic and twenty-four organic chemicals were carried forward from the background
comparison and organic constituent evaluation. As described in Chapter 3 of this report,
analytes are divided into three classes for the screening assessment (noncarcinogens,
carcinogens, and radionuclides), depending on which toxicological effect forms the basis of
their SAL. This separation is required to evaluate possible additive effects within each class
of chemical.
Only in sample, 0316-95-0273, did lead exceed its SAL. Benzo(a)anthracene, benzo(a)pyrene,
benzo(b)fluoranthene, dibenzo(a,h)anthracene, and indeno(1 ,2,3-c,d)pyrene exceeded SAL
values in several soil samples. These compounds will be retained as COPCs for further
evaluation. Sample results that exceeded SAL values are highlighted in black squares in the
previous tables.
An MCE calculation was performed using the sum of the maximum concentrations of constituents
that exceeded background UTLs but were less than SALs. The MCE results for noncarcinogens
and chemical carcinogens were 0.2 and 0.8, respectively. These MCE values are less than
September 29, 1997 124 TA-16 RFI Report

RFI Report
unity; therefore, a potential human health risk based on additive effects from contaminants not
exceeding SALs is not identified for these classes of chemicals, and no further COPCs have
been identified. The MCE calculations are presented in Table 5.11.8-1.
TABLE 5.11.8-1
MCE CALCULATION FOR PRS 16-030(g)
Max cone. SAL Analyte mg/kg mg/kg Normaliz~ Value
Noncarcinogenic Effects Barium 391 5300 0.074 Copper 62.4 2800 0.022 Zinc 107 23000 0.005 Acetone 0.009 2100 <0.001 Acenaphthene 0.84 2200 <0.001 Anthracene 1.8 18000 <0.001 Fluoranthene 9 2600 0.003 Fluorene 0.96 2300 <0.001 Naphthalene 0.86 1000 0.001 Pyrene 8.5 19 000. <0.001 Dibenzofuran 0.53 260 0.002 Di-n-butyl phthalate 2.2 6500 <0.001 HMX 1.72 3300 0.001 1,3,5-TNB 0.184 3.3 0.056
TOTAL 0.2
Carcinogenic Effects Chromium 38.5 210 0.183 Benzo(k)fluoranthene 2.5 6.1 0.410 Chrysene 2.7 61 0.044 2,4-DNT 0.114 0.65 0.175 TNT 0.478 15 0.032
TOTAL 0.8
5.11.9 Human Health Risk Assessment
Lead and five PAHs were identified as COPCs in the screenin,g assessment presented in
Section 5.11.8. Due to the low concentrations of these compounds, a quantitative human
health risk assessment was not performed for this PRS. However, a qualitative evaluation of
these COPCs is presented.
Lead was detected in one out of eight samples, at a concentration 9% above its SAL (434
versus 400 ppm). The EPA Region IX industrial PRG for lead is 1000 mg/Kg. This is a more
appropriate decision point, given the industrial landuse for this PRG. Therefore, additional
evaluation of lead for human health risk will not be pursued.
Five PAHs were identified in the screening assessment presented in Section 5.11.8. PAHs
were detected above SALs at this PRS. The sampling locations where PAHs were detected
TA-16 RFI Report 125 September 29, 1997

RFI Report
receive storm-water runoff from asphalt paved areas that drain into a parking-lot drain that also
discharges into this PRS. The presence of PAHs in the analytical data from this site is not
unusual because PAHs are found in asphalt and are products of incomplete combustion from
motor vehicles. The low concentrations of PAHs at this PRS (less than 5 ppm) are likely to be
associated with runoff from the nearby paved areas rather than due to PAS-related
contamination.
The most likely explanation for the observation of PAHs in these soil samples is that they
represent nonspecific contamination associated with general industrial activities. The
"Toxicological Profile for Polycyclic Aromatic Hydrocarbons (PAHs)" (ATSDR 1995, 55663) by
the Agency of Toxic Substances and Disease Registry shows that soil concentrations of PAHs
in urban/industrial areas commonly range in the tens to hundreds of mg/Kg. The source of
these signatures includes combustion products from organic materials and fossil fuels and
runoff from asphalt and roofing tar.
Process knowledge and history for the facilities associated with 16-030(g) suggests that PAHs
were not used in this Area. Asphalt is a common sources of PAHs that is upgradient of this
PRS.In particular, the drainage from the nearby parking lot runs directly into this outfall
discharge area. These materials and vehicle emissions are the likely sources for these
contaminant signatures. This constitutes a continuing source of contaminants and consequently
is not within the scope of the Environmental Restoration Project. The PAHs will be dropped as
COPCs for this PRS.
5.11.1 0 Preliminary Ecological Assessment
In cooperation with NMED and EPA Region 6, the Laboratory ER Project is developing an
approach for ecological risk assessment. Further ecological risk assessment at this site will be
deferred until this site can be assessed as part of the ecological exposure unit methodology
currently being developed. When completed, the ecological risk assessment will be provided
as an Attachment.
5.11.11 Conclusions and Recommendation
The objective of the Phase I RFI at PRS 16-030(g) was to determine if a release had occurred
from the sump drain line, outfall, and drainage at this site at a level that represents a risk to
human health and the environment. RFI sampling was conducted at locations biased to
represent the area(s) of greatest contamination. The COPCs that were identified have been:
September 29, 1997 126 TA-16 RFI Report

RF/ Report
(1) shown not represent a risk in an industrial scenario (i.e. lead), or (2) attributed to on-going releases from the nearby parking lot, which drains directly to this outfall (the PAHs).
These data generally support the site-conceptual model, except for slightly elevated copper and chromium values observed in one of the two deepest samples. These elevated values may be due to natural high values of these constituents in the subunit of the Bandelier tuff that underlies this PRS.
Contamination has been bounded relative to SALs except for the PAHs. Both samples at depth and downgradient samples contain constituents at levels well below SALs for all constituents analyzed. PAH contamination has not been bounded, because the downgradient samples were not analyzed for SVOCs. However, the SVOC contamination is attributable to an ongoing release. The data suggests that widespread contamination at concentrations of human health concern has not occurred. PRS 16-030(g) is recommended for human-health NFA.
TA-16 RFI Report 127 September 29, 1997

RFI Report
6.0 REFERENCES
Agency for Toxic Substances and Disease Registry (ATSDR), August 1995. "Toxicological
Profile for Polycyclic Aromatic Hydrocarbons (PAHs) (Update)." (ATSDR 1995, 55663)
Baytos, J.F., June 2, 1970. "Analysis for Residual Explosives in Drainage Ditches at the Sump
Effluent Outlets at Group GMX-3 Operation Building," Los Alamos Scientific Laboratory
Memorandum to E. Wilder (GMX-3) from J. F. Baytos (GMX-3), Los Alamos, New Mexico.
(Baytos 1970, 15-16-278)
Baytos, J.F., December 1970. "Analysis for Residual Explosives in Drainage Ditches at the
Sump Effluent Outlets GMX-3," Los Alamos Scientific Laboratory Memorandum to E. Wilder
(GMX-3) from J. F. Baytos (GMX-3), Los Alamos, New Mexico. (Baytos 1970, 15-16-0017)
Baytos, J.F., February 1988. "Analysis of HE Contaminants in Waste Water from Operating
Buildings at TA-16 (S-Site)," Los Alamos National Laboratory Memorandum to A. P. Torres
(WX-3) from J.F. Baytos, Los Alamos, New Mexico. (Baytos 1970,15-16-278, through Baytos
1988, 15-16-266; 15 internal reports)
Baytos, J.F., December 1975. "Analysis of Soil Samples for Residual Explosives from Drainage
Ditches at Sump Effluent Outlets," Los Alamos Scientific Laboratory Memorandum to H.E.
Ballance from J.F. Baytos, Los Alamos, New Mexico. (Baytos 1975, 15-16-272 ,through
Baytos 1970, 15-16-278)
Baytos, J.F ., July 1991. "Field Spot-Test Kit for Explosives," Los Alamos National Laboratory
Report LA-12071-MS, Los Alamos, New Mexico. (Baytos 1991, 0741)
Blake, W D., F. Goff, A I. Adams, and D. Counce, May 1995. "Environmental Geochemistry for
Surface and Subsurface Waters in the Pajarito Plateau and Outlying Areas, New Mexico," Los
Alamos National Laboratory Report LA-12912-MS, UC 903, Los Alamos, New Mexico. (Blake
et al. 1995, 1355)
Bowen, B.M., May 1990. "Los Alamos Climatology," Los Alamos National Laboratory Report
LA-11735-MS, Los Alamos, New Mexico. (Bowen 1990, 0033)
September 29, 1997 128 TA-16 RFI Report
I,

RFI Report
Bradley, L. J. N., B. H. Magee, and S. L. Allen, 1994. "Background Levels of Polycyclic
Aromatic Hydrocarbons (PAH) and Selected Metals in New England Urban Soils," in Journal
of Soil Contamination, Vol. 3(4), p. 349. ER ID 46492. (Bradley et al. 1994, 1144)
Brown, R., B. Martin, and D. Hickmott, August 1992. "Barium Transport at S-Site and
Laser-Induced Breakdown Spectroscopy (LIBS): Its Application to Field Screening of Barium
in Soils," Los Alamos National Laboratory, Los Alamos New Mexico. (Brown et al. 1992, 15-
16-389)
Broxton, D. E., R.T. Ryti, D. Carlson, R. Warren, E. Kluk, and S. Chipera, March 21, 1996.
"Natural Background Geochemistry of the Bandelier Tuff at MDA P, Los Alamos National
Laboratory," Los Alamos National Laboratory Report LA-UR-96-1151, Los Alamos, New
Mexico. (Broxton et al. 1996, 1305)
Dorries, A.M. (Ed.), June 1, 1996. "Risk-Based Corrective Action Process," Revision 1, Los
Alamos National Laboratory Report LA-UR-96-2811, Los Alamos, New Mexico. (Dorries 1996,
1297)
Dunham , D., January 1996. "Biological and Floodplain/Wetland Assessment for the Steam
Plant Project," Los Alamos National Laboratory Report LA-UR-96-1 08, Los Alamos, New
Mexico. (Dunham 1996, 15-16-622)
Edwards, N.T., 1983. "Polycyclic Aromatic Hydrocarbons (PAHs) in the Terrestrial Environment
A Review." J. Environ. Quality, Vol. 12(4), p. 427. (Edwards 1983, 55636)
Ellvinger, J., February 2, 1990. "TA-16 Surface Impoundment Closure Plan Approval," New
Mexico Heatlh and Environment Department letter to J.R. Anderson (DOE) from J. Ellvinger
(Hazardous Waste Bureau), Santa Fe, New Mexico. (EIIvinger 1990, 15-16-372)
Environmental Protection Group, July 1994. "Environmental Surveillance at Los Alamos
During 1992," Los Alamos National Laboratory Report LA-12764-ENV, Los Alamos, New
Mexico. (Environmental Protection Group 1994, 1179)
Environmental Restoration Decision Support Council and Earth Science Council, June 30,
1997. "Application of LANL Backtground Data to ER Project Decision-Making, Part II:
Radionuclides in Soils, Sediments and Tuff," Los Alamos National Laboratory Report (review
draft), Los Alamos, New Mexico. (Environmental Restoration Decision Support Council
and Earth Science Council1997, 1414)
TA-16 RFI Report 129 September 29, 1997

RFI Report
Environmental Restoration Project, September 1996. "RFI Report for Potential Release Sites
in TA-16: 16-003(k), 16-021(c), Field Unit 3," Los Alamos National Laboratory Report
LA-UR-96-3191, Los Alamos, New Mexico. (Environmental Restoration Project 1996, 1419)
EPA (US Environmental Protection Agency), April 1 o, 1990. Module VIII of RCRA Permit No.
NM0890010515, EPA Region 6, issued to Los Alamos National Laboratory, Los Alamos, New
Mexico, effective May 23, 1990, EPA Region 6, Hazardous Waste Management Division,
Dallas, Texas. (EPA 1990, 0306)
EPA (US Environmental Protection Agency), April 1992. "Guidance for Data Usability in Risk
Assessment (Part A)," Final, No. 9285.7-09A, Office of Emergency and Remedial Response,
Washington, D.C. ER ID No. 54947. (EPA 1992, 1166)
EPA (US Environmental Protection Agency), July 1992. "Test Methods for Evaluating Solid
Waste, Physical/Chemical Methods," SW-846, Third Edition, Final Update 1, Office of Solid
Waste and Emergency Response, Washington, D.C. (EPA 1992, 1207)
EPA (US Environmental Protection Agency), September 1, 1995. "Region 9 Preliminary
Remediation Goals (PRGs) Second Half 1995," San Francisco, California. (EPA 1995, 1307)
Eppler, A.S., D.A. Cremers, D. D. Hickmott, M.J. Ferris, and A.C. Koskelo, 1996. "Matrix Effects
in the Detection of Pb and Ba in Soils Using Laser-Induced Breakdown Spectroscopy," Applied
Spectroscopy, v. 50, p. 1175-1181. (Eppler et al. 1996, 15-16-643)
Fresquez, P.R., M.A. Mullen, J.K. Ferenbaugh, and R.A. Perona, April 1996. "Radionuclides
and Radioactivity in Soils Within and Around Los Alamos National Laboratory, 1974 through
1994: Concentrations, Trends, and Dose Comparisons," Los Alamos National Laboratory
Report LA-13149-MS, Los Alamos, New Mexico (Fresquez et al. 1996, 1360)
Gardner, J.N., T. Kolbe, and S. Chang, Janurary 1993. "Geology, Drilling, and Some Hydrologic
Aspects of Seismic Hazards Program Core Holes, Los Alamos National Laboratory, New
Mexico," Los Alamos National Laboratory Report LA-12460-MS, Los Alamos, New Mexico.
(Gardner et al. 1993, 0848)
Gautier, M.A. (Ed.). "Analytical Chemistry Techniques and Quality Assurance," Los Alamos
National Laboratory Report LA-10300-M, Los Alamos, New Mexico. (Gautier, 1417)
Gibbs, T.T. and A. Popolato, 1980, "LASL Explosive Property Data," University of California
Press, Berkeley, California. (Gibbs and Popolato 1980, 15-16-369)
September 29, 1997 130 TA-16 RFI Report

RF/ Report
ICF-Kaiser, 1995. QA/QC plan for the field campaign. (ICF-Kaiser 1995, 15-16-628)
Jansen, J., and T.J. Taylor, May 24, 1995. "Proposed Modifications on the RCRA Facility Investigations (RFI) Work Plan for Operable Unit (OU) 1 082," Los Alamos National Laboratory
and U.S. Department of Energy Los Alamos Area Office letter to Barbara Driscoll (Environmental Protection Agency) from Jorg Jansen (Environmental Restoration Project) and Theodore J. Taylor (DOE), Los Alamos, New Mexico. (Jansen and Taylor 1995, 15-16-627)
Knudsen, T.P., P. Black, 0. Myers, and B. Vandenplas, April 1996. "Technical Approach to Data Assessment for ER Project Site Characterization Decisions," Los Alamos National Laboratory Report, Los Alamos, New Mexico. (Knudsen et al. 1996, 1299)
LANL (Los Alamos National Laboratory). "Los Alamos National Laboratory Environmental Restoration Program Standard Operating Procedures," Los Alamos National Laboratory Report, Los Alamos, New Mexico. (LANL, 0875)
LANL (Los Alamos National Laboratory), August 1989. "Release Site Database; Task 13; TA-11, 13, 16, and 25" (Preliminary Draft, Volumes I and II), prepared by Roy F. Weston, Inc., for the Department of Energy, Los Alamos, New Mexico. (LANL 1989, 15-16-362)
LANL (Los Alamos National Laboratory), November 1990. "Solid Waste Management Units Report," Volumes I through IV, Los Alamos National Laboratory Report LA-UR-90-3400, prepared by International Technology Corporation under Contract 9-XS8-0062R-1, Los Alamos, New Mexico. (LANL 1990, 0145)
LANL (Los Alamos National Laboratory), July 1993. "RFI Work Plan for Operable Unit 1 082," Los Alamos National Laboratory Report LA-UR-93-1196, Los Alamos, New Mexico. (LANL 1993, 1094)
LANL (Los Alamos National Laboratory), May 1994. "RFI Work Plan for Operable Unit 1082, Adddendum 1 ," Los Alamos National Laboratory Report LA-UR-94-1580, Los Alamos, New Mexico. (LANL 1994, 1160}
LANL (Los Alamos National Laboratory), February 1995. "Installation Work Plan for
Environmental Restoration," Revision 4, Los Alamos National Laboratory Report LA-UR-95-740, ER ID No. 49822, Los Alamos, New Mexico. (LANL 1995, 1164)
TA-16 RFI Report 131 September 29, 1997

RFI Report
LANL (Los Alamos National Laboratory}, July 1995. "Statement of Work-Analytical Support,"
Revision 2, RFP No. 9-XS1-Q4257, ER ID No. 49738, Los Alamos, New Mexico. {LANL 1995,
1278)
LANL (Los Alamos National Laboratory), July 1993. "RFI Work Plan for Operable Unit 1082,
Addendum 2," Los Alamos National Laboratory Report LA-UR-95-1 038, Los Alamos, New
Mexico. {LANL 1995, 1342)
LANL (Los Alamos National Laboratory), March 1996. "Quality Assurance Project Plan
Requirements for Sampling and Analysis," Los Alamos National Laboratory Report
LA-UR-96-441, Los Alamos, New Mexico. (LANL 1996, 1292)
LASL (Los Alamos Scientific Laboratory), February 1992. "Soil Behind Building 260," Los
Alamos Scientific Laboratory Analytical Report, Los Alamos, New Mexico. (LASL 1977,15-16-
380)
LASL (Los Alamos Scientific Laboratory}, 1977. "TA-16-401, 406 HE," Los Alamos Scientific
Laboratory Analytical Report, Los Alamos, New Mexico. (LASL 1977, 15-16-426)
Layton, D., B. Mallon, W. Mitchell, L. Hall, R. Fish, L. Perry, G. Snyder, K. Bogen, W. Malloch,
C. Ham, and P. Dowd, December 1997. "Conventional Weapons Demilitarization: A Health and
Envrionmental Effects Data-Base Assessment. Explosives and Their Co-Contaminants," Final
Report, Phase II, Lawrence Livermore National Laboratory Report UCRL-211 09, Livermore,
California. (Layton et al. 1987, 15-16-447)
Lewis, R.J., 1992. "Sax's Dangerous Properties of Industrial Materials, " Van Nostrand
Reinhold, New York {Lewis 1992, 15-16-646)
Longmire, P .A., D.E. Broxton, and S.L. Reneau (Eds.), October 1995. "Natural Background
Geochemistry and Statistical Analysis of Selected Soil Profiles, Sediments, and Bandelier Tuff,
Los Alamos, New Mexiw0," Los Alamos National Laboratory Report LA-UR-95-3486, Los
Alamos, New Mexico. {Longmire et al. 1995, 1266)
McCann, J.P., P. Black, and L. Nonno, April1996. "Screening Assessment Methodology," Los
Alamos National Laboratory Report, Los Alamos, New mexico. {McCann et al. 1996, 1300)
McDonald, E.V., R.D. Ryti, P.A. Longmire, and S.L. Reneau, March 1996. "Background
Geochemistry of Soils and Colluvium at MDA-P, Los Alamos National Laboratory," Los Alamos
National Laboratory Report LA-UR-96-1 092, Los Alamos, New Mexico. (McDonald et al. 1996,
1354)
September 29, 1997 132 TA-16 RFI Report

RFI Report
National Park Service, September 19, 1983. "Archeology and Historic Preservation: Secretary
of the Interior's Standards and Guidelines," Notice, Federal Register, Vol. 48, No. 190,
p. 44716. {National Park Service 1983, 0632)
Panowski, J.B. and P.G. Salgado, July 1971. "Group GMX-3 Effluents," Los Alamos Scientific
Laboratory Memorandum to J. Aragon (GMX-3) from J. B. Panowski (GMX-3) and P.G. Salgado
(GMX-3), Los Alamos, New Mexico. {Panowski and Salgado 1971, 15-16-038)
Penland, J.R., July 1959. "HE Contamination of Abandoned Structures," Los Alamos Scientific
Laboratory Memorandum to S.E. Russo (ENG-3) from J.R. Penland (H-3), Los Alamos, New
Mexico. {Penland 1959, 15-16-255)
Raymer, D.F., January 1996. "Biological and Floodplain/Wetland Assessment for Environmental
Restoration Program, Operable Unit 1082, TAs 11, 13, 16, 24, 37, and 28," Los Alamos
National Laboratory Report LA-UR-93-4182, Los Alamos, New Mexico. {Raymer 1996, 15-16-
621)
Rickenbaugh, D., September 1979. "Explosive Content in Solution," Los Alamos Scientific
Laboratory Memorandum from D. Rickenbaugh to B. Norwood, Los Alamos, New Mexico.
{Rickenbaugh 1979, 15-16-440)
Rogers, M.A., 1995. "Insert for Geologic Map of the Los Alamos National Laboratory
Reservation," Mara, Inc., Los Alamos, New Mexico. {Rogers 1995, 1353)
Ryti, R., P. Longmire, and E. McDonald, March 29, 1996. "Application of LANL Background
Data to ER Project Decision-Making, Part 1: lnorganics," Los Alamos National Laboratory
Report LA-UR-96-1534, Los Alamos, New Mexico. {Ryti et al. 1996, 1298)
Taylor, T.J., January 9, 1995. "Approval of the OU 1082 RFI Workplan," Department of Energy,
Los Alamos Area Office Memorandum to H. Jansen (EM/ER) from T.J. Taylor (DOE/LAAO), Los
Alamos, New Mexico. {Taylor 1995, 1357)
Turner, A. and M. Schwartz, August 1971. "Environmental Studies at S-Site; Water and Soil
Analyses for RDX-HMX, Barium, TNT, and Boron," Los Alamos Scientific Laboratory Group
WX-12 unpublished report, Los Alamos, New Mexico. {Turner and Schwartz 1971, 15-16-284)
TA-16 RFI Report 133 September 29, 1997

RFI Report
THIS PAGE LEFT INTENTIONALLY BLANK
September 29, 1997 134 TA-16 RFI Report

APPENDIX A. ANALYTICAL SUITES
Results of analyses can be found in the Facility for Information Management and Display
(FIMAD). Hard copies of supporting information will be provided upon request.
Chemicals that are reported by analytical laboratories as not detected have not been included
in the tables of this RFI report. Nonetheless, undetected analytes are often part of the decision
making process and it is important to note that these chemicals were analyzed. This appendix
lists the target analytes in each analytical suite included in the tables of Section 5.
Inorganic Suite
Aluminum Beryllium Cobalt Magnesium Potassium Thallium
Antimony Cadmium Copper Manganese Selenium Vanadium
Arsenic Calcium Iron Mercury Silver Zinc
Barium Chromium Lead Nickel Sodium
Volatile Organic Compound (VOC) Suite
Acetone Dibromochloromethane
Benzene 1 ,2-Dichlorobenzene
Bromobenzene 1 ,3-Dichlorobenzene
Bromochloromethane 1 A-Dichlorobenzene
Bromodichloromethane Dichlorodifluoromethane
Bromoform 1, 1-Dichloroethane
Bromomethane 1 ,2-Dichloroethane
2-Butanone 1, 1-Dichloroethene
n-Butylbenzene cis-1 ,2-Dichloroethene
sec-Butylbenzene trans-1 ,2-Dichloroethene
tert-Butylbenzene 1 ,2-Dichloropropane
Carbon disulfide 1 ,3-Dichloropropane
Carbon tetrachloride 2,2-Dichloropropane
Chlorobenzene 1, 1-Dichloropropene
Chloroethane cis-1 ,3-Dichloropropene
Chloroform trans-1 ,3-Dichloropropene
Chloromethane Ethylbenzene
2-Chlorotoluene Hexachlorobutadiene
4-Chlorotoluene 2-Hexanone
1 ,2-Dibromo-3-chloropropane lodomethane
1 ,2-Dibromoethane lsopropylbenzene
Dibromomethane p-lsopropyltoluene
TA-16 RFI Report A-1
Methyl iodide
4-Methyl-2-pentanone
Methylene chloride
Naphthalene
n-Propylbenzene
Styrene
1,1, 1 ,2-Tetrachloroethane
1,1 ,2,2,-Tetrachloroethane
Tetrachloroethene
Toluene
Trichlorotrifluoroethane
1 ,2,4-Trichlorobenzene
1,1, 1-Trichloroethane
1,1 ,2-Trichloroethane
Trichloroethene
Trichlorofluoromethane
1 ,2,3-Trichloropropane
1 ,2,4-Trimethylbenzene
1 ,3,5-Trimethylbenzene
Vinyl chloride
o,m-Xylene
p-Xylene
September 29, 1997

RFI Report
Semivolatile Organic Compound (SVOC) Suite
Acenaphthene Chrysene lsophorone
Acenaphthylene Dibenzo(a,h )anthracene 2-Methylnaphthalene
Aniline Dibenzofuran 2-Methylphenol
Anthracene 1 ,2-Dichlorobenzene 4-Methylphenol
Azobenzene 1 ,3-Dichlorobenzene Naphthalene
Benzo(a)anthracene 1 A-Dichlorobenzene 2-Nitroaniline
Benzo(b )fluoranthene 3,3'-Dichlorobenzidine 3-Nitroaniline
Benzo(k)fluoranthene 2,4-Dichlorophenol 4-Nitroaniline
Benzo(g,h,i)perylene Diethylphthalate Nitrobenzene
Benzo(a)pyrene Dimethyl phthalate 2-Nitrophenol
Benzoic acid Di-n-butylphthalate 4-Nitrophenol
Benzyl alcohol Di-n-octylphthalate N-Nitrosodimethylamine
Bis(2-chloroethoxy)methane 2,4-Dimethylphenol N-Nitrosodiphenylamine
Bis(2-chloroethyl)ether 2,4-Dinitrophenol N-Nitroso-di-n-propylamine
Bis(2-chloroisopropyl)ether 4,6-Dinitro-2-methylphenol Pentachlorophenol
Bis(2-ethylhexyl)phthalate 2,4-Dinitrotoluene Phenanthrene
4-Bromophenylphenyl ether 2,6-Dinitrotoluene Phenol
Butylbenzylphthalate Fluoranthene Pyrene
Carbazole Fluorene Pyridine
4-Chloroaniline Hexachlorobenzene 1 ,2,4-Trichlorobenzene
4-Chloro-3-methylphenol Hexachlorobutadiene 2,4,5-Trichlorophenol
2-Chloronaphthalene Hexach lo rocyclopentadiene 2,4,6-Trichlorophenol
2-Chlorophenol Hexachloroethane
4-Chlorophenylphenyl ether lndeno(1 ,2,3-cd)pyrene
Uranium Suite
Total Uranium
Radionuclide Suite-Gamma Spectroscopy
Americium-241
Cobalt-60
Potassium-40
September 29, 1997
Cerium-144
Europiium-152
Cesium-137
lodine-129
Ruthenium-1 06 Sodium-22
Cobalt-57
Neptunium-237
A-2 TA-16 RFI Report

2-Amino-4,6-DNT
4-Amino-2,6-DNT
1 ,3-Dinitrobenzene (1 ,3-DNB)
2,4-Dinitrotoluene (2,4-DNT)
2,6-Dinitrotoluene (2,6-DNT)
RFI Report
High Explosives Suite
HMX Nitrobenzene (NB)
o-Nitrotoluene (2-NT)
m-Nitrotoluene (3-NT)
p-Nitrotoluene (4-NT)
RDX
Tetryl
1 ,3,5-Trinitrobenzene (1 ,3,5-TNB)
2,4,6-Trinitrotoluene (2,4,6-TNT)
Extended High Explosives Suite
Nitroglycerin
Triaminiotrinitrobenzene (T ATB)
TA-16 RFI Report
Nitroguanadine
A-3
Pentaerythritol tetranitrate(PETN)
September 29, 1997

RFI Report
THIS PAGE LEFT INTENTIONALLY BLANK
September 29, 1997 A-4 TA-16 RFI Report

APPENDIX B. DATA VALIDATION
The following tables summarize the results of quality assurance/quality control data validation for all analytical results used to support recommendations in this RFI report. Tables are presented in order of request number for each sample delivery group sent for laboratory analysis. The tables are grouped by analytical suite. Request numbers for each PAS are cited in Section 5.x.4, in Table 5.x.4-1, entitled Summary of Request Numbers for Samples Taken at PAS xx-xxx.
Tables in this appendix cover radiochemical analysis (Table B-1 ), HE analysis (Table B-2), inorganic analysis (Table B-3), SVOC analysis (Table B-4), total uranium analysis (Table B-5) and VOC analysis (Table B-6).
TABLE B-1
DATA QUALITY EVALUATION FOR RADIOCHEMISTRY ANALYSES AT TA-16
SUITE REQUEST NUMBER COMMENTS
Radionuclides 330 All data are useable without qualification.
Radionuclides 1108 All data are useable without qualification.
Radionuclides 1194 All data are useable without qualification.
Radio nuclides 1244 All data are useable without qualification.
Radionuclides 1253 All data are useable without qualification.
Radionuclides 3627 All data are useable without qualification.
TA-16 RFI Report 8-1 September 29, 1997

RFI Report
TABLE B-2
DATA QUALITY EVALUATION FOR HIGH EXPLOSIVES ANALYSES AT TA-16
REQUEST SUITE NUMBER COMMENTS
HEXPa 116 All data are useable without qualification.
HEXPa 121 All data are useable without qualification.
HEXPa 140 TATB in samples 0316-95-0194,-0195,-0196 and nitroguanadine in sample
0316-95-0206 were not detected in second column analysis and should be
considered estimated. All data are useable with qualification.
HEXPa 215 Holding times were missed by one day. This has no effect on the usability
of the data. PETN in sample 0316-95-0222 and TATB in sample
0316-95-0273 were not detected in second column analysis and should be
considered estimated. All data are acceptable with qualification.
HEXPa 222 Tetryl was found in the method blank but not confirmed by second column
analysis. Samples analyzed for nitroglycerin, PETN, TATB, and
nitroguanadine did not have a surrogate. The values associated with these
compounds should be considered estimated. All data are acceptable with
qualification.
HEXP 328 All data are useable without qualification.
HEXP 525 No lab control standard was present. All data were P-qualifiel. All data
are considered useable for the purposes of this report.
HEXP 546 No lab control standard was present. All data were P-qualified. All data are
considered useable for the purposes of this report.
HEXP 621 Lab control standard was not present. Data considered useable.
HEXP 731 All data are useable without qualification.
HEXP 874 Lab control standard was not present. Data considered useable.
HEXP 903 No lab control standard was present. All data were P-qualified. All data are
considered useable for the purposes of this report.
HEXP 923 No lab control standard was present. All data were PM-qualifiedc. All data
are considered useable for the purposes of this report.
HEXP 972 Samples 0316-95-0115 missed holding times by 3 days. This sample is not
included in this report. Samples 0316-95-0110 through -0114 and sample
0316-95-2014 missed holding times by 1 day. A one-day deviation from
the standard holding time has no effect on the data usability. All data are
useable for the purposes of this report.
HEXP 980 No lab control standard was present. All data were PM-qualified. All data
are considered useable for the purposes of this report.
HEXP 1052 Lab control samples not present. Lab provided a lab control standard for
analysis. Results showed high recovery of 2,4-DNT. This did not affect
the usability of the samples included in this report.
September 29, 1997 8-2 TA-16 RFI Report

RFI Report
TABLE B-2
DATA QUALITY EVALUATION FOR HIGH EXPLOSIVES ANALYSES ATTA-16 (continued)
REQUEST SUITE NUMBER COMMENTS
HEXP 1102 No Jab control standard was present. All data were PM-qualified. All data are considered useable for the purposes of this report.
HEXP 1154 Sample 0316-95-0461 missed holding times by two days. This sample is not included in this report. Lab control samples not present. All data are accepted as useable for the purposes of this report.
HEXP 1183 No Jab control standard was present. All data were PM-qualified. All data are considered useable for the purposes of this report.
a. These request numbers called for an expanded suite of HE analysis. The expanded HE suite includes HEPETN, HENG, HETATB, as well as HEXP.
b. P = Professional judgment should be applied prior to using the data c. PM = Professional judgment should be applied prior to using the data-manual review of the raw data is
recommended
TABLE B-3
DATA QUALITY EVALUATION FOR INORGANIC ANALYSES ATTA-16
REQUEST SUITE NUMBER COMMENTS
lnorganics 120 All data are useable.
lnorganics 122 All data are useable.
lnorganics 141 All data are useable.
lnorganics 206 All data are useable.
lnorganics 223 All data are useable.
lnorganics 252 All data are useable.
lnorganics 329 All data are useable.
lnorganics 526 Duplicate recovery for beryllium, chromium, iron, lead, and manganese was outside the acceptable 20% range and these values were J-qualified.8 The matrix spike for zinc was out of control and zinc values were J-qualified. The matrix spike for selenium was out of control and selenium values were UJ-qualified.b All data are acceptable with qualification.
lnorganics 547 Duplicate recovery for chromium was outside the acceptable 20% range. Matrix spikes for barium and zinc were outside the acceptable range. Zinc, chromium, and barium values were J-qualified. All data are useable with qualification.
TA-16 RFI Report B-3 September 29, 1997

RFI Report
TABLE 8-3
DATA QUALITY EVALUATION FOR INORGANIC ANALYSES AT TA-16 (continued)
REQUEST SUITE NUMBER COMMENTS
lnorganics 622 Duplicate recovery for chromium, copper, zinc, nickel, iron, and lead were
outside the acceptable 20% limit and these data were P-qualified. c These
data should be considered estimated. Zinc also had a low spike recovery
and was qualified as J-.d Spike recovery was above the acceptable limit of
125% for arsenic and the data were qualified as J+. 6 Spike recovery for
selenium was below the acceptable limit of 75% and the data were
UJ-qualified. All data are useable with qualification.
lnorganics 730 Spike recovery was out of control for antimony, arsenic, and selenium. Data were qualified as UJ. Aluminum was out of control in the duplicate and data
were P-qualified. Aluminum should be considered as estimated. All data are
acceptable with qualification.
lnorganics 875 Duplicate recovery for calcium and chromium was outside the acceptable
20% range. Calcium and chromium were P-qualified and should be
considered estimated. This did not affect the quality of the data for the
purposes of this report. All data are considered useable.
lnorganics 924 Duplicate recovery for chromium was outside the acceptable 20% range and was P-qualified. Spike recoveries were below the acceptable level of 75%
for manganese (74%), lead (58%), copper (64%), and chromium (69%). The
data are qualified as J-. All data are considered useable as qualified.
lnorganics 978 Spike recovery for barium was outside the acceptable value of 125% and all
barium data were qualified as estimated with a high bias (J+ ). Spike recovery for selenium was below the acceptable value of 75%. All selenium data were
qualified as UJ. Matrix spike criteria for lead were not met in sample
0316-95-0110, although this sample is not included in this report. Duplicate
recovery for barium, lead, and manganese was outside the acceptable 20%
range. This did not affect the quality of the data for the purposes of this report. All data are useable with qualification.
a. J = Analyte was positively identified, numerical value is estimated to be more uncertain than would normally be expected for that analysis
b. UJ = Analyte was not detected, numerical value is an estimate of the EQL c. P = Professional judgment should be applied prior to using the data d. J- = Analyte was positively identified, result is likely biased low e. J+ = Analyte was positively identified, result is likely biased high f. U = Analyte was not detected
September 29, 1997 B-4 TA-16 RFI Report
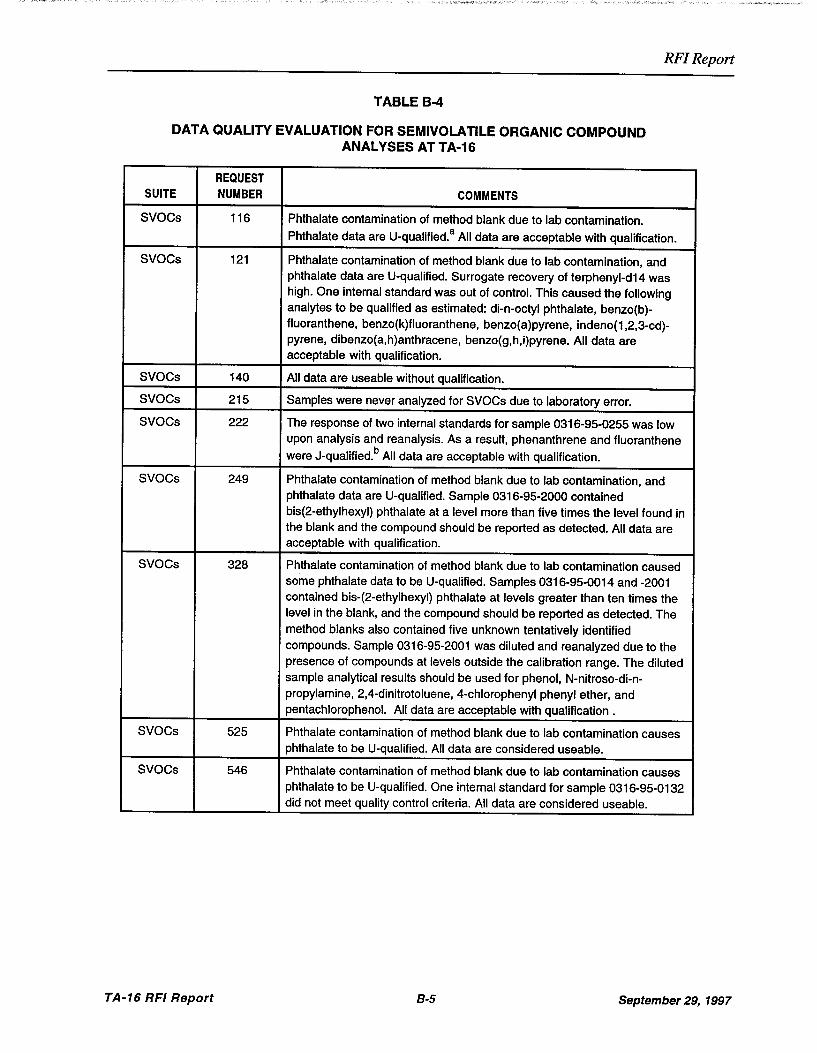
RFI Report
TABLE B-4
DATA QUALITY EVALUATION FOR SEMIVOLATILE ORGANIC COMPOUND ANALYSES ATTA-16
REQUEST SUITE NUMBER COMMENTS
SVOCs 116 Phthalate contamination of method blank due to lab contamination. Phthalate data are U-qualified.8 All data are acceptable with qualification.
SVOCs 121 Phthalate contamination of method blank due to lab contamination, and phthalate data are U-qualified. Surrogate recovery of terphenyl-d14 was high. One internal standard was out of control. This caused the following analytes to be qualified as estimated: di-n-octyl phthalate, benzo(b)-fluoranthene, benzo(k)fluoranthene, benzo(a)pyrene, indeno(1,2,3-cd)-pyrene, dibenzo(a,h)anthracene, benzo(g,h,i)pyrene. All data are acceptable with qualification.
SVOCs 140 All data are useable without qualification.
SVOCs 215 Samples were never analyzed for SVOCs due to laboratory error.
SVOCs 222 The response of two internal standards for sample 0316-95-0255 was low upon analysis and reanalysis. As a result, phenanthrene and fluoranthene were J-qualified. b All data are acceptable with qualification.
SVOCs 249 Phthalate contamination of method blank due to lab contamination, and phthalate data are U-qualified. Sample 0316-95-2000 contained bis(2-ethylhexyl) phthalate at a level more than five times the level found in the blank and the compound should be reported as detected. All data are acceptable with qualification.
SVOCs 328 Phthalate contamination of method blank due to lab contamination caused some phthalate data to be U-qualified. Samples 0316-95-0014 and -2001 contained bis-(2-ethylhexyl) phthalate at levels greater than ten times the level in the blank, and the compound should be reported as detected. The method blanks also contained five unknown tentatively identified compounds. Sample 0316-95-2001 was diluted and reanalyzed due to the presence of compounds at levels outside the calibration range. The diluted sample analytical results should be used for phenol, N-nitroso-di-n-propylamine, 2,4-dinitrotoluene, 4-chlorophenyl phenyl ether, and pentachlorophenol. All data are acceptable with qualification .
SVOCs 525 Phthalate contamination of method blank due to lab contamination causes phthalate to be U-qualified. All data are considered useable.
SVOCs 546 Phthalate contamination of method blank due to lab contamination causes phthalate to be U-qualified. One internal standard for sample 0316-95-0132 did not meet quality control criteria. All data are considered useable.
TA-16 RFI Report 8-5 September 29, 1997

RFI Report
TABLE B-4
DATA QUALITY EVALUATION FOR SEMIVOLATILE ORGANIC COMPOUND ANALYSES AT TA-16
(continued)
REQUEST SUITE NUMBER COMMENTS
SVOCs 621 Phthalate contamination of method blank due to lab contamination causes phthalate to be U-qualified. All internal standards did not meet quality control criteria. Samples were reanalyzed. Only reanalyzed results are considered useable.
SVOCs 729 All data are useable without qualification.
a. U = Analyte was not detected b. J = Analyte was positively identified, numerical value is estimated to be more uncertain than would normally be
expected for that analysis c PM = Professional judgment should be applied prior to using the data-manual review of the raw data is
recommended d. UJ = Analyte was not detected, numerical value is an estimate of the EO e. J- = Analyte was positively identified, result is likely biased low f. RPM= Without further review of the raw data, sample results are unusable
TABLE B-5
DATA QUALITY EVALUATION FOR TOTAL URANIUM ANALYSES AT TA-16
REQUEST SUITE NUMBER COMMENTS
Uranium 142 All data are useable without qualification.
Uranium 925 All data are useable without qualification.
Uranium 982 All data are useable without qualification.
Uranium 1108 All data are useable without qualification.
Uranium 1244 All data are useable without qualification.
Uranium 1393 All data are useable without qualification.
Uranium 3627 All data are useable without qualification.
TABLE B-6
DATA QUALITY EVALUATION FOR VOLATILE ORGANIC COMPOUNDS ANALYSES AT TA-16
REQUEST SUITE NUMBER COMMENTS
VOCs 249 One method blank contained methylene chloride, trichloroethene, and
trichlorofluoromethane. Another method blank contained methylene
chloride and acetone at levels less than EQLs. Results for these analytes
were qualified as Ua or J.b All data are useable as qualified.
VOCs 289 One method blank contained methylene chloride, trichloroethene, and
trichlorofluoromethane. Another method blank contained methylene
chloride and acetone at levels less than EQLs. Results for these analytes
were qualified as U or J. All data are useable as qualified.
September 29, 1997 8-6 TA-16 RFI Report

RFI Report
TABLE 8-6
DATA QUALITY EVALUATION FOR VOLATILE ORGANIC COMPOUNDS ANALYSES AT TA-16 (continued)
REQUEST SUITE NUMBER COMMENTS
VOCs 328 The method blank contained acetone, methylene chloride, and trichlorofluoromethane. One internal standard exhibited a low response and some compounds were UJ-qualified.c Data are useable as qualified.
VOCs 525 Acetone, methylene chloride, and trichlorofluoromethane were present in the blanks and U-qualified. All data are useable with qualification.
VOCs 546 Acetone, methylene chloride, and trichlorofluoromethane were present in the blanks and U-qualified. All data are useable with qualification.
VOCs 621 Trichlorofluoromethane and methylene chloride present in levels less than five times the EQL were U-qualified. All data are useable with qualification.
VOCs 729 One internal standard was out of control. Data were UJ-qualified. All data are useable with qualification
VOCs 874 Methylene chloride and acetone were found in the blanks. Values below ten times EQL are U-qualified. All data are useable with qualification.
VOCs 903 Methylene chloride and acetone were found in the blanks. Values below ten times the EQL are U-qualified. All data are useable with qualification.
VOCs 923 Methylene chloride and trichlorofluoromethane were found in the blanks and U-qualified. In samples 0316-95-0063 and -0063RE, one surrogate had a low recovery and one internal standard had a low response. Detected compounds are qualified as J-.d Undetected compounds are UJ-qualified. All data are acceptable with qualification.
VOCs 972 Methylene chloride, trichlorofluoromethane, and acetone were found in the blanks and U-qualified. All data are useable for the purposes of this report.
VOCs 980 Methylene chloride and acetone were found in the blanks and U-qualified. All data are acceptable with qualification.
VOCs 1052 Methylene chloride was found in the blanks and U-qualified. All data are acceptable with qualification.
VOCs 1102 Methylene chloride, trichlorofluoromethane, and acetone were found in the blanks and U-qualified. All data are acceptable with qualification.
VOCs 1192 All data are acceptable without qualification.
VOCs 1242 Methylene chloride, trichlorofluromethane, and acetone were found in the blanks and U-qualified. All data are acceptable with qualification.
VOCs 1251 Methylene chloride, acetone, and trichlorofluoromethane were present in method blanks due to laboratory contamination and U-qualified. All data are acceptable with qualification.
a U = Analyte was not detected b. J = Analyte was positively identified, numerical value is estimated to be more uncertain than would normally be
expected for that analysis c. UJ = Analyte was not detected, numerical value is an estimate of the EQL d. J- = Analyte was positively identified, result is likely biased low e. PM = Professional judgement should be applied prior to using the data-manual review of the raw data is
recommended f. J+ = Analyte was positively identified, result is likely biased high
TA-16 RFI Report 8-7 September 29, 1997

RFI Report
THIS PAGE LEFT INTENTIONALLY BLANK
September 29, 1997 B-8 TA-16 RFI Report

APPENDIX C. FIELD SCREENING METHODS
The field screening methods used for biasing laboratory-sample selection during the fiscal year
(FY) 1995 TA-16 field campaign include volatile organic methods (photoionization detector
[PID]), metals methods (X-ray fluorescence [XRF] and laser-induced breakdown spectrometry
[LIBS]), radionuclide methods (sodium iodide [Nal] detector), and the high explosives (HE)
spot test for explosives. Each of these techniques indicates the presence of constituents of
potential concern in soil samples. These methods are qualitative (indicative of the presence or
absence of a constituent) to semi-quantitative (indicative of the relative amount of a constituent)
indicators of the presence of constituents. The principal utility of such methods is to increase
the chances that samples are taken in locations of higher contamination. These methods are
not used for determining whether a potential release site (PRS) is clean; that decision is based
entirely on the results of laboratory analysis.
Each of these methods is described briefly below. Additional information about these techniques
is provided in the cited references and standard operating procedures (SOPs).
Photoionization Detector (PID)
A PL-101 PID with a 11.7 eV lamp was used during the FY 1995 TA-16 field campaign. This is
a general survey instrument capable of real-time detection of many complex organic compounds
in air. The PID is used both for health and safety purposes to ensure that the breathing zone
in a PRS is free of high levels of organic constituent. It also used to identify soil samples that
contain volatile organic compounds. The PID provides semi-quantitative results that can be
used to select the most volatile organic-rich samples from a PRS. Because the principal
constituents of concern at TA-16 are HE and barium, the PID was not typically the principal
biasing method used at TA-16 PRSs.
Operation of the PID follows LANL-ER-SOP-HSM-1 C "Direct-Reading Monitoring Method
Using GCs, PIDs, and FIDs." The PID is calibrated daily. Records of this calibration are in the
field notes, which are archived at the Records Processing Facility.
A review of the locations at TA-16 that were sampled during FY 1995 based on PID hits (e.g.,
PRS 16-021 [a]) suggests that the method is subject to false positives. Locations that provided
PID hits of 20-50 ppm showed only low levels (20 ppb or less) of volatile organic compounds.
The PID is known to react with naturally occurring VOCs (e.g. pinenes, terpenes) that are a
component of forest litter. It is likely that these false positive are due to the presence of these
compounds.
TA-16 RFI Report C-1 September 29, 1997

RFI Report
XRF
A Spectrace 9000 XRF instrument was used during the FY 1995 TA-16 field campaign. XRF is
a technique for analyzing total metals in solids. The instrument consists of a source for sample
excitation, a detector or proportional counter, a sample chamber, and an energy analyzer. XRF
only scans the upper layer of material, which means that sample preparation can have a large
impact on reproducibility of repeated sample measurements. The XRF typically provides semi
quantitative data on metal concentrations in soils. The instrument is subject to matrix effects;
however, it can provide quantitative data if matrix-matched standards are available. The
principal inorganic analyte used for biasing samples at TA-16 is barium. The detection limit for
barium in soils is 60 mg/kg, a level that is well below the SAL of 5300 mg/kg.
Operation of the Spectrace 9000 XRF instrument currently follows LANL-ER-SOP-1 0.08
"Operation of the Spectrace 9000 Field-Portable X-Ray Fluorescence Instrument." However,
this SOP was not promulgated during FY 1995; use of this instrument during the FY 1995 TA-16
field campaign followed the manufacturer's instructions. The XRF was checked daily for (1)
instrument response on an iron blank, and (2) analytical background on teflon. Precision was
evaluated by reanalyzing a sample at a rate of approximately 1 in 10. All calibration and
operation records are available in the field notes, which are archived at the Records Processing
Facility. The XRF method has been approved for inclusion in EPA SW-846 methods as method
6200.
A review of the locations at TA-16 that were sampled during FY 1995 based on XRF hits for
barium suggests that the method is effective for biasing. A comprehensive statistical study of
the relationship between barium determined by field-based XRF and barium determined by
laboratory methods has not been completed at this time. However, as an example, laboratory
sample locations at PRS 16-01 O(a) were selected based on barium field screening. Comparative
data between XRF and laboratory methods are provided in Table C -1.
TABLE C-1
COMPARISON OF XRF AND LABORATORY DATA FOR BARIUM
SCREENING LABORATORY LOCATION ID XRF:Ba LABORATORY:Ba SAMPLE ID SAMPLEID (mg/kg) (mg/kg)
0316-95-1504 0316-95-0383 16-1343 4620 6680
0316-95-1505 0316-95-0386 16-1344 4260 9580
0316-95-1507 0316-95-0389 16-1345 3650 5220
0316-951519 0316-95-0392 16-2167 240 1090
September 29, 1997 C-2 TA-16 RFI Report

RFI Report
This simple comparison suggests that XRF barium data is biased low relative to laboratory
barium analyses, probably due to matrix effects, and that XRF barium data can successfully be
used for sample biasing. The technique can correctly identify the two higher barium samples
relative to the lower barium samples.
LIBS
A Spectra-Physics DCR-11 laser-induced breakdown spectroscopy (LIBS} instrument was
used for sample biasing at one PRS in this report (PRS 16-010[a]} during the FY 1995 TA-16
field campaign. This instrument was tested to determine whether LIBS or XRF had greater
utility for biasing samples based on their barium abundance.
In LIBS, a laser spark is focused on a soil sample to excite atomic emission lines that are
characteristic of the trace metals in the sample. One identifies emitting species by spectrally
and temporally resolving the plasma light. The LIBS instrument typically provides semi
quantitative data on metal concentrations in soils. The instrument is subject to matrix effects;
however, it can provide quantitative data if matrix-matched standards are available. The
principal inorganic analyte used for biasing samples at TA-16 is barium. The LIBS detection
limit for barium in soils is 42 mg/kg (Eppler et al. 1996, 15-16-643}, a level well below the SAL
of 5300 mg/kg. A detailed description of the application of LIBS to Sa-contaminated soils is
provided by Eppler (Eppler et al. 1996, 15-16-643}.
There is no ER SOP for operation of the LIBS instrument because it is still an experimental
analytical technique. The PRS 16-01 O(a} test was completed by the LANL scientist who
developed this analytical method. The field test at PRS 16-01 O(a} was completed by standardizing
barium response of the LIBS instrument against soils of known barium composition. Comparative
data showing LIBS and laboratory methods are provided in Table C-2.
TABLE C-2
COMPARISON OF LIBS AND LABORATORY DATA FOR BARIUM
SCREENING LABORATORY LOCATION LIBS:Ba LABORATORY:Ba SAMPLE ID SAMPLE ID ID (mg/kg) (mg/kg)
0316-95-1504 0316-95-0383 16-1343 2880 6680
0316-95-1505 0316-95-0386 16-1344 2040 9580
0316-95-1507 0316-95-0389 16-1345 2070 5220
0316-951519 0316-95-0392 16-2167 1340 1090
TA-16 RFI Report C-3 September 29, 1997

RFI Report
This comparison suggests that LIBS barium data is biased low relative to laboratory barium
analyses, probably due to matrix effects, and that LIBS barium data can successfully be used
for sample biasing. The technique can correctly identify the higher barium samples relative to
the lower barium samples.
Both LIBS and XRF can be used successfully to bias laboratory samples based on barium
abundance. However, XRF appears to be a superior biasing technique than LIBS. XRF is a
proven technique that is scheduled for inclusion as an SW-846 method. XRF uses an
off-the-shelf instrument that can be operated in the field by a sampling technician; LIBS still
requires operation by a highly trained scientist. XRF can provide semi-quantitative data on a
wide range of heavy metals in a short period of time; LJBS is best for investigating a single
element at a time. There are specific applications for which LIBS is superior to XRF, such as
determination of beryllium or chromium in soil; however, for field biasing based on barium, XRF
is the technique preferred by Field Unit 3.
Sodium Iodide Detector for Gamma Emitters
A Ludlum 2x2 sodium iodide (Nal) detector was used during the FY 1995 TA-16 field campaign.
This is a general survey instrument capable of real-time detection of gamma emitters in soil or
surfaces. The Nal detector is used for both health and safety purposes to ensure that materials
in a PRS are free of high levels of radioactive constituents and to identify soil samples that
contain radionuclides at levels greater than background. The Nal instrument provides semi
quantitative results that can be use to select radionuclide-rich samples from a PRS. Because
the principal constituents of concern at TA-16 are HE and barium, the Nal was not typically the
principal biasing method at TA-16 PASs.
Operation of the Nal instrument follows LANL-ER-SOP-06.23 "Measurement of Gamma-Ray
Fields Using a Sodium Iodide Detector." The Nal detector is response-checked daily. Records
of this check are in the field notes, which are archived at the Records Processing Facility.
HE Spot Test
The HE spot test kit with Modified Griess reagents was extensively used for sample biasing
during the FY 1995 TA-16 field campaign. All PASs in which the HE spot test revealed
contamination (e.g., Burning Ground PASs, the TA-16-260 outfall) are not included in this
report. An HE spot test kit positive result typically indicates that a PRS is not suitable for NFA
unless the spot test result was a false positive. PASs included in this report typically had
negative HE spot test results or false positive HE spot test results.
September 29, 1997 C-4 TA-16 RFI Report

RFI Report
The HE spot test kit was developed at LANL to identify the presence of explosives as
contaminants on equipment and environmental media. Four reagents in a carrying case can be
used to detect any of the common explosives used at Los Alamos (HMX, RDX, TNT, PETN, and
TATB). The HE spot test kit provides a rapid {less than 1 minute) qualitative indicator of the
presence or absence of HE in soils. The nominal detection limit for this kit is 100 ppm of HE
(Baytos 1991, 15-16-339). The HE spot test kit is used by Field Unit 3 for
• safety purposes to determine whether a soil is likely to present an explosive
hazard to workers,
• determining whether a soil must be classed as an explosive for shipping
purposes, and
• biasing laboratory samples to locations that have received significant HE
discharge.
The HE spot test is a gross biasing method that is used to ensure that locations with high
concentrations of HE are sampled or cleaned up. It is not used for final cleanup decisions at
a site.
Use of the HE Spot-Test kit is dictated by LANL-ER-SOP-1 0.06 "High Explosives Spot Test."
A comparison of HE spot test results against laboratory data collected during the FY 1995
TA-16 field campaign reveals the following:
• the HE spot test successfully identified samples with greater than 100 ppm
HE at highly contaminated potential release sites such as those at theTA-
16 Burning Ground and the TA-16-260 outfall,
• there were few (one or two) false negative results {locations where greater
than 100 ppm HE was found based on laboratory analysis, but the HE spot
test gave a negative result), and
• false positive results (locations where less than 100 ppm HE was found
based on laboratory analysis, but the HE spot test provided a positive
result) were common.
TA-16 RFI Report C-5 September 29, 1997

RFI Report
False negative results were noted at the T A-16-260 outfall and may be due to sample
heterogeneity. False positive results were noted at several PRS, such as PRS 16-01 O(a), which
is included in this report. False positive results may be due to the presence of nitrite in the soil
or to low levels of humic material in soils that may suggest a color change in the spot test
reagents (Spontarelli personal communicatio_n, 1996).
September 29, 1997 C-6 TA-16 RFI Report