Refer#1 Li-S. azu
121
1 THE EFFECT OF PRESSURE ON LITHIUM-SULFUR CATHODE PERFORMANCE by Chris Campbell ____________________________ A Thesis Submitted to the Faculty of the DEPARTMENT OF MATERIALS SCIENCE AND ENGINEERING In Partial Fulfillment of the Requirements For the Degree of MASTER OF SCIENCE In the Graduate College THE UNIVERSITY OF ARIZONA 2013
description
Refer#1 Li-S. azu
Transcript of Refer#1 Li-S. azu

1
THE EFFECT OF PRESSURE ON LITHIUM-SULFUR CATHODE PERFORMANCE
by
Chris Campbell
____________________________
A Thesis Submitted to the Faculty of the
DEPARTMENT OF MATERIALS SCIENCE AND ENGINEERING
In Partial Fulfillment of the Requirements
For the Degree of
MASTER OF SCIENCE
In the Graduate College
THE UNIVERSITY OF ARIZONA
2013

2
STATEMENT BY AUTHOR
This thesis has been submitted in partial fulfillment of requirements for an
advanced degree at the University of Arizona and is deposited in the University Library
to be made available to borrowers under rules of the Library.
Brief quotations from this thesis are allowable without special permission,
provided that an accurate acknowledgement of the source is made. Requests for
permission for extended quotation from or reproduction of this manuscript in whole
or in part may be granted by the head of the major department or the Dean of the
Graduate College when in his or her judgment the proposed use of the material is in
the interests of scholarship. In all other instances, however, permission must be
obtained from the author.
SIGNED: Chris Campbell
APPROVAL BY THESIS DIRECTOR
This thesis has been approved on the date shown below:
(12/06/2013)
Srini Raghavan Date
Professor of Chemistry of
Materials Science and Engineering

3
ACKNOWLEDGEMENTS
Without the motivation and support provided to me by Dr. John Affinito, this work would
not exist; for his help I am eternally grateful. I am equally indebted to my advisor, Dr.
Srini Raghavan, without whom I would not have had the opportunity to reach the end of
this long path. His efforts helped me shape my work into a coherent whole, and his
direction was invaluable in helping me communicate my ideas in a clear and concise
manner. I owe a debt of gratitude to all of my colleagues at Sion Power who were happy
to assist me as they could throughout my time there. Lastly, I must thank my colleague
and friend Dr. Karthikeyan Kumaresan, his insightful comments and stimulating
conversation were instrumental in shaping my understanding of the lithium sulfur battery
chemistry.

4
DEDICATION
For my Mom, Dad, and Sister:
Who have always offered me their unending love and support.

5
TABLE OF CONTENTS
LIST OF FIGURES ............................................................................................................ 7
LIST OF TABLES ............................................................................................................ 11
ABSTRACT ...................................................................................................................... 12
I. INTRODUCTION ......................................................................................................... 13
II. BACKGROUND AND LITERATURE REVIEW ...................................................... 18
II.A. TYPICAL CONSTRUCTION OF A LITHIUM-SULFUR BATTERY ..................................... 18
II.B. OPERATION OF AN IDEAL LITHIUM-SULFUR CELL .................................................... 21
II.C. THE POLYSULFIDE SHUTTLE ................................................................................... 27
III. CURRENT STUDY.................................................................................................... 39
IV. MATERIALS AND METHODS ............................................................................... 41
IV.A. CARBON PARTICULATE CATHODES ....................................................................... 41
IV.B. SINTERED NICKEL CATHODES ................................................................................ 43
IV.C. OPTICAL MICROSCOPY .......................................................................................... 49
IV.D. SCANNING ELECTRON MICROSCOPY ...................................................................... 49
IV.E. DIBUTYL PHTHALATE (DBP) UPTAKE ................................................................... 49
IV.F. NITROGEN ADSORPTION/DESORPTION STUDIES ..................................................... 50
IV.G. MERCURY INTRUSION POROSIMETRY .................................................................... 51
IV.H. COMPRESSION TESTING ........................................................................................ 51
IV.I. LI-S CELL ASSEMBLY ............................................................................................. 51
IV.J. CELL PERFORMANCE TESTING ................................................................................ 53
IV.K. CELL DISASSEMBLY AND ANALYSIS ...................................................................... 54

6
V. RESULTS .................................................................................................................... 55
V.A. OPTICAL MICROSCOPY OF TYPE I AND II CATHODES ............................................... 55
V.B. ELECTRON MICROSCOPY ........................................................................................ 59
V.C. DIBUTYL PHTHALATE (DBP) UPTAKE .................................................................... 70
V.D. NITROGEN ADSORPTION AND DESORPTION ............................................................. 71
V.E. MERCURY INTRUSION POROSIMETRY ..................................................................... 77
V.F. CATHODE COMPRESSION ........................................................................................ 80
V.G. LITHIUM-SULFUR BATTERY PERFORMANCE ............................................................ 82
VI. DISCUSSION ............................................................................................................. 91
VII. SUMMARY AND FUTURE WORK ..................................................................... 110
APPENDIX A. MERCURY INTRUSION DATA ........................................................ 115
REFERENCES ............................................................................................................... 117

7
LIST OF FIGURES
Figure 1. Cross section of a lithium-sulfur battery showing its basic layout. ................... 18
Figure 2. Cross section of a lithium-sulfur battery showing the ideal charge and discharge
processes of a lithium-sulfur battery. ................................................................................ 22
Figure 3. Ideal discharge process curve for a fresh Li-S cell. ........................................... 24
Figure 4. Ideal charge process curve for a lithium-sulfur cell. ......................................... 27
Figure 5. Cross section of a lithium-sulfur battery with polysulfide shuttle mechanism. 28
Figure 6. Comparison of ideal charge process with and without shuttle .......................... 29
Figure 7. Ideal discharge curve from cell with active shuttle, showing loss of the upper
plateau. .............................................................................................................................. 31
Figure 8. Comparison of discharge process curves for cells with and without shuttle. .... 32
Figure 9. Typical lithium-sulfur charge and discharge curves for catholyte type cell with
nitrate. ............................................................................................................................... 35
Figure 10. Rate capability of a typical lithium-sulfur catholyte type cell. ....................... 36
Figure 11. Low temperature performance of a typical lithium-sulfur catholyte cell. ....... 37
Figure 12. Carbon-based cathode slurry production flowchart. ....................................... 42
Figure 13. SEM micrograph of nickel powder type 255 supplied by the manufacturer. .. 44
Figure 14. SEM micrograph of nickel powder type 525 supplied by the manufacturer. .. 44
Figure 15. Sintered nickel plaques. ................................................................................... 47
Figure 16. Schematic of electrode stack for 105 mAh cells. ............................................ 52
Figure 17. Schematic of electrode stack for 300 mAh cells. ............................................ 52
Figure 18. Type I cathode as coated at 30x magnification. .............................................. 55
Figure 19. Type II cathode as coated at 30x magnification. ............................................. 56

8
Figure 20. Type A cathode as coated at 30x magnification. ............................................. 57
Figure 21. Type B cathode as coated at 30x magnification. ............................................. 58
Figure 22. Type C cathode as coated at 30x magnification. ............................................. 59
Figure 23. SEM micrographs of type I cathode after full discharge without applied
pressure. (A) Backscattered electron image of cathode surface in plane view, (B) cross
section showing interior of cathode void volume, (C) EDS spectrum collected from area
of 19a. ............................................................................................................................... 61
Figure 24. SEM micrographs of type I cathodes cycled under 1 MPa applied pressure. (A)
Surface of type I cathode and (B) cross section of type I cathode. ................................... 63
Figure 25. Type II cathode after full discharge cycled without applied pressure. (A)
Backscattered electron image of cathode surface, (B) backscattered electron image of
cathode cross section, (C) EDS spectrum taken from area in (A). ................................... 65
Figure 26. SEM micrographs of type II cathode cycled under pressure. (A) Backscattered
electron image of cathode surface, (B) backscattered electron image of cathode cross
section. .............................................................................................................................. 67
Figure 27. EDS from type II cathode (upper left area of Figure 26A) confirming that the
lighter deposit is sulfur rich. ............................................................................................. 68
Figure 28. Further EDS from type II cathode showing distribution of the components in
the cathode in cross section. Clockwise from top left: electron image, carbon Kα1-2, sulfur
Kα1, oxygen Kα1. .............................................................................................................. 68
Figure 29. SEM micrographs of type 255 sintered nickel electrodes. Top to bottom, left to
right: 100x magnification, 60° tilt 100x magnification, 500x magnification, 2500x
magnification. ................................................................................................................... 70

9
Figure 30. Nitrogen adsorption/desorption isotherm for Xe2 carbon. .............................. 72
Figure 31. BET surface area plot for Xe2 carbon. ............................................................ 73
Figure 32. The t-plot for desorption isotherm from Xe2 carbon sample. ......................... 74
Figure 33. Nitrogen adsorption/desorption isotherm for Vulcan carbon. ......................... 75
Figure 34. BET surface area plot for Vulcan XC72 carbon. ............................................ 76
Figure 35. The t-plot for Vulcan XC72 carbon................................................................. 77
Figure 36. Mercury intrusion porosimetry of type I cathode. ........................................... 78
Figure 37. Mercury intrusion porosimetry of type A cathode. ......................................... 78
Figure 38. Mercury intrusion type 255 nickel cathode. .................................................... 79
Figure 39. Compression behavior of the carbon-based cathodes. .................................... 81
Figure 40. Cycle life of type I and type II cathodes cycled with and without pressure. ... 83
Figure 41. Plot of discharge voltage versus specific capacity for cells with type I cathode
cycled under various applied pressures. ............................................................................ 85
Figure 42. Discharge voltage curves for cells with type II cathodes. ............................... 86
Figure 43. Specific discharge capacity versus cycle for cells with types A, B, and C
cathode cycled under 1 MPa. ............................................................................................ 87
Figure 44. Discharge voltage versus specific capacity of cathode types A, B, and C. ..... 88
Figure 45. Plot of discharge voltage versus specific capacity for cells with nickel-based
cathodes cycled with and without pressure. ...................................................................... 89
Figure 46. Discharge curve comparing the performance of type 525 cathode with type
255 cathode. ...................................................................................................................... 90
Figure 47. Specific discharge of cells with type I and II cathodes. .................................. 91
Figure 48. Lower plateau capacity for type I and II cathodes. ......................................... 93

10
Figure 49. Specific capacity of cells with each cathode type cycled under 1 MPa. ......... 94
Figure 50. Cartoon representation of cathode compression, as-produced cathode on the
left, and cathode placed under 1 MPa on the right. .......................................................... 95
Figure 51. Schematic representation of the cathode at the start of the discharge process
(left) and at the beginning of the lower plateau (right). .................................................... 96
Figure 52. Schematic representation of the state of the cathode at the start of the lower
plateau. .............................................................................................................................. 97
Figure 53. Relationship between specific discharge capacity and total void volume (Vv).
........................................................................................................................................... 99
Figure 54. Functional relationship between Φ and specific discharge capacity for Type I
cathodes........................................................................................................................... 101
Figure 55. Specific capacity as a function of void fraction for all cathode types. .......... 102
Figure 56. Diagram showing the effects of Li2S precipitation on the porous structure of
the cathode. ..................................................................................................................... 104
Figure 57. SEM micrographs showing Li2S nodules deposited on a pore wall. ............. 104
Figure 58. Diagram of a pore wall showing Li2S deposition. ......................................... 105
Figure 59. Cartoon of first reaction step in the reduction of S42-
to S2-
. ......................... 107
Figure 60. Mercury intrusion porosimetry of type II cathode. ....................................... 115
Figure 61. Mercury intrusion porosimetry for type B cathode. ...................................... 115
Figure 62. Mercury intrusion of type C cathode. ............................................................ 116
Figure 63. Mercury intrusion type 525 nickel cathode. .................................................. 116

11
LIST OF TABLES
Table 1. Comparison of lithium battery performance with industry targets. .................... 16
Table 2. Sulfur to carbon ratio of carbon-based cathodes. ............................................... 41
Table 3. DBP uptake of the cathodes tested in this study. ................................................ 71
Table 4. Mercury intrusion results. ................................................................................... 79
Table 5. Percentage of initial cathode thickness at one megapascal applied pressure. .... 82
Table 6. Calculated void volumes for cathodes with and without applied pressure. ........ 98
Table 7. Void fraction of type I cathodes under increasing pressure. ............................. 100
Table 8. Void fraction initially and under 1 MPa for each cathode type. ....................... 102
Table 9. Void size distribution for different cathode types. ........................................... 106

12
ABSTRACT
Lithium-sulfur battery chemistry is being considered for use in electric vehicles due to its
high theoretical specific energy. However, demonstrated cycle life is limited to 50 cycles,
which prevents adoption in real-world applications. Work with solid electrolytes has
shown promise in extending cycle life, but these materials are destroyed by the formation
of lithium dendrites during the charge process. The application of at least 0.7 MPa
pressure normal to the electrode stack mitigates lithium dendrite formation by
mechanically deforming lithium deposits during the charge process, enabling the use of a
solid electrolyte. In order to probe the effect of applied pressure, several compressible
carbon and sulfur composite cathodes and novel sintered nickel cathodes were fabricated
and their effect on cathode performance was investigated. For each type of cathode, the
intraparticle pore volume and the interparticle void volume were quantified and the
porosity (i.e. void fraction) was calculated, the mechanical behavior under 0 to 2 MPa
compression was measured, and lithium-sulfur cells were cycled under several pressures
between 0 and 1 MPa. The cathodes studied had void fractions in the range of 0.45 to
0.90. Specific discharge capacities between 200 and 1100 mAh/g under 1 MPa were
observed in carbon-based cathodes. Nickel-based cathodes showed increased specific
discharge capacity of up to 1300 mAh/g, with no degradation of performance under
pressure. Specific discharge capacity was shown to be highly correlated to void fraction.
These results, in conjunction with previous work, strongly suggest that the performance
of lithium-sulfur cathodes is highly dependent on properties that influence ionic mass
transport in the cathode.

13
I. INTRODUCTION
A battery is an energy storage device that converts between chemical and electrical
energy. In a primary battery the conversion of chemical energy into electrical energy is
irreversible and the battery is discarded after the electrical energy has been extracted. In a
secondary battery, the conversion of chemical energy into electrical energy is reversible.
The conversion of stored chemical energy into electrical energy is referred to as the
discharge process. The reverse process, conversion of electrical energy to chemical
energy, is known as the charge process. Secondary batteries are commonly referred to as
rechargeable batteries.
The dominant power supply for terrestrial vehicles is the internal combustion engine,
which relies on the consumption of fossil fuels to generate mechanical energy. With the
rising cost of fossil fuels due to a number of economic factors, as well as increased
political pressures to reduce consumption of oil, development of alternative power
sources for terrestrial vehicle propulsion has received significant research attention and
investment over the last decade. One candidate to replace the combustion paradigm is a
battery system that supplies electrical energy to an electric motor which then converts the
electrical energy to mechanical energy. Already, hybrid electric vehicles are becoming
commonplace in the automotive marketplace. A hybrid electric vehicle possesses a
rechargeable battery system that supplements and improves the performance of a
combustion engine powertrain. Nearly every major and many minor automotive
manufacturers offer such hybrid powertrain vehicles.

14
The next step in the evolution of fully electric vehicles is the introduction of vehicles
with a fully electric powertrain with power supplied by a rechargeable battery system.
Several small-scale efforts have been made to produce fully electric vehicles for the
consumer market in the United States. These include the Tesla Motors models: Roadster,
S, and X; Smart Car’s Fourtwo electric drive; and the Nissan Leaf, among others. None
of these vehicles can compete for consumer dollars with standard combustion engine
powertrain vehicles due to at least one of three factors, namely limited vehicle range,
increased cost, or reduced vehicle size. Each of these vehicles uses lithium ion batteries
as its power source.
The United States Advanced Battery Consortium (USABC) was formed by three major
U.S. auto manufacturers (Ford, Chrysler, and GM) along with several of the larger energy
companies (e.g. Conoco-Phillips, Exxon) to provide guidance to the nascent electric
vehicle battery manufacturing market as to the battery performance necessary for
commercialization. The four main targets of the requirements are specific energy, cycle
life, cost, and high rate capability.
Specific energy (γ) is the product of the discharge current (I, amps), the total discharge
time (t, hours), and the average discharge voltage (U, volts), all divided by the weight of
the battery (m, kg), and given by γ = I*t*U/m. It is generally measured in watt hours per
kilogram (Wh/kg). The product, I*t gives the capacity of the battery, and is a way of
measuring how long a battery can be discharged at a given current before it must be

15
recharged. The specific capacity, I*t/m where m is the mass of the limiting active species,
is another common metric used to evaluate battery performance.
Cycle life is defined as the number of cycles of charge and discharge that can be
performed before the capacity of the battery drops below 80 percent of the initial, or
rated, capacity of the battery. A cycle is one full discharge and charge or vice versa. The
rated capacity of a battery is the capacity as defined by the manufacturer; often it is the
capacity at a given cycle number based on when the battery has reached a steady state of
operation.
The rate capability of a battery is its ability to function at high current draws. To measure
rate capability, batteries are often tested with various discharge currents. As the size of a
battery can vary greatly and will determine to a large extent the range of current it can
deliver, it is useful to define a measure of the discharge current relative to the size of the
battery. The “C rate” is just such a measure, and is the discharge (or charge) current,
extracted from (or applied to), the battery relative to the capacity of the battery. The C
rate of a battery is the current required to discharge the battery’s capacity in 1 hour. A
battery with a capacity of 50 milliamp-hours (mAh) would require a 50 milliamp (mA)
current to discharge in 1 hour. A 30 minute discharge, half the time, would require twice
the current, 100 mA or 2C. A rate of C/2 or 0.5C would be half the current, 25 mA and
double the time, a 2 hour discharge. Most battery systems are cycled between C/5 and
C/10 during laboratory testing for cycle life.

16
Table 1 compares the performance of lithium ion batteries (gathered from Saft, a major
manufacturer of lithium ion batteries)1 with USABC
2 targets.
Table 1. Comparison of lithium battery performance with industry targets.
Battery Performance Metric Li Ion Performance USABC Target
Specific energy at C/3 discharge rate
(Wh/kg) 100 200
Cycle life at 80% DOD
(number of cycles) 1000 1000
Selling price: 25,000 units at 40 kWh
(dollars/kilowatt hour) 400 100
1C-rate discharge, no failure
(percent of rated capacity) 75 75
As Table 1 shows, lithium ion batteries meet or exceed the high rate discharge and cycle
life specifications set out by USABC. However, the cost is about four times the USABC
target at half of the required specific energy. In order to increase vehicle size, reduce cost,
and increase vehicle range, battery systems with higher energy densities and lower cost
must be developed.
Lithium-sulfur batteries provide a viable alternative to lithium ion batteries for electric
vehicle applications. Lithium-sulfur batteries have demonstrated higher specific energy
and sufficient high discharge rate performance, and are projected to have lower cost
compared to lithium ion batteries. However, the main drawback to lithium-sulfur
batteries is their short cycle life. Batteries that meet the specific energy requirements of
the USABC have demonstrated cycle lives of less than 100 cycles.

17
The energy that can be extracted from a lithium-sulfur cell depends strongly on the
cathode. Due to the insulating nature of sulfur, a lithium-sulfur cathode must contain
electronically conductive additives in order to pass current between the active sulfur
material and the external circuit. The cathode must also provide for ionic transport within
the cathode and between the cathode and the anode. Thus the void volume in the cathode
structure is critical to the performance of lithium-sulfur batteries.
In lithium-sulfur battery chemistry, the anode active material is lithium metal, and the
cathode active material is sulfur. Two failure modes dominate the cycle life of the
lithium-sulfur system. The first is the polysulfide shuttle, which has received the bulk of
the research attention. The polysulfide shuttle leads to depletion of cathode active
material (sulfur) due to deposition of sulfur compounds onto the anode surface.
The second failure mode comprises deleterious side reactions between the lithium metal
anode and the solvent. The polysulfide shuttle has limited the cycle life of lithium-sulfur
batteries to less than 50 cycles at high specific capacity (above 1000 mA*h/g). In lithium-
sulfur batteries where the shuttle mechanism has been mitigated, solvent loss becomes
the dominant failure mode and limits cycle life to roughly 100 cycles.
18
II. BACKGROUND AND LITERATURE REVIEW
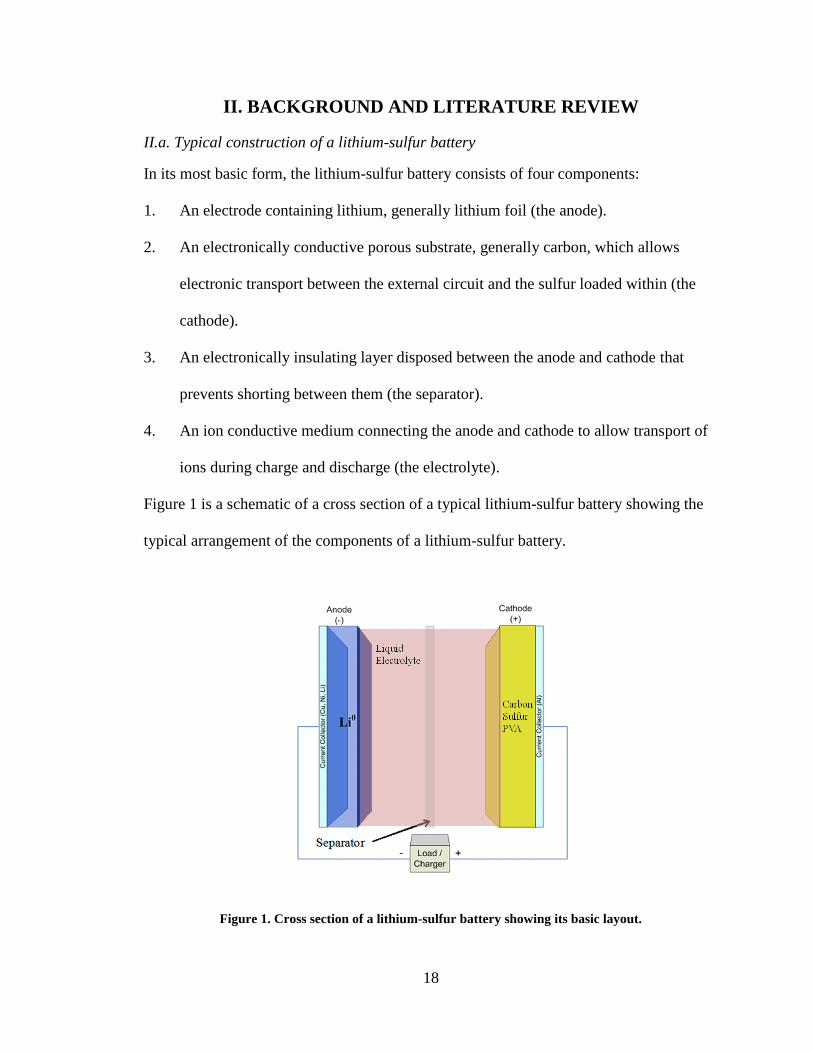
II.a. Typical construction of a lithium-sulfur battery
In its most basic form, the lithium-sulfur battery consists of four components:
1. An electrode containing lithium, generally lithium foil (the anode).
2. An electronically conductive porous substrate, generally carbon, which allows
electronic transport between the external circuit and the sulfur loaded within (the
cathode).
3. An electronically insulating layer disposed between the anode and cathode that
prevents shorting between them (the separator).
4. An ion conductive medium connecting the anode and cathode to allow transport of
ions during charge and discharge (the electrolyte).
Figure 1 is a schematic of a cross section of a typical lithium-sulfur battery showing the
typical arrangement of the components of a lithium-sulfur battery.
Figure 1. Cross section of a lithium-sulfur battery showing its basic layout.

19
The lithium metal anode is the source of lithium ions and it supplies electrons to the
external circuit during discharge. On charge, lithium ions are plated back to the anode. In
typical lithium-sulfur batteries the anode consists of a metallic lithium foil, as in the
example from Rauh.3 The lithium metal can also be sputtered or evaporated onto a metal
current collector, typically copper or nickel foil. Although lithium intercalation materials
such as lithiated graphite can be used as anodes in the lithium-sulfur system, lithium foil
is not only more convenient and less expensive, but also more energy dense, as the
graphite normally used in lithium ion applications costs weight, and it is not active
material.
Problems typically arise from the use of lithium metal electrodes due to the growth of
lithium dendrites on the plating of lithium to the anode during the charging process.4–6
As
the lithium metal is plated out of the electrolyte solution, the areas of initial deposit
become both lower energy sites and physically closer to the bulk of lithium ions in
solution. As a result, the initial plating sites are favored for further plating and dendrites
can form rapidly. If the battery undergoes less than complete charge and discharge
cycles, the dendrite problem will be exacerbated.7 These dendrites can pierce the
separator and cause rapid self-discharge of the system.5,8
Typical lithium-sulfur batteries are a “dissolved cathode” or “catholyte” system; the
active cathode material, sulfur, is at least partially soluble in the chosen solvent. The
cathode is formed by mixing the active material with a supporting scaffold material. The
scaffold must contain an adequate pore volume to host solvent, electrolyte, and reaction

20
products. The scaffold must also support the electronic charge transfer to and from the
external circuit to the solid sulfur species in the cathode. Each of these requirements is
typically met by mixing the solid sulfur with an electronically conductive carbon powder.
The carbon provides surface area for the electrochemical reaction between sulfur species
and the lithium ions. In addition, the carbon black provides an electrically conductive
bridge to the current collector and in turn the external circuit. Some examples of carbon
additives are carbon nanotubes,9–13
carbon black derived from natural products,14,15
or
petroleum sources.16–19
The sulfur and carbon powders are usually combined with a
polymer binder such as PVDF,20–25
PVOH,7,26–29
EAA, or gelatin,18,19,30
and the resulting
slurry or paste is coated onto aluminum or nickel foil.
The separators commonly used in lithium ion batteries are also used in lithium-sulfur
batteries. These separators are polypropylene or polyethylene films between 10 and 25
microns thick that have a porosity between 10 and 40 percent, usually composed of
mesopores and nanopores. The films can be single or multilayer and some incorporate
ceramic layers or additives. The pore size distribution and orientation of the films are
closely controlled to allow rapid lithium ion transport while ensuring that there is no
direct “line of sight” through the separator that could allow dendrites to grow through and
short the two electrodes.
There is a wide array of non-aqueous solvents to choose from in the class of aprotic
molecules, such as ethers (poly, acyclic or cyclic,31
glymes,32
acetals,33
ketals, and
sulfones).34
Soluble lithium salts are added to the solvent to form a solution. The first

21
function of the added salts is to provide ionic conductivity between the anode and the
porous cathode material. Lithium bis(trifluoromethanesulfonyl)imide (LiTFSI),
LiN(SO2CF3)2 is the most commonly used salt.26,35–38
Other lithium salts have been tried,
including lithium bis(oxalato)borate LiB(C2O4)239
and lithium hexafluorophosphate
(LiPF6),11,25,33
but most are reactive with the polysulfide species, rendering them useless
for lithium-sulfur applications. Lithium salts are also known to form a surface electrolyte
interface (SEI)40,41
and improve lithium morphology on charging.
II.b. Operation of an ideal lithium-sulfur cell
During the discharge process, lithium is oxidized at the anode while sulfur is reduced in
the cathode. The exact nature of the sulfur reduction process greatly depends on the
characteristics of the battery in question, specifically on the type and amount of solvent in
the electrolyte, the presence of solid sulfur in the cathode, temperature, and the
extracted/applied current. The discussion below is germane to a lithium-sulfur cell
assembled with a cathode containing solid sulfur, and an electrolyte solvent composed of
dioxolane (DOL), dimethoxyethane (DME), or a mixture of the two, cycled near room
temperature, at C/5 current (typical for Li-S cells).
22
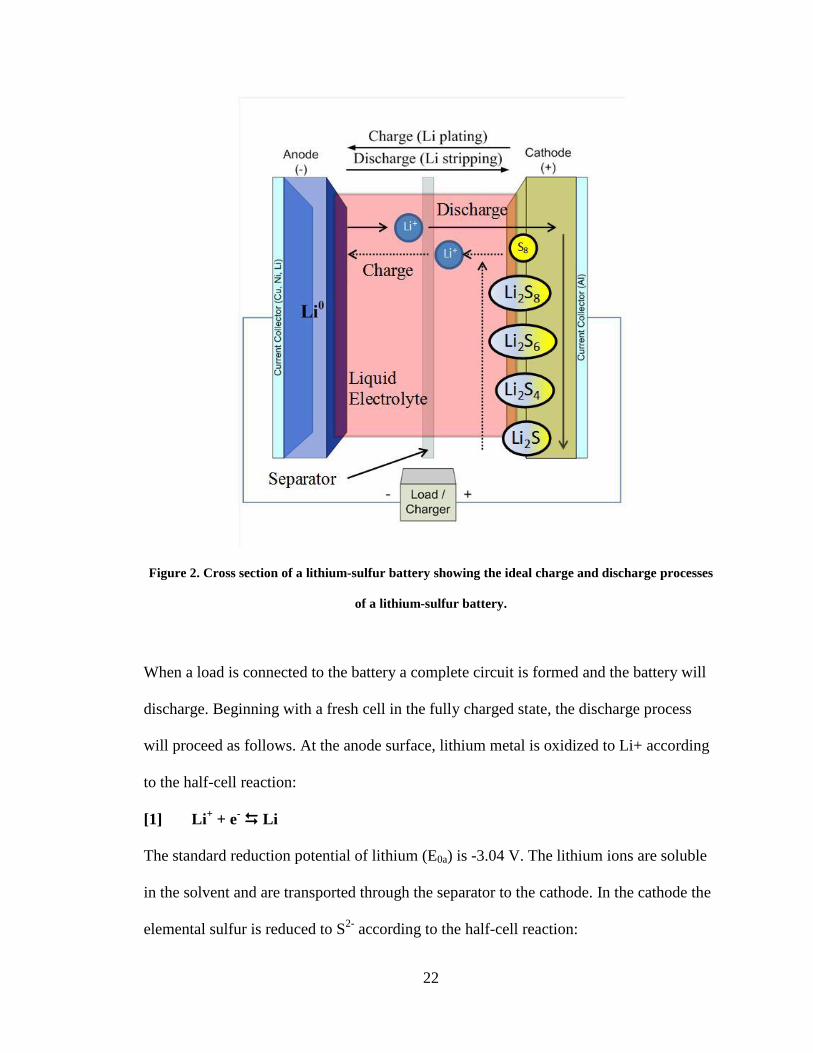
Figure 2. Cross section of a lithium-sulfur battery showing the ideal charge and discharge processes
of a lithium-sulfur battery.
When a load is connected to the battery a complete circuit is formed and the battery will
discharge. Beginning with a fresh cell in the fully charged state, the discharge process
will proceed as follows. At the anode surface, lithium metal is oxidized to Li+ according
to the half-cell reaction:
[1] Li+ + e
- Li
The standard reduction potential of lithium (E0a) is -3.04 V. The lithium ions are soluble
in the solvent and are transported through the separator to the cathode. In the cathode the
elemental sulfur is reduced to S2-
according to the half-cell reaction:

23
[2] S8 + 16e- 8S
2-
The standard reduction potential of the sulfur reduction (E0c) is -0.48 V. Brummer et al.42
were the first to report on the multi-step nature of the sulfur reduction reactions in the
lithium-sulfur cathode. The solid phase S80 is first dissolved into the electrolyte as S8
2-.
The sulfide species are then reduced according to the following electrochemical
reactions.43
[3] S80 + 2e
- S8
2-
[4] S82-
+ 2e- 2S4
2-
[5] S42-
+ 2e- 2S2
2-
[6] S22-
+ 2e- 2S
2-
Depending on the solubility of sulfide and lithium ions in the solvent, any of the
following precipitation/dissolution reactions may take place during the discharge and
form lithium polysulfides:
[7] S82-
+ 2 Li+ Li2S8
[8] S42-
+ 2 Li+ Li2S4
[9] S22-
+ 2 Li+ Li2S2 (s)
[10] S2-
+ 2 Li+ Li2S (s)
However, it has been demonstrated that lithium polysulfides of the formula Li2Sx where x
is greater than 2 are substantially soluble in common lithium-sulfur battery solvents.44–47
The practical result is that all polysulfide species are dissolved in the electrolyte
throughout the discharge process until S22-
and S2-
are formed, which can precipitate as
Li2S2 and Li2S in the cathode as the final discharge product(s).40
The overall reaction can
be summarized by summing the two half-cell standard potentials as:

24
[11] S8 + 16 Li 8 Li2S E0 = E
0c – E
0a = 2.56 V
A useful tool in illustrating the electrochemical behavior of a Li-S battery is a plot of cell
voltage versus time (h), capacity (mAh), or specific capacity (mAh/g). As a convention,
the term “specific capacity” in this document refers to the specific capacity with respect
to the mass of the cathode active species (sulfur). Figure 3 below is a plot of the cell
voltage versus specific discharge capacity under galvanostatic condition and terminated
at 1.85V. The discharge process curve illustrates the voltage response for a cell that
follows the sulfur reduction steps outlined above.
Figure 3. Ideal discharge process curve for a fresh Li-S cell.
There are five labeled regions in Figure 3 that correspond to the sequential steps in the
discharge process. The first region (A) begins near the open circuit voltage (OCV),
calculated from the standard electrode potentials, and runs to roughly 2.3V. This region
corresponds to the process described by reaction [3], solvation of solid sulfur and the
1.85
1.95
2.05
2.15
2.25
2.35
2.45
0 200 400 600 800 1000 1200 1400 1600 1800
Cel
l V
olt
age
Specific Discharge Capacity (mAh/gS8)
Ideal Li-S Discharge Process Curve
A EDCB

25
formation of S82-
. Region (B) corresponds to reaction [4], the reduction of S82-
to S42-
, and
runs from 2.3V to 2.1V. Together, regions A and B are referred to throughout the
literature as the upper plateau, although that designation of plateau is dubious as there is a
distinct negative slope throughout the region. Nevertheless that convention will be
followed here.
The portion of the discharge curve labeled (C) is the first point where S42-
begins to be
converted to S22-
according to reaction [5]. Due to the low solubility of Li2S2,
heterogeneous precipitation occurs as described by reaction [9]. The voltage dip and
subsequent rise between (C) and (D) is explained by the energy cost of forming new
surface area, i.e. the energy cost to form Li2S2 nuclei. When the nucleation barrier has
been overcome, the cell voltage recovers slightly. The discharge curve beyond point (C)
is referred to as the lower plateau and is labeled (D). Once the sulfur is reduced to S42-
the
discharge proceeds through reactions [5] and [6] and both S22-
and S2-
are formed. In
addition to precipitation of Li2S2, precipitation of Li2S also occurs on the lower plateau
according to reaction [10]. Finally, in region (E) the remaining sulfur is reduced to Li2S
and there is a sharp drop in the voltage of the cell. The upper plateau accounts for 418
mAh/gS8 and the lower plateau for 1254 mAh/gS8, for a total specific capacity of 1672
mAh/g29
The potential of the Li-S cell when undergoing one of the different cathode reactions can
be calculated based on the Nernst equation. For the reduction reactions in sequence,

26
combined with the oxidation of lithium at the anode reaction [1], beginning with reaction
[3]:
[12]
Then reaction [4]
[13]
For the lower plateau, discharge reactions [5] and [6] are the applicable processes, for the
sake of clarity only reaction [6] is considered:
[14]
The oxidation of sulfur at the cathode during the charging process proceeds in the exact
reverse of the discharge process, starting with the oxidation of Li2S to Li2S2, the reverse
of reaction [6], then the reverse of [5], [4], and finally [3]. Figure 4 shows the charge
curve that corresponds to the discharge shown in Figure 3.

27
Figure 4. Ideal charge process curve for a lithium-sulfur cell.
Region (A) on the plot shows the reverse of reactions [6] and [5] where S42-
is generated.
Region (B) corresponds to the oxidation of S42-
to S82-
and the further oxidation to S80. As
the last of the sulfur precipitates in the cathode as S80, there is a spike (C) in the voltage
to 2.5V, indicating the cell is fully charged.
II.c. The polysulfide shuttle
Unfortunately the actual process of charging a lithium-sulfur cell deviates from the ideal
process. The “shuttle” or “polysulfide shuttle” is the name given to the mechanism that
prevents the lithium-sulfur cell from charging according to the sequential process
outlined above. The shuttle is a parasitic self-discharge current that originates during the
charging process due to the solubility of intermediate charge products in the electrolyte.
Figure 5 illustrates the polysulfide shuttle mechanism.48
A B C

28
Figure 5. Cross section of a lithium-sulfur battery with polysulfide shuttle mechanism.
In the ideal charge process, sulfur and lithium are separated at the cathode and lithium
diffuses to the anode where it plates from solution, leaving solid sulfur in the cathode. In
the shuttle, polysulfides are oxidized at the cathode and reduced at the anode and diffuse
freely back and forth between the two electrodes. Due to their solubility the charge
products of reactions [4] and [3], namely S42-
and S82-
, can diffuse to the anode during the
charging process. Once at the anode the polysulfide species can be reduced to lower-
order polysulfides following the standard discharge process. This gives rise to a parasitic
discharge current observed during the charging process. The same polysulfides can then
diffuse back to the cathode and be re-oxidized [4] → [3] again.
Li+ S8
Li2Sx
Li2Sx
Li2Sx-2Li2S
Li2S4
Li2S6
Li2S8
Li2Sx-2

29
The most important consequence of the polysulfide shuttle is the difficulty in charging
the cell completely. After a complete charge, all utilized lithium would be plated back to
the anode and all the sulfur would be precipitated in the cathode as S80. In the case of a
typical recharge of a lithium-sulfur cell, the shuttle prevents the precipitation of solid
sulfur, as S82-
is constantly being reduced at the anode to S42-
rather than being oxidized
in the cathode to S80. To illustrate this point it is helpful to look at a plot of cell voltage
versus specific capacity for the first charge of a real lithium-sulfur cell. Cell data were
obtained for a galvanostatic discharge at 25 mA (C/8), plotted in red. The voltage for the
ideal process, from Figure 4, has been overlain onto the figure (dashed line).
Figure 6. Comparison of ideal charge process with and without shuttle.

30
The overall charge process voltage is polarized compared to the ideal process; however,
regions (A) and (B) are similar for both charge processes. In region (A) the voltage spikes
initially as the dissolution of S2-
is slow and there is some concentration of soluble
polysulfides in the electrolyte, then dips and slowly rises as higher-order polysulfides are
generated. In region (B) the cell voltage continues to rise due to increased concentration
of S82-
. The effect of the polysulfide shuttle can be seen in the formation of a plateau
above 2.3V, region (C). The galvanostatic charge can be continued indefinitely in the
presence of a strong shuttle, and the voltage will be stable. This contrasts with the ideal
process, where a spike in the charge voltage is observed towards the end of the charge
process, indicating oxidation of S82-
to S80, the reverse of reaction [3]. Here the charge
process was continued beyond the theoretical capacity of the cell, to 1700 mAh/gS8,
before being terminated. The stable cell voltage indicates a balance between the applied
charge current and the shuttle current.
The capacity of the next discharge will be reduced due to the incomplete charging
brought on by the shuttle mechanism. As no solid sulfur was generated during the charge,
the next discharge will begin with the reduction of S82-
to S42-
according to [4], and at a
correspondingly lower voltage than the OCV. A plot of an ideal discharge process from a
cell with an active shuttle mechanism is shown in Figure 7.

31
Figure 7. Ideal discharge curve from cell with active shuttle, showing loss of the upper plateau.
Compared to Figure 3 (see Figure 8), nearly 400 mAh/gS8 is lost from the upper plateau.
All subsequent discharges will look similar to the second unless the shuttle is arrested.
This limits the theoretical specific capacity of the lithium-sulfur cell to approximately
1200 mAh/gS8. As cycle life is defined as the number of cycles until the capacity of the
battery has been reduced by 20% from the initial capacity, the loss of the upper plateau
can account for 50 to 75 percent of total capacity loss.
1.70
1.80
1.90
2.00
2.10
2.20
2.30
2.40
2.50
0 200 400 600 800 1000 1200 1400 1600
Vo
ltag
e
Specific Capacity (mAh/gS8)
Discharge Voltage Curve For Cell With Active Shuttle

32
Figure 8. Comparison of discharge process curves for cells with and without shuttle.
Mikhaylik et al.27,29
studied the polysulfide shuttle in detail by constructing lithium-sulfur
cells with LiTFSI concentrations ranging from 0.5M to 2M and by applying charge and
discharge currents ranging from 20 mA to 800 mA to those cells. The upper plateau
discharge capacity was measured as a function of discharge and charge current as well as
storage time for each of the cells. Upper plateau capacity was taken as a proxy for the
effect of the shuttle, since high plateau capacity drops with increasing shuttle activity as
seen in Figure 7. The authors concluded that the main factors in determining the rate of
the shuttle reaction were reaction rate of the lithium metal with the polysulfide species,
and the rate of transport of the sulfide species to and from the anode.

33
To address the rate of transport of the sulfide species, researchers have attempted to
sequester elemental sulfur in the cathode. Typically this is attempted by inserting sulfur
into an engineered carbon structure.9, 11, 13, 14, 18, 20, 21, 49-66
There are two major outcomes from the totality of these attempts. If the structure in
question does not sequester the polysulfides, the shuttle continues unabated and poor
specific capacity is observed. The highest specific capacity reached was 1000 mAh/gS8,
but at a low discharge rate (C/10 or lower) and/or it was not stable for more than one
initial cycle. This specific capacity is too low to be commercially viable.
Another strategy to limit polysulfide mobility is to employ highly viscous electrolytes.
Both high molecular weight solvents and high salt concentrations have been studied.
Many researchers have also attempted to defeat the shuttle mechanism by changing the
electrolyte solvent to limit polysulfide solubility12, 23, 25, 26, 51, 67-86
or by the addition of
certain additives to modify the solubility of polysulfides. The results of this line of work
are similar to the sulfur encapsulation. When the shuttle current is arrested, low specific
capacity is observed.
Mikhaylik discloses in an issued U.S. patent37
that nitrite and nitrate salts of lithium
decrease the rate of reaction between polysulfides and lithium metal. The author
hypothesizes that the nitrate influences the formation of a surface electrolyte interphase
(SEI), which is a layer formed by reaction of the active anode material and the electrolyte
at the anode surface. Formation of an SEI may modify charge transfer, chemical

34
reactivity, ionic transport, or other properties of the active surface. In lithiated graphite
anodes typical for lithium ion batteries, the SEI also limits further reaction of the lithium
metal with solvent and electrolytes thus improving cycle life. Aurbach41
later confirmed
the presence of an SEI on the anode in cycled lithium-sulfur cells containing nitrate using
electron microscopy and spectroscopic techniques, and proposed a reaction mechanism
for the layer’s formation.
II.d. Lithium-sulfur cell performance
Figure 9 shows typical discharge and charge curves for a lithium-sulfur cell containing
nitrate additives discharged at C/5 (0.47 mA/cm2 and 223 mA/gS8) and charged at C/8
(0.29 mA/cm2
and 139 mA/gS8). Most of the upper plateau capacity is retained, and there
is a sharp spike in the charge voltage at the end of charge, indicating complete charging
of the sulfur to S80. Overall the specific capacity is lower than the ideal; specifically the
lower plateau capacity is reduced. The sulfur reduction reactions corresponding to the
lower plateau are [5] and [6].

35
Figure 9. Typical lithium-sulfur charge and discharge curves for catholyte type cell with nitrate.
Figure 10 shows the effects of increasing discharge current on lower plateau discharge
capacity, originally reported by Mikhaylik.26

36
Figure 10. Rate capability of a typical lithium-sulfur catholyte type cell.
Capacity on the upper plateau is not affected by increasing discharge rate. However, both
lower plateau capacity and the voltage at which the lower plateau occurs are reduced.
Mikhaylik26
also reported the performance of catholyte type lithium-sulfur cells cycled
below room temperature. The resulting data are shown in Figure 11.

37
Figure 11. Low temperature performance of a typical lithium-sulfur catholyte cell.
Similar to increased discharge rates, the upper plateau capacity is affected only slightly.
The lower plateau capacity is decreased dramatically at lower temperatures. The reduced
temperatures are still well above the freezing points of DME and DOL (-58°C and -92°C
respectively). Further plateaus appear in the discharge as lower temperatures are
approached. This is due to decreased solubility of the reaction products in the sulfur
reduction chain.
Typical lithium-sulfur battery cycle lives with nitrate additives are less than 100 cycles.
Mikhaylik7 has identified two causes of limited cycle life in cells containing nitrate
compounds. The first was the loss of nitrate compounds due to reaction with lithium
metal, forming the SEI as observed by Aurbach.41
The second was reaction of lithium
metal with solvent and subsequent depletion of solvent due to undesirable side reactions.
Each of these issues was exacerbated by the development of dendrites during the charge

38
process. The dendrites increased the surface area of lithium metal available for reaction
with solvent and nitrate, increasing the reaction rate between them.
To eliminate dendrite growth on the lithium anode, the authors propose that 1 MPa
anisotropic pressure, just higher than the yield strength of lithium metal, be applied
normal to the active faces of the electrode stack while cycling the battery. The application
of pressure mechanically deforms the lithium and minimizes the surface area of the
anode. The application of pressure mechanically deforms the plated lithium, and the
anode surface area is nearly constant throughout the cycle life of the battery.
Affinito7,49
proposed creating a polymer ceramic composite layer to act as a barrier to
solvent interaction with the lithium anode. Implementation of this barrier layer depends
on elimination of lithium dendrites, as they would likely fracture the barrier, rendering it
useless. The application of 1 MPa anisotropic pressure normal to the active faces of the
electrode stack could prevent the formation of lithium dendrites, keeping any barrier
layers intact.

39
III. CURRENT STUDY
The causes of capacity fade in lithium-sulfur cells have been identified as solvent
depletion and loss of nitrate due to reaction with lithium metal. Proposed solutions to
both require that the electrode stack be placed under 1 MPa during cycling. To date no
studies have been performed on lithium-sulfur batteries related to the cathode
performance under an applied isotropic pressure. This work investigates the performance
of state-of-the-art lithium-sulfur cathodes cycled under pressure applied normal to the
active faces of the electrode stack. This work also introduces a new approach to
fabricating a lithium-sulfur cathode, where the pore structure can be controlled
independently of the active material loading.
Seven types of cathode were fabricated for testing in lithium-sulfur cathodes. Five of the
cathodes were fabricated with carbon as the scaffold material; the other two used nickel.
Of the five carbon-based cathodes, four contained a low surface area carbon and the fifth
a high surface area carbon. Two different nickel powders were used to fabricate the
nickel cathodes; the powders were two different sizes. Sulfur per planar area of the
electrode was held constant across all types of cathode. Cathode variables studied were
thickness, void volume, void size distribution, and compressibility.
Several analytical techniques were used to understand the geometry and morphology of
the cathodes that were fabricated. Nitrogen adsorption/desorption experiments were
performed on the carbon and nickel powders to measure pore volume, pore size
distribution, and surface area. Mercury intrusion was performed on the fabricated

40
cathodes to measure void volume, void size distribution, and surface area. Oil absorption
was used to model the electrolyte uptake characteristics of the cathodes. Both optical
microscopy and SEM were used to image the cathodes after fabrication. Further SEM
micrographs were obtained of the cathodes after galvanostatic cycling. An Instron
mechanical properties tester was used to measure the compression behavior of the
cathode films.
Each type of cathode was assembled into several lithium-sulfur cells. The lithium-sulfur
cells were cycled and voltage and current measurements were taken. From this data, the
specific capacity of the cells was determined and discharge and charge voltage curves
were prepared.

41
IV. MATERIALS AND METHODS
IV.a. Carbon particulate cathodes
Carbon particulate cathodes were fabricated to study the effects of cathode surface area
and pore volume on the performance of lithium-sulfur cells under applied pressure. Each
carbon particulate cathode formulation consisted of a carbon black powder, elemental
sulfur powder, and a polyvinyl alcohol (PVA) binder. The carbon powders used in this
work were Printex carbon black Xe2 obtained from the Evonik Degussa Corporation,
Parsippany NJ, USA; Vulcan XC72 carbon black obtained from the Cabot Corporation,
Boston MA, USA; and Timrex Ks6 graphite obtained from Timcal America, Westlake
OH, USA. The sulfur used was purchased as sublimed 100 mesh sulfur powder from Alfa
Aesar. The polyvinyl alcohol used was Celvol brand type 325, 98.4% hydrolyzed,
purchased from Celanese Chemicals, Dallas TX, USA. All of the powders were used as
supplied. The table below gives the sulfur to carbon ratio, by weight, of all five types of
the coated carbon cathodes. Type I cathode contained the Evonik carbon black, and all
other types contained the Vulcan carbon black.
Table 2. Sulfur to carbon ratio of carbon-based cathodes.
Cathode Type S:C
I 3.0
II 3.0
A 2.5
B 2.0
C 1.5
The particulate carbon cathodes fabricated for this work were produced in a manner
consistent with techniques accepted in both the literature and commercial practice. A

42
slurry was formed from the particulate components in a mixture of de-ionized water and
isopropanol (IPA) (Sigma Aldrich, used as supplied), the PVA binder was dissolved in
the water/IPA mixture prior to addition of the particulates. The slurries were processed
using an attrition mill equipped with 6.5 mm yttria doped zirconia milling media. The
milling time and speed for each cathode slurry formulation were optimized to maximize
specific capacity. Details of the optimization process are not reported here, and only the
data from cathodes made using the best optimized milling procedure for each cathode
formulation are reported. The general details of the milling process are outlined in the
flowchart.
Figure 12. Carbon-based cathode slurry production flowchart.
After the slurry was prepared, it was slot-die coated onto a primed aluminum foil. The
primer provided adhesion and electrical conduction between the current collector and the
cathode. The primer consisted of a 2-micron-thick, dense layer of PVA and carbon. Each
PVA dissolved in an 80/20 wt% water/IPA solution
PVA solution, remaining solvent, and sulfur added to attrition mill
High RPM milling
Carbon particulate added to attrition mill
High RPM milling
Slurry discharged from mill
Viscosity 100 - 300 cP, Total solids 9 - 12%

43
cathode was coated so as to keep the sulfur weight per area constant across all of the
cathode films. The target sulfur loading was 1.85 ± 0.05 mg/cm2, and it was controlled by
varying the slurry pump speed and the line speed. The slurry was dried using IR ovens;
drying temperatures were kept between 100°C and 105°C to remove the solvent and
minimize loss of sulfur due to sublimation. The thickness of the cathode films varied
between 35 and 115 microns across the different cathode formulations according to the
properties of that particular slurry.
IV.b. Sintered nickel cathodes
Sintered nickel cathodes were produced to study the effect of pore size distribution on the
behavior of lithium-sulfur batteries under pressure. Sintered nickel plaques with a
specific geometry were produced by sintering two different nickel powders into a
continuous film. The two powders were Inco type 255 and Inco type 525, both obtained
from Novamet Specialty Products, Wykoff NJ, USA. Both types of powder are
filamentary nickel powders made up of discrete chain-like particulates. Type 255 nickel
powder filaments were between 2 and 5 microns in diameter and roughly 50 microns
long. Type 525 nickel powder has a similar aspect ratio and is between 1 and 2 microns
in diameter and 10 microns long.

44
Figure 13. SEM micrograph of nickel powder type 255 supplied by the manufacturer.
Figure 14. SEM micrograph of nickel powder type 525 supplied by the manufacturer.
A three-zone clamshell furnace used to sinter the nickel powders was obtained from the
Thermcraft Corporation. The first and third heating zones were each 15" in length and the
center zone was 24" in length for a total of 54" of heating elements. The power to the
heating elements in each zone was independently controlled using Yokogawa model
UP350 program controllers. The clamshell accommodated up to a 5.5" diameter process

45
tube. A fused silica process tube with the dimensions of 130 x 135 x 1829 mm was
obtained from Heraeus Quartz America. Custom end caps were fabricated from
aluminum to allow the process tube to be sealed from the outside atmosphere and to
allow controlled flow from either of two gas lines. Gas flows were monitored using a
bubbler filled with mineral oil and controlled to approximately 120 sccm.
The production process for a given set of sintered nickel plaques consisted of three steps:
powder distribution, drying, and firing. The following procedure was developed to evenly
distribute a thin (less than 350 micron) layer of loose powder (approximately ± 25
microns peak to valley) into the well of the crucibles described above. Each of the six
crucibles was laid out on a flat level surface. A form was placed on top of each crucible
and aligned so that the form did not overlap with the well of the crucible. Then 6.5g of
powder was weighed into a small beaker. A large excess of acetone, roughly 50:1 by
volume with respect to the volume of the powder, was then added to the beaker. The
solvent and powder were then agitated with a metal spatula to form a suspension. While
stirring constantly the suspension was poured rapidly into the crucible/form. This process
was then repeated to fill the five additional crucibles.
After the suspension was added to the crucible/form, the powder rapidly settled out into
the well of the crucible and the acetone began to evaporate. After about 30 minutes most
of the solvent had evaporated and the form was removed from the crucible. The crucibles
were then stacked in groups of three and placed into a vacuum oven. A vacuum was

46
pulled to 30 inches of mercury and held for at least 30 minutes. Once the plates were
removed from the oven the unfired film was ready to be fired.
The six nickel-loaded crucibles were stacked three high in two groups for the firing step.
An alumina spacer, 2 mm thick, was placed between each BN crucible to allow adequate
gas flow across the nickel powder during the firing process. The six crucibles were
placed on a fused silica sled, which served to elevate the crucibles into the center of the
process tube and ease loading and removal of the crucibles. The sled was then loaded into
the center of the process tube, and the tube was sealed to atmosphere. Forming gas (5%
H2, 95% N2) was bled into the tube at approximately 120 sccm to create a reducing
atmosphere.
A two-stage heating process was used to sinter the nickel green into a continuous film.
The first step in the heating process consisted of a ramp to 450°C from room temperature
over 30 minutes and a hold for an additional 30 minutes. This first step of the heating
process was intended to drive off any volatiles left after the drying process as well as
degrade any organic contaminants that may have been present in the green. After the 30
minute dwell, the temperature was ramped to 790°C over 30 minutes and held at 790°C
for 15 minutes. The power to the heaters was then shut off and the furnace allowed to
cool to approximately 650°C over the next 30 minutes. The clamshell was then opened
and the process tube cooled rapidly to below 400°C over the course of the next 5 to 10
minutes. The cooling proceeded slowly to below 250°C, when the tube was opened and
the crucibles removed.

47
When the sintering process was allowed to continue beyond 15 minutes at temperatures
of 790°C or higher, significant lateral shrinkage of the nickel plates was observed. In
these cases, wrinkling of the nickel plates was also often observed. The shrinkage was
confined to the lateral dimensions of the plates; the thickness was unaffected. The picture
below shows a comparison of a plate that was held at 790°C for 15 minutes (left) and a
plate that was held at 790°C for 30 minutes (right).
Figure 15. Sintered nickel plaques.
The plate held for 30 minutes (right side of Figure 15) is typical of samples that were
produced at higher temperatures and longer times. The color variation between the two is
indicative of the degree of sintering. As the sintering process proceeded, the color of the
nickel films would gradually lighten, with bright grey plates indicating a large degree of
densification.

48
At the end of the above process six sintered nickel plaques roughly 4.5" x 8" x 250
microns were produced. The plaques were then cut into 4.5 x 4.3 cm pieces. The
thickness of each piece was measured at its corners and in its center and the weight of the
piece was recorded. The fractional porosity of the sintered nickel piece was determined
by the following formula:
1-((A*T/W)/ρ)
where A is the sample area in cm2, T is the sample thickness in cm, W is the sample
weight in g, and ρ is the specific gravity of nickel, 8.908 g/cm3.
Once the nickel pieces were produced, they were filled with the active material, sulfur.
An oil bath was prepared in a large crystallization dish and placed on top of a hot plate
equipped with a k-type thermocouple probe for heating control. The probe was clamped
in place, submerged in the oil bath, and the hot plate was set to 70°C. A 500 mL beaker
was filled to the level of the oil in the bath with HPLC grade toluene (obtained from
Sigma Aldrich, used as received). The beaker was set into the oil bath with an appropriate
magnetic stir bar in place. Sulfur was metered into the toluene-filled beaker under slow
stirring. Enough sulfur was added to the toluene to maintain an excess of sulfur at 70°C,
as evidenced by the presence of undissolved sulfur.
Each sintered nickel electrode, having been weighed, was dipped individually into the
sulfur-saturated toluene solution. The dip was held for 7 seconds. Upon removal each
electrode was exposed to a cold argon stream to remove any remaining toluene. The
electrodes were then dried for 2 hours at 80°C under vacuum. Once each electrode was

49
filled with sulfur to the correct loading, a nickel tab was attached to both sides of the
electrode along one edge using a resistance welder. At this point the electrodes were
ready to be assembled into Li-S cells.
IV.c. Optical microscopy
Optical microscopy was performed to obtain magnified images of the carbon cathodes
prior to their assembly into lithium-sulfur batteries. Optical microscopy was performed
using a Nikon Optiphot microscope with 5x and 10x Zeiss objectives. Digital image
capture was performed using a Micrometrics 318CU camera system and corresponding
software.
IV.d. Scanning electron microscopy
Scanning electron microscopy was performed using an AMRAY 1830 scanning electron
microscope equipped with a backscattered electron detector and an energy-dispersive
X-ray spectroscopy system. The SEM micrographs yielded images of the detailed
morphology of cycled carbon particulate cathodes as well as the structure of sintered
nickel cathodes prior to their assembly into lithium-sulfur batteries.
IV.e. Dibutyl phthalate (DBP) uptake
The uptake of dibutyl phthalate (DBP) was studied to determine the available pore
volume of electrode samples. DBP has been shown50
to be a good proxy for electrolyte
solutions commonly used for Li-S batteries owing to similar wetting properties, viscosity,
and low vapor pressure at standard temperature and pressure (easing evaporation
concerns).
50
The uptake measurement was performed by weighing a piece of cathode material with a
known area, then exposing that piece of cathode to an excess of DBP. After soaking in
DBP for 30 minutes the excess was drained and the cathode sample was blotted with an
absorbent napkin. The cathode piece was then weighed to determine the weight of DBP
absorbed. The void volume of the test piece was calculated using the specific gravity of
DBP, 1.05 g/mL. The void volume per unit area for each sample was then calculated by
dividing the uptake volume by the sample area. To obtain the total volume of a given
cathode the uptake per area was multiplied by the total area of the cathode in the cell.
IV.f. Nitrogen adsorption/desorption studies
To measure the pore volume, pore size distribution, and surface area due to pores of size
1 nanometer up to 160 nm, nitrogen gas ads/desorption measurements were performed
using a Beckman Coulter SA3100 analyzer. The samples were outgassed at 300°C for 60
minutes prior to measurement. The saturation tube containing the sample was weighed
once it came to room temperature to determine the amount of sample as accurately as
possible. The samples were then evacuated and brought to liquid nitrogen temperature. A
multi-point isotherm was obtained using the static equilibrated method, where a known
volume of gas is injected into the sample chamber and a measurement of the sample
pressure relative to the saturation pressure is made once equilibrium is reached. The
surface area of the sample was calculated from the isotherm data using the Brunauer-
Emmett-Teller (BET) model of multi-layer non-interacting adsorbate layers. The pore
size distribution of the sample was calculated from the isotherm data using the Barret-
Joyner-Halenda (BJH) equation.
51
IV.g. Mercury intrusion porosimetry
To measure the pore volume, pore size distribution, and surface area of pores between
160 nm and hundreds of microns, mercury intrusion measurements were performed using
a Micromeritics Autopore A instrument. The pressure range of the measurement was 1 to
33,000 psi. The contact angle between mercury and the test samples was assumed to be
130° according to the manufacturer’s specification regarding the measurement of highly
porous materials.
IV.h. Compression testing
To determine the mechanical effects of placing the various cathode types under
compression, the relationship between compressive stress and strain was determined
using an Instron 1122 testing frame equipped with Instron 5500R control electronics, a
5kN load cell, and highly polished self-seating orbital compression platens. Deflection of
the sample was measured using a dual LVDT setup to minimize Abbe error. The
compression was measured from 0 to 20N with a crosshead speed of 0.3 mm/s.
IV.i. Li-S cell assembly
Lithium-sulfur cells were assembled with each of the various types of cathode to test their
performance. Lithium foil purchased from Chemetall-Foote was used as the anode.
Polyethylene separator film purchased from Tonen General was used as the separator.
The cathode, anode, and separator were stacked in configurations with 105 mAh
theoretical capacity (cathode types I and II) or 300 mAh theoretical capacity (cathode
types A, B, C, 255, and 525), assuming a sulfur-specific discharge capacity of 1672
mAh/g.

52
The 105 mAh cells were assembled according to the schematic in Figure 16.
Figure 16. Schematic of electrode stack for 105 mAh cells.
The 300 mAh cells were assembled according to the schematic in Figure 17.
Figure 17. Schematic of electrode stack for 300 mAh cells.
After assemby, each electrode stack was placed into a pouch constructed from heat-
sealable, aluminum-laminated film, obtained from Showa Denko America. A 50/50
mixture by weight of 1,3, dioxolane and dimethoxyethane as solvents, with lithium

53
bis(trifluoromethanesulfonyl)imide (LiTFSI) added for conductivity, and lithium nitrate
to provide shuttle inhibition, was used as the electrolyte solution for these cells. The cells
were filled with the electrolyte solution by syringe injection into the pouch which was
then sealed while under vacuum.
The ratio of electrolyte solution weight to sulfur weight (E:S) is an important design
consideration as the solvents are consumed by deleterious reactions with the lithium
anode throughout the life of the cell. Higher E:S ratios promote longer cycle lives and
higher specific capacity. The E:S for cells with 105 mAh theoretical capacity was 7:1.
The E:S ratio of cells with 300 mAh theoretical capacity was 3:1. The E:S ratio of cells
with 300 mAh theoretical capacity and sintered nickel cathode was 3.5:1.
IV.j. Cell performance testing
Galvanostatic cycling was used to determine the effects of the various cathode geometries
on the performance of the lithium-sulfur batteries. Once assembled the cells were left to
rest for 24 hours to allow complete infiltration/distribution of the electrolyte within the
cathode. After the 24 hour rest some of the cells were placed in a fixture which applied
up to 1 MPa pressure normal to the active face of the electrodes. Most cells were cycled
without applied pressure or at 1 MPa. All cells were then connected to a Maccor
Corporation series 4000 electrochemical tester.
Cycle life testing was performed according to the following protocol:
Two minute rest at OCV
Discharge at C/5 (223 mA/gS8, 0.47 mA/cm2) to 1.7V
Two minute rest
Charge at C/8 (126 mA/gS8, 0.27 mA/cm2) to 2.5V

54
Hold at 2.5V until charge current tapers to 0.5 mA
Repeat steps 1–5
The cell voltage, time on test, and current were recorded at 5 minute intervals during each
phase of testing.
IV.k. Cell disassembly and analysis
After cycling, cells were opened under argon atmosphere in a glovebox. Relevant
electrodes were rinsed in either DOL or DME to remove soluble sulfur species that might
interfere with measurements. The samples were held under rough vacuum during
transport between the glovebox and the SEM. Cathode sectioning was performed either
by cryo-microtome or by tearing samples in the cross-web direction.
55
V. RESULTS
V.a. Optical microscopy of type I and II cathodes
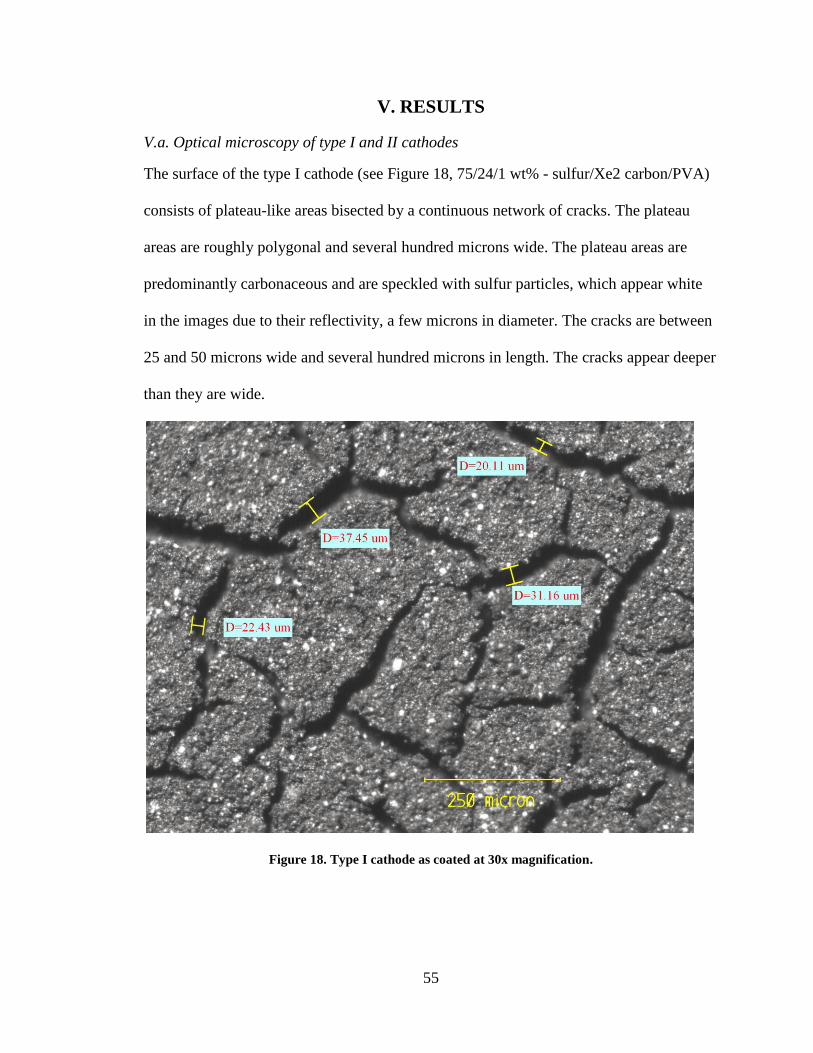
The surface of the type I cathode (see Figure 18, 75/24/1 wt% - sulfur/Xe2 carbon/PVA)
consists of plateau-like areas bisected by a continuous network of cracks. The plateau
areas are roughly polygonal and several hundred microns wide. The plateau areas are
predominantly carbonaceous and are speckled with sulfur particles, which appear white
in the images due to their reflectivity, a few microns in diameter. The cracks are between
25 and 50 microns wide and several hundred microns in length. The cracks appear deeper
than they are wide.
Figure 18. Type I cathode as coated at 30x magnification.

56
Similar to the type I cathode, the surface of the type II cathode (see Figure 19, 75/24/1
wt% - sulfur/Vucan carbon/PVA) consists of plateau-like areas bisected by a network of
cracks. However the cracks are smaller, between 5 and 20 microns wide. The crack
network is not continuous across the sample. It is unclear how deep the cracks are. The
surface appears more homogeneous in composition, with no clear separation of sulfur and
carbon.
Figure 19. Type II cathode as coated at 30x magnification.
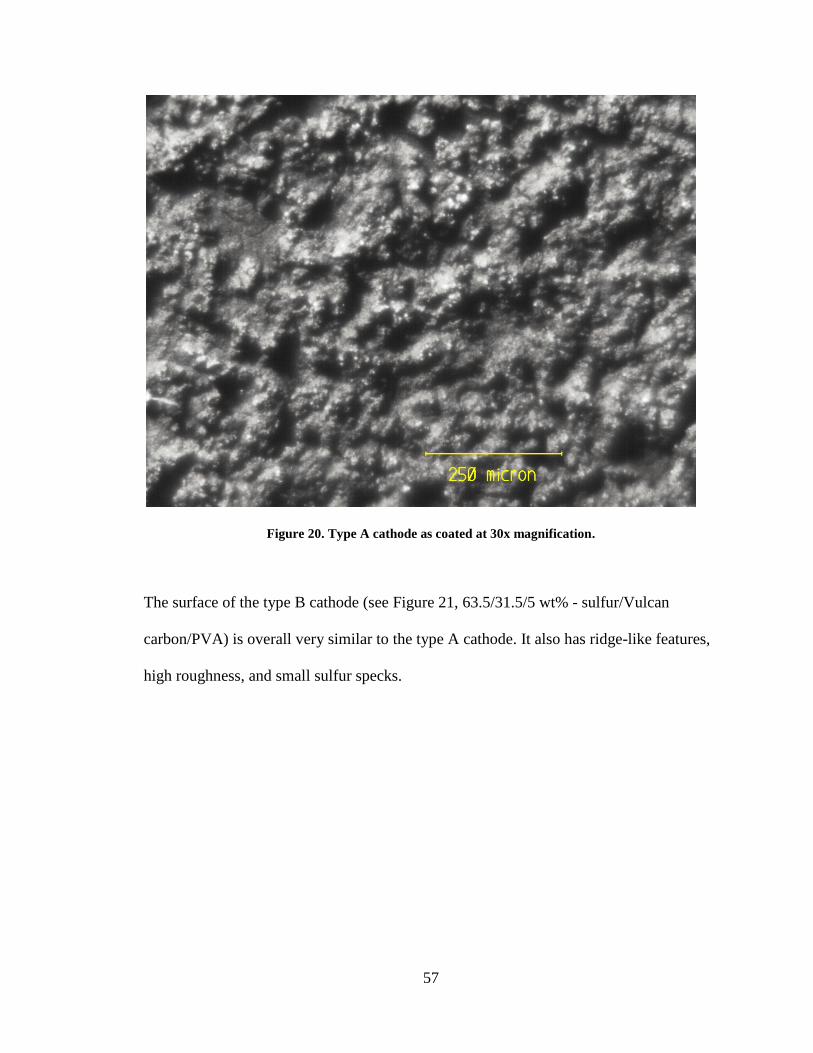
The type A cathode (see Figure 20, 68/27/5 wt% - sulfur/Vulcan carbon/PVA) does not
exhibit the plateau and crack morphology of type I and II cathodes. Instead the surface is
characterized by rough ridges. There are small white specks, assumed to be sulfur,
dotting the surface.
57
Figure 20. Type A cathode as coated at 30x magnification.
The surface of the type B cathode (see Figure 21, 63.5/31.5/5 wt% - sulfur/Vulcan
carbon/PVA) is overall very similar to the type A cathode. It also has ridge-like features,
high roughness, and small sulfur specks.

58
Figure 21. Type B cathode as coated at 30x magnification.
The surface of cathode type C (see Figure 22, 57/38/5 wt% - sulfur/Vulcan carbon/PVA)
exhibits both ridges and cracks. The overall roughness of the surface is lower than
cathodes of type A and B, and the cracks are smaller and less extensive than cathode
types I and II.

59
Figure 22. Type C cathode as coated at 30x magnification.
Type I and II surfaces show a network of cracks covering the surface caused by stresses
created when the solvent evaporates during the coating process. Due to the similarity in
structure as their natural counterparts, these surfaces are sometimes referred to as “mud
flats” or “mud-cracked.” The cathodes with lower surface area carbon exhibit smaller
cracks or a rough surface compared to the type I cathode with high surface area carbon.
In addition to lower surface area, an increased binder to carbon ratio appears to reduce
the number of cracks and their size.
V.b. Electron microscopy
Scanning electron micrographs taken of cells with the type I cathode (75/24/1 wt% -
sulfur/Xe2 carbon/PVA) are shown in Figure 23. The cells were discharged without

60
applied pressure at C/5 to 1.7 V, reaching a capacity of approximately 1100 mAh/g. The
cells were then disassembled and the electrodes were washed with an excess of DOL to
remove any residual lithium polysulfides. They were rinsed in an excess of toluene to
remove any solid sulfur.
Figure 23(A) is a backscattered electron image of the type I cathode surface. The surface
presents the mud-crack morphology observed in the fully charged state under optical
magnification (Figure 18). The uniform brightness of the image indicates uniform
composition of the surface. Figure 23(C) shows the EDS spectrum taken over the
displayed area of Figure 23(A). The EDS peaks are assigned to sulfur, carbon, and
oxygen, with sulfur having the highest intensity. The very smooth sulfur-rich surface
contrasts with the carbon-rich surface observed for the same cathode at 100% state of
charge (Figure 18). Figure 23(B) shows the cathode in cross section. The interior void
volume of the cathode is covered in small nodular growths which form a layer that
completely coats the pore walls.

61
Figure 23. SEM micrographs of type I cathode after full discharge without applied pressure. (A)
Backscattered electron image of cathode surface in plane view, (B) cross section showing interior of
cathode void volume, (C) EDS spectrum collected from area of 19a.
Due to the washing procedure performed on these electrodes after disassembly, the only
sulfur species present should be the discharge products Li2S2 and Li2S. These insoluble
sulfides coat the surface of the electrode uniformly. The cross section of the cathode also
indicates that a uniform film of insoluble discharge products is deposited on interior pore
walls during the discharge process. The high sulfur utilization correlates well with the
large amount of sulfide deposit observed relative to carbon observed.
A B
C

62
Type I cathodes were cycled under 1 MPa for comparison, with results obtained from
cells cycled without pressure. The cells were discharged once, then charged once,
according to the procedure described in Section IV.j (Cell performance testing). The cells
were then disassembled and the electrodes were washed with an excess of DOL to
remove any residual lithium polysulfides. Scanning electron micrographs taken of
cathodes from these cells are shown in Figure 24.
Figure 24(A) shows the backscattered electron image of the surface of the cathode. There
are clearly observed areas of low and high intensity, indicating a separation of phases
with different atomic numbers. The bright areas are likely sulfur rich while the darker
areas are likely carbon rich. The separation of phases on the electrode surface appears to
follow the mud-crack pattern previously observed, with the sulfur filling in the cracks
around the plateaus composed mainly of carbon. Figure 24(B) shows the backscattered
electron image of the same cathode in cross section. In the cross-section image, there are
three clear phases: a bright white (sulfur), a dark grey (carbon), and a light grey
(aluminum current collector). In both the surface and cross-section images the sulfur is
clearly constrained, almost exclusively, to the mud-cracks.

63
Figure 24. SEM micrographs of type I cathodes cycled under 1 MPa applied pressure. (A) Surface of
type I cathode and (B) cross section of type I cathode.
Comparing the images from Figure 23 with Figure 24 shows the effect of pressure on the
distribution of active material in the cathode. The applied pressure reduces the total
amount of sulfur observed; in addition, the sulfur deposits appear confined to the large
mud-cracks in the surface of the electrode.
2008-10-24 Groupe de caractérisation
B5-4301, 100%SOC, Pressure
This cells shows non
homogeneous composition
distribution. Regions with very
high S concentration can be
seen filling out the porosity.
This cells shows non
homogeneous composition
distribution. Regions with very
high S concentration can be
seen filling out the porosity.
A
B
Carbon
Carbon
Sulfur
Sulfur
Aluminum

64
Figure 25 shows electron micrographs obtained from cells with a type II cathode (75/24/1
wt% - sulfur/Vucan carbon/PVA) that were discharged without applied pressure. The
type II cathode samples were prepared exactly as discussed for the samples of type I
cathode. Figure 25(A) shows a smooth, dense, uniform deposit on the surface of the
cathode. The deposit displays a network of fractures within the plateau areas. The mud-
cracks are also partially filled with the deposit. The EDS spectra shown in Figure 25(C),
obtained for the area shown in Figure 25(A), indicates that the surface is composed
mainly of sulfur. The electrode utilization is fairly uniform across the entire electrode, as
indicated by the uniform brightness throughout the image. The cathode cross section,
Figure 25(B), shows uniform composition throughout the thickness of the cathode. The
aluminum current collector is visible running across the top of the image.
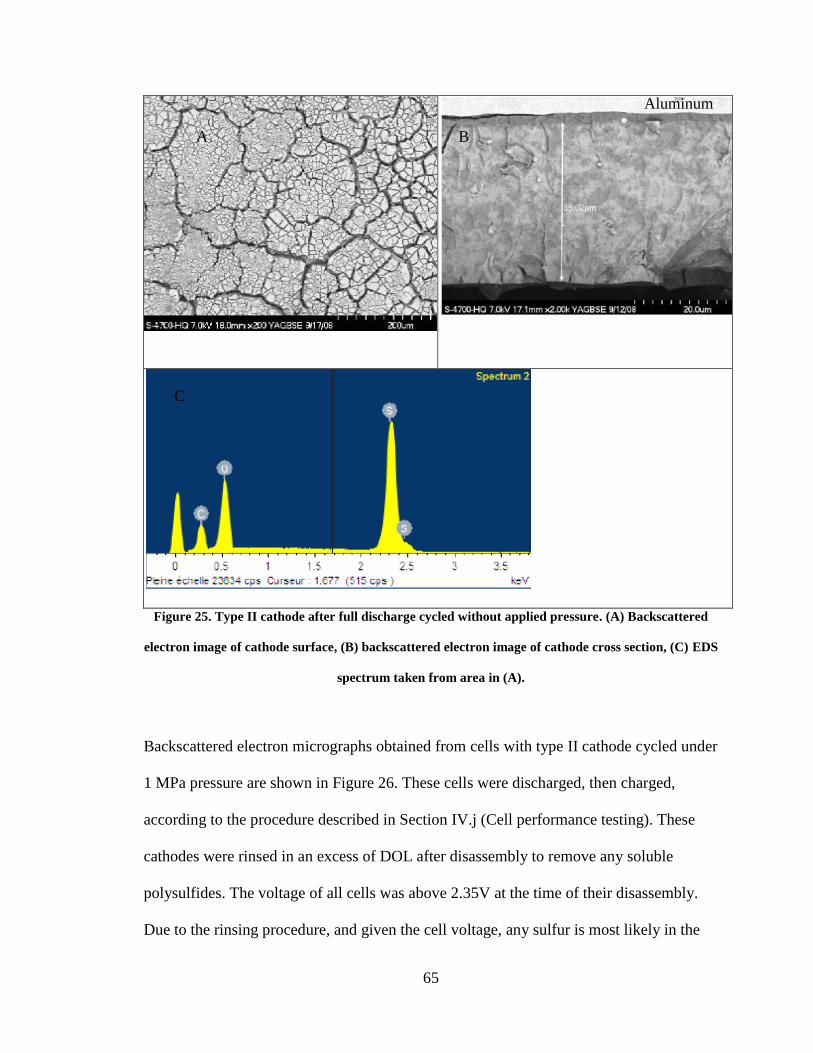
65
Figure 25. Type II cathode after full discharge cycled without applied pressure. (A) Backscattered
electron image of cathode surface, (B) backscattered electron image of cathode cross section, (C) EDS
spectrum taken from area in (A).
Backscattered electron micrographs obtained from cells with type II cathode cycled under
1 MPa pressure are shown in Figure 26. These cells were discharged, then charged,
according to the procedure described in Section IV.j (Cell performance testing). These
cathodes were rinsed in an excess of DOL after disassembly to remove any soluble
polysulfides. The voltage of all cells was above 2.35V at the time of their disassembly.
Due to the rinsing procedure, and given the cell voltage, any sulfur is most likely in the
A
C
B
Aluminum

66
form of elemental sulfur. Figure 26(A) shows two obvious phases, indicated by the high
contrast between a bright phase (sulfur), distributed in islands tens of microns in
diameter, distributed across a darker phase (carbon). The sulfur deposits show a loose
spatial association with cracking in the surface of the cathode.
A cross-section view of the type II cathode is shown in Figure 26. In this view the
aluminum substrate bisects the image (mid grey). The cathode is visible on either side of
the current collector. Again, two phases are clearly visible with the sulfur deposited
throughout the thickness of the cathode. The carbon-rich regions show voids throughout
the thickness of the cathode. The cathode containing high surface area carbon black (type
I cathode, Figure 24) shows sulfur confined only to the mud-cracks in the surface, with
no active material deposited in the plateau areas during cycling; whereas active material
is deposited throughout cathodes that contain low surface area carbon black (type II).

67
Figure 26. SEM micrographs of type II cathode cycled under pressure. (A) Backscattered electron
image of cathode surface, (B) backscattered electron image of cathode cross section.
EDS was performed on areas assumed to be carbon or sulfur rich in the type II cathode to
confirm their chemical composition. The results of the EDS analysis are shown in Figures
27 and 28.
Carbon
Carbon
Sulfur
Aluminum
Sulfur
A
B

68
Figure 27. EDS from type II cathode (upper left area of Figure 26A) confirming that the lighter
deposit is sulfur rich.
Figure 28. Further EDS from type II cathode showing distribution of the components in the cathode
in cross section. Clockwise from top left: electron image, carbon Kα1-2, sulfur Kα1, oxygen Kα1.
2008-10-24 Groupe de caractérisation
A5-4404, 100%SOC, Pressure: 2nd region
Local chemical analysis clearly shows a very different
composition between the two regions. White Region is S
rich.
Local chemical analysis clearly shows a very different
composition between the two regions. White Region is S
rich.
2008-10-24 Groupe de caractérisation
A5-4404, 100%SOC
Remaining Sulphur
concentrated in the S8
(pure sulphur) region
Remaining Sulphur
concentrated in the S8
(pure sulphur) region
2008-10-24 Groupe de caractérisation
A5-4404, 100%SOC
Remaining Sulphur
concentrated in the S8
(pure sulphur) region
Remaining Sulphur
concentrated in the S8
(pure sulphur) region
2008-10-24 Groupe de caractérisation
A5-4404, 100%SOC
Remaining Sulphur
concentrated in the S8
(pure sulphur) region
Remaining Sulphur
concentrated in the S8
(pure sulphur) region
2008-10-24 Groupe de caractérisation
A5-4404, 100%SOC
Remaining Sulphur
concentrated in the S8
(pure sulphur) region
Remaining Sulphur
concentrated in the S8
(pure sulphur) region
Carbon
Sulfur
Electron image Carbon Kα1-2
Sulfur Kα1 Oxygen Kα1

69
Representative SEM micrographs at various magnifications are shown below for the
sintered plaque produced from type 255 nickel powder. Particle deformation and necking
as well as a loss of surface area provide evidence of the extent of sintering. These
indications are obvious when comparing the image at 2500x magnification to the image
supplied by the manufacturer (see Section IV.b, Sintered nickel cathodes). The sintered
nickel has a rough surface due to the degree of porosity, but exhibits a good deal of
homogeneity when compared to the carbon-based electrodes due to the lack of crack-type
defects. The pore sizes observed range from 50 plus microns in diameter down to about 1
micron in diameter.

70
Figure 29. SEM micrographs of type 255 sintered nickel electrodes. Top to bottom, left to right: 100x
magnification, 60° tilt 100x magnification, 500x magnification, 2500x magnification.
V.c. Dibutyl phthalate (DBP) uptake
DBP uptake was used to measure the void volume (VV) of the cathodes that were
fabricated. The results are shown in Table 3.

71
Table 3. DBP uptake of the cathodes tested in this study.
Cathode Type S:C Ratio VV
(mL)
Standard Deviation
(mL)
I 3.0 0.40 0.005
II 3.0 0.27 0.006
A 2.5 0.66 0.007
B 2.0 0.69 0.004
C 1.5 1.05 0.008
255 nickel n/a 0.29 0.015
525 nickel n/a 0.47 0.085
The measurements indicate that types I, II, 255 nickel, and 525 nickel have similar void
volumes; whereas types A, B, and C have increasingly higher void volumes
comparatively. For carbon-based cathodes, VV varied less than 2 percent between each
sample. For nickel-based cathodes, VV varied between 5 and 10 percent between each
sample. A positive correlation between increased carbon and VV was obtained, and VV
for the nickel-based cathodes was roughly equivalent to the lowest values of the carbon
cathodes.
V.d. Nitrogen adsorption and desorption
Nitrogen adsorption/desorption was used to measure the porosity of the carbon blacks
and nickel powders used in this study. The adsorption/desorption isotherm for Xe2
carbon is shown in Figure 30. The total volume adsorbed was nearly 1500 mL/g of
carbon. The isotherm exhibits the characteristic shape of a type IV isotherm with a
hysteresis loop that closes at PS/P0 = 0.4, indicative of a mesoporous sample. The

72
hysteresis loop is type H3 or H4, either case indicating the presence of oblong or slit-
shaped pores in the sample, typical of a high-structure carbon black.
Figure 30. Nitrogen adsorption/desorption isotherm for Xe2 carbon.
The surface area of the Printex Xe2 carbon black, used in the type I cathode, was
calculated from the isotherm using the Brunauer-Emmet -Teller (BET) function. The
BET surface area plot is shown in Figure 31; from the plotted data the surface area was
calculated to be 1154 m2/g.

73
Figure 31. BET surface area plot for Xe2 carbon.
The Barret-Joyner-Halenda (BJH) method was used to estimate the sample mesoporous
volume. Figure 32 shows the t-plot generated from the isotherm data that was used along
with the Kelvin equation to calculate pore volume. The calculated pore volume for the
Xe2 carbon, used in type I cathodes, was 2.24mL/g.

74
Figure 32. The t-plot for desorption isotherm from Xe2 carbon sample.
The porosity of Vulcan XC72 carbon black, used in type II cathodes, was also studied
using nitrogen adsorption/desorption. The isotherm obtained from the Vulcan carbon is
shown in Figure 33.

75
Figure 33. Nitrogen adsorption/desorption isotherm for Vulcan carbon.
The Vulcan isotherm can be classified as a type I isotherm, indicating the presence of
micropores in the sample. There is a slight hysteresis between the adsorption and
desorption branches that closes at PS/P0 of approximately 0.85. The small hysteresis
indicates that there is little mesoporosity in the sample. The BET method was used to
determine the surface area of the Vulcan carbon. The surface area was measured to be
254.98 m2/g. Figure 34 shows the BET surface area plot for Vulcan carbon.

76
Figure 34. BET surface area plot for Vulcan XC72 carbon.
The pore volume of the Vulcan carbon was estimated from the t-plot shown in Figure 35
as 0.3285 mL/g. Nitrogen adsorption was also performed on the 255 nickel powder and
525 nickel powder. The measurement showed zero pore volume over the range of the
measurement.

77
Figure 35. The t-plot for Vulcan XC72 carbon.
V.e. Mercury intrusion porosimetry
The void volume, void fraction, and void size distribution of each cathode was measured
by mercury intrusion. The results from cathode types I, A, and 255 are illustrated in
Figures 36 through 38. Further data can be found in Appendix A. Table 4 presents the
pertinent information from the measurements.

78
Figure 36. Mercury intrusion porosimetry of type I cathode.
Figure 37. Mercury intrusion porosimetry of type A cathode.

79
Figure 38. Mercury intrusion type 255 nickel cathode.
Table 4. Mercury intrusion results.
Cathode Type
Total Intrusion
Volume
(mL/g)
Void Fraction Distribution
Modality
Peak Center
Locations
(um)
I 0.75 0.64 Bimodal 50, 0.8
II 0.56 0.73 Trimodal 50, 1, 0.1
A 1.27 0.83 Trimodal 80, 3, 0.1
B 1.17 0.90 Trimodal 80, 5, 0.1
C 0.98 0.89 Trimodal 50, 5, 0.1
255 nickel 0.17 0.71 Unimodal 10
525 nickel 0.20 0.71 Unimodal 10

80
The intrusion volume of the nickel cathodes appears quite low in comparison to that of
the carbon-based cathodes due to the reported units, mL/g. The nickel has a higher
density (9 g/mL) compared to carbon and sulfur (roughly 2 g/mL). The mercury intrusion
indicates that the carbon-based cathodes each have voids with an effective diameter of 50
to 80 microns. These large voids are the mud-cracks observed under optical
magnification. The mud-cracks account for between a third and a half of the void volume
of the carbon cathodes. The other pores consist of intrastitial pores, generally in the
micron range and sub-micron sized and interstitial pores. Within the type A, B, and C
cathodes, void volume below 5 microns increases with increasing carbon amounts in the
formulation. The void sizes in nickel-based cathodes have a much narrower distribution
compared to the carbon cathodes. No pores less than 1 micron are measured in the nickel-
based cathodes.
V.f. Cathode compression
An Instron mechanical properties tester was used to measure the compression of the
carbon-based cathodes under pressures in the range of 0 to 2 MPa. The results are
displayed in Figure 39. The data are displayed as percent compression from the original
sample thickness as a function of the applied pressure.

81
Figure 39. Compression behavior of the carbon-based cathodes.
The thickness of cathode types I and II measured under 1 MPa is between 45 and 55
percent of the initial thickness of the cathode. Cathode types A, B, and C compressed to
between 60 and 70 percent of their initial thickness under 1 MPa. The results of the same
compression testing performed on the nickel cathodes of both type 255 and 525 showed
no change in thickness with applied pressure in the range of 0 to 2 MPa. The compression
of the cathodes is correlated with higher sulfur content in the cathode formula. The crush
strength of the carbon particulates is very high compared to the applied pressure. While
the compressive strength of sulfur (23 MPa90
) is also higher than the applied pressure, it
is much lower than that of carbon. It is possible that if the pressure is not distributed
evenly over the cathode due to non-uniform morphology, the sulfur particulates could
deform. The higher concentration in types A, B, and C cathodes may also play a role in

82
the increased compressive strength observed. The sintered nickel cathodes do not
compress in the range of pressures measured. Table 5 gives the percent compression of
the carbon-based cathodes under 1 MPa.
Table 5. Percentage of initial cathode thickness at one megapascal applied pressure.
Cathode Type Percent of Initial Thickness at 1 MPa
I 48
II 52
A 60
B 65
C 70
V.g. Lithium-sulfur battery performance
Figure 40 shows the capacity versus cycle number for cells with cathodes of type I and II.
Closed red markers show data from cells with type I cathode cycled without pressure;
open red markers show data from cells with type I cathode cycled under 1 MPa. Data
from cells with type II cathode are presented in black, closed markers are from cells
cycled without pressure, and open markers indicate that the cell was discharged under
1-MPa. Representative values from groups of a minimum of five cells are presented. The
specific capacity for the first discharge cycle of cells with either type of cathode, when
cycled without pressure, is approximately 1150 mAh/gS8. The specific discharge capacity
of cells with type I cathode drops 200 mAh/gS8 from the first cycle to the second cycle.
Over the next five cycles the specific capacity slowly increases before peaking at 1100
mAh/gS8 at the eighth cycle. After the eighth cycle, the specific capacity of cells with
type I cathode drops in a fairly linear fashion, reaching 900 mAh/gS8 at the 90th cycle.
After the first cycle the specific capacity of the cells with type II cathodes, when cycled

83
without pressure, decreases rapidly from 1150 to 900 mAh/gS8, before it plateaus briefly
for approximately 15 cycles. The specific capacity of these cells then follows the fade
rate of the type I cells albeit at 150 to 200 mAh/gS8 lower specific discharge capacity.
Figure 40. Cycle life of type I and type II cathodes cycled with and without pressure.
The first cycle capacity is drastically reduced when cells with either type I or type II
cathode are cycled under pressure. Under pressure, cells with either type of cathode reach
only 250 mAh/gS8 at the first discharge. The capacity of both type I and type II cathodes
increases with cycle number. In the case of type I cathodes there is a gradual increase in
capacity over 60 to 70 cycles when the capacity plateaus at roughly 500 mAh/gS8. In
contrast, cells with type II cathode reached only 250 mAh/gS8 for the first 30 cycles, but
then spiked to 850 mAh/gS8 specific discharge capacity. The cells with type II cathode
that had a discontinuous spike in capacity then faded over the next 20 cycles down to 550

84
mAh/gS8. The discontinuous spike was consistently observed for cells with type II
cathodes, but its occurrence ranged from between 30 to 50 cycles. Cells with type II
cathode cycled under pressure accumulated more capacity over their lifetime than cells
with type I cathode.
Figure 41 is a plot of the discharge voltage versus the specific capacity for six different
cells with type I cathodes. Each of the cells was cycled under a different pressure: 0, 0.1,
0.2, 0.3, 0.4, and 1 MPa. As little as 0.1 MPa of pressure applied to the cell reduces the
specific capacity, which continues to decrease with increasing applied pressure. As the
pressure is increased, there is a clear indication of polarization on both the upper plateau
(UP) and the lower plateau (LP) as the voltage traces are shifted towards lower capacity
and voltages. The loss of capacity is slight and is due to a shortened lower plateau for
pressures up to 0.2 MPa. For applied pressures of 0.3 MPa and above a reduction of
capacity in UP and LP is seen.

85
Figure 41. Plot of discharge voltage versus specific capacity for cells with type I cathode cycled under
various applied pressures.
Figure 42 is a plot of the discharge voltage versus specific capacity for cells with type II
cathodes cycled under various different pressures. Below 0.4 MPa, there is no obvious
trend between the applied pressure and specific capacity. In fact, each cell cycling under
0.4 MPa or less discharged to a higher capacity than the cell cycling without applied
pressure. However, slight capacity loss is seen on the UP with increasing applied
pressure. When cycled under 1 MPa the performance of cells with type II cathode is
similar to that of cells with type I cathode, no LP observed and total capacity reduced to
200 mAh/gS8

86
Figure 42. Discharge voltage curves for cells with type II cathodes.
The specific capacity values obtained for the first 20 cycles of lithium-sulfur cells made
with cathode types A, B, and C are shown in Figure 43. The data were obtained at an
applied pressure of 1 MPa. Cells with cathode type A reach a stable specific discharge
capacity within the first 10 cycles of 600 mAh/gS8, with type B they reach a capacity of
800 mAh/gS8, and with type C over 1000 mAh/gS8. This performance contrasts with the
performance of cells with type I and II cathodes, each of which discharged less than 300
mAh/gS8. The specific capacity decreases with increasing sulfur to carbon ratio. The
sulfur to carbon ratios are 2.5, 2.0, and 1.5 for cathode types A, B, C respectively, and 3.0
for cathode types I and II.

87
Figure 43. Specific discharge capacity versus cycle for cells with types A, B, and C cathode cycled
under 1 MPa.
Discharge voltage curves are plotted in Figure 44 for cells with type A, B, and C
cathodes. The data presented are the average taken from three cells of each cathode type.
In cells with type A or B cathode, both upper and lower plateau capacities are suppressed
compared to type C cathode. The lower plateau specific capacity is 800 mAh/gS8 in cells
with type C cathode, which is several hundred mAh/gS8 higher than the lower plateau
capacity of cells with type A or B cathodes.

88
Figure 44. Discharge voltage versus specific capacity of cathode types A, B, and C.
Cells with nickel-based cathodes were cycled with and without 1 MPa applied pressure.
The results of the cycling tests are presented in Figure 45. The applied pressure has little
effect on the sulfur utilization, which reaches 1100 mAh/gS8. This is in strong contrast to
the behavior of cells with carbon-based cathodes reported earlier.
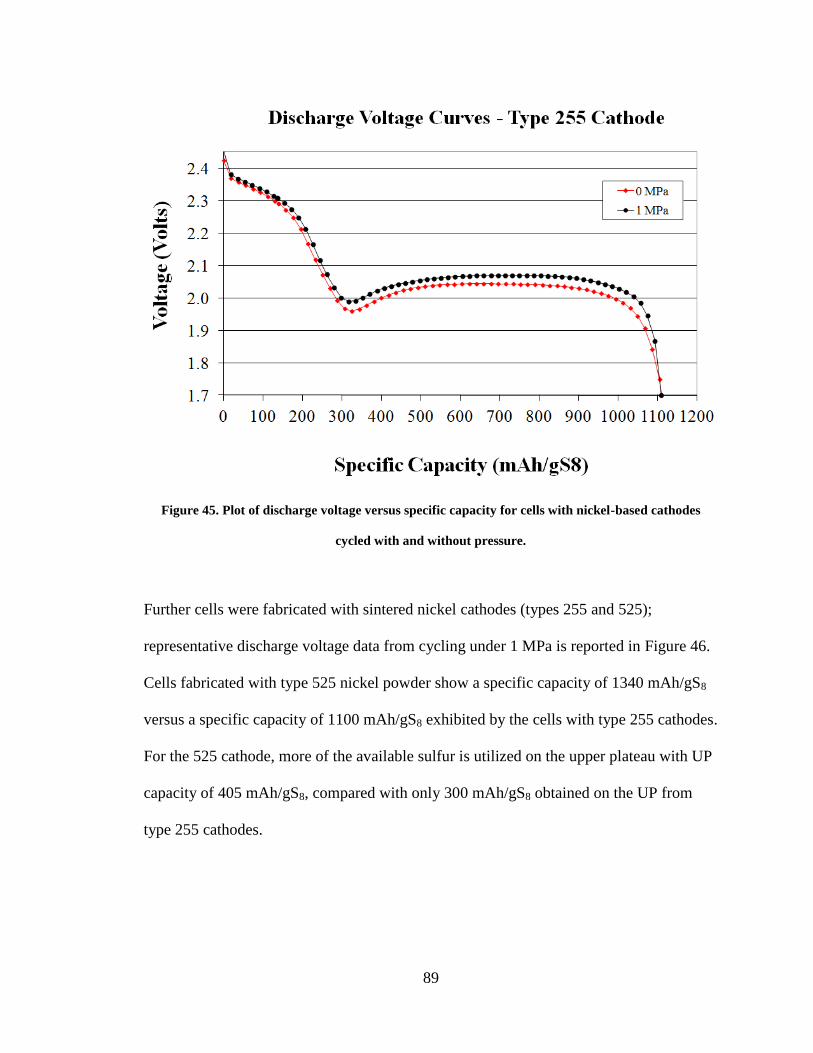
89
Figure 45. Plot of discharge voltage versus specific capacity for cells with nickel-based cathodes
cycled with and without pressure.
Further cells were fabricated with sintered nickel cathodes (types 255 and 525);
representative discharge voltage data from cycling under 1 MPa is reported in Figure 46.
Cells fabricated with type 525 nickel powder show a specific capacity of 1340 mAh/gS8
versus a specific capacity of 1100 mAh/gS8 exhibited by the cells with type 255 cathodes.
For the 525 cathode, more of the available sulfur is utilized on the upper plateau with UP
capacity of 405 mAh/gS8, compared with only 300 mAh/gS8 obtained on the UP from
type 255 cathodes.

90
Figure 46. Discharge curve comparing the performance of type 525 cathode with type 255 cathode.
Discharge Voltage
1.7
1.8
1.9
2.0
2.1
2.2
2.3
2.4
0 100 200 300 400 500 600 700 800 900 1000 1100 1200 1300 1400 1500
Specific Capacity (mAh/gS8)
Vo
ltag
e (V
olt
s)Type 525B cathode
Type 255 Cathode
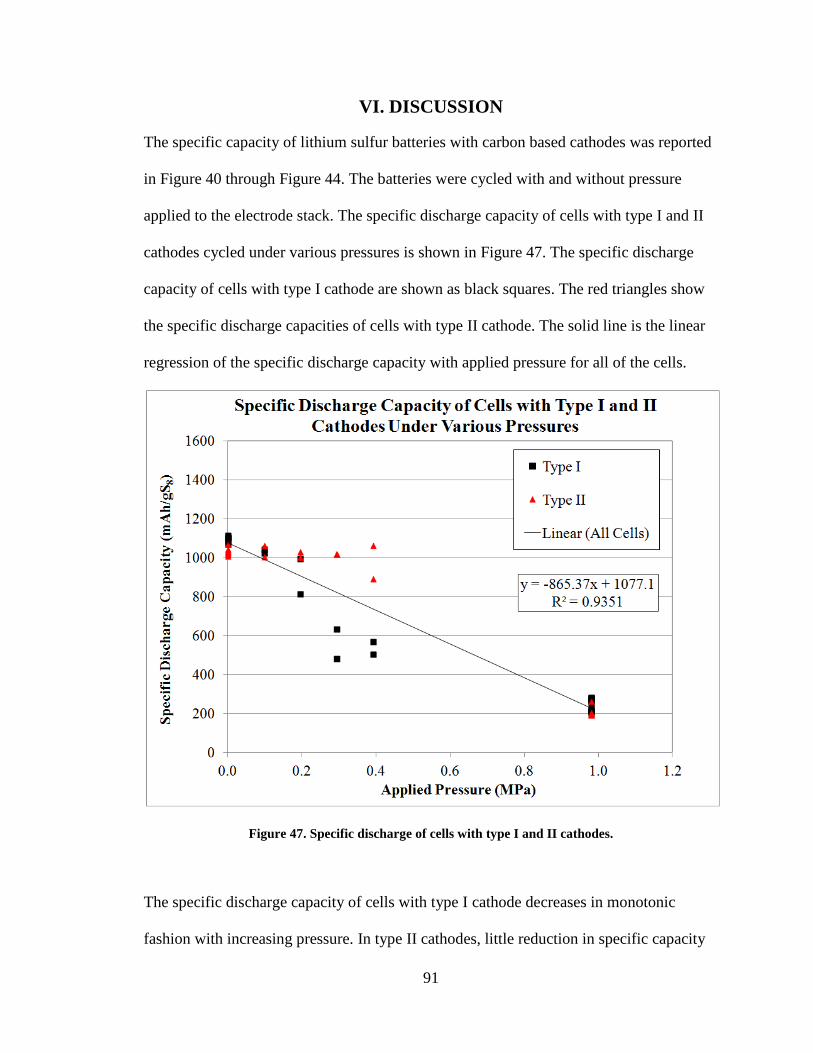
91
VI. DISCUSSION
The specific capacity of lithium sulfur batteries with carbon based cathodes was reported
in Figure 40 through Figure 44. The batteries were cycled with and without pressure
applied to the electrode stack. The specific discharge capacity of cells with type I and II
cathodes cycled under various pressures is shown in Figure 47. The specific discharge
capacity of cells with type I cathode are shown as black squares. The red triangles show
the specific discharge capacities of cells with type II cathode. The solid line is the linear
regression of the specific discharge capacity with applied pressure for all of the cells.
Figure 47. Specific discharge of cells with type I and II cathodes.
The specific discharge capacity of cells with type I cathode decreases in monotonic
fashion with increasing pressure. In type II cathodes, little reduction in specific capacity

92
was observed for pressures up to 0.4 MPa. Above 0.4 MPa, cells with type II cathode
show drastic reduction in capacity similar to cells with type I cathode. While each
cathode contains 24 percent carbon black in its formulation, Type I cathodes contain a
high surface area carbon black (1500 m2/g) and type II cathodes contain a low surface
area carbon black (75 m2/g). Since the cathode surface area is largely determined by the
surface area of the carbon, it is likely that the type II cathodes have lower total surface
area. The reduction in the surface area of the cathode may contribute to the greater
pressure tolerance of the type II cathodes compared to the type I cathodes.
The observed reduction in overall capacity with applied pressure is predominantly due to
loss of lower plateau capacity, as shown in Figures 41 and 42. Figure 48 shows the
specific capacity on the lower plateau for type I and II cathodes, as a function of applied
pressure. Data for type I cathode are shown with black squares, and for type II cathodes
with red triangles. The solid line is the linear regression of the lower plateau specific
discharge capacity with applied pressure for all of the cells.

93
Figure 48. Lower plateau capacity for type I and II cathodes.
As 75 percent of the theoretical specific capacity comes from the lower plateau, the
relationship between total specific capacity and applied pressure is expected to be similar
to lower plateau specific capacity and applied pressure. And, in fact, both trends show a
similar inverse relationship. However, the lower plateau capacity is observed to be
reduced for cells with both cathode types consistently across all applied pressures. The
electrochemical processes occurring on the lower plateau are the reduction of S42-
to S22-
and S2-
, and the subsequent precipitation of Li2S2 and Li2S. The reduction in specific
capacity can therefore be linked to an inhibition of these processes.

94
Not all cells were affected equally by the application of pressure. Figure 49 compares the
specific capacity of cells with the different cathode types cycled under 1 MPa. Error bars
represent the range of values obtained for cells with a given cathode type. Specific
capacity values of cathode types I and II are shown in red for comparison.
Figure 49. Specific capacity of cells with each cathode type cycled under 1 MPa.
Specific discharge capacity is reduced, predominantly on the lower plateau, when carbon-
based cathodes are cycled under 1 MPa. The application of pressure to cells with nickel-
based cathodes had no effect on their specific capacity. Cells with cathodes types A, B,
and C were less affected by the application of 1 MPa than cathode types I and II. Cathode
types A, B, and C contain the same type of low surface area carbon as type II cathodes.
Cathode types A, B, and C had decreasing ratios of sulfur to carbon black in their

95
formulations (2.5:1, 2:1, 1.5:1), increasing cathode volumes, and more binder than
cathode types I and II. All of these properties may play a role in their increased
performance under pressure. Nickel-based cathodes have lower surface area than carbon-
based cathodes of any type. The nickel powder that the cathodes are fabricated from has a
specific surface area on the order of 1 m2/g, which is further reduced during the sintering
process.
In addition to variations in cathode surface area and void volume, cathodes responded
differently to the application of pressure. While no compression of the nickel cathodes
was observed under 1 MPa, carbon cathodes were compressed between 30 and 52 percent
(detailed in Figure 39) by the application of 1 MPa to the electrode stack. Figure 50 is a
visualization of the effect of applying 1 MPa to a carbon-based cathode. The cathode is
shown in the as-coated condition, before filling with electrolyte, in cross section. The
yellow blobs represent the sulfur particles, and the black spheroids represent the carbon
particles.
Figure 50. Cartoon representation of cathode compression, as-produced cathode on the left, and
cathode placed under 1 MPa on the right.

96
The compression leads directly to a reduction in the volume of the cathode, which is due
to the rearrangement of the carbon and sulfur particulates, and the elimination of
interstitial void volume. It is unlikely that at 1 MPa the internal pore structure of the
carbon particles is affected.
At the start of the lower plateau, sulfur in the cathode has been reduced from S8 to S42-
;
S42-
is highly soluble in the solvent and all Li2S4 should be dissolved. Figure 51 shows a
schematic of the cathode in cross section at the start of the discharge process (left) and at
the start of the lower plateau (right). The electrolyte solution is represented by the light
red rectangle behind the carbon and sulfur particles.
Figure 51. Schematic representation of the cathode at the start of the discharge process (left) and at
the beginning of the lower plateau (right).
As the discharge process proceeds, the solid sulfur is dissolved and reduced to S42-
,
represented by the darkening of the electrolyte color. Precipitation of Li2S2 from S42-
-
saturated solution is the next step in the sulfur reduction process.
Figure 52 shows the effect of the application of pressure to a sample volume of cathode at
the start of the lower plateau.

97
Figure 52. Schematic representation of the state of the cathode at the start of the lower plateau.
The total volume of the cathode (VC) is represented in two dimensions by the area of the
red rectangle. The cathode also has a total void volume (VV) which, in two dimensions,
would be the area of the red rectangle less the sum of the areas of the black carbon
particulates. Void volume is reduced when the carbon cathodes are compressed; the
carbon particulates are pressed together resulting in a much less open structure. The void
volume under pressure will be denoted as VV* to avoid confusion with the uncompressed
quantity.
To determine VV and VV*, the mercury intrusion and nitrogen desorption measurements
were combined with the compression data collected from the Instron tester (Figure 39).
These measurements were all conducted on cathodes in the as-coated condition, with
sulfur present in the cathode. At the start of the lower plateau, where the cathode
performance is affected by pressure, the sulfur will be dissolved in the electrolyte. The
volume of sulfur (VS) in each cathode can be calculated by multiplying the sulfur loading
by the area of the cathode and specific gravity of sulfur. Then VS is added to the

98
measured pore volumes to obtain VV and VV* at the start of the lower plateau. Table 5
shows the percent reduction in thickness for each carbon-based cathode type under 1
MPa. It is assumed that reduction in VV is due entirely to loss of interstitial pore volume.
Table 6 shows the measured values for thickness, VC and VV, and the calculated values
for VV* for each of the cathodes that were prepared for this study.
Table 6. Calculated void volumes for cathodes with and without applied pressure.
Cathode Type S:C Ratio Thickness
(microns)
VC
(mL)
VV
(mL)
VV*
(mL)
I 3.0 45 0.45 0.40 0.19
II 3.0 35 0.35 0.27 0.14
A 2.5 77 0.77 0.66 0.40
B 2.0 75 0.75 0.69 0.45
C 1.5 115 1.14 1.05 0.74
255 nickel n/a 41 0.41 0.29 0.29
525 nickel n/a 66 0.66 0.47 0.47
Volid volume (VV) ranges from 0.27 to 1.05 mL and VV* ranges from 0.14 to 0.74 mL.
The void volume trends positively with increasing amounts of carbon in the cathode, with
type C cathode having the highest measured void volume.
Figure 53 shows the relationship between the void volume of the cathode and specific
discharge capacity for all the cells in this study. Data points for individual cells are shown
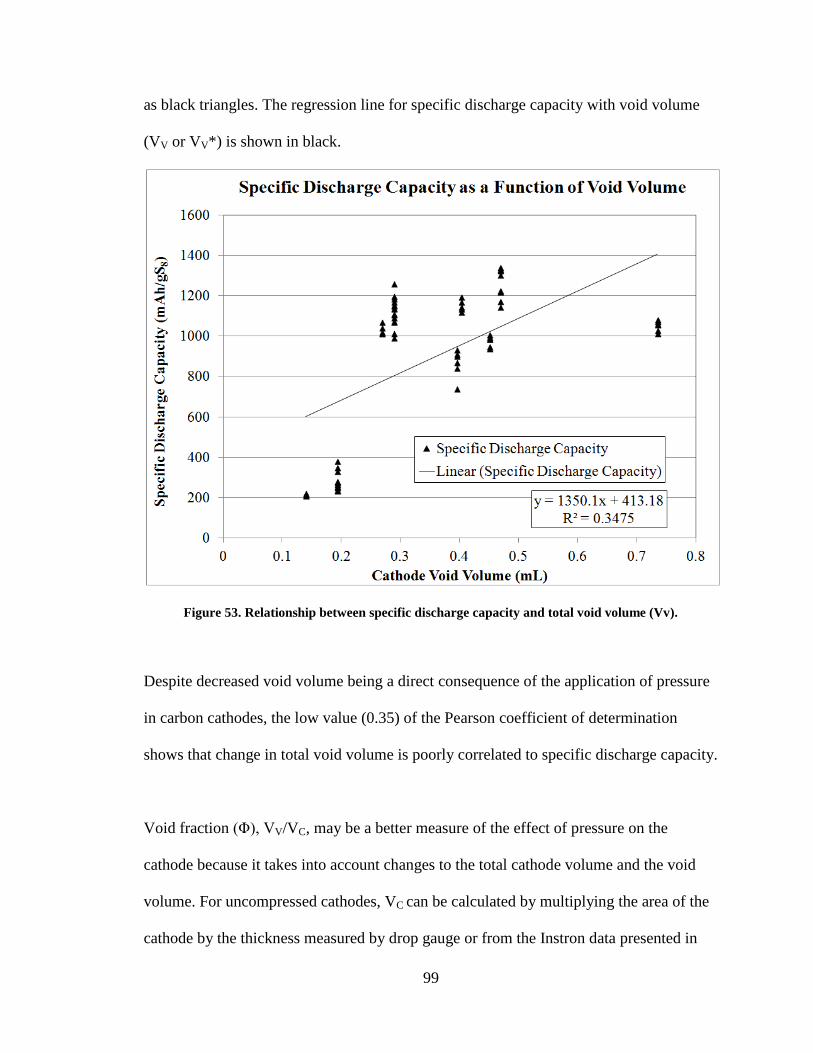
99
as black triangles. The regression line for specific discharge capacity with void volume
(VV or VV*) is shown in black.
Figure 53. Relationship between specific discharge capacity and total void volume (Vv).
Despite decreased void volume being a direct consequence of the application of pressure
in carbon cathodes, the low value (0.35) of the Pearson coefficient of determination
shows that change in total void volume is poorly correlated to specific discharge capacity.
Void fraction (Φ), VV/VC, may be a better measure of the effect of pressure on the
cathode because it takes into account changes to the total cathode volume and the void
volume. For uncompressed cathodes, VC can be calculated by multiplying the area of the
cathode by the thickness measured by drop gauge or from the Instron data presented in

100
Figure 39, with both values being in good agreement. The total volume of compressed
cathodes (VC*) was found according to the formula VC* = VC(1- ThF/ThI), where ThF is
the final thickness and ThI is the initial thickness. Values of ThF/ThI were reported in
Table 5. Values of Φ for the type I cathodes that were cycled under various pressures are
reported in Table 7.
Table 7. Void fraction of type I cathodes under increasing pressure.
Pressure (MPa) (ThF/ThI)*100 Void Fraction (Φ)
0.0 100 0.90
0.1 88 0.79
0.2 79 0.71
0.3 72 0.65
0.4 67 0.60
1.0 42 0.43
Figure 54 shows the functional relationship between specific discharge capacity and
lower plateau capacity and the calculated void fraction for type I cathodes. The data for
the specific discharge capacity are given in open symbols, and the regression for specific
discharge capacity with void fraction is shown as a solid line. The data for the lower
plateau specific discharge capacity are given in closed symbols, and the regression of
lower plateau specific discharge capacity is shown with a dashed line.

101
Figure 54. Functional relationship between Φ and specific discharge capacity for Type I cathodes.
The Pearson coefficient of determination of the linear regress between LP specific
discharge capacity and Φ is 0.91, and for total capacity and Φ is 0.96. The similarity in
trend is expected, as most of the specific capacity in these cells comes from the lower
plateau. For the type I cathode cycled under various pressures, differences in lower
plateau capacity can be explained simply by differences in Φ.
The same analysis can be applied to the broader range of cathodes studied. Table 8 shows
the void fraction (Φ) at the start of the lower plateau for each type of cathode with and
without the application of 1 MPa.

102
Table 8. Void fraction initially and under 1 MPa for each cathode type.
Cathode Type Φ Φ 1 MPa σΦ
I 0.90 0.52 0.02
II 0.77 0.44 0.02
A 0.86 0.54 0.02
B 0.93 0.58 0.02
C 0.92 0.65 0.02
255 0.71 0.71 0.07
525 0.71 0.71 0.07
Figure 55 shows the specific capacity for cells with different cathode types as a function
of void fraction.
Figure 55. Specific capacity as a function of void fraction for all cathode types.
Across all of the cathodes in this study, the value of the Pearson coefficient of
determination between Φ and specific discharge capacity is 0.62. Specific capacity trends
positively with void fraction but not in monotonic fashion. Cells made with both types of
Type I
Type II
Nickel

103
nickel cathodes have higher average specific capacities than the type II cathode, despite
having slightly lower values of Φ. The average specific capacity of the 255 nickel is just
below that of the type I cathode and the 525 nickel cathode is slightly higher; both have
about 70 percent of the void fraction of the type I cathode. The correlation between
specific discharge capacity and void fraction for a single type of cathode is better than the
correlation across all cathodes. As the lower plateau discharge reactions proceed toward
the end of discharge, the precipitation of discharge products in the cathode decreases the
void fraction. Given the variations in void structure of the different cathode types, it is
reasonable to expect that the cathodes will respond differently to the changes in void
fraction.
The precipitation of lithium sulfide during the discharge process occludes some volume,
both intrastitial pores and interstitial voids, and in turn decreases void fraction. Figure 56
is an illustration of the changes that occur to the void volume as the discharge process
progresses. The image on the left represents the cathode at the beginning of the lower
plateau; the image on the right represents the cathode somewhere in the middle of the
lower plateau, where Li2S2 and Li2S have begun to precipitate out of solution. The Li2S
and Li2S2 deposits are represented in green.

104
Figure 56. Diagram showing the effects of Li2S precipitation on the porous structure of the cathode.
The size of the discharge products can be examined from SEM images taken of cathodes
at the end of discharge. The deposits are identified as Li2S using the methods discussed
earlier. Figure 57 shows typical Li2S deposits in a cathode at the end of discharge; the
image on the left shows a pore wall from type I cathode in cross section, and on the right
is a magnified section of the same.
Figure 57. SEM micrographs showing Li2S nodules deposited on a pore wall.
Li2S deposits

105
As seen in the figure, the deposited Li2S takes the form of 100–200 nm nodules. The
deposits take this form due to the insulating nature of lithium sulfide, which limits
electron transfer from the carbon or nickel to sulfide ions in the electrolyte and caps the
size of Li2S2 and Li2S deposits to a critical thickness above which electron transfer cannot
occur, preventing sulfur reduction at that point. Figure 58 shows a diagram of a pore wall
covered with Li2S deposits.
Figure 58. Diagram of a pore wall showing Li2S deposition.
Assuming complete coverage of pore walls with Li2S, a minimum pore diameter to avoid
occlusion with discharge products would be roughly half a micron. If 0.5 µm is a critical
pore diameter, then cathodes with more pores greater than this size should be expected to
outperform the specific capacity predicted by measuring void fraction at the start of the
lower plateau. Table 9 compiles the results of nitrogen adsorption/desorption and
mercury intrusion measurements used to determine the void sizes for each cathode.

106
Table 9. Void size distribution for different cathode types.
Cathode Type Void fraction (Φ) d < 50 nm 50nm < d < 0.5µm d > 0.5 µm
I 0.52 54% 11% 35%
II 0.44 16% 15% 70%
A 0.54 6% 8% 86%
B 0.58 7% 10% 84%
C 0.65 5% 13% 81%
255 0.71 0% 0% 100%
525 0.71 0% 0% 100%
The table shows the percentage of VV* that falls within the designated ranges for each
cathode type. The void volume of the carbon cathodes consists of between 15 and 65
percent voids smaller than 0.5 µm. The type I cathode has the highest percentage (65)
followed by the type II cathode (31). The nickel-based cathodes consist entirely of pores
larger than 0.5 µm.
The lower plateau capacity is tied to the conversion of S42-
to S22-
and S2-
. Formation of
both S22-
and S2-
results in heterogeneous precipitation of lithium sulfide onto the
conductive carbon surface. This process occurs in three steps. The first step is diffusion
of reactants to the active surface. One molecule of S42-
and four lithium ions from the
bulk electrolyte diffuse to the surface of a carbon particulate in the cathode. Figure 59
illustrates a volume of the cathode membrane at the start of the lower plateau. The red
background represents the solvent into which the Li2S4 has dissolved. The lithium ions
are represented by the positive symbol and the negative represents S42-
. The dashed
arrows show an imagined diffusion path of the ionic species to the surface of a carbon
particulate.

107
Figure 59. Cartoon of first reaction step in the reduction of S42-
to S2-
.
In the second reaction step, the requisite ionic species are adsorbed onto the carbon
surface. The third step, electron transfer, then occurs and insoluble Li2S is precipitated on
the surface of the carbon particulate.
Figure 11 showed that lower plateau capacity is correlated negatively with decreasing
temperature; lower temperature will suppress diffusion rates. Figure 10 showed that
lower plateau capacity is an inverse function of discharge rate. Slower discharge rate
allows longer diffusion time. As reported by Yamin,45
working with lithium metal anodes
and polysulfides dissolved in THF, a system similar to that examined here, precipitation
of S2-
from S52 is a diffusion-controlled process. It is therefore reasonable to assume that
the lower plateau discharge process is diffusion limited.

108
The first step in the reduction of S42-
, diffusion of the ionic species in bulk solution to the
surface of a carbon particulate in the cathode, is described by the equations for transport
of ionic species in a fluid-filled porous membrane due to both an electrical potential and a
chemical potential. The two ionic species with the highest concentration at the start of the
lower plateau are Li+ and S4
2-. In bulk solution, assuming activity of unity, the governing
equation is:
[15]
The discussion here centers on diffusion not in the bulk electrolyte, but in the cathode, a
porous membrane defined by the carbon or nickel structure. Equation [15] corrected for
diffusion in a porous membrane is:
[16]
This correction accounts for the geometry of the porous membrane. The parameters of the
porous membrane that influence molar flux are void fraction (Φ), and a structure
parameter β, which attempts to capture the effects of the geometry of the void space and
is closely related to connectivity, pore size, and tortuosity (τ). Increasing Φ and
decreasing β will increase the flux of an ionic species up to the limit of what would be
observed in the bulk fluid. Values of the diffusion constant for the various ionic species
present have not been reported in the literature and will further depend on temperature
and solvent environment, but are not affected by the type of cathode. In the case of the
reduction of S42-
to S22-
, if the reaction is diffusion limited, the reaction rate on the carbon
surface should be the equivalent of the flux to the carbon surface at steady state.

109
The disconnect between reduction in pore volume and changes in specific capacity
illustrated in Figure 53 is explained by the role of mass transport in determining the lower
plateau capacity. It is possible to create a cathode with a large pore volume that has very
poor mass transport characteristics; for example, a very thick cathode that has a small
void fraction would have both a very long diffusion path, and very slow mass transport
while having a large void volume.
The structure factor, β, was not quantified in this study. While several techniques are
available to measure Φ of cathodes both before and after the application of pressure, β is
not readily accessible through experimentation, especially for compressed cathodes.
However, β does depend on pore size distribution, and qualitative observations of
changes in tortuosity, connectivity, and pore size throughout the discharge process can
give some insight towards understanding the effect of β.
Generally lower tortuosity is associated with large, straight, short pores. In comparing
intraparticle pores to interparticle voids in the carbon-based cathodes, interparticle voids
should present a less tortuous path for diffusion. Extending the concept further, carbon
particles with high surface areas, such as those used in type I cathodes, have highly
tortuous intraparticle pore volumes. In comparing nickel cathodes that have no
intraparticle pores to carbon cathodes, nickel cathodes should have still lower tortuosity
compared to carbon cathodes with low surface area carbons.

110
VII. SUMMARY AND FUTURE WORK
Development of all electric powertrains for terrestrial vehicles has received increasing
attention in recent years. Major hurdles to the adoption of electric vehicles are vehicle
size, range, and cost. Each of these drawbacks is associated with the state-of-the-art
lithium ion battery chemistries currently available for use in electric vehicles. While
lithium ion batteries offer long cycle lives, they contain expensive materials with low
energy density. High energy density active materials offer the promise of increasing
driving range to satisfy consumer demands. Inexpensive raw materials can allow wide-
scale adoption of new technologies by keeping costs low. The lithium-sulfur system
offers these attractive features but currently carries the drawback of limited cycle life.
A review of the available literature in the area of lithium-sulfur batteries shows that most
effort is directed at solving the problem of the polysulfide shuttle. However, researchers
that have inhibited the polysulfide shuttle over the first hundred cycles have shown that
capacity fade is not abated. These researchers point to deleterious reactions between the
electrolyte solvents and the lithium metal anode to explain the observed battery failure
modes in the absence of the polysulfide shuttle. The only proposed approach to
separating the electrolyte and lithium metal anode is a solid electrolyte.
Formation of lithium dendrites during the charging process (lithium plating) is a well-
known problem with lithium metal anodes. The formation of dendrites further
complicates the use of a solid electrolyte, as an electrolyte layer is likely to be damaged

111
by dendrite growth. Application of 1 MPa normal to the active face of the electrode stack
can mechanically prevent the formation of lithium dendrites during the charging process.
This study was undertaken to understand the relationship between the function of
standard lithium-sulfur cathodes and the application of pressure. Lithium-sulfur cathodes
were produced from slurries containing sulfur mixed with conductive carbon black and a
polymer binder. The ratio of carbon to sulfur in the cathode was varied. Two different
types of carbon black were used. Cathodes were also produced by sintering filamentary
nickel powder and dip coating the sulfur into the resulting porous nickel sponge.
The cathodes were characterized by nitrogen adsorption and desorption, mercury
intrusion, and DBP uptake. Electron and optical images were captured to show important
features of the cathode structure. Compression of the cathodes was measured using a
mechanical properties tester. From the characterization data, total pore volume and void
fraction with and without applied pressure were calculated for each cathode type.
Cathodes were assembled into lithium-sulfur cells and their performance was evaluated
with and without pressure. Specific capacity and cycle life were measured, and the
single-cycle discharge curves for several cells were obtained to elucidate the mechanisms
underlying the behavior of the cells.
Type I cathodes were fabricated from sulfur powder, a high surface area carbon black,
and polymer binder. Analytical results showed that the void volume of these cathodes

112
was dominated by the nano-sized pores within the carbons themselves, especially as
larger voids were eliminated upon application of pressure. Instron measurements showed
that the cathodes collapsed to near 50 percent of their initial thickness. Electrochemical
testing of cells with these cathodes showed high specific capacity when cycled without
pressure, but extremely low specific capacity when cycled under pressure. Post mortem
analysis showed that all of the electrochemical activity took place in the large mud-cracks
when these cells were cycled under pressure.
Type II cathodes were fabricated using a low surface area carbon black. These cathodes
also collapsed to roughly 50 percent of their initial thickness under 1 MPa. Testing of
cells with the low surface area cathode showed increased specific capacity when cycled
under pressure as compared to the high surface area cathodes. The increase in capacity
shown by low surface area cathodes was correlated to nitrogen adsorption data indicating
lower cathode surface area. Lower total surface area with the same pore volume
necessarily means that the average pore size was increased when compared to the high
surface area cathodes, which was confirmed using mercury porosimetry. Post mortem
analysis revealed uneven utilization across the entire surface of the cathode.
The ratio of carbon to sulfur was varied in cathode types A, B, and C. Cathodes with
more carbon had more pore volume per gram of sulfur than the previous cathodes as
indicated by mercury intrusion. Compression testing showed that the compression was
inversely proportional to the amount of carbon in the formulation. Increasing amounts of
carbon led to higher sulfur utilizations under 1 MPa. Evaluation of the single-cycle

113
discharge curves showed that sulfur utilization on the lower plateau increased
dramatically with increasing carbon content, while upper plateau capacity increased only
slightly. Lengthening of the lower plateau implies conditions that favor the precipitation
of Li2S.
Nickel cathodes did not compress under the 1 MPa applied load. This allowed the effects
of pore volume to be examined independently of cathode compression. Measurements of
the cathode surface area using nitrogen and mercury probes indicated lower surface area
than the carbon-based cathodes. These measurements revealed a radically different void
volume compared to the carbon cathodes, composed entirely of pores between 0.1 and
100 microns. Electrochemical testing of lithium-sulfur batteries with the nickel cathodes
showed increased specific capacity over the carbon cathodes.
The application of pressure was highly correlated to decreased specific capacity of
lithium-sulfur cells with carbon-based cathodes. Cells with nickel-based cathodes were
not affected by the application of pressure. Given the compression behavior of the
cathodes, and corresponding reduction in void volume, it was expected that there would
be a relationship between void volume and specific capacity. The total void volume with
and without applied pressure was calculated for each cathode type. However, it was
found that void volume and specific capacity were not highly correlated (r2 = 0.3). Void
fraction was calculated for each cathode type, and was found to be highly correlated (r2 =
0.9) to the specific capacity of the type I cathode under varied pressures. The correlation
was not as strong for the population of all the cells studied here at r2 = 0.6.

114
The correlation between void fraction and specific capacity was linked to the mass flux of
ionic species in the cathode membrane during the discharge process on the lower plateau.
The mass flux of ionic species from the bulk electrolyte to reaction sites on the surface of
the cathode determines the reaction rate of the conversion of Li2S2 to Li2S, in turn
increasing the specific capacity measured for a given cathode. Mass flux depends on the
diffusion and migration of the ionic species which in turn depends on properties of the
void volume in the cathode such as void fraction, void size distribution, and tortuosity of
the void volume. While tortuosity was not quantified, void size distribution
measurements indicate that the nickel cathodes should have especially low tortuosity
when compared to the carbon cathodes. This may account for their better than expected
performance.
The sintered nickel cathodes demonstrate a path to increasing the performance of lithium-
sulfur batteries from a theoretical standpoint. However, due to the high density of nickel,
the cathodes fabricated for this study are highly impractical for electric vehicle
applications. The nickel cathodes may serve as a template for future lithium-sulfur
cathode development where specific capacity and cycle life can be optimized using low-
density materials. Lighter metals and alloys, carbon monoliths, inherently conductive
polymers or ceramics, and polymers or ceramics with conductive coatings are obvious
candidates for further study.

115
APPENDIX A. MERCURY INTRUSION DATA
Figure 60. Mercury intrusion porosimetry of type II cathode.
Figure 61. Mercury intrusion porosimetry for type B cathode.

116
Figure 62. Mercury intrusion of type C cathode.
Figure 63. Mercury intrusion type 525 nickel cathode.

117
REFERENCES
1. Saft. Saft lithium batteries selection guide. (2013).
2. USABC. USABC goals for advanced batteries for EVs. 1 (2011). At
<http://www.uscar.org/commands/files_download.php?files_id=27>
3. Rauh, R. D., Pearson, G. F. & Brummer, S. B. Capacity, rate capabilities and
rechargeability of a lithium/dissolved sulfur secondary battery. Proc. Electrochem.
Soc. 77-6, 998–1008 (1977).
4. Besenhardt, J., Gurtler, J. & Komeda, P. Suppression of dendrite formation during
cycling of lithium electrodes in organic electrolytes. Ext. Abstr. ECS Fall Meet.
(1987). At
<http://scholar.google.com/scholar?hl=en&btnG=Search&q=intitle:Suppression+o
f+Dendrite+Formation+During+Cycling+of+Lithium+Electrodes+in+Organic+Ele
ctrolytes#0>
5. Rao, B. M. L. Lithium-aluminum electrode. J. Electrochem. Soc. 124, 1490
(1977).
6. Schlaikjer, C. Method for preventing dendritic growth in secondary cells. US Pat.
4,139,680 (1979). At
<http://www.google.com/patents?hl=en&lr=&vid=USPAT4139680&id=BacuAA
AAEBAJ&oi=fnd&dq=method+for+preventing+dendritic+growth+in+secondary+
cells&printsec=abstract>
7. Mikhaylik, Y., Kovalev, I. & Schock, R. High energy rechargeable Li-S cells for
EV application: Status, remaining problems and solutions. ECS Trans. 25, 23–34
(2010).
8. Ely, D. R. & Garcia, R. E. Heterogeneous nucleation and growth of lithium
electrodeposits on negative electrodes. J. Electrochem. Soc. 160, A662–A668
(2013).
9. Han, S.-C. et al. Effect of multiwalled carbon nanotubes on electrochemical
properties of lithium/sulfur rechargeable batteries. J. Electrochem. Soc. 150,
A889–A893 (2003).
10. Yuan, L., Yuan, H., Qiu, X., Chen, L. & Zhu, W. Improvement of cycle property
of sulfur-coated multi-walled carbon nanotubes composite cathode for
lithium/sulfur batteries. J. Power Sources 189, 1141–1146 (2009).
11. Wang, J. L. L., Yang, J., Xie, J. Y. Y., Xu, N. X. X. & Li, Y. Sulfur–carbon nano-
composite as cathode for rechargeable lithium battery based on gel electrolyte.
Electrochem. Commun. 4, 499–502 (2002).

118
12. Guo, J., Xu, Y. & Wang, C. Sulfur-impregnated disordered carbon nanotubes
cathode for lithium-sulfur batteries. Nano Lett. 11, 4288–4294 (2011).
13. Zheng, W., Liu, Y., Hu, X. & Zhang, C. Novel nanosized adsorbing sulfur
composite cathode materials for the advanced secondary lithium batteries.
Electrochim. Acta 51, 1330–1335 (2006).
14. Choi, Y. S. et al. Effect of cathode component on the energy density of lithium-
sulfur battery. Electrochim. Acta 50, 833–835 (2004).
15. Wei, S. et al. Pig bone derived hierarchical porous carbon and its enhanced cycling
performance of lithium-sulfur batteries. Energy Environ. Sci. 4, 736–740 (2011).
16. Jun, S., Joo, S. & Ryoo, R. Synthesis of new, nanoporous carbon with hexagonally
ordered mesostructure. J. Am. Chem. Soc. 10712–10713 (2000). At
<http://koasas.kaist.ac.kr/handle/10203/11217?viewType=local>
17. Wang, C., Chen, J., Shi, Y., Zheng, M. & Dong, Q. Preparation and performance
of a core-shell carbon/sulfur material for lithium/sulfur battery. Electrochim. Acta
55, 7010–7015 (2010).
18. Sun, J. et al. Preparation and electrochemical characterization of the porous sulfur
cathode using a gelatin binder. Electrochem. commun. 10, 930–933 (2008).
19. Li, X. et al. Optimization of mesoporous carbon structures for lithium-sulfur
battery applications. J. Mater. Chem. 21, 16603–16610 (2011).
20. Ryu, H.-S., Ahn, H.-J., Kim, K.-W., Ahn, J.-H. & Lee, J.-Y. Discharge process of
Li/PVdF/S cells at room temperature. J. Power Sources 153, 360–364 (2006).
21. Ryu, H.-S. et al. Electrochemical properties of PVdF gel polymer electrolyte with
plasticizer for lithium/sulfur battery. J. Korean Electrochem. Soc. 10, 213–218
(2007).
22. Wu, F. et al. Sulfur/polythiophene with a core/shell structure: Synthesis and
electrochemical properties of the cathode for rechargeable lithium batteries. J.
Phys. Chem. C 115, 6057–6063 (2011).
23. Choi, Y.-J., Kim, K.-W., Ahn, H.-J. & Ahn, J.-H. Improvement of cycle property
of sulfur electrode for lithium/sulfur battery. J. Alloys Compd. 449, 313–316
(2008).
24. Choi, J.-W. et al. Rechargeable lithium/sulfur battery with suitable mixed liquid
electrolytes. Electrochim. Acta 52, 2075–2082 (2007).

119
25. Shin, J. H., Jung, S. S., Kim, K. W., Ahn, H. J. & Ahn, J. H. Preparation and
characterization of plasticized polymer electrolytes based on the PVdF-HFP
copolymer for lithium/sulfur battery. J. Mater. Sci. Mater. Electron. 13, 727–733
(2002).
26. Mikhaylik, Y. V & Akridge, J. R. Low temperature performance of Li/S batteries.
J. Electrochem. Soc. 150, A306–A311 (2003).
27. Mikhaylik, Y. V & Akridge, J. R. Polysulfide shuttle study in the Li/S battery
system. J. Electrochem. Soc. 151, A1969–A1976 (2004).
28. Mikhaylik, Y., Kovalev, I., Xu, J. & Schock, R. Rechargeable Li-S battery with
specific energy 350 Wh/kg and specific power 3000 W/kg. ECS Trans. 13, 53–59
(2008).
29. Akridge, J. R., Mikhaylik, Y. V. & White, N. Li/S fundamental chemistry and
application to high-performance rechargeable batteries. Solid State Ionics 175,
243–245 (2004).
30. Sun, J. et al. Application of gelatin as a binder for the sulfur cathode in lithium–
sulfur batteries. Electrochim. Acta 53, 7084–7088 (2008).
31. Peled, E., Sternberg, Y., Gorenshtein, A. & Lavi, Y. Lithium-sulfur battery:
Evaluation of dioxolane-based electrolytes. J. Electrochem. Soc. 136, 1621–1625
(1989).
32. Shim, J., Striebel, K. A. & Cairns, E. J. The lithium/sulfur rechargeable cell. J.
Electrochem. Soc. 149, A1321 (2002).
33. Rauh, R. D., Abraham, K. M., Pearson, G. F., Surprenant, J. K. & Brummer, S. B.
A lithium/dissolved sulfur battery with an organic electrolyte. J. Electrochem. Soc.
126, 523–527 (1979).
34. Mikhaylik, Y. Electrolytes for lithium sulfur cells. US Pat. 7,553,590 (2009). At
<http://www.google.com/patents?hl=en&lr=&vid=USPAT7553590&id=UJHHAA
AAEBAJ&oi=fnd&dq=electrolytes+for+lithium+sulfur+cells&printsec=abstract>
35. Henderson, W. A. Crystallization kinetics of Glyme−LiX and PEO−LiX polymer
electrolytes. Macromolecules 40, 4963 (2007).
36. Kim, S., Jung, Y. & Park, S.-J. Effects of imidazolium salts on discharge
performance of rechargeable lithium-sulfur cells containing organic solvent
electrolytes. J. Power Sources 152, 272–277 (2005).

120
37. Kim, S., Jung, Y. & Park, S.-J. Effect of imidazolium cation on cycle life
characteristics of secondary lithium-sulfur cells using liquid electrolytes.
Electrochim. Acta 52, 2116–2122 (2006).
38. Marmorstein, D. et al. Electrochemical performance of lithium/sulfur cells with
three different polymer electrolytes. J. Power Sources 89, 219–226 (2000).
39. Xiong, S., Kai, X., Hong, X. & Diao, Y. Effect of LiBOB as additive on
electrochemical properties of lithium–sulfur batteries. Ionics (Kiel). 18, 249–254
(2011).
40. Peled, E. & Yamin, H. Solid electrolyte interphase (SEI) electrodes:
Lithium/polysulfide-THF system. Power Sources 8, 101–115 (1981).
41. Aurbach, D. et al. On the surface chemical aspects of very high energy density,
rechargeable Li-S batteries. J. Electrochem. Soc. 156, A694–A702 (2009).
42. Brummer, S. Low temperature lithium/sulfur secondary battery... 68 (1975). At
<http://scholar.google.com/scholar?hl=en&btnG=Search&q=intitle:Low+temperat
ure+lithium/sulfur+secondary+battery#2>
43. Kumaresan, K., Mikhaylik, Y. & White, R. E. A mathematical model for a
lithium–sulfur cell. J. Electrochem. Soc. 155, A576 (2008).
44. Cheon, S.-E. E. et al. Rechargeable lithium sulfur battery. J. Electrochem. Soc.
150, A800–A805 (2003).
45. Yamin, H. & Peled, E. Electrochemistry of a nonaqueous lithium/sulfur cell. J.
Power Sources 9, 281–287 (1983).
46. Yamin, H., Gorenshtein, A., Penciner, J., Sternberg, Y. & Peled, E. Lithium sulfur
battery. Oxidation/reduction mechanisms of polysulfides in THF solutions. J.
Electrochem. Soc 135, 1045–1048 (1988).
47. Kolosnitsyn, V. S., Karaseva, E. V, Amineva, N. A. & Batyrshina, G. A. Cycling
lithium-sulfur batteries. Russ. J. Electrochem. (Translation Elektrokhimiya) 38,
329–331 (2002).
48. Tudron, F. B., Akridge, J. R. & Puglisi, V. J. Lithium-Sulfur Rechargeable
Batteries: Characteristics, state of development, and applicability to powering
portable electronics. Power Corp. Tucson AZ 1–4 (2004). at
<http://www.sionpower.com/pdf/articles/PowerSources2004.pdf>
49. Affinito, J. Developing Li-S Chemistry for High Energy Rechargeable Batteries. in
Symp. Energy Storage Beyond Lithium Ion III Mater. Perspect. 85756, 35 (2010).

121
50. ASTM. Standard test method for carbon black — oil absorption number of
compressed sample (COAN) 1. 7–10 (2012). doi:10.1520/d3493-09