Ref. No.: GIC Re/SE/2020-21/Q3-IMP Date: April 07, 2021
26
Ref. No.: GIC Re/SE/2020-21/Q3-IMP To , The Manager Listing Department BSE Limited Phiroze Jeejeebhoy Tower Dalal Street Mumbai - 400001 Scrip Code: (BSE - 540755/ NSE - GICRE) Dear Sir/Madam, Date: April 07, 2021 The Manager Listing Department GICRe The National Stock Exchange of India Ltd. Exchange Plaza, 5 th Floor, Plot C/ 1, G Block, Bandra Kurla Complex Mumbai - 400051 Sub.: Investor Presentation - 03 FY 2020-21 Financial Results Presentation With reference to above captioned subject, please find attached herewith Investor Presentation - Q3 FY 2020-21 Financial Results Presentation. The same will also be available on the website of the Corporation at www.gicofindia.com. This is for your information and record. Thanking You. For General Insurance Corporation of India (Suchita Gupt~ CS & CFO & Compliance Officer Encl. A/A "+I I'<~ ll fflt1Rt1f aftin° Pi" l+I (1flffl~~ci,q';ft) General Insurance Corporation of India (Government of India Company) CIN NO.: L67200MH1972GOI016133 IRDA REGN No.: 112 "Wffl", 170, ~ - cTcTm, ~. ~-400 020 . "SURAKSHA", 170, J. Tata Road, Churchgate, Mumbai - 400 020 . INDIA Te l.: +91 -22-2286 7000 www.gicofindia .in '!"', ..... -""""'.lt""'
Transcript of Ref. No.: GIC Re/SE/2020-21/Q3-IMP Date: April 07, 2021

Ref. No.: GIC Re/SE/2020-21/Q3-IMP
To, The Manager Listing Department BSE Limited Phiroze Jeejeebhoy Tower Dalal Street Mumbai - 400001
Scrip Code: (BSE - 540755/ NSE - GICRE)
Dear Sir/Madam,
Date: April 07, 2021
The Manager Listing Department
~~
GICRe
The National Stock Exchange of India Ltd. Exchange Plaza, 5th Floor, Plot C/1, G Block, Bandra Kurla Complex Mumbai - 400051
Sub.: Investor Presentation - 03 FY 2020-21 Financial Results Presentation
With reference to above captioned subject, please find attached herewith Investor Presentation - Q3 FY 2020-21 Financial Results Presentation.
The same will also be available on the website of the Corporation at www.gicofindia.com.
This is for your information and record.
Thanking You.
For General Insurance Corporation of India
~~ (Suchita Gupt~
CS & CFO & Compliance Officer
Encl. A/A
"+I I'<~ ll fflt1Rt1f aftin° Pi" l+I (1flffl~~ci,q';ft)
General Insurance Corporation of India (Government of India Company) CIN NO.: L67200MH1972GOI016133 IRDA REGN No.: 112
"Wffl", 170, ~ -cTcTm, ~. ~-400 020.
"SURAKSHA", 170, J. Tata Road, Churchgate, Mumbai - 400 020. INDIA Tel.: +91 -22-2286 7000 www.gicofindia.in
~ '!"',.....-""""'.lt""'

Q3 FY 2021Financial Results PresentationMumbai

Safe Harbour
2
Except for the historical information contained herein, statements in this presentation and the
subsequent discussions, which include words or phrases such as "will", "aim", "will likely result", "would",
"believe", "may", "expect", "will continue", "anticipate", "estimate", "intend", "plan", "contemplate", seek
to", "future", "objective", "goal", "likely", "project", "should", "potential", "will pursue", and similar
expressions of such expressions may constitute "forward-looking statements“. Such forward-looking
statements are subject to certain risks and uncertainties like government actions, local, political or
economic developments, technological risks, and many other factors that could cause actual results to
differ materially from those contemplated by the relevant forward-looking statements. GIC Re will not be
in any way responsible for any action taken based on such statements and undertakes no obligation to
publicly update these forward-looking statements to reflect subsequent events or circumstances.

Agenda
Market Review1
Strategic Overview2
Financial Performance3
3
Market Review
4

How Reinsurance Works?
5
Benefits
expenses
Part of
benefits expenses
Premium
revenue
Part of
premium revenue
Tran
sfer o
f R
isk
Policyholders
Customers’
individual risk exposures
Direct Insurers
Preferably similar risks
with independent loss events to obtain a balanced insurance
portfolio
Reinsurers
Primary insurers cede
actuarial and catastrophe risks to limit undiversifiable
risk exposure
Reinsurers retrocede
part of the reinsurance premiums to limit risk exposure
Retrocessionaire
Source: Torben, Juul & Andersen, “Managing Economic Exposures of Catastrophe and Terrorism Risk: International Financing Solu tions”, Conference on Catastrophic Risks & Insurance, November 2004

Reinsurance Industry - Role
6
GIC Re has been playing a key role in the Indian reinsurance market and able to
maintain about 60% share in the Indian reinsurance market.
Providing insurers capacity
to write more: proportional
Providing insurers protection
against bottom line volatility:
non-proportional – major
risks
Providing insurers protection
against balance sheet
protection:
non-proportional -
catastrophe
Reinsurance support aims at
3
1
2
Reinsurance is the foundation for economic growth
through risk transfer mechanism
The risks flow through insurers to reinsurers
Insurance is written on the strength of reinsurance
support
Reinsurer insulates himself from the insurer’s adverse
financial performance
Reinsurers have devices to guard against anti-selection
1
2
3
4
5

Global Scenario
▪ Size of the reinsurance market in 2018 was
US$255 bn and is forecast to hit US$319
bn by the end of 2025
▪ Reinsurance prices hardened for June
renewals amid lower retro capacity
▪ A.M. Best has maintained its stable outlook
for the global reinsurance sector on the
back of positive rate momentum across a
broad range of non-life classes of business
▪ In the current environment, marked by
years of accumulating catastrophic losses,
investment market losses, and significant
losses expected as a result of the
pandemic, there is potential for double-
digit reinsurance price increases to extend
into 2021
Source: A.M. Best; National financial supervisory authorities, insurance associations and statistical offices, Thomson Reuters, Allianz Research ; Valuates Report 7
5.8%
-0.5%
9.7%
1.7% 2.2% 3.2%
6.80%
-2.30%
6.80%
4.30% 4.20% 4.30%
CAGR 2009-19 2019
* The conversion into EUR is based on 2019 exchange rates.
5.8%
0.9%
8.1%
2.2%
3.2%
4.4%5.4%
1.5%
8.0%
2.1%
3.8%4.5%
5.60%
1.10%
8.10%
2.20%
3.50%
4.40%
Rest of the
world
Japan Asia ex Japan Western
Europe
North America World
CAGR 2020-30 Life CAGR 2020-30 P&C CAGR 2020-30 Total
Gross Written Premium* growth, by region

Reinsurance industry in India
Source: GlobalData; IRDAI 8
GIC Re is the largest
player in India and leads
most of the domestic
companies' treaty
programmes and facultative placements
Gross written premiums
of general insurance
industry in 2019-20:
₹1,89,216 crore
Retention ratio of
industry in 2018-19:
59.8%
Insurance penetration
increased marginally to
3.70% in FY 2018-19 from
3.69% in FY 2017-18
Crop insurance has
become the third largest
line of non-life business,
after motor and health
insurance

Domestic Operating Environment
Source: IRDAI; GlobalData; Research Trades 9
Budget 2020
▪ 100% foreign direct investment (FDI) was permitted for insurance intermediaries.
▪ Expansion of Ayushman Bharat scheme to fulfil existing gaps in secondary and tertiary healthcare will play a huge role in increasing awareness and acceptance of health insurance amongst all sections of the society.
GIC Re expected
to maintain
market leadership
going forward on
strong financials, adequate
capacity and
expertise
Reinsurance
premiums in
India is expected
to touch
Rs 989.75 billion by 2025
India’s general
insurance market
is estimated to
grow at a
compound annual growth
rate (CAGR) of
6.2% during
2019-2023.

Combined Ratio – Indian non-life insurance
Source: Council Compilation as per source data submitted by companies 10
119.7%
125.6%
117.0%
111.6% 110.6%
114.2%117.6%
122.0%
113.9%
119.3%
2009-10 2010-11 2011-12 2012-13 2013-14 2014-15 2015-16 2016-17 2017-18 2018-19
Combined Ratio - Overall
114.7%
103.5% 103.7%
113.9%120.2%
107.0%
116.0%119.3%
General Insurers Standalone Health Insurers Specialised Insurers Overall
Combined Ratio (Split by Type of Insurer)
2017-18 2018-19

Strategic Overview
11

Competitive Strategy Pillars
12
▪ Geographical Diversification
▪ Lines of Business Diversification
▪ Continued focus on Risk Selection
▪ Deployment of Modelling and Pricing
Techniques and Tools
▪ Modelling accumulation of exposures
▪ Rebalancing the risk portfolio
▪ Well-rated retrocession counterparties
▪ Recruitment of Experts
▪ Low attrition rate
▪ Healthy Investment Income
▪ Diversified Investment Portfolio
▪ Effective Asset Liability Management
▪ Conservative Claim Reserving
▪ Following best practices such as
conducting stress test to assess
resilience
▪ Continued Obligatory cessions & Order
of Preference
▪ Long term relationship with the market
▪ Well-positioned to exploit all
opportunities
Prudent
Underwriting
Exposure
Management
Talent
Management
Efficient Asset
Management
Effective Risk
Management
Dominant Indian
market position

Impact due to Covid-19
13
Financial Impact on GIC Re
▪ There is no major impact that we see in life portfolio and is manageable till date
▪ Though the impact will be clear over time, GIC Re has started loading additional margin for
any negative impact due to Covid-19
The Covid-19 disruption and the subsequent lockdown imposed by the government has
significantly impacted the non-life insurance industry’s premiums
▪ Fire: Despite slowdown in economy resulting from Covid-19, fire premium is likely to see a
growth in domestic sector due to increase in rates imposed across all occupancies.
▪ Motor: Claims are expected to decline as fewer vehicles are plying on the road amid
lockdown. Moreover, hike in third-party motor premiums proposed by the IRDAI is also
likely to cushion the increasing claim losses. However, dropping auto volumes may result in
significant drop in motor insurance premiums.
▪ Health & Miscellaneous: The impact of Covid-19 will be felt on new retail PA business,
event cancellation, Loss of Profit covers, and film production covers as these type of
covers may not be placed in the market thus adversely affecting the premium growth.
▪ Equity Investments: No major impact as markets have recovered.
▪ Debt Instruments: No new credit event or default has occurred till date.

Strategic Approach
▪ GIC Re to leverage its position of 12th rank based on the scale it affords and excellent credit rating domestically.
▪ The Company stands to benefit from price hardening in select segments / geographies.
▪ Indian market with its unprecedented growth, particularly in agriculture and health affords an opportunity to
leverage GIC Re balance sheet.
▪ Solvency pressures on Indian insurance market players could lead to higher reinsurance cessions, growing the
reinsurance market size which would provide GIC Re an opportunity to sustain its market share.
▪ Phased adoption of modelling capabilities to ensure better exposure management and deriving value extraction
from it.
▪ Greater volatility countered through conservative reserving.
▪ Continued focus on underwriting profitability through
▪ Class-specific evaluation
▪ Weeding out the contracts with inadequate pricing
▪ Incentivisation based on individual company / contract performance
▪ Industry Performance
▪ Adoption of IIB rates and resultant increase in price as a factor.
▪ Listing of insurers will lead to greater bottom line focus.
▪ Leverage Lloyd’s platform to expand GIC Re presence in international markets.
14

Financial Performance
15

Financials at a glance
16
Particulars Q3 FY21 Q3 FY20 9M FY21 9M FY20 FY20
Gross Premium 11,668.51 11,539.96 38,201.56 41,812.29 51,030.13
Profit After Tax 987.42 (1,069.64) 660.00 (1,556.50) (359.09)
Incurred Claims Ratio 89.6% 108.4% 94.9% 99.1% 97.5%
Combined ratio 108.5% 130.4% 114.0% 115.9% 114.4%
Solvency Ratio (times) 1.53 1.51 1.53 1.51 1.53
₹ crore

Key Financials
17
Particulars Q3 FY21 Q3 FY20 9M FY21 9M FY20 FY20
Gross Premium 11,668.51 11,539.96 38,201.56 41,812.29 51,030.13
Net Premium 10,485.32 9,772.76 33,956.67 38,215.52 46,655.41
Earned Premium 9,139.16 7,828.47 32,292.34 36,476.66 44,145.43
Incurred Claims 8,192.95 8,486.67 30,651.56 36,148.44 43,035.86
Incurred claims ratio (on earned premium) 89.6% 108.4% 94.9% 99.1% 97.5%
Net Commission 1,916.29 2,120.59 6,284.41 6,089.09 7,508.35
Net Commission Percentage (on Net Premium) 18.3% 21.7% 18.5% 15.9% 16.1%
Expenses of Management 77.52 52.85 200.52 281.58 373.01
Expenses of Management ratio (on net premium) 0.7% 0.5% 0.6% 0.7% 0.8%
Profit/(Loss) on Exchange 12.94 65.83 (110.84) 171.27 424.03
Underwriting Profit/(Loss) (1,022.64) (2,749.44) (4,953.35) (5,903.60) (6,367.18)
Investment Income 2,624.47 2,018.99 6,534.65 5,216.00 7,125.48
Other Income less Outgo (84.99) (335.48) (463.39) (859.46) (1,204.28)
Profit Before Tax 1,516.84 (1,065.93) 1,117.90 (1,547.06) (445.97)
Provision for Taxation 529.42 3.71 457.90 9.44 (86.88)
Profit After Tax 987.42 (1,069.64) 660.00 (1,556.50) (359.09)
Combined Ratio % 108.5% 130.4% 114.0% 115.9% 114.4%
₹ crore

Break-up of Gross Premium
18
Gross Premium H1 FY21 H1 FY20 Growth %
A) Fire 11,270.37 9,014.70 25.0%
B) Miscellaneous - Total 24,099.78 30,666.84 -21.4%
Misc - Motor 6,739.41 7,318.56 -7.9%
Misc - Health 4,234.95 4,435.41 -4.5%
Misc - Agriculture 8,860.06 14,835.56 -40.3%
Misc - Other LOBs 4,265.36 4,077.31 4.6%
C) Marine 1,941.97 1,444.98 34.4%
Marine - Cargo 1,085.69 749.10 44.9%
Marine - Hull 856.28 695.88 23.0%
D) Life 889.44 685.77 29.7%
Total – A+B+C+D 38,201.56 41,812.29 -8.6%
Gross Premium Breakup Incurred Claims Combined Ratio (%)
9M FY21 Share (%) 9M FY20 Share (%) Growth (%) 9M FY21 9M FY20 9M FY21 9M FY20
Domestic 25,214.16 66.0% 31,264.75 74.8% -19.4% 20,280.74 26,544.24 111.28 110.96
International 12,987.39 34.0% 10,547.53 25.2% 23.1% 10,370.82 9,604.20 119.29 129.88
Total 38,201.56 100% 41,812.29 100% -8.6% 30,651.56 36,148.44 114.01 115.76
₹ crore
₹ crore
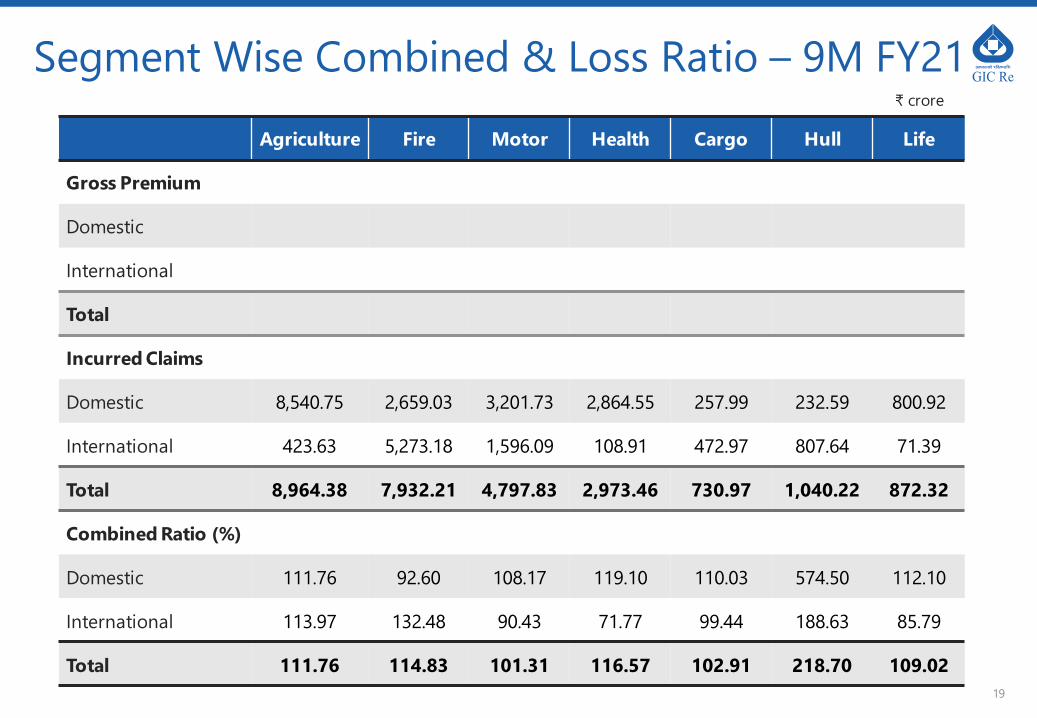
Segment Wise Combined & Loss Ratio – 9M FY21
19
Agriculture Fire Motor Health Cargo Hull Life
Gross Premium
Domestic
International
Total
Incurred Claims
Domestic 8,540.75 2,659.03 3,201.73 2,864.55 257.99 232.59 800.92
International 423.63 5,273.18 1,596.09 108.91 472.97 807.64 71.39
Total 8,964.38 7,932.21 4,797.83 2,973.46 730.97 1,040.22 872.32
Combined Ratio (%)
Domestic 111.76 92.60 108.17 119.10 110.03 574.50 112.10
International 113.97 132.48 90.43 71.77 99.44 188.63 85.79
Total 111.76 114.83 101.31 116.57 102.91 218.70 109.02
₹ crore

Domestic Business Mix
20
27.0% 25.0% 28.0% 27.0%
73.0% 75.0% 72.0% 73.0%
FY 17 FY 18 FY 19 FY 20
Obligatory Non-Obligatory
• Obligatory cessions continue to remain at 5% with no monetary limits on cessions.
• GIC Re Health portfolio comprises mostly of Obligatory cessions, some selective domestic treaties and
selective Pradhan Mantri Jan Arogya Yojana Abhiyan Schemes besides business written by the Foreign
branches.

Key Financials (1/2)
21
33,585.44
41,799.37 44,238.00
51,030.13
FY 17 FY 18 FY 19 FY 20
30,174.56
37,634.46 38,995.97
46,655.41
FY 17 FY 18 FY 19 FY 20
Gross Premium Net Premium
81.0%86.5% 89.5%
97.5%
FY 17 FY 18 FY 19 FY 20
3,127.67 3,233.58
2,224.31
-359.09
FY 17 FY 18 FY 19 FY 20
Incurred Claims Ratio Profit After Tax
₹ crore₹ crore
₹ crore

Key Financials (2/2)
22
17,946.63
21,525.9222,334
.42 20,529.45
FY 17 FY 18 FY 19 FY 20
47,982.94
51,360.1952,765.05
35,425.80
FY 17 FY 18 FY 19 FY 20
Net Worth Excl. FVC Net Worth Incl. FVC Policyholders’ Funds
41,681
.87
52,821
.86
58,500
.31
72,830
.00
FY 17 FY 18 FY 19 FY 20
₹ crore ₹ crore ₹ crore
2.40
1.72
2.06
1.53
FY 17 FY 18 FY 19 FY 20
17.4315.02
9.96
-1.75
FY 17 FY 18 FY 19 FY 20
Solvency Ratio Return on Equity %
99.70
104.00105.86
114.37
FY 17 FY 18 FY 19 FY 20
Combined Ratio %

Appendix
23

Glossary
24
Ceding Company (Cedant) The company that transfers its risk to a reinsurer
Combined Ratio The sum of the loss ratio and the expense ratio
Earned Premiums The portion of the premium for which protection has been provided
Excess of Loss ReinsuranceA form of reinsurance, which, subject to a specified limit, indemnifies the ceding
company for the amount of loss in excess of a specified retention
Expense RatioSum of acquisition costs and other operating expenses, in relation to premiums
earned
Facultative Reinsurance
Reinsurance of individual risks by offer and acceptance wherein the reinsurer retains
the ability to accept or reject and individually price each risk offered by the ceding company
Incurred but not reported
losses (IBNR)
An actuarial estimate of amounts required to pay ultimate net losses that refers to
losses that have occurred but have not yet been fully and finally settled/paid
Loss RatioRatio of total losses incurred (paid and reserved) in claims plus adjustment
expenses divided by the total premiums earned
Obligatory TreatyA reinsurance contract under which the subject business must be ceded by the
insurer in accordance with contract terms and must be accepted by the reinsurer
RetrocessionA transaction in which a reinsurer transfers risks it has reinsured to another
reinsurer
Treaty Reinsurance The ceding company transfers all risks within a book of business to the reinsurer

25
Thank You
For details please contact:
Janet
Chief Manager T: + 91 22 22867597E: [email protected]
Binay Sarda
Christensen Investor RelationsT: + 91 22 4215 0210E: [email protected]