Reengineering a trans-national paper process through IT ... · challenge even bigger when it is...
115
Reengineering a trans-national paper process through IT automation Giovanni Porcu M.Sc. in International Technology Management Center for Industrial Production Allborg University
Transcript of Reengineering a trans-national paper process through IT ... · challenge even bigger when it is...
Reengineering a trans-national paper process through IT
automation
Giovanni Porcu
M.Sc. in International Technology Management
Center for Industrial Production
Allborg University

ii
- Empty page -
iii
Title: Reengineering a trans-national paper process through
IT automation
Supervisor: Harry Boer
Project period: 12/07/2010 – 31/05/2011
Pages: 115
Number of appendixes: 3
Deadline: 31/05/2011 10.00 AM
Master’s Thesis author:
Giovanni Porcu
______________
International Technology Management
Centre for Industrial Production - Aalborg University
The reports contents are confidential. Publication requires permission by author and
company.
Abstract:
Nissan Europe SAS (NESAS) is engaged in the after-sales
business selling parts and accessories on the market. The
accessories are produced by external suppliers under
requirements and specifications given by NESAS Conversion
& Accessories Engineering. In order to be sold on market,
accessories need to be homologated and a process is set-up
for this purpose. Several divisions of the company, which are
located worldwide, are involved in the process and contribute
by providing input to the process in form of data. The process
is currently paper-based with a working document which is
updated by all departments involved. In order to improve
overall performance of the process in terms of visibility, data-
sharing, communication and user-friendliness, a BPR project
is launched. This Thesis presents a solution to reengineer the
paper-based process and automate it through the use of an IT
application built on existent IT resources available company-
wise. The reengineering activity is conducted by a
reengineering team based on a 4-phases framework developed
for this case, which starts from Analysis of the process, its
Redesign, Implementation of the reengineered process and
Evaluation. The steps to follow and the main factors to
consider when automating a cross-divisional paper data-flow
are described in this Thesis.
Abstract:

iv
- Empty page -
v
Executive Summary
Global companies are counting more and more on global processes, which are crossing
departments‘ and involve divisions located worldwide. Although IT development gave a
great contribution to improve internal processes within departments or divisions borders,
cross-divisional processes, especially when they manage information, are often let to
responsible people who perform them based on their experience. Information and data
flow through the organisation, being the trigger for important business processes. Many
paper processes are executed without a sufficient control and many knowledge workers
in global companies base their work on that amount of information which is not
controlled and most of the times unclear and poorly understood.
Nissan Europe bases its process for European homologation of accessories on a paper
flow. That paper is issued in France printed, filled-in, scanned and sent to UK, Japan and
Switzerland, where the same operations are done. Once many copies of that paper has
been printed and sent, that is eventually lost, abandoned or trashed.
Homologation is the enabler for accessories enable their sales of accessories on a
European scale: what if something goes wrong in the paper-process?
Most of the times a paper process is hidden and, as a result, its consequences are also
hidden, until the moment they occur. In this case:
No European homologation = No sales all over Europe.
Automating a process is a matter of change. Many companies struggle trying to
implement process changes which stay within departments‘ borders making the
challenge even bigger when it is about reengineering a transnational process.
A Business Process Reengineering project was launched to turn the paper-based
homologation process for accessories into an electronic process. Replacing a paper
process with an electronic process is not just a technological problem, but mainly a
managerial problem, as it is about changing people‘s actions. This Master‘s Thesis
proposes the steps and techniques to follow in order to reengineer a transnational
business process. An electronic application was developed to manage a redesigned
process meeting the objectives, which are often management‘s concerns about
technology: reliability of the solution and compatibility.

vi
- Empty page -
vii
Abstract
Nissan Europe SAS (NESAS), divisione Europea di Nissan Motor Ltd, è presente, per
mezzo della Divisione After Sales, nel business Automotive After Market attraverso la
vendita di parti ed accessori. La vendita di accessori a livello europeo avviene previa
omologazione WVTA (Whole Vehicle Type Approval), basata sulla normativa Europea
di riferimento. NESAS C&A Engineering esegue uno specifico processo per ottenere
l‘omologazione WVTA degli accessori attraverso il coinvolgimento di vari dipartimenti
e divisioni localizzati in Francia, Gran Bretagna, Giappone e Svizzera. Il processo è
interamente basato su un documento cartaceo sul quale il personale dei vari dipartimenti
coinvolti nel processo indica quali accessori possono essere omologati, sulla base di
giudizi di natura tecnica e commerciale. Con l‘obiettivo di migliorare l‘efficienza del
processo, la sua visibilità e la condivisione dei necessari documenti tecnici che vengono
scambiati tra i vari dipartimenti, il processo deve essere riorganizzato, in particolar modo
attraverso l‘utilizzo di opportune soluzioni informatiche. Questa Tesi di Laurea è basata
sul lavoro condotto per la riorganizzazione del processo di omologazione degli accessori
e presenta l‘applicazione di teorie, concetti e metodi utilizzati nel campo del Business
Process Reengineering. Il progetto di riorganizzazione del processo prevede l‘utilizzo di
una soluzione compatibile con l‘esistente piattaforma informatica, adottata dalle varie
divisioni di Nissan Motor Ltd a livello globale. L‘intero progetto, condotto da un team
composto di quattro persone del dipartimento NESAS C&A Engineering, si articola in
quattro fasi, che sono: analisi del processo esistente, sviluppo della nuova soluzione,
implementazione e successiva valutazione. La Tesi di Laurea ha l‘obiettivo di
individuare le tecniche da utilizzare e le azioni da eseguire in modo da implementare una
nuova soluzione per lo specifico problema, rappresentato dall‘automazione dell‘esistente
processo interdipartimentale di omologazione degli accessori per il mercato Europeo.
viii
Preface
This Master Thesis is written based on a project conducted during an internship at
Nissan Europe SAS in France. The work has been conducted in the Engineering
department during the period from July 2010 to May 2011 and is submitted as final long
project for 3rd
and 4th semesters of the Master‘s Programme in International Technology
Management at Aalborg University. References are done according to the Harvard
methodology (Author, Year).
I would like to express my gratitude and thank the following people for having
contributed and supported this project:
- Section Manager Michel Cedolin, for his guidance during my entire internship
and for having provided me lot of learning opportunities;
- Section Manager Michael Thewissen, for all explanations on the process and the
overall WVTA homologation activity;
- Section Manager Louis du Garreau, for having attended many meetings and
having provided precious inputs to this project;
- Manager Pascal Constant, for his explanations, support and sponsorship during
the entire project;
A special thanks to Dr Harry Boer, supervisor of this project, for having offered his
guidance through the entire work conducted for this Thesis, his insight and suggestions
on all theoretical aspects and a series of precious feedbacks.
ix
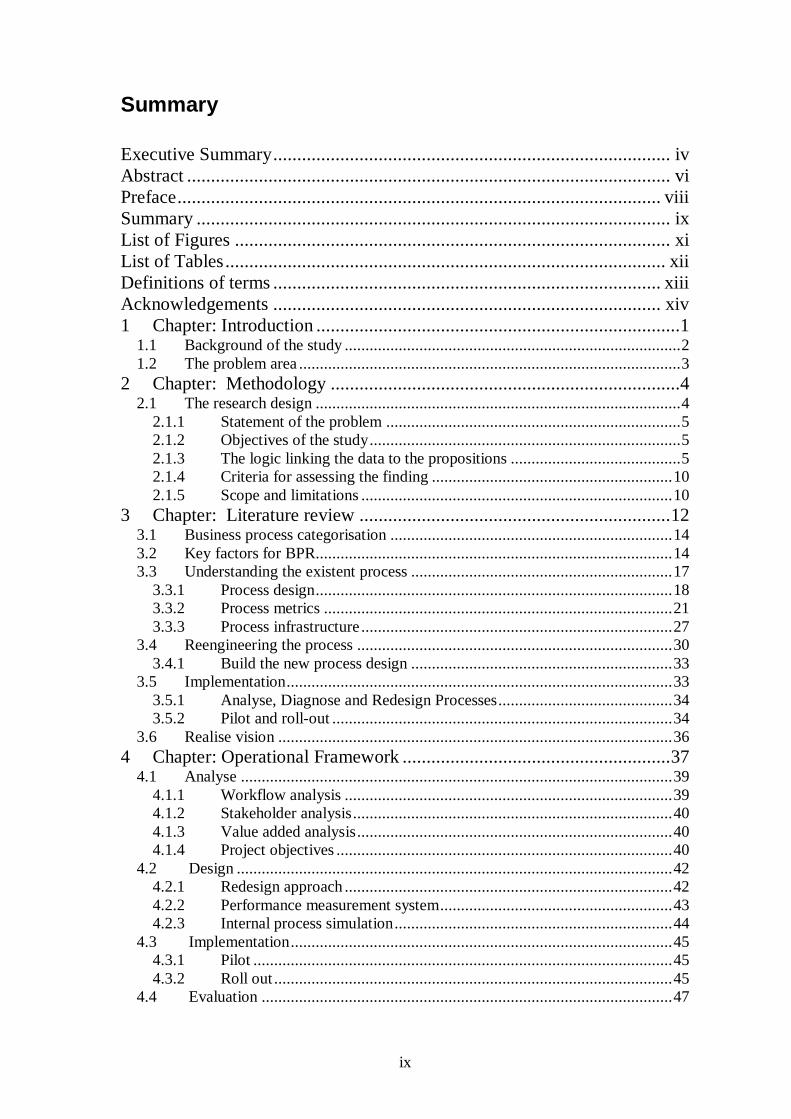
Summary
Executive Summary ................................................................................... iv
Abstract ..................................................................................................... vi
Preface ..................................................................................................... viii
Summary ................................................................................................... ix
List of Figures ........................................................................................... xi
List of Tables ............................................................................................ xii
Definitions of terms ................................................................................. xiii
Acknowledgements ................................................................................. xiv
1 Chapter: Introduction ............................................................................1
1.1 Background of the study ................................................................................. 2
1.2 The problem area ............................................................................................ 3
2 Chapter: Methodology .........................................................................4
2.1 The research design ........................................................................................ 4
2.1.1 Statement of the problem ....................................................................... 5
2.1.2 Objectives of the study ........................................................................... 5
2.1.3 The logic linking the data to the propositions ......................................... 5
2.1.4 Criteria for assessing the finding .......................................................... 10
2.1.5 Scope and limitations ........................................................................... 10
3 Chapter: Literature review ................................................................. 12
3.1 Business process categorisation .................................................................... 14
3.2 Key factors for BPR...................................................................................... 14
3.3 Understanding the existent process ............................................................... 17
3.3.1 Process design ...................................................................................... 18
3.3.2 Process metrics .................................................................................... 21
3.3.3 Process infrastructure ........................................................................... 27
3.4 Reengineering the process ............................................................................ 30
3.4.1 Build the new process design ............................................................... 33
3.5 Implementation ............................................................................................. 33
3.5.1 Analyse, Diagnose and Redesign Processes .......................................... 34
3.5.2 Pilot and roll-out .................................................................................. 34
3.6 Realise vision ............................................................................................... 36
4 Chapter: Operational Framework ........................................................ 37
4.1 Analyse ........................................................................................................ 39
4.1.1 Workflow analysis ............................................................................... 39
4.1.2 Stakeholder analysis ............................................................................. 40
4.1.3 Value added analysis ............................................................................ 40
4.1.4 Project objectives ................................................................................. 40
4.2 Design ......................................................................................................... 42
4.2.1 Redesign approach ............................................................................... 42
4.2.2 Performance measurement system ........................................................ 43
4.2.3 Internal process simulation ................................................................... 44
4.3 Implementation ............................................................................................ 45
4.3.1 Pilot ..................................................................................................... 45
4.3.2 Roll out ................................................................................................ 45
4.4 Evaluation ................................................................................................... 47
x
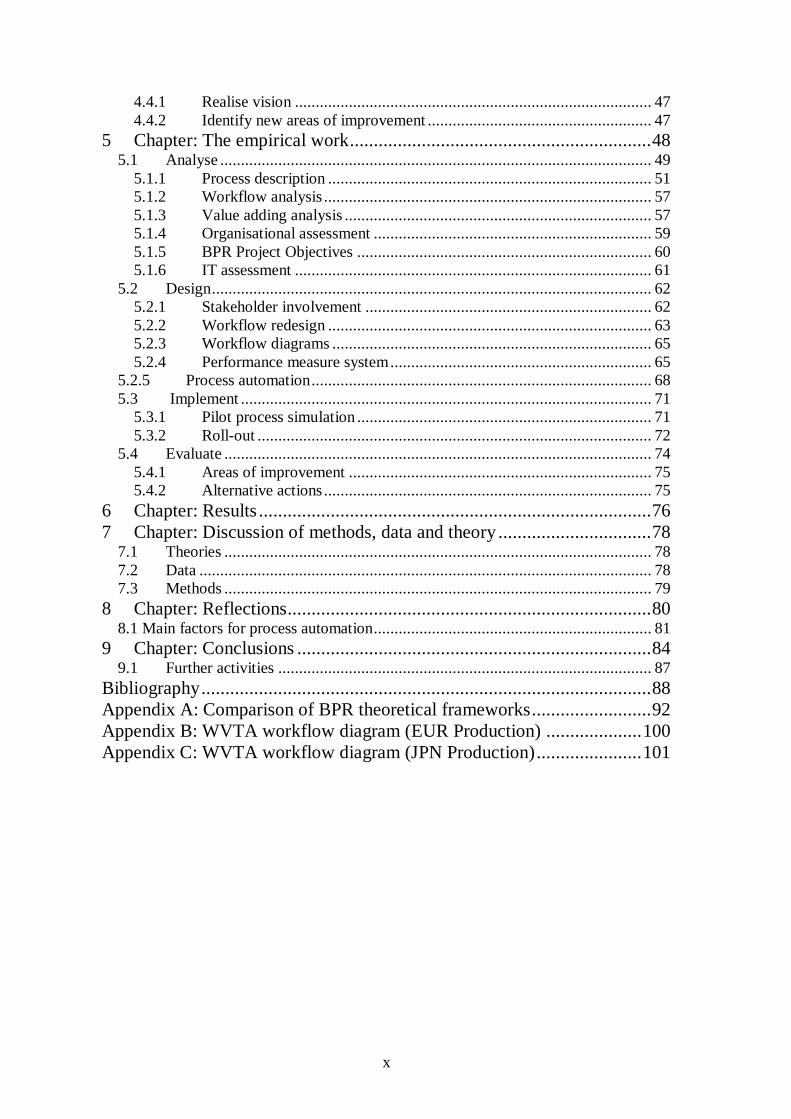
4.4.1 Realise vision ...................................................................................... 47
4.4.2 Identify new areas of improvement ...................................................... 47
5 Chapter: The empirical work ............................................................... 48
5.1 Analyse ........................................................................................................ 49
5.1.1 Process description .............................................................................. 51
5.1.2 Workflow analysis ............................................................................... 57
5.1.3 Value adding analysis .......................................................................... 57
5.1.4 Organisational assessment ................................................................... 59
5.1.5 BPR Project Objectives ....................................................................... 60
5.1.6 IT assessment ...................................................................................... 61
5.2 Design .......................................................................................................... 62
5.2.1 Stakeholder involvement ..................................................................... 62
5.2.2 Workflow redesign .............................................................................. 63
5.2.3 Workflow diagrams ............................................................................. 65
5.2.4 Performance measure system ............................................................... 65
5.2.5 Process automation .................................................................................. 68
5.3 Implement ................................................................................................... 71
5.3.1 Pilot process simulation ....................................................................... 71
5.3.2 Roll-out ............................................................................................... 72
5.4 Evaluate ....................................................................................................... 74
5.4.1 Areas of improvement ......................................................................... 75
5.4.2 Alternative actions ............................................................................... 75
6 Chapter: Results .................................................................................. 76
7 Chapter: Discussion of methods, data and theory ................................ 78
7.1 Theories ....................................................................................................... 78
7.2 Data ............................................................................................................. 78
7.3 Methods ....................................................................................................... 79
8 Chapter: Reflections............................................................................ 80
8.1 Main factors for process automation ................................................................... 81
9 Chapter: Conclusions .......................................................................... 84
9.1 Further activities .......................................................................................... 87
Bibliography .............................................................................................. 88
Appendix A: Comparison of BPR theoretical frameworks ......................... 92
Appendix B: WVTA workflow diagram (EUR Production) .................... 100
Appendix C: WVTA workflow diagram (JPN Production) ...................... 101
xi
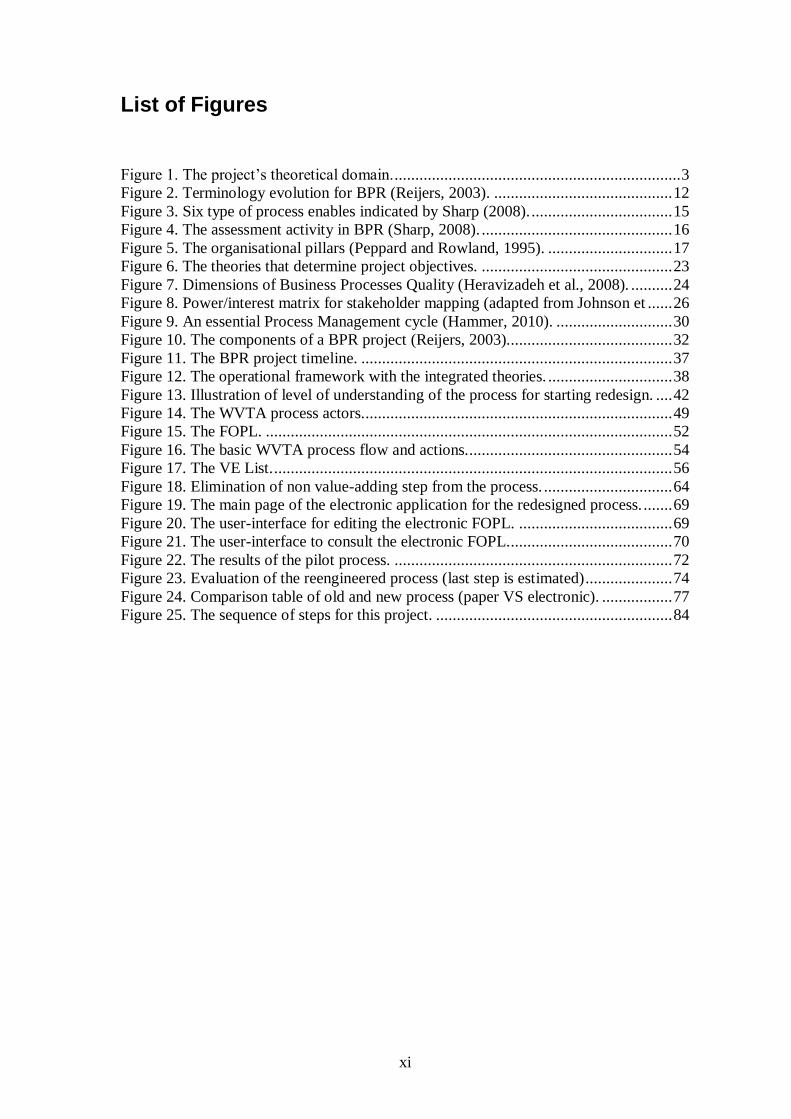
List of Figures
Figure 1. The project‘s theoretical domain...................................................................... 3
Figure 2. Terminology evolution for BPR (Reijers, 2003). ........................................... 12
Figure 3. Six type of process enables indicated by Sharp (2008). .................................. 15
Figure 4. The assessment activity in BPR (Sharp, 2008). .............................................. 16
Figure 5. The organisational pillars (Peppard and Rowland, 1995). .............................. 17
Figure 6. The theories that determine project objectives. .............................................. 23
Figure 7. Dimensions of Business Processes Quality (Heravizadeh et al., 2008). .......... 24
Figure 8. Power/interest matrix for stakeholder mapping (adapted from Johnson et ...... 26
Figure 9. An essential Process Management cycle (Hammer, 2010). ............................ 30
Figure 10. The components of a BPR project (Reijers, 2003)........................................ 32
Figure 11. The BPR project timeline. ........................................................................... 37
Figure 12. The operational framework with the integrated theories. .............................. 38
Figure 13. Illustration of level of understanding of the process for starting redesign. .... 42
Figure 14. The WVTA process actors. .......................................................................... 49
Figure 15. The FOPL. .................................................................................................. 52
Figure 16. The basic WVTA process flow and actions.................................................. 54
Figure 17. The VE List. ................................................................................................ 56
Figure 18. Elimination of non value-adding step from the process. ............................... 64
Figure 19. The main page of the electronic application for the redesigned process. ....... 69
Figure 20. The user-interface for editing the electronic FOPL. ..................................... 69
Figure 21. The user-interface to consult the electronic FOPL........................................ 70
Figure 22. The results of the pilot process. ................................................................... 72
Figure 23. Evaluation of the reengineered process (last step is estimated) ..................... 74
Figure 24. Comparison table of old and new process (paper VS electronic). ................. 77
Figure 25. The sequence of steps for this project. ......................................................... 84
xii
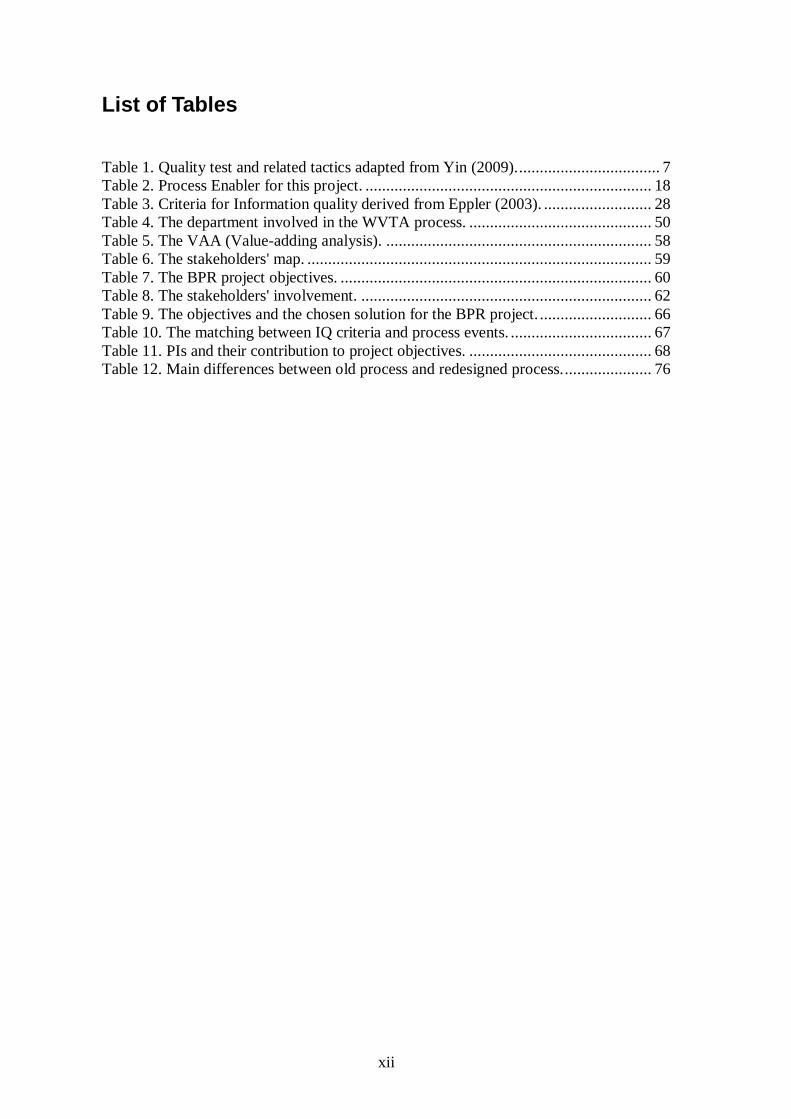
List of Tables
Table 1. Quality test and related tactics adapted from Yin (2009). .................................. 7
Table 2. Process Enabler for this project. ..................................................................... 18
Table 3. Criteria for Information quality derived from Eppler (2003). .......................... 28
Table 4. The department involved in the WVTA process. ............................................ 50
Table 5. The VAA (Value-adding analysis). ................................................................ 58
Table 6. The stakeholders' map. ................................................................................... 59
Table 7. The BPR project objectives. ........................................................................... 60
Table 8. The stakeholders' involvement. ...................................................................... 62
Table 9. The objectives and the chosen solution for the BPR project. ........................... 66
Table 10. The matching between IQ criteria and process events. .................................. 67
Table 11. PIs and their contribution to project objectives. ............................................ 68
Table 12. Main differences between old process and redesigned process. ..................... 76
xiii
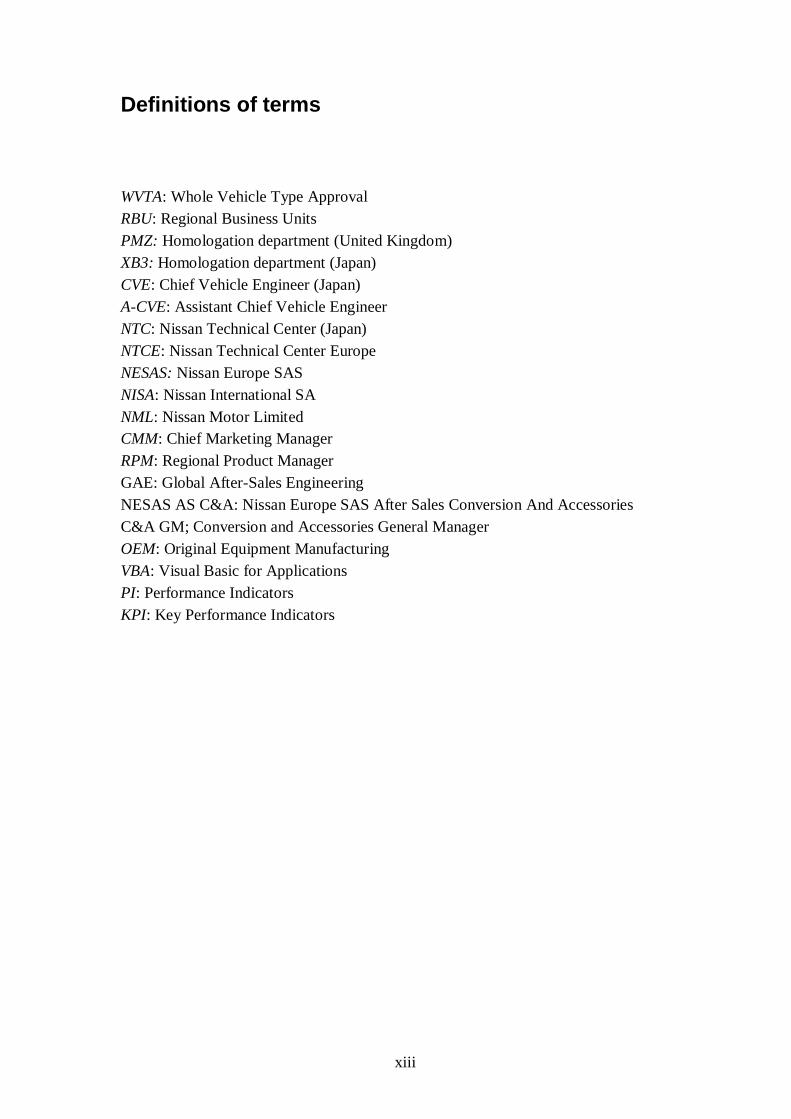
Definitions of terms
WVTA: Whole Vehicle Type Approval
RBU: Regional Business Units
PMZ: Homologation department (United Kingdom)
XB3: Homologation department (Japan)
CVE: Chief Vehicle Engineer (Japan)
A-CVE: Assistant Chief Vehicle Engineer
NTC: Nissan Technical Center (Japan)
NTCE: Nissan Technical Center Europe
NESAS: Nissan Europe SAS
NISA: Nissan International SA
NML: Nissan Motor Limited
CMM: Chief Marketing Manager
RPM: Regional Product Manager
GAE: Global After-Sales Engineering
NESAS AS C&A: Nissan Europe SAS After Sales Conversion And Accessories
C&A GM; Conversion and Accessories General Manager
OEM: Original Equipment Manufacturing
VBA: Visual Basic for Applications
PI: Performance Indicators
KPI: Key Performance Indicators

xiv
Acknowledgements
When preparing this Master‘s Thesis, I was working in the NESAS C&A After Sales
Division, where also the Engineering department is located. I have been in contact with
many people, who have contribute to this project, providing me support and explanations
to get a good insight on the topic, but also by offering me great opportunities of leaning
in a unique multicultural work environment: thanks to the entire After Sales Division.
A special thanks to my supervisor Michel Cedolin for having supported me during my
project and challenged by providing me many other learning opportunities during my
1-year internship, which was a great experience.
I owe my deepest gratitude to my parents who have supported me all the way since the
beginning of my studies.
A special thanks to all my family and my uncle Onorato, who would have loved to see
this Master‘s Thesis concluded.
Giovanni Porcu
1
1 Chapter: Introduction
This Chapter gives an introduction to the Master’s Thesis introducing the background of
the study and the related problem area.
Globalization and delocalization are phenomenons which are changing the business
world in the last two decades. Companies are forced into change if they want to be
successful in their businesses. Change a company to make it global also means to change
its processes. The automotive industry is particularly affected by these phenomenons
that see carmakers becoming global players, running their business on a global scale
(Mentuccia, 2010).
Besides, authorities and governments are making pressure on automotive companies to
comply with even more strict and articulated regulations. Thus, carmakers are striving to
adjust their processes accordingly, in order to improve their efficiency and their ability
to meet the new requirements (McGarrahan and Harris, 2008).
As a result, they are investing a lot of resources in research and product development
processes, often neglecting all the remaining ones. In addition, the more ―visible‖ is a
process and its output, the more evident may be its need of improvement. Information
and data processes are most of the times ―hidden‖ processes, especially when they are
based on paper and run through different departments and divisions. Often, information
and data flows are left to an appointed responsible person, meaning that lot of space is
left to one‘s ―ability‖ and inventive. Rather than regulating these information and data
processes, companies prefer count on someone‘s hands, determining, in most of the
cases, the unclearness of these processes.
Carmakers, on global scale, count on a high number of hidden processes to exchange
data and information among divisions and departments. Many ―knowledge workers‖ in
the automotive industry base their work just on the huge amount of data and information,
which flows through the organisation. Most of the times, the data and information flows
are not sufficiently regulated and controlled: we cannot even say how many documents,
papers and forms transit on the desks of a certain organisation every day! But it does
happen. When processes are less ―visible‖, as information and data processes on paper,
their possible failure and consequences are most of the times hidden, until the moment
they occur.
Then, the question is: why don‘t we get rid of paper and automate these processes?
More than on the technological side, the challenge lies on the change management area,
as automating a paper process means changing the actions people do to execute it. The
challenge for managers is even bigger when this change has to cross the department‘s
borders. In the following Chapters is introduced the solution developed for a global
company in order to automate a cross-divisional data flow based on paper.
2
1.1 Background of the study
This Master‘s Thesis is based on the work done during a 1-year internship at Nissan
Europe SAS, based Montigny le Bretonneux. Nissan Europe SAS is the holding
company for European subsidiaries and pan-European operational support of Nissan
Motor Company Ltd (Nissan, 2010). The work was conducted at the Engineering
department, which is part of the After Sales Conversion and Accessories (AS C&A)
division.
The After Sales (AS) division is engaged in the parts and accessories (e.g alloy wheels,
parking systems, alarms, etc...) development and sales for after-market business in
Europe, Russia and Turkey.
The Aftermarket business is seen with different perspectives by carmakers. Some pay
high attention to it, while some others don‘t think it is a critical business function
(Mentuccia, 2010). However, consideration of after-sales business among companies is
lately increasing as the customers‘ trend is to postpone new vehicle purchase and hold
on their cars for a longer time. That increases the importance of the After-sales business
as a source of profit and as a mean to feed customer loyalty (Mentuccia, 2010).
With the aftermarket business, carmakers are engaged in providing parts, accessories
and service to their customers. Accessories are most of the times manufactured by
suppliers based on carmaker specifications. In order to be able to sell the accessories, car
manufacturers must ensure if the accessories need to be homologated or not and, if so,
proceed with the homologation. Accessories can be sold if homologated against national
standards/requirements or against European standards. EU set a regulation WVTA
(Whole Vehicle Type Approval) aiming at harmonizing the different national
homologation systems present in the EU countries (WVTA, 2010), allowing thus a
carmaker to sell all over Europe a vehicle WVTA homologated, with no need of
additional national homologation.
The entire division coordinates its activities according to the NESAS After-Sales
development process which indicates process flow, roles and responsibilities of the
different departments.
Nissan Europe is in charge of different activities for the accessories business, which are
carried out by purchasing, engineering, marketing, quality and pricing departments.
All internal activities and task related to the accessories business are described by the
NESAS After-Sales development process, which includes the process for WVTA
Homologation of accessories. The latter is described by the ―Procedures manual for EC-
WVTA homologation of option parts‖. If accessories are WVTA homologated they can
be sold in all European countries with no limitation and substituting national
homologation.
This project carried out as a BPR activity consists in the creation and implementation of
an electronic process for WVTA homologation of accessories which aims at replacing
the existing paper-based process.
3
1.2 The problem area
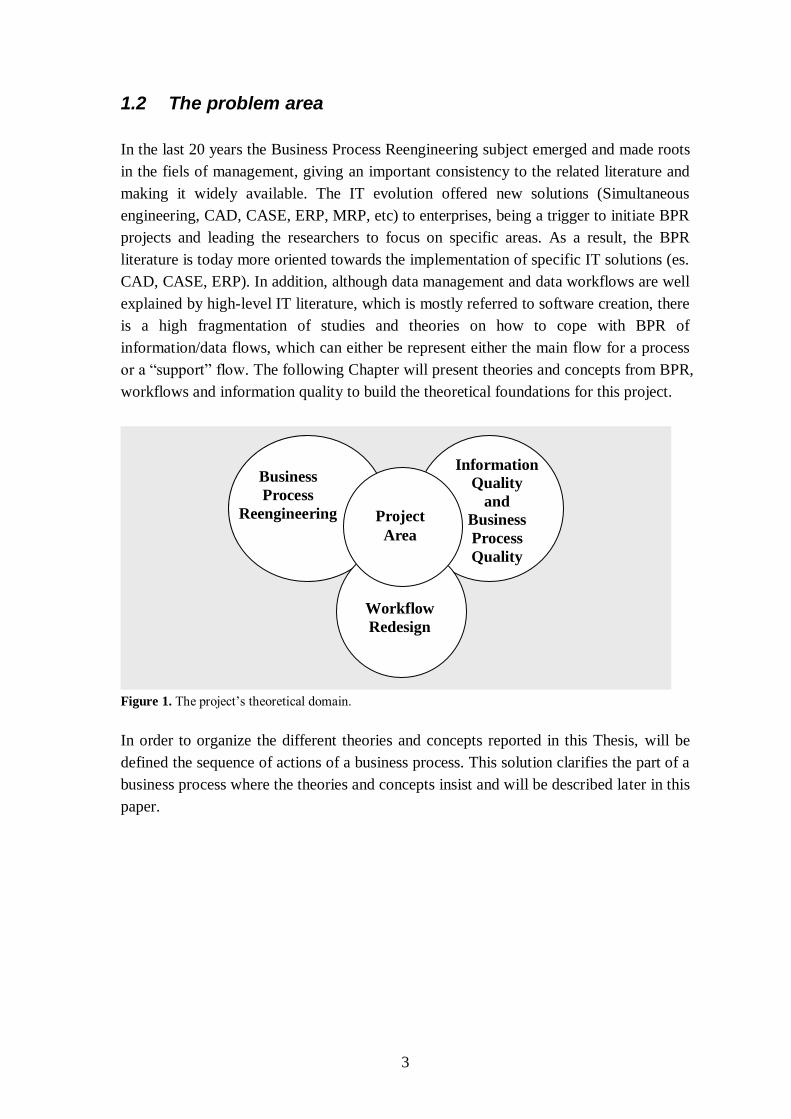
In the last 20 years the Business Process Reengineering subject emerged and made roots
in the fiels of management, giving an important consistency to the related literature and
making it widely available. The IT evolution offered new solutions (Simultaneous
engineering, CAD, CASE, ERP, MRP, etc) to enterprises, being a trigger to initiate BPR
projects and leading the researchers to focus on specific areas. As a result, the BPR
literature is today more oriented towards the implementation of specific IT solutions (es.
CAD, CASE, ERP). In addition, although data management and data workflows are well
explained by high-level IT literature, which is mostly referred to software creation, there
is a high fragmentation of studies and theories on how to cope with BPR of
information/data flows, which can either be represent either the main flow for a process
or a ―support‖ flow. The following Chapter will present theories and concepts from BPR,
workflows and information quality to build the theoretical foundations for this project.
Figure 1. The project‘s theoretical domain.
In order to organize the different theories and concepts reported in this Thesis, will be
defined the sequence of actions of a business process. This solution clarifies the part of a
business process where the theories and concepts insist and will be described later in this
paper.
Project
Area
Business
Process
Reengineering
Information
Quality
and
Business
Process
Quality
Workflow
Redesign
4
2 Chapter: Methodology
This Chapter describes the methodology followed to conduct this project and introduces
the research design adopted to solve a specific company problem.
This Master‘s Thesis is based on a project conducted to elaborate a solution for a
problem of a case company. The problem was represented by a business process to be
automated, requiring a Business Process Reengineering initiative, which consists of
mainly two parts: analysis of an existent situation and design of a new solution. For the
purpose of this thesis, the analysis part is approached as case study analysis. A case
study can be done on a organisational process and a specific research design has to be
developed, being a plan to link the empirical data collected to the initial research
question and, eventually, to its conclusions (Yin, 2009). According to Yin (2009), there
are five components which are particularly important for a research design, namely:
1. Study‘s questions, with questions as ―what‖, ―why‖ and ―how‖ that result the
most appropriated for the case study method;
2. Theirs propositions, if any, which set the direction of the study catalysing the
attention on the what should be examined within the scope of the study;
3. The unit(s) of analysis, which defines what the case ―is‖;
4. The logic linking the data to the propositions;
5. The criteria for interpreting the finding.
The research design elaborated for this project follows the path indicated by Yin (2009)
with its five components and it is described in the next Section.
2.1 The research design
The study questions for this Master‘s Thesis are presented in form of problem statement
and related objectives of the study, respectively in sub-subsection 2.1.1 and 2.1.2. The
propositions set the direction of the study and consist of analysing the existing process
for WVTA homologation of accessories, understanding its basic and automate it in order
to increase the overall process performance. The unit of analysis is the process for
WVTA homologation of accessories, which is a cross-divisional paper data flow.
The components of the research design and explained more in details in sub-subsections
2.1.3 and 2.1.4.
5
2.1.1 Statement of the problem
The problem statement for this project was formulated as follows:
―What are the main steps to follow and the techniques to use when reengineering and
automating a cross-divisional business process which manages a paper data flow?‖
2.1.2 Objectives of the study
Based on the case of the process for WVTA homologation for accessories, the project
tries to achieve several objectives:
1. To analyze the current process, including performance, and identify areas of
improvement;
2. To study what are the improvements that can be made by using an electronic
process as replacement of the existing paper-based process;
3. To design and develop several alternatives for improving the process;
4. To propose the Business Process Reengineering (BPR) design in order to
improve performance through the elimination of unnecessary steps or actions and,
by consequence, reduce the number of follow-ups requested by process users;
5. To implement the re-engineered process through a simulation to test its
efficiency and identify improvements so that the real process will not be affected.
2.1.3 The logic linking the data to the propositions
The research design used for the purpose of the project aims at linking the data to the
propositions conducting two different activities, which were the process analysis and its
redesign. The analysis had the objective to define the ―as-is‖ situation on the basis of the
analysis of the existent process. Once the ―as-is‖ situation was determined, a redesign
study followed aiming at defining the ―to-be‖ situation, represented by a new design for
the process.
Case analysis
The case study approach is used to conduct the analysis part of this project. It includes
data collection, validation and analysis to understand the existing process for WVTA
homologation of accessories. The components of the case study analysis are described in
further details below here.
Data collection
6
To conduct the case analysis different types of sources and materials were consulted,
such as field notes, manuals, written and electronic working documents, forms and
interviews. The paper documents consulted were:
- Procedures manual for EC-WVTA option parts homologation
- Working documents used for the process, which were FOPL (Full Option
Part List) and VE (Vehicle Enhancement) List;
Then, the two types of interviews mostly used for this project are, as defined by Barlow
(2009):
- Unstructured interviews, stimulating stakeholders to present what they knew
about some topics using open-ended question and verbal or non-verbal
encouragers (e.g slides);
- Focus groups, which were carefully moderated to get some knowledge and
relevant information about some topics; field notes were extensively used.
Key persons were selected in order to gather information and data, from different
departments, divisions and managerial levels were consulted in order to obtain a high
level of validity and reliability of the information. Key persons interviewed were:
- Michel Cedolin, NESAS C&A Engineering Section Manager;
- Michael Thewissen, NESAS C&A Engineering Section Manager;
- Louis du Garreau, NESAS C&A Business and Product Planning;
- Pascal Constant, NESAS S&A Engineering Manager;
- Kevin Brown, PMZ Engineer;
- Seji Takahashi, XB3 Manager;
- Nobuo Kanazawa, GAE;
- Nobuhisa Sekimoto, GAE;
- Gareth Dunsmore, NISA CMM.
During interviews and focus group, field notes were taken. According to Gambold
(2009), the field notes represent a technique for collecting data and making field work
into a case study: the translation of field work into a case study cannot be successful
without proper field notes.
Data validation
The data collected during this phase of the project have to be questioned in matter of
validity and reliability, as these two aspects represent the key elements to deem in order
to conduct a rigorous research design (Yue, 2009). Validity and reliability determine the
quality of any empirical social research (Yin, 2009), including case studies. As
previously mentioned, the analysis conducted for this project follows a case study
approach and it will then questioned in terms of validity and reliability.
According to Yue (2009), ―validity refers to the extent to which a concept is actually
represented by the indicators of such concepts‖ (no page available for quote citation).
After validity, reliability is the other key element in order to conduct rigorous research
design and, according to Kerry and Street (2009), it ―assesses the extent to which the
7
results and conclusions drawn from a case study would be reproduced if the research
were conducted again‖ (no page available for quote citation).
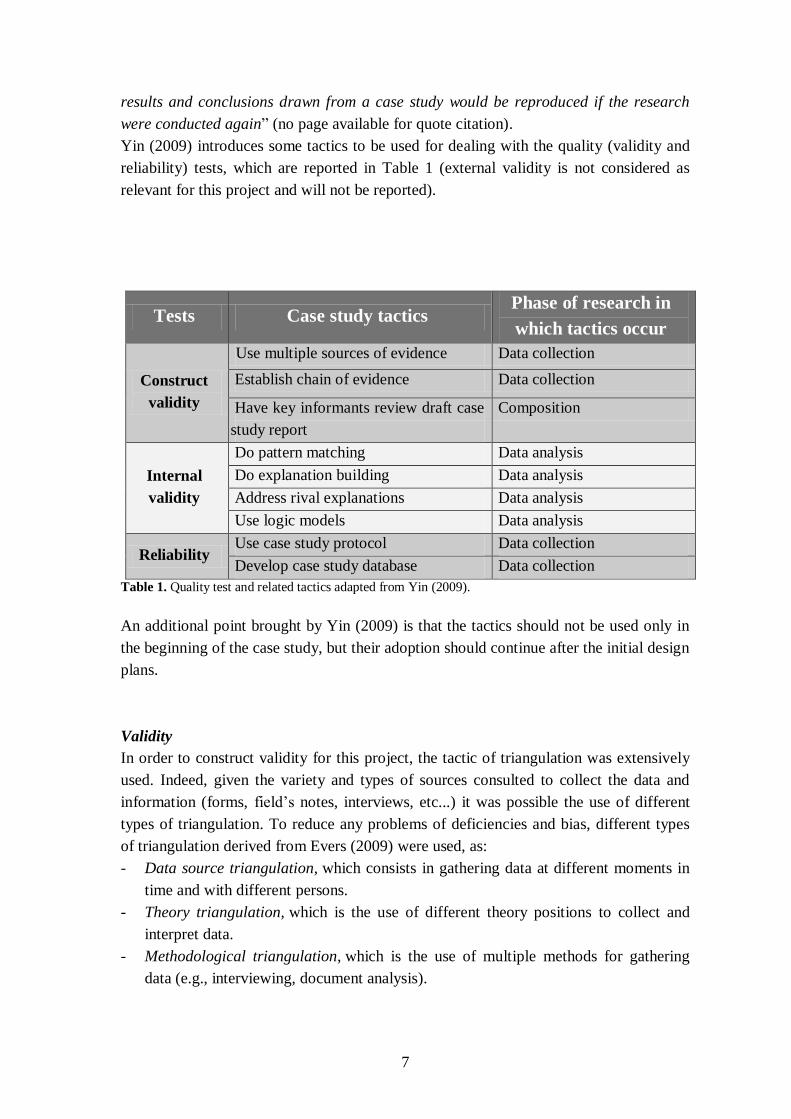
Yin (2009) introduces some tactics to be used for dealing with the quality (validity and
reliability) tests, which are reported in Table 1 (external validity is not considered as
relevant for this project and will not be reported).
Tests Case study tactics Phase of research in
which tactics occur
Construct
validity
Use multiple sources of evidence Data collection
Establish chain of evidence Data collection
Have key informants review draft case
study report
Composition
Internal
validity
Do pattern matching Data analysis
Do explanation building Data analysis
Address rival explanations Data analysis
Use logic models Data analysis
Reliability Use case study protocol Data collection
Develop case study database Data collection
Table 1. Quality test and related tactics adapted from Yin (2009).
An additional point brought by Yin (2009) is that the tactics should not be used only in
the beginning of the case study, but their adoption should continue after the initial design
plans.
Validity
In order to construct validity for this project, the tactic of triangulation was extensively
used. Indeed, given the variety and types of sources consulted to collect the data and
information (forms, field‘s notes, interviews, etc...) it was possible the use of different
types of triangulation. To reduce any problems of deficiencies and bias, different types
of triangulation derived from Evers (2009) were used, as:
- Data source triangulation, which consists in gathering data at different moments in
time and with different persons.
- Theory triangulation, which is the use of different theory positions to collect and
interpret data.
- Methodological triangulation, which is the use of multiple methods for gathering
data (e.g., interviewing, document analysis).
8
- Data type triangulation, that indicates the use of different types of data as manuals,
forms, written documents, field notes and they are a result of the triangulation of
methods.
- Analysis triangulation, which consists of using several separate analytic techniques
to validate the meaning in the data set. Analysis triangulation can also involve
multiple units and levels of analysis (e.g., individuals, families, settings). The
combination of analytic techniques enhances the breadth and depth of what
researchers see in their data.
As just mentioned, it is plain how the type of information and data gathered for this
project and then analysed (manuals, procedures, regulations, field notes, forms and
working documents) was mostly qualitative data.
Relevant importance for this project had the qualitative analysis of the process, which
was carried out at first stage. The sole analysis of the Procedures Manual and the
working documents were not necessary as more information was needed to get a good
insight of the process. Indeed, the manual was written by a former worker of the
department, thus some knowledge was not actually included in the manual as it was
probably taken for granted. Besides, it has to be highlighted the fact that the information
reported in the manual may be not complete as a sole person may neglect some parts or
information.
In order to catch the missing information necessary to have a good understanding of the
process, its stakeholders were constantly interviewed during meetings or at any time it
was needed. The interviews, most of the times, were not organised in form of a set of
questions, but open questions were asked in order to get as much information as possible
and also because the level of knowledge of the interviewer (myself) was not sufficient to
ask precise questions targeted to specific topics (though some case like this did occur).
Reliability
The concept of reliability deals with the reproducibility of the results obtained by a case
study (Kerry and Street, 2009). In other words, it assesses if the same results and
conclusions are obtained if a case study is conducted again. The objective of the
reliability test is to minimize the bias and error during the collection and the analysis of
the data (Kerry and Street, 2009). The analysis part conducted for this project will be
tested in terms of reliability, similarly to how it is done with a case study.
As Yin (2009) suggests, tactics to obtain reliability of a case study are the use of a case
study protocol and the creation of a case study database.
When conducting the case analysis for this project, all steps followed, starting from the
data collection and ending with the results, have been written down in this paper as well
as the procedures and the actions taken. Hence, the process has been translated as a
sequence of actions that should be reproducible, if the context and the initial conditions
are the same. The data collection was conducted using extensively the method of
9
triangulation to reduce the bias and errors and status meetings were continuously done
during the entire project, making several reviews. In addition, meeting minutes were
constantly released to inform about the steps and actions taken for the purposes of this
project. However, the results obtained are also related to the electronic application
developed to best serve the redesigned process, and specific IT skills are required to
reproduce it.
Analysis of the current situation (“as-is”)
An analysis of the data collected was done and in order to avoid bias and error, the
method of triangulation was used also in this phase as well as the other tactics proposed
by Yin (2009). The data was collected and validated by data source, data type and
methodological triangulations. Based on that, concepts and explanations were
elaborated to explain unclear parts of the ―as-is‖ situation, which were mainly related to
the understanding of the current process (e.g. responsible person to perform a certain
action in the process). Explanations were then presented and discussed, mostly during
meetings, in order to get a high degree of validation. During the analysis phase,
whenever any rival explanation emerged, this was properly addressed and conclusions
were elaborated only after discussion.
In order to support and integrate the analysis of the current ―as-is‖ situation, it was
conducted a thorough review of the theories, tools and techniques in:
- Workflow and Business Process Modelling;
- Business Process Management;
- Business Process Reengineering;
- Key performance indicators and balanced scorecards;
- Business Process Management/redesign handbooks;
- Change management theory.
Then, the theories, tools and techniques were used to conduct theory and analysis
triangulations aiming at supporting analysis of the ―as-is‖ situation and build the
foundations for the following redesign study. As it will be further explained in the
Chapter 4, these theories will be integrated in the operational framework used to conduct
this project.
Redesign study
It was conducted an investigation on the IT solutions currently used by the company to
identify a suitable solution for the BPR project described in this paper. The IT solution
for this case study was identified by the reengineering team as a combination of:
- eRoom, which is a platform for data-sharing available company-wise;
10
- Visual Basic for Application, which was used to develop an electronic
application to be shared on the eRoom.
Several alternatives for the new design were proposed during this phase and their
validity was tested by triangulation. The data type triangulation was used to test whether
the solutions proposed by the electronic application were matching the actions the
redesigned process was meant to perform. Then, in order to get high grade validation,
the solutions were also proposed to the reengineering team, which chose the best
solutions among the different alternatives.
2.1.4 Criteria for assessing the finding
The criteria for assessing the finding are case specific. For the purpose of this project
they were established in form of project objectives by the reengineering team, as it will
be explained in the next Chapters. Considering that the solution to propose for the new
designed process was an electronic application, the criteria of interpretation were related
primarily to:
- Reliability, to ensure that the electronic application could support the process
with no failures;
- Compatibility, to ensure that the electronic application was compatible with the
existing technologies.
Later in this paper, it is presented a comparison between result of analysis and results of
the redesign. No precise information were gathered and stored about the performance of
the old process and, therefore, its analysis was done with a qualitative approach.
However, the performance of the new electronic process is measured, creating a
database that will make possible to monitor the process over time.
The next Chapter will present the Literature Review conducted for this case study, which
will be used jointly with an operational framework developed for this case study
according to the research design.
2.1.5 Scope and limitations
The Business Process Reengineering (BPR) project presented in this paper is targeted to
best serve a process designed to get, manage, elaborate and share data used for
homologation process of accessories on Nissan vehicles in Europe.
Scientific literature available on specifically technical and managerial aspects of IT
solutions for reengineering this type of data processes is limited and, as implementation
of IT solutions is continuously and rapidly evolving, the literature is not up-to-date.
11
The study was conducted on the data-flow part of the process, meaning that extending
the research to product-flow of the processes might need more powerful tools for
planning, in & out goods and such (e.g. ERP).
Process analysis was done on working documents and through feedbacks from people
involved, but no opportunity of analyzing a real case has occurred. Thus, some
additional information may be lost.
The solution studied is only targeted to manage communication and result data (outputs)
and it is not managing the physical items and technical and business aspects which are
left to internal studies of the departments (divisions). Inclusion of these other aspects as
material flow and cost may require conventional software packages (e.g. MRP, ERP,
SAP). Besides, the BPR solution hereby presented is also developed specifically the type
of data and the scale of the process for WVTA homologation of accessories performed
by Nissan Europe and, even though is can be used as a base, is not applicable to any
other similar process.
For the purposes of this project it was chosen to use available software packages for all
Nissan divisions involved in the process (MS office 2003 and VB for Application
version 5) and eRoom software version 7). The implementation results are monitored
over a short span of time.
12
3 Chapter: Literature review
This Chapter gives an overview of the literature concepts used for this thesis. BPR is
introduced, then literature is presented on how to understand, analyse and reengineer
business processes with the contribution of theories and concepts picked up from related
study fields.
The Oxford English (OED, 2011) dictionary defines business process re-
engineering (BPR) as “a system or programme for a thorough review and restructuring
of a company's organization and methods, especially so as to exploit the capabilities of
information technology; abbreviated BPR‖.
Business process re-engineering is also indicated with the term business process
redesign, defined as its synonym (BD, 2010).
In the 1990, Hammer (2010) introduced his own work in Business Process
Reengineering (BPR) that later showed a main weakness in not being a continuous
activity, but only episodic. However, Hammer himself highlighted the strength of BPR
in redefine a process attacking delays, non-value adding activity, errors, complexity
(Hammer, 2010). Besides the BPR brought also a different point of view on the matter,
focusing more on the process design than the process execution.
Other than business process re-engineering and business process redesign, other terms
that refer to the same subject can be found in the literature:
- Business process improvement;
- Business process management.
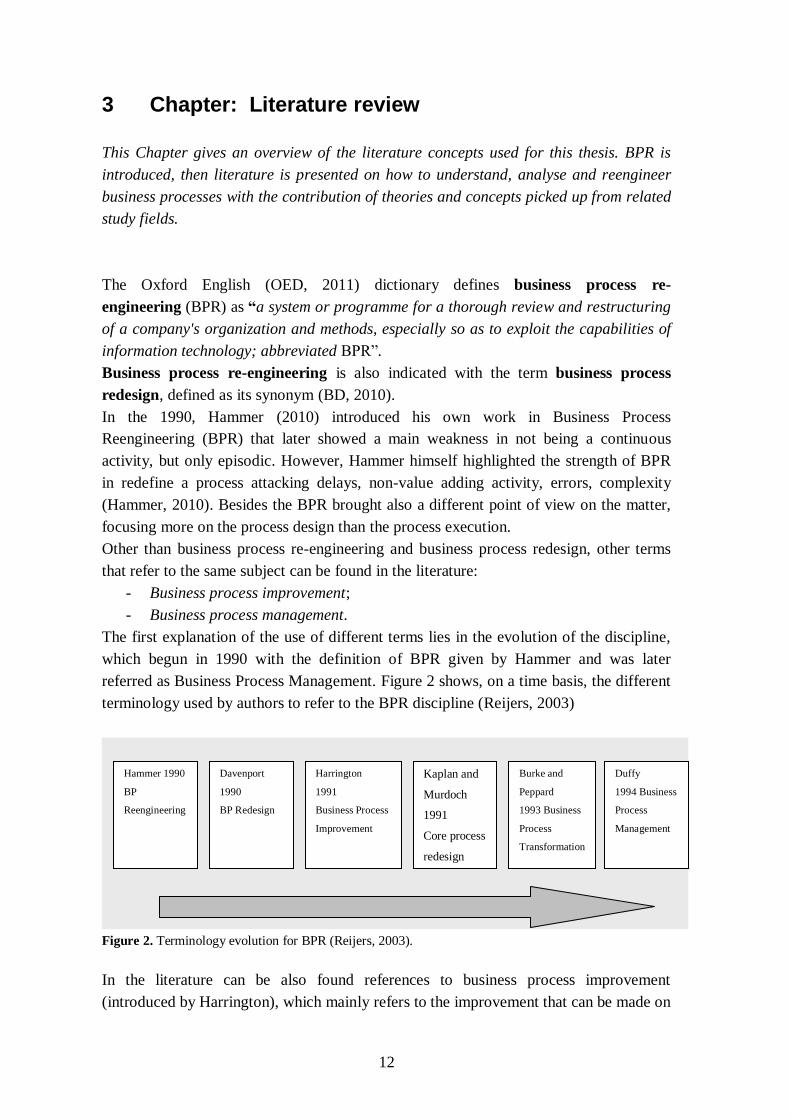
The first explanation of the use of different terms lies in the evolution of the discipline,
which begun in 1990 with the definition of BPR given by Hammer and was later
referred as Business Process Management. Figure 2 shows, on a time basis, the different
terminology used by authors to refer to the BPR discipline (Reijers, 2003)
Figure 2. Terminology evolution for BPR (Reijers, 2003).
In the literature can be also found references to business process improvement
(introduced by Harrington), which mainly refers to the improvement that can be made on
Hammer 1990
BP
Reengineering
Davenport
1990
BP Redesign
Harrington
1991
Business Process
Improvement
Kaplan and
Murdoch
1991
Core process
redesign
Burke and
Peppard
1993 Business
Process
Transformation
Duffy
1994 Business
Process
Management
13
a existent business process as also suggested by its definition: ―Improving quality,
productivity, and response time of a business process, by removing non-value adding
activities and costs through incremental enhancements‖ (the business dictionary).
Business Process Management is instead a much wider subject as it indicates a
comprehensive system for managing and transforming organisational operations. It was
introduced first by Deming and Shewhart dealing with statistical process control which
led to the quality movement and then up to the Six Sigma philosophy (Hammer,2010).
The Business Process Management is the latest concept as Hammer (2010) considers it
the sinthesys of the two approaches of process improvement just mentioned, which are
Shewhart and Deming approaches.
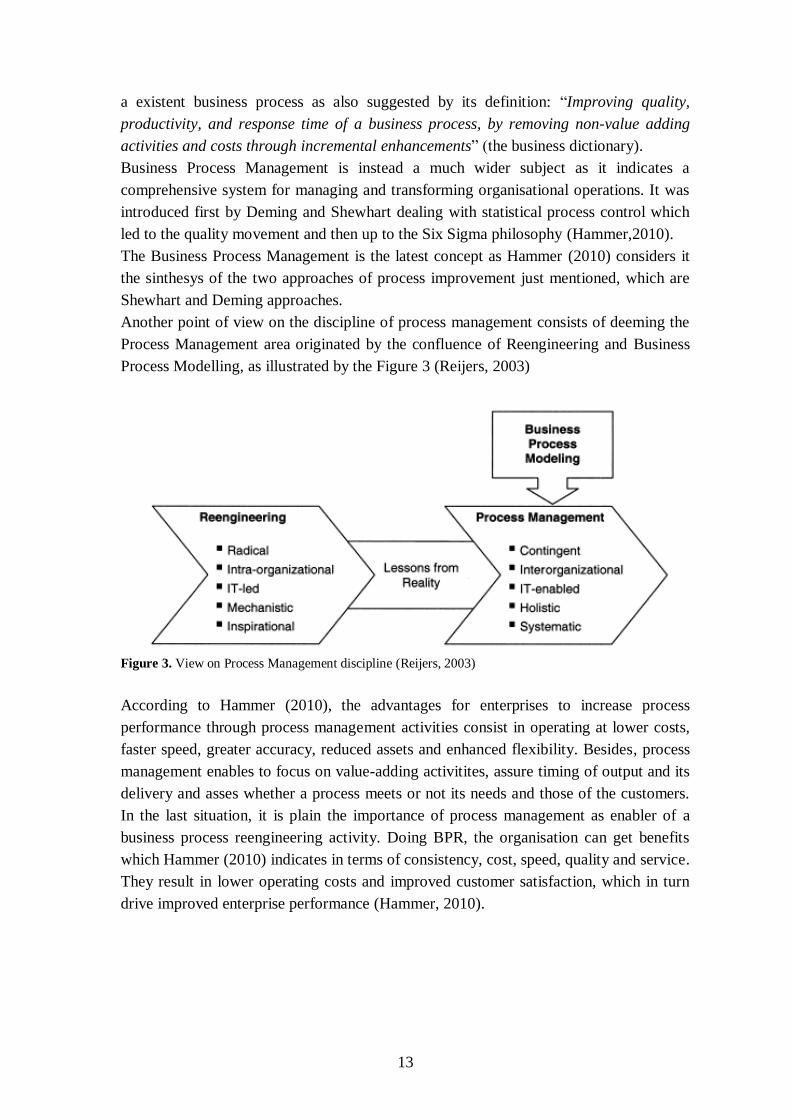
Another point of view on the discipline of process management consists of deeming the
Process Management area originated by the confluence of Reengineering and Business
Process Modelling, as illustrated by the Figure 3 (Reijers, 2003)
Figure 3. View on Process Management discipline (Reijers, 2003)
According to Hammer (2010), the advantages for enterprises to increase process
performance through process management activities consist in operating at lower costs,
faster speed, greater accuracy, reduced assets and enhanced flexibility. Besides, process
management enables to focus on value-adding activitites, assure timing of output and its
delivery and asses whether a process meets or not its needs and those of the customers.
In the last situation, it is plain the importance of process management as enabler of a
business process reengineering activity. Doing BPR, the organisation can get benefits
which Hammer (2010) indicates in terms of consistency, cost, speed, quality and service.
They result in lower operating costs and improved customer satisfaction, which in turn
drive improved enterprise performance (Hammer, 2010).
14
3.1 Business process categorisation
In order to be able to understand a process and assess if there is a need of redesigning, it
has to be classified and further analysed to get deeper knowledge.
Reijers (2003) suggests a first distinction between administrative and manufacturing
processes: the ―business outcome‖ or ―output‖ that is, more explicitly, the process
product, can be either a good, which has a physical manifestation, or a service, which
has not. Hence, a business process that produces goods is more known as a
manufacturing process, while one that delivers a service is commonly classified as a
workflow, service or administrative process.
A business process can be further categorised in terms of execution frequency and level
of standardisation (van der Aalst and van Hee, 2002):
1. Customized process, ad hoc process or project;
2. Mass-customization or production process;
3. Mass-production or transaction process.
In addition, van der Aalst and van Hee (2002) classify the business process depending
on the place where it happens in the organisation, making a distinction among:
1. Primary or production process;
2. Secondary or support processes;
3. Tertiary or managerial processes.
3.2 Key factors for BPR
Having introduced the classification of a business process, its analysis can proceed
further. Hammer (2010) suggests the key factors for BPM, which are also considered as
the enablers of a process and the organizational capabilitites for a process.
The process enablers, which are critical for high performance processes are:
1. Process design, which indicates the specifications of the process (Who, what,
when, where, with what info, etc);
2. Process metrics, which are the base to set targets and measure process
performance;
3. Process performers, who are people with a specific set of skills suitable to realize
the process and achieve its goals;
4. Process infrastructure, which are the IT and HR systems that support the
performers when carrying out their process functions (e.g. ERP, training,
compensation systems, etc..);
5. Process owner, who should be a person with authority and responsibility for the
process across the entire organisation (e.g. senior manager).
15
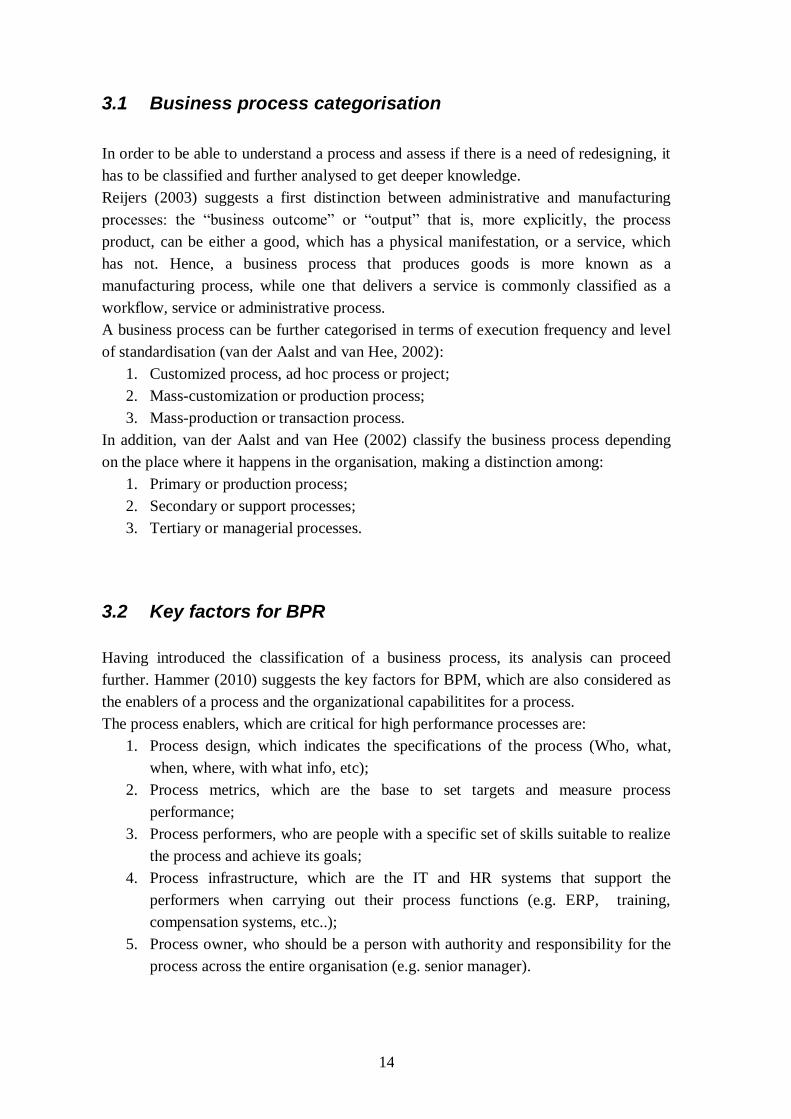
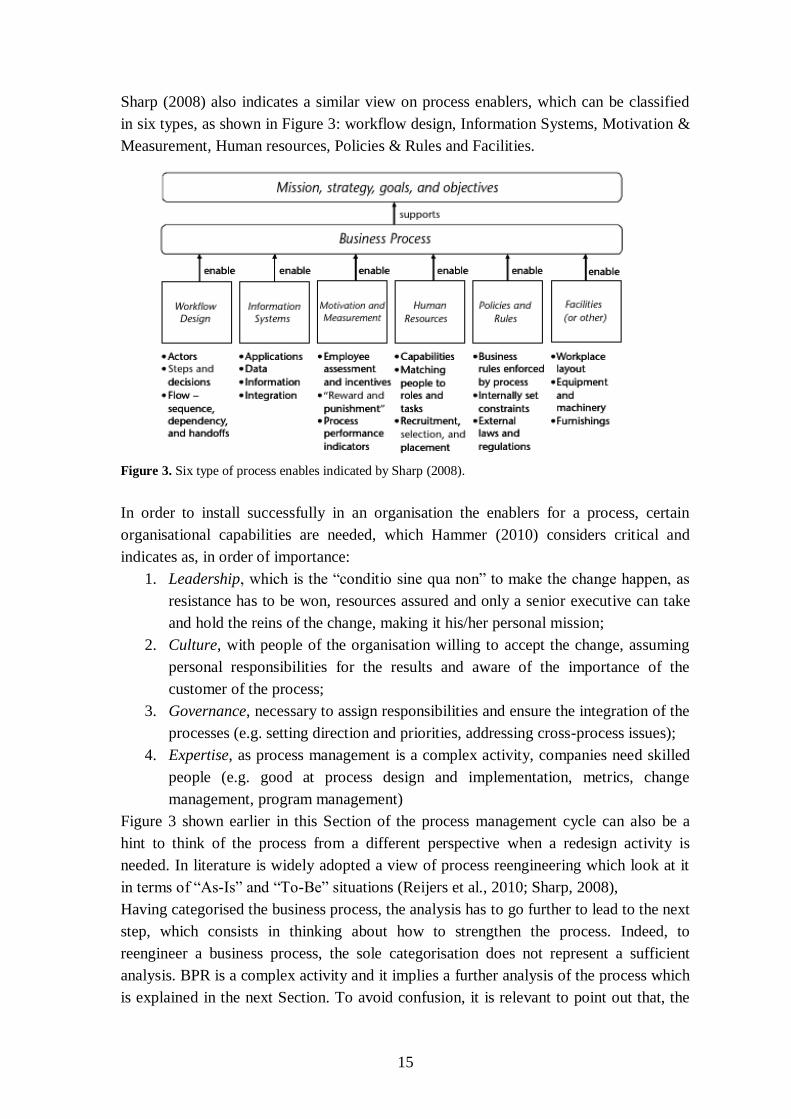
Sharp (2008) also indicates a similar view on process enablers, which can be classified
in six types, as shown in Figure 3: workflow design, Information Systems, Motivation &
Measurement, Human resources, Policies & Rules and Facilities.
Figure 3. Six type of process enables indicated by Sharp (2008).
In order to install successfully in an organisation the enablers for a process, certain
organisational capabilities are needed, which Hammer (2010) considers critical and
indicates as, in order of importance:
1. Leadership, which is the ―conditio sine qua non‖ to make the change happen, as
resistance has to be won, resources assured and only a senior executive can take
and hold the reins of the change, making it his/her personal mission;
2. Culture, with people of the organisation willing to accept the change, assuming
personal responsibilities for the results and aware of the importance of the
customer of the process;
3. Governance, necessary to assign responsibilities and ensure the integration of the
processes (e.g. setting direction and priorities, addressing cross-process issues);
4. Expertise, as process management is a complex activity, companies need skilled
people (e.g. good at process design and implementation, metrics, change
management, program management)
Figure 3 shown earlier in this Section of the process management cycle can also be a
hint to think of the process from a different perspective when a redesign activity is
needed. In literature is widely adopted a view of process reengineering which look at it
in terms of ―As-Is‖ and ―To-Be‖ situations (Reijers et al., 2010; Sharp, 2008),
Having categorised the business process, the analysis has to go further to lead to the next
step, which consists in thinking about how to strengthen the process. Indeed, to
reengineer a business process, the sole categorisation does not represent a sufficient
analysis. BPR is a complex activity and it implies a further analysis of the process which
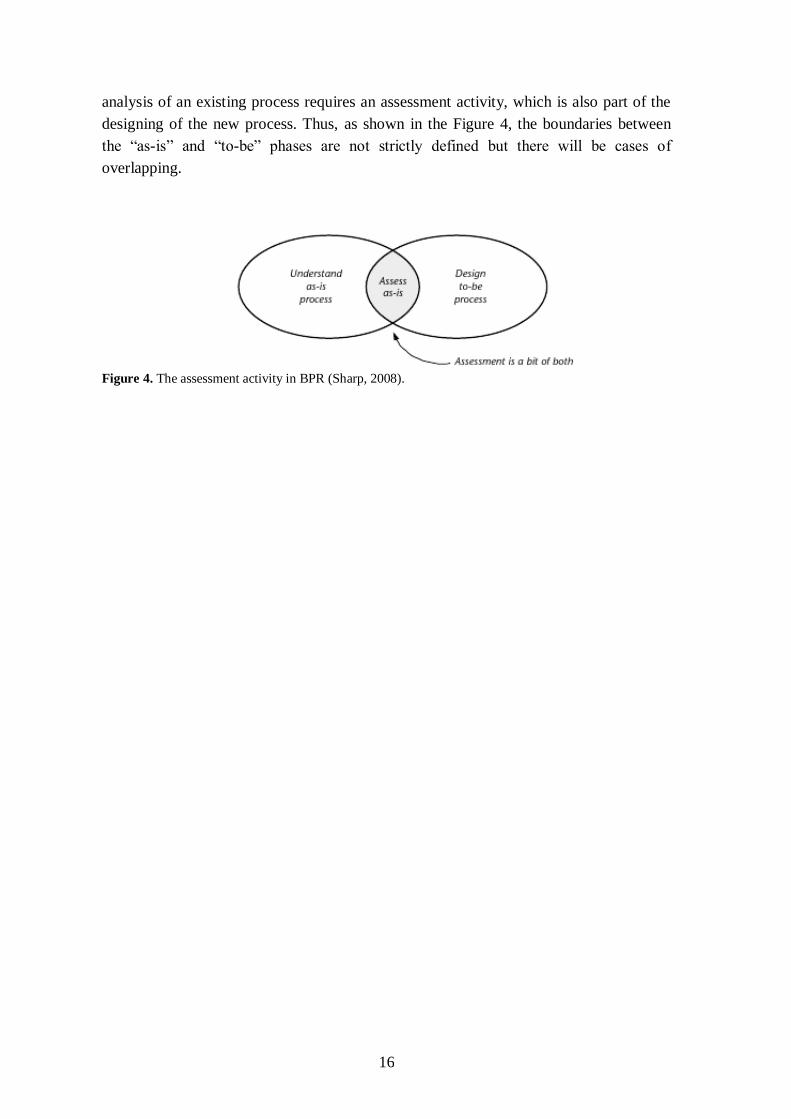
is explained in the next Section. To avoid confusion, it is relevant to point out that, the
16
analysis of an existing process requires an assessment activity, which is also part of the
designing of the new process. Thus, as shown in the Figure 4, the boundaries between
the ―as-is‖ and ―to-be‖ phases are not strictly defined but there will be cases of
overlapping.
Figure 4. The assessment activity in BPR (Sharp, 2008).
17
3.3 Understanding the existent process
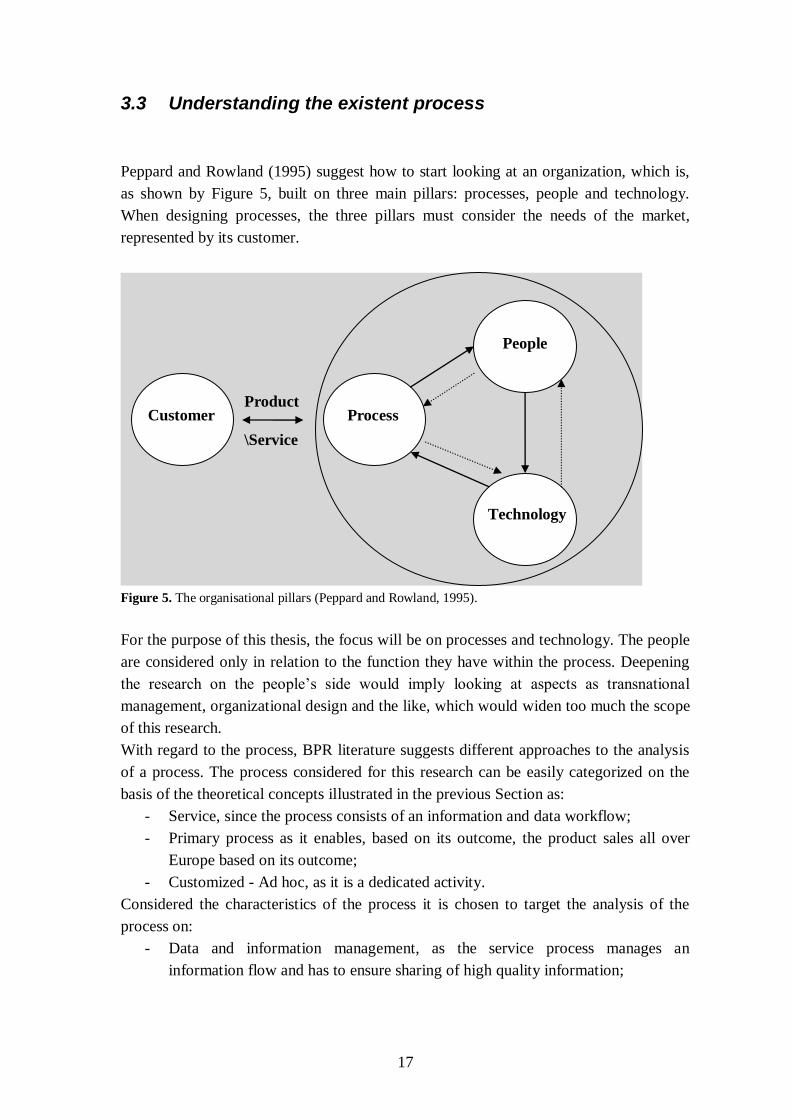
Peppard and Rowland (1995) suggest how to start looking at an organization, which is,
as shown by Figure 5, built on three main pillars: processes, people and technology.
When designing processes, the three pillars must consider the needs of the market,
represented by its customer.
Figure 5. The organisational pillars (Peppard and Rowland, 1995).
For the purpose of this thesis, the focus will be on processes and technology. The people
are considered only in relation to the function they have within the process. Deepening
the research on the people‘s side would imply looking at aspects as transnational
management, organizational design and the like, which would widen too much the scope
of this research.
With regard to the process, BPR literature suggests different approaches to the analysis
of a process. The process considered for this research can be easily categorized on the
basis of the theoretical concepts illustrated in the previous Section as:
- Service, since the process consists of an information and data workflow;
- Primary process as it enables, based on its outcome, the product sales all over
Europe based on its outcome;
- Customized - Ad hoc, as it is a dedicated activity.
Considered the characteristics of the process it is chosen to target the analysis of the
process on:
- Data and information management, as the service process manages an
information flow and has to ensure sharing of high quality information;
Technology
Customer Process
People
Product
\Service
18
- IT systems, which, given the importance of the process, have to be reliable and
error-proof, as already introduced by the Criteria for assessing the finding in
Sub-subsection 2.1.4;
- Specific solutions as workflows, measurement, given that the process is
dedicated to a specific activity.
Therefore, specific topics are picked up from the existing literature on BPR in order to
proceed with the analysis of the existing process, aiming at getting a sufficient
understanding of it. Indeed, according to Shin and Jemella (2002), a detailed knowledge
would be counterproductive for the redesign activity, as also explained in the later
Sections.
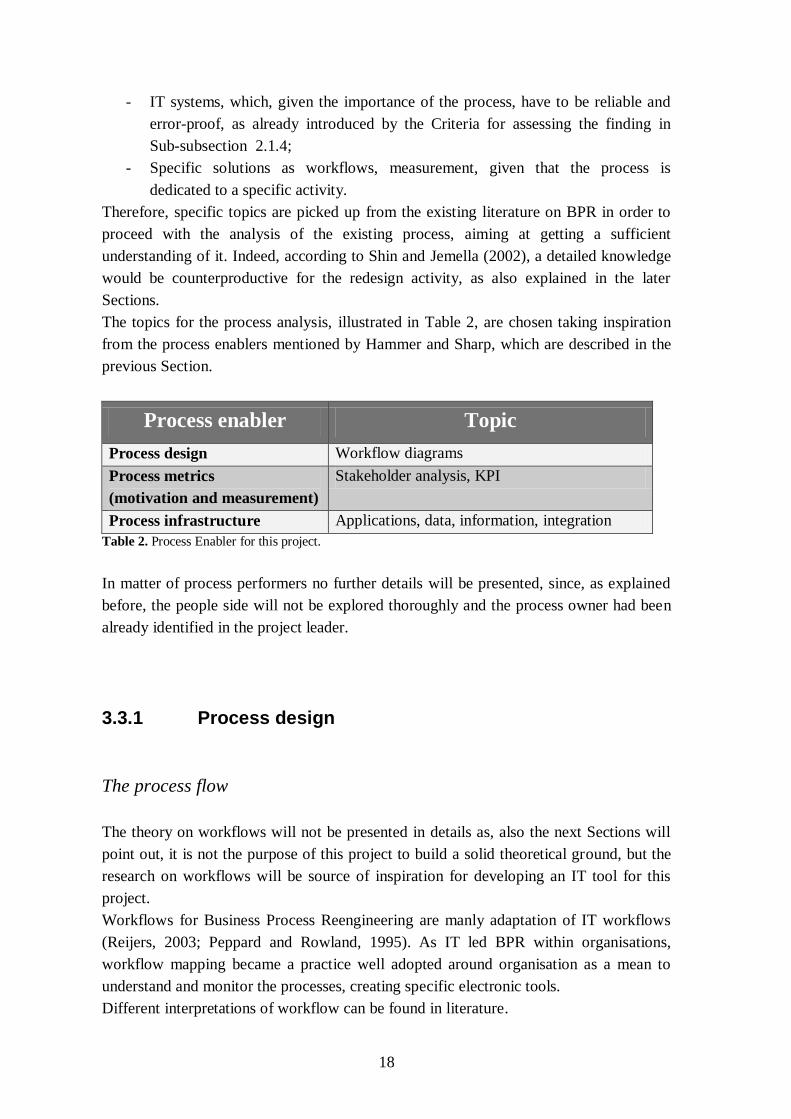
The topics for the process analysis, illustrated in Table 2, are chosen taking inspiration
from the process enablers mentioned by Hammer and Sharp, which are described in the
previous Section.
Process enabler Topic
Process design Workflow diagrams
Process metrics
(motivation and measurement)
Stakeholder analysis, KPI
Process infrastructure Applications, data, information, integration
Table 2. Process Enabler for this project.
In matter of process performers no further details will be presented, since, as explained
before, the people side will not be explored thoroughly and the process owner had been
already identified in the project leader.
3.3.1 Process design
The process flow
The theory on workflows will not be presented in details as, also the next Sections will
point out, it is not the purpose of this project to build a solid theoretical ground, but the
research on workflows will be source of inspiration for developing an IT tool for this
project.
Workflows for Business Process Reengineering are manly adaptation of IT workflows
(Reijers, 2003; Peppard and Rowland, 1995). As IT led BPR within organisations,
workflow mapping became a practice well adopted around organisation as a mean to
understand and monitor the processes, creating specific electronic tools.
Different interpretations of workflow can be found in literature.
19
The workflow management has the objective of modelling and controlling the execution
of complex application processes in different domains as business, electronic learning,
natural sciences and so forth (Reijers, 2003). The workflow models are instead a
representation of application processes which are used by workflow management
systems for controlling the automated execution of workflows. The workflow models are
developed on a project basis making them kind of unique. However, it can be outlined a
general process for the development of the workflows.
Workflow types
Sharp (2008) indicates different types of workflows which show work flows that involve
combination of people, systems, machines, or other mechanisms.
The first point which has to be made is on the distinction between the two types of
workflows which constitute a business process. One is the data/information workflow
and the other one is the product workflow also known as manufacturing process (Reijers,
2003). As the latter is managed mostly by using targeted IT solutions as e.g. ERP or CSP
and it has not be considered for this project, focus is kept on the data and information
workflows.
Once determined that the product of the workflow is actually information, there are
some main differences between a workflow and a manufacturing process as indicated
below (Van der Aalst, 1999):
- Making a copy is easy and cheap;
- There are no real limitation with respect to the in-process inventory;
- There are less requirements with respect to the order in which tasks are
executed;
- Quality is difficult to measure, as criteria to assess the quality of an informational
product are usually less explicit than those in manufacturing environment;
- Quality of end products may vary;
- Transportation of electronic data is timeless.
A general workflow diagram shows what is done, by whom, in what sequence—―who,
does what, when‖. Sharp (2008) mentions how, in the field, is common to say that
workflow models depict the three R‘s— roles, rules, and routes. ―Roles‖ refers to the
actors who complete steps in the process. Responsibilities are the individual steps that
each actor performs. Routes are the flows and decisions that connect the steps and
therefore define the path (or route) that an individual work item will take through the
process. It is then a key characteristic for workflows to adhere to the 3R formula to meet
the purposes they are built for (Sharp, 2008). With regard to this project we can
differentiate two types of workflows. One is the workflow that has to be reengineered,
which has a current version and a second version after the redesign of the process. A
second type of diagram is the one that will guide the map of the IT tools. Generally
20
many authors refer to Petri nets about the creation of workflow diagrams as base of
electronic processes to be performed by software based on the Petri nets themselves.
Indeed, as Reijers (2003) states Petri nets are used as the basis for modelling workflows.
Since Zisman in 1977, who used Petri nets to model workflows for the first time, several
authors have modelled workflows in terms of Petri nets, amongst which Ellis in 1979,
Lee in 1992, Ellis and Nutt in 1993, Merz et al. in 1995 and Van der Aalst and Van Hee,
in 1996.
The choice for Petri nets is consistent with a task-oriented view on workflows.
However, taking into account the objectives of this project and considering that the
electronic application will be develop on an empirical base, the Petri Net‘s theories will
not be used for software development purposes.
Workflow diagram use
The use of workflow diagrams can serve different purposes as mentioned by Reijers
(2003). Some of them are particularly relevant for the objectives of this project:
- Communication and training, as workflow models that can be used for
introducing to newcomers the overall structure of the business process, the
products that are delivered by it, and the dependencies with other parts of the
company;
- Simulation and Analysis, with executable specification of a workflow to be
used for simulating the behaviour of the workflow under different circumstances;
- Documentation, Knowledge Management, and Quality, with the workflow
model that indicates work instructions on each of its tasks (instructions can be
consulted by the resources responsible for their execution) and can be a support
for Total Quality Management (TQM) implementation, providing a clear
business process codification to reduce role conflict and ambiguity, thereby
increasing work satisfaction and reducing feelings of alienation and stress.
- Enactment, with the workflow that can be managed and controlled, through its
model, in real-time by an enterprise system such as a Workflow Management
System or Enterprise Resource Planning System;
- System Development, with the workflow model that acts as input for system
development activities, specifying functional requirements for the supporting
systems that have to be modified or build;
- Management Information, with the workflow model that identifies and
specifies the key mile stones within a workflow from a manager‘s perspective.
21
3.3.2 Process metrics
As previously introduced in this Section, process metrics are defined by Hammer (2010)
as the base to set targets and measurement for the process.
Since every organization has its own strategy and objectives to achieve, measurement
acts as a compass that allows the user to constantly monitor his direction towards the
destination.
Kaplan and Norton (1996), in their publication on balanced scorecards, suggest the
importance of metrics:
―If you can’t measure it, you can’t manage it‖ (p.21).
The theme of performance measurement is widely covered in business process re-
engineering and management literature: Key Performance Indicators (KPIs) and
balanced scorecards are two of the most common used approaches. KPIs are defined by
Parmentier (2009) as ―a set of measures focusing on those aspects of organizational
performance that are the most critical for the current and future success of the
organization‖ (p.4).
Instead, the balanced scorecards have been developed with the aim of combining
financial measures of past performance with measures that are linked to the future
performance of the organization, considered based on the following aspects: financial,
customer, internal business process, and learning and growth.
Therefore, the balance scorecard is a framework that translates vision and strategy into a
set of measurable parameters, as stated by Kaplan and Norton (1996). As for the scope
of this project is limited to the process itself, no financial aspects are considered,
balanced scorecards will not be applied to this case, but references to related theory will
be made to set the necessary performance measures for the process.
When an organization engages itself into a process redesign project, objectives and
targets are set for the new activity in line with the overall vision and strategy of the
organization. As mentioned by some authors (Parmentier, 2009; Kaplan and Norton,
1996), managers and key people are addressed by a great amount of data and
information day by day. Not all the times the information is the right one or it is handled
in the best way to make decision. At the same way, a process reengineering activity
needs good indicators which can be considered in form of KPIs and/or balanced
scorecards.
How to find out KPI for the process
When BPR projects start, they are surrounded by uncertainty, due to the fact that the ―to-
be‖ situation is not clearly defined as well as objectives: a blurred vision of the new
situation dominates the scene. Often, in the case of paper processes, also the ―as-is‖
22
situation does not appear very clear, due to the intrinsic limits of a paper process (e.g.
difficulties to track the actual process and understand the value-adding activity, poor
understanding of the process and its objectives by the people, etc). This implies that,
though a rough vision/idea of how the new process is shared among stakeholders, details
are still far from being defined. So, project objectives appear fuzzy during the early
phases of the project. In order to establish a proper system of measurement for the
process, having said the importance of strategy and objectives, it is plain how the first
step to do is to set, refine or make explicit the objectives, which will indicate the way to
build the performance measurement system.
KPI and process objectives
Every process in an organization is set to perform a certain work and achieve certain
objectives, which are related to both the process itself and overall organizational
objectives and strategy.
A manufacturing process is set to give products as output in a determined time, meet
certain criteria as cost, quality and so forth.
An information workflow, created for managing data, implies an understanding of what
are the objectives and the targets for an electronic process in order to be able to set the
good parameters and build on the proper performance measurement system.
The way to explicit the objectives of the project is pretty straightforward. Under the
pressure made on organization by the IT wave during the 90s, it is common belief that
there are benefits in turning the paper workflows into electronic processes. Most of the
times, the electronic processes is a top-down decision. As a result, not many people
around organizations understand where the benefits in having electronic processes are
and thus objectives are often not defined for this kind of projects.
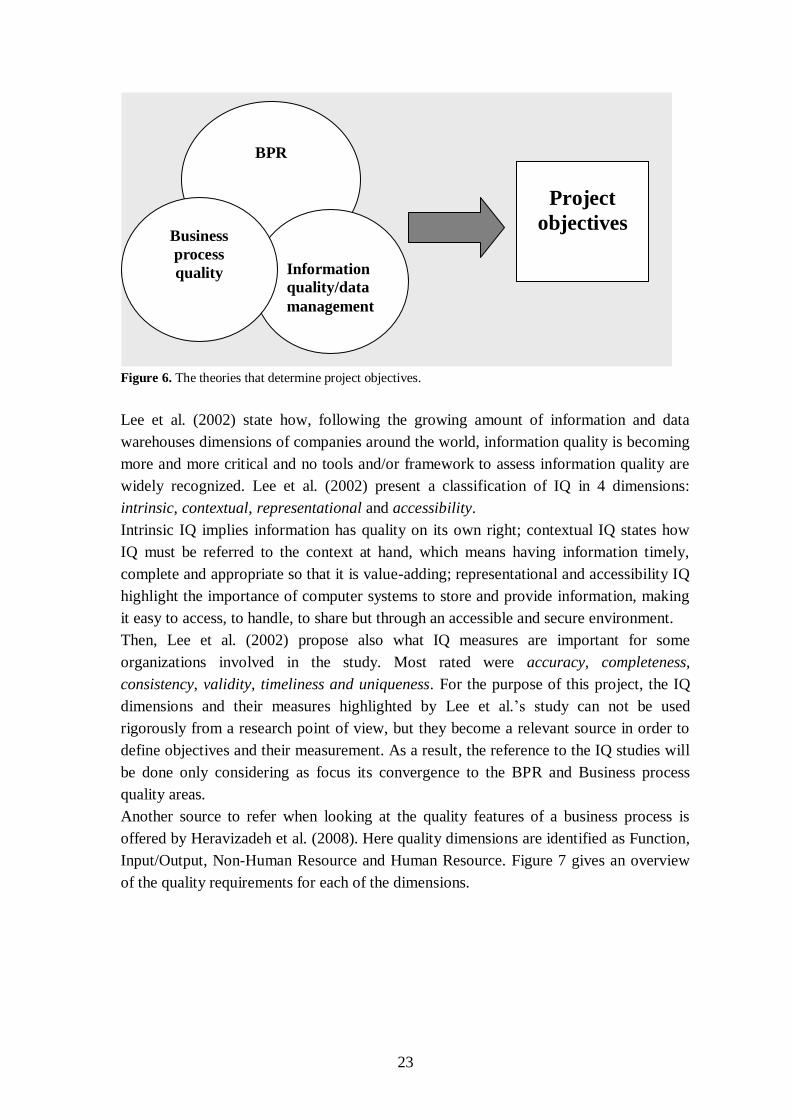
This problem area is widely touched in the literature, though it is hard to find where and
when it comes into the sphere of BPR. Davenport (1993) wrote on the BPR activities
done for process automation, but this is still not sufficient to clarify the issue. A lens to
look at the matter and see it more defined is represented by the convergence of the
subjects of Information Quality, BPR and Business Process Quality, as shown by Figure
6.
23
Figure 6. The theories that determine project objectives.
Lee et al. (2002) state how, following the growing amount of information and data
warehouses dimensions of companies around the world, information quality is becoming
more and more critical and no tools and/or framework to assess information quality are
widely recognized. Lee et al. (2002) present a classification of IQ in 4 dimensions:
intrinsic, contextual, representational and accessibility.
Intrinsic IQ implies information has quality on its own right; contextual IQ states how
IQ must be referred to the context at hand, which means having information timely,
complete and appropriate so that it is value-adding; representational and accessibility IQ
highlight the importance of computer systems to store and provide information, making
it easy to access, to handle, to share but through an accessible and secure environment.
Then, Lee et al. (2002) propose also what IQ measures are important for some
organizations involved in the study. Most rated were accuracy, completeness,
consistency, validity, timeliness and uniqueness. For the purpose of this project, the IQ
dimensions and their measures highlighted by Lee et al.‘s study can not be used
rigorously from a research point of view, but they become a relevant source in order to
define objectives and their measurement. As a result, the reference to the IQ studies will
be done only considering as focus its convergence to the BPR and Business process
quality areas.
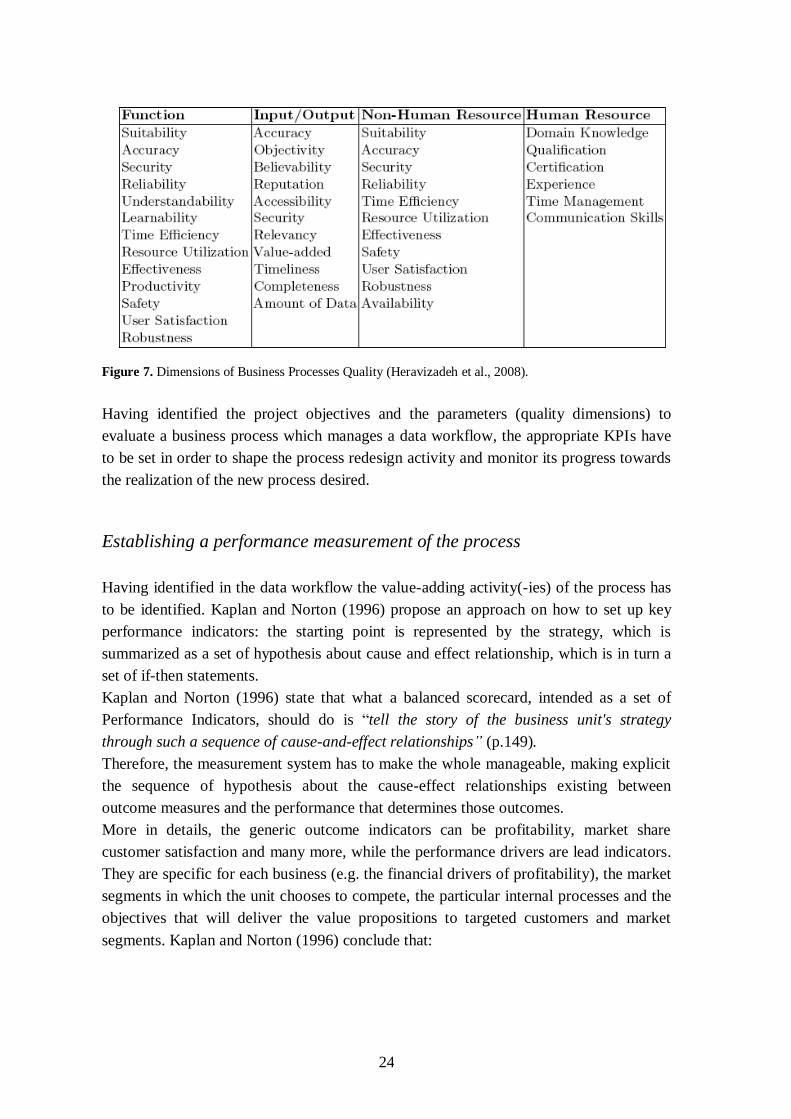
Another source to refer when looking at the quality features of a business process is
offered by Heravizadeh et al. (2008). Here quality dimensions are identified as Function,
Input/Output, Non-Human Resource and Human Resource. Figure 7 gives an overview
of the quality requirements for each of the dimensions.
BPR
Information
quality/data
management
Project
objectives Business
process
quality
24
Figure 7. Dimensions of Business Processes Quality (Heravizadeh et al., 2008).
Having identified the project objectives and the parameters (quality dimensions) to
evaluate a business process which manages a data workflow, the appropriate KPIs have
to be set in order to shape the process redesign activity and monitor its progress towards
the realization of the new process desired.
Establishing a performance measurement of the process
Having identified in the data workflow the value-adding activity(-ies) of the process has
to be identified. Kaplan and Norton (1996) propose an approach on how to set up key
performance indicators: the starting point is represented by the strategy, which is
summarized as a set of hypothesis about cause and effect relationship, which is in turn a
set of if-then statements.
Kaplan and Norton (1996) state that what a balanced scorecard, intended as a set of
Performance Indicators, should do is ―tell the story of the business unit's strategy
through such a sequence of cause-and-effect relationships‖ (p.149).
Therefore, the measurement system has to make the whole manageable, making explicit
the sequence of hypothesis about the cause-effect relationships existing between
outcome measures and the performance that determines those outcomes.
More in details, the generic outcome indicators can be profitability, market share
customer satisfaction and many more, while the performance drivers are lead indicators.
They are specific for each business (e.g. the financial drivers of profitability), the market
segments in which the unit chooses to compete, the particular internal processes and the
objectives that will deliver the value propositions to targeted customers and market
segments. Kaplan and Norton (1996) conclude that:
25
―A good Balanced Scorecard should have an appropriate mix of outcomes (lagging
indicators) and performance drivers (leading indicators) that have been customized
to the business unit’s strategy to tell how the outcomes have been achieved‖ (p. 150).
Setting Key Performance Indicators
If a Key Performance Indicator has to be set for a process, this should indicate how the
process is actually doing better over time. It can be useful to concentrate on the aspect of
the process which is creating value for the organization. A value adding activity can be
conducted so that the Value Adding (VA) activity(-ies) of the process can be found out
and, at the same time, the Non Value Adding (NVA) actions will be identified and
considered for elimination.
Conger (2010) proposes some steps to follow in order to conduct a Value Adding
Analysis, for a process with an output to be delivered to a customer. Adapting the
procedure for the purposes of this project, the steps can be summed-up as follows:
1. Map the process.
2. List all process steps and place them in a table with four other columns for
duration, value adding activities (VA), non value-adding activities that are
required (NVA), and non value-adding activities that are unnecessary (NVAU).
3. Review each process step considering if, after eliminating one activity:
a) Somebody will be affected by that;
b) Somebody will ask for that activity to be restored;
c) Overall process will be affected by the activity elimination;
4. Evaluate all NVAU activities for elimination;
5. Evaluate remaining activities for automation, outsourcing, or co-production.
NVA and NVAU activities that do not appear able to be automated or eliminated are
marked for further analysis for streamlining, outsourcing, or some other replacement
with VA activities.
As mentioned by Kapland and Norton (1996), it is proposed to link the measurement
system to the financial measures but it is not the purpose of this project to examine the
financial side of the process, as there is no relation between the information flow and the
financial aspects.
Stakeholder analysis
A process in an organization is performed by people, who are given tasks and
responsibilities. Understanding a process is also a matter of understanding the actual
tasks and responsibilities of the people: they are the process stakeholders and will be the
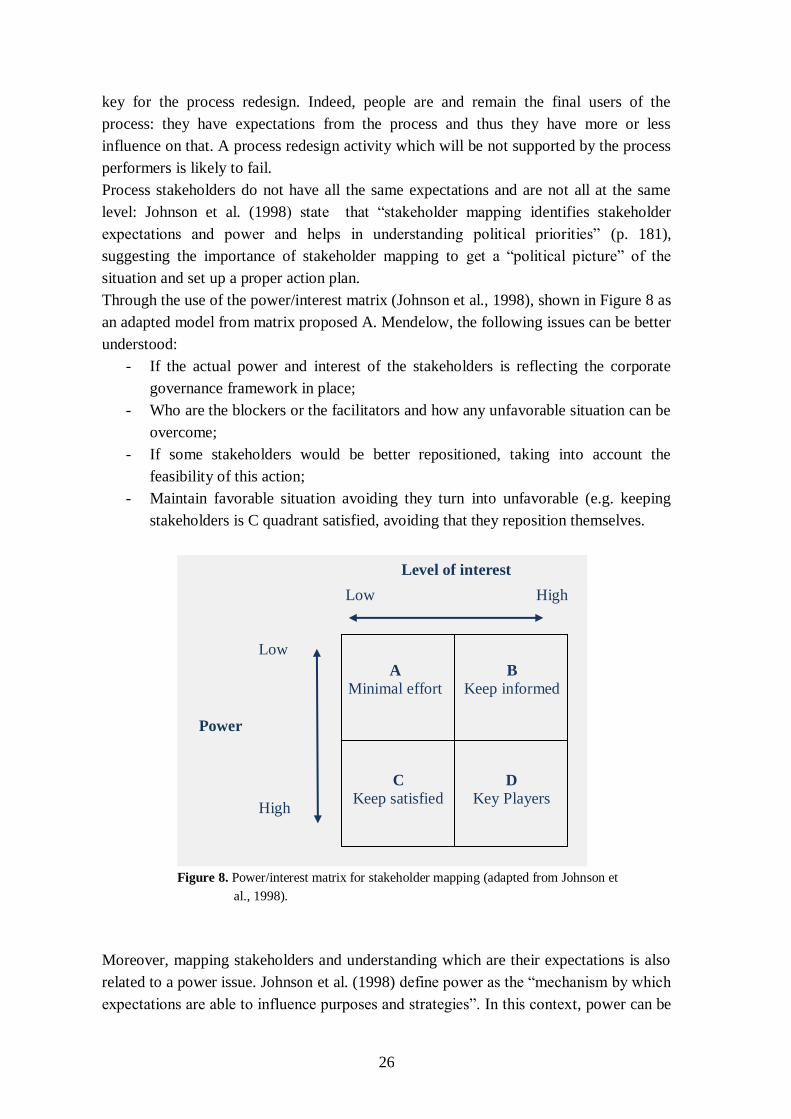
26
key for the process redesign. Indeed, people are and remain the final users of the
process: they have expectations from the process and thus they have more or less
influence on that. A process redesign activity which will be not supported by the process
performers is likely to fail.
Process stakeholders do not have all the same expectations and are not all at the same
level: Johnson et al. (1998) state that ―stakeholder mapping identifies stakeholder
expectations and power and helps in understanding political priorities‖ (p. 181),
suggesting the importance of stakeholder mapping to get a ―political picture‖ of the
situation and set up a proper action plan.
Through the use of the power/interest matrix (Johnson et al., 1998), shown in Figure 8 as
an adapted model from matrix proposed A. Mendelow, the following issues can be better
understood:
- If the actual power and interest of the stakeholders is reflecting the corporate
governance framework in place;
- Who are the blockers or the facilitators and how any unfavorable situation can be
overcome;
- If some stakeholders would be better repositioned, taking into account the
feasibility of this action;
- Maintain favorable situation avoiding they turn into unfavorable (e.g. keeping
stakeholders is C quadrant satisfied, avoiding that they reposition themselves.
Figure 8. Power/interest matrix for stakeholder mapping (adapted from Johnson et
al., 1998).
Moreover, mapping stakeholders and understanding which are their expectations is also
related to a power issue. Johnson et al. (1998) define power as the ―mechanism by which
expectations are able to influence purposes and strategies‖. In this context, power can be
B
Keep informed
A
Minimal effort
C
Keep satisfied
D
Key Players
Power
Level of interest
Low
High
High Low
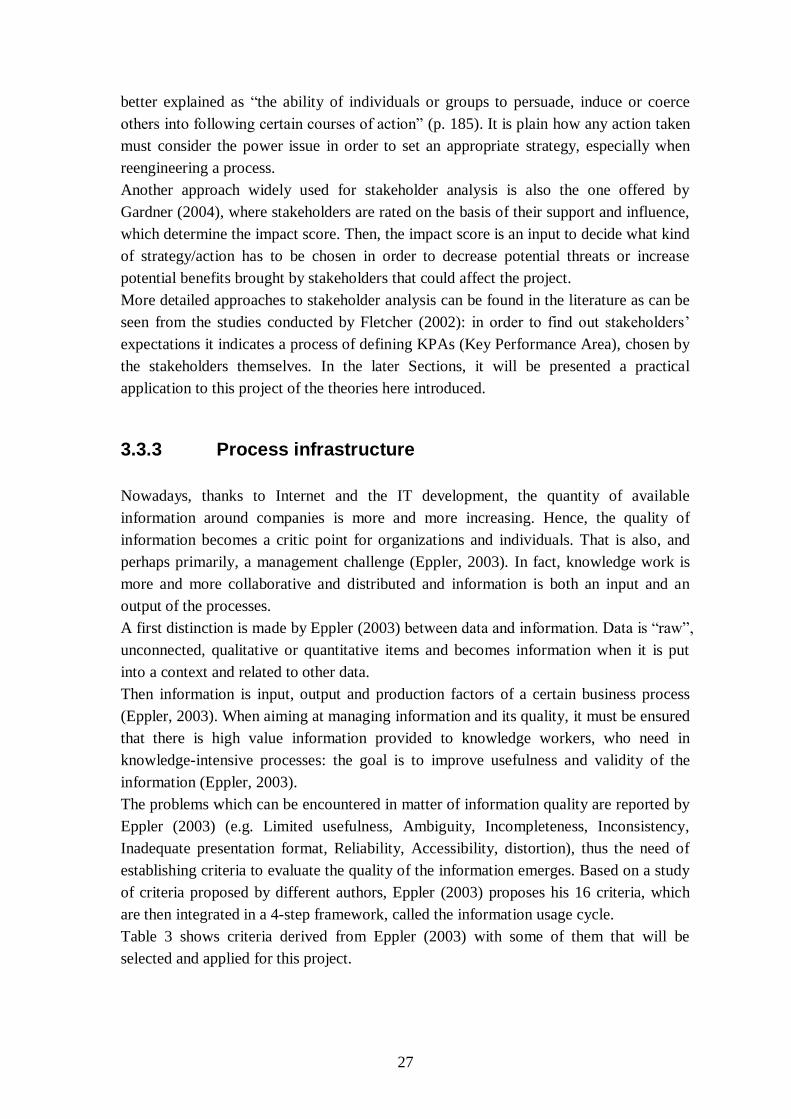
27
better explained as ―the ability of individuals or groups to persuade, induce or coerce
others into following certain courses of action‖ (p. 185). It is plain how any action taken
must consider the power issue in order to set an appropriate strategy, especially when
reengineering a process.
Another approach widely used for stakeholder analysis is also the one offered by
Gardner (2004), where stakeholders are rated on the basis of their support and influence,
which determine the impact score. Then, the impact score is an input to decide what kind
of strategy/action has to be chosen in order to decrease potential threats or increase
potential benefits brought by stakeholders that could affect the project.
More detailed approaches to stakeholder analysis can be found in the literature as can be
seen from the studies conducted by Fletcher (2002): in order to find out stakeholders‘
expectations it indicates a process of defining KPAs (Key Performance Area), chosen by
the stakeholders themselves. In the later Sections, it will be presented a practical
application to this project of the theories here introduced.
3.3.3 Process infrastructure
Nowadays, thanks to Internet and the IT development, the quantity of available
information around companies is more and more increasing. Hence, the quality of
information becomes a critic point for organizations and individuals. That is also, and
perhaps primarily, a management challenge (Eppler, 2003). In fact, knowledge work is
more and more collaborative and distributed and information is both an input and an
output of the processes.
A first distinction is made by Eppler (2003) between data and information. Data is ―raw‖,
unconnected, qualitative or quantitative items and becomes information when it is put
into a context and related to other data.
Then information is input, output and production factors of a certain business process
(Eppler, 2003). When aiming at managing information and its quality, it must be ensured
that there is high value information provided to knowledge workers, who need in
knowledge-intensive processes: the goal is to improve usefulness and validity of the
information (Eppler, 2003).
The problems which can be encountered in matter of information quality are reported by
Eppler (2003) (e.g. Limited usefulness, Ambiguity, Incompleteness, Inconsistency,
Inadequate presentation format, Reliability, Accessibility, distortion), thus the need of
establishing criteria to evaluate the quality of the information emerges. Based on a study
of criteria proposed by different authors, Eppler (2003) proposes his 16 criteria, which
are then integrated in a 4-step framework, called the information usage cycle.
Table 3 shows criteria derived from Eppler (2003) with some of them that will be
selected and applied for this project.
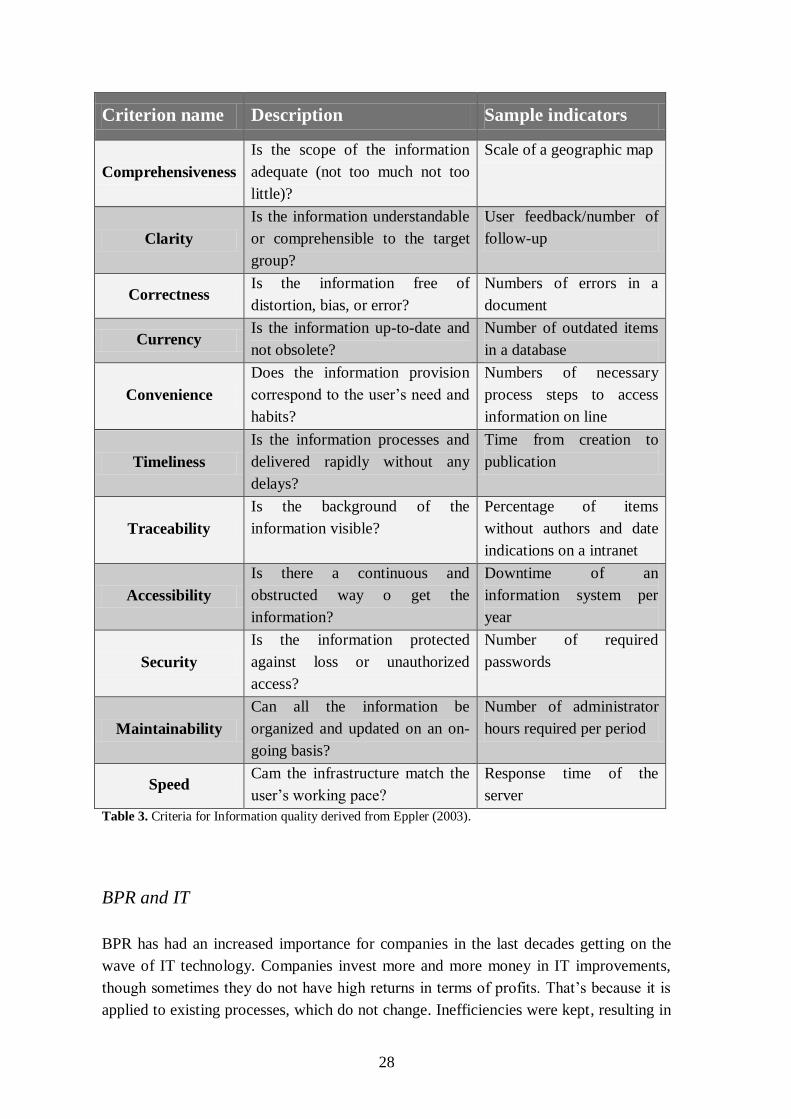
28
Criterion name Description Sample indicators
Comprehensiveness
Is the scope of the information
adequate (not too much not too
little)?
Scale of a geographic map
Clarity
Is the information understandable
or comprehensible to the target
group?
User feedback/number of
follow-up
Correctness Is the information free of
distortion, bias, or error?
Numbers of errors in a
document
Currency Is the information up-to-date and
not obsolete?
Number of outdated items
in a database
Convenience
Does the information provision
correspond to the user‘s need and
habits?
Numbers of necessary
process steps to access
information on line
Timeliness
Is the information processes and
delivered rapidly without any
delays?
Time from creation to
publication
Traceability
Is the background of the
information visible?
Percentage of items
without authors and date
indications on a intranet
Accessibility
Is there a continuous and
obstructed way o get the
information?
Downtime of an
information system per
year
Security
Is the information protected
against loss or unauthorized
access?
Number of required
passwords
Maintainability
Can all the information be
organized and updated on an on-
going basis?
Number of administrator
hours required per period
Speed Cam the infrastructure match the
user‘s working pace?
Response time of the
server
Table 3. Criteria for Information quality derived from Eppler (2003).
BPR and IT
BPR has had an increased importance for companies in the last decades getting on the
wave of IT technology. Companies invest more and more money in IT improvements,
though sometimes they do not have high returns in terms of profits. That‘s because it is
applied to existing processes, which do not change. Inefficiencies were kept, resulting in

29
unsuccessful investments in IT. Processes have to be reengineered and changed to allow
IT to bring benefits.
When doing reengineering activity to automate existing process, it is key to assess the
type of IT change an organization will go through as well as internal capabilities to
perform the change. As Peppard and Rowland report (1995), the choice of internal IT
departments to develop new software is risky as systems may be delivered late, over-
budget and with user not satisfied.
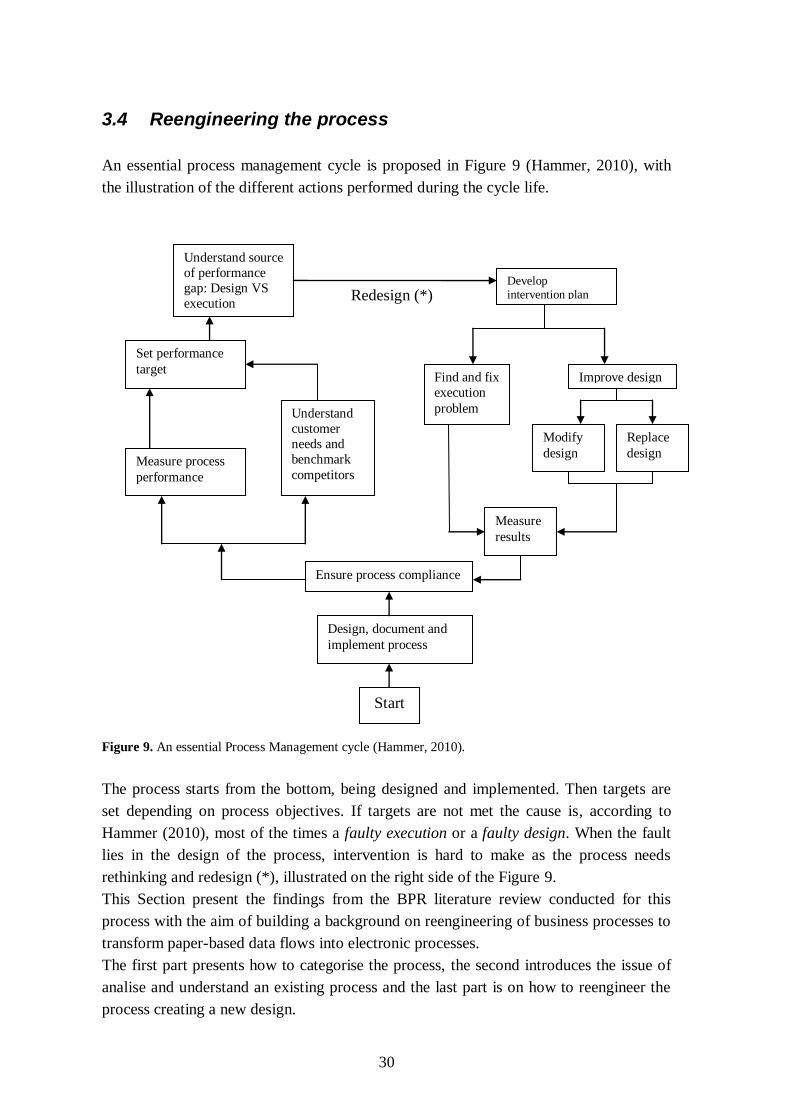
30
3.4 Reengineering the process
An essential process management cycle is proposed in Figure 9 (Hammer, 2010), with
the illustration of the different actions performed during the cycle life.
Figure 9. An essential Process Management cycle (Hammer, 2010).
The process starts from the bottom, being designed and implemented. Then targets are
set depending on process objectives. If targets are not met the cause is, according to
Hammer (2010), most of the times a faulty execution or a faulty design. When the fault
lies in the design of the process, intervention is hard to make as the process needs
rethinking and redesign (*), illustrated on the right side of the Figure 9.
This Section present the findings from the BPR literature review conducted for this
process with the aim of building a background on reengineering of business processes to
transform paper-based data flows into electronic processes.
The first part presents how to categorise the process, the second introduces the issue of
analise and understand an existing process and the last part is on how to reengineer the
process creating a new design.
Redesign (*)
Set performance
target
Start
Measure
results
Improve design
Understand source
of performance
gap: Design VS
execution
Design, document and
implement process
Develop intervention plan
Ensure process compliance
Find and fix
execution
problem
Modify
design
Replace
design Measure process
performance
Understand
customer
needs and
benchmark
competitors
31
Some major issues have to be investigated in order to be prepared for reengineering a
business process and start to define the ―to-be‖ process. The most important are:
- Evaluation of the existing business process as a base for the new redesigned
process;
- Level of investigation and understanding of the existing process.
-
According to Peppard and Rowland (1995), the approaches taken when carrying out
BPR activities are classified as either systematic redesign or clean sheet.
Systematic redesign approach consist on identifying and understanding existing
processes and then it proceeds in a systematic way working for the creation of the new
process which delivers the desired output.
The clean sheet approach re-thinks the process and the way of delivering the outcome to
make a new design out of scratch.
Depending on the kind of change companies want to put in place with BPR, one
approach is preferred to the other. Incremental change is preferred when aiming at
performance improvement of the process in the short term, whilst looking at the
medium-long term, the clean sheet is more likely to be adopted to introduce new ways to
compete.
Peppard and Rowland (1995) state how systematic redesign can be made more quickly,
in small chunks and at a reduced risk for the companies. As example, Japanese car
manufacturers with their kaizen philosophy have made huge improvements as sum of
many small changes that were implemented. Indeed, the best for companies would be to
make systematic redesign part of their Business Process Management activity, in
alternative to Business Process Re-engineering or Business Process Redesign.
Clean sheet approach is also defined by Peppard and Rowland (1995) as capable to give
companies good chances of performance leaps. It is about starting from the target and
the desired result and work back creating a design to make it happen. The main reason
that drives the choice of a clean sheet approach lies in either a failure of re-engineering
of existing processes with no satisfying results or in the belief of being arrived to a
―breakpoint‖. Risks when starting with a clean sheet approach are higher.
However, there are many factors that influence the choice of the approach for BPR, as
organisational readiness for change, scale of the change and so on. As a result, many
times companies end up in choosing a mix of the two philosophies
The choice of one approach instead of the other will also have implications for shaping
the BPR project, according resources, choosing the change agent/team, technologies and
so on.
Besides, there are some required characteristics for conducting BPR projects that are,
according to Peppard and Rowland (1995), a combination of:
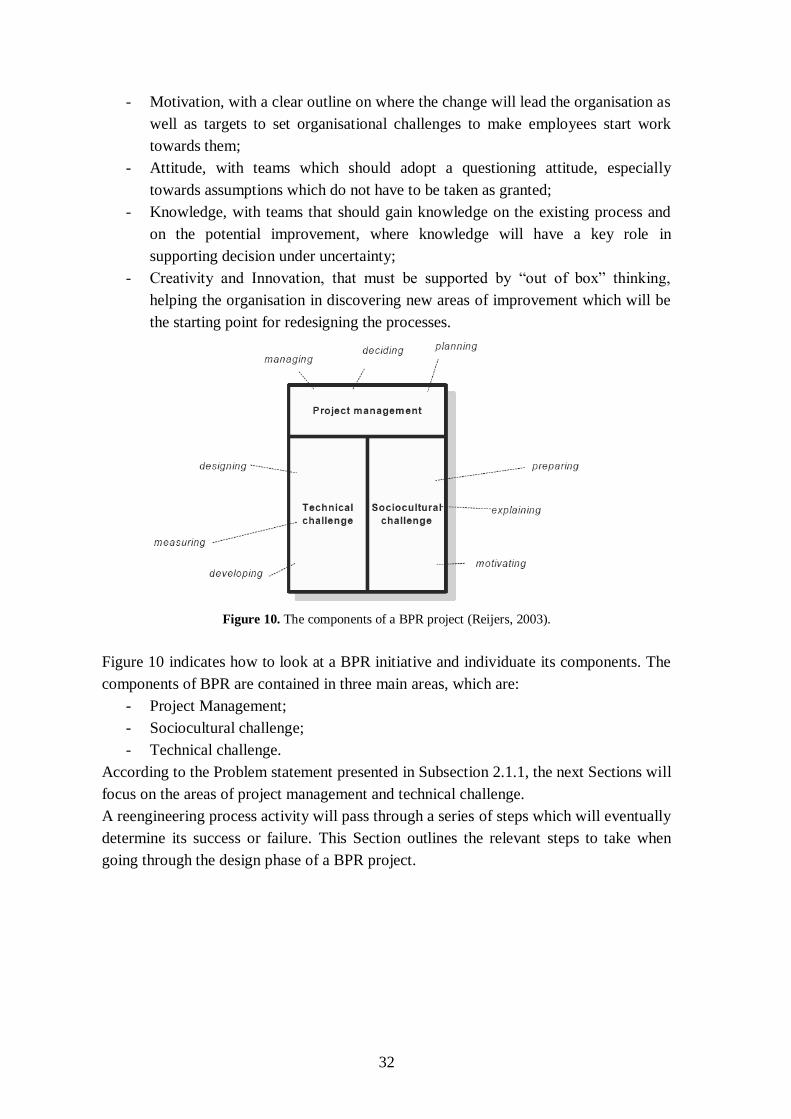
32
- Motivation, with a clear outline on where the change will lead the organisation as
well as targets to set organisational challenges to make employees start work
towards them;
- Attitude, with teams which should adopt a questioning attitude, especially
towards assumptions which do not have to be taken as granted;
- Knowledge, with teams that should gain knowledge on the existing process and
on the potential improvement, where knowledge will have a key role in
supporting decision under uncertainty;
- Creativity and Innovation, that must be supported by ―out of box‖ thinking,
helping the organisation in discovering new areas of improvement which will be
the starting point for redesigning the processes.
Figure 10. The components of a BPR project (Reijers, 2003).
Figure 10 indicates how to look at a BPR initiative and individuate its components. The
components of BPR are contained in three main areas, which are:
- Project Management;
- Sociocultural challenge;
- Technical challenge.
According to the Problem statement presented in Subsection 2.1.1, the next Sections will
focus on the areas of project management and technical challenge.
A reengineering process activity will pass through a series of steps which will eventually
determine its success or failure. This Section outlines the relevant steps to take when
going through the design phase of a BPR project.
33
3.4.1 Build the new process design
This phase aims at building a high-level process concept on the base of the vision
developed at the first stages of the process (Davenport, 1993). Davenport (1993)
mentions there is more to say on the activities which lead to the design phase than on the
latter itself. Creativity and a capable group of people are important ingredients to analyse
the elements and information previously collected and synthesize it to generate a new
designed process. In addition, the people directly responsible for the process redesign
activities should involve the different stakeholders in this process as their view is
fundamental. Even if the design phase may take longer time involving all the
stakeholders, it can result in shorter implementation time of the new process (Davenport,
1993). Davenport (1993) states how the solution chosen to develop the new process,
should be able to perform some actions as:
- Graphically represent the process steps as well as material and information flow
between steps;
- Rolling up the process steps in a sequence;
- Have a high interactive and graphical user interface;
- Produce real-time graphical output;
- Identify key bottlenecks in the process.
A particular attention should be paid when designing the features of the new process and
assessing which IT-tool will be chosen to execute the new process and meet its
requirements. Ideally, the two actions should be conducted hand in hand in order to find
the convergence and achieve the objectives (Davenport, 1993).
To develop a new design, it is quite important the idea generation to perform through
brainstorming, looking at best practices and involving stakeholders and so on (Sharp,
2008). Indeed, as stated by Sharp (2008), the way from the ―as-is‖ state of a process to
the ―to-be‖ is most of the times not clearly defined, making relevat the importance of the
creativity and the idea generation to design the new process.
3.5 Implementation
Implementation is also a complex part when doing BPR. Peppard and Rowland (1995)
claim how redesigning activity of a process is rather simple when compared to the
implementation, as many BPR projects fail when time comes for the implementation. In
fact, organisations and people within them are resistant to change. Then the
implementation phase of a BPR initiative should be highly considered and some
important steps have to be followed.
34
Different approaches are presented in the literature regarding implementation of the new
process. Peppard and Rowland (1995) present a brief framework to approach
implementation of BPT, which consists of five phases:
1. Create the environment;
2. Analyse, diagnose and redesign processes;
3. Restructure the organisation;
4. Pilot and Roll-out;
5. Realise vision.
The five phases are described in more details, with the exception of create the
environment and restructure of the organisation phases, which were not conducted for
this project. The phases mentioned below, will be used as source of inspiration for
conducting this project, being included in the operational framework, illustrated in the
next Section.
3.5.1 Analyse, Diagnose and Redesign Processes
A reengineering activity starts with an analysis of the ―as-is‖ situation of a process. The
reengineering agent (or team) should be careful to not spend too much time on that as
reengineering a process needs the creation and adoption of new solutions for the process,
which can be affected by sticking too much on the way things are currently done
(Peppard and Rowland, 1995; Shin and Jemella, 2002). Peppard and Rowland (1995)
propose a step-based model to adopt for this phase of the BPR initiative, which is as
follows:
- Recruit and train teams;
- Identify process outcomes and linkages;
- Diagnose condition;
- Benchmark best practices;
- Redesign processes (systematic or clean sheet, or a mix of them);
- Review people requirements of new process design;
- Review technological requirements of new process design;
- Validate new process design.
The practical application of these steps will be described in Chapter 5.
3.5.2 Pilot and roll-out
After having determined the new design of the process, the critic point is how to put it in
place. A simulation is recommended to test the new solution prior to its actual
implementation. Depending on the product output of the process, the simulation might
have high costs, thus limiting the possibilities of testing for the redesigned process.
35
Obviously, when the process consists of a data-flow, the simulation can be done nearly
without any constraint in terms of budgeting.
Pilot
The new processes should be laid down in cooperation with selected actors and in two
steps, which are the pilot and the roll-out (Peppard and Rowland, 1995). The pilot is a
smaller scale, but fully operational, implementation of a new process in a relatively
small unit of the organisation (Davenport, 1993) and its advantage is also to make the
migration to the new process less radical. The roll-out follows the pilot and refers to the
actual implementation of the new process. The selection of the pilot is considered crucial
for the success of the overall BPR activity and some characteristics are required as make
visible the improvements brought by BPR on the process and have high chances of
success without being too complex. Once the pilot is launched, it has to be closely
monitored and make it work, if necessary with the senior management support. Failures
are a good chance for learning and have to be quickly fixed. The purpose of launching a
pilot is to make a process simulation with the objective of ―mimic the reality in some
way‖ (Laguna and Marklund, 2004). According to Laguna and Marklund (2004), the
steps to perform are as follows:
1. Building a simulation model of the process;
2. Running the simulation model;
3. Analysing the performance measures;
4. Evaluating alternative scenarios.
A very important point is also to give priority to the BPR programme during this phase,
as pilot is the base for a successful implementation. Furthermore, as Laguna and
Marklund (2004) state, conducting a process simulation brings some main advantage to
the overall BPR project, as:
- Reduce the risk related to any type of change, because current operations
for real processes are not affected allowing strategies to be tested;
- Examine the process over a long time, since simulation compresses
process time;
- Capture system dynamics, which are the random events that can occur
and affect the process during its execution;
- Visualise process operation, making ideas alive and improving their
communication and win resistance to change.
Roll-out
Peppard and Roland (1995) state that no matter ―however successful the previous stage
are thought to have been it is this stage which will actually transform the
organisation‖(p.224).
36
The main points highlighted by Peppard and Rowland (1995), which can also be
considered with regard to this BPR project are:
- Staff training, which takes a long time and should go hand-in-hand with
the implementation of the redesigned process to not be forgotten;
- Roll-out plan, which has to be clearly communicated;
- Management support, to sustain the activity and pull it forward if needed.
If the pilot or the following roll-out will take too long time, there will be high risk of
losing the change momentum with the new process that will be forgotten as time goes on
(Peppard and Rowland, 1995). Again, senior management support becomes crucial for a
successful pilot and roll-out.
3.6 Realise vision
It consists of a ―next phase‖ which follows the implementation of the redesign process.
Indeed, many authors refer to it as a new phase to be conducted to evaluate the
redesigned process (Motwani et al., 1998; Reijers, 2003; Kettinger, 1997). Peppard and
Rowland (1995) define the important steps to realize vision as:
- Assessment of the new process performance;
- Improvements capitalization;
- Identification of new uses for the capabilities developed for the
redesigned process;
- Continuous improvement.
The steps above may appear obvious at first sight, but that is where most of the
companies are struggling after having implemented successful BPR projects (Peppard
and Rowland, 1995).
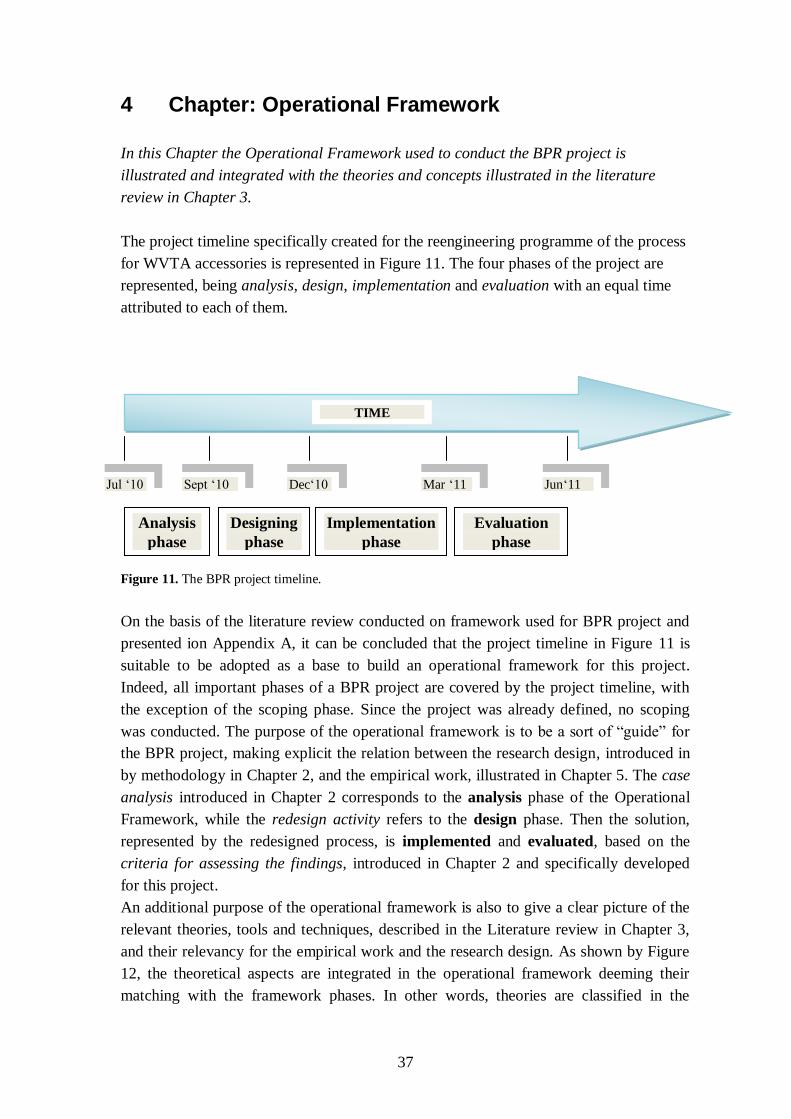
37
4 Chapter: Operational Framework
In this Chapter the Operational Framework used to conduct the BPR project is
illustrated and integrated with the theories and concepts illustrated in the literature
review in Chapter 3.
The project timeline specifically created for the reengineering programme of the process
for WVTA accessories is represented in Figure 11. The four phases of the project are
represented, being analysis, design, implementation and evaluation with an equal time
attributed to each of them.
Figure 11. The BPR project timeline.
On the basis of the literature review conducted on framework used for BPR project and
presented ion Appendix A, it can be concluded that the project timeline in Figure 11 is
suitable to be adopted as a base to build an operational framework for this project.
Indeed, all important phases of a BPR project are covered by the project timeline, with
the exception of the scoping phase. Since the project was already defined, no scoping
was conducted. The purpose of the operational framework is to be a sort of ―guide‖ for
the BPR project, making explicit the relation between the research design, introduced in
by methodology in Chapter 2, and the empirical work, illustrated in Chapter 5. The case
analysis introduced in Chapter 2 corresponds to the analysis phase of the Operational
Framework, while the redesign activity refers to the design phase. Then the solution,
represented by the redesigned process, is implemented and evaluated, based on the
criteria for assessing the findings, introduced in Chapter 2 and specifically developed
for this project.
An additional purpose of the operational framework is also to give a clear picture of the
relevant theories, tools and techniques, described in the Literature review in Chapter 3,
and their relevancy for the empirical work and the research design. As shown by Figure
12, the theoretical aspects are integrated in the operational framework deeming their
matching with the framework phases. In other words, theories are classified in the
Analysis
phase
Designing
phase
Implementation
phase
Sept ‗10 Dec‗10
TIME
Mar ‗11 Jul ‗10
Evaluation
phase
Jun‗11
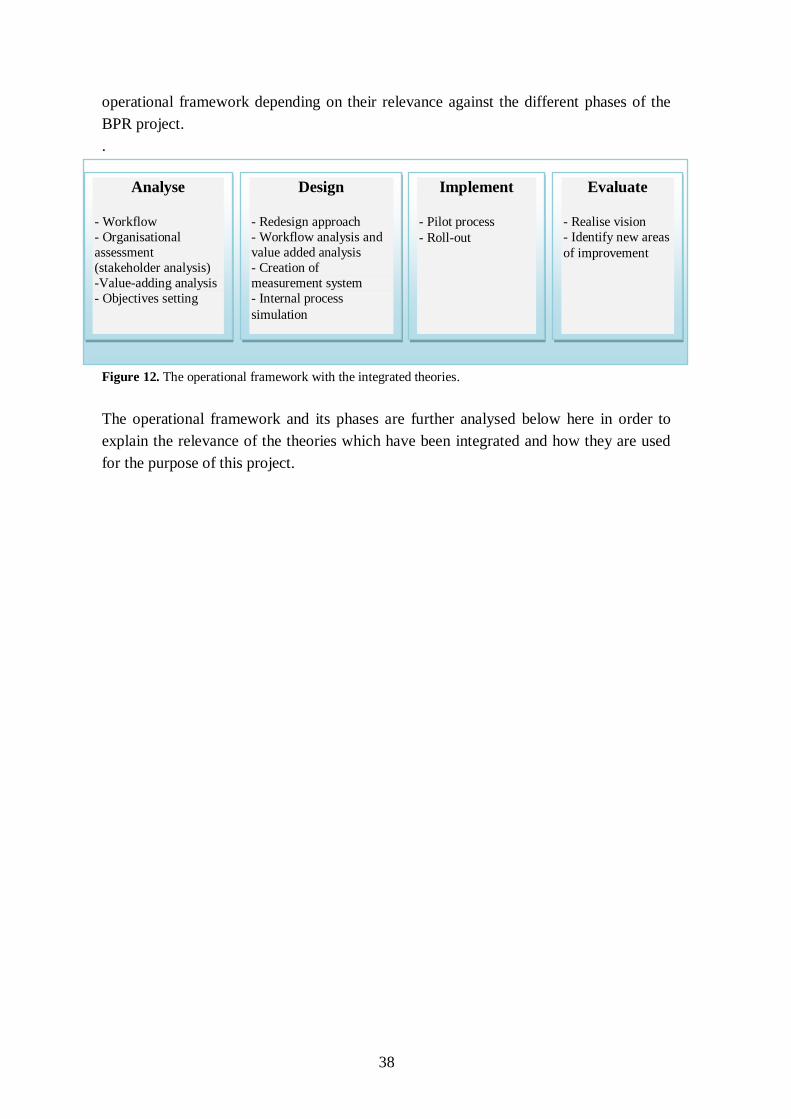
38
operational framework depending on their relevance against the different phases of the
BPR project.
.
Figure 12. The operational framework with the integrated theories.
The operational framework and its phases are further analysed below here in order to
explain the relevance of the theories which have been integrated and how they are used
for the purpose of this project.
Analyse
- Workflow
- Organisational
assessment
(stakeholder analysis)
-Value-adding analysis
- Objectives setting
Design
- Redesign approach
- Workflow analysis and
value added analysis
- Creation of
measurement system
- Internal process
simulation
Implement
- Pilot process
- Roll-out
Evaluate
- Realise vision
- Identify new areas
of improvement
39
4.1 Analyse
In this Section are described the theories used for the analysis of the ―as-is‖ situation,
which are: the workflow diagram creation, the stakeholder analysis, the value-adding
analysis and the objective setting. Besides, it is also described the reason why they were
applied to the process to analyse and how they were applied for the purpose of this
project
4.1.1 Workflow analysis
As introduced in the literature review in Chapter 3, the workflow analysis is conducted
to create a workflow diagram, which would clarify the different steps of the process as
well as the actions executed by the process performers. To reengineer a process, it must
be clear the sequence of steps to follows for the process‘ execution. In addition, once the
workflow analysis is done, the related diagram is created. Having a workflow diagram,
bring the benefits describe by the literature review, in Chapter 3.
The importance of the workflow diagrams for the analysis of the ―as-is‖ situation was
also particularly important given the type of process to reengineer. The process for
WVTA homologation of accessories is cross-divisional and based on paper. Taking into
account the communication problem related to the fact of having division and
departments in many different locations, a workflow diagram brings relevant benefits in
terms of communication. When conducting interviews (unstructured by phone or focus
groups by Video conference) with people not on-site, the workflow diagrams are a
powerful tool to make a person understand the basics, the inter-dependencies between
people and the actions, the latter are required to take.
Once the process analysis gets into details, the workflow diagram becomes more precise
and its range of use becomes wider. The workflow diagram, according to Peppard and
Roland (1995), became helpful as a training tool as well as a mean of communication
with specific stakeholder of the process. Generally, the higher interest the stakeholders
had in the process the more there was the need to provide a detailed diagram or more
information to explain the contents of the diagram.
In addition, the workflow diagrams are a fundamental tool to use in software
development. As this project consisted of creating an electronic application for the
redesigned process a workflow diagram is needed, even though if not in its articulated
version as the ones used for software development purposes.
40
4.1.2 Stakeholder analysis
The process for WVTA homologation of accessories is a cross-divisional process which
is entirely managed by the NESAS C&A Engineering department, given that it is a
process that mostly involve engineering problems. The process‘ stakeholders present a
high variety in terms of functions as technical, business and marketing departments are
involved in the process. As a result, stakeholders have different interest in the process
and different expectations from it. As reengineering a process is also a matter of change
management, the issue of power is fundamental. The question was then: who is holding
the reins of the change?
The answer was given by the stakeholder analysis, which mapped all the stakeholders in
relation to their power and interest in the process. An additional reason to use the
stakeholders‘ mapping was also overcoming the problem of visibility of the
stakeholders: if a stakeholder is not ―visible‖, due to physical absence, it may be
considered as not important and thus forgotten when taking decision that will affect
him/her. Having all stakeholders mapped helps in not forgetting their importance and
asking their involvement, when needed.
To map the stakeholders‘ interest, the process manual was consulted to understand the
role and the task that each stakeholder had to perform. It was looked also the level in the
organisational chart. Then, it was considered the type of information they supplied as
input to the process and whether this could have been considered as critic information or
not.
4.1.3 Value added analysis
As the new process aims at improving the overall performance and meet the objectives
set in the previous phase, it will be counterproductive to keep non value-adding steps in
the new process. Hence, an analysis was conducted to identify the value-adding and non
value-adding activities of the process. The value-adding activities will be the focus when
setting a system of performance measurement. The application of the value-adding
analysis to the WVTA process will be described later in this paper.
4.1.4 Project objectives
Given that the goal of the reengineering process is to improve overall efficiency of the
process and information is the product of the process, the dimensions of business process
quality are examined in order to determine the objectives.
41
Dimensions of business process quality allowed to identify what were the problems
related to the type of data and information handled by the WVTA process. Based on that,
the project objectives were also better defined.
Quality dimensions of Business process are looked up because even though the aim of
the reengineering a process is to improve its performance and visibility, a set of
measures is needed in order to rate the redesigned process against the targets. Based on
that, it is possible to start the design activity.
The project analysis will clarify the ―as-is‖ situation, especially through the mapping of
the process. Given that the ultimate goal is to improve the overall process it can be
assessed on which of the dimensions the process need improvement. In particular, the
classification of the process can also help in determining the dimensions where the
process needs improvement. The project objectives setting can be summarised by the
equation:
Process analysis + BPQ = Project objectives
As explained in Chapter 3 by the literature review there are some problems in managing
information and data flows, which must be considered. In addition, the need of
reengineering with IT is generally driven by the need of bringing some kind of
improvement for the process. For instance, if the product delivered by a production
process is food, there may be quality parameters related to food as taste, freshness and so
on. Similarly, if the product of a process is information, information quality has to be
considered.
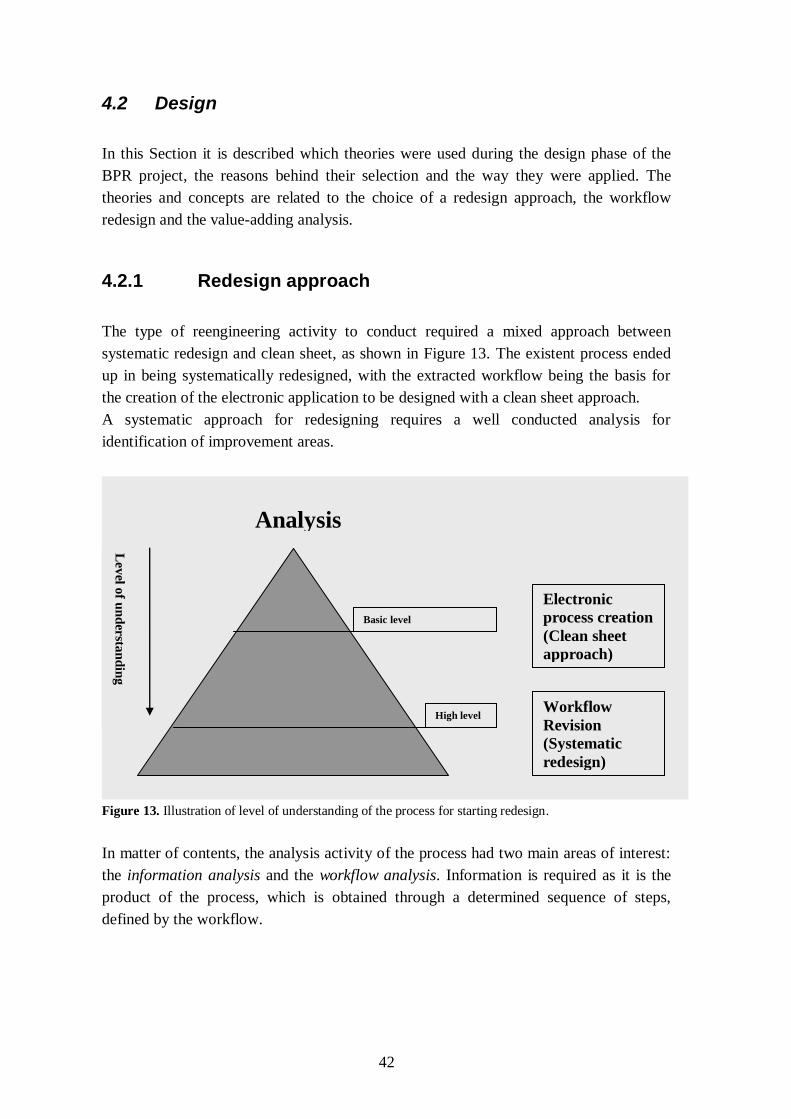
42
4.2 Design
In this Section it is described which theories were used during the design phase of the
BPR project, the reasons behind their selection and the way they were applied. The
theories and concepts are related to the choice of a redesign approach, the workflow
redesign and the value-adding analysis.
4.2.1 Redesign approach
The type of reengineering activity to conduct required a mixed approach between
systematic redesign and clean sheet, as shown in Figure 13. The existent process ended
up in being systematically redesigned, with the extracted workflow being the basis for
the creation of the electronic application to be designed with a clean sheet approach.
A systematic approach for redesigning requires a well conducted analysis for
identification of improvement areas.
Figure 13. Illustration of level of understanding of the process for starting redesign.
In matter of contents, the analysis activity of the process had two main areas of interest:
the information analysis and the workflow analysis. Information is required as it is the
product of the process, which is obtained through a determined sequence of steps,
defined by the workflow.
Electronic
process creation
(Clean sheet
approach)
Workflow
Revision
(Systematic
redesign)
Analysis
Lev
el of u
nd
ersta
nd
ing
Basic level
High level
43
4.2.2 Performance measurement system
The performance measurement system of the new process was set in relation to the
project objectives, according to Kaplan and Norton (1996).
The Dimensions of Business Process Quality and the criteria for Information Quality
were used to develop Performance Indicators. They were selected by the reengineering
team and approved to be used for a first set of measurement. It is plain how some of
them resulted in being ―intrinsic reasons‖ which motivate and trigger the introduction of
IT in organisations (e.g. documents lost, documents with no owner‘s info, etc). However,
these reasons are not always understood by companies, or simply they are not explicitly
stated.
The reason why a system of process performance measurement has to be set is to
evaluate if a process is capable to achieve its objectives and, if so, at what degree. The
measurement indicators set for a process should be considered, not only when the new
process is already in place, but also during its redesign in order to do a first qualitative
assessment. To create a performance measurement system for the process, some pre-
requisites are necessary:
1. The purpose of the process and the product that it delivers must be clear;
2. The objectives that the redesigned process should achieve have to be defined;
3. The value added activities have to be defined by the value-adding analysis, since
they will be the focus of the performance measurement system.
For this project, the prerequisites were necessary based on the following logical
sequence:
1. To improve the process (and its output) the focus is put on the product;
2. The process product is information (data are also supplied in order to generate
the output information);
3. The information is generated by the process performers and the actions they take
(not all the actions generate information: e.g. taking a pen do not generate
information, whereas using that pen to fill-out a form it will);
4. If actions are better performed, its output will improve;
5. To perform actions, the process performers use information and data, which
come from previous process steps and/or from the external environment.
In conclusion, information and data are the focus for improving the process: increasing
their quality will increase the overall process quality. Information and data quality
parameters have to be set and to do this, Information Quality theories are used. For the
purpose of this project, information and data will be handled differently, as it will be
further explained in this Section.
44
4.2.3 Internal process simulation
Internal process simulation, executed within the reengineering team, can be considered
as a milestone to mark the conclusion of the design phase. If its outcome is satisfactory,
the project can step into the implementation phase. Hence, the internal process
simulation is a sort of validation of the redesigned process, as also stated by Peppard and
Rowland (1995).
The choice of conducting an ―internal pilot‖ within the reengineering team was made to
avoid the pitfalls related to the selection of ―external‖ process performers. Though more
complicated to execute, an ―external pilot‖ would better raise awareness of the project
within the organisation and perhaps improve the implementation time shortening it.
Indeed, in order to raise change awareness and balance the choice of the pilot conducted
internally, the electronic application was at this stage tested with the departments on a
one-by-one basis. In this way, external feedbacks were received and considered to
develop the final application. The objective of conducting an internal pilot is the
assessment of whether improvements are made and the performance measurement
system set for the process is used for this purpose.
45
4.3 Implementation
For the implementation, the literature review indicates some practical actions to perform
and steps to follow in order to proceed. Those are the pilot process and roll-out, which
are hereby described.
4.3.1 Pilot
The pilot process is considered by Peppard and Rowland (1995) as key for the success of
the BPR programme. The Design phase of the BPR project aims at creating an electronic
application, which will then be run for a pilot process.
A key point was to provide stakeholders a vision of the new process once automated, so
that ideas could have been generated and implemented in the final version of the
application, to make it capable of better achieve the project objectives. The purpose is to
do a quick fixing in case some unconformities are found and get feedback for rapid
corrections in order to prepare the roll-out phase.
As indicated by Peppard and Rowland (1995), the pilot process needs a careful selection.
Sponsorship was used for internal simulation and one-by-one testing and different
strategies were used with the stakeholders, based on the stakeholders‘ analysis.
According to the stakeholder mapping, most involved stakeholders in the process were
involved frequently to get their feedback while less important departments were
consulted less frequently. The issue of stakeholders‘ involvement will be further
explained by the empirical work in Chapter 5. It was paid a particular attention on
recording the events in order to proceed with the fixing activities in case of need and
prepare in a sufficient manner the following pilot process
4.3.2 Roll out
The roll-out represents the actual implementation of the redesigned process and it is a
critic point as many authors report how BPR projects fails right at this time. The roll-out
it is also the activity that builds the ground for the final evaluation of the redesigned
process, which should start right after kicking-off the roll-out.
No specific planning with details on how to proceed with implementation was made.
Implementing the workflow changes did not require any big change for the process
performers except in terms of how to execute the process. Indeed, a process step was
eliminated without further changes in terms of roles and responsibilities for the other
process performers.
During the implementation, as the users are more confident with the tool, the
―weaknesses‖ of the electronic application tend to be highlighted and the main
suggestions for improvement are likely to appear at this time. Thus, the reengineering

46
team and the project leader should allow enough space to emerging suggestions for
improvements.
47
4.4 Evaluation
To evaluate the new process, Peppard and Rowland (1995) suggest two main actions to
perform, which are realise vision, followed by the identification of new areas of
improvement
4.4.1 Realise vision
Once the redesigned process is put in place with the pilot process, the evaluation activity
starts to assess the new process. Its performance has to be evaluated in order to identify
weaknesses and areas of improvement (Rowland and Peppard, 1995). For the purpose of
this project, a preliminary assessment is done on the basis of the performance system put
in place at the end of the Design phase. The preliminary character of the assessment is
due to the limited span of time available, whereas a thorough assessment requires a
longer span of time, demanding a systematic measurement on the process.
4.4.2 Identify new areas of improvement
As users become more trained, the redesigned process will be more and more used: then,
the implementation phase will tend to highlight more and more the ―weaknesses‖ of the
redesigned process.
The reengineering team and the project leader have to let emerge and encourage users‘
feedbacks in order to identify the areas of improvement.
A good point in having a business process which is automated, mapped and monitored
through all its passages and steps, consists of having a base of data which are organized
and easily understandable. An easier monitoring of the process, combined to user‘s
feedbacks, will set the way for further improvement of the redesigned process. All
activity carried out for the process can now be monitored using the electronic tool.
Numbers and costs can be implemented in the base of data.
People will use the tool more and more and will highlight any bad point as well as
improvements to make. However, even the evaluation and continuous improvement
activity needs project leader to catalyse all the activity related inputs and take ownership
of any action.
48
5 Chapter: The empirical work
In this Chapter is described the empirical work conduct for this project on the basis of
the four phases of the operational framework presented in Chapter 4. The analysis of the
existing process is conducted, the process is then redesign and implemented. The last
Section presents the evaluation of the redesigned process.
The empirical work was conducted in cooperation with the reengineering team,
composed by:
- The project leader;
- Two C&A Engineering Section Managers;
- The C&A Engineering Manager;
- The C&A Business & Product Planning Section Manager.
After the analysis and the redesign phases of the process were conducted, the
reengineering team composition did not include anymore the C&A Business and Product
Planning Section Manager, since implementation was purely a matter of the department
leader of the process, NESAS C&A Engineering. However, it has to be pointed out that
since C&A Engineering and C&A Business and Product Planning teams work in close
cooperation during the daily activities, a neat distinction can not be done: even if not
involved directly in the implementation activity, the NESAS C&A Business and Product
Planning Section Manager was consulted and kept informed.
The operational framework used for conducting the empirical work defines four phases
and, as already introduced in Chapter 4, it does not cover a scoping activity which was
done before the beginning of this project. Indeed, the scoping done for this project was
very limited; it consisted mostly in a kick-off of the project by the project leader.
However, some actions were performed in order to begin with the empirical work and
the analysis of the process: a BPR programme planning was established, which included
a project schedule and a communication planning with identification of all responsible
persons and their contact.
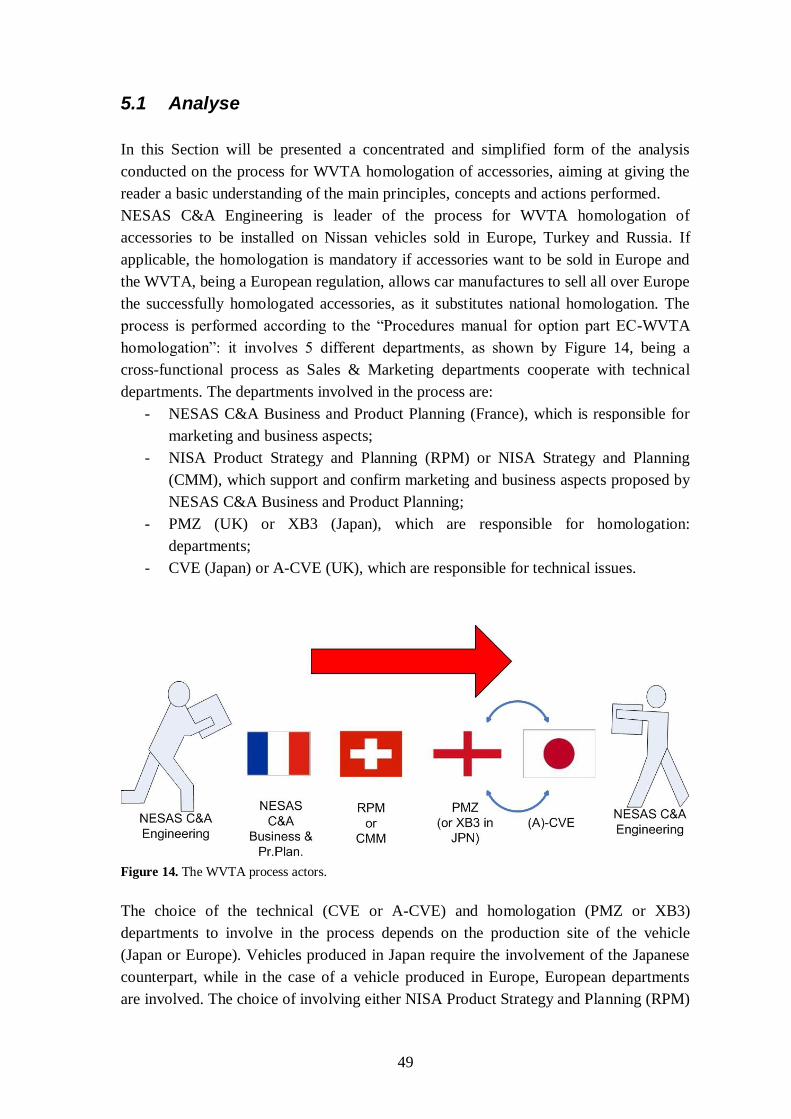
49
5.1 Analyse
In this Section will be presented a concentrated and simplified form of the analysis
conducted on the process for WVTA homologation of accessories, aiming at giving the
reader a basic understanding of the main principles, concepts and actions performed.
NESAS C&A Engineering is leader of the process for WVTA homologation of
accessories to be installed on Nissan vehicles sold in Europe, Turkey and Russia. If
applicable, the homologation is mandatory if accessories want to be sold in Europe and
the WVTA, being a European regulation, allows car manufactures to sell all over Europe
the successfully homologated accessories, as it substitutes national homologation. The
process is performed according to the ―Procedures manual for option part EC-WVTA
homologation‖: it involves 5 different departments, as shown by Figure 14, being a
cross-functional process as Sales & Marketing departments cooperate with technical
departments. The departments involved in the process are:
- NESAS C&A Business and Product Planning (France), which is responsible for
marketing and business aspects;
- NISA Product Strategy and Planning (RPM) or NISA Strategy and Planning
(CMM), which support and confirm marketing and business aspects proposed by
NESAS C&A Business and Product Planning;
- PMZ (UK) or XB3 (Japan), which are responsible for homologation:
departments;
- CVE (Japan) or A-CVE (UK), which are responsible for technical issues.
Figure 14. The WVTA process actors.
The choice of the technical (CVE or A-CVE) and homologation (PMZ or XB3)
departments to involve in the process depends on the production site of the vehicle
(Japan or Europe). Vehicles produced in Japan require the involvement of the Japanese
counterpart, while in the case of a vehicle produced in Europe, European departments
are involved. The choice of involving either NISA Product Strategy and Planning (RPM)
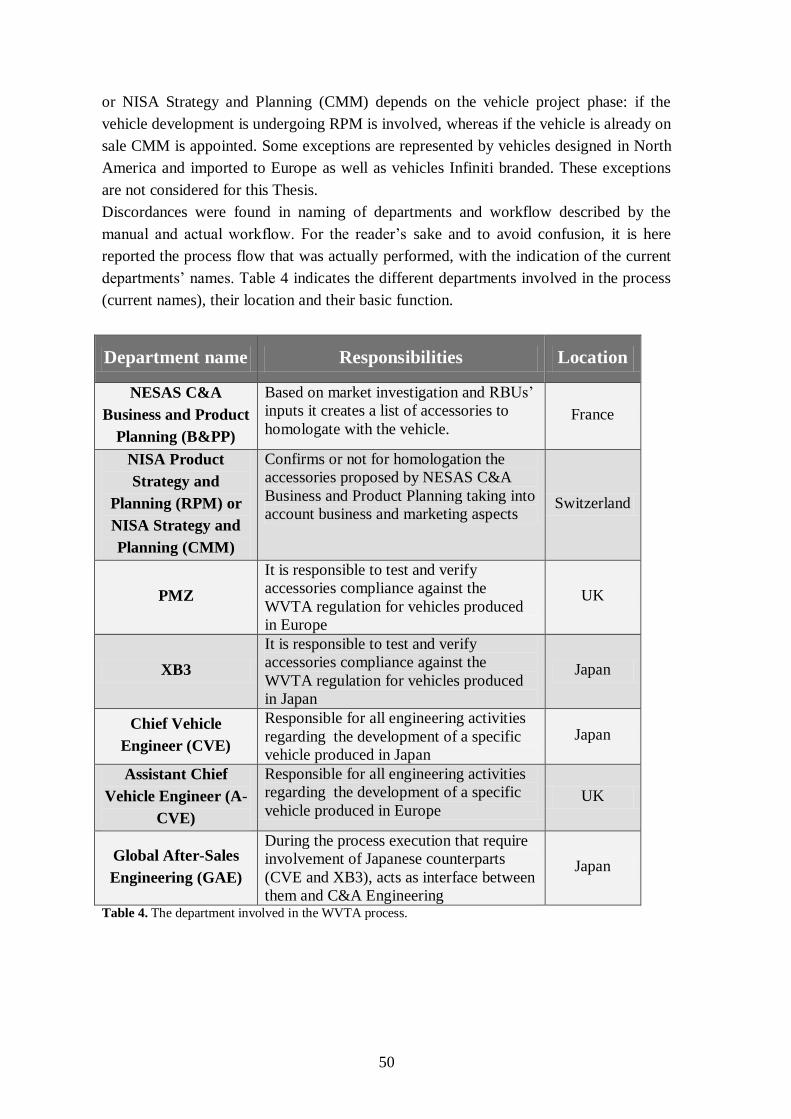
50
or NISA Strategy and Planning (CMM) depends on the vehicle project phase: if the
vehicle development is undergoing RPM is involved, whereas if the vehicle is already on
sale CMM is appointed. Some exceptions are represented by vehicles designed in North
America and imported to Europe as well as vehicles Infiniti branded. These exceptions
are not considered for this Thesis.
Discordances were found in naming of departments and workflow described by the
manual and actual workflow. For the reader‘s sake and to avoid confusion, it is here
reported the process flow that was actually performed, with the indication of the current
departments‘ names. Table 4 indicates the different departments involved in the process
(current names), their location and their basic function.
Department name Responsibilities Location
NESAS C&A
Business and Product
Planning (B&PP)
Based on market investigation and RBUs‘
inputs it creates a list of accessories to
homologate with the vehicle. France
NISA Product
Strategy and
Planning (RPM) or
NISA Strategy and
Planning (CMM)
Confirms or not for homologation the
accessories proposed by NESAS C&A
Business and Product Planning taking into
account business and marketing aspects Switzerland
PMZ
It is responsible to test and verify
accessories compliance against the
WVTA regulation for vehicles produced
in Europe
UK
XB3
It is responsible to test and verify
accessories compliance against the
WVTA regulation for vehicles produced
in Japan
Japan
Chief Vehicle
Engineer (CVE)
Responsible for all engineering activities
regarding the development of a specific
vehicle produced in Japan
Japan
Assistant Chief
Vehicle Engineer (A-
CVE)
Responsible for all engineering activities
regarding the development of a specific
vehicle produced in Europe UK
Global After-Sales
Engineering (GAE)
During the process execution that require
involvement of Japanese counterparts
(CVE and XB3), acts as interface between
them and C&A Engineering
Japan
Table 4. The department involved in the WVTA process.
51
5.1.1 Process description
The process is organised on a vehicle basis, meaning that a set of accessories that are
intended to be installed on a vehicle, are part of the same process flow (event) and
constitute a unique input for the process, in form of a list: the FOPL (Full Option Part
List).
The process schedule is set referring to the Start Of Sales (SOS) of the vehicle and it is
linked to the main process which organises the activity of the C&A After Sales Division,
the NESAS C&A After Sales Development Process.
At – 21 months to the Start of Sales of a vehicle NESAS C&A B&PP discusses with
NISA RPM/CMM about the accessories to be WVTA homologated and at month -18, it
creates the FOPL. However, as the process timing depends on the NESAS C&A After
Sales Development Process, it cannot be anyhow modified by this process or for its
purpose. Therefore, process schedule is not considered as a relevant aspect when
reengineering the process. The process is now analysed taking into account the process
inputs, steps and output.
5.1.1.1 Process inputs
FOPL
It is the main input of the process and its enables it. The FOPL (Full Option Part List),
shown in Figure 15, is a list, created by NESAS C&A Business and Product Planning,
which contains the accessories to homologate for a specific vehicle. The accessories are
defined on the basis of marketing investigations, performed with different techniques
(market analysis, customer profiles, competitor analysis, etc). Hence, the market and
customer wishes are the triggers to define the list of accessories which will be
homologated with the vehicle (e.g. alloy wheel, parking systems, alarms, styling
accessories, etc..). Without homologation, the accessories cannot be sold in the market.
NESAS C&A Business and Product Planning and NISA RPM (or CMM) both sign the
document.
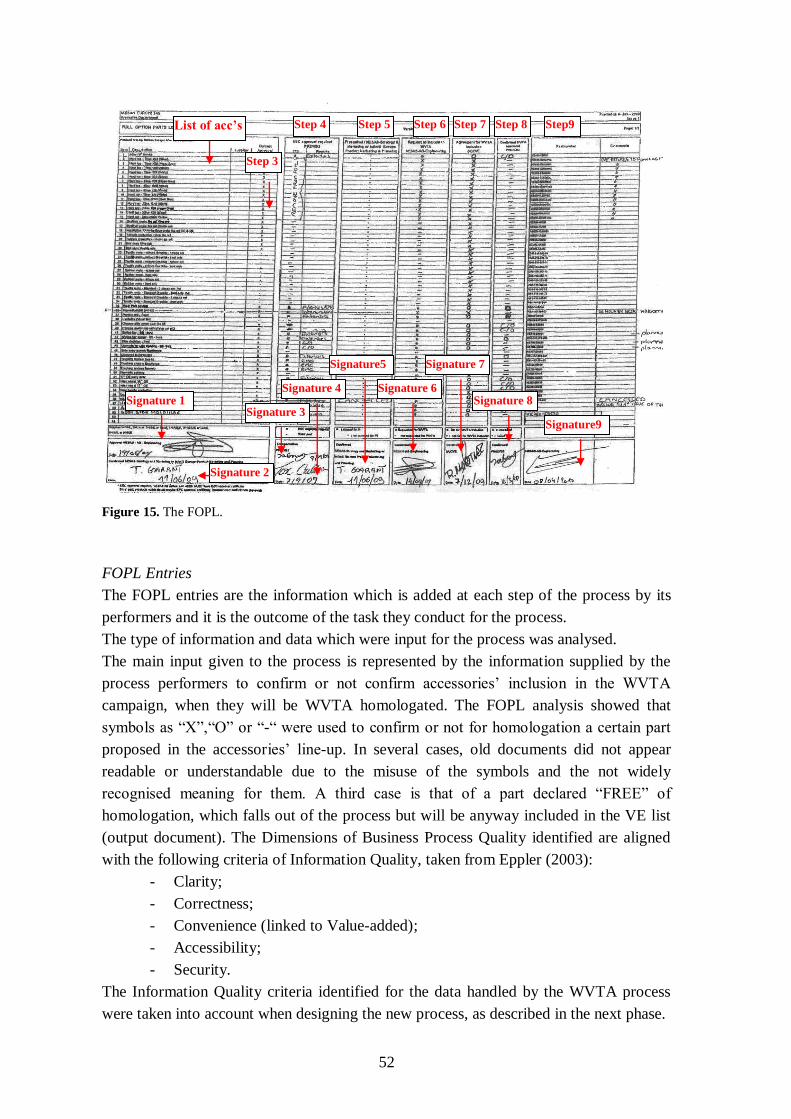
52
Figure 15. The FOPL.
FOPL Entries
The FOPL entries are the information which is added at each step of the process by its
performers and it is the outcome of the task they conduct for the process.
The type of information and data which were input for the process was analysed.
The main input given to the process is represented by the information supplied by the
process performers to confirm or not confirm accessories‘ inclusion in the WVTA
campaign, when they will be WVTA homologated. The FOPL analysis showed that
symbols as ―X‖,―O‖ or ―-― were used to confirm or not for homologation a certain part
proposed in the accessories‘ line-up. In several cases, old documents did not appear
readable or understandable due to the misuse of the symbols and the not widely
recognised meaning for them. A third case is that of a part declared ―FREE‖ of
homologation, which falls out of the process but will be anyway included in the VE list
(output document). The Dimensions of Business Process Quality identified are aligned
with the following criteria of Information Quality, taken from Eppler (2003):
- Clarity;
- Correctness;
- Convenience (linked to Value-added);
- Accessibility;
- Security.
The Information Quality criteria identified for the data handled by the WVTA process
were taken into account when designing the new process, as described in the next phase.
List of acc’s
Signature 1
Signature 2
Signature 3
Signature 4
Signature5
Signature 6
Signature 7
Signature 8
Signature9
Step 3
Step 4 Step 5 Step 6 Step 7 Step 8 Step9
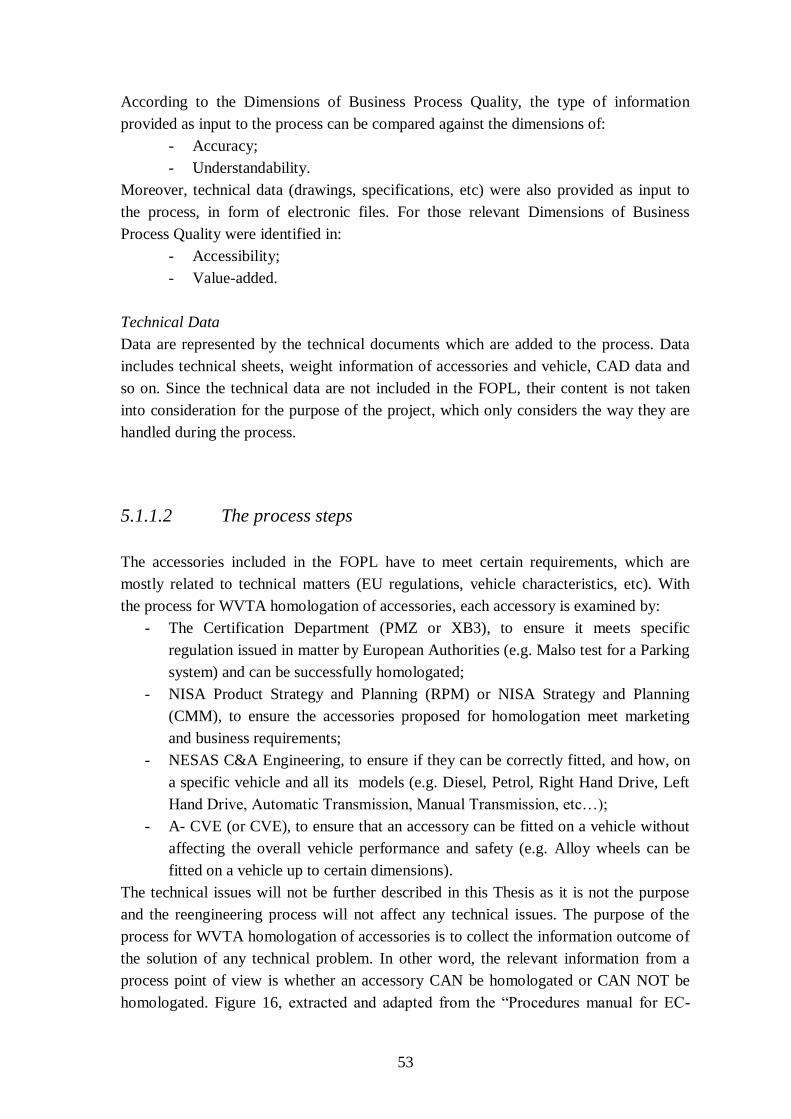
53
According to the Dimensions of Business Process Quality, the type of information
provided as input to the process can be compared against the dimensions of:
- Accuracy;
- Understandability.
Moreover, technical data (drawings, specifications, etc) were also provided as input to
the process, in form of electronic files. For those relevant Dimensions of Business
Process Quality were identified in:
- Accessibility;
- Value-added.
Technical Data
Data are represented by the technical documents which are added to the process. Data
includes technical sheets, weight information of accessories and vehicle, CAD data and
so on. Since the technical data are not included in the FOPL, their content is not taken
into consideration for the purpose of the project, which only considers the way they are
handled during the process.
5.1.1.2 The process steps
The accessories included in the FOPL have to meet certain requirements, which are
mostly related to technical matters (EU regulations, vehicle characteristics, etc). With
the process for WVTA homologation of accessories, each accessory is examined by:
- The Certification Department (PMZ or XB3), to ensure it meets specific
regulation issued in matter by European Authorities (e.g. Malso test for a Parking
system) and can be successfully homologated;
- NISA Product Strategy and Planning (RPM) or NISA Strategy and Planning
(CMM), to ensure the accessories proposed for homologation meet marketing
and business requirements;
- NESAS C&A Engineering, to ensure if they can be correctly fitted, and how, on
a specific vehicle and all its models (e.g. Diesel, Petrol, Right Hand Drive, Left
Hand Drive, Automatic Transmission, Manual Transmission, etc…);
- A- CVE (or CVE), to ensure that an accessory can be fitted on a vehicle without
affecting the overall vehicle performance and safety (e.g. Alloy wheels can be
fitted on a vehicle up to certain dimensions).
The technical issues will not be further described in this Thesis as it is not the purpose
and the reengineering process will not affect any technical issues. The purpose of the
process for WVTA homologation of accessories is to collect the information outcome of
the solution of any technical problem. In other word, the relevant information from a
process point of view is whether an accessory CAN be homologated or CAN NOT be
homologated. Figure 16, extracted and adapted from the ―Procedures manual for EC-
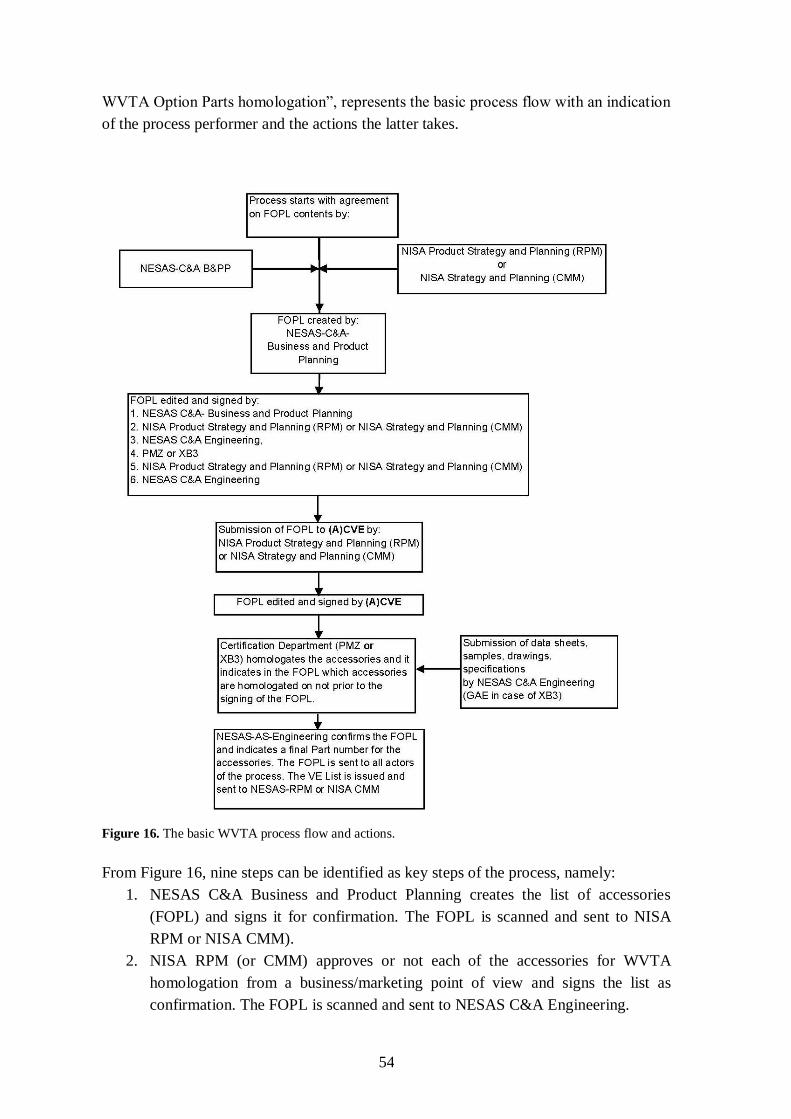
54
WVTA Option Parts homologation‖, represents the basic process flow with an indication
of the process performer and the actions the latter takes.
Figure 16. The basic WVTA process flow and actions.
From Figure 16, nine steps can be identified as key steps of the process, namely:
1. NESAS C&A Business and Product Planning creates the list of accessories
(FOPL) and signs it for confirmation. The FOPL is scanned and sent to NISA
RPM or NISA CMM).
2. NISA RPM (or CMM) approves or not each of the accessories for WVTA
homologation from a business/marketing point of view and signs the list as
confirmation. The FOPL is scanned and sent to NESAS C&A Engineering.
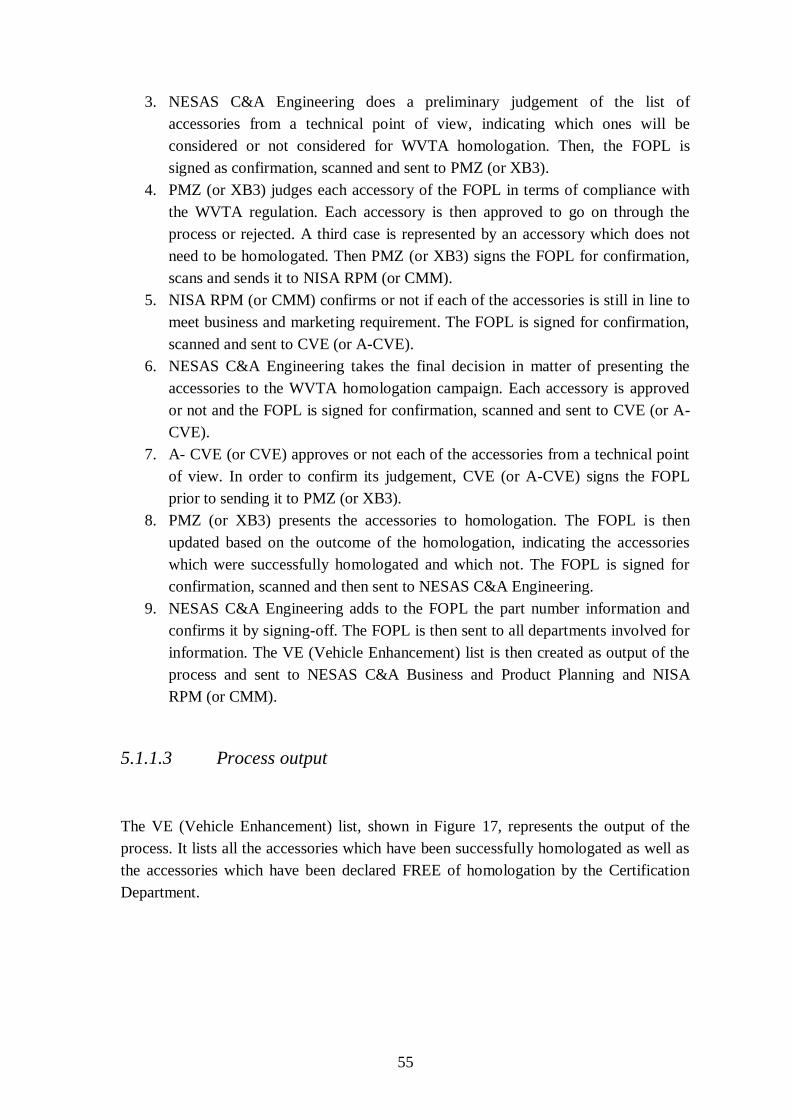
55
3. NESAS C&A Engineering does a preliminary judgement of the list of
accessories from a technical point of view, indicating which ones will be
considered or not considered for WVTA homologation. Then, the FOPL is
signed as confirmation, scanned and sent to PMZ (or XB3).
4. PMZ (or XB3) judges each accessory of the FOPL in terms of compliance with
the WVTA regulation. Each accessory is then approved to go on through the
process or rejected. A third case is represented by an accessory which does not
need to be homologated. Then PMZ (or XB3) signs the FOPL for confirmation,
scans and sends it to NISA RPM (or CMM).
5. NISA RPM (or CMM) confirms or not if each of the accessories is still in line to
meet business and marketing requirement. The FOPL is signed for confirmation,
scanned and sent to CVE (or A-CVE).
6. NESAS C&A Engineering takes the final decision in matter of presenting the
accessories to the WVTA homologation campaign. Each accessory is approved
or not and the FOPL is signed for confirmation, scanned and sent to CVE (or A-
CVE).
7. A- CVE (or CVE) approves or not each of the accessories from a technical point
of view. In order to confirm its judgement, CVE (or A-CVE) signs the FOPL
prior to sending it to PMZ (or XB3).
8. PMZ (or XB3) presents the accessories to homologation. The FOPL is then
updated based on the outcome of the homologation, indicating the accessories
which were successfully homologated and which not. The FOPL is signed for
confirmation, scanned and then sent to NESAS C&A Engineering.
9. NESAS C&A Engineering adds to the FOPL the part number information and
confirms it by signing-off. The FOPL is then sent to all departments involved for
information. The VE (Vehicle Enhancement) list is then created as output of the
process and sent to NESAS C&A Business and Product Planning and NISA
RPM (or CMM).
5.1.1.3 Process output
The VE (Vehicle Enhancement) list, shown in Figure 17, represents the output of the
process. It lists all the accessories which have been successfully homologated as well as
the accessories which have been declared FREE of homologation by the Certification
Department.
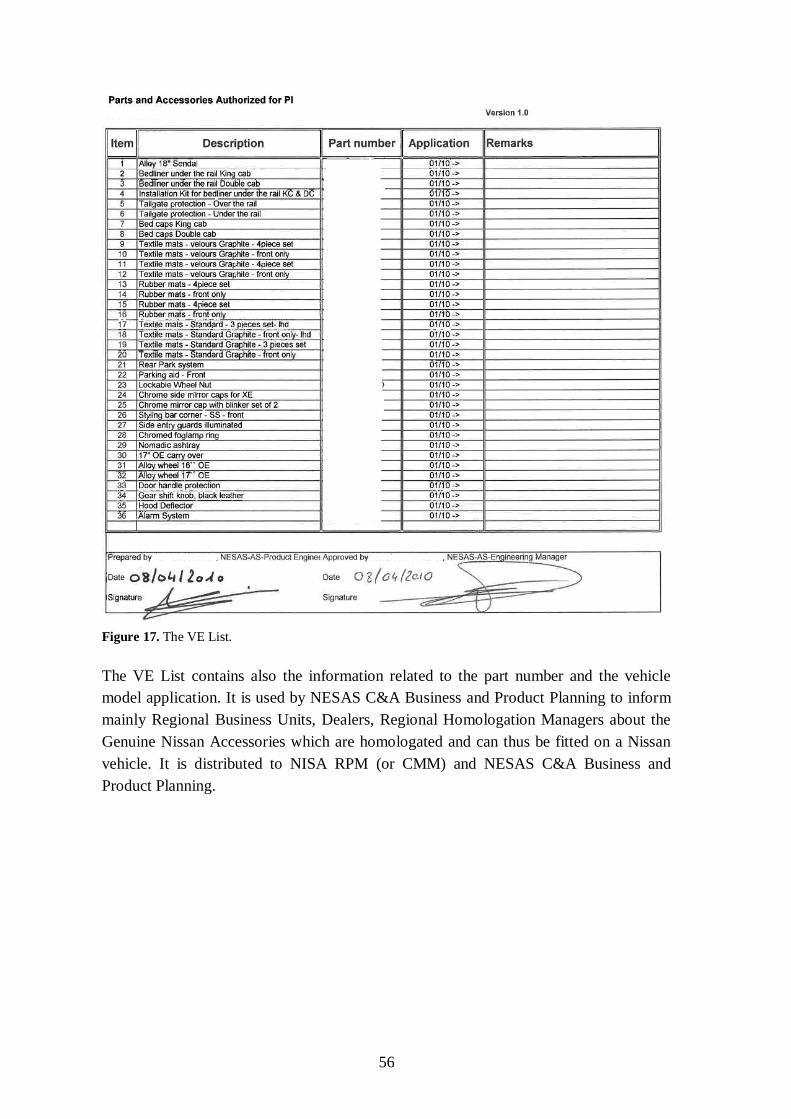
56
Figure 17. The VE List.
The VE List contains also the information related to the part number and the vehicle
model application. It is used by NESAS C&A Business and Product Planning to inform
mainly Regional Business Units, Dealers, Regional Homologation Managers about the
Genuine Nissan Accessories which are homologated and can thus be fitted on a Nissan
vehicle. It is distributed to NISA RPM (or CMM) and NESAS C&A Business and
Product Planning.
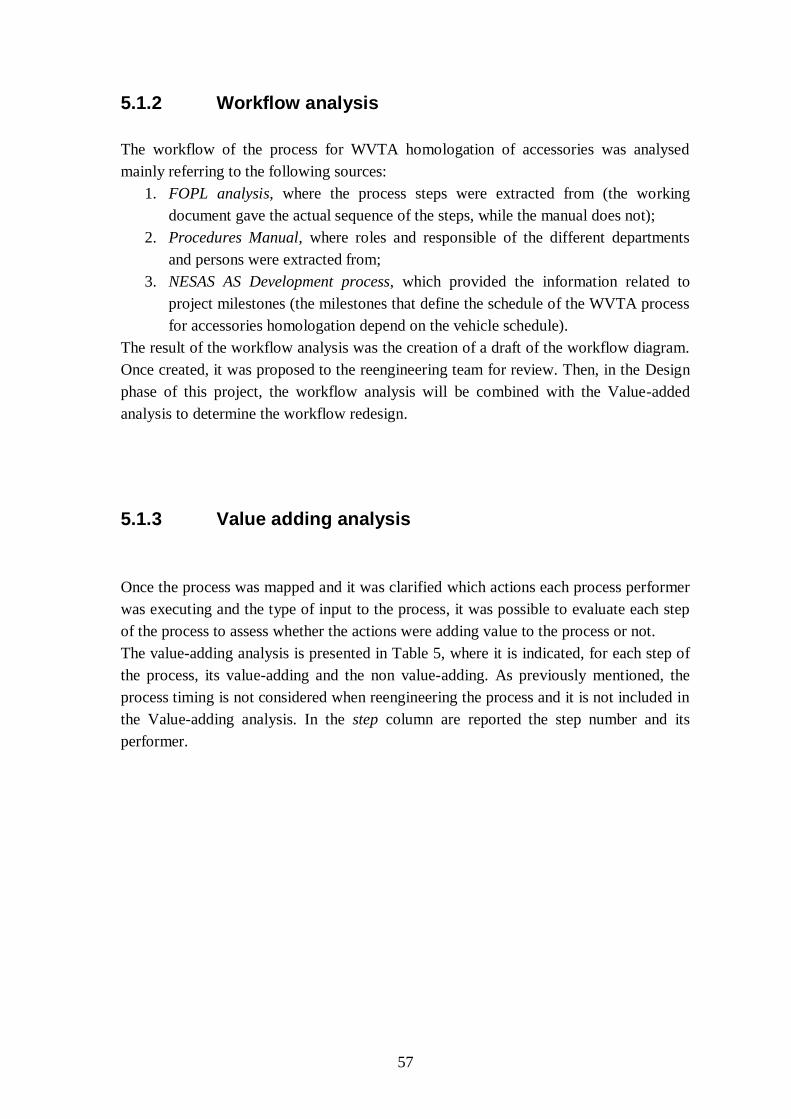
57
5.1.2 Workflow analysis
The workflow of the process for WVTA homologation of accessories was analysed
mainly referring to the following sources:
1. FOPL analysis, where the process steps were extracted from (the working
document gave the actual sequence of the steps, while the manual does not);
2. Procedures Manual, where roles and responsible of the different departments
and persons were extracted from;
3. NESAS AS Development process, which provided the information related to
project milestones (the milestones that define the schedule of the WVTA process
for accessories homologation depend on the vehicle schedule).
The result of the workflow analysis was the creation of a draft of the workflow diagram.
Once created, it was proposed to the reengineering team for review. Then, in the Design
phase of this project, the workflow analysis will be combined with the Value-added
analysis to determine the workflow redesign.
5.1.3 Value adding analysis
Once the process was mapped and it was clarified which actions each process performer
was executing and the type of input to the process, it was possible to evaluate each step
of the process to assess whether the actions were adding value to the process or not.
The value-adding analysis is presented in Table 5, where it is indicated, for each step of
the process, its value-adding and the non value-adding. As previously mentioned, the
process timing is not considered when reengineering the process and it is not included in
the Value-adding analysis. In the step column are reported the step number and its
performer.
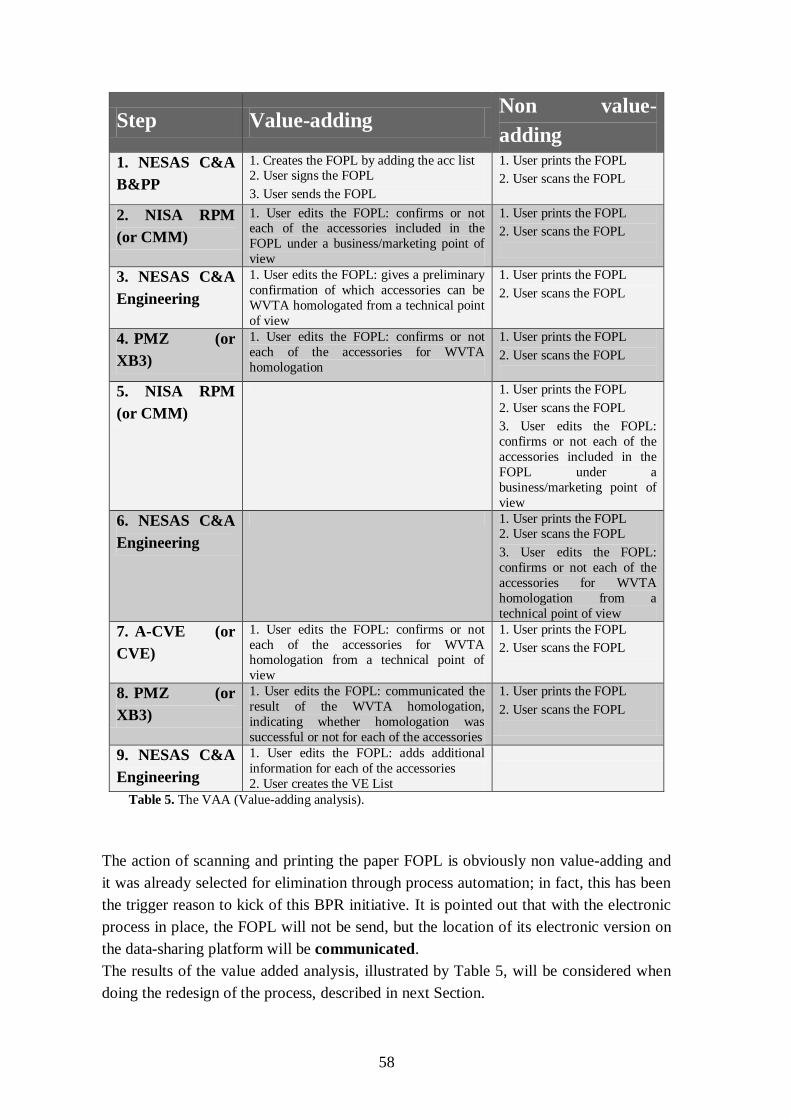
58
Step Value-adding Non value-
adding
1. NESAS C&A
B&PP
1. Creates the FOPL by adding the acc list 2. User signs the FOPL
3. User sends the FOPL
1. User prints the FOPL
2. User scans the FOPL
2. NISA RPM
(or CMM)
1. User edits the FOPL: confirms or not each of the accessories included in the
FOPL under a business/marketing point of
view
1. User prints the FOPL
2. User scans the FOPL
3. NESAS C&A
Engineering
1. User edits the FOPL: gives a preliminary
confirmation of which accessories can be
WVTA homologated from a technical point
of view
1. User prints the FOPL
2. User scans the FOPL
4. PMZ (or
XB3)
1. User edits the FOPL: confirms or not
each of the accessories for WVTA
homologation
1. User prints the FOPL
2. User scans the FOPL
5. NISA RPM
(or CMM)
1. User prints the FOPL
2. User scans the FOPL
3. User edits the FOPL:
confirms or not each of the
accessories included in the
FOPL under a
business/marketing point of
view
6. NESAS C&A
Engineering
1. User prints the FOPL 2. User scans the FOPL
3. User edits the FOPL:
confirms or not each of the
accessories for WVTA
homologation from a
technical point of view
7. A-CVE (or
CVE)
1. User edits the FOPL: confirms or not
each of the accessories for WVTA homologation from a technical point of
view
1. User prints the FOPL
2. User scans the FOPL
8. PMZ (or
XB3)
1. User edits the FOPL: communicated the
result of the WVTA homologation,
indicating whether homologation was
successful or not for each of the accessories
1. User prints the FOPL
2. User scans the FOPL
9. NESAS C&A
Engineering
1. User edits the FOPL: adds additional
information for each of the accessories
2. User creates the VE List
Table 5. The VAA (Value-adding analysis).
The action of scanning and printing the paper FOPL is obviously non value-adding and
it was already selected for elimination through process automation; in fact, this has been
the trigger reason to kick of this BPR initiative. It is pointed out that with the electronic
process in place, the FOPL will not be send, but the location of its electronic version on
the data-sharing platform will be communicated.
The results of the value added analysis, illustrated by Table 5, will be considered when
doing the redesign of the process, described in next Section.
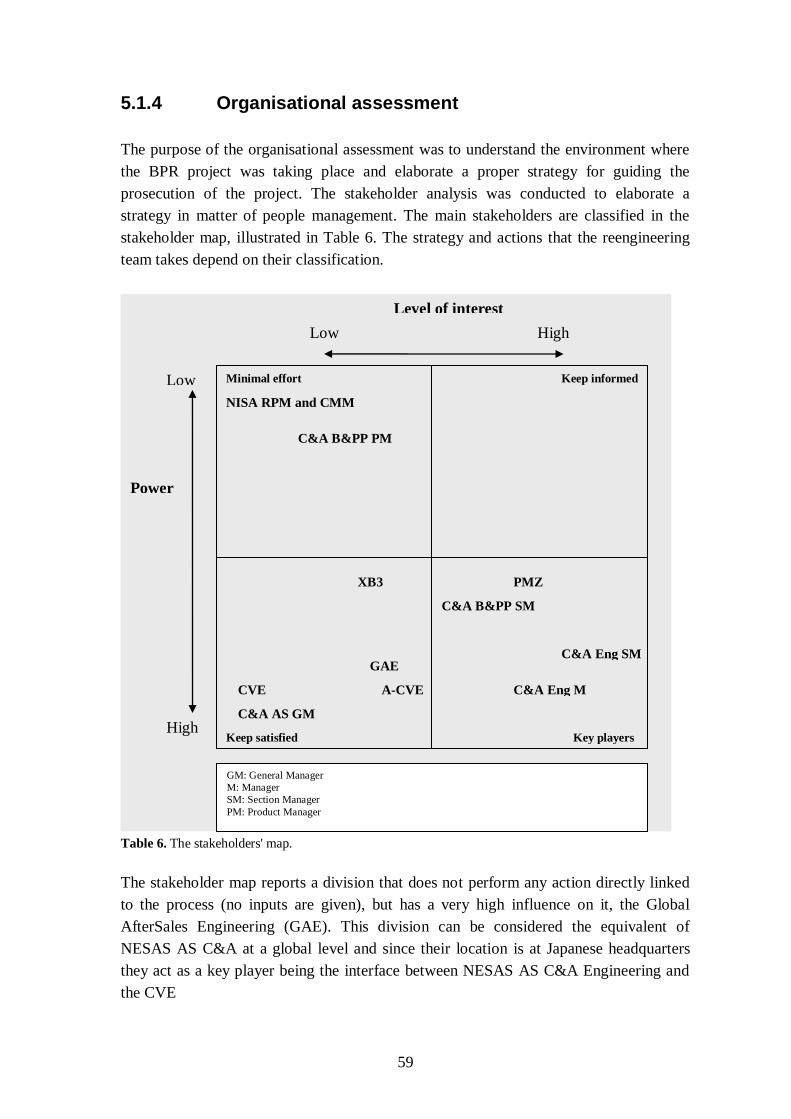
59
5.1.4 Organisational assessment
The purpose of the organisational assessment was to understand the environment where
the BPR project was taking place and elaborate a proper strategy for guiding the
prosecution of the project. The stakeholder analysis was conducted to elaborate a
strategy in matter of people management. The main stakeholders are classified in the
stakeholder map, illustrated in Table 6. The strategy and actions that the reengineering
team takes depend on their classification.
Table 6. The stakeholders' map.
The stakeholder map reports a division that does not perform any action directly linked
to the process (no inputs are given), but has a very high influence on it, the Global
AfterSales Engineering (GAE). This division can be considered the equivalent of
NESAS AS C&A at a global level and since their location is at Japanese headquarters
they act as a key player being the interface between NESAS AS C&A Engineering and
the CVE
Keep satisfied
XB3
C&A B&PP PM
GAE
NISA RPM and CMM
C&A Eng SM
Key players
Minimal effort Keep informed
Power
Level of interest
Low
Low High
High C&A AS GM
C&A Eng M
PMZ
CVE A-CVE
GM: General Manager
M: Manager
SM: Section Manager
PM: Product Manager
C&A B&PP SM
60
5.1.5 BPR Project Objectives
Often, at project birth the objectives are not precisely identified as the reengineering
team and the organisation know only roughly what outcome has to be generated by the
redesign of the project (e.g. financial benefits, process speed increase, etc). That is why
they will be identified after some analysis of the project where it will be clearer which
are the aspects that will need to be improved resulting in be more precise and detailed
targets for the BPR project. Turning a data flow from paper to an electronic format
brings several benefits, mainly related to data handling and management.
Taking inspiration from the theory on Information Quality, some Performance Indicators
(PI) were developed as candidates to monitor the performance of the chosen solutions
for BPR activity and evaluate the grade of achievement of the objectives. The first step
was to examine the Dimensions of Business Process Quality to draw the items which can
be suitable to rate a data and information flow.
The followings were selected:
- Security
- Reliability
- User satisfaction
- Accessibility
- Time efficiency
Based on the five dimensions of Business Process Quality selected, five main objectives
of the BPR project, shown in Table 7, were identified by the reengineering team.
Objective User-friendliness
Communication
Data sharing
Security
Process Speed
Table 7. The BPR project objectives.
User-friendliness was required due to the fact of having an electronic application: this
had to be easy to use in order to facilitate users‘ tasks, similarly to any well known
electronic application based on Windows system (e.g. consider a Windows Media Player,
with a main window where buttons click perform several actions and menus to access
the various options).
Communication among all departments and through all the process phases (including
communication of process outcome) had to be improved; communication also emerged
as a critic aspect of the process during its internal audit.
61
Data-sharing was also identified by the internal audit as a matter of improvement, as the
WVTA process includes, other than the FOPL and the VE list, additional documentation
which need to be shared among departments and people involved in the process: as all
documentation is necessary for process actors in deciding their input to the process, it
has to be widely available, accessible and traceable.
Since paper documents used for the process are continuously scanned, sent and then
carelessly trashed and/or abandoned, security emerged as a key aspect to be considered
when reengineering the process: data and information handled by the process had to be
kept reserved to process users, stakeholders and, when necessary, other selected persons.
The process speed was obviously affected by the fact of having a paper-based process,
as the working document (FOPL) needed to be printed out, filled in and scanned in order
to be submitted to the next accountable person in the process.
The BPR project objectives will be taken into account to set a proper system of
performance measurement in form of Performance Indicators, as described in the next
Section.
5.1.6 IT assessment
An IT assessment was conducted to know what kinds of IT software packages were used
within the company and by which departments. Other than common software (e.g. MS
Office suite, Adobe), there are many software packages specifically targeted for some
divisions, thus not available worldwide for all companies divisions due to different
reasons (costs, internal IT resources, security, etc). However, the eRoom platform is
worldwide available for all Nissan employees, which allows users to share information,
files and databases in a secured environment that they can access prior to a required
authentication.
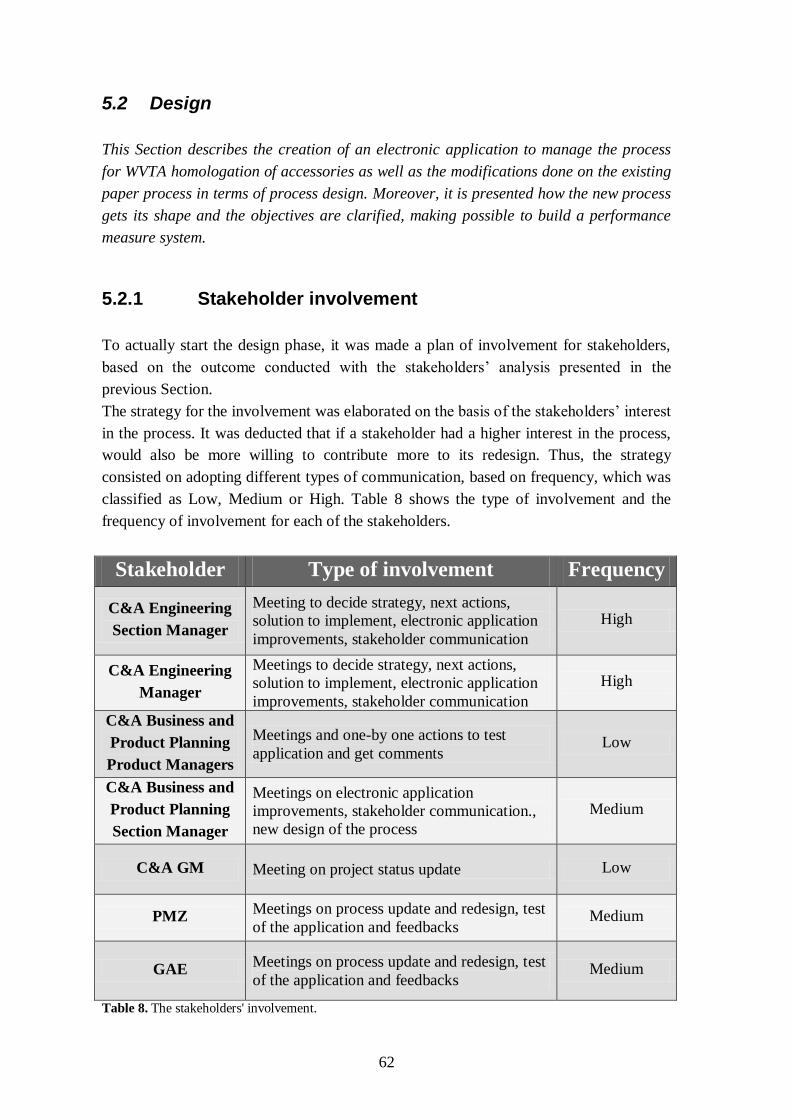
62
5.2 Design
This Section describes the creation of an electronic application to manage the process
for WVTA homologation of accessories as well as the modifications done on the existing
paper process in terms of process design. Moreover, it is presented how the new process
gets its shape and the objectives are clarified, making possible to build a performance
measure system.
5.2.1 Stakeholder involvement
To actually start the design phase, it was made a plan of involvement for stakeholders,
based on the outcome conducted with the stakeholders‘ analysis presented in the
previous Section.
The strategy for the involvement was elaborated on the basis of the stakeholders‘ interest
in the process. It was deducted that if a stakeholder had a higher interest in the process,
would also be more willing to contribute more to its redesign. Thus, the strategy
consisted on adopting different types of communication, based on frequency, which was
classified as Low, Medium or High. Table 8 shows the type of involvement and the
frequency of involvement for each of the stakeholders.
Stakeholder Type of involvement Frequency
C&A Engineering
Section Manager
Meeting to decide strategy, next actions,
solution to implement, electronic application
improvements, stakeholder communication
High
C&A Engineering
Manager
Meetings to decide strategy, next actions,
solution to implement, electronic application
improvements, stakeholder communication
High
C&A Business and
Product Planning
Product Managers
Meetings and one-by one actions to test
application and get comments Low
C&A Business and
Product Planning
Section Manager
Meetings on electronic application
improvements, stakeholder communication.,
new design of the process
Medium
C&A GM Meeting on project status update Low
PMZ Meetings on process update and redesign, test
of the application and feedbacks Medium
GAE Meetings on process update and redesign, test
of the application and feedbacks Medium
Table 8. The stakeholders' involvement.
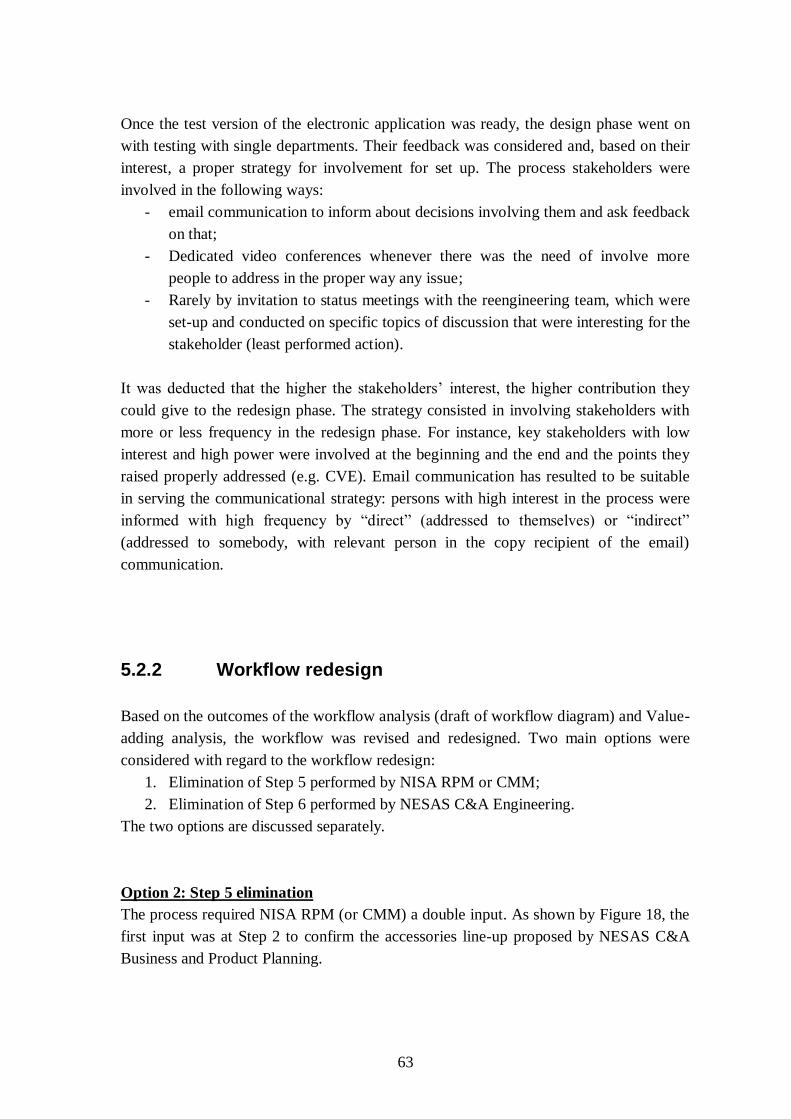
63
Once the test version of the electronic application was ready, the design phase went on
with testing with single departments. Their feedback was considered and, based on their
interest, a proper strategy for involvement for set up. The process stakeholders were
involved in the following ways:
- email communication to inform about decisions involving them and ask feedback
on that;
- Dedicated video conferences whenever there was the need of involve more
people to address in the proper way any issue;
- Rarely by invitation to status meetings with the reengineering team, which were
set-up and conducted on specific topics of discussion that were interesting for the
stakeholder (least performed action).
It was deducted that the higher the stakeholders‘ interest, the higher contribution they
could give to the redesign phase. The strategy consisted in involving stakeholders with
more or less frequency in the redesign phase. For instance, key stakeholders with low
interest and high power were involved at the beginning and the end and the points they
raised properly addressed (e.g. CVE). Email communication has resulted to be suitable
in serving the communicational strategy: persons with high interest in the process were
informed with high frequency by ―direct‖ (addressed to themselves) or ―indirect‖
(addressed to somebody, with relevant person in the copy recipient of the email)
communication.
5.2.2 Workflow redesign
Based on the outcomes of the workflow analysis (draft of workflow diagram) and Value-
adding analysis, the workflow was revised and redesigned. Two main options were
considered with regard to the workflow redesign:
1. Elimination of Step 5 performed by NISA RPM or CMM;
2. Elimination of Step 6 performed by NESAS C&A Engineering.
The two options are discussed separately.
Option 2: Step 5 elimination
The process required NISA RPM (or CMM) a double input. As shown by Figure 18, the
first input was at Step 2 to confirm the accessories line-up proposed by NESAS C&A
Business and Product Planning.
64
Figure 18. Elimination of non value-adding step from the process.
Then, NISA RPM (or CMM) was asked to take a second action at Step 5, after NESAS
C&A Engineering second input to the process. The FOPL analysis highlighted how
NISA RPM (or CMM) was taking both actions at the time of their first involvement (at
Step 2, FOPL was signed for both Step 2 and Step 6). It was not possible to get any
explication for this matter of fact; thus, the reengineering team concluded that the second
action required to NISA RPM (or CMM) was actually not bringing any added-value to
the process: the step was eliminated from the process flow.
Option 1: Step 6 elimination
As shown by the Value-adding analysis in Table 5, NESAS C&A Engineering performs
at Step 6 the same action as Step 3. Thus, it was considered to eliminate Step 6.
Eventually, the reengineering team decided to keep the Step 6 for reasons which are
partially depending on its contribute to the process in term of information. Indeed, the
functions of Step 6 are mainly monitoring the process and establish a proper
communication with the Chief Vehicle engineering (or A-CVE), which is a key actor for
the process. In addition, communication is even more critical when the Japanese
counterpart is involved in the process (CVE), making the role of C&A Engineering even
more critical in terms of communication.
1,
2
3
4
5
6
7
8
9
1,
2
3
4
5
6
7
8
NISA RPM
or
NISA CMM
NESAS C&A
Engineering
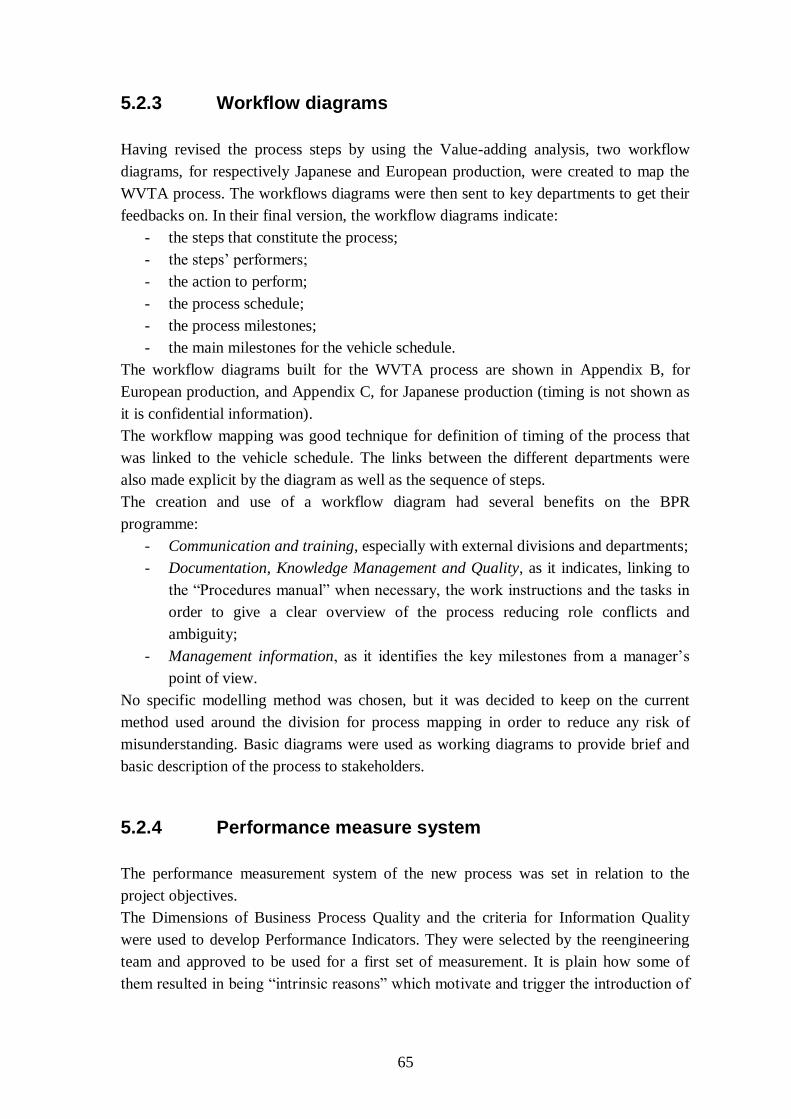
65
5.2.3 Workflow diagrams
Having revised the process steps by using the Value-adding analysis, two workflow
diagrams, for respectively Japanese and European production, were created to map the
WVTA process. The workflows diagrams were then sent to key departments to get their
feedbacks on. In their final version, the workflow diagrams indicate:
- the steps that constitute the process;
- the steps‘ performers;
- the action to perform;
- the process schedule;
- the process milestones;
- the main milestones for the vehicle schedule.
The workflow diagrams built for the WVTA process are shown in Appendix B, for
European production, and Appendix C, for Japanese production (timing is not shown as
it is confidential information).
The workflow mapping was good technique for definition of timing of the process that
was linked to the vehicle schedule. The links between the different departments were
also made explicit by the diagram as well as the sequence of steps.
The creation and use of a workflow diagram had several benefits on the BPR
programme:
- Communication and training, especially with external divisions and departments;
- Documentation, Knowledge Management and Quality, as it indicates, linking to
the ―Procedures manual‖ when necessary, the work instructions and the tasks in
order to give a clear overview of the process reducing role conflicts and
ambiguity;
- Management information, as it identifies the key milestones from a manager‘s
point of view.
No specific modelling method was chosen, but it was decided to keep on the current
method used around the division for process mapping in order to reduce any risk of
misunderstanding. Basic diagrams were used as working diagrams to provide brief and
basic description of the process to stakeholders.
5.2.4 Performance measure system
The performance measurement system of the new process was set in relation to the
project objectives.
The Dimensions of Business Process Quality and the criteria for Information Quality
were used to develop Performance Indicators. They were selected by the reengineering
team and approved to be used for a first set of measurement. It is plain how some of
them resulted in being ―intrinsic reasons‖ which motivate and trigger the introduction of
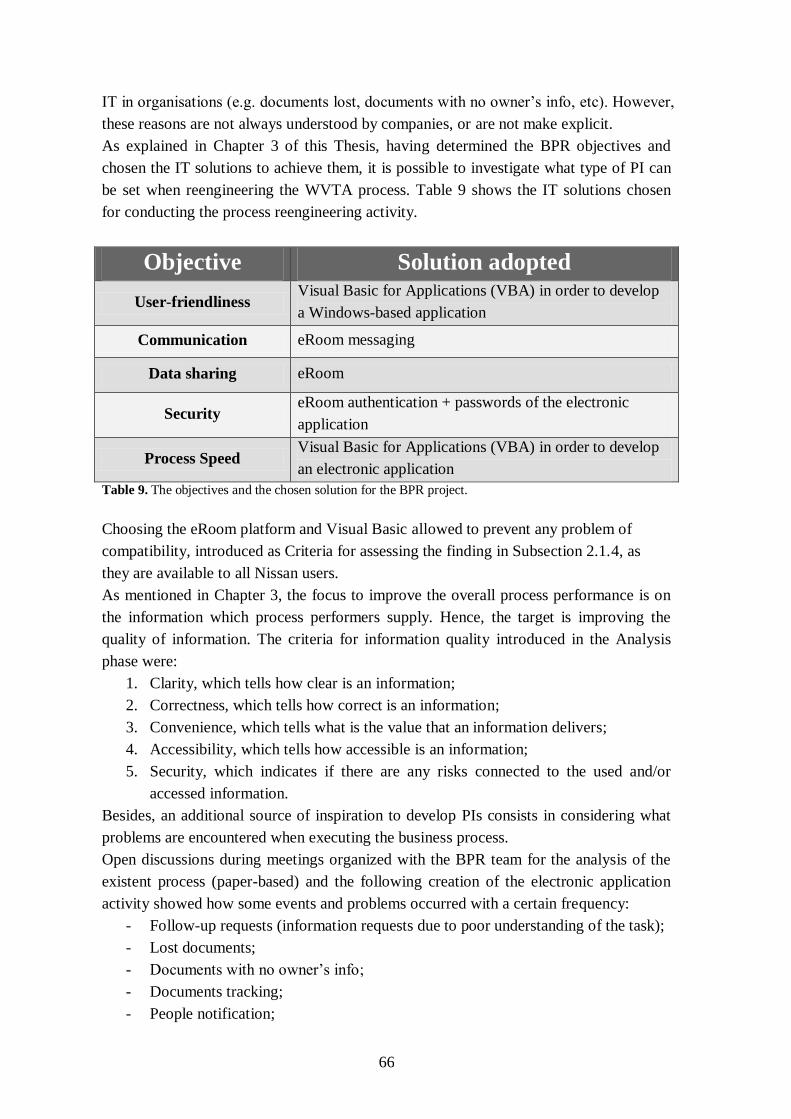
66
IT in organisations (e.g. documents lost, documents with no owner‘s info, etc). However,
these reasons are not always understood by companies, or are not make explicit.
As explained in Chapter 3 of this Thesis, having determined the BPR objectives and
chosen the IT solutions to achieve them, it is possible to investigate what type of PI can
be set when reengineering the WVTA process. Table 9 shows the IT solutions chosen
for conducting the process reengineering activity.
Objective Solution adopted
User-friendliness Visual Basic for Applications (VBA) in order to develop
a Windows-based application
Communication eRoom messaging
Data sharing eRoom
Security eRoom authentication + passwords of the electronic
application
Process Speed Visual Basic for Applications (VBA) in order to develop
an electronic application
Table 9. The objectives and the chosen solution for the BPR project.
Choosing the eRoom platform and Visual Basic allowed to prevent any problem of
compatibility, introduced as Criteria for assessing the finding in Subsection 2.1.4, as
they are available to all Nissan users.
As mentioned in Chapter 3, the focus to improve the overall process performance is on
the information which process performers supply. Hence, the target is improving the
quality of information. The criteria for information quality introduced in the Analysis
phase were:
1. Clarity, which tells how clear is an information;
2. Correctness, which tells how correct is an information;
3. Convenience, which tells what is the value that an information delivers;
4. Accessibility, which tells how accessible is an information;
5. Security, which indicates if there are any risks connected to the used and/or
accessed information.
Besides, an additional source of inspiration to develop PIs consists in considering what
problems are encountered when executing the business process.
Open discussions during meetings organized with the BPR team for the analysis of the
existent process (paper-based) and the following creation of the electronic application
activity showed how some events and problems occurred with a certain frequency:
- Follow-up requests (information requests due to poor understanding of the task);
- Lost documents;
- Documents with no owner‘s info;
- Documents tracking;
- People notification;
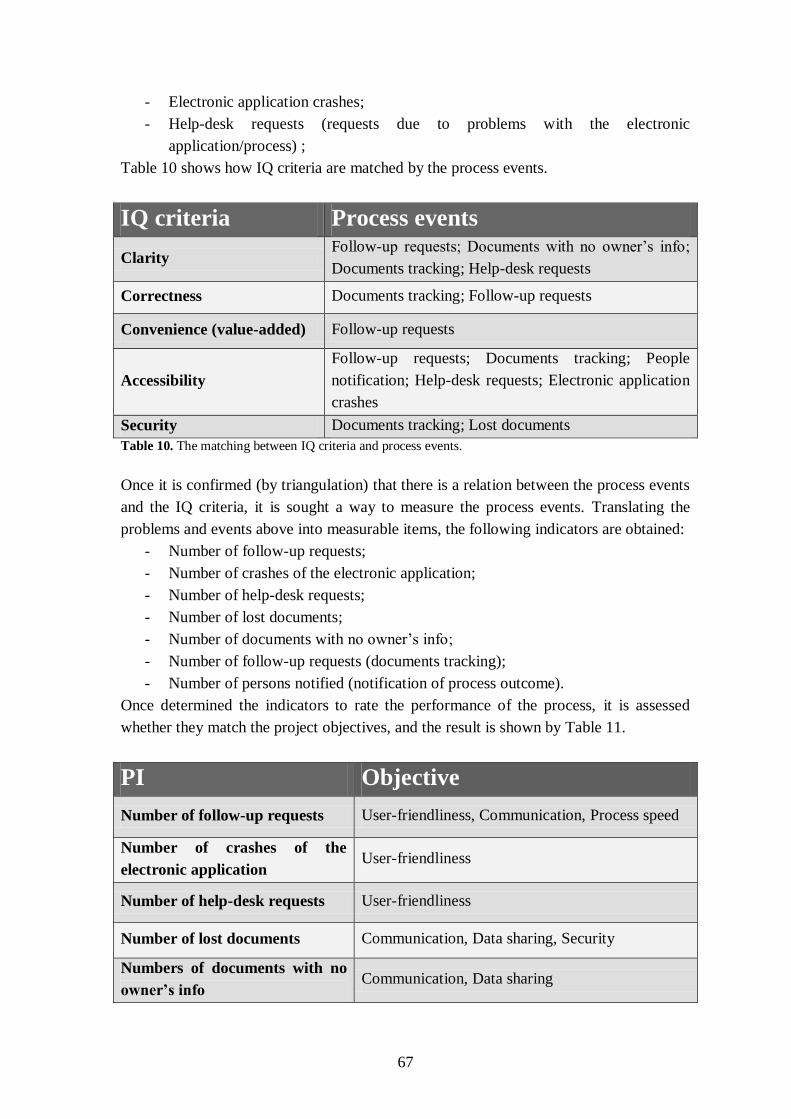
67
- Electronic application crashes;
- Help-desk requests (requests due to problems with the electronic
application/process) ;
Table 10 shows how IQ criteria are matched by the process events.
IQ criteria Process events
Clarity Follow-up requests; Documents with no owner‘s info;
Documents tracking; Help-desk requests
Correctness Documents tracking; Follow-up requests
Convenience (value-added) Follow-up requests
Accessibility
Follow-up requests; Documents tracking; People
notification; Help-desk requests; Electronic application
crashes
Security Documents tracking; Lost documents
Table 10. The matching between IQ criteria and process events.
Once it is confirmed (by triangulation) that there is a relation between the process events
and the IQ criteria, it is sought a way to measure the process events. Translating the
problems and events above into measurable items, the following indicators are obtained:
- Number of follow-up requests;
- Number of crashes of the electronic application;
- Number of help-desk requests;
- Number of lost documents;
- Number of documents with no owner‘s info;
- Number of follow-up requests (documents tracking);
- Number of persons notified (notification of process outcome).
Once determined the indicators to rate the performance of the process, it is assessed
whether they match the project objectives, and the result is shown by Table 11.
PI Objective
Number of follow-up requests User-friendliness, Communication, Process speed
Number of crashes of the
electronic application User-friendliness
Number of help-desk requests User-friendliness
Number of lost documents Communication, Data sharing, Security
Numbers of documents with no
owner’s info Communication, Data sharing
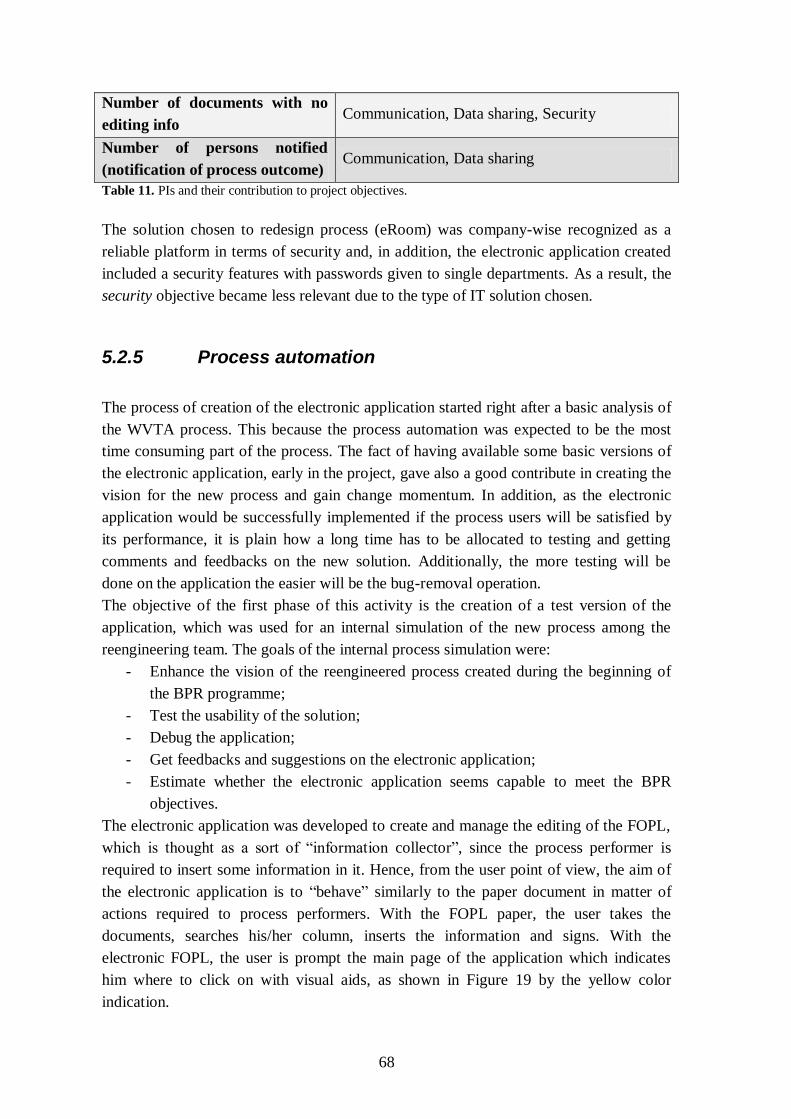
68
Number of documents with no
editing info Communication, Data sharing, Security
Number of persons notified
(notification of process outcome) Communication, Data sharing
Table 11. PIs and their contribution to project objectives.
The solution chosen to redesign process (eRoom) was company-wise recognized as a
reliable platform in terms of security and, in addition, the electronic application created
included a security features with passwords given to single departments. As a result, the
security objective became less relevant due to the type of IT solution chosen.
5.2.5 Process automation
The process of creation of the electronic application started right after a basic analysis of
the WVTA process. This because the process automation was expected to be the most
time consuming part of the process. The fact of having available some basic versions of
the electronic application, early in the project, gave also a good contribute in creating the
vision for the new process and gain change momentum. In addition, as the electronic
application would be successfully implemented if the process users will be satisfied by
its performance, it is plain how a long time has to be allocated to testing and getting
comments and feedbacks on the new solution. Additionally, the more testing will be
done on the application the easier will be the bug-removal operation.
The objective of the first phase of this activity is the creation of a test version of the
application, which was used for an internal simulation of the new process among the
reengineering team. The goals of the internal process simulation were:
- Enhance the vision of the reengineered process created during the beginning of
the BPR programme;
- Test the usability of the solution;
- Debug the application;
- Get feedbacks and suggestions on the electronic application;
- Estimate whether the electronic application seems capable to meet the BPR
objectives.
The electronic application was developed to create and manage the editing of the FOPL,
which is thought as a sort of ―information collector‖, since the process performer is
required to insert some information in it. Hence, from the user point of view, the aim of
the electronic application is to ―behave‖ similarly to the paper document in matter of
actions required to process performers. With the FOPL paper, the user takes the
documents, searches his/her column, inserts the information and signs. With the
electronic FOPL, the user is prompt the main page of the application which indicates
him where to click on with visual aids, as shown in Figure 19 by the yellow color
indication.
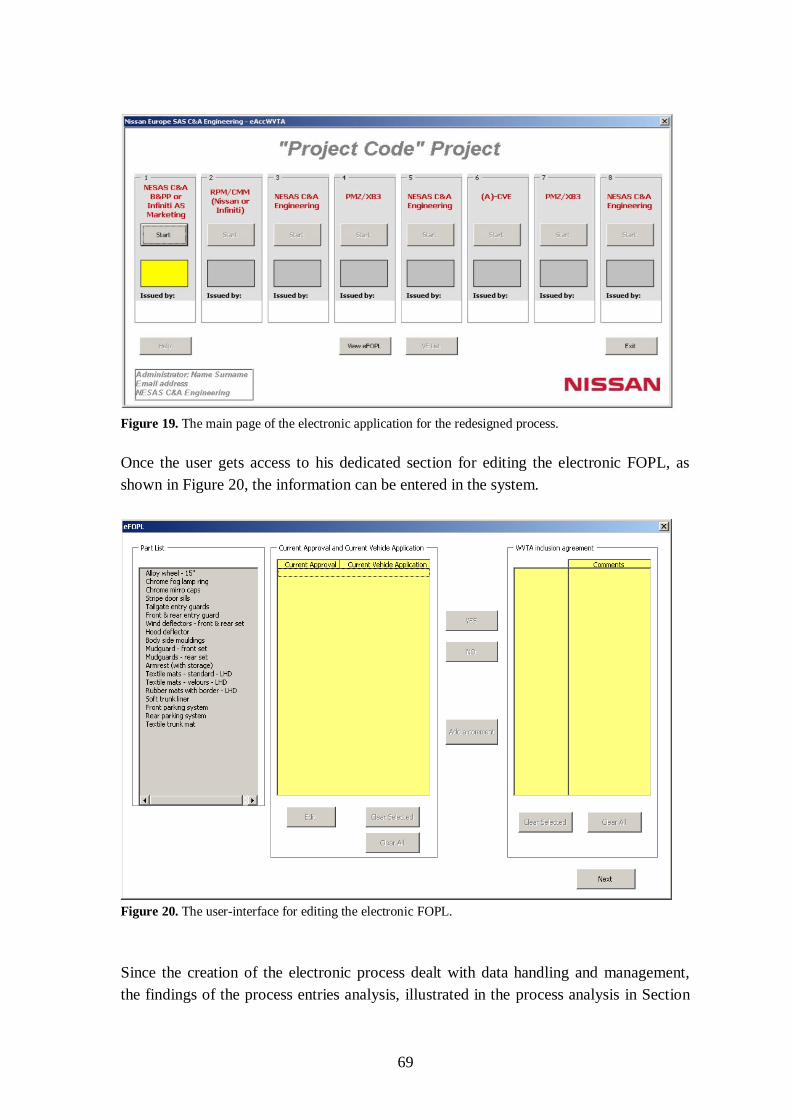
69
Figure 19. The main page of the electronic application for the redesigned process.
Once the user gets access to his dedicated section for editing the electronic FOPL, as
shown in Figure 20, the information can be entered in the system.
Figure 20. The user-interface for editing the electronic FOPL.
Since the creation of the electronic process dealt with data handling and management,
the findings of the process entries analysis, illustrated in the process analysis in Section
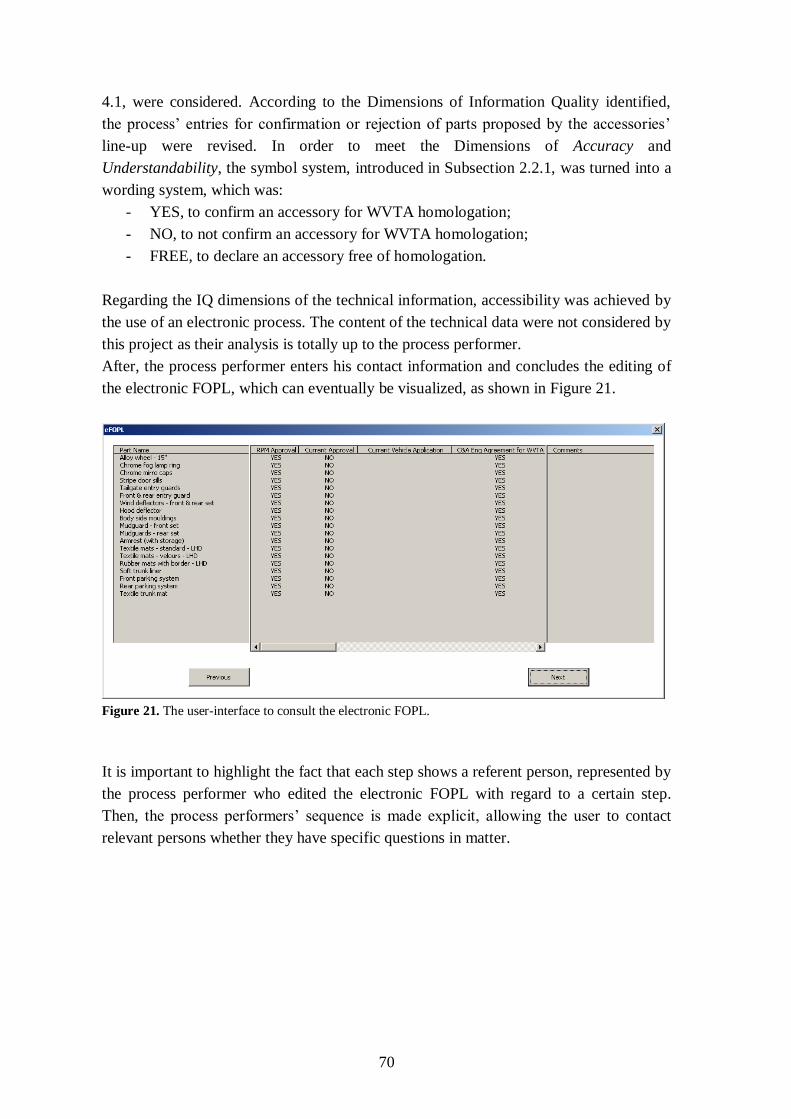
70
4.1, were considered. According to the Dimensions of Information Quality identified,
the process‘ entries for confirmation or rejection of parts proposed by the accessories‘
line-up were revised. In order to meet the Dimensions of Accuracy and
Understandability, the symbol system, introduced in Subsection 2.2.1, was turned into a
wording system, which was:
- YES, to confirm an accessory for WVTA homologation;
- NO, to not confirm an accessory for WVTA homologation;
- FREE, to declare an accessory free of homologation.
Regarding the IQ dimensions of the technical information, accessibility was achieved by
the use of an electronic process. The content of the technical data were not considered by
this project as their analysis is totally up to the process performer.
After, the process performer enters his contact information and concludes the editing of
the electronic FOPL, which can eventually be visualized, as shown in Figure 21.
Figure 21. The user-interface to consult the electronic FOPL.
It is important to highlight the fact that each step shows a referent person, represented by
the process performer who edited the electronic FOPL with regard to a certain step.
Then, the process performers‘ sequence is made explicit, allowing the user to contact
relevant persons whether they have specific questions in matter.
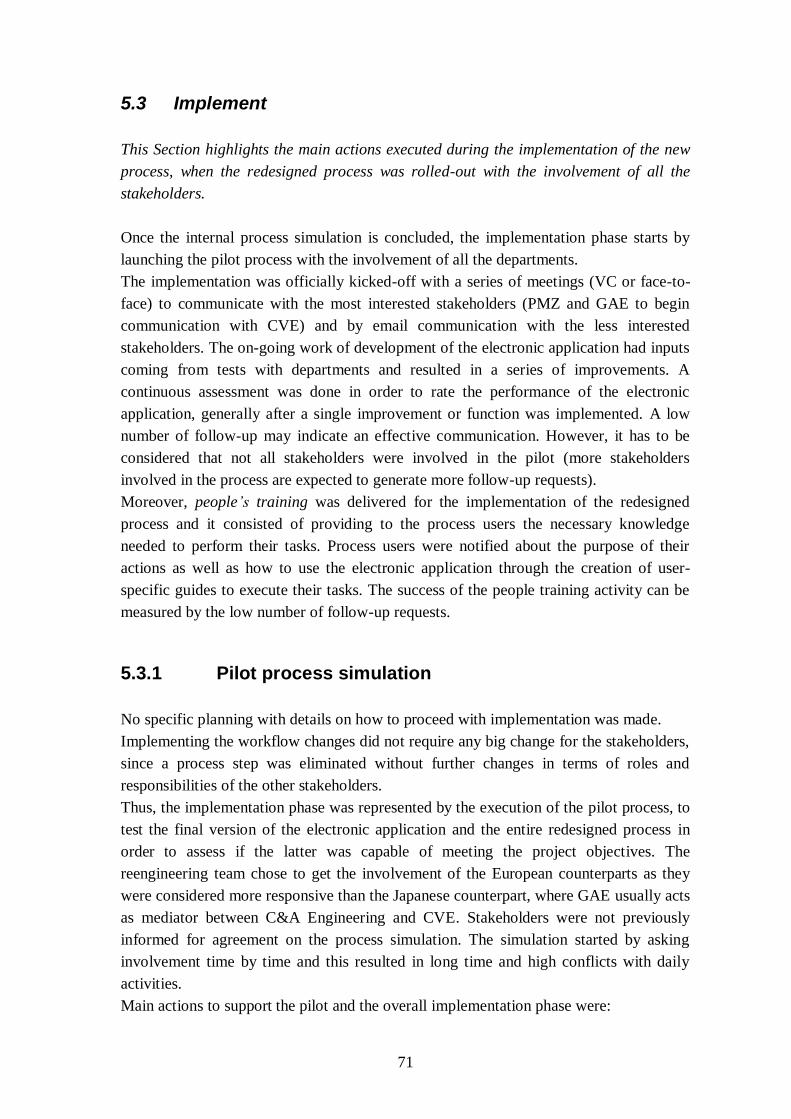
71
5.3 Implement
This Section highlights the main actions executed during the implementation of the new
process, when the redesigned process was rolled-out with the involvement of all the
stakeholders.
Once the internal process simulation is concluded, the implementation phase starts by
launching the pilot process with the involvement of all the departments.
The implementation was officially kicked-off with a series of meetings (VC or face-to-
face) to communicate with the most interested stakeholders (PMZ and GAE to begin
communication with CVE) and by email communication with the less interested
stakeholders. The on-going work of development of the electronic application had inputs
coming from tests with departments and resulted in a series of improvements. A
continuous assessment was done in order to rate the performance of the electronic
application, generally after a single improvement or function was implemented. A low
number of follow-up may indicate an effective communication. However, it has to be
considered that not all stakeholders were involved in the pilot (more stakeholders
involved in the process are expected to generate more follow-up requests).
Moreover, people’s training was delivered for the implementation of the redesigned
process and it consisted of providing to the process users the necessary knowledge
needed to perform their tasks. Process users were notified about the purpose of their
actions as well as how to use the electronic application through the creation of user-
specific guides to execute their tasks. The success of the people training activity can be
measured by the low number of follow-up requests.
5.3.1 Pilot process simulation
No specific planning with details on how to proceed with implementation was made.
Implementing the workflow changes did not require any big change for the stakeholders,
since a process step was eliminated without further changes in terms of roles and
responsibilities of the other stakeholders.
Thus, the implementation phase was represented by the execution of the pilot process, to
test the final version of the electronic application and the entire redesigned process in
order to assess if the latter was capable of meeting the project objectives. The
reengineering team chose to get the involvement of the European counterparts as they
were considered more responsive than the Japanese counterpart, where GAE usually acts
as mediator between C&A Engineering and CVE. Stakeholders were not previously
informed for agreement on the process simulation. The simulation started by asking
involvement time by time and this resulted in long time and high conflicts with daily
activities.
Main actions to support the pilot and the overall implementation phase were:
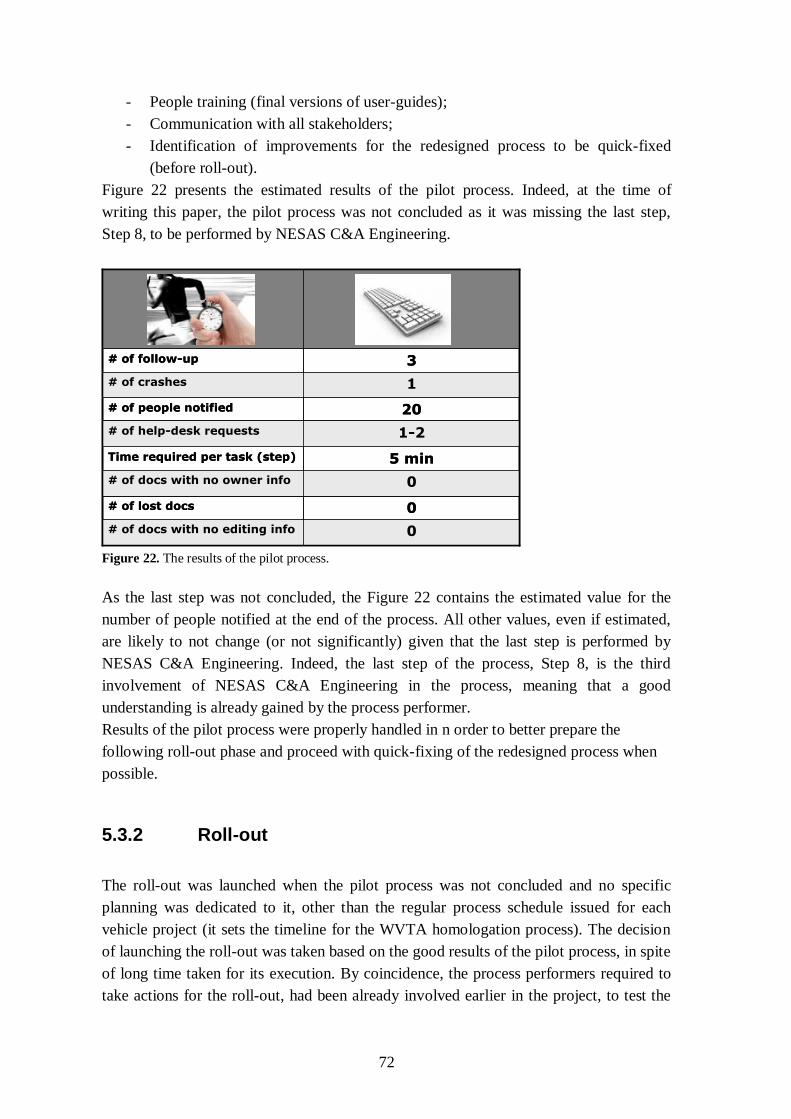
72
- People training (final versions of user-guides);
- Communication with all stakeholders;
- Identification of improvements for the redesigned process to be quick-fixed
(before roll-out).
Figure 22 presents the estimated results of the pilot process. Indeed, at the time of
writing this paper, the pilot process was not concluded as it was missing the last step,
Step 8, to be performed by NESAS C&A Engineering.
0# of lost docs
0# of docs with no owner info
5 minTime required per task (step)
1-2# of help-desk requests
20# of people notified
0# of docs with no editing info
1# of crashes
3# of follow-up
0# of lost docs
0# of docs with no owner info
5 minTime required per task (step)
1-2# of help-desk requests
20# of people notified
0# of docs with no editing info
1# of crashes
3# of follow-up
Figure 22. The results of the pilot process.
As the last step was not concluded, the Figure 22 contains the estimated value for the
number of people notified at the end of the process. All other values, even if estimated,
are likely to not change (or not significantly) given that the last step is performed by
NESAS C&A Engineering. Indeed, the last step of the process, Step 8, is the third
involvement of NESAS C&A Engineering in the process, meaning that a good
understanding is already gained by the process performer.
Results of the pilot process were properly handled in n order to better prepare the
following roll-out phase and proceed with quick-fixing of the redesigned process when
possible.
5.3.2 Roll-out
The roll-out was launched when the pilot process was not concluded and no specific
planning was dedicated to it, other than the regular process schedule issued for each
vehicle project (it sets the timeline for the WVTA homologation process). The decision
of launching the roll-out was taken based on the good results of the pilot process, in spite
of long time taken for its execution. By coincidence, the process performers required to
take actions for the roll-out, had been already involved earlier in the project, to test the

73
application under development. Thus, it can be assumed they had already ―assimilated‖
the change to the redesigned process. For this reason, they may be considered for
inclusion in the stakeholder network with the role of facilitators, to sustain the
implementation of the redesigned process. An additional factor to consider is that the
rolled-out processes are related to other processes and have a specific schedule, which
allows the process to run at the right time.
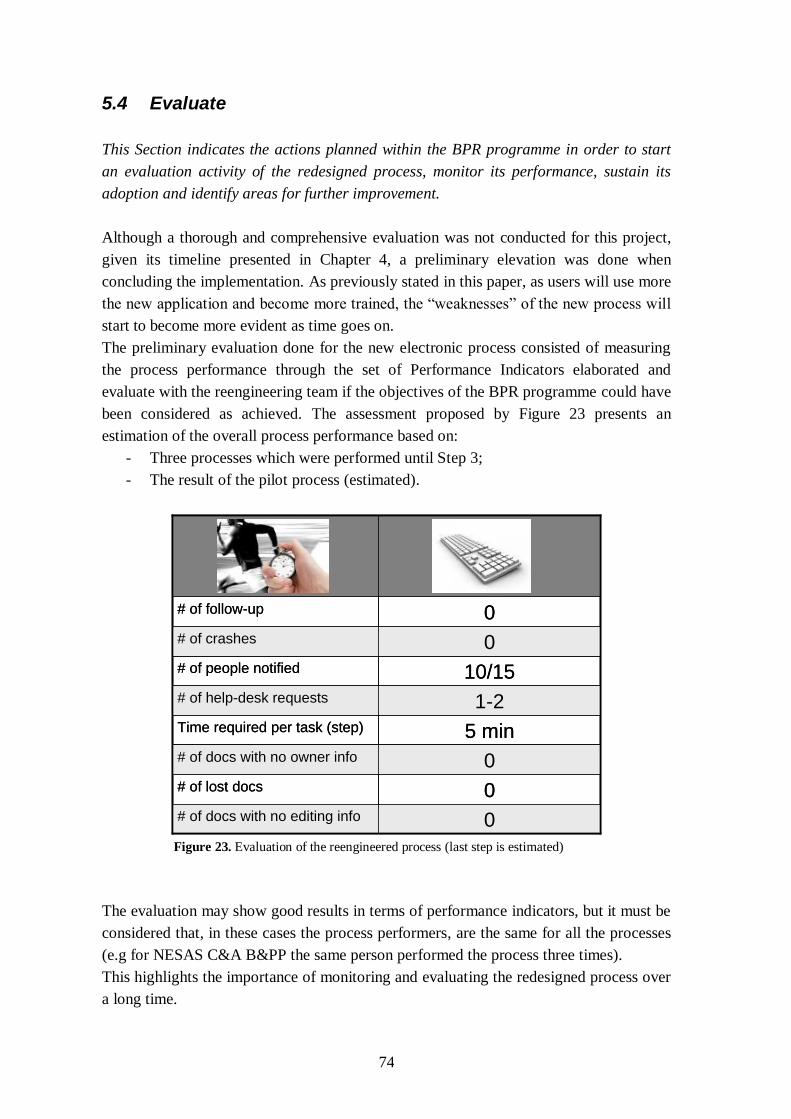
74
5.4 Evaluate
This Section indicates the actions planned within the BPR programme in order to start
an evaluation activity of the redesigned process, monitor its performance, sustain its
adoption and identify areas for further improvement.
Although a thorough and comprehensive evaluation was not conducted for this project,
given its timeline presented in Chapter 4, a preliminary elevation was done when
concluding the implementation. As previously stated in this paper, as users will use more
the new application and become more trained, the ―weaknesses‖ of the new process will
start to become more evident as time goes on.
The preliminary evaluation done for the new electronic process consisted of measuring
the process performance through the set of Performance Indicators elaborated and
evaluate with the reengineering team if the objectives of the BPR programme could have
been considered as achieved. The assessment proposed by Figure 23 presents an
estimation of the overall process performance based on:
- Three processes which were performed until Step 3;
- The result of the pilot process (estimated).
0# of lost docs
0# of docs with no owner info
5 minTime required per task (step)
1-2# of help-desk requests
10/15# of people notified
0# of docs with no editing info
0# of crashes
0# of follow-up
0# of lost docs
0# of docs with no owner info
5 minTime required per task (step)
1-2# of help-desk requests
10/15# of people notified
0# of docs with no editing info
0# of crashes
0# of follow-up
Figure 23. Evaluation of the reengineered process (last step is estimated)
The evaluation may show good results in terms of performance indicators, but it must be
considered that, in these cases the process performers, are the same for all the processes
(e.g for NESAS C&A B&PP the same person performed the process three times).
This highlights the importance of monitoring and evaluating the redesigned process over
a long time.
75
5.4.1 Areas of improvement
The reengineering team encouraged users‘ feedbacks in order to identify the areas of
improvement. A good point in having a business process which is automated, mapped
and monitored through all its passages and steps, consists of having a base of data which
are organized and easily understandable. Thus, an easier monitoring of the process,
combined to user‘s feedbacks, will set the way for further improvement of the
redesigned process. All activity carried out for the process can now be monitored using
the electronic tool. Numbers and costs can be implemented in the base of data. People
will use the tool more and more and will highlight any bad point as well as
improvements to make. However, even the evaluation and continuous improvement
activity needs project leader to catalyse all the activity related inputs and take ownership
of any action. Some areas for improvements were identified, as:
1. Kick-off of the FOPL
2. Follow-up indicator to be taken down to zero;
3. Process is automated but not autonomous yet. Users have to be involved case by
case. A process plan can be launched at starting of each project so that the
performers can be identified beforehand: positive effects are expected on a
communicational point of view.
4. New performance indicators should be identified as many of the current ones are
close to zero.
5.4.2 Alternative actions
The different frameworks presented in Appendix A, suggest some actions to perform
when implementing a reengineered process. However, given the not high level of details
suggested for a certain action, when it gets executed, there might be several ways to
perform it. Based on empirical work conducted for the electronic application of the
WVTA process, it is plain how many factors may affect the duration of the
implementation phase. A detailed planning of the implementation can definitely improve
its timing and it should contain:
- Actions to perform and their explanation;
- Responsible persons for those actions;
- Deadlines.
Formal commitment has to be gained by the designated persons for the actions to
perform as well as an explicit management support and sponsorship.
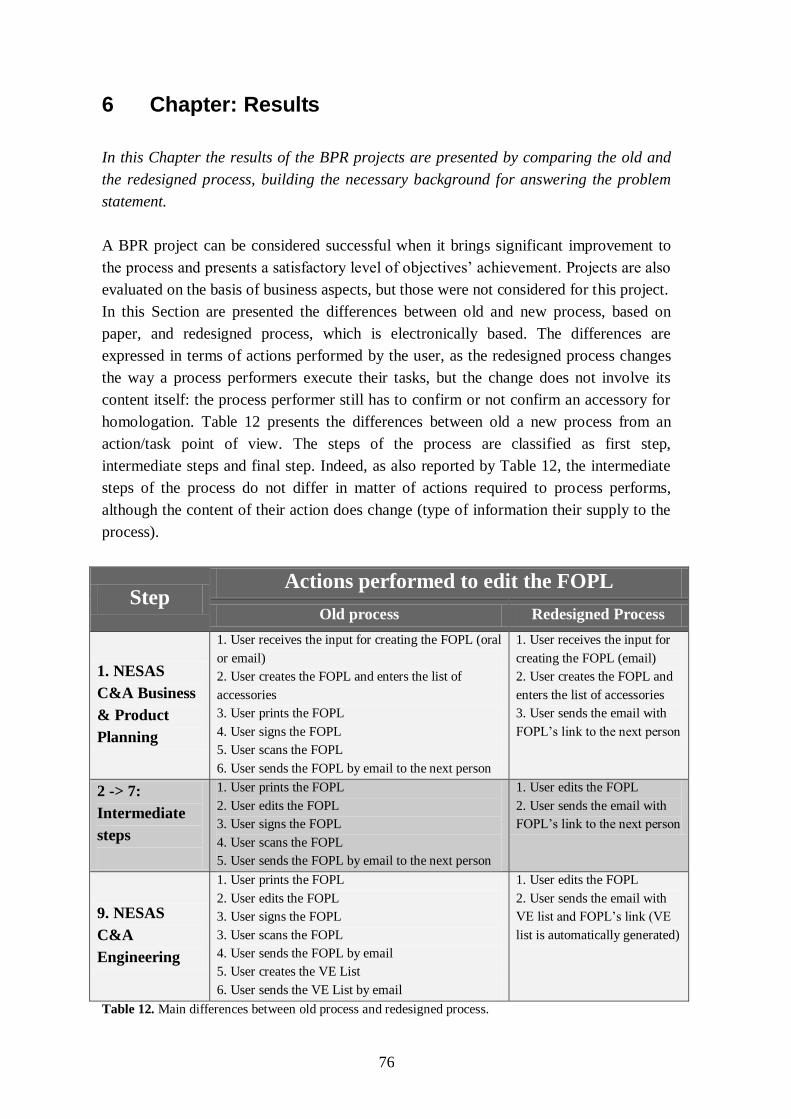
76
6 Chapter: Results
In this Chapter the results of the BPR projects are presented by comparing the old and
the redesigned process, building the necessary background for answering the problem
statement.
A BPR project can be considered successful when it brings significant improvement to
the process and presents a satisfactory level of objectives‘ achievement. Projects are also
evaluated on the basis of business aspects, but those were not considered for this project.
In this Section are presented the differences between old and new process, based on
paper, and redesigned process, which is electronically based. The differences are
expressed in terms of actions performed by the user, as the redesigned process changes
the way a process performers execute their tasks, but the change does not involve its
content itself: the process performer still has to confirm or not confirm an accessory for
homologation. Table 12 presents the differences between old a new process from an
action/task point of view. The steps of the process are classified as first step,
intermediate steps and final step. Indeed, as also reported by Table 12, the intermediate
steps of the process do not differ in matter of actions required to process performs,
although the content of their action does change (type of information their supply to the
process).
Step Actions performed to edit the FOPL
Old process Redesigned Process
1. NESAS
C&A Business
& Product
Planning
1. User receives the input for creating the FOPL (oral
or email)
2. User creates the FOPL and enters the list of
accessories
3. User prints the FOPL
4. User signs the FOPL
5. User scans the FOPL
6. User sends the FOPL by email to the next person
1. User receives the input for
creating the FOPL (email)
2. User creates the FOPL and
enters the list of accessories
3. User sends the email with
FOPL‘s link to the next person
2 -> 7:
Intermediate
steps
1. User prints the FOPL
2. User edits the FOPL
3. User signs the FOPL
4. User scans the FOPL
5. User sends the FOPL by email to the next person
1. User edits the FOPL
2. User sends the email with
FOPL‘s link to the next person
9. NESAS
C&A
Engineering
1. User prints the FOPL
2. User edits the FOPL
3. User signs the FOPL
3. User scans the FOPL
4. User sends the FOPL by email
5. User creates the VE List
6. User sends the VE List by email
1. User edits the FOPL
2. User sends the email with
VE list and FOPL‘s link (VE
list is automatically generated)
Table 12. Main differences between old process and redesigned process.
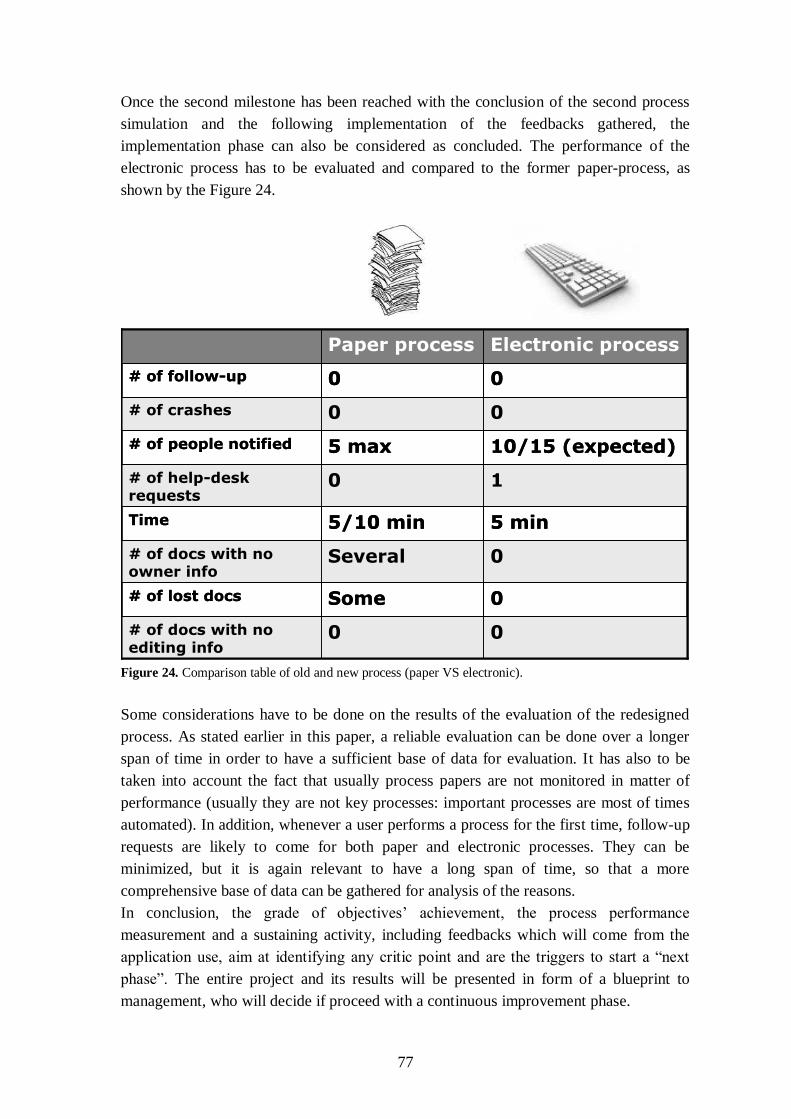
77
Once the second milestone has been reached with the conclusion of the second process
simulation and the following implementation of the feedbacks gathered, the
implementation phase can also be considered as concluded. The performance of the
electronic process has to be evaluated and compared to the former paper-process, as
shown by the Figure 24.
0Some# of lost docs
0Several# of docs with no owner info
5 min 5/10 minTime
10# of help-desk requests
10/15 (expected)5 max# of people notified
00# of docs with no editing info
00# of crashes
00# of follow-up
Electronic processPaper process
0Some# of lost docs
0Several# of docs with no owner info
5 min 5/10 minTime
10# of help-desk requests
10/15 (expected)5 max# of people notified
00# of docs with no editing info
00# of crashes
00# of follow-up
Electronic processPaper process
Figure 24. Comparison table of old and new process (paper VS electronic).
Some considerations have to be done on the results of the evaluation of the redesigned
process. As stated earlier in this paper, a reliable evaluation can be done over a longer
span of time in order to have a sufficient base of data for evaluation. It has also to be
taken into account the fact that usually process papers are not monitored in matter of
performance (usually they are not key processes: important processes are most of times
automated). In addition, whenever a user performs a process for the first time, follow-up
requests are likely to come for both paper and electronic processes. They can be
minimized, but it is again relevant to have a long span of time, so that a more
comprehensive base of data can be gathered for analysis of the reasons.
In conclusion, the grade of objectives‘ achievement, the process performance
measurement and a sustaining activity, including feedbacks which will come from the
application use, aim at identifying any critic point and are the triggers to start a ―next
phase‖. The entire project and its results will be presented in form of a blueprint to
management, who will decide if proceed with a continuous improvement phase.
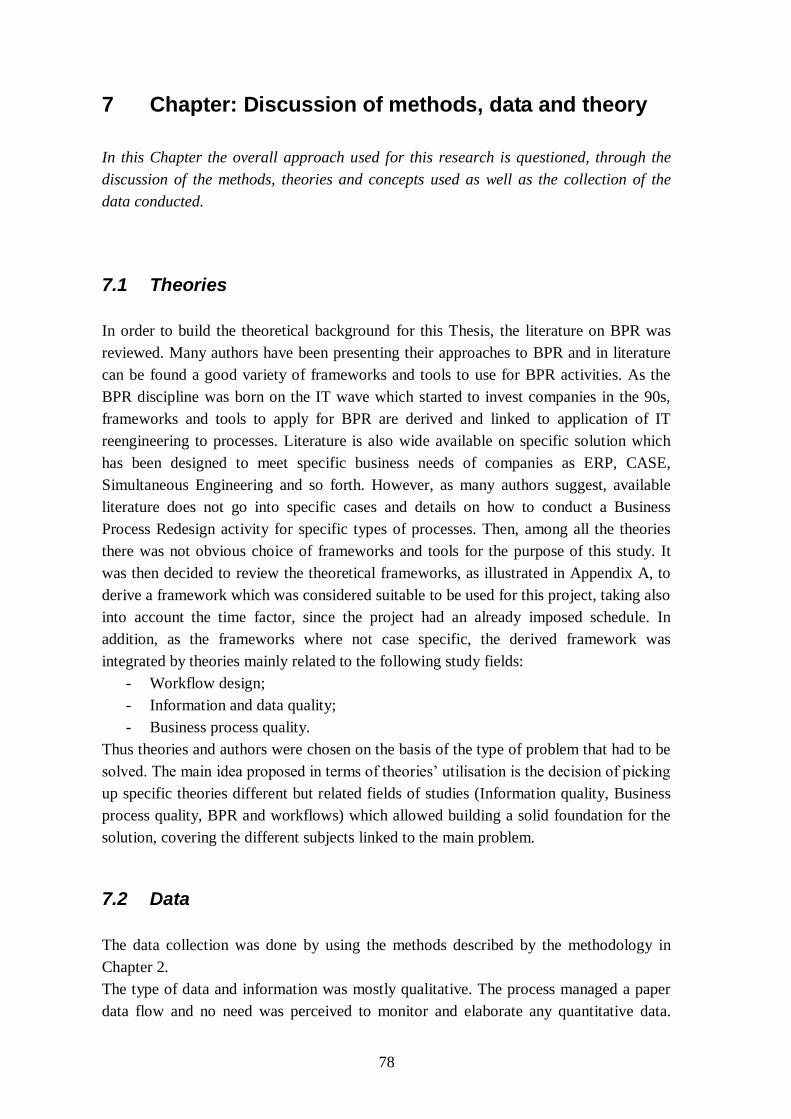
78
7 Chapter: Discussion of methods, data and theory
In this Chapter the overall approach used for this research is questioned, through the
discussion of the methods, theories and concepts used as well as the collection of the
data conducted.
7.1 Theories
In order to build the theoretical background for this Thesis, the literature on BPR was
reviewed. Many authors have been presenting their approaches to BPR and in literature
can be found a good variety of frameworks and tools to use for BPR activities. As the
BPR discipline was born on the IT wave which started to invest companies in the 90s,
frameworks and tools to apply for BPR are derived and linked to application of IT
reengineering to processes. Literature is also wide available on specific solution which
has been designed to meet specific business needs of companies as ERP, CASE,
Simultaneous Engineering and so forth. However, as many authors suggest, available
literature does not go into specific cases and details on how to conduct a Business
Process Redesign activity for specific types of processes. Then, among all the theories
there was not obvious choice of frameworks and tools for the purpose of this study. It
was then decided to review the theoretical frameworks, as illustrated in Appendix A, to
derive a framework which was considered suitable to be used for this project, taking also
into account the time factor, since the project had an already imposed schedule. In
addition, as the frameworks where not case specific, the derived framework was
integrated by theories mainly related to the following study fields:
- Workflow design;
- Information and data quality;
- Business process quality.
Thus theories and authors were chosen on the basis of the type of problem that had to be
solved. The main idea proposed in terms of theories‘ utilisation is the decision of picking
up specific theories different but related fields of studies (Information quality, Business
process quality, BPR and workflows) which allowed building a solid foundation for the
solution, covering the different subjects linked to the main problem.
7.2 Data
The data collection was done by using the methods described by the methodology in
Chapter 2.
The type of data and information was mostly qualitative. The process managed a paper
data flow and no need was perceived to monitor and elaborate any quantitative data.
79
However, this fact constituted a problem when setting up a measurement system to
evaluate the process performance towards the achievement of the objectives set for the
BPR programme. Indeed, as the Performance indicators where set, the comparison
between old paper process and new electronic process was hard to be defined since the
old process was not monitored and measured and no data were collected on it, letting
performance measurement to ―rough ideas‖ (e.g. number of papers lost with the paper
process: sometime lists got lost but nobody could quantify the event referring to the past).
A performance measurement becomes effective when the measures are taken for those
indicators and the same type of information can be compared over time (quantitative
measurement VS quantitative measurement).
7.3 Methods
Methods for gathering information and data were described by methodology in Chapter
2. To overtake any problem of bias or poor knowledge, it was extensively used the
triangulation method in order to verify and validate the information acquired. However,
triangulation was not always possible due to key people‘s absence (not employed
anymore). At Nissan there is a high staff rotation, with personnel who leave the
company and new personnel who is recruited on a regular basis. It is reasonable to
assume that the same phenomenon occurs in many global companies. Thus, when a
person leaves the company some knowledge and experience is inevitably lost. It is plain
the impact of this phenomenon on the processes, especially when those are not currently
updated and reviewed. A process manual may not describe in details all the actions
required to take and process performers will tend to take some actions by own initiative
in order to perform the assigned task. Thus his/her actions are not translated into words
introducing the issue of tacit knowledge, which can not be transferred anymore once
somebody leaves the company.
In conclusion, triangulation was not always possible and the resulting process, even
though revised, may still miss some information.
80
8 Chapter: Reflections
In this Chapter are illustrated the reflections on the overall project to assess which
alternative actions could have been taken.
Reflecting on the steps taken for carrying out this project and looking backwards some
different actions could have been taken, especially in matter of scoping of the project
and during the implementation phase. The choice of automating the process was taken
based on indications given by internal audit of the process with the objective of an
overall improvement of the process in terms of visibility and document sharing. After a
brief investigation on available software packages around the company, as the process
documents were printed out from Excel files and an existent platform was available for
sharing documents worldwide within the company, it was chosen to push automation
through that direction. However, a different approach could have been taken doing a
wider scoping to assess if within the department (or division) there was the need of
improve other processes with similar architecture as the WVTA. A preliminary study on
this subject would have better defined the problem as well as its importance for the
business of the department (or division). Doing this a better approach could have been
chosen and, in addition, different solutions could have been considered at a higher level.
Eventually, a better solution could have been identified for generating a better
improvement on more processes and to the entire business. Obviously, that would have
led to a business case for improving department processes, which would have needed the
allocation of certain resources.
When implementing the new electronic process, various events affected the activity
largely delaying the pilot process and its conclusion. The causes were mainly related
with conflicts against daily business and no specific priority accorded to the pilot
process to overcome those conflicts. A pilot process loses effectiveness if its execution
gets delayed too much and reduces the change momentum of BPR activity. In order to
avoid possible failures in the implementation, as the pilot process was running late, after
the first feedbacks received on it, the implementation proceeded with real processes to
not interrupt or delay the overall the BPR project. However, when a pilot process is not
concluded, its benefits are also reduced in terms of:
- Fine-tuning of the process;
- Improvements of the final version of the process;
- Change awareness, whose level can be increased or kept;
- Staff training, as long implementation time makes people forget.
Better implementation of the process could have been done through:
- Project planning specifically targeted for the pilot process;
- Explicit sponsorship of the management to raise awareness and establish a kind
of ―priority‖;
81
- Explicit commitment by selected actors for the pilot process.
In conclusion, different execution of the pilot process, through the measures above stated,
could have increased the benefits of the reengineered process‘ implementation.
8.1 Main factors for process automation
Based on the work conducted for the process automation, some main factors were
identified as influential for the success of this BPR project. The premise to kick-off and
implement a BPR programme in an organisation is the change readiness of the
organisation, which is fundamental for the programme‘s success. If organisational
mindset is not responsive towards change, a BPR activity will certainly take longer time
and its success may even be at risk.
Besides, some other factors which occurred during this project and may be encountered
during the daily business around many organisations can also influence the success of
BPR programme.
People’s training
As the process for WVTA homologation of accessories is executed on a vehicle basis
and over a long span of time (21 months approximately), the people involved in the
process are different from time to time. Indeed, NISA RPM and CMM roles are vehicle
specific, meaning that there is a CMM or RPM per vehicle (or more vehicles), CVE and
A-CVE are appointed for a vehicle platform being responsible for generally 2-3 vehicles.
NESAS C&A Business and Product Planning staff is composed by three Product
Manager, who split responsibilities of the entire range of Nissan‘s vehicles. Upon that,
people turnover happens at an important frequency: a trained person might not perform
the process a second time, creating in the need of training new personnel. Thus, in order
to training of people simple to deliver and easy to understand, there are some important
issues to consider:
- Network‘s creation, that has to counterbalance the leave of trained person/s
through an effective contact with the other stakeholders;
- Access to information, which has to be easily available to new users;
- Quality of information, which has to be easily understandable for a new user.
Power
A key factor is definitely sponsorship/management support especially when it comes the
time of putting in place the new process. Power is a fundamental point in order to win
resistance, if any, and get priority over the daily businesses which run within the
organisation.
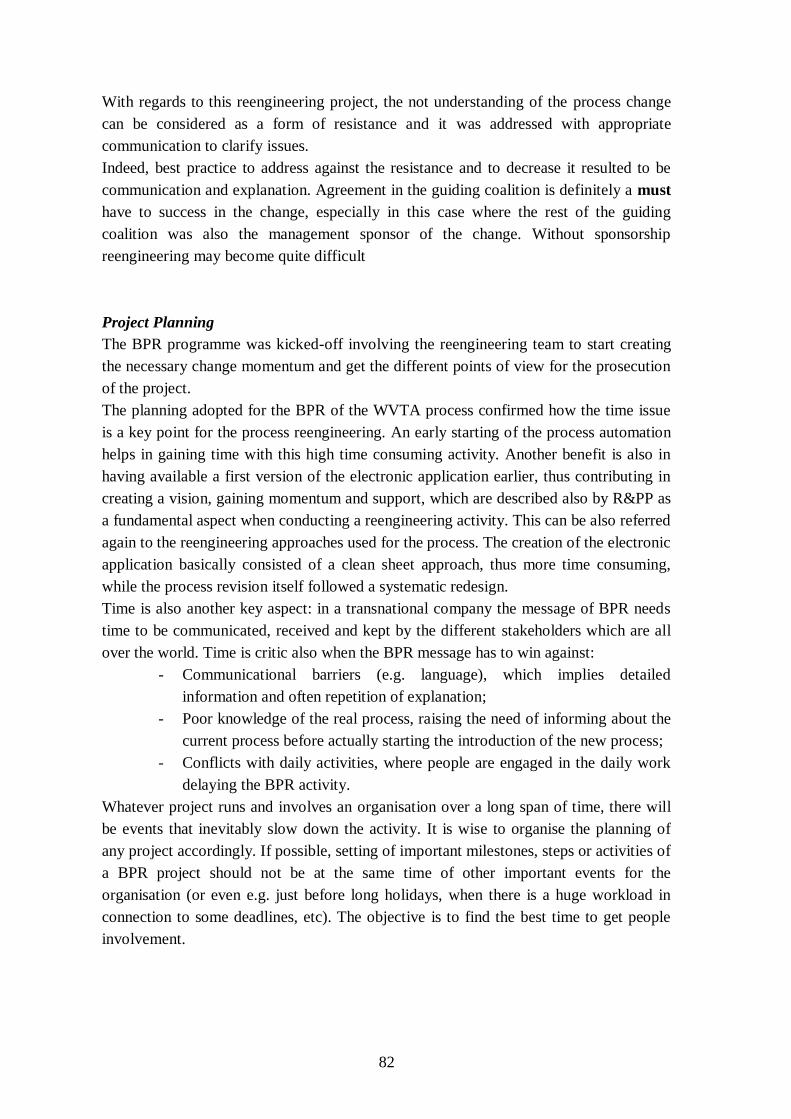
82
With regards to this reengineering project, the not understanding of the process change
can be considered as a form of resistance and it was addressed with appropriate
communication to clarify issues.
Indeed, best practice to address against the resistance and to decrease it resulted to be
communication and explanation. Agreement in the guiding coalition is definitely a must
have to success in the change, especially in this case where the rest of the guiding
coalition was also the management sponsor of the change. Without sponsorship
reengineering may become quite difficult
Project Planning
The BPR programme was kicked-off involving the reengineering team to start creating
the necessary change momentum and get the different points of view for the prosecution
of the project.
The planning adopted for the BPR of the WVTA process confirmed how the time issue
is a key point for the process reengineering. An early starting of the process automation
helps in gaining time with this high time consuming activity. Another benefit is also in
having available a first version of the electronic application earlier, thus contributing in
creating a vision, gaining momentum and support, which are described also by R&PP as
a fundamental aspect when conducting a reengineering activity. This can be also referred
again to the reengineering approaches used for the process. The creation of the electronic
application basically consisted of a clean sheet approach, thus more time consuming,
while the process revision itself followed a systematic redesign.
Time is also another key aspect: in a transnational company the message of BPR needs
time to be communicated, received and kept by the different stakeholders which are all
over the world. Time is critic also when the BPR message has to win against:
- Communicational barriers (e.g. language), which implies detailed
information and often repetition of explanation;
- Poor knowledge of the real process, raising the need of informing about the
current process before actually starting the introduction of the new process;
- Conflicts with daily activities, where people are engaged in the daily work
delaying the BPR activity.
Whatever project runs and involves an organisation over a long span of time, there will
be events that inevitably slow down the activity. It is wise to organise the planning of
any project accordingly. If possible, setting of important milestones, steps or activities of
a BPR project should not be at the same time of other important events for the
organisation (or even e.g. just before long holidays, when there is a huge workload in
connection to some deadlines, etc). The objective is to find the best time to get people
involvement.
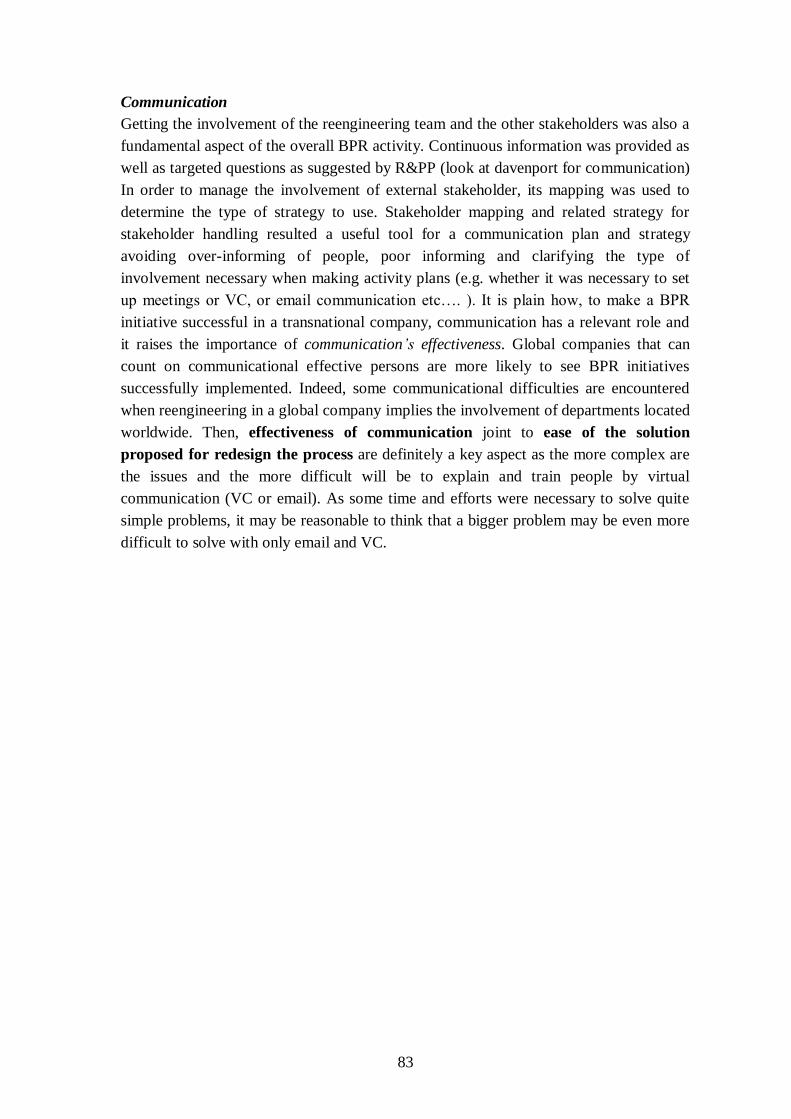
83
Communication
Getting the involvement of the reengineering team and the other stakeholders was also a
fundamental aspect of the overall BPR activity. Continuous information was provided as
well as targeted questions as suggested by R&PP (look at davenport for communication)
In order to manage the involvement of external stakeholder, its mapping was used to
determine the type of strategy to use. Stakeholder mapping and related strategy for
stakeholder handling resulted a useful tool for a communication plan and strategy
avoiding over-informing of people, poor informing and clarifying the type of
involvement necessary when making activity plans (e.g. whether it was necessary to set
up meetings or VC, or email communication etc…. ). It is plain how, to make a BPR
initiative successful in a transnational company, communication has a relevant role and
it raises the importance of communication’s effectiveness. Global companies that can
count on communicational effective persons are more likely to see BPR initiatives
successfully implemented. Indeed, some communicational difficulties are encountered
when reengineering in a global company implies the involvement of departments located
worldwide. Then, effectiveness of communication joint to ease of the solution
proposed for redesign the process are definitely a key aspect as the more complex are
the issues and the more difficult will be to explain and train people by virtual
communication (VC or email). As some time and efforts were necessary to solve quite
simple problems, it may be reasonable to think that a bigger problem may be even more
difficult to solve with only email and VC.
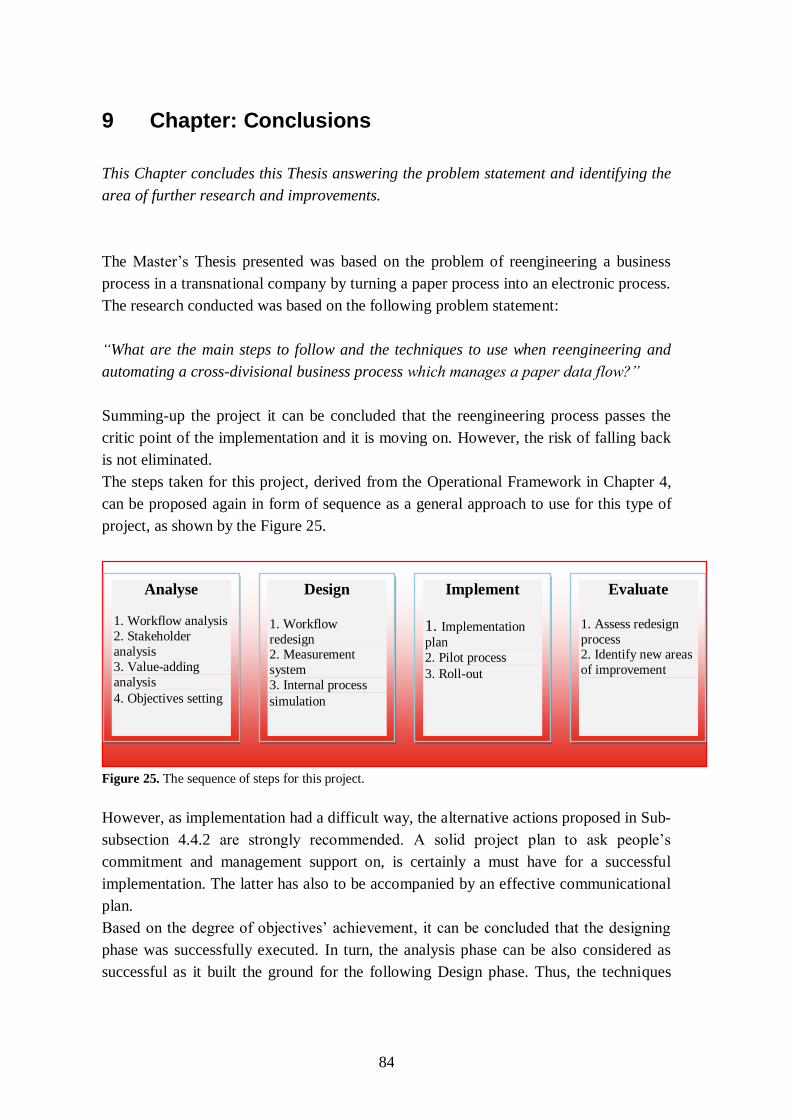
84
9 Chapter: Conclusions
This Chapter concludes this Thesis answering the problem statement and identifying the
area of further research and improvements.
The Master‘s Thesis presented was based on the problem of reengineering a business
process in a transnational company by turning a paper process into an electronic process.
The research conducted was based on the following problem statement:
―What are the main steps to follow and the techniques to use when reengineering and
automating a cross-divisional business process which manages a paper data flow?‖
Summing-up the project it can be concluded that the reengineering process passes the
critic point of the implementation and it is moving on. However, the risk of falling back
is not eliminated.
The steps taken for this project, derived from the Operational Framework in Chapter 4,
can be proposed again in form of sequence as a general approach to use for this type of
project, as shown by the Figure 25.
Figure 25. The sequence of steps for this project.
However, as implementation had a difficult way, the alternative actions proposed in Sub-
subsection 4.4.2 are strongly recommended. A solid project plan to ask people‘s
commitment and management support on, is certainly a must have for a successful
implementation. The latter has also to be accompanied by an effective communicational
plan.
Based on the degree of objectives‘ achievement, it can be concluded that the designing
phase was successfully executed. In turn, the analysis phase can be also considered as
successful as it built the ground for the following Design phase. Thus, the techniques
Implement
1. Implementation
plan 2. Pilot process
3. Roll-out
Design
1. Workflow
redesign 2. Measurement
system
3. Internal process
simulation
Evaluate
1. Assess redesign
process 2. Identify new areas
of improvement
Analyse
1. Workflow analysis
2. Stakeholder
analysis
3. Value-adding
analysis
4. Objectives setting
85
used for conducting analysis and design phases of this BPR process can be proposed as
valid techniques to use. As indicated in Chapter 4 and 5, they are:
- Stakeholder analysis;
- Value-adding analysis;
- Workflow mapping;
- Process input analysis (Information quality assessment);
- Performance measurement system creation.
The techniques listed above were used to design a new process capable of achieving the
objectives set. It can be concluded that making any error in setting objectives, may lead
to design a wrong solution for reengineering the process, even though the other
techniques are correctly used.
This project had the purpose of achieving five objectives and, as described below here,
they can be considered achieved.
1. To analyze the current process, including performance, and identify areas of
improvement.
The current process was analyzed in two steps: basic understanding to start the process
automation and higher level of understanding to revise the process and its workflow. The
performance of the current process was evaluated only in a qualitative way as no
quantitative measures were collected with regards to the Performance Indicators set for
the process.
2. To study what are the improvements that can be made by using an electronic
process as replacement of the existing paper-based process.
The improvements that can be made on a paper-based process, which manages a data
flow, by replacing it with an electronic process, can be summarized by its preliminary
evaluation, as illustrated in Chapter 5. The preliminary evaluation was considered by the
reengineering team to rate the degree of achievement of the objectives and thus which
improvements can be brought on the process by the use of an electronic format.
3. To design and develop several alternatives for improving the process.
Several alternatives of an electronic application were developed for managing the
redesigned process. Then, the alternatives were proposed to the reengineering team
explaining their logic and the type of improvement that they could make on the process.
4. To propose the Business Process Re-engineering design in order to improve
performance through the elimination of unnecessary steps or actions and, by
consequence, reduce the number of follow-ups requested by process users.
The Business Process Reengineering allowed a design which improved the process
(based on the preliminary evaluation) and eliminated the unnecessary steps and actions.
However, the electronic application caused a certain number of follow-ups in form of
86
help-desk requests and they were mostly reduced by the improvement of the electronic
application more than the process itself.
5. To implement the re-engineered process through a simulation to test its
efficiency and identify improvements so that the real process will not be affected.
Through the process simulation it was possible to test the electronic application without
affecting the process. Once implemented on a real process, any weakness of the re-
engineered process will be highlighted making clear any trouble not previously detected.
However, the long span of execution time of the process and all the fine-tuning of the
reengineered process done before the implementation significantly reduced the
magnitude of encountered problems, making possible quick fixing and adjustment.
The objectives are considered as achieved and the solution presented, being specifically
tailored, was capable of meeting the project objectives as well as leave room for further
improvement of the process.
However, the introduction of an electronic process as replacement of a paper-process
raises a problem of employees‘ capabilities and skills. When an electronic process is
created internally and specifically targeted for a process, the process performers can be
more or less easily trained to do their tasks as well as a process manager, which has to
perform basic actions. But in order to further improve the process itself, IT capabilities
will be required, meaning that, if an organisation wants to keep on improving over the IT
wave, skilled employees will be more and more needed.
Indeed, the condition for continuous improvement is to have skilled personnel to
manipulate the electronic process and execute the improvements highlighted.
Moreover, in order to give a final judgement of the reengineered process implemented, a
constant monitoring is needed to evaluate if all actors will become familiar with the new
solution and have understood their role, task and responsibilities.
In addition, among the set of Performance Indicators used to develop and implement the
process, Key Performance Indicator(-)s will have to be chosen and in the mid/long term,
there might be the need of review the performance measurement system of the process.
87
9.1 Further activities
The project conducted in connection to this Master‘s Thesis highlighted some areas of
further activities, which are identified in:
1. Extension of redesigned process to entire WVTA homologation activity,
including costs and financial measurement;
2. Adaptation of the redesigned process, with the electronic application
developed for the redesigned process that can be adapted to manage other
departmental processes which are related to the WVTA and based on paper (e.g.
accessory development);
Besides, the findings of this project can be tested in other similar contexts, to see how
easily of this solution can be adapted to same or similar problems in other global
companies.
88
Bibliography
McGarrahan, J. and Harris, M.J. (2008) Business Process Management for Automotive
End of Life processes [online]. Redbooks IBM, IBM.
Available from: http://www.redbooks.ibm.com/abstracts/redp4451.html
[Accessed 9th April 2011]
Mentuccia, L. (2010) Refocusing on the Aftersales Market – Increase revenues and
reduce costs to achieve high performance [online]. Accenture reports, Accenture.
Available from:
http://www.accenture.com/SiteCollectionDocuments/PDF/Accenture_Refocusing_After
sales_Market.pdf [Accessed 8th April 2011]
Hoeltsz, M. et al. (2010) A new era: Accelerating toward 2020 — An automotive
industry transformed [online], Deloitte report. Deloitte press releases, Deloitte.
Available from: http://www.deloitte.com/view/en_UA/ua/press/ua-pressreleases-
en/a527384aab1a5210VgnVCM100000ba42f00aRCRD.htm [Accessed 9th April 2011]
Nissan (2010) Corporate Information [online], Nissan Internet site.
Available from: http://www.nissan-
global.com/EN/COMPANY/PROFILE/EN_ESTABLISHMENT/EUROPE/
[Accessed 14th April 2011]
TÜV (2010) Homologation of Automotive vehicles [online], TÜV Rheinland Group
Internet site. Available from:
http://www.gc.tuv.com/en/index.php?page=shop.product_details&category_id=19&flyp
age=flypage.tpl&product_id=56&option=com_virtuemart&Itemid=106
[Accessed 20th April 2011]
WVTA (2010) Automotive Regulatory Framework [online], European Commission
Internet site.
Available from: http://ec.europa.eu/enterprise/sectors/automotive/technical-
harmonisation/regulatory-framework/ [Accessed 20th April 2011]
Michael Hammer (2010) What is Business Process Management? In: Jan vom Brocke
and Michael Rosemann (eds) Handbook on Business Process Management 1
Introduction, Methods, and Information Systems. Heidelberg, Springer p.3-16
Eriksson, Päivi, and Anne Kovalainen. "Case Study Research in Business and
Management." Encyclopedia of Case Study Research. 2009. SAGE Publications. 17 Apr.
89
2011. http://www.sage-ereference.com.zorac.aub.aau.dk/casestudy/Article_n34.html
(citation as instructed)
Yin, R. K. (2009), Case Study Research Design and Methods, Forth edition. SAGE
Publications, Inc.
Evers, Jeanine C., and Anne Loes van Staa. "Qualitative Analysis in Case
Study." Encyclopedia of Case Study Research. 2009. SAGE Publications. 17 Apr.
2011.<http://www.sage-ereference.com.zorac.aub.aau.dk/casestudy/Article_n277.html>.
(citation as instructed)
Barlow, Constance A. "Interviews." Encyclopedia of Case Study Research. 2009. SAGE
Publications. 17 Apr. 2011. <http://www.sage-
ereference.com.zorac.aub.aau.dk/casestudy/Article_n182.html> (citation as instructed)
Gambold, Liesl L. "Field Notes." Encyclopedia of Case Study Research. 2009. SAGE
Publications. 22 May. 2011. http://www.sage-
ereference.com.zorac.aub.aau.dk/casestudy/Article_n147.html (citation as instructed)
Yue, Anthony R. "Validity." Encyclopedia of Case Study Research. 2009. SAGE
Publications. 22 May. 2011. http://www.sage-
ereference.com.zorac.aub.aau.dk/casestudy/Article_n353.html (citation as instructed)
Ward, Kerry, and Chris Street. "Reliability." Encyclopedia of Case Study Research.
2009. SAGE Publications. 22 May. 2011. <http://www.sage-
ereference.com.zorac.aub.aau.dk/casestudy/Article_n293.html>. (citation as instructed)
OED (2011). Business Process Re-engineering definition [online]. Second edition.
Oxford English Dictionary website, Oxford University Press.
Available from: http://www.oed.com/ [Accessed 18th April 2011]
Reijers, H.A. (2003). Design and Control of Workflow Processes Business Process
Management for the Service Industry. 5th
Edition. Germany, Springer.
BD (2010). Business Process Improvement definition [online]. Online Business
Dictionary.
Available from:
http://www.businessdictionary.com/definition/business-process-improvement-BPI.html
[Accessed 05th May 2011]
Peppard, J. and Rowland, P. (1995) The essence of Business Process Reengineering. 5th
Edition. Hemel Hempstead, Prentice Hall
90
Sharp, A. (2008) Workflow modeling: tools for process improvements and applications
development. 2nd
edition. Norwood, Artech House.
van der Aalst, W. and van Hee, K. (2002) Workflow Management: Models, Methods,
and Systems [online]. The MIT Press, Cambridge.
Available from:
http://mitpress.mit.edu/catalog/item/default.asp?ttype=2&tid=8633&mode=toc
[Accessed 20th
May 2011]
Van der Aalst, W.M.P. (1999). On the automatic generation of workflow processes
based on product structures. Computers in Industry, p. 39:97-111 cited in: van der Aalst,
W.M.P and Berens P.J.S. (2001) Beyond workflow management: product-driven case
handling. Proceeding GROUP '01 Proceedings of the 2001 International ACM
SIGGROUP Conference on Supporting Group Work ACM New York, NY
Davenport, T.H. (1993) Process Innovation Reengineering work through Information
Technology. 4th edition. Boston, Harvard Business school press.
Heravizadeh, M. et al. (2008) Dimensions of Business Processes Quality (QoBP). In
Proc. of the 6th International Conference on Business Process Management Workshops
(BPM Workshops 2008), Milan. Lecture Notes in Business Information Processing
Available from:
http://www.mendling.com/publications/08-BPD.pdf
[Accessed 04th
May 2011]
Lee, Y.W. et al. (2002) AIMQ: a methodology for information quality assessment.
Information & Management, Vol. 40 Issue 2, pp. 133-146
Parmentier, D. (2009) Key Performance Indicators Developing, implementing and using
winning KPIs. Second edition. Hoboken, John Wiley & Sons, Inc.
Johnson, J. et al. (1998) Exploring Corporate Strategy. Seventh edition. Harlow,
Pearson Education Limited
Kaplan, R. And Norton, D. (1996) The balanced scorecard: translating strategy into
action. Boston, Harvard Business school press.
Sue Conger (2010) Six Sigma and Business Process Management In: Jan vom Brocke
and Michael Rosemann (eds) Handbook on Business Process Management 1
Introduction, Methods, and Information Systems. Heidelberg, Springer p.127-148
91
Reijers, H.A. et al. (2010) Business Process Quality Management In: Jan vom Brocke
and Michael Rosemann (eds) Handbook on Business Process Management 1
Introduction, Methods, and Information Systems. Heidelberg, Springer p. 167-185
Gardner, R. (2004) The process-focused organisation: a transition strategy for success.
Milwaukee, ASQ Quality press.
Fletcher, A. et al. (2003) Mapping stakeholders perceptions for a third sector. Journal of
Intellectual Capital, Vol. 4 No. 4, pp. 505-527
Eppler, M.J. (2003) Managing Information Quality Incresing the value of Information in
knowledge-intensive products and processes. Berlin, Springer
Laguna, M. and Marklund, J. (2004) Business Process Modeling, Simulation, and
Design Upper Saddle River, Pearson Prentice Hall
Shin, N. And Jemella, D.F. (2002) Business process reengineering and performance
improvement The case of Chase Manhattan Bank Business Process Management
Journal, Vol. 8 No. 4, pp. 351-363
Kettinger, W.J et al. (1997) Business Process Change: A Study of Methodologies,
Techniques, and Tools MIS Quarterly, Vol. 21, No. 1, pp. 55-80
Motwani, J. et al. (1998) Business process reengineering A theoretical framework and an
integrated model International Journal of Operations & Production Management, Vol.
18 No. 9/10, pp. 964-977
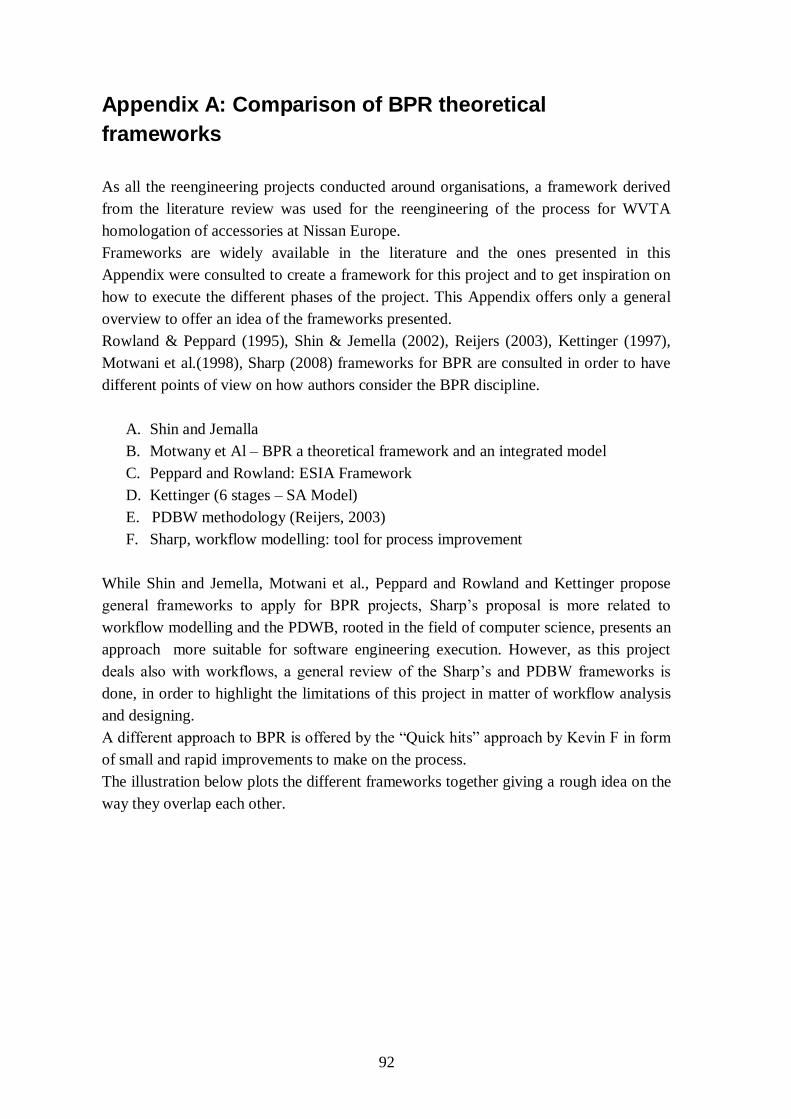
92
Appendix A: Comparison of BPR theoretical
frameworks
As all the reengineering projects conducted around organisations, a framework derived
from the literature review was used for the reengineering of the process for WVTA
homologation of accessories at Nissan Europe.
Frameworks are widely available in the literature and the ones presented in this
Appendix were consulted to create a framework for this project and to get inspiration on
how to execute the different phases of the project. This Appendix offers only a general
overview to offer an idea of the frameworks presented.
Rowland & Peppard (1995), Shin & Jemella (2002), Reijers (2003), Kettinger (1997),
Motwani et al.(1998), Sharp (2008) frameworks for BPR are consulted in order to have
different points of view on how authors consider the BPR discipline.
A. Shin and Jemalla
B. Motwany et Al – BPR a theoretical framework and an integrated model
C. Peppard and Rowland: ESIA Framework
D. Kettinger (6 stages – SA Model)
E. PDBW methodology (Reijers, 2003)
F. Sharp, workflow modelling: tool for process improvement
While Shin and Jemella, Motwani et al., Peppard and Rowland and Kettinger propose
general frameworks to apply for BPR projects, Sharp‘s proposal is more related to
workflow modelling and the PDWB, rooted in the field of computer science, presents an
approach more suitable for software engineering execution. However, as this project
deals also with workflows, a general review of the Sharp‘s and PDBW frameworks is
done, in order to highlight the limitations of this project in matter of workflow analysis
and designing.
A different approach to BPR is offered by the ―Quick hits‖ approach by Kevin F in form
of small and rapid improvements to make on the process.
The illustration below plots the different frameworks together giving a rough idea on the
way they overlap each other.
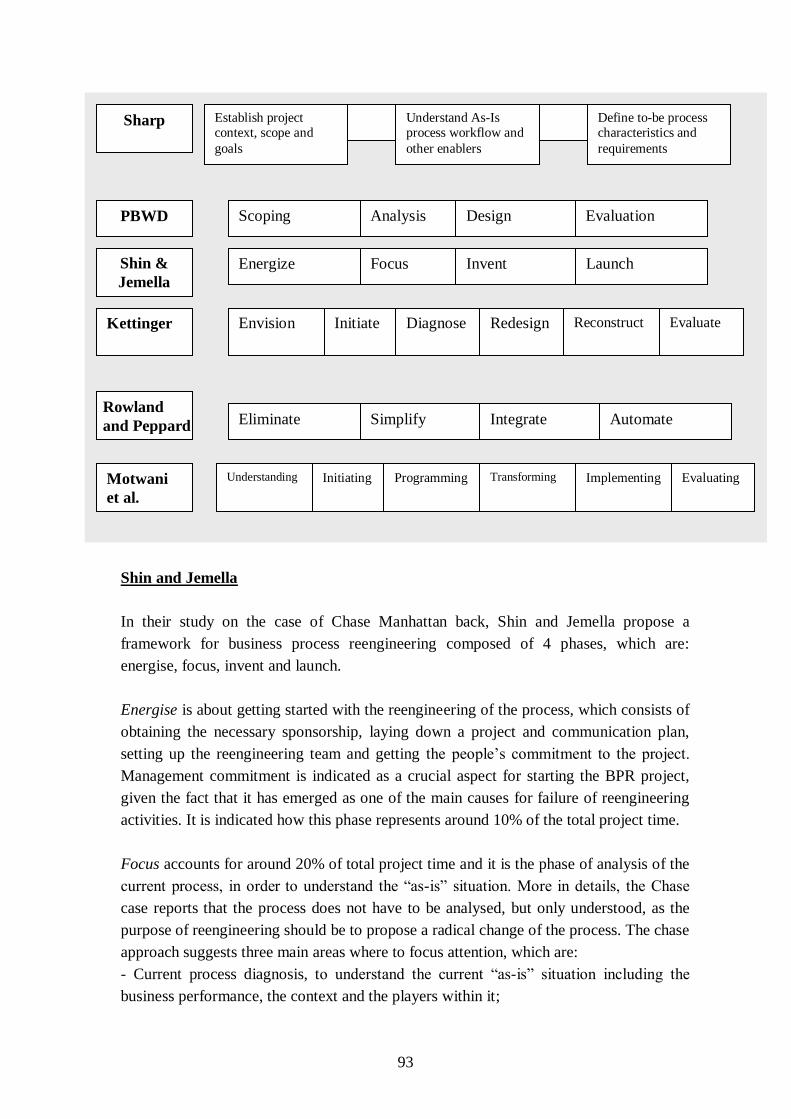
93
Shin and Jemella
In their study on the case of Chase Manhattan back, Shin and Jemella propose a
framework for business process reengineering composed of 4 phases, which are:
energise, focus, invent and launch.
Energise is about getting started with the reengineering of the process, which consists of
obtaining the necessary sponsorship, laying down a project and communication plan,
setting up the reengineering team and getting the people‘s commitment to the project.
Management commitment is indicated as a crucial aspect for starting the BPR project,
given the fact that it has emerged as one of the main causes for failure of reengineering
activities. It is indicated how this phase represents around 10% of the total project time.
Focus accounts for around 20% of total project time and it is the phase of analysis of the
current process, in order to understand the ―as-is‖ situation. More in details, the Chase
case reports that the process does not have to be analysed, but only understood, as the
purpose of reengineering should be to propose a radical change of the process. The chase
approach suggests three main areas where to focus attention, which are:
- Current process diagnosis, to understand the current ―as-is‖ situation including the
business performance, the context and the players within it;
Establish project context, scope and
goals
Understand As-Is process workflow and
other enablers
Define to-be process characteristics and
requirements
Scoping Analysis Design Evaluation
Envision Initiate Diagnose Redesign Reconstruct Evaluate
Eliminate Simplify Integrate Automate
Understanding Initiating Programming Transforming Implementi
ng Evaluating
Energize Focus Invent Launch
Sharp
PBWD
Shin &
Jemella
Kettinger
Rowland
and Peppard
Motwani
et al.
Implementing
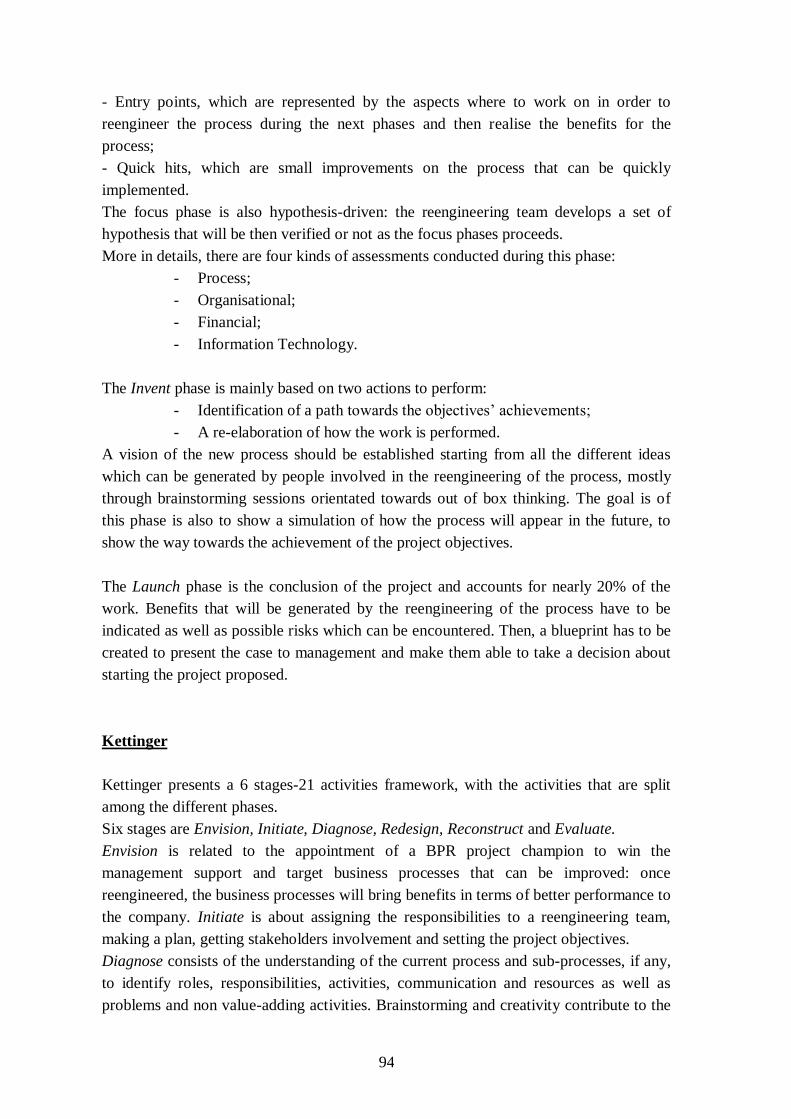
94
- Entry points, which are represented by the aspects where to work on in order to
reengineer the process during the next phases and then realise the benefits for the
process;
- Quick hits, which are small improvements on the process that can be quickly
implemented.
The focus phase is also hypothesis-driven: the reengineering team develops a set of
hypothesis that will be then verified or not as the focus phases proceeds.
More in details, there are four kinds of assessments conducted during this phase:
- Process;
- Organisational;
- Financial;
- Information Technology.
The Invent phase is mainly based on two actions to perform:
- Identification of a path towards the objectives‘ achievements;
- A re-elaboration of how the work is performed.
A vision of the new process should be established starting from all the different ideas
which can be generated by people involved in the reengineering of the process, mostly
through brainstorming sessions orientated towards out of box thinking. The goal is of
this phase is also to show a simulation of how the process will appear in the future, to
show the way towards the achievement of the project objectives.
The Launch phase is the conclusion of the project and accounts for nearly 20% of the
work. Benefits that will be generated by the reengineering of the process have to be
indicated as well as possible risks which can be encountered. Then, a blueprint has to be
created to present the case to management and make them able to take a decision about
starting the project proposed.
Kettinger
Kettinger presents a 6 stages-21 activities framework, with the activities that are split
among the different phases.
Six stages are Envision, Initiate, Diagnose, Redesign, Reconstruct and Evaluate.
Envision is related to the appointment of a BPR project champion to win the
management support and target business processes that can be improved: once
reengineered, the business processes will bring benefits in terms of better performance to
the company. Initiate is about assigning the responsibilities to a reengineering team,
making a plan, getting stakeholders involvement and setting the project objectives.
Diagnose consists of the understanding of the current process and sub-processes, if any,
to identify roles, responsibilities, activities, communication and resources as well as
problems and non value-adding activities. Brainstorming and creativity contribute to the
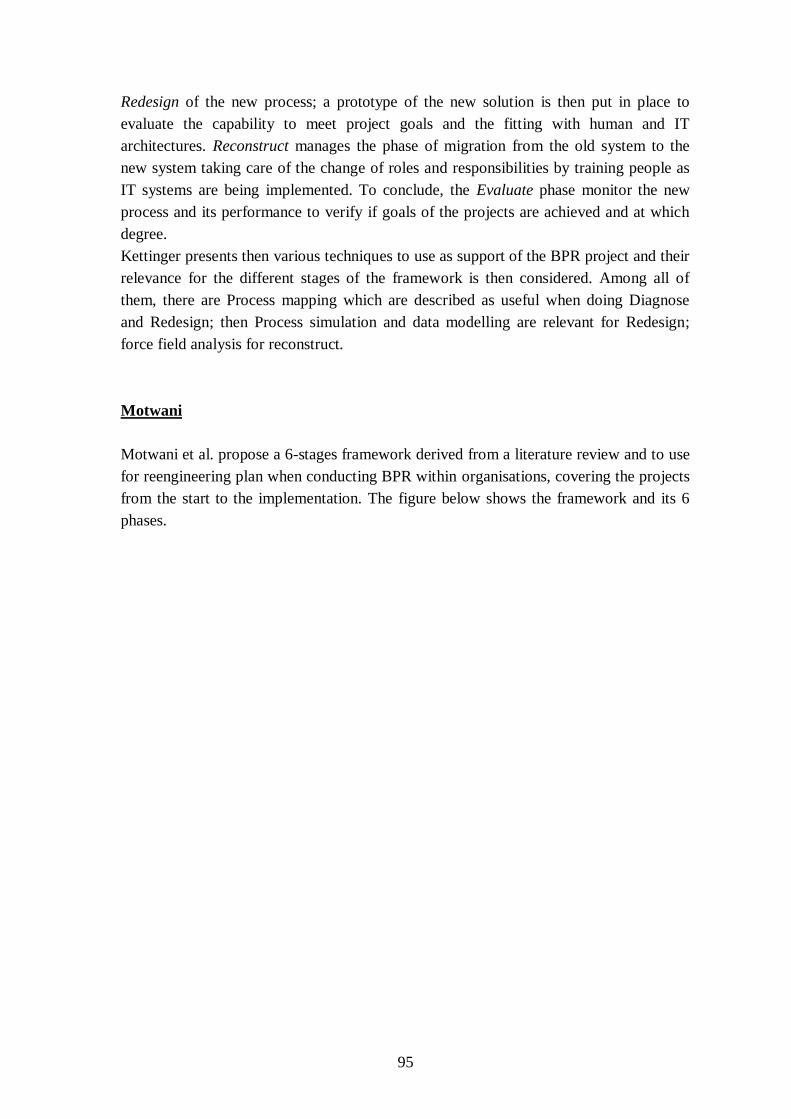
95
Redesign of the new process; a prototype of the new solution is then put in place to
evaluate the capability to meet project goals and the fitting with human and IT
architectures. Reconstruct manages the phase of migration from the old system to the
new system taking care of the change of roles and responsibilities by training people as
IT systems are being implemented. To conclude, the Evaluate phase monitor the new
process and its performance to verify if goals of the projects are achieved and at which
degree.
Kettinger presents then various techniques to use as support of the BPR project and their
relevance for the different stages of the framework is then considered. Among all of
them, there are Process mapping which are described as useful when doing Diagnose
and Redesign; then Process simulation and data modelling are relevant for Redesign;
force field analysis for reconstruct.
Motwani
Motwani et al. propose a 6-stages framework derived from a literature review and to use
for reengineering plan when conducting BPR within organisations, covering the projects
from the start to the implementation. The figure below shows the framework and its 6
phases.
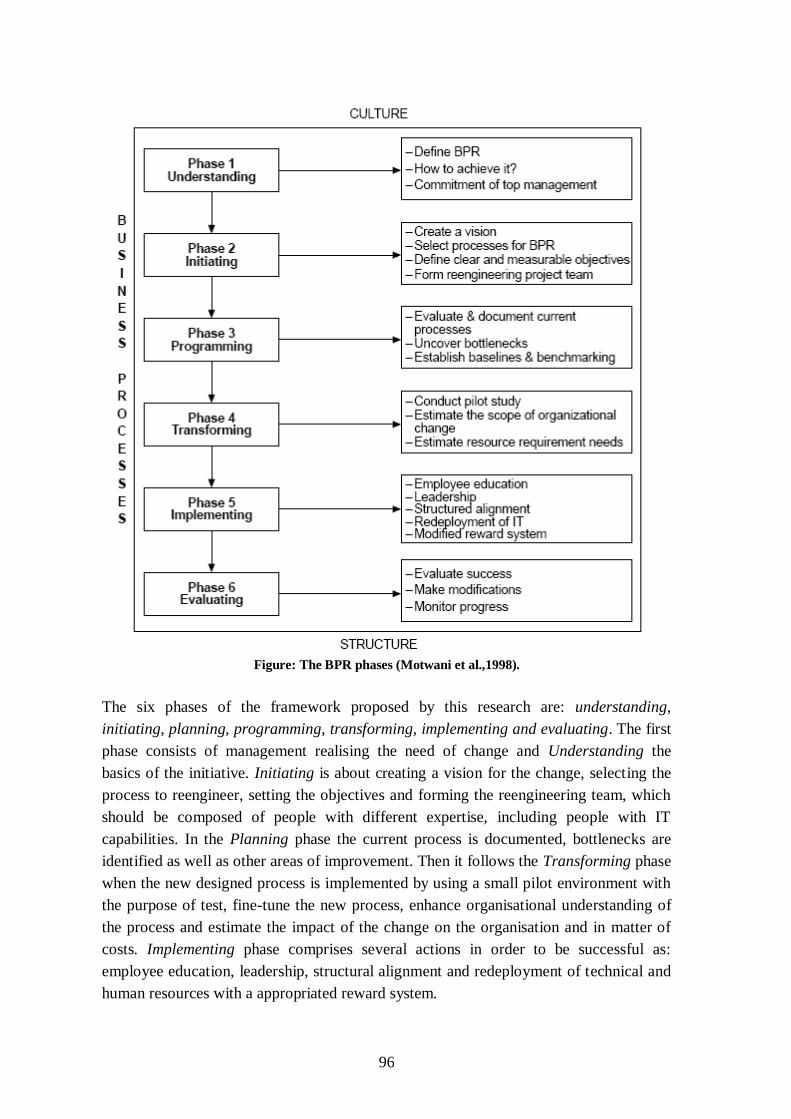
96
Figure: The BPR phases (Motwani et al.,1998).
The six phases of the framework proposed by this research are: understanding,
initiating, planning, programming, transforming, implementing and evaluating. The first
phase consists of management realising the need of change and Understanding the
basics of the initiative. Initiating is about creating a vision for the change, selecting the
process to reengineer, setting the objectives and forming the reengineering team, which
should be composed of people with different expertise, including people with IT
capabilities. In the Planning phase the current process is documented, bottlenecks are
identified as well as other areas of improvement. Then it follows the Transforming phase
when the new designed process is implemented by using a small pilot environment with
the purpose of test, fine-tune the new process, enhance organisational understanding of
the process and estimate the impact of the change on the organisation and in matter of
costs. Implementing phase comprises several actions in order to be successful as:
employee education, leadership, structural alignment and redeployment of technical and
human resources with a appropriated reward system.
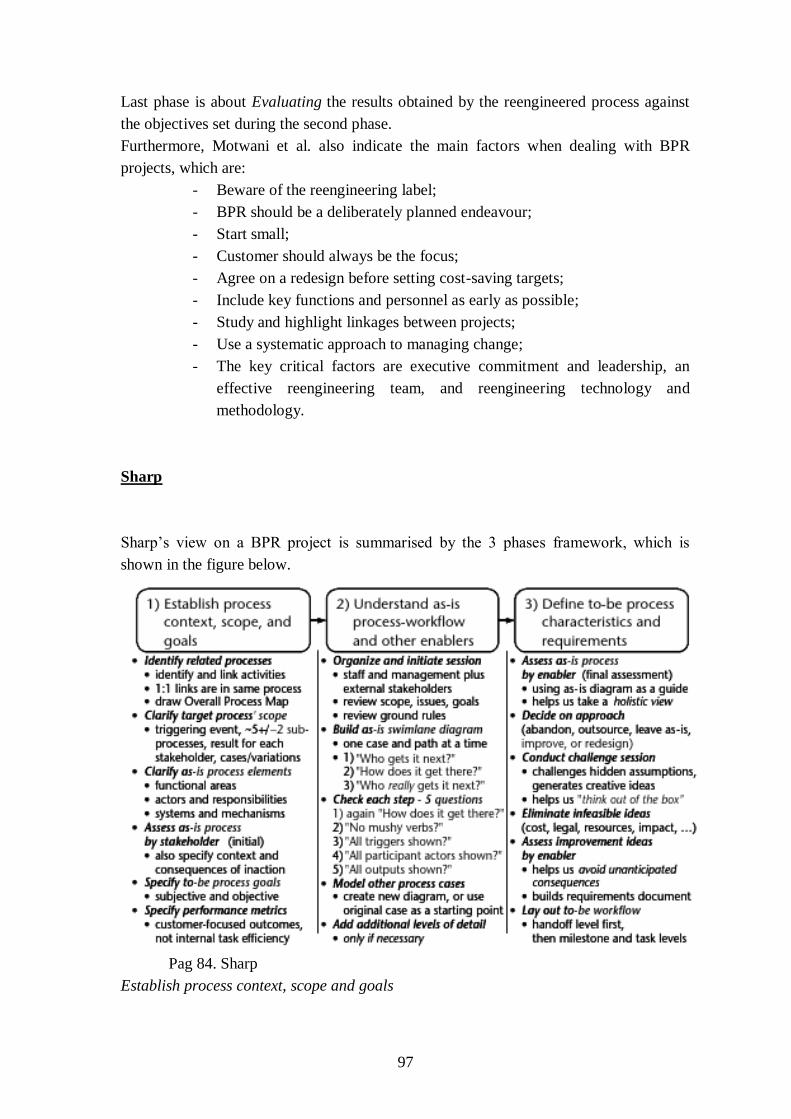
97
Last phase is about Evaluating the results obtained by the reengineered process against
the objectives set during the second phase.
Furthermore, Motwani et al. also indicate the main factors when dealing with BPR
projects, which are:
- Beware of the reengineering label;
- BPR should be a deliberately planned endeavour;
- Start small;
- Customer should always be the focus;
- Agree on a redesign before setting cost-saving targets;
- Include key functions and personnel as early as possible;
- Study and highlight linkages between projects;
- Use a systematic approach to managing change;
- The key critical factors are executive commitment and leadership, an
effective reengineering team, and reengineering technology and
methodology.
Sharp
Sharp‘s view on a BPR project is summarised by the 3 phases framework, which is
shown in the figure below.
Pag 84. Sharp
Establish process context, scope and goals
98
It is considered by Sharp as the most important phase because it happens in a short time
and highly affects the prosecution of the activity: if executed well, it will have positive
benefits on the project; otherwise, the consequences may create obstacles. This first
phase includes actions as: identifying the process to reengineer and its targets (who,
what and how), review organisational context (including strategy, mission etc), set
project objectives and goals
Understand ―as-is‖ process
Once the project objectives and targets are set the questions is to assess why the
improvements to make, were not achieved before and why that could be done. A
suggestion is to not get into details during these phase, but just to understand they way
the process is and works. Main actions for this phase comprehend mapping the existent
process, documents important observations and the other process enablers (IT, measures,
etc), keep track of ideas for improvement and the way they will act on the process.
Design ―to-be‖ process
This phase is divided by Sharp in two main activities:
- Characterize the to-be process;
- Design the to-be process workflow.
The first activity revolves around the final assessment of the as-is process, the strategy to
choose for reengineering as well as generation of new ideas or rejection of existing ones,
final development of the to-be model and revision of the conceptual data model.
The second activity consists of drawing down the new workflow, assessing each level
and decide what to keep of not to get the final process layout.
It has to be pointed out that Sharp proposes a method to reengineer workflows but not
how to reengineer a process. However, given the type of project conducted for this
Thesis Sharp‘s a theory on workflow modelling become relevant.
PBWD (Product-Based Workflow Design)
This methodology covers the technical side of a BPR project and its approach consists of
a four phases framework with the following phases: Scoping, Analysis, Design and
Evaluation.
During the Scoping phase the workflow that will be subjected to redesign is identified as
well as the performance targets and possible limitations of the project. The Analysis is
done to decompose the workflow and understand the dependencies for the purpose of its
evaluation and the design of the new workflow. Then, bearing in mind the project
objectives, the Design phase generates different alternatives of the workflow structure
which indicate task or information processing. After that, the Evaluation phase verifies
the proposed workflow structures and considers the achievement grade of the

99
performance targets. The workflow designs are then evaluated by the management and a
final choice is made.
The workflow design gets more into details, more specific theories and concepts are
used (e.g. Petri Nets): as the purpose of this Thesis is not to apply or test these theories
with workflow design, the PBWD methodology will not be further analysed.
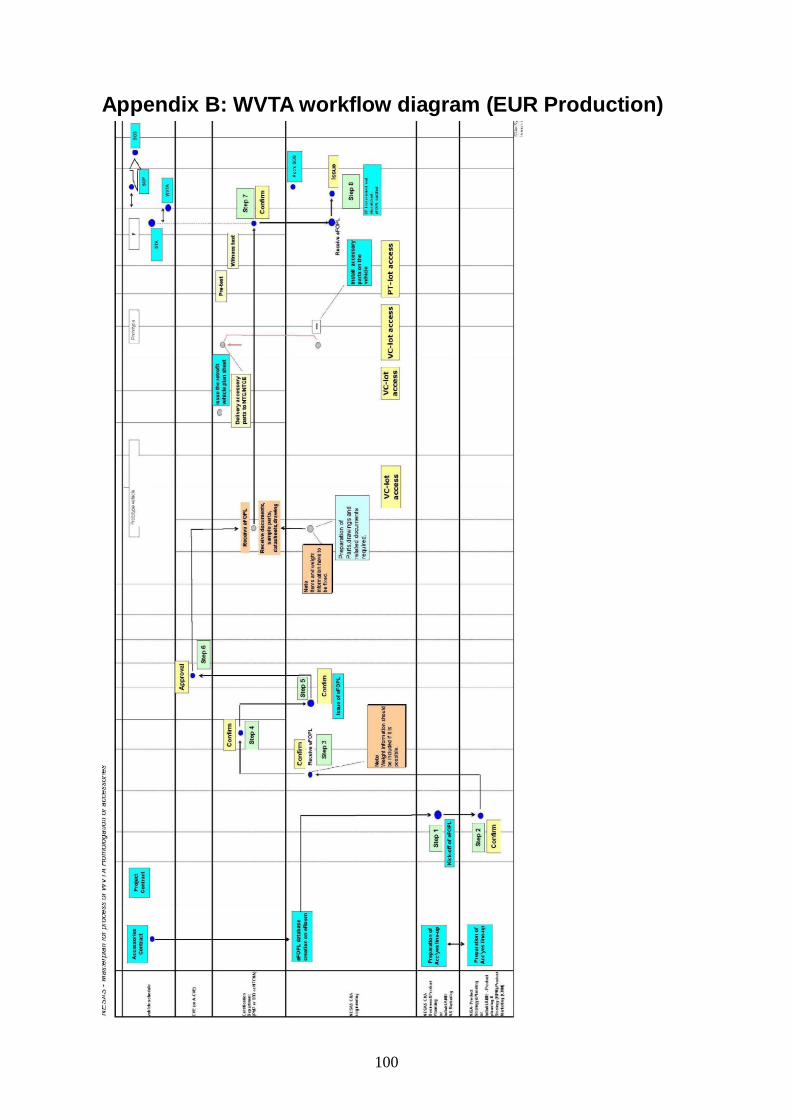
100
Appendix B: WVTA workflow diagram (EUR Production)
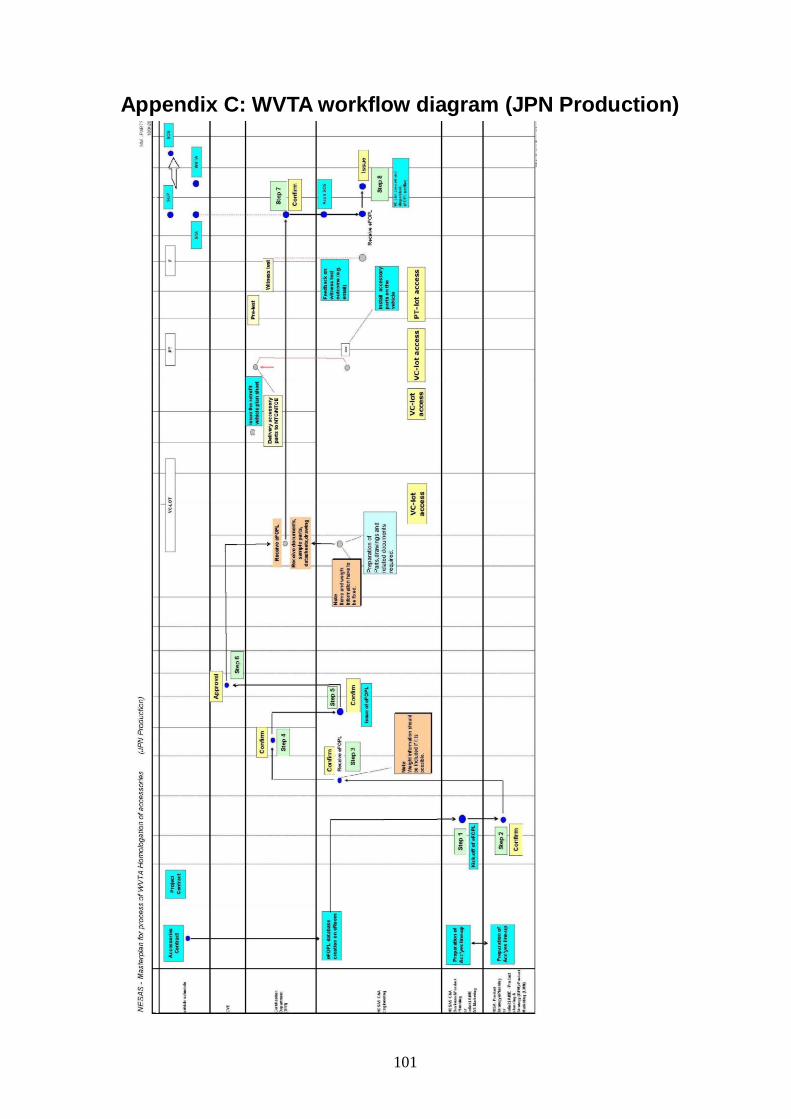
101
Appendix C: WVTA workflow diagram (JPN Production)