REEF COVER AND ZONATION CLASSIFICATION SYSTEM FOR …
39
3BRMPA .4240 9943 KUC REEF COVER AND ZONATION CLASSIFICATION SYSTEM FOR USE WITH REMOTELY SENSED GREAT BARRIER REEF DATA: USER GUIDE AND HANDBOOK D. KUCHLER Great Barrier Reef Marine Park Authority Technical Memorandum GBRMPA TM 9
Transcript of REEF COVER AND ZONATION CLASSIFICATION SYSTEM FOR …

3BRMPA .4240 9943
KUC
REEF COVER AND ZONATION CLASSIFICATION SYSTEM FOR USE WITH REMOTELY SENSED GREAT BARRIER REEF DATA: USER GUIDE AND HANDBOOK
D. KUCHLER
Great Barrier Reef Marine Park Authority
Technical Memorandum GBRMPA TM 9

GREAT BARRIER REEF MARINE PARK AUTHORITY
TECHNICAL MEMORANDUM GBRMPA-TM-9
REEF COVER AND ZONATION CLASSIFICATION SYSTEM FOR USE
WITH REMOTELY SENSED GREAT BARRIER REEF DATA
- USER GUIDE AND HANDBOOK
D. A. KUCHLER
March 1987
(submitted 1983)
SUMMARY
The operational use of the Reef Cover and Zonation Classification System for use with Remotely Sensed Great Barrier Reef data, is outlined. A recommended data recording handbook is described for efficient recording from the classification system, whether it be in the laboratory or the field. The handbook is designed to be held in the palm of one hand and to be water resistant when used in the field. It comprises the classification system and data recording cards which are stored in an inside pocket. Each card has facilities for eight sample site recordings.
KEYWORDS: coral reef, classification system, data recording
handbook, GBR, remote sensing.
Technical memoranda are of a preliminary nature, and represent
the views of the author, not necessarily those of the Great Barrier Reef Marine Park Authority.
Please address comments or requests for additional copies to:
The Executive Officer,
Great Barrier Reef Marine Park Authority,
P.O. Box 1379, TOWNSVILLE, AUSTRALIA, 4810.

C Commonwealth of Australia
ISSN 0817-6094
ISBN 0-642-52561-7
,J C
Great Barrier Reef Marine, Park Authority
P.O. Box 1379 Townsville QId 4810 Telephone (077) 81 8811

EXECUTIVE SUMMARY
Introduction
This memorandum is one of a series of four GBRMPA Technical
Memoranda dealing with the terminology, recognition and
classification of coral reef cover and zonation features for use
with the analysis of remotely sensed data of the Great Barrier Reef.
Objective of the Memorandum
The memorandum outlines how to use the reef cover and zonation
classification system designed for use with remotely sensed coral
reef data efficiently and easily and easily. It instructs users
in the systematic recording of information obtained from field
sample and remotely sensed data in the coral reef analysis
process. The feature terminology and reef coral and zonation
classification system were described in GBRMPA Technical Memoranda 7 and 8 respectively.
A data recording handbook designed for efficient use in the field
laboratory is described and worked examples are given.
Summary
The classification system is an attempt to develop a standard for
the classification of reef cover and zonation in the Great
Barrier Reef region to facilitate comparison and evaluation of
interpretations of remotely sensed data. The system is user
oriented and based on a logical division approach to
classification but is not strictly hierarchical so that
classification decisions are not hierarchically dependant. This
could limit its usefulness beyond the mapping phase.

The system is based on five primary categories by criteria which
are visible on, or inferrable from, remotely sensed data. The
chosen criteria are (I) Zones, (II) Features, (III) Composition
and/or Position, (IV) Condition and/or Pattern and/or Morphology,
(V) Presence. A secondary categorising structure permits the
ready classification of mixed data, i.e. when a mapped unit
consists of a mixture of surface cover types or features.
Multiple entries, to allow for features which can be categorised
into more than one primary group, are permitted.
Coding of features is generally numeric to facilitate transfer of
the recorded data between interpreter, recorder, operator and
computer files.
Conclusion
The data recording book described provides a useful basis for
development as a standard issue for use by field observers and
air photo and image interpreters. Further discussion with other
researchers and end users of the resultant data is required
before the schema could be recommended and/or adopted as a
universal data recording standard for the region. The system is
simple enough in concept but the number of possible entries
required for some features would be cumbersome until the user was
thoroughly familiar with the given range. This is however a
criticism common of most in-the-field recording systems.

TABLE OF CONTENTS
Title
1. Introduction
2. Classification system design
Primary categorising structure
Secondary categorising structure
Multiple entries
Coding symbols
3. Data recording handbook
4. Use of classification system
The decision making process
Recording classified data
Use of primary categorising structure
Use of secondary categorising structure
Use of classification system with recording card
Conclusion
Acknowledgements
References
Page
1
2
2
4
4
5
6
8
8
8
11
12
17
30
30
31
FIGURES
Figure 1 • Example of the field handbook which contains
the data recording cards.
6
Figure 2 • Example of the data recording card. 17 Figure 3 • Landsat MSS image of Cairns Reef, GBR. 19 Figure 4 • Flow-diagram illustrating the use of the
classification system with a recording card. 20
Figure 5 • Aerial photograph of Green Island Cay (GBR)
and surrounding reef flat. Sample site 1 is
delineated. 29
TABLES
Table Full listing of data categories as used in
this classification system.
3
Table Abbreviated entries for the classification 7
system given in the data recording handbook.

-1-
1. INTRODUCTION
In recent years, the Great Barrier Reef (GBR) has been
mapped by many workers. Maps have been produced at scales which
depict individual reefs (Stoddart, 1969, 1978; Flood, 1977); reef
regions (Stoddart et al., 1978); and the whole Great Barrier Reef
province (Maxwell, 1968; GBRMPA, 1983). During recent mapping
projects (Jupp et al.,' 1985; Kuchler, 1984) it became evident
that these maps were not compatible because the labels used to
represent reefal cover and zonal units were not standard. For
this reason, the information could not be easily integrated into
a GBR data base.
Since a standardised labelling procedure is required for
mapping geomorphological features in GBR remote sensing projects
and for GBR mapping in general, a method was devised. The method
has three components: a standardised geomorphological
nomenclature of the GBR; a classification system which
categorises and attributes labels to the nomenclature; and, a
classified data recording system. Each component has been
presented in a separate GBRMPA Technical Memorandum.
In one paper (Kuchler, 1986b), a nomenclature for
geomorphological features on reefs within the GBR is presented.
There is presently insufficient ground data by which to verify
terms, so the nomenclature adopts the most frequently used terms
in the literature.
The other paper (Kuchler, 1986a) categorises the
nomenclature, attributes labels, and forms it into a
classification system for use in the mapping process. The
classification system was designed for labelling reef covers on
maps, for labelling interpreted reef covers on aerial and orbital
remotely sensed GBR images, and for recording ground data. Since
the classification system has already been presented, this third
paper describes and illustrates the classified data recording
method. A handbook and data recording card format which
facilitate easy recording are presented in the appendices of this
paper.

-2-
2. CLASSIFICATION SYSTEM DESIGN
The rationale behind, and the design of the
classification system are described in Kuchler (1986b). To make
this presentation more meaningful, a brief reiteration is given
here.
The classification system was devised for the following
two reasons;
to provide a standard for classifying and labelling
geomorphological information on reef covers and zonation.
Such information may be derived from remotely sensed data
or from field observations,
to provide a standard which allows the comparison and
evaluation of interpretations of different types of
remotely sensed data.
The system is built on information needed by the
potential user and is based on the logical division approach to
classification (Ryerson and Gierman, 1975). It has both primary
and secondary categorising structures.
2.1 Primary categorising structure
The classification system has five levels which form
the primary categorising structure. Each level attempts to
categorise reef features according to different criteria which
are important to mapping of the GBR using remotely sensed data.
Thus, the classificatory form and purpose are inextricably bound
together. The criteria chosen for each level are as follows:
Level I • Zones
Level II : Features
Level III : Composition and/or position
Level IV : Condition and/or pattern and/or morphology
Level V : Presence

-3-
Table 1. Full listing of data categories as used in this
classification system.
to 75 W (1)
>, 4.1 In to .--4 0 1-1 as as 43 0 4-1 4-1
4 14 14 14 1>OnS0 4-, 11) W (1) g.4 0 '0 0
o1c a> >> 1-1 RS cA. OP OP OP OP OP OP OP 0 0$ 0$ 0$ mcDcpc) 1::1,-1
*000 ,000000 0$ eLnou) 'Ti out-) 4-4 it) ri W 0 c.) pi -ot Ul ko t-- co a) .-4 E .-f E 0 0 e e 0 o .-4 en en 0 1.4 4) a) > -4 1 1 1 1 I I I 1 1 La 1 c,) cn v ..n to co .-4 1 1 1 0 44 4.) '0 >, 04 to •,-1 a) 1 0 00000000 •.1“) 1 I 1 1 1 I 10Inco en 0 17, a) > A a ...3
0 1-4 04 m .v tot +.0 1-.. oo 0, , • v-1 04 on ct, in ko ex, ,-.4 v-I en n.>. ,...1 Z = F4 0
111 to t•-• CO 01 0 v--1 N 01 V 0 to N 00 01 0 v.-1 N on cr. 141 to 1`, co 01 0 r-1 114 PC n• Z ri ri vv-1 r-1 r-1 r-4 '-4 ri rvi 1,1 N N N N N N N N N N on 01
z
w 'Ti
0 4) 0$ wa
..1).1 0 a 0 4-, W 1t$ 0 '0 -4 W CD 0 W
Z 0 (1) a a 0 4, 4-, •.-1 1:1 a ) ,-4 ■-4 W r-1 4-1 1:1 44 W
0 0 a) (1)4-1 0 OW 00 (a of al te) 0) as 0 0 as (a > 4) 0 4-) 0 0
H 0 4-, 4-) ra a r0 a 4.) 1:1 04 P4 0 4-1 4-1 4-, 14 0 - ■-f 'C1 '0 .--i 0 > 0 0) 0 W 4-) 4-,
E4 0 to m 4-) ti) as 0 Ow 04-)1000001,40...t..-tra,--ia) 10 0 Or 0, '0 as 0 H
-, 4-1 Ul 1:1 4-1 "0 o..1 V1 4-1 U P4 1t$ 0 •ri 0 4-, 4-) as (4 4) 4-) II .--4 (I) rl. 0 •.-4 0 0)
CI 04 0 U*1 0 CD 0 0 0 (4 g -I-1 r-4 g e 4-) '0 0 to a) 41 0 -.1 0 0 0 3 3 4.1 44
Z 14 04 ,-4 '0 0 U .0 t) 0 0 as 4.) 0 -I-1 W 0 -t-1 ( 0 0 as (- 4.) 1-4 a) o >. 0
0 0 a) 4.4 0 '0 0 to 0 4.) •.-4 $3. 0 .44 0 U .--4 4.4 a) ..-4 XI W 0 0.. a) 4-1 0 tp .-4 ....I 4-) .-4 )4 .--t 0 a
t.) 14 a) 0 0. as X •,-4 0 4) 4) co 0 ..-4 a) w 0 0 4.) o )4 10 .-4 as '0 0 0.. 4- 1 .4 0 a ti w ,--{ w (t) 44 E 4, W ..-1 0 -H ..-4 44 0 a) •,-4 0 0 .0 -.4 > 0 0 u) 0 0 al o (1) •.1 0 0 0 .v.4 4-, 0 cd 0 0 .0 a) a) .• (/) 0 .-1 A Z 4 E-1 a g A g A to 0 0 0 I-1 4-4 E-4 Z t..) U Z U.. ti) 1--) co to Z ca a a Z cn a H
C.
H On tO N 03 01 0 v-1 N 01 V 111 to N c0 01 0 r-4 N 01 V 1.11 to r`. 03 01 0 r-1 N on ,t+ tr) to N co 01 e:::,
A .--1 --1 r-4 v-4 v-1rlr-lr-11-41,4NNNN010404NN041,1010101010101Cn0101V
14 u) 'V 0 04 ti, 4-' 0 004-)0 0$ ..X 0 In 41) -,-4 0 > 4.) as 4.) 0 )., 0 I-.
Lk 14 •.-1 0 g 4-, 1:3, U tcl .3 4-$ (0 3 0 al 4-)
1-1 0 4.1 14 14 RS 14 MS 3 4-1 tp •-1 CO 4-, 44 (I)
V) 1..1 0$ as U U 3-4 as 44 0) 0, at as 4-) 0
0 El •11 4-) 0 RS g 11) -1-, 0 e 44 01 to 0 0, W at 3 0, 0 W
04 4-1 14 'XI etS 4.) 1-1 0 0 0 01 0 0 0 0 0 W > a) 0 0 0 0, U 0,
ZM W as 1-1 .0 4-4 0 as a) .--4 0 0 0, w ..-4 > > 0 0 '0 -.4 0 as
0 0 ).. ,--I )4 .0 .0 3 as 0. 0 A '0 t-i a) ..-4 W r-1 r-1 01 e ri g vv% 14 Ul 14 CD 44 'Ti ..-1 0 .14
t.) a a) T.1 a) 44 4-) 44 4-) '0 3 u) 4.4 a 0 .--t 0 co 0 0' 0 A 0 '0 -I-I 0, ..-4 '0 as 4, ai W 0, ts 1:5 4-, 1-4 4-4 ...1C - ,-1 0 04 '0 3 1-4 0 0 40 0 W 0 o E 0 0 0, 0, 0, al 1-1 4 - ,-4 g 10 g > 0 0 (-4 19 g g g g as al •-1 .--1 0 0
t 4 04 - ,-1 0 0 0 RC 0) A a) to 0 o -t .-4 .-4 (/) 0 0 0 -...4 4) 1.4 al r-i 0 aS al O0 0 s4 ZI-3 Z 0)43 Aatga 03 go 4 4 4 u) ciacnocnuaornauozza 01 GO 43
H Ul to N 00 01 0 '-4 N On ct, Ul 43 N 00 01 0 1--1 N on <3, on to N 03 01 0 v-4 N 01 o' on to N 00 01 0 1-1 N 01
A r-1 r-4 "A r-4 e-4 r-I <-4 "-I 1-4 r-4 N N N N N N N N N cvononmononmononmmve,” .0, V
H L11 to N 00 ch
N On cM Ul to N CO 01 CD v-1 N on ct• in to t•.• CO 01 O 1..4 N on et' Ul to N CO 01 0 r-1 v--1 v-1 r-1 tv.4 ,-4 v-4 1-4 ri N N N N N N N rve9Nen monmononmonmoncr
4-, N
N 01 '0 44 W 44 4-1 ,-I WW
W 4.4 04 RS c15 v.-1 N ni >, 44 La a) 0 1-1 ,-10 W g g En •-1 0
4-1 > .-4 N 4-1 4-1 (-4 ,-1 0 N 0 g 0 1.3 0 0 .-1 0 0 0 N 0 0 0 0 0 0 CD 41 e 4-1 4-, 4-4 ,-I .-X 0 0 at 4-1 4-1440W N 0 000.-1 0, o to 0
to 0 w I-, Cu ..)4 .4-1 14 4-) 4-) w 1-4 o V 0 0 0, to o Ca 0 '0 0 to 4-1 0 11) ts, 0 U 1-1 E etS 0, etc tr. O a) 0 t4 as g r-1 0 ,-1 4 '0 A 0 IA 0 I. A -I (1.1 ,--1 0 4 - ri r-i 0 ,-iws-ig 0.-i 140 .-i 0 V o '0 ,--1 la M VI 4-1 g-1 W ll) 14 .34 U 14 144 4, 144 w a) •.-1 '0 CP A V 0) o .-i 0, a) 0 0 re, 14 as .--1 ct)
a) 9.4 a 0 u 4J 4-) 0 > to - ,-1 .0 0 to 0) 0 TI a) 0 >•, ,--1 o to A 44 a) > t3 U 4-1 4-1 4-1 4, 04 4-4 4-4 0 CCI 4-1 144 44 4-1 0 g •.-1 41) .-1 g 10 W 0 4 0$ W r-4 0$ (J),-1 ,0 04 0 -I a)
0 0 a a Z v) a a ol P4 a a a a 0 H A CO 4 g <r) Et) A tri Z C) 01 tJ H (..) tn 0 1.4 A . II 14 H .1-) ks.) (-• co al o .-.4 fq rn •'4). tr) l0 r- co of o .-4 (,) rn .1. Lc) QD r- co <31 o ,--1 (-4 en ‘1, to 0 .1 r-1 1-1 q- ♦ 1-1 ,-4 1-.1 r-1 r-1 I-1 .--1 N N N N N N N N N NI on on on on on on 1:4 H P. Z
PR
ES
EN
CE
4-1 0 4-, CD U 0 W ,W 0
0 0 0 *--4 0 11 W 04 •,1 0 11 r-1 1--4 'Ti W A tr. ,-.4 0 0 o of 0$ to o ....t a) 4-) 0 0 0 -I 44 '0 4-4 0 44 44
4-4 0 0 0 e 4, v-1 3 4-1 00)03 .--4 1.4 M O. 4-4 4 4-1 44 s-, a) 0 4) 4.) 4-, 4-) 4-4 0
as 3-1 4.) 0 0 W U 04 E 0 0 0 a) as a) A 14 'V a) •.-I A t--1 .-1 0 0 as 0 0 4-4 '01 a) as r-1 0 -1-1 0 0 4 > e 4-, 0 04 44 4-4 0 as as 4.. ,-4 X IT 0, tn X 0. 4) ,-•4 en 44 al 4-) 10 44 o 0 4.) 0) 4-) )... 0 ..-4 a) 0) ,-4 .--i 1-1
01 014-14-144 00011000)00010•1014000 0,10, 010. ,-1004a0, >000 r-4 00000 - ,-I 00-H-HettettetS0o-.1000.0,0 044000)0(3.0)4-(000.0.0.0 (nZoca4u0Zaaaaaalal El apaE-icnucnai-laracicncncDa>uuu
FE
AT
UR
ES

-4-
The categorising criteria are not strictly
hierarchical, so decisions are not hierarchically dependent when
classifying a mapped unit into more than one level.
2.2 Secondary categorising structure
The classification system was designed with a
secondary categorising structure to allow for the classification
of mixed data. Mixed data occur when a mapping unit is composed
of a mixture of surface covers and/or zones. Consequently, it may
classify into more than one category within any level in the
classification system. Mixed areas are a significant feature of
the reef surface when it is viewed from the resolution of a
Landsat MSS image (1 pixel = 0.5 hectare).
One example of mixed data is the mixed pixels or
'mixels' which occur in satellite imagery because of a less than
optimum relationship between the recording system resolution and
target size. Another example is ground sample sites which, when
determined by statistical random sampling methods, often occur on
the boundaries between different reef covers or zones (Kuchler,
1984). Hallum (1972) states that, from space altitudes, many of
the ground resolution elements are individually composed of a
mixture of object categories and many of the data points
generated by multispectral sensors are not characteristic of any
single object category. Thus, the purpose of the secondary
categorising structure is to allow for more than one category to
be recorded for any level within the classification system. For
example, a sample site on the ground corresponding to a 'mixel'
on the Landsat image may be composed of both a living and a dead
coral zone, so category numbers 21 and 22 of Level I would be
recorded.
2.3 Multiple entries
The classification system also has multiple entries
since some features categorise into more than one of the five
levels. The term 'beach' for example, is a category of both
Levels II and III. This is because 'beach' is both a reef feature
(Level II) and the composition of a feature (Level III), as in
the term 'beach ridge' where 'ridge' is the feature and 'beach'
is the composition.

-5-
2.4 Coding symbols
The numerals 5 to 49 were chosen as the
classification coding symbols for the following two reasons:
• They support a five column matrix from which original
unclassified information can be systematically retrieved.
Numerals 1 to 4 have not been used, and therefore are not
unit value coding symbols. These numerals have been
reserved for the retrieval process where they indicate
that the coding symbol in the recording is a value in tens
rather than a unit value. For example, the entry 724940 is
retrieved as:
724940
Level I - category 7 = reefal shoal Level II - category 24 = shoal (2 not a unit value) Level III - category 9 = south Level IV - category 40 = temporary feature
(4 not a unit value) Level V - not used.
Thus, the feature is a temporary reefal shoal located to the south.
Numerals greater than 49 cannot be used for coding
symbols because they are prefixed by numbers which are used as
unit value coding symbols. The number of categories available for
classification at each level is therefore limited to forty-nine.
In transferring data between interpreter and interpreter;
interpreter and recorder; and operator and computer files;
a shorter, simpler and more accurate communication exists
with numerals, rather than with upper and lower case
alphabetic letters.

List of Data Categories
Pocket for storing Data Recording Cards
-6-
3. DATA RECORDING HANDBOOK
The data recording handbook is necessary for efficient recording from the classification system both in the
laboratory and in the field. The handbook is designed to be held
in the palm of one hand and to be water resistant in the field.
It comprises the classification system and data recording cards.
In the classification system, some entries have been abbreviated
(Table 2) to allow the listing to fit within the dimensions of
the handbook. The recording cards are stored in an inside pocket
of the handbook (Figure 1). Each card has facility to record
eight sample site recordings (Figure 2).
Figure 1. Example of the field handbook which contains the data
recording cards.
The listing of data categories is that which appears in Table 1.

-7--
Table 2. Abbreviated entries for the classification system.
Abbreviated entry name Complete entry name
L Level Mtple Multiple
Spur Groove Spur and Groove Rf Reef
Zone Shal Shallow Med Medium Req Required Smarine Submarine Chnl Channel Btwn Between Pn Pattern PN Pattern in Level IV title Encrust Encrusting Part Partially Clear Cleared Vegetatn Vegetation Engin Engineering Constr Construction Mixed Mixed live and dead Sgle Single Dep Depression Perm Permanent Temp Temporary .5 0.5 m water Var Depth Variable water depth Lgt Light Cover Covering Hvy Heavy

-8-
4. USE OF CLASSIFICATION SYSTEM
Two sequential procedures are involved in using the
classification system: categorisation of the data; and, recording
of the categorisation. Use of the primary and/or secondary
classification structures is controlled by the decision making
process, data scale, and classification purpose.
4.1 The decision making process
The interpretation of remotely sensed imagery or of
ground covers at a reef site involves the following four steps;
detection of features,
recognition and identification of features,
analysis and delineation of patterns,
and classification.
A decision regarding the detectability of a feature
is made in step one. Decisions regarding the precise
identification and delineation of a feature are made in steps two
and three. These two are the principal decision-making steps, and
involve a combination of nomenclature decisions and general
classification concepts. The first three steps are iterative
until a final nomenclature decision is reached. A feature is
named using the nomenclature presented in Kuchler (1986a). In the
final step, the decision is categorised and labelled according to
the classification system and then recorded.
4.2 Recording classified data
A critical component in using the classification
system is the method of recording. The method, specifically
outlined later, ensures that:
-9-
the original pre-classification information can be
retrieved
the recording is efficient and compact, even though it may
be lengthy at times
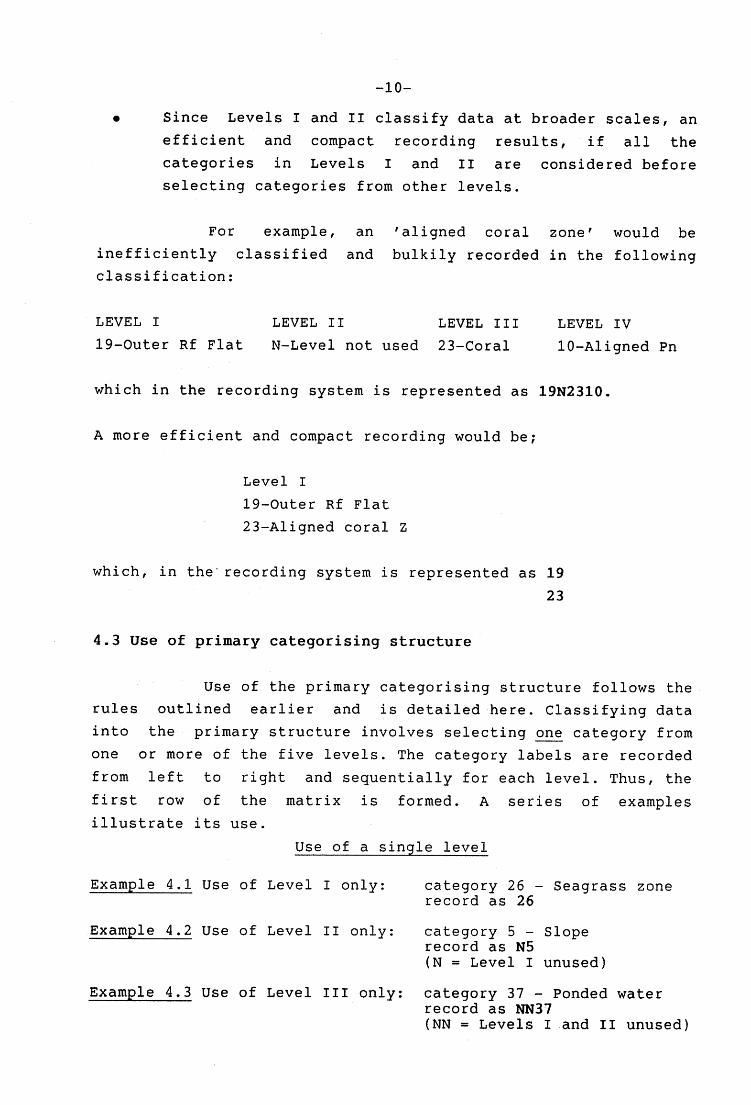
The method is systematic and consistent, and is built on
the following five rules:
The recording follows a matrix array in which 5 x 49
entries are the maximum. The 5 columns represent the five
classification levels, and 49 rows represent the maximum number of multiple selections possible within any
particular level.
Each classification level occupies a unique and sequential
place in a five column matrix array:
Level I occupies column
any row in the matrix.
1, the first position in
Level II occupies column 2 and the second position.
Level III occupies column 3 and the third position.
Level IV occupies column 4 and the fourth position.
Level V occupies column 5 and the fifth position.
All multiple coding selections from any level are recorded
in their respective column positions in any row in the
matrix.
With the obvious exception of Level I, the recording for
any level must be preceded by a recording for each
previous level. For example, a Level II record is preceded
by a Level I record; and a Level IV record is preceded by
records in columns 1 to 3 (Levels I, II, III). Such a
system allows the classification levels to which the
labels refer to be sequentially deduced from a matrix
array.
-10-
• Since Levels I and II classify data at broader scales, an
efficient and compact recording results, if all the
categories in Levels I and II are considered before
selecting categories from other levels.
For example, an 'aligned coral zone' would be
inefficiently classified and bulkily recorded in the following classification:
LEVEL I LEVEL II LEVEL III LEVEL IV 19-Outer Rf Flat N-Level not used 23-Coral 10-Aligned Pn
which in the recording system is represented as 19N2310.
A more efficient and compact recording would be;
Level I
19-Outer Rf Flat
23-Aligned coral Z
which, in the recording system is represented as 19
23
4.3 Use of primary categorising structure
Use of the primary categorising structure follows the
rules outlined earlier and is detailed here. Classifying data
into the primary structure involves selecting one category from one or more of the five levels. The category labels are recorded
from left to right and sequentially for each level. Thus, the
first row of the matrix is formed. A series of examples
illustrate its use.
Use of a single level
Example 4.1 Use of Level I only: category 26 - Seagrass zone record as 26
Example 4.2 Use of Level II only: category 5 - Slope record as N5 (N = Level I unused)
Example 4.3 Use of Level III only: category 37 - Ponded water record as NN37 (NN = Levels I and II unused)

Use of multiple levels
Example 4.4 The use of five levels to classify a seagrass zone heavily covered by live seagrass.
Level I: category 26 - Seagrass zone record as 26
Level II: category N - level unused record as 26N
Level III: category 22 - Seagrass record as 26N22
Level IV: category 7 - live state record as 26N227
Level V: category 31 - heavy cover record as 26N22731
Retrieval of original information from classified data record
Using the record 26N22731 from the preceeding example.
Always retrieve from left to right, from first to last row, and one row at a time.
The first numeral is 2. Since 2 is not a unit value but a
tens value in the labelling system, the numeric value for
column one is 26. Column one is used for Level I in which
26 represents Seagrass zone.
In the second column (Level II), the character N indicates no category was recorded.
For the third column (Level III), the first numeral 2 is
not a unit value in the labelling system. Therefore, the
category number is 22, which in Level III indicates Seagrass.
The first numeral in column four is 7, which is a numeric
label in the system. Category 7 in Level IV indicates a Live state.
Three is the first numeral in column five. Since 3 is a
tens value in the labelling system, the category is 31. In
Level V, 31 indicates a Heavy . cover.
Thus the classified information is a seagrass zone heavily
covered by live seagrass.
-12-
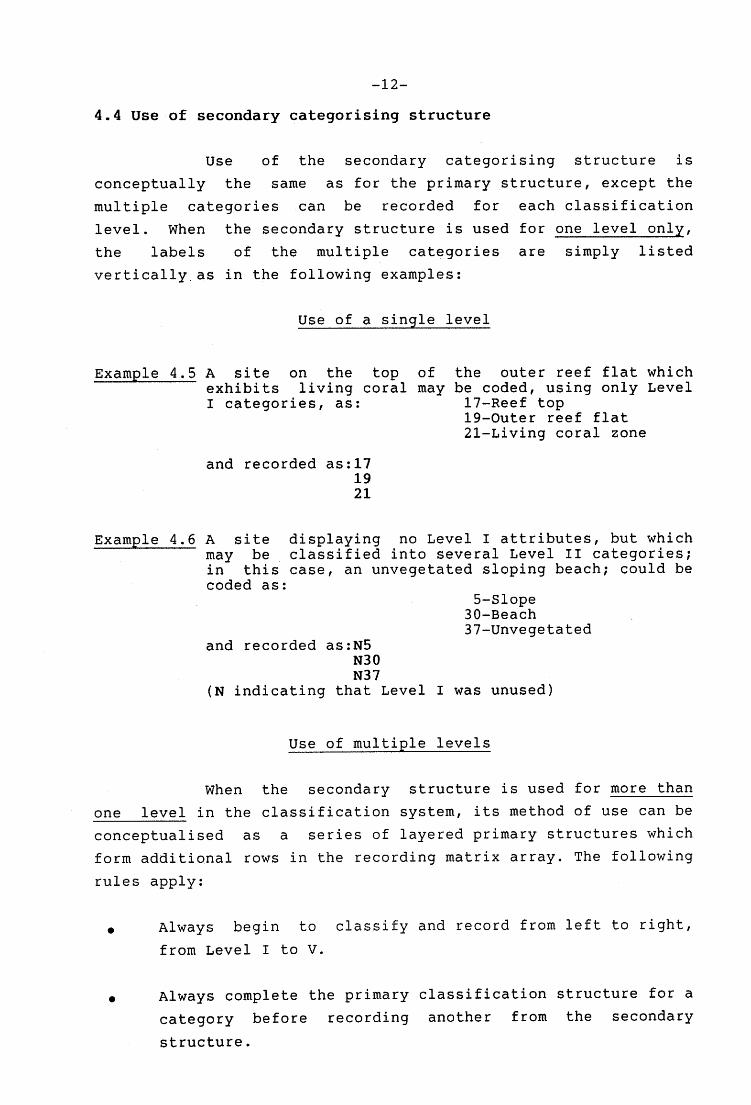
4.4 Use of secondary categorising structure
Use of the secondary categorising structure is
conceptually the same as for the primary structure, except the
multiple categories can be recorded for each classification
level. When the secondary structure is used for one level only,
the labels of the multiple categories are simply listed
vertically , as in the following examples:
Use of a single level
Example 4.5 A site on the top of the outer reef flat which exhibits living coral may be coded, using only Level I categories, as: 17-Reef top
19-Outer reef flat 21-Living coral zone
and recorded as:17 19 21
Example 4.6 A site displaying no Level I attributes, but which may be classified into several Level II categories; in this case, an unvegetated sloping beach; could be coded as:
5-Slope 30-Beach 37-Unvegetated
and recorded as:N5 N30 N37
(N indicating that Level I was unused)
Use of multiple levels
When the secondary structure is used for more than
one level in the classification system, its method of use can be
conceptualised as a series of layered primary structures which
form additional rows in the recording matrix array. The following
rules apply:
Always begin to classify and record from left to right,
from Level I to V.
Always complete the primary classification structure for a
category before recording another from the secondary
structure.

-13-
For Levels I to IV, always record one category from the
secondary classification structure at a time.
For Level V, record as many categories as is necessary
from the secondary structure at a time.
When more than one Level V category is recorded, complete
the primary classification structure for each category, by
repeating the Level I to IV entries.
The primary structure relating to the Level V categories
must be complete before another category from Levels I to IV is recorded.
In operation, the following sequence occurs:
Step 1.
Step 2.
Step 3.
Step 4.
Step 5.
Make one recording from Level I.
Complete the primary classification by recording
one category from Levels II, III and IV.
Make one or more recordings for Level V.
If more than one category is recorded for Level
V, repeat the Level I to IV recordings for
category.
Reiterate Steps 1 to 4 until all multiple
selections for each level have been recorded.
each
The following examples will illustrate its use:
Use of multiple levels
Example 4.7 Description of sample site:
Seagrass zone - 80% live seagrass - patch of 20% medium grain sand ponded water 0.25 m deep
Classify as:
LEVEL I 26-Seagrass zone 26-Seagrass zone 26-Seagrass zone
LEVEL II LEVEL III 22-Seagrass
26-Sand patch 26-Sand 37-Ponded water
LEVEL IV LEVEL V 7-live state 12-80% 27-medium grain 7-20%
15-<0.5m
Record as: 26N22712 262626277 26N37N15

-14-
Example 4.8 Description of sample site:
Seagrass zone - 80% live seagrass - 20% sand
Classify as: LEVEL I LEVEL II 26-Seagrass zone 26-Seagrass zone
Record as: 26N22712 26N26N7
Example 4.9
LEVEL III 22-Seagrass 26-Sand
LEVEL IV 7-Live state
LEVEL V 12-80% 7-20%
Description of sample site:
Classify as: Seagrass zone - 100% seagrass covered by 0.25 m water
LEVEL I LEVEL II LEVEL III LEVEL IV LEVEL V 26-Seagrass zone 22-Seagrass 14-100%
15-<0.5 m
Record as: 26N22N14 26N22N15
To retrieve original information from the classified data record,
always retrieve left to right, from first to last row, and one row at a time.
Row 1 Column 1 = Level I Category 26 = Seagrass zone (2 is not a unit value)
Column 2 = Level II Category N = Level unused
Column 3 = Level III Category 22 = Seagrass
Column 4 = Level IV Category N = Level unused
Column 5 = Level V Category 14 = 100% cover
Columns 1 to 4 (Levels I to IV) same as Row 1 Column 5 = Level V
Category 15 = <0.5 m
Row 2

-15-
Example 4.10
Description of sample site: Reef rim - Rubble bank with algal encrustation
Coral head with no living coral Outer reef flat - Shingle 50%
- Sand 50% Windward
Classify as: LEVEL I LEVEL II LEVEL III LEVEL IV LEVEL V 15-Reef rim 18-Bank 24-Rubble 15-Reef rim 21-Algal encrust 15-Reef rim 9-Coral head 8-Dead state 19-Outer rf flat 25-Shingle 9-50% 19-Outer rf flat 26-Sand 9-50% 19-Outer rf flat 12-Windward
Record as:
151824NN or shortened to 151824 15N21NN 15N21 1598NN 1598 19N25N9 19N25N9 19N26N9 19N26N9 19N12NN 19N12
To retrieve original information from this classified data record,
retrieve left to right, from first to last row, and one row at a time.
Row 1 Column 1 = Level I Category 15 = Reef rim (1 is not a unit value)
Column 2 = Level II Category 18 = Bank (1 is not a unit value)
Column 3 = Level III Category 24 = Rubble (2 is not a unit value)
Row 2
Column 1 = Level I Category 15 = Reef rim (1 is not a unit value)
Column 2 = Level II Category N = Level unused
Column 3 = Level III Category 21 = Algal Encrust (2 is not a unit value)

-16-
Row 3
Row 4
Row 5
Row 6
Column 1 = Level I Category 15 = Reef rim (1 is not a unit value)
Column 2 = Level II Category 9 = Coral head
Column 3 = Level III Category 8 = dead state
Column 1 = Level I Category 19 = Outer rf flat (1 is not a unit value)
Column 2 = Level II Category N = Level unused
Column 3 = Level III Category 25 = Shingle (2 is not a unit value)
Column 4 =Level IV Category N = Level unused
Column 5 = Level V Category 9 = 40 - 50%
Column 1 = Level I Category 19 = Outer rf flat (1 is not a unit value)
Column 2 = Level II Category N = Level unused
Column 3 = Level III Category 26 = Sand (2 is not a unit value)
Column 4 = Level IV Category N = Level unused
Column 5 = Level V Category 9 = 40 - 50%
Column 1 = Level I Category 19 = Outer rf flat (1 is not a unit value)
Column 2 = Level II Category N = Level unused
Column 3 = Level III Category 12 = Windward (1 is not a unit value)

0
M INIM MENNE MINER EMI= MEM 0
Date Time /Type
Cl) (1) 3 V CD
0
Data Recording Card Tide Reef
Notes
No.
Recorder Site
MIEN MINIM MIMI= MEIN
-17-
5. USE OF CLASSIFICATION SYSTEM WITH RECORDING CARD
Use of the classification system with a recording
card is illustrated in the following two examples. Example 4.5
illustrates the simplest of classifications, whilst example 4.10
shows the most complex. In the examples above, , and example 5.2
from this section, information on both proportional reef covers
and water depth is classified - the secondary structure of Level V is prominent.
Figure 2. Example of the data recording card.
Four samples for each site are able to be recorded on
each side of the card. The reverse of the card may have the site data deleted.

-18-
Example 5.1 The classification of features in Figure 3:
detect the features for classification
identify features for classification
analyse and delineate features
fill in applicable identifiers at top of recording
card:
DRC No
Date
Reef
Time/type :
Tide
Recorder
Site
1
1.8.83
Cairns
LAND SAT
N/A
DK
Broad zonation
classify the features using the classification system
and data recording cards from the handbook.
So, for the example in Figure 3, the procedure is as
follows:
MIRM MIME IBM= MEM MUM MEM
maw sumo= "ma mom ommio Immo=

-19-
Figure 3. Landsat MSS image of Cairns Reef, GBR.

-20-
Example 5.2
This example is based on the aerial photograph of
Green Island which makes up Figure 5.
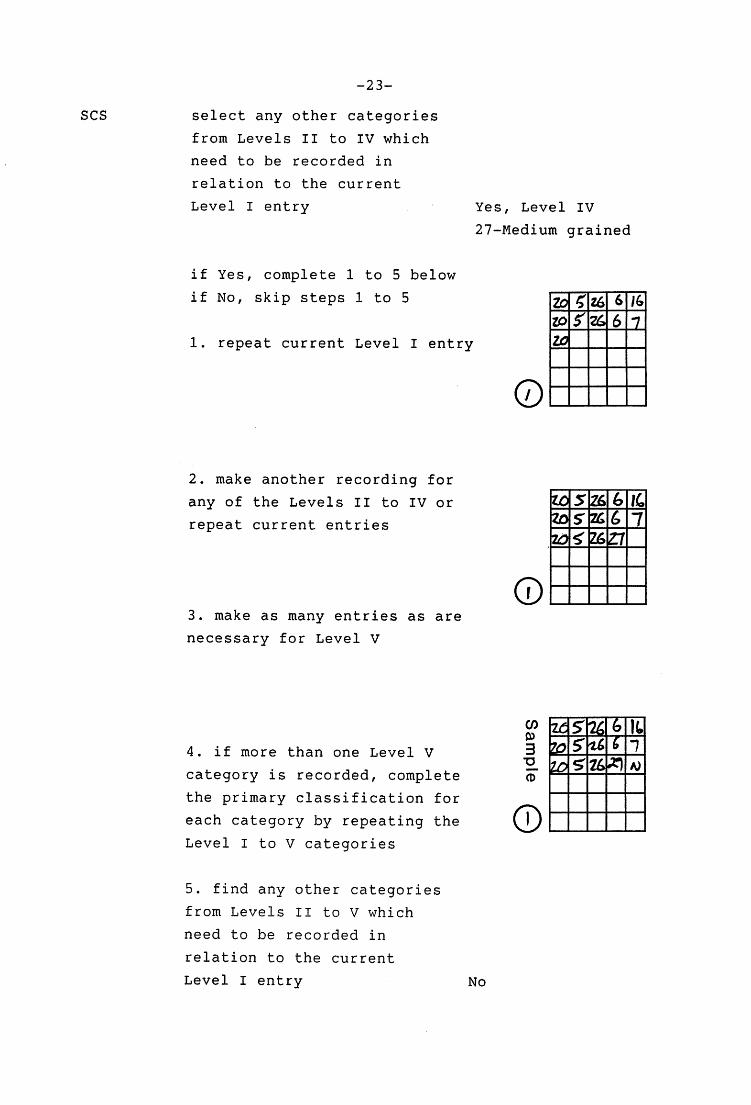
Figure 4. Flow-diagram illustrating the use of the classification
system with a recording card.
For this example, PCS = Primary categorising structure;
and SCS = Secondary categorising structure.
Instructions Use of
data recording card
START
record information at top of DRC No. : 1
data recording card Date : 4.4.83
Reef : Green Island
Time/type: Aerial photo
Tide :lm
Recorder : DK
Site : 1
record sample number in
circle at bottom left of
grid
CD
3
CD
MUM MI MBE= NMI MINIM M111111111 MINIM
actively survey sample site
for zonation and reef cover
go to Level I
read each entry
PCS select one entry 20-Inner reef flat

SCS scan Level III to determine
any other entries for use No
if Yes, MENTALLY note them
PCS record one entry from Level III
in third column of row one
-21-
record entry using its
numeric label in the
top left grid cell
a) 3
O SCS scan Level I to determine
any other entries for use Yes
if Yes, MENTALLY note them 26-Seagrass zone
go to Level II
read each entry
PCS select one entry 5-Slope
SCS scan Level II to determine
any other entries for use No
if Yes, MENTALLY note them
PCS record one entry from Level II
in second column of row one
go to Level III
read each entry
PCS select one entry 26-Sand

SCS record entries from Level V
in column five of row one cD
ZO 6 t6
-22-
go to Level IV
read each entry
PCS select one entry
SCS scan Level IV to determine
6-Gentle
any other entries for use Yes
if Yes, MENTALLY note them 27-Medium grained
if No, continue
PCS record one entry from Level IV
in column four of row one
go to Level V (T)
read each entry
SCS
select one or more entries 16-0.5 to 1.0 m
7-20 to 30%
PCS
if more than one Level V category
is recorded, complete the primary
classification structure for each
category by repeating the Level I
to IV categories in successive rows
go back to Level I entries
O
M©0 6E MOM& Fi NMI= OM=
MINIM
if Yes, complete 1 to 5 below
if No, skip steps 1 to 5
1. repeat current Level I entry
0
Eli 6 16 ZO BIM 6 MINN
OMEN
SCS
-23-
select any other categories
from Levels II to IV which
need to be recorded in
relation to the current
Level I entry Yes, Level IV
27-Medium grained
make another recording for
any of the Levels II to IV or
repeat current entries
make as many entries as are
necessary for Level V
IfisM e "ME
0 =MEM MIR=
if more than one Level V
category is recorded, complete
the primary classification for
each category by repeating the
Level I to V categories
find any other categories
from Levels II to V which
need to be recorded in
relation to the current
Level I entry No
3
CD
0

-24-
if Yes, return to step 1
if No, continue
go back to Level I categories
SCS select any other entries
to recall from memory for
Level I
Yes
26-Seagrass zone
if Yes, continue reiteration
process
if No, classification is complete
Reiteration process
record an entry from Level
I in column one of next row
available
mrial 4 re II MEM
FNIBEEEIN 6
EINEM 11111111111
II NMI
select entry from Level II
9-Coral head
SCS scan Level II for other
entries for use Yes
if Yes, MENTALLY note them 26-Sand patch
record the entry from Level
II in column two

3 -o
O
26
R,
-25-
SCS select one entry
from Level III 23-Coral
SCS scan Level III for other
entries for use No
if Yes, MENTALLY note them
record one entry for Level III
SCS select one entry
from Level IV 7-Live state
SCS scan Level IV for other
entries for use No
if Yes, MENTALLY note them
record one entry for Level IV
SCS select one or more entries
from Level V
14-90 to 100%
18-2 to 3 m
SCS record all entries
from Level V
PCS
if more than one Level V
category has been recorded,
repeat all previous entries
for Levels I to IV
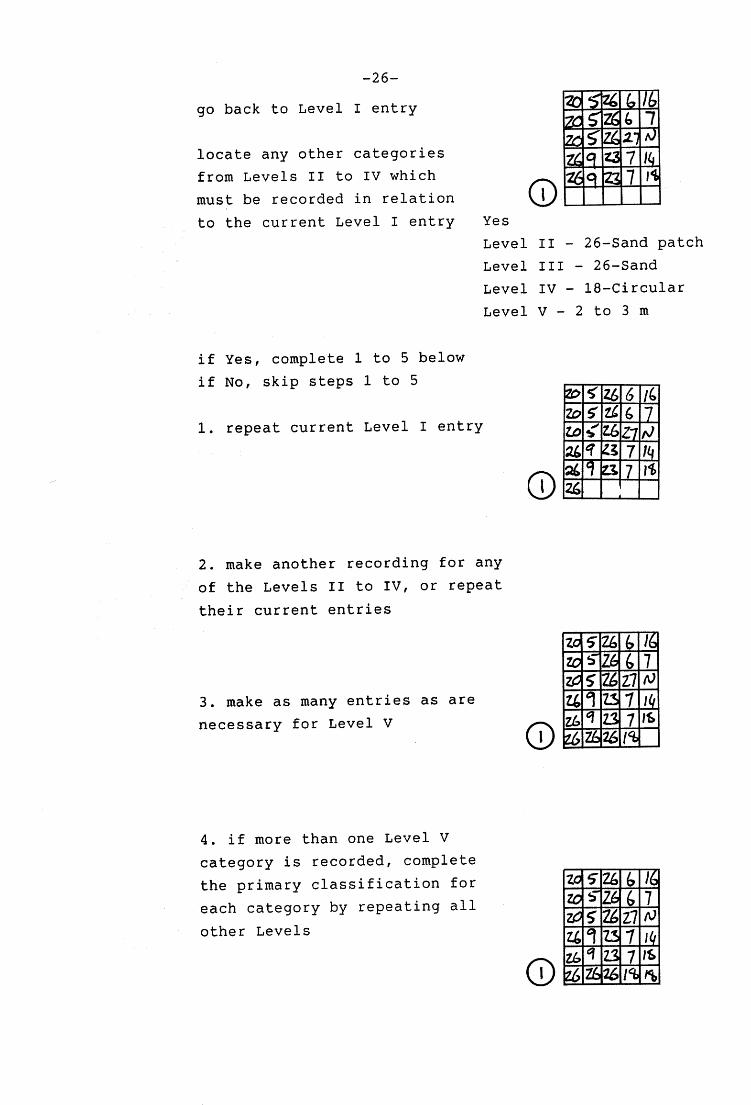
O Yes
Level II - 26-Sand patch
Level III - 26-Sand
Level IV - 18-Circular
Level V - 2 to 3 m
E113 26 MESS
El!1 PP
MOIREA
mE26rea
6 FE C NI
11)
MEM EEPs
3. make as many entries as are
necessary for Level V
0
E131 2.6 Maw
6 IL 6 II
EMIEFIIIM IT 1 MEM
mils zo ME 26TE rb 0
-26-
go back to Level I entry
locate any other categories
from Levels II to IV which
must be recorded in relation
to the current Level I entry
if Yes, complete 1 to 5 below
if No, skip steps 1 to 5
1. repeat current Level I entry
3114613/121 za BIM 6 i71 zoiz651/1 Eng 231Filill 24 UM is 2611111111111111
2. make another recording for any
of the Levels II to IV, or repeat
their current entries
4. if more than one Level V
category is recorded, complete
the primary classification for
each category by repeating all
other Levels

-27-
5. locate any other categories
from Levels II to V which must
be recorded in relation to the
current Level I entry Yes
Level III - 22-Seagrass
Level IV - 12-Patched Pn
Level V - 14-90%
- 19-3 to 4 m
if Yes, complete 1 to 5 below
if No, skip steps 1 to 5
1. repeat current
Level I entry
make another recording
for any of the Levels II to
IV, or repeat current entries
make one or more
recordings for Level V
if more than one Level V
category is recorded, complete
the primary classification for
each category by repeating the
Level I to IV categories,
locate any other categories
from Levels II to V which must
recorded in relation to the
current Level I entry No

-28-
if Yes, go back to step 1
if No, continue
go back to Level I categories
SCS
locate any other entries
to recall from memory for
Level I
No
if Yes, work through the reiteration process
if No, classification is complete
END
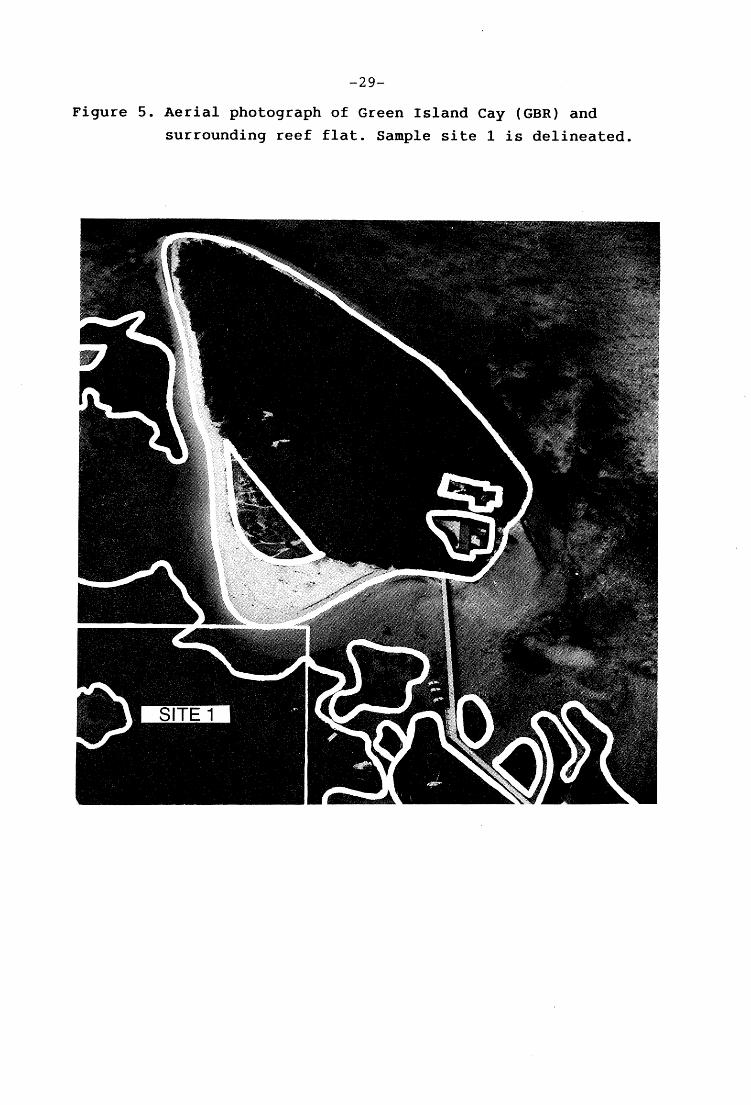
-29-
Figure 5. Aerial photograph of Green Island Cay (GBR) and
surrounding reef flat. Sample site 1 is delineated.

-30-
CONCLUSION
A user guide and handbook is now available for the
reef cover and zonation classification system which is designed
for use with remotely sensed Great Barrier Reef data. The guide
outlines how to use the classification system efficiently and easily.
ACKNOWLEDGEMENTS
The Great Barrier Reef Marine Park Authority is
acknowledged for its full financial support. Dr D.L.B. Jupp and
Dr P. Laut of CSIRO, Division of Water and Land Resources,
Canberra, kindly read the manuscript and offered constructive criticisms.
-31-
8. REFERENCES
Flood, P.G. 1977. Coral cays of the Capricorn and Bunker Groups,
Great Barrier Reef Province, Australia. Atoll Research
Bulletin, 195, 1-8. Hallum, C.R. 1972. On a model for optimal proportions estimates for
category mixtures. Proceedings of the Eighth International
Symposium on Remote Sensing of the Environment, Environmental
Research Institute of Michigan, II, 951-58.
Jupp,D.L.B.;Mayo, K.K.; Kuchler, D.A.; Heggen, S.J. and Kendall,
S.W. 1981a. Remote sensing by LANDSAT as support for
management of the Great Barrier Reef. Proceedings of the
Second Australasian Remote Sensing Conference, Canberra,
9.5.1-9.5.6. Jupp, D.L.B.; Mayo, K.K.; Kuchler, D.A.; Heggen, S.J. and Kendall,
S.W. 1981b. The BRIAN method for large area inventory and
monitoring. Proceedings of the Second Australasian Remote
Sensing Conference, Canberra, 6.5.1-6.5.4.
Jupp, D.L.B.; Mayo, K.K.; Kuchler, D.A.; Heggen, S.J.; Kendall,
S.W.; Haywood, M.J.; Ayling, T. and Radke B.M. 1985. A
LANDSAT based multidate information system for the Cairns
section of the Great Barrier Reef Marine Park. Report 2:
Interpretation of Landsat data by computer based
identification and labelling. CSIRO, Division of Water and
Land Resources Technical Memorandum. Canberra. Natural
Resources Series, Number 4.
Jupp, D.L.B.; Moore, S.J.; Mayo, K.K.; Heggen, S.J.; Kendall, S.W.
and Kuchler, D.A. 1982. A LANDSAT based multidate information
system for the Cairns section of the Great Barrier Reef
Marine Park. Report 1: Preface, image base and index system.
CSIRO, Division of Water and Land Resources Technical
Memorandum, Canberra, TM 82/16.
Kuchler, D.A. 1986a. Reef cover and zonation classification system
for use with remotely sensed Great Barrier Reef data. Great
Barrier Reef Marine Park Authority Technical Memorandum.
Great Barrier Reef Marine Park Authority, Townsville, TM-7.
Kuchler, D.A. 1986b. Geomorphological nomenclature: reef cover and
zonation, Great Barrier Reef, Australia. Great Barrier Reef
Marine Park Authority Technical Memorandum. Great Barrier
Reef Marine Park Authority, Townsville, TM-8.
Kuchler D.A. 1984. Geomorphological separability: Landsat MSS and
aerial photographic data, Heron Island Reef, Great Barrier

-32-
Reef, Australia. Unpublished PhD thesis, James Cook
University of North Queensland, Townsville.
Maxwell, W.G.H. 1968. Atlas of the Great Barrier Reef. Amsterdam,
Elsevier.
Ryerson, R.A. and Gierman, D.M. 1975. A remote sensing compatible
land use activity classification. Proceedings of the Canadian
Association of Geographers Annual Meeting. Vancouver, 1-17.
Stoddart, D.R. 1969. Ecology and morphology of recent coral reefs.
Biological Review, 44, 433-498.
Stoddart, D.R. 1978. Mapping reefs and islands, in D.R. Stoddart and
R.E. Johannes (Eds.), Coral Reef Research Methods. Paris,
UNESCO, 17-22.
Stoddart, D.R.; McLean, R.F. and Hopley, D. 1978. Geomorphology of
reef islands, northern Great Barrier Reef. Philosophical
Transactions of the Royal Society of London B, 284, 39-61.

!AO