Reduction of Greenhouse gases - AGNagnatural.pt/documentos/ver/reduction-of-greenhouse...2009 –...
97
-
Upload
truongxuyen -
Category
Documents
-
view
219 -
download
5
Transcript of Reduction of Greenhouse gases - AGNagnatural.pt/documentos/ver/reduction-of-greenhouse...2009 –...


2009 – 2012 Triennium Work Report
June 2012
Reduction of Greenhouse gases - A Technology Guide
Produced by:
PROGRAM COMMITTEE A: SUSTAINABILITY
International Gas Union
Chair: Juan Puertas, Spain

This publication is produced under the auspices of the INTERNATIONAL GAS UNION (IGU) which holds the copyright. This publication may not be reproduced in whole or in part without the written permission of the IGU. However, irrespective of the above, established journals and periodicals shall be permitted to reproduce this publication, or part of it, abbreviated or edited form, provided that credit is given to IGU. This document contains strictly technical information to be distributed during the 25th World Gas Conference in Kuala Lumpur, Malaysia, and has no commercial intent.

Table of Contents
Forward and Acknowledgements i
Abstract iii
Executive Summary iv
Chapter 1 The Role of Natural Gas in Energy Security and Climate Change
Part 1 Natural Gas in Energy and Climate Policy Perspective 1
Part 2 Natural Gas Reports 14
Chapter 2 Life-Cycle CO2 Emissions in the Conventional Natural Gas Supply Chain and the Impact of CH4 Leakage Associated with the Natural Gas Industry
Introduction 27
Managing Methane: Building Block of Natural Gas and Potent Greenhouse Gas 29
Overview of Natural Gas Supply Chain 31
Chapter 3 BEST PRACTICES AND TECHNOLOGIES OF GREENHOUSE GAS EMISSIONS REDUCTION: Exploration, Production and Storage
Introduction to Greenhouse Gas Emissions from Exploration, Production and Storage 37
Major Sources of Methane Emissions and Emission Reduction Technologies 40
Chapter 4 BEST PRACTICES AND TECHNOLOGIES OF GREENHOUSE GAS EMISSIONS REDUCTION: Pipeline Transmission System, LNG and Distribution Networks 45
Chapter 5 BEST PRACTICES AND TECHNOLOGIES OF GREENHOUSE GAS EMISSIONS REDUCTION: Utilisation 62

i
Foreword and Acknowledgements
This report is intended as a reference to various GHG reduction technologies along the natural gas supply chain.
During the 2003 – 2006 Netherlands Triennium, the International Gas Union (IGU) reported on the environmental superiority of natural gas during combustion and over the entire lifecycle. This was based on a study done by the World Energy Council.
Prevention of methane leaks was examined in the Methane to Market Partnership (now called the Global Methane Initiative). This multilateral effort clarified the major technologies used and their economic effectiveness. Most of the technologies described are economically viable and sound, in terms of health, safety, and the environment. The paper about this received an award during the last Argentine Triennium.
In the current Malaysian Triennium, IGU is putting together the guides based on IGU and US EPA work. These consist of best practices for technology to reduce emissions of the major greenhouse gases CO2 and CH4 at generation and leakage points throughout the supply chain. Best practices during utilization of gas are also described, since the greatest quantities of CO2 are emitted during combustion.
Natural gas is seen by many as a bridge to a low-carbon future, however some argue that it is not so environmentally friendly, pointing to methane leakage at the well head or pipeline or to it being a fossil fuel that will hurt investments in renewable energy and create a “lock in effect”. But the natural gas system has practical and proven technologies for prevention of methane leaks and energy efficiency.
Greater use of natural gas, applying these technologies, can provide realistic solutions to the challenges of energy security and climate change. But the gas industry must promote best-practice technologies. It is important for government to provide supportive policies and measures to promote greater use of natural gas and best practices.
We hope that this guide can be a resource for policy makers to understand the gas industry’s perspective on reducing greenhouse gas emissions and that it will inspire discussions leading to practical policies and measures for energy security and climate change.
I am heartily thankful to all colleagues of Study Group 3, PGC-A for their hard work.
Special thanks to United States Environmental Protection Agency for generously offering us to use their valuable data and information developed through their Natural Gas STAR Program. Most of the methane leakage prevention technologies included in this guide is indebted to the work of the agency.
Yoshitaka Ojiro, David Wiesner, Masami Kobayashi and Phil Li provided us their expertise and professional advice all through our work. (Members do not necessarily endorse all of its findings and recommendations, either individually or collectively.)
Study Group 3 had all the support and encouragement from Juan Puetas (Chairman, PGC-A), Naiara Ortiz de Mendíbil Romo (Secretary, PGC-A), HO Sook Wah (Chairman, Coordination Committee) and UNGKU Ainon (Secretary, Coordination Committee).
This study also benefited from comments and suggestions from American Gas Association, Thierry Lefevre (CEERD), Vichien Tantiwisarn (Ministry of Energy, Thailand), and Abdul Salam (Asian Institute of Technology).
ii
Lastly, I offer my regards and blessings to all of those who contributed in any respect during the completion of this guide. Satoshi Yoshida Study Group 3 leader & Vice Chair, PGC-A Tokyo Gas Company Core Contributors;
Carey Bylin, Environmental Protection Agency, USA
Konstantin Romanov, Gazprom, Russia
Mostafa Kashkooli, National Iranian Gas Company, Iran
Jürgen Vorgang, Open Grid Europe, Germany
Yuichiro Yamaguchi, Osaka Gas, Japan
Pavarate Rattanasuwan, PTT, Thailand
Toungmon Chalermchavalit, PTT, Thailand
Daniele Fontanelli, Snam Rete Gas, Italy
Rachid Bessaoud, Sonatrach, Algeria
Hideo Kawaguchi, Toho Gas, Japan
Masao Takekawa, Tokyo Gas, Japan
Fernando Estebaranz, Union Fenosa Gas, Spain
Contributors;
Elena Kosolapova, Gazprom VNIIGAZ LLC, Russia
Gretta Akopova, Gazprom VNIIGAZ LLC, Russia
Grigory Yulkin, Gazprom VNIIGAZ LLC, Russia

iii
Abstract
The objective of this guide is to be a resource to policy makers, to better understand the gas industry’s perspectives about energy policy and to bring to the fore promising technologies responding to climate change through best practices. Understanding of current trends for fuel diversity is more critical from now on for policy makers, in order to develop effective and practical policy directions for reducing greenhouse gases.
First, an overview of the advantages and disadvantages of different types of fuel sources for primary energy and power generation is given. The superiority of gas as an environmentally friendly energy source is shown, although it is not perfect. Then, recent major publications and reports by various institutions promoting or opposing greater use of natural gas are summarized.
Natural gas, including shale gas, is garnering increased interest. To better understand these issues, a discussion is given of the issues regarding the entire gas supply chain. The results of a recent life-cycle assessment by Eurogas-Marcogaz are introduced. The final chapters introduce best practices for various GHG reduction technologies used throughout the gas supply chain.
Note: The descriptions in this guide do not detail the meaning of certain terms in countries. For instance, the definitions for transmission and distribution in the supply chain are different in various countries with their differing regulations.

iv
Executive Summary Natural gas is in the spotlight as a form of primary energy, due to being a simple, inexpensive solution for energy security and climate change. This has resulted in the publication of many analyses of the potential of natural gas from a variety of organizations.
Chapter 1 begins with an overview of the advantages and disadvantages of the major sources of primary energy: renewable energy, nuclear energy, oil, coal and natural gas. It then briefly summarizes 18 reports analyzing natural gas. There are benefits and drawbacks to every source of primary energy, but natural gas has relatively few drawbacks overall. Not every analysis accepts the “Golden Age of Natural Gas” scenario, but few deny its importance as primary energy.
Natural gas combustion creates the lowest burden to the environment of all the fossil fuels, in terms of CO2 emissions. This is due to the chemical makeup of its major component, methane. But some analyses have pointed to leakage of “substantial amount of methane,” which has a powerful greenhouse effect, during transport from upstream to end consumers. These analyses conclude that natural gas is not the most environmentally friendly fossil fuel in terms of life-cycle assessment (LCA).
Chapter 2 discusses a European case study showing that methane leakage during transport is not a major source of GHG emissions, although some uncertainties remain. The case study examines emissions from the perspective of LCA and provides an overview of fugitive emissions and methane leakage points. LCA shows that CO2 emissions at the point of use create most of the greenhouse gases (GHG). The concluding remark to the industry is that it should continue to reduce CO2 emissions at the time of consumption and to strive for energy efficiency in the supply chain and prevention of methane leaks.
Chapters 3 and 4 discuss best-practice technologies for GHG reduction that can be applied at points in the natural gas chain where emissions are produced and where methane leakage occurs. Chapter 3 discusses the upstream segment (exploration, extraction and storage) and Chapter 4 covers transmission, the LNG chain and distribution. Many of these technologies are the result of years of effort and they owe their genesis to the multilateral Global Methane Initiative.
Chapter 5 covers best-practices for energy conservation technologies to reduce CO2 emissions at the time of usage, including combined heat and power (CHP). It shows that utilizing more of these technologies more effectively can lead to reduction of GHG while increasing demand for natural gas. Natural gas systems show a comparative advantage in energy use, which can contribute to realizing sustainable growth for industry.
The future will bring increases in energy demand while energy resources become increasingly scarce, adding to the urgency for governments worldwide to implement conservation policies. The various energy conservation technologies can provide answers and solutions. But for energy conservation and methane reduction technologies to be widely implemented, it is important and necessary to have supportive policies at both the national and local levels.

1
Chapter 1 The Role of Natural Gas in Energy Security and Climate Change
Part 1 Natural Gas in Energy and Climate policy perspective
Natural gas has gained prominence in the public discourse on clean energy and energy security. Natural gas emits half as much carbon dioxide as coal and is free of particulates and toxic heavy metals. Its versatility has made it a crucial component of energy use, from central generation to distributed heating. In North America, proved natural gas reserves have grown 20% the last five years, largely due to advances in shale gas extraction techniques. Asia-Pacific reserves increased 39% in the same period, led by Chinese and Australian discoveries.1
Countries with limited domestic resources are also shifting towards gas generation, with cross-border shipments up 30% in the last five years. Liquefied Natural Gas (LNG) now accounts for 28% of this trade, including 89% of gas destined for Asia-Pacific countries2. Natural gas has the reserves, scale, characteristics, applications, and market maturity to play a major role in tackling global energy challenges. It can help the world transition to cleaner and more secure energy now, and help integrate new carbon-free sources as they develop and arrive on the grid.
Characteristics of Energy Sources
Energy is the basis of economic development, the backbone of modern life. The rise of developing nations will place unprecedented demands on our energy system, as wealth undeniably parallels energy consumption.3
Figure 1.1 Annual per capita electricity use of world countries
1 US Department of Energy, Energy Information Administration (US EIA), 2010 2 BP Statistical Review of World Energy (BP Report), 2005 and 2010. 3 Lawrence Livermore National Laboratory, “Global Energy Futures and Human Development: A Framework for
Analysis,” Alan D. Pasternak, October 2000.

2
Faced with this challenge, policymakers must look beyond everyday political discourse to serve the long-term public interest. There is no silver bullet for meeting global energy needs; energy policy requires tradeoffs and nuanced planning. This chapter surveys the reserves, production, impact, and trends of dominant energy options today. Our energy systems represent over a century of investment in basic infrastructure; their transformation will take time. Through realistic evaluation, policymakers can create a diversified resource portfolio that balances possibilities and limitations of resources at hand.
Table 1.1 Production, reserves and consumption of primary energy by region
Production, Reserves, & Consumption of Primary Energy by Region
Energy in Millions of Oil or Oil Equivalent (Mtoe)
2009 Production Reserves Consumption Non-Fossil Energy
(Mtoe) Oil Coal Gas Oil Coal Gas Oil Coal Gas Hydro Nuclear Other
Asia-Pacific 383 2213 395 14 59 37 1206 2152 447 217 125 37
North America 629 578 739 15 235 11 1025 531 737 158 213 55
Europe & CIS 855 420 876 21 236 65 914 456 953 182 265 62
Middle East 1156 1 366 85 >500 >100 336 9 311 2 0 0
Latin America 339 53 136 81 181 53 256 22 121 158 5 16
Africa 459 143 183 36 >500 72 144 107 85 22 3 1
Total World 3821 3409 2696 46 119 63 3882 3278 2653 740 611 164
2009 Production Reserves Consumption Non-Fossil Energy
(Mtoe) Oil Coal Gas Oil Coal Gas Oil Coal Gas Hydro Nuclear Other
OCED 860 977 1022 14 174 14 2073 1036 1302 299 507 116
non-OCED 2960 2432 1674 55 97 92 1809 2242 1351 441 103 48 *OECD members are generally regarded as developed economies ^ Total proven reserves at the end of 2009 divided by total production in 2009 Capacity Factor assumptions for "Other Non-Fossil Energy", 20%-25% solar, 30% wind, 90% geothermal
Renewable energy
Renewable energy is the most visible face in the struggle against climate change, and is promoted by governments around the world. Hydro constitutes 6.5% of world primary energy, while other renewables together account for about 1.5%.4 Renewables can be categorized into biofuels, baseload generation, and variable generation.
Biofuels – Brazil and the US produce 86% of the world's supply, spurred by ethanol blending requirements for their general gasoline supplies. Feedstock cultivation, fermentation, and transport require significant fossil energy inputs. By displacing petroleum, current biofuels reduce greenhouse gas (GHG) emissions by only about 13%.5 Biofuels compete with food production for arable land and water, and are implicated in the rise in grain prices in 2007-2008. Even if the US diverted its entire grain harvest to produce ethanol, that would only supply 16% of current demand.6
Baseload Generation – hydro, biomass, geothermal
Hydroelectric, biomass, and geothermal generation are favoured by utilities for high capacity factors and baseload characteristics, meaning they tend to run at near peak and around the clock. These resources are also relatively low cost, but more constrained geographically and
4 BP Report, 2010. US EIA, “Primary Energy Consumption by Source,” 2006. 5 Science, Daniel M. Kammen, et al, “Ethanol Can Contribute to Energy and Environmental Goals” January 2006. 6 Lester R. Brown, Testimony before U.S. Senate Committee on Environment and Public Works, 2007-06-13.

3
increasingly “tapped out.” In the last five years, hydro has essentially stopped growing in the developed world. Of the 25 top energy consuming nations, only the US and Indonesia experienced meaningful geothermal growth in the last five years.
Table 1.2 Annualized growth and percentage share for most-prevalent forms of renewable energy
2009 Annualized Growth (over last 5 yr) Share of Renewables Hydro Geotherm. Wind Solar Hydro Geotherm. Wind Solar
OCED 1% 4% 22% 49% 76% 3% 18% 3% non-OCED 5% 3% 54% 13% 93% 1% 5% 0% Overall 3% 4% 27% 43% 85% 2% 11% 1%
Source: BP Statistical Review of World Energy, 2010 Report Capacity Factor assumptions: 20%-25% solar, 30% wind, 90% geothermal
Variable Generation – Wind and Solar
Wind and solar generation are extremely flexible to deploy; their resources are less geographically restrained by baseload renewables, and can be distributed at a household level or serve as central generation in energy parks. Their sustained growth, 27% and 43% per year respectively over the last five years, has spurred product development and dramatic price declines.
However, wind and solar are still among the most expensive forms of energy, and remain at the mercy of shifting subsidy policies around the world. As such, these industries often swing back and forth between supply and demand constraints, as shown by the effect of the expiration of tax credits on US wind development in 2000, 2002, and 20047(Figure 1.2).
Such uncertainties increase the cost and risk of project development and financing, and ripple through the global supply chains serving these industries.
Siting & Transmission Challenges
Because wind and ground-mounted solar have lower energy density than fossil fuel facilities, they occupy more land and can be challenging to site, especially in countries with local or consensus-driven land-use planning. Decision makers often have limited experience relevant to these decisions, and few precedents or analytical frameworks to consider. Many projects are delayed, modified or not permitted due to concerns over impact on ecosystems and threatened species.
Utility-scale solar thermal and solar PV installations are often sited in deserts where habitats for endangered species can be disrupted. Locations ideal for wind turbines are frequently in critical habitat or migratory bird stopover areas such as the over 3,000 Waterfowl Production Areas managed by the US Fish and Wildlife Service, which has acquired over 25,000 wetland easements8. All of these are subject to wind turbine siting restrictions. But wind farms are also being challenged on grounds that they lower the property values of adjacent land and cause medical problems for people in the area.
7 American Wind Energy Association, 2007 8 http://library.fws.gov/Pubs9/NWRS_waterfowl01.pdf
Figure 1.2

4
Because of large space requirements, projects are often proposed in remote areas with insufficient transmission assets. New transmission adds cost, and can be more difficult to permit than the projects themselves.
Grid Integration Challenges
Wind and solar are delivered as available to the grid. They exhibit variable output, with potentially significant sub-hourly swings. The left graph of Figure 1.3 is an overlay of 31 daily output curves from a sample wind installation. The right graph shows the output from a solar installation on a day with many transient clouds.
Figure 1.3 Examples of variations in daily output of wind and solar power
A Responsive Grid
Studies have simulated the effects of increased presence of variable generation on the operation of the Western US9, Eastern US10, Oahu11, and European12 grids. Based on their models, high levels of wind and solar (as much as 35%) can be accepted without storage or significantly higher spinning reserves, but only after substantial investments in a more responsive grid. This includes more precise forecasting and scheduling, new transmission such as HVDC lines, demand side management (DSM), and more responsive fossil generation.
To pave a future with high levels of renewable energy, planners need encourage a transition from baseload-only sources such as coal and nuclear towards more operationally flexible assets such as gas and hydro. This will give the grid flexibility to respond to increasing amounts of variable generation.
Nuclear
World nuclear power production is currently four times that of all non-hydro renewables combined. The United States, France and Japan have the greatest nuclear capacity,
9US Dept of Energy, National Renewable Energy Laboratories (US NREL), “Western Wind and Solar Integration
Study.” 10 US NREL, “Eastern Wind Integration and Transmission Study.” 11 US NREL, “Oahu Wind Integration and Transmission Study.” 12 European Transmission System Operators for Electricity (ENTSO-E), “European Wind Integration Study.”
5
together generating over half of the world’s nuclear power13, even after the considerable reduction in output from Japan after the Fukushima accident.
Other than in France, nuclear power development has been frozen in the Western world since the Three Mile Island incident in 1979 and Chernobyl in 1986. 14 New nuclear build is currently greatest in Asia and Eastern Europe with China and Russia leading the way.
Because nuclear power can be scaled up to a greater degree than any other form of carbon-free power, concern over greenhouse gas emissions had rekindled interest in the nuclear option, popularly dubbed the “nuclear renaissance.” The public seemed more willing to accept nuclear power before Fukushima. In the last five years, 30 new reactor applications have been under review in the United States, although none of these have begun construction so far. 15
Yet, even with the support of a federal loan guarantee program, the “nuclear renaissance” did not materialize. The last plant placed online in the US was commissioned in 1993. In October 2010, Constellation Energy abandoned its Calvert Cliffs III project despite a $7.5 billion loan guarantee, saying that the loan guarantee terms were "unworkable”.16 This was a blow to the fledgling movement. However, the recent approval by the NRC of a Westinghouse design gives the green light for construction of four new power plants in the United States.17
The one European nuclear project is underway in Olkiluoto, Finland. After Fukushima the intent is still to complete it, although it was already years behind schedule and the owner has sued the French construction contractor Areva.
The Fukushima nuclear power plant accident has added further complexity to an already difficult situation for nuclear build. Loss of control of the reactors led to fuel meltdown. This incident demonstrated the vulnerability of a society dependent upon nuclear power. This momentous event has challenged society to thoroughly review the use of nuclear energy.
In the post-Fukushima era, careful scrutiny must be given to at least five major concerns. Security, nuclear proliferation, peak uranium and the difficult problem of radioactive waste disposal were prior concerns, with disposal now taking on new urgency.
However, assessments of the environmental impact and cost of nuclear power have dramatically shifted. It is now recognized that one accident could destroy farming, livestock raising and fishing in the surrounding area. It could bring devastation to the overall environment and threaten the security of regional food and water supplies for a long period. As a result, the life-cycle cost of nuclear power is being re-evaluated with new emphasis on the risk of accidents. The potential for huge compensation costs after an accident has changed the perception of nuclear from low-cost to high-cost power.
Major concerns:
•Security – Distributed infrastructure in populated places can be impractical to secure. For years after 9/11, the US ordered commercial pilots not to fly near nuclear plants. But the government then refused to give the pilots a map locating these plants, fearing it would end up in terrorist hands. 18
•Nuclear proliferation – 31 countries operate nuclear power stations today. The IAEA is tasked with monitoring civilian nuclear facilities for signs of weapon-making (such as uranium 13 BP Report 2010 14 International Atomic Energy Agency (IAEA) list: United States of America: Nuclear Power Reactors - By Status 15 US Nuclear Regulatory Commission. 16 “Constellation Energy shelves plan for Calvert Cliffs reactor”, Washington Post, October 13, 2010 17 Approval of Reactor Design Clears Path for New Plants, http://www.nytimes.com/2011/12/23/business/energy-
environment/nrc-clears-way-for-new-nuclear-plant-construction.html 18 “Information Incognito: In War on Terror, U.S. Tries to Make Public Data Secret; The Almanac Under Wraps?”
Wall Street Journal, March 2005.

6
enrichment or plutonium extraction), but not all countries welcome continued scrutiny. Also, the post-9/11 era has raised the spectre of terrorists undermining plant safety or stealing materials for nefarious purposes.
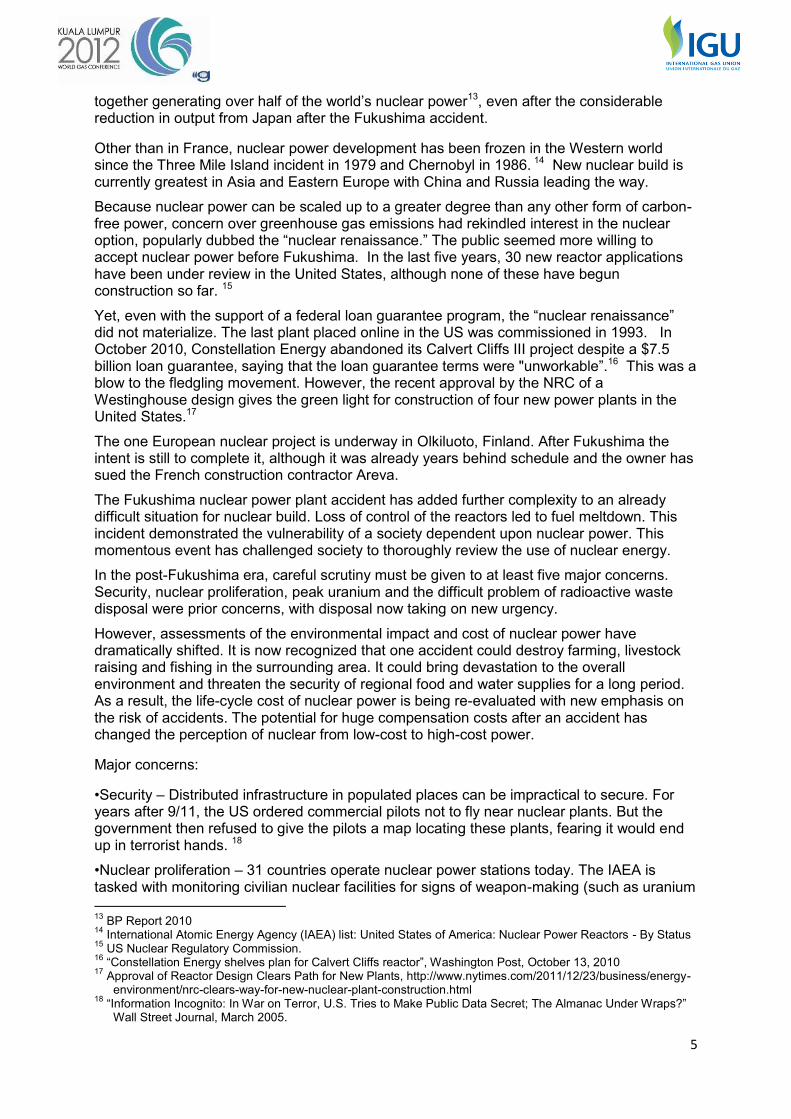
•“Peak Uranium” – Due to the low number of new reactors in past decades, uranium production has also atrophied from underinvestment. Consumption by reactors has outstripped uranium production since the late 80s; current production supports only 65% of consumption.19 Instead, reactors depend on government and commercial inventories, which are near depletion. The US is nearing the end of the 20-year “Megatons to Megawatts” deal, which supplies half of its nuclear fuel needs with materials converted from dismantled Soviet warheads. Together with the expectation of new reactors, normally stable uranium spot prices surged from a low of $7/lb in 2001 to $137/lb in 2007 before dropping to a low of $40/lb and more recently $53/lb. (Figure 1.4) 20
•Radioactive waste disposal – Despite decades of efforts, no nation has managed to build a secure permanent storage site for radioactive waste. The US stores thousands of tons of waste at reactor sites across hundreds of communities. Countries that reprocess their waste often have to ship it round-trip across oceans to do so, since few relevant facilities exist and none will keep foreign waste.
•Cost – Immense cost overruns plagued many proposed projects in the 1970s and 1980s, and continue to threaten projects today. For example, the price tag of the Finnish Olkiluoto project discussed earlier has gone up by 50 percent. At the same time, natural gas prices have fallen. The CEO of Exelon stated that “at today's gas prices you can't build a new nuclear plant in a competitive marketplace." 21
19 MIT News, Lack of fuel may limit U.S. nuclear power expansion, March 21, 2007. 20 Ux Consulting Company. Yellowcake (U3O8) prices. 21 Exelon deal won't revive Calvert Cliffs project” Baltimore Sun, April 29, 2011,
http://weblogs.baltimoresun.com/business/hancock/blog/2011/04/exec_exelon_deal_wont_revive_c.html
Figure 1.4 Uranium prices

7
Oil
Oil is the world's most used fuel, representing over one-third of primary energy consumed in 2009. 22 Oil dominates transportation, where its energy, power density and liquid form are valued. However, it largely retreated from electric generation after the supply shock of 1979, reflecting a need to prioritize the resource for uses with no practical alternatives.
Fears of oil depletion have shaped geopolitics since the United States, then the largest producer, reached its peak oil production in 1970. By 2005, 33 of the 48 largest oil producers had passed peak production, as had the developed world as a whole.23 The Executive Summary of WEO 2010 says "Crude oil output reaches an undulating plateau of around 68-69 mb/d by 2020, but never regains its all-time peak of 70 mb/d reached in 2006, while production of natural gas liquids (NGL) and unconventional oil grows quickly."
Today, 20 of the top 25 energy consumers depend on imports of oil to run their economies.24 Gasoline-powered vehicles are perhaps the most visible use of oil, for which commercial alternatives now exist in the form of electric and compressed natural gas (CNG) vehicles. However, oil serves other roles which are irreplaceable in commerce today, from powering jet engines to making plastics and solvents.
The World Economic Outlook (WEO), "Oil Scarcity, Growth, and Global Imbalances" points out that gradual oil scarcity as currently seen may have small impact, but "… the risks [oil scarcity] poses should not be underestimated, either. Much will ultimately depend on the extent and evolution of oil scarcity, which remain highly uncertain. There is a potential for abrupt shifts, which would have much larger effects…"
22 BP Report, 2010. 23 WorldWatch Institute (2005-01-01), State of the World 2005: Redefining Global Security. New York: Norton. p.
107. 24 BP Report, 2010.
Figure 1.5

8
Few doubt that global oil production will peak and decline at some point, but opinions differ on timing. Some claim oil will peak after 2020, while others say the peak has already occurred.25 Based on the experience of identifying national peaks, the global peak may only be obvious in retrospect. And it suggests that the cost will increase accordingly.
Oil reserve life has increased steadily in the last thirty years, making acute global production shortfalls seem unlikely in the immediate future. However, the supply mix is becoming increasingly risky and costly to exploit. The BP Deepwater Horizon disaster in 2010 highlighted the risks involved in the settings where exploration and production commonly occur.
Also, unconventional oil, such as tar sands, extra-heavy crude, and gas-to-liquids, are widely expected to constitute an increasing proportion of supply.26 They each bring on a new set of supply-related challenges, for instance, higher technology translated to higher depletion rate or production declines. For capacity growth, as the latest World Economic Outlook (p55, 56) from the IMF points out, there are other issues such as slowing investment and geological constraints, to name a few.
The rise of the car-owning class in China and India makes dramatic increases in demand for oil appear inevitable. However, fuel efficient technologies can counteract this trend. Also, electrification and CNG can reduce worries about dependence on oil imports. Lastly, urban planning and public transportation play a role in boosting society’s energy efficiency.
Coal
Coal has played a primary role in electric generation ever since Thomas Edison built the first central power station in 1882. Unlike oil, coal will likely remain abundant on all continents for many decades to come. China, the US and India dominate world coal consumption, accounting for 47%, 15% and 7% respectively.27 Coal generates the majority of electricity in each of those countries.
25 http://www.theoildrum.com 26 International Energy Agency, World Energy Outlook, 2010. 27 BP Report, 2010.
Figure 1.6 Forecasts of world oil production

9
Coal plants are currently seen as un-financeable in the US, where tighter emission standards are anticipated. While over 10GW of coal was brought online in 2009-10, no new projects broke ground. Instead, power producers dropped plans for 38 new plants and decided to retire 48 aging ones.28
On the other hand, coal is drastically expanding in India and China. India has favoured “Ultra Mega Power Plants” to ease energy shortages, each 4GW or more.29
China currently brings online about one plant per week.30 However, this may change in the future. The Exxon 2012 Energy Outlook states that a tapering-off of China‘s population growth rate after 2030 will lend to the slowing in demand for coal-fired resources.31 In addition, recent discoveries of shale gas in China could increase the proportion of natural gas used for Chinese energy needs and decrease the use of coal.32
Environmental Impacts
Unfortunately, coal also has the highest environmental cost of all major fuel sources, with far-reaching effects on climate change and the safety of air, water, and food resources.
First, coal-fired generation is the largest contributor to GHG and acid-rain pollution, releasing twice the carbon dioxide of gas-fired generation, and three times that of biomass.
28 Washington Post, Steven Mufson, “Coal's burnout,” January 2, 2011. 29 http://dotearth.blogs.nytimes.com/2008/04/09/money-for-indias-ultra-mega-coal-plants-approved/ 30 MIT: the Future of Coal Report, 2007. 31 http://www.exxonmobil.com/Corporate/energy_outlook.aspx 32 China‘s shale gas boom could surpass U.S. – Sinopec. Reuters, Dec. 7, 2011,
http://www.reuters.com/article/2011/12/07/china-shale-sinopec-idUSL5E7N705Y20111207
Source: US Dept of Energy, NETL, Jan 2010.
Figure 1.7 New Coal Generation Build Rate (China & US)
Table 1.3 Environmental impacts of fuel sources
US Average NOx SO2 CO2
Coal 3.6 10 2138.1
Natural Gas 0.7 0.2 1176
Oil 2.1 5 1175.6
Biomass/other 3.9 1.9 722.7 Source: United States EPA, EGRID 2007
10
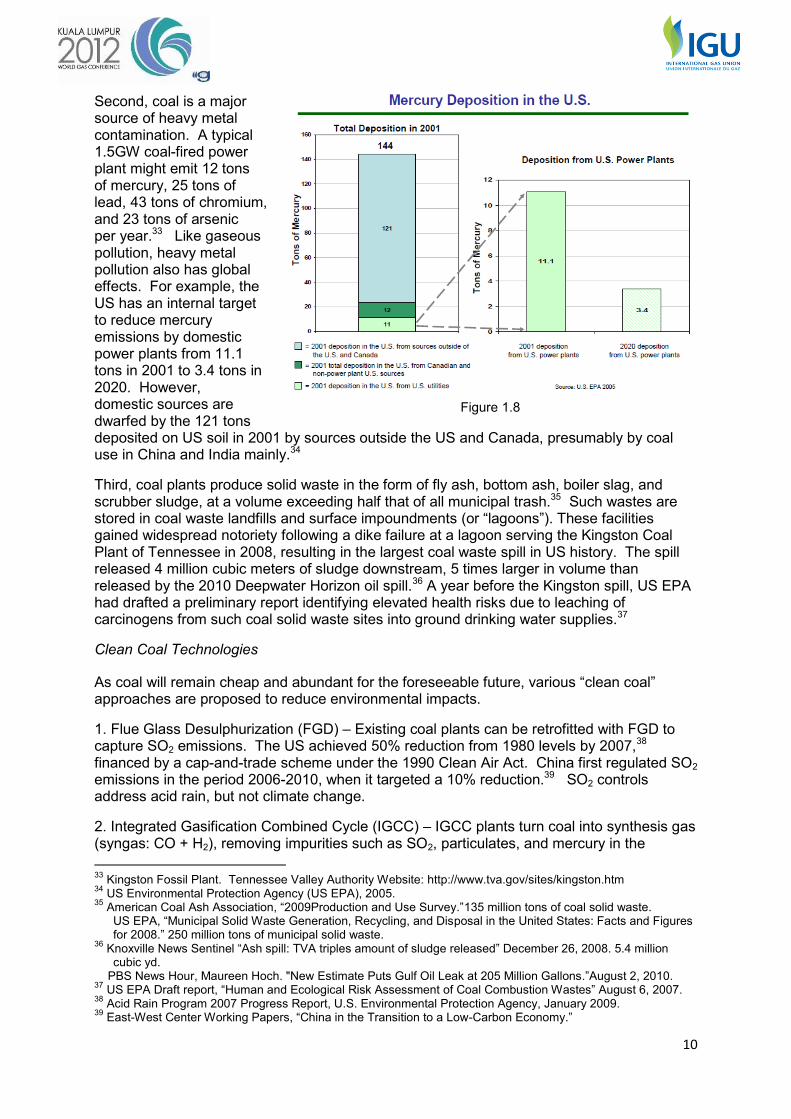
Second, coal is a major source of heavy metal contamination. A typical 1.5GW coal-fired power plant might emit 12 tons of mercury, 25 tons of lead, 43 tons of chromium, and 23 tons of arsenic per year.33 Like gaseous pollution, heavy metal pollution also has global effects. For example, the US has an internal target to reduce mercury emissions by domestic power plants from 11.1 tons in 2001 to 3.4 tons in 2020. However, domestic sources are dwarfed by the 121 tons deposited on US soil in 2001 by sources outside the US and Canada, presumably by coal use in China and India mainly.34
Third, coal plants produce solid waste in the form of fly ash, bottom ash, boiler slag, and scrubber sludge, at a volume exceeding half that of all municipal trash.35 Such wastes are stored in coal waste landfills and surface impoundments (or “lagoons”). These facilities gained widespread notoriety following a dike failure at a lagoon serving the Kingston Coal Plant of Tennessee in 2008, resulting in the largest coal waste spill in US history. The spill released 4 million cubic meters of sludge downstream, 5 times larger in volume than released by the 2010 Deepwater Horizon oil spill.36 A year before the Kingston spill, US EPA had drafted a preliminary report identifying elevated health risks due to leaching of carcinogens from such coal solid waste sites into ground drinking water supplies.37
Clean Coal Technologies
As coal will remain cheap and abundant for the foreseeable future, various “clean coal” approaches are proposed to reduce environmental impacts.
1. Flue Glass Desulphurization (FGD) – Existing coal plants can be retrofitted with FGD to capture SO2 emissions. The US achieved 50% reduction from 1980 levels by 2007,38 financed by a cap-and-trade scheme under the 1990 Clean Air Act. China first regulated SO2 emissions in the period 2006-2010, when it targeted a 10% reduction.39 SO2 controls address acid rain, but not climate change.
2. Integrated Gasification Combined Cycle (IGCC) – IGCC plants turn coal into synthesis gas (syngas: CO + H2), removing impurities such as SO2, particulates, and mercury in the 33 Kingston Fossil Plant. Tennessee Valley Authority Website: http://www.tva.gov/sites/kingston.htm 34 US Environmental Protection Agency (US EPA), 2005. 35 American Coal Ash Association, “2009Production and Use Survey.”135 million tons of coal solid waste. US EPA, “Municipal Solid Waste Generation, Recycling, and Disposal in the United States: Facts and Figures
for 2008.” 250 million tons of municipal solid waste. 36 Knoxville News Sentinel “Ash spill: TVA triples amount of sludge released” December 26, 2008. 5.4 million
cubic yd. PBS News Hour, Maureen Hoch. "New Estimate Puts Gulf Oil Leak at 205 Million Gallons.”August 2, 2010. 37 US EPA Draft report, “Human and Ecological Risk Assessment of Coal Combustion Wastes” August 6, 2007. 38 Acid Rain Program 2007 Progress Report, U.S. Environmental Protection Agency, January 2009. 39 East-West Center Working Papers, “China in the Transition to a Low-Carbon Economy.”
Figure 1.8

11
process. Syngas is then fed through a combined-cycle gas turbine, which boasts higher efficiencies than traditional coal combustion. Therefore, IGCC addresses both acid rain and climate change issues.
First-generation IGCC facilities suffered from cost overruns and operational challenges. As of 2007, only two plants remain active in the US. China is building a 250MW demonstration plant in Tianjin, but IGCC may have limited applicability there due to prevalence of low quality coal. Mitsubishi Heavy Industries is building a 1.3GW facility in the Netherlands, to be commissioned in 2011.
3. Carbon capture and sequestration (CCS) – CCS technologies capture CO2 from coal-fired power plants, transport it to an impervious geological feature, and then pump it deep into the ground to avoid atmospheric emissions entirely. CCS requires a sealed, integrated system to contain unprecedented volumes of gases indefinitely. If all CO2 emissions from US coal plants were stored by CCS, the quantity would be equivalent to three times the weight and one-third of the annual volume of all natural gas transported by the US gas pipeline system.40 These enormous facilities are expected to require an additional 10-40% more coal to be burned for the same energy.41 Since the emissions from the related mining, transporting, and processing of coal are not sequestered, a fuel-use increase of as little as 25% would result in an increase in net CO2 emissions.42 Also, CCS requires extensive surveillance to ensure proper injection and no leakage or reintroduction into the atmosphere, particularly for oil and gas recovery applications.
CCS has been highlighted by both US and Chinese governments in their climate change policies. However, it has had a rocky road in the United States. The Taylorville pilot project in Illinois was voted down by the Illinois legislature, but was then approved by the state senate in December 2011. The Assembly will vote on it in 2012.43 There are three operating R&D CCS facilities – Weyburn, Canada (enhanced oil recovery), Sleipner, Norway (gas recovery), and Salah, Algeria. A study by MIT warned that all three lacked the “necessary modelling, monitoring, and verification (MMV) capability to resolve outstanding technical issues, at scale.” The study concluded that CCS is theoretically possible, but so mind-bogglingly difficult technically that it is unlikely to become a commercial technology before 2030.44
Natural gas
Natural gas is the cleanest fossil fuel source. It enables baseload, intermediate, and peak generation, as well as a host of innovative distributed applications. Access to gas supplies has expanded with the rise of LNG, new shale gas techniques, worldwide price declines, and entrance of new players. Gas is poised for an expanding role in the global energy mix.
Global Trade
Natural gas has become a global commodity with the continuing build out of LNG and pipeline infrastructure. Until the 1990s, LNG trade focused on three important island economies – Japan, Taiwan, and South Korea. Today, North America and Western Europe are becoming large players, driving the trans-Atlantic market as well.45 The United States, originally thought to be an LNG importer, is now preparing to become an LNG exporter.46
40 MIT: the Future of Coal Report, 2007 41 IPCC, 2005. 42 Energy Policy, Jacobson and Delucchi “Providing all global energy with wind, water, and solar power, Part I
Technologies, energy resources, quantities and areas of infrastructure, and materials,” 2010 43 http://ilchamber.org/news/2905/taylorville-energy-center-gets-green-light-from-illinois-senate/ 44 MIT: the Future of Coal Report, 2007 45 http://www.energy.ca.gov/2007publications/CEC-200-2007-017/CEC-200-2007-017.PDF 46 http://www.downstreamtoday.com/news/article.aspx?a_id=28454

12
Figure 1.9 2009 Gas Net Global Trade Movements (Billion Cubic Meters)
Price Trends47
Increasing globalization meant gas prices around the world moved closely together for much of the past fifteen years, with oil prices acting as the ceiling. However, vast new reserves are driving an unprecedented price gap between North America gas and crude prices.
Figure 1.10
Unconventional Gas
Unconventional gas that can be exploited using current technology consists in the main of shale gas and tight gas48 with lesser amounts of coal bed methane. Recent US shale gas discoveries could change the dynamic of world energy markets. The US Energy Information Administration estimates 862 tcf of “technically recoverable resource” in the United States 47 BP Report, 2010. 48 Gas that is stuck in a very tight formation underground, trapped in unusually impermeable, hard rock, or in a
sandstone or limestone formation that is unusually impermeable and non-porous (tight sand).

13
alone. Industry estimates range from 700 tcf to 1,800 tcf, with a median of 1,000 tcf. To this can be added tight gas (industry median estimate 350 tcf) and Canadian shale and tight gas (400 tcf and 70 tcf).49 These estimates dwarf the amount of hydrocarbon resources discovered in the Tupi oil fields near Brazil, the largest hydrocarbon discovery in the Western Hemisphere in 30 years.50
Major oil companies see the potential, and are positioning themselves to tap these discoveries. Exxon Mobil paid $36B in Dec 2009 to buy XTO Energy, whose assets are mostly in US shale gas properties. Chevron followed with $4.3B for Atlas Energy in November, buying a strong position in the Marcellus shale. France's Total SA agreed in January to acquire a quarter of Chesapeake's Barnett Shale operations in Texas for $2.25 billion.
Various Applications
Natural gas can be compressed, liquefied or delivered through distribution networks. It is a primary fuel source, as in city gas for cooking, heating and cooling. CNG is a motor fuel and is used in remote areas off of power grid. Gas is used in central system power generation and it plays a critical role in distributed systems that support intermittent renewable power. New advanced technologies are promoting the cleaner use of gas.
1. Compressed Natural Gas (CNG) vehicles – While Asia-Pacific leads the world in CNG vehicles, CNG is also popular in the West for fleet vehicles and buses. Many CNG vehicles serve in Argentina and Brazil as taxis. Such vehicles travel within a defined area near filling stations. They log heavy mileage, and tend to pay back their cost more quickly due to avoided gasoline purchases. CNG helps cities fight urban air pollution with commercially-available technology. In addition, CNG and propane vehicles can be used in remote, off-grid locations.
2. Cooling – Absorption chilling and gas heat pump cooling flatten seasonal gas demand by increasing summer consumption of gas, while flattening seasonal power demand by offsetting summer peak usage. Absorption uses non toxic lithium bromide as an absorbent. Gas can be used in conjunction with solar thermal or waste heat to power these systems. Absorption chillers are popular in China and Japan, where they make up one-fifth of the commercial cooling market.51 Gas heat pumps use the more familiar and efficient compression technology.52
3. Fuel cells –Fuel cells run quietly and produce electricity, water, heat and very small amounts of nitrogen dioxide and other emissions, depending on the fuel source. Hydrogen fuel cells are a dream technology providing a clean alternative to combustion generators, making electricity and hot water through a chemical reaction between oxygen in the atmosphere and hydrogen extracted from gas.53 Natural gas and methanol are sometimes used as fuel. Fuel cells of all types are used as backup power or used in remote areas where access to the grid is limited. About half of the fuel cells sold recently are for static use and the other half are for vehicles, airplanes and submarines.
4. Micro Combined Heat and Power (Micro-CHP) –Recent advances in small heat engines (reciprocating or sterling) have made it economical to run gas engines based on a 49 Table 1-3, PRUDENT DEVELOPMENT: Realizing the Potential of North America’s Abundant Natural Gas and
Oil Resources, National Petroleum Council 2011 , http://downloadcenter.connectlive.com/events/npc091511/Resource_Supply-091511.pdf 50 Tupi is estimated to yield 5-8 gigabarrels of oil. See "Petrobras Pumps First Crude from Massive Tupi Field
Offshore Brazil". Rigzone. May 1, 2009. 51 Japan Gas Association, Haruki Takahashi “Advancement of the gas industry in Japan” 2004. GCIS Strategic
Research, “The China Green HVAC Market” 2009. 52 http://www.gas.or.jp/gasfacts_e/08/index.html 53 http://www.gas.or.jp/english/letter/vo_09.html

14
commercial building’s heat demand, and then export any surplus electricity to the grid in a net-metering scheme. Micro-CHP can also be based on fuel-cell technology, optimizing the balance between heat recovery and power generation efficiencies.
5. Integration of Intermittent Renewable Energy – As described in the renewable energy section, natural gas plays a key role in preparing the energy system for high levels of variable renewable energy resources. New gas power plants can be set up to initially serve traditional baseload roles, and then evolve their operation to compensate for variable wind and solar resources as those resources begin to accumulate on the grid.
Conclusion
Concerns about climate change dominate political discourse in many countries. The UN's IPCC AR4 report, representing current scientific consensus, states that "anthropogenic warming could lead to some effects that are abrupt or irreversible.”54 Adherents of runaway climate change theories sound a much louder alarm, warning that positive feedback loops could lead the climate system to a catastrophic “point of no return.”
On the other hand, our energy infrastructure is an enormous societal asset, critical to powering society from the beginning of the industrial revolution. Critical infrastructure demands careful planning, and any transformation will take decades. Thus, policymakers must maintain a long-term view when assessing economic and environmental costs, formulate a plan to lower carbon emissions responsibly, and then promote the right structural changes for a cleaner and more secure future.
Natural gas is emerging as the central component in this crucial transition, with the scale and maturity to meet today’s energy needs cleanly and securely. It also has a diversity of applications and the flexibility to enable fundamental shifts in our energy systems, which are necessary so that it can continue serving future generations. Researchers from respected institutions are therefore refocusing their efforts on gas. In the next part, we will look at some of these studies.
Part 2 Natural Gas Reports
Because natural gas has relatively few drawbacks overall as a form of primary energy, it plays a major part in energy policy discussions and many reports have been issued on the subject. None have raised concerns about a lack of resources, but other issues have been raised, including the cost of transport and the geopolitics arising across the gas chain, from production through transport to consumption. Some reports see economically recoverable unconventional gas resources as being limited.
Natural gas is often called a form of bridge energy because it integrates well into the process of transitioning to renewable energy. Even though gas could be an optimal partner for the introduction of renewable energy resources, some fear that it could dampen the investment needed to lower the cost of renewable energy to parity with traditional power sources. This is due to the positive qualities of natural gas. One of the lowest-cost means for rapidly reducing CO2 emissions is to replace coal or oil with natural gas. Emissions are reduced even further with natural-gas combined head and power applications. However, the result is a lock-in-effect, as the renovated or newly built facility will continue to emit CO2 for the remainder of its useful life.
Some speak of a golden age of gas. Whether this forecast comes true or not, the large reserves of unconventional natural gas can create supply security and price stability without carbon credits. Natural gas is assured of a solid future.
54 http://www.ipcc.ch/publications_and_data/ar4/syr/en/mains3-4.html

15
Responsible development of unconventional natural gas is important to alleviate concerns over water contamination and higher GHG emissions from methane leaks. Although almost all the reports raise some issues, natural gas and natural gas systems are looked upon favourably as a significant fuel resource that offers practical solutions to global warming.
What follows are summaries of a number of these reports.
IEA, World Energy Outlook, 2011 “Are We Entering the Golden Age of Gas?”
This IEA special report explores the potential for a ‘golden age’ of natural gas in the near future. In this scenario, departing from the base case of the 2010 New Policies Scenario, natural gas plays a greater role in the global energy mix, with a 25% global share in 2035. Gas benefits from uncertainty in the global energy situation. It is readily available to replace nuclear power in countries where nuclear plans are being shelved, and coal power where it is being phased out. Other benefits include: replacing oil products in transportation, providing energy diversity and security and providing backup generation for variable power sources. Gas is increasingly competing with electricity in many end-use sectors such as commercial buildings. An additional driver is the need for increased power in the expanding economies of China, India and the Middle East.
The Golden Age of Gas Scenario assumes that China ramps up gas use, nuclear power growth slows, the use of gas in the transportation sector increases, and prices are $3 to $7 per mcf due to ample supply, primarily from unconventional production in many areas of the world.
The gas trade doubles (half pipeline gas and half LNG), but regional demand and supply differences remain. The United States remains self sufficient in gas, assuming regulatory approval of unconventional gas production.
IEA, World Energy Outlook, 2010 (WEO2010)
In WEO2010, the International Energy Agency (IEA) predicts that natural gas will replace coal as a fossil fuel by the year 2035. Natural gas will lead the market for fossil fuels, with the market growing 44 percent through 2035.
Under the New Policies Scenario, ninety-three percent of the growth in energy demand will occur outside the countries making up the Organisation for Economic Cooperation and Development (OECD). The New Policies scenario assumes that countries that have made commitments to
Figure 1.11 World primary energy demand by fuel in the GAS scenario
Figure 1.12 World energy-related CO2 emissions

16
reducing climate change keep these commitments, although they have not formerly adopt the policies. The IEA is hoping the New Policies scenario will be a new baseline for improving the climate.
WEO2010 presents three scenarios to predict changes in the climate to 2035. The Current Policies scenario assumes nations implement only the policies they have currently adopted. The New Policies is explained above. The 450 scenario assumes countries meet the high-end of the goals presented at the Copenhagen conference on climate change in 2010, including eliminating fossil fuel subsidies, which the IEA expects will stabilize the climate at two degrees Celsius above the current average.
CRS Report for Congress, Global Natural Gas: A Growing Resource (2010)
This report was prepared for members and committees of Congress by Michael Ratner, Analyst in Energy Policy at the Congressional Research Service. It explains key aspects of global natural gas markets, including supply and demand, as well as major developments in the United States.
Natural gas is considered a potential bridge fuel for power generation, while moving toward a low-carbon economy, because it is cleaner burning than its hydrocarbon rivals coal and oil. Natural gas combustion also emits less particulate matter, sulphur dioxide and nitrogen oxides than coal or oil. With a growing resource base and relatively low carbon emissions, natural gas is likely to play a greater role in the world energy mix.
The world used over 100,000 billion cubic feet (bcf) of natural gas in 2009, of which the United States was the largest consumer at almost 23,000 bcf. Almost 84% of US consumption came from domestic production, with 14% from Canadian imports and 2% from liquefied natural gas (LNG). However, according to a recent U.S. Energy Information Administration (EIA) report, US shale gas reserves increased 76% in 2009, while US production rose 47%. With expanded U.S. and Canadian supply potential, LNG export options are now being considered.
Many countries have been watching US developments and are now exploring their own shale gas resources. Some countries with large unconventional resources are trying to develop and commercialize shale gas. Going forward, the advance of shale gas production will be influenced by technical capability, environmental concerns and political considerations.
MIT, The Future of Natural Gas (2010)
Global Remaining Recoverable Gas Resource Global Gas Supply Cost Curve
Figure 1.13

17
Scientists estimate that the amount of natural gas available in the world today is about 150 times the world's annual consumption. Suppliers can offer most of the world's supply at or below eight dollars per million metric Btu, but the cost of transporting this natural gas can be high. Most of the world's natural gas reserves are now located in the Middle East, Russia, and North America. Extracting gas from shale for world markets has increased supply and lowered production costs per unit.
Analysts must be careful when evaluating the natural gas market because 1) gas can be used to generate electricity, heat homes, and support industry; 2) markets for gas are found in distinct regions around the globe, and 3) the natural gas market has a history of feast or famine expectations.
World Watch Report #184, Powering the Low-Carbon Economy: The Once and Future Roles of Renewable Energy and Natural Gas (2011)
The price of renewable energy is falling, but the two biggest source, wind and solar, are unreliable and destabilizing to the grid in large quantities. Alone, they cannot replace coal and nuclear baseload plants, which suffer from operational inflexibility and the expense and efficiency losses associated with long-distance transmission.
The price of natural gas, the cleanest, lowest-carbon fossil fuel, is also falling. Natural gas can be used in a range of efficient, flexible, and scalable generating technologies. Large wind and solar facilities paired with gas can provide baseload power on the transmission grid. Small solar, wind, and natural gas-fired cogeneration plants can also be networked together to provide flexible, robust power on the distribution grid. This will allow for reduced dependence on coal, speeding the transition to a low-carbon economy.
There are ways to mitigate the carbon emissions from natural gas. Biogas from landfills and organic processes can be captured and utilized. In the future, hydrogen produced from water through electrolysis using renewable energy could be added to methane to further reduce the carbon content.
There are four key enabling mechanisms to promote displacement of coal power: increased regulation of air pollutants, attaching a cost to emissions of CO2, allowing wind and solar plants to balance their own output with onsite resources, and designing wholesale electricity markets to react to fluctuations in electricity supply and demand as rapidly as possible. With the proper technology and incentives, renewable energy and natural gas can accelerate the decarbonisation of the world’s electricity system and form the foundation of tomorrow’s low-carbon economy.
Resources for the Future, Natural Gas: A Bridge to a Low-Carbon Future? (2009)
This paper examines four scenarios on US gas availability and energy policy, simulated using the NEMS energy market model (DOE). Scenario 1 represents business as usual (BAU) policies, not reflecting the unconventional gas boom. Scenario 2 incorporates Potential Gas Committee (PGC) estimates, incorporating increased shale gas
Figure 1.14

18
resources and low production costs (High Gas). Scenario 3 assumes BAU with a cap-and-trade policy in place. Scenario 4 reflects High Gas with cap-and-trade.
Gas can be a bridge to a low-carbon future, but only with cap-and-trade. Otherwise, abundant gas supplies will not decrease CO2 emissions because a) overall energy use will increase substantially and b) gas will displace nuclear and renewable resources instead of coal in generating electricity.
DB Climate Change Advisors, Natural Gas and Renewables: A Secure Low Carbon Future Energy Plan for the United States (November 2010)
This report puts special focus on the short-term, complex relationship of natural gas and renewables. On the one hand, gas is proposed as a “bridge” generation technology to a low-carbon energy future, due to its operational flexibility and favourable emission profile compared to coal. Underutilized gas plants can provide backup power for intermittent renewables with the right transmission linkages and a market structure that pays for capacity as well as energy delivered. On the other hand, natural gas sets the marginal wholesale power price in most competitive electricity markets. Abundant, low-cost shale gas has been the game changer. Without feed-in tariffs for solar and wind power, such projects can become money losers. This has recently caused the growth rate of wind energy in particular to slow.
Greater potential over the long term lies in natural gas with carbon capture and storage. In this time period it anticipates renewables and natural gas becoming more complementary resources. Hybrid natural gas and solar power plants hold promise for delivering reliable, low-carbon electricity.
World Economic Forum, Energy Vision Update 2011: A New Era for Gas
The World Economic Forum (WEF) is a not-for-profit international organisation established in 1971 located in Geneva. Most members are corporate top executives and some energy ministers. The report is an annual update of the global energy situation and projections based on the work of the Energy Industry Partnership program of WEF.
Natural gas today provides 24% of the world’s primary energy. It is regarded as more environmentally acceptable, more available and less expensive, mainly due to recent increased production of unconventional gas. This includes shale gas in North America, tight gas and coal-bed methane (CBM). These are coupled with a growing LNG capacity to create more availability. The global LNG trade doubled in the 10 years from 2000 to 2010 and is expected to increase another 50% by 2020. In Europe, development of unconventional gas faces several challenges including government ownership of subsurface mineral rights.
Gas demand growth in OECD countries is expected to be more evolutionary than revolutionary. Its most robust demand will be for power generation. Climate and efficiency
Figure 1.15

19
are addressed on a global and regional basis. The twin challenges of climate change and energy security are difficult to solve, but an optimal mix of solutions should be considered.
The search for balance between competition and energy security is central to an understanding of the role of spot markets and long term contracts in the global gas trade. Energy security and the environment can also come into conflict if the power system relies too much on intermittent renewable sources. Energy not consumed is the cheapest option, but reducing energy consumption required investment. Gas for now, is a triple A energy source, abundant, affordable, and acceptable. In the United States, low-cost shale gas is a formidable competitor for both renewable electric power and new nuclear energy. In Pakistan, Argentina, Iran and Italy, natural gas vehicles are popular.
European Gas Advocacy Forum, Making the Green Journey Work: Optimized pathways to reach 2050 abatement targets with lower costs and improved feasibility (2011)
Centrica, Eni, E.ON Ruhrgas, Gazprom, GDF SUEZ, Qatar Petroleum, Shell and Statoil participated in the preparation of this analysis. Data from the European Climate Foundation (ECF) was used, but ECF was not involved. The report shares the participants’ consensus view of how the energy industries can develop lowest-cost options for European 2050 objectives to be met. It offers a technical analysis and cost-effective steps to achieving 80% of the 2050 targets. Its conclusion is that the optimised pathways will achieve Europe’s 2050 emission reduction target with increased savings and improved feasibility over previously published pathways.
The study explores three optimized pathways to meet the European Council CO2 target of 80-95% below 1990 levels by 2050. These pathways achieve the target at less risk and €450-500B less cost than the “60%-RES” roadmap of the European Climate Foundation. For the period of up to 2030, it suggests for the near-term, three potential comprehensive pathways. First, increase renewable power generation, complemented by a mix of gas and nuclear capacity, to steadily replace coal-fired capacity.
For the period 2030 to 2050, continued movement from coal to gas and switching to biomass with carbon capture and storage for electricity generation can take place. LNG will be used for shipping and heavy duty vehicles. However, nuclear, biomass and CCS dominate the proposed options.
These incremental approaches incur less technology risk as well by lowering reliance on intermittent generation that would require pan-European build-out of transmission and cross-grid cooperation/ balancing of power.
Figure 1.16 Optimized pathway for achieving abatement targets

20
BP Energy Outlook 2030 (2012)
Figure 1.17
The natural gas market will grow faster than any other fossil fuel market in coming years, according to BP's Energy Outlook, published in January 2012. Eighty percent of the growth in demand for natural gas between 2010 and 2030 will take place in countries outside of the Organization of Economic Cooperation and Development (OECD). Growth in demand will be highest in China, India and Middle Eastern nations. The increase in demand will be roughly equal for China and the Mideast with growth in India equal to about 1/3 that of China. Globally, demand for natural gas was about 300 Bcf/day in 2010; demand is expected to grow to nearly 470 Bcf/day by 2030.
The growth in the supply of natural gas transported by pipeline between 2010 and 2030 will come mostly from the Middle East, the Former Soviet Union (FSU) and a variety of other countries. Also, North America will begin making an increasingly significant contribution to supply during these years. The growth in the supply of liquefied natural gas (LNG) will come mostly from Australia, Africa and the Mideast. The increase in LNG supply growth will be more than double that of gas overall.
Among non-OECD nations, the natural gas market will grow along with the markets for other fuels, as the demand for all fuels grows in developing nations.
Among OECD nations, the growth of natural gas will be driven by regulatory changes and price differentials. OECD countries will switch from coal and oil to gas for power generation, as gas becomes relatively less expensive and as regulation of carbon emissions tightens. The BP Energy Outlook highlights the opportunities for “lightening the carbon load” by switching to less carbon-intensive fuels such as natural gas.
Exxon Mobil, The Outlook for Energy: A View to 2040 (2011)
Exxon Mobil’s outlook for 2040 projects world energy demand will be about 30 percent higher. While energy demand will be flat for OECD countries, non OECD energy demand will grow by close to 60 percent. Global energy-related CO2 emissions are expected to level off around the year 2030, with energy being used more efficiently. Energy supplies will continue to diversify as new technologies and sources emerge. The supply mix will vary by region, reflecting diverse economic and demographic trends as well as the evolution of technology and government policies.

21
Oil, gas and coal combined will continue to account for about four-fifths of the fuel mix throughout the outlook period, but demand for coal will peak and begin a gradual decline. With demand shifting to lower-carbon sources, natural gas will become the world’s no. 2 fuel. Natural gas will grow rapidly enough to overtake coal for the number-two position behind oil. For both oil and natural gas, an increasing share of global supply will come from unconventional sources.
Figure 1.18
Royal Dutch Shell plc Sustainability Report (2010)
World demand for energy will keep increasing for the foreseeable future. According to the International Energy Agency, by 2050, the global population will be 9 billion, and energy demand will double. A transition to a sustainable energy system will take decades.
Greenhouse gases are a serious threat and cutting global CO2 emissions must be a top priority. But fossil fuels supply 80% of the world’s energy and will be the cornerstone of the global energy system into the future. A third of the world’s CO2 emissions come from power generation.
Power generated from natural gas produces 50–70% less CO2 than coal power. Replacing aging coal-fired power stations with new gas-fired plants could therefore significantly reduce CO2 emissions from the power sector. Combining natural gas with carbon capture and storage (CCS) could reduce CO2 emissions by 90% compared to coal. Natural gas will account for over half of Shell’s total production in 2012, with tight gas contributing a larger proportion.
Every small effort counts in the push toward environmentally sustainable energy. Shell’s efforts include promotion of renewable energy, CCS, systematic water recycling and pursuing efficiencies (e.g. cleaner burning natural gas). As an example, the move from coal to natural gas will reduce conventional pollution.
Many innovative projects are reported. Floating LNG processing plants (FLNG), at remote, offshore fields, process, liquefy and load the gas onto tankers, thus reducing the environmental impact of offshore gas production.

22
The Gorgon LNG project (Shell interest 25%) in Western Australia is the world’s largest carbon capture and storage (CCS) project. It will produce 15 million tons a year of LNG over 40 years, while reducing the project’s overall CO2 emissions by around 40%. CO2 will be separated from the natural gas and injected into a saline rock formation deep underground.
Another important effort is reduction of gas flaring. In 2010 flaring increased by 30%, primarily due to increased production in Nigeria and the start of Iraqi operations. Nigeria’s problems include the insurrection that is hampering progress and the government partner’s unstable funding. Shell is committed to finding ways to reduce flaring, which made up nearly 14% of its direct GHG emissions in 2010.
National Petroleum Council, Prudent Development: Realizing the Potential of North America’s Abundant Natural Gas and Oil Resources (2011)
The National Petroleum Council (NPC) is an oil and natural gas advisory committee to the Secretary of Energy, Mr. Steven Chu. At his request, NPC conducted a comprehensive study reassessing North America’s natural gas and oil resources. Environmental protection, economic growth and energy security are the objectives for the future society with a lower carbon energy mix. Assessments of environmental, operational, technology, supply, demand and infrastructure considerations are required to determine ways in which natural gas and oil can contribute to this transition.
Potential supplies are much greater than previously thought for both natural gas and oil resources, as a result of recent advances in production technology for oil sands and for oil and gas trapped in tight sands and shale, as well as coal bed methane. The gas and oil industry is vital for the economy, generating millions of jobs. However, it is important to do responsible development and delivery in a safe and environmentally acceptable manner.
NPC recommends: prudent development of the resources with consideration for health, safety and the environment, reducing greenhouse gas emissions including methane. The environmental footprint and impact of the full fuel cycle for various fuel sources should be considered. Policies should be put in place to promote efficient use of energy such as CHP, to enhance energy regulations to be effective and not burdensome, and to provide the necessary intellectual capital for a skilled workforce.
American Gas Foundation, Natural Gas End Use: A Vision for Today and the Future (2009)
Figure 1.19 Uses for natural gas
This report is prepared by the Gas Technology Institute (GTI) for the American Gas Foundation (AGF). AGF is a non profit organisation working on public policy with emphasis on gas energy research programs. GTI has been a not-for-profit R&D organization for nearly 70 years. GTI develops, deploys and licenses technology solutions for the energy industry.

23
The vision for natural gas is as a part of the solution for energy security, the low carbon society and other environmental problems, given its abundant supply and relatively low cost compared with other fuels. Natural gas is not just for the industry but for all of society. Therefore we should expand and improve its end-use applications.
The dynamics of the US energy industry are changing, with the role of nuclear power being re-examined and efforts being made by government to decrease dependence on imported oil. Gas R&D should have a strong lobbying effort to promote end-use applications in an active and efficient way. The gas industry needs to work with manufacturers and government agencies on specific actions to bring the proposed vision to reality. Industry, researchers and government need to collaborate effectively. The US needs a realistic portfolio backed by systematic funding that is based on clear set of RD&D priorities and has specific targets, so that decision makers can work with better understanding and industry can develop better and improved solutions for every sector. Natural gas will continue to play an important role in the nation's energy strategy as new and enhanced end-use technologies enter the marketplace.
World Shale Gas Resources: An Initial Assessment of 14 Regions Outside the U.S.
In April 2011, the United States Energy Information Administration (EIA) released its first systematic assessment of the international shale gas resource base in 14 priority regions identified by an initial EIA study. Advanced Resources International, Inc developed assessments of 48 shale gas basins in 32 countries, containing almost 70 shale gas formations. This report describes the key results, the report scope and methodology, and the key assumptions behind the results.
Figure 1.20 World shale gas resources
Today, shale gas has become a “game changer” for the U.S. natural gas market. EIA's Annual Energy Outlook 2011 (AEO2011) estimates technically recoverable US shale gas at 862 trillion cubic feet. Shale gas is also the largest contributor to the projected growth in gas production, and by 2035 it will account for 46 percent of US natural gas production. Moreover, many parts of the world also have significant potential for shale gas that could play an increasingly important role in global natural gas markets. The report estimates that adding the identified shale gas resources to other gas resources increases total world technically recoverable gas resources by over 40 percent.
Two country groupings emerge from the data. France, Poland, Turkey, Ukraine, South Africa, Morocco, and Chile are highly dependent upon gas imports and have at least some

24
production infrastructure. Their substantial shale gas resources could significantly alter their future gas balance. The United States, Canada, Mexico, China, Australia, Libya, Algeria, Argentina, and Brazil have large shale gas resource on top of their existing natural gas resources. Depending on the infrastructure readiness, they could become exporters. Russia and Central Asia, the Middle East, South East Asia, and Central Africa were not addressed by the current report because either they have large conventional reserves or there was not enough information to do an initial assessment.
Developing America’s Unconventional Gas Resources: Benefits and Challenges, A Report of the CSIS Energy & National Security Program (2010)
The Center for Strategic and International Studies (CSIS) is a public policy institute in Washington DC providing strategic insights and practical policy solutions to US decision makers since the 1960’s. This paper is generally positive about the use of natural gas, including unconventional gas. It concludes that gas production and use are not without challenges, but gas offers a clear improvement over the status quo if properly managed.
CSIS has a major focus on defence and security, and appropriately, the report discusses shale gas in terms of improving the trade balance, creating jobs and increasing energy security both in the US and European countries. (Shale Gas and U.S. National Security, A Report of James A. Baker Ⅲ Institute, 2011 illustrates more on geopolitical implications.)
The CSIS report predicts increased use of natural gas in the power sector. Natural gas is better than coal for achieving climate objectives. However, the timeline for such replacement should align with gas supply projections, not government mandates. Also it emphasizes the importance of making investments self-sustaining by such means as pricing carbon, setting an energy-intensity standard or broadening clean fuel definitions to include natural gas.
Setting energy policy on a more sustainable path is a complex and difficult task. Natural gas can provide an important bridge to a more secure future.
The ‘Shale Gas Revolution’: Hype and Reality, A Chatham House Report (2010)
Shale gas leapt from 1% of US production in 2000 to 20% in 2009, flooding the market and causing low prices. This caused investor uncertainties at all stages of the gas value chain. Gas export projects were cancelled or postponed. LNG capacity utilisation was reduced. Low prices may lead to underinvestment in conventional gas production, pipelines, and storage and create supply constraints if exporters form a cartel.
In the meantime, shale gas bears potential risks, including faster depletion rates, environmental restrictions such as moratoria on horizontal drilling and hydraulic fracturing, and doubtful applicability outside the US. In Europe, a unique combination of less favourable geology, no tax breaks, and an onshore service sector that lags of the US, and the lack of private property mineral rights may hamper development.
The fallout from the hyping of shale gas includes lagging investment in both conventional gas and renewable energy. In the UK, concern about future low gas prices is complicating the debate over whether to replace declining domestic gas production for power generation with nuclear power plants. Investments made (or not made) in the next 10-15 years can set our trajectory over 40 or more years. If underinvestment in alternatives to shale gas persists and the promise of shale gas is not realized, serious shortages could return within ten years.
Tyndall Centre Manchester, Shale gas: a provisional assessment of climate change and environmental impacts (2011)
This report studies the impacts from shale gas production, using data from Marcellus Shale in Pennsylvania. It is difficult to apply the study findings using US data to the UK, so this is a provisional assessment.

25
Shale gas exploitation does not involve the high energy or water inputs of other unconventional fuels such as oil sands, but water use is significant (9,000 - 29,000m3 per well). Groundwater is at clear risk of contamination. Casings and cement seals that shield aquifers could fail. Such problems arise from human error and cannot be eliminated. For surface water, higher standards of hazard management will be needed. A typical well involves 180-580m3 of fracking additives, 140m3 of well cuttings (mud), and 1,300-23,000m3 of flow-back fluids. The potential in the UK for hazardous chemicals to enter the groundwater is real. High population density creates problems, due to the proximity of wells to populated areas, such as noise pollution, traffic, and landscape impacts. Each well requires 4-5 weeks of nonstop drilling and 6,600 truck trips. The report recommends a cautious approach to exploitation of shale gas in the EU.
(The Economic and Scientific Policy Directorate of the European Parliament report, “Impacts of shale gas and shale oil extraction on the environment and on human health, (2011)” points out the need to streamline EU regulatory framework concerning hydraulic fracturing.
In the U.S., the Natural Gas Subcommittee of the Secretary of Energy Advisory Board’s 90-day report (August 2011) presents recommendations to reduce the environmental impacts from shale gas production and EPA’s shale gas study is due to be completed in 2014.)
Greenhouse gas emissions in excess of conventional gas production are equal to 0.2%-2.9% of the emissions at the time of combustion. An estimated 348-438 tonnes CO2e (equivalent) are released per well. On average, refracturing will add 0.14-1.63tons CO2e/TJ of gas energy extracted. There is no data for fugitive emissions. The report says, however, that investment in shale gas slows down investment in zero-carbon technologies. Also, without a meaningful cap on emissions, the shale gas exploitation may increase net carbon emissions as the world is always energy-hungry and additional fossil fuel resources are welcomed.
Post Carbon Institute, Will Natural Gas Fuel America in the 21st Century? (2011)
The Post Carbon Institute examines three prevalent assumptions about the role that natural gas can play in the energy of the future. The first is that, with the added reserves of shale gas, the US has a huge resource base that will support 100 years of consumption. The second is that the price will remain low for the next several decades. The third is that natural gas and shale gas are cleaner and safer to use than other fossil fuels in terms of greenhouse gas emissions and public health.
The report uses published scientific reports and data to conclude that none of the three assumptions are correct. It concludes that reserves of shale gas are overstated and that recovery rates will be lower than forecast based on misplaced optimism about recovery rates, the longevity of wells, and price stability at current low prices.
The report’s case for environmental harm stems from a series of NY Times articles starting with “Shale Gas Isn't Cleaner Than Coal, Cornell Researchers Say.” The lead author of the study, Robert Howarth, stated that shale gas has a greater greenhouse effect over a 20 year window than coal production, due to methane gas emissions during shale gas production.
The paper concludes: “Strategies for energy sustainability must focus on reducing energy demand and optimizing the use of the fuels that must be burnt. … Capital- and energy-intensive ‘solutions’ such as carbon capture and storage (CSS) are … inconsistent with the whole notion of energy sustainability…”

26
A greater role is anticipated for natural gas in the Asia Pacific region
Kenji KOBAYASHI
President of Asia Pacific Energy Research Centre
The Asia Pacific region is expected to see a significant increase in energy demand in the years to come, with the expected high economic growth in Asia as a main driver. Careful consideration is required on how to cope with the expected enormous increase in energy demand, as uncontrolled and hastened development could lead to rapid depletion of energy and other natural resources and aggravate climate change issues, which would be unsustainable.
Appropriate policy measures are required to achieve the twin goals of economic growth and a sustainable environment with less use of resources and energy. Various institutions and authorities around the world agree on the importance of natural gas to achieve these goals. This is especially true for the Asia Pacific region, where the role of gas is expected to be even greater in the future.
The region has a unique combination of natural gas markets: (1) Northeast Asia where countries traditionally have depended on LNG for city gas and power generation; (2) China and India whose energy demand including natural gas is already large and is expected to be even larger; (3) Southeast Asia, which has been a supply centre for LNG and highly dependent on natural gas for its own energy needs, and which is expected to have higher demand growth than other regions; and (4) Oceania, which is expected to provide over half of the incremental supply of natural gas to the region as a whole.
The Asia Pacific region has a huge potential to expand effective and efficient use of promising renewable energy sources, including solar and biomass. Natural gas is advantageous, in that it can compensate for their shortcomings and thus accelerate their introduction and penetration.
Efficient energy systems should be established with less capital expenditure and social burdens, to develop more sustainable social infrastructure throughout the region. For this, natural gas is even more indispensable.
With the region’s unique combination of countries, sub-regions, and skill-sets of people supplementing each other, the natural gas sector is expected to contribute greatly to healthy development of a sustainable society.

27
Chapter 2 - Life-Cycle CO2 Emissions in the Conventional Natural Gas Supply Chain and the Impact of CH4 Leakage Associated with
the Natural Gas Industry
Introduction
The superior environmental quality of natural gas combustion is undisputed due to its chemical composition. However, some have alleged that it is not so environmentally benign due to substantial leaks upstream and in the supply chain of methane, which has a high global warming potential (GWP) value. More recently, issues have arisen around the environmental impact of shale gas.
The counterargument looks at life-cycle assessment (LCA). Some of the past arguments against natural gas used data with insufficient credibility, based on speculation of substantial amounts of gas leaking from Russian pipelines.
To test these arguments, the Wuppertal Institute in Germany collected the actual data with Russian cooperation. It issued a report showing the environmental superiority of natural gas from the standpoint of LCA.
IGU, on the other hand, produced a report on the measures that could be taken to reduce the environmental load, looking at LCA along the supply chain after analysis was done using prior WEC data and the survey results from Wuppertal Institute during the 2003-2006 Triennium.
ISO 14040 /14044 specifies the international standard for the scope and definitions of LCA analysis. However, this standard is difficult to comply with in every detail. The difficulties lie in collecting the specified data, setting the range of the analysis, and setup of the various parameters.
If, on the other hand, the LCA parameters are limited to the natural gas chain and climate change, it is not so difficult to clarify the issues, challenges and possible solutions. Examples would be direct emissions of greenhouse gases along the supply chain and energy usage, i.e. indirect emissions. (Other pollution issues such as acid rain, soil contamination and water contamination are outside the scope of this discussion.)
In order to propose policy initiatives, it is necessary to do precise analyses using accurate, quantifiable values to the greatest extent possible. However, it is necessary to be responsive to the major topics that concern industry and to produce realistic solutions that actually solve the problems, rather than doing analyses with academic precision solely for academic interest.
Figure 2.1 Life-cycle emissions for power generation by fuel type

28
Natural gas, oil and other gases from the same well are respectively responsible for GHG emissions in proportion to their produced total calorific value. The industry should continue the effort of collecting the necessary data, analyzing it and disclosing it so that the comparative superiority of natural gas from the perspective of LCA is well understood. The process should be transparent and accountable. This will show where the industry needs to improve, and will produce better ideas to implement more effective solutions.
Based on the similar awareness of the need for solutions, Eurogas-Marcogas did an LCA analysis (including investigation of acid rain) of identical amounts of energy service for heat, electricity and Combined Heat and Power, using detailed models of the European natural gas chain. This epoch-making analysis had the following results:
Figure 2.2 GHG emissions associated to the various steps of the life cycle of the 3 natural gas uses assessed in the Eurogas-Marcogaz LCA.
Note: Percentages indicated on the graphs are related to the contribution of the final use to the total life cycle
Looking at the total picture of the use of natural gas, the CO2 emitted at the time of consumption (during combustion) has the biggest greenhouse gas impact, more than 85%.
The greenhouse gas impact increases depending on the path of the supply chain. The large factors are the energy used at liquefaction plants and by compressors for long-distance pipeline transport.
Four issues were deemed of greatest importance:
1) Development of high-efficiency gas utilisation
2) Improvement of liquefaction-unit efficiency
3) Improvement of compressor efficiencies
4) Reducing associated gas flaring during production

29
Similar conclusions are shown in various studies and analyses, but with some variation in the numerical values. The largest effect is seen for utilizing gas with higher efficiency, i.e. greater CO2 reduction in combustion. Challenges in the supply chain are the reduction of direct CO2 emissions such as flaring, indirect CO2 emissions in energy use such as in liquefaction, and methane leakage.
Regarding methane leakage, the paper, “Methane's Role in Promoting Sustainable Development in the Oil and Natural Gas Industry” by participants in the Methane to Markets Partnership (now called Global Methane Initiative) presents case studies of mitigation activities over many years. It received the Best Paper Award during the World Gas Conference in Argentina. It discussed specific technologies that could be used to prevent leaks and venting of natural gas. In addition, it promoted the international implementation of economically viable projects and showed their solid performance and good outcomes.
Managing Methane: Building Block of Natural Gas and Potent Greenhouse Gas
Carey Bylin (USA)
As concerns about energy security and climate change grow, the world is increasingly looking to natural gas, the cleanest burning hydrocarbon resource, as a bridge fuel that will play a critical role in transitioning to a global clean energy model that includes more renewable energy resources. While it is true that burning natural gas emits a fraction of the carbon dioxide and other pollutants emitted by burning coal or oil, releases of natural gas to the atmosphere during the production, processing, transmission and distribution of natural gas can reduce the relative climate benefit of natural gas. In addition, these natural gas emissions represent a permanent loss of an economically valuable hydrocarbon resource. Implementing proven, cost-effective technologies and practices to reduce venting and fugitive emissions of natural gas ensure this clean burning energy source achieves the climate benefit throughout the natural gas value chain.
Methane is the principal component of natural gas, making up approximately 95% of pipeline quality natural gas. While methane is a source of clean energy, it is also a very potent greenhouse gas that can impact local air quality. According to the Intergovernmental Panel on Climate Change (IPCC) 4th Annual Assessment Report, the 100-year global warming potential of methane is 25, meaning that it is 25 times more effective than carbon dioxide at trapping heat in the atmosphere. Evaluated on a 20-year scale, methane has an even greater global warming potential of 72. Methane is also a precursor to the formation of tropospheric ozone, which at ground level is an air pollutant harmful to human health and toxic to ecosystems. Reducing methane emissions, in addition to reducing flaring and improving energy efficiency, is an integral part of a comprehensive approach to reducing greenhouse gas emissions and product losses from natural gas operations.
While energy efficiency and flaring reduction projects are very important, methane emission reduction activities have some key advantages. For example, while emission of carbon dioxide from combustion is one of the principal sources of greenhouse gases in the industry, projects to reduce these emissions require significant financial investment and may take years to implement, while methane emission reduction projects require significantly less - or no - capital investment, can be implemented in the near term, and pay back very quickly. Compared to flaring, methane emission reduction projects can have a greater impact from a climate change perspective. While the volume of gas flared in 2005 was significantly greater than the volume of gas leaked and vented (162 billion cubic meters (bcm) versus 102 bcm), gas leakage and venting had a climate impact nearly three times greater than gas flaring. That is, the relative climate impact, measured in terms of carbon dioxide equivalent, of methane venting and leakage was 1,618 million metric tons of CO2 equivalent (MMtCO2e), while that of flared gas was 400 MMtCO2e.
Methane emissions occur in the upstream oil industry and at all stages (production, processing, transmission and distribution) of the natural gas value chain. Emissions can be

30
the result of operational venting, such as normal operation of reciprocating and centrifugal compressors; unintentional leaks, for example through valves and connections; and routine construction or system disruptions that require blowdowns of pipeline segments or compressor stations. The U.S. EPA estimates that worldwide methane emissions from oil and natural gas operations totalled 111.6 billion cubic meters (Bcm) (1,595 MtCO2e) in 2010, and that this volume will increase to 125 Bcm (1,789 MtCO2e) in 2020. This represents $12 billion to $20 billion in lost revenue55 to the industry in 2010.
Globally, the volume of natural gas lost to the atmosphere through venting and fugitive emissions represents about 4% of worldwide net dry gas consumption, an amount greater than the volume of gas consumed by the United Kingdom or Japan in 2009. This represents an unnecessary loss of product and revenue as well as contribution to global greenhouse gas emissions. Methane has a relatively short atmospheric life of 12 years and a very strong near-term global warming potential, so methane reductions are being called out as a crucial part of the strategy to achieving short-term climate impacts. The oil and gas industry therefore has a unique opportunity to play a role in reducing methane emissions and contributing to the achievement of short-term global climate benefits.
Capturing leaked and vented methane emissions through changes to oil and natural gas industry technologies and practices can reduce emissions, while in many cases also decreasing costs and increasing revenues. Since 1993, the U.S. Environmental Protection Agency (EPA) has worked with the U.S. oil and natural gas industry to reduce methane emissions through the Natural Gas STAR Program, a voluntary partnership with oil and gas companies that promotes cost-effective methane emission reduction technologies and practices among all sectors of the oil and gas industry. Through 18 years of collaboration with industry, EPA has developed a comprehensive suite of technical information on methane mitigation activities that have been successfully implemented by the industry. The Natural Gas STAR Program to date has over 130 oil and gas corporate partners, 14 of which are international partners, who have achieved methane emission reductions of 27.8 billion cubic meters worldwide. The Natural Gas STAR Program has been extended internationally via the U.S. EPA’s participation in the Global Methane Initiative (formerly the Methane to Markets Partnership), under which the EPA promotes methane emission mitigation activities in oil and natural gas operations worldwide.
Methane emission reduction options identified by the oil and natural gas industry have a variety of capital requirements and include installation of new equipment, retrofits of existing equipment, changes in standard practices and improved construction procedures. While some of these mitigation options are capital intensive, for many others it is a matter of changing operational practices or choosing a technology option that emits less methane as a part of normal operations. Of the over 55 technologies and practices highlighted by the Natural Gas STAR Program, nearly one-fourth are estimated to cost less than $1,000 to implement, and over 40% are less than $5,000 to implement. In many cases, value is derived not only through emission reductions, but also through additional gas sales revenue, using natural gas to replace a more expensive fuel for onsite energy generation, reduced capital and operating costs, and important safety benefits. Utilizing gas value alone, many of these options pay back within 3 months to two years.
Natural gas’ role in the world energy mix will continue to grow into the future. To ensure this role continues to be positive from a climate, efficiency and local air quality perspective, the industry must remain vigilant about minimizing methane emissions from the oil and natural gas value chain. Companies today can achieve environmental, economic and safety benefits by implementing commercially-available, cost-effective opportunities to reduce natural gas losses to the atmosphere and instead direct that gas to beneficial use. Doing so will maximize supply and utilisation of a non-renewable hydrocarbon resource and ensure that the relative climate benefits from natural gas use extend to the whole value chain. 55 Depending on how the gas is valued.

31
Overview of Natural Gas Supply Chain
Exploration and Drilling
Prior to drilling for gas or oil, geological surveys and other preparatory steps must be undertaken. Once a survey indicates a promising well, the exploratory bore is made, to determine whether this is an oil or gas deposit. Usually, it is not clear beforehand whether a well will produce gas or oil. Therefore, during exploration for natural gas, it is very difficult at the outset to allocate the proportion of greenhouse gas emissions or energy usage to oil or gas, although the exploration was targeting gas as well as oil. Therefore, some life cycle assessments (e.g. for appliance efficiency standards) exclude exploration from the life cycle inventory and assessment. Other assessments such as U.S. EPA‘s mandatory greenhouse gas reporting program include an emissions inventory reflecting exploratory and production well emissions.
The drilling techniques used for exploration and developing boreholes are essentially the same as for oil. A drilling fluid (mud) is pumped into the drill pipe. This fluid consists of water, clay, polymers and suspended materials for density control.
Production and processing
Details of equipment used in extraction may depend partly on whether the production site is on- or offshore (in the latter case there may, for example, be extra compression) and whether the gas is associated to oil or not. For pre-production, reproduced fluid is generally discharged into the sea in offshore production, although it may also be injected, and re-injected together with formation water in onshore production.
The raw gas is isolated from solids and fluids by flashing, the so-called primary separation. The isolated raw gas will have an elevated temperature due to the higher temperatures in the reservoirs and a pressure of several to several hundreds of bars.
In some areas, natural gas is sweet and dry when it comes out of the ground, containing no sulphur and only small amounts of heavy hydrocarbons. In such areas, no further processing is required beyond the removal of produced water, and the gathering lines feed the gas directly into transmission lines.
In other areas, the gas is not of sufficient quality for end use. In some cases, there may only be pre-processing offshore, with subsequent transport – after compression – of the gas for further onshore treatment. Further processing basically involves the separation of the methane fraction (CH4) in the raw gas from co-products or pollutants such as water vapour, acid gases (CO2, sulphurous compounds), nitrogen (N2), condensable hydrocarbons (C5+), and ethane, propane and butane.
The principal service is provided by a natural gas processing plant. Mainline transmission systems are designed to operate only within certain tolerances of specific gravity, pressure, hydrocarbon dew point (HCDP), BTU content range, and water and H2S content to avoid operational problems. The objective is not only to produce pipeline quality dry gas but also to remove higher hydrocarbons from the natural gas and separate into fractions such as ethane, propane, and butane. Most treatment processes require electricity for valves, pumps, etc. If the gas is offshore or in a remote area, then electricity for production and treatment is often generated onsite.
Figure 2.3 shows the major sources of greenhouse gas emissions in the flow of exploration, gathering and processing. This will be explained in more detail in Chapter 3.

32
Figure 2.3 Technological processes that create methane and CO2 emissions
During processing, direct CO2 emissions come from flaring, exhaust pipes, gas compressor units, boiler house chimneys, heaters, (auxiliary) power stations and vent stacks. CH4 leakage could come from unsealing of equipment (welding joint, flange and thread joint, etc.), casing head gas and horizontal and sub-horizontal wells.
Energy consumption and emissions at the processing stage depend on the quality of the raw natural gas. Methane emissions and the amount flared do not depend on the gas quality but rather reflect the technology used. After gas is collected from various wells and, if necessary, is processed, the gas goes to a compressor station where it is sent into the long-distance pipeline. The entire process consumes power.
Gas gathering at the wellhead
Gathering systems consist of a series of pipes that collect natural gas and transport it to the larger transmission pipeline. This begins at the wellhead and goes through a series of piping systems that consolidate gas from different wells. The pipeline directs the flow either to a natural gas processing plant or directly to a main transmission pipeline system depending upon the initial quality of the wellhead product.
In order to reduce greenhouse gas emissions and energy consumption, the following points in the process of exploration and gathering are important: modernizing dehydration, monitoring compressor vents, enhancing the efficiency of processing equipment, replacement of pneumatic devices and valve equipment, LPG use for onsite generation (power for the compressor), improving igniters, system optimization and energy efficient compressors.
GE Energy: Flare Gas Reduction - recent global trends and policy considerations
Associated gas flaring is one of the most challenging energy and environmental problems facing the world today. Approximately 150 billion cubic meters of natural gas are flared in the world each year, representing an enormous waste of natural resources and contributing 400 million metric tons of CO2-equivalent global greenhouse gas emissions. Environmental degradation associated with gas flaring has a significant impact on local populations, often resulting in loss of livelihood and severe health issues.
The technology to address the problem exists today and the policy reforms required are largely understood. However, deeper issues regarding infrastructure development and market design hinder progress in the places where gas flaring is most rampant.
Figure 2.4

33
Transmission
Natural gas transport from production to consumers occurs either by liquefaction or through transmission and distribution gas pipelines.
Before entering the pipeline network, natural gas first undergoes dehydration and separation at the production site. It is then highly compressed for long-distance transmission through the large-diameter pipeline network. During transmission, natural gas loses pressure due to friction with the pipe walls, and this is compensated for with compressor stations situated at intervals of 60 to 160 km. If conditions on a specific pipeline cause the gas to lose even more pressure than usual, the pressure of the natural gas must initially be very high. For instance, on a section of pipeline crossing a seabed, it is difficult to build compressor stations, and the water pressure can further reduce the pressure.
The transmission process causes environmental impact. For international gas pipelines, the major impact comes from the gas combustion to run the compressor stations. The impact is larger with increased distance. Some of the critical points in the transmission process for gas consumption are turbine compressors that burn natural gas at compressor stations along the way, electric motors and gas engines, power generation, and leaks of methane gas – fugitive emissions – during transmission. At compressor stations, gas becomes hot as it is compressed, and some fuel is burned during the cooling process.
In the above four areas, gas is the usual fuel for engines and motors. This is because of the combination of ready access to natural gas from the transmission pipeline itself and difficulties with alternatives, such as geographic remoteness from the nearest power grid.
For each point at which energy is used, measures to reduce the environmental burden are needed, such as high-efficiency turbine compressors, high efficiency onsite generators and utilisation of waste heat and renewable energy.
Findings by the Wuppertal Institute study of 2005 are often quoted. The study involved direct measurement and analysis of methane emissions from the 6000 km-long Russian pipeline system. It was found that approximately 3% of the gas was lost to leakage. This is of major environmental concern. Fugitive emissions of natural gas from Russia to the German border are equal to about 1% of transported volume on average. National high-pressure transmission pipelines in European countries have a similar negative environmental impact, however, at shorter distances, the environmental impact is lower.
It should also be noted that other operations besides gas transmission may release methane, such as extension of pipelines and inspection and maintenance of the associated facilities.
A variety of technologies for preventing methane leaks were demonstrated under the multilateral Methane to Market Partnership (now called the Global Methane Initiative). The transmission pipeline network also has a valve system to manage the gas pressure.
The transmission network may have other facilities at the junction of many pipeline systems, such as mixing stations or blending stations, which combine gas from different production areas with different characteristics and calorific values. One of the functions of a mixing station is to create gas with a uniform calorific value. After the quality is adjusted to the appropriate level, biogas is sometimes injected to the pipeline. This injection is done by a compressor, which consumes more electricity or natural gas.
At the receiving end, natural gas is adjusted for its quality, temperature, and pressure and is odorized. The volume of the gas is measured at metering stations, and the flow is monitored before entering the city gate station, where it is sold to customers such as local distribution companies. In the local distribution network, most customers receive gas at low temperature and low pressure. There is no need for compression over short distances. However, some large industrial customers may receive higher pressure gas supplied from larger diameter

34
lines at short distances. In such cases it is advisable to ameliorate the environmental impact using methods like those for mainline transmission pipeline networks.
Storage
The environmental impact of natural gas storage is primarily the result of natural gas combustion in turbines and motors. It also comes from the power consumption of electric motors and other electric loads. Gas storage facilities may be built in conjunction with the pipeline to accommodate seasonal demand. Storage may also be utilized for adjusting the supply pressure or supply volume. Gas is compressed for injection into the storage or reservoir, often underground, using gas turbines, gas motors, or electric motors. During re-injection of the gas into the pipeline, energy is used to dehydrate, condition and purify the gas.
In order to reduce the environmental impact of natural gas storage, better technologies such as higher efficiency gas turbines, gas motors, and electric motors for gas injection can be used. Additional measures include improving the efficiency of dehydration and purification facilities and designing them to prevent entry of vapour or impurities.
Figure 2.5 Natural gas flow
LNG Liquefaction Plant
Liquefied natural gas (LNG) is a convenient means of transporting natural gas from production areas to consumers, where it is technically or economically difficult to build transmission pipelines. LNG is regasified at the receiving terminal and is supplied to end users by local distribution companies.
In the liquefaction process, refrigerants are used to cool the gas to approximately -160°C. The temperature cannot be greater than -82°C regardless of pressure, because the critical temperature for methane, a major element of natural gas, is -82°C; therefore it does not liquefy above this temperature.
There are many liquefaction processes developed so far. They differ in type of refrigerant, type of deep cooling, and/or type of heat exchanger.
The two major liquefaction methods in use are CASCADE and C3-MCR. CASCADE has three stages of cooling. Each uses pure component refrigerants: propane, ethylene and methane. C3-MCR uses mixtures of nitrogen, methane, ethylene, and propane. Many liquefaction plants use the C3-MCR method.
Liquefied natural gas processing can be roughly divided into five parts: pre-treatment, acid gas removal, dehydration, liquefaction and heavier hydrocarbon separation.
During pressurization and cooling of the gas, the heavier hydrocarbon fractions such as ethane, propane, and butane are liquefied and separated. The gas is further cooled until the

35
methane is liquefied at very low temperature. Boil-off vapour from the LNG tank at the liquefaction plant is usually compressed and used as fuel for power generation, but some plants unfortunately flare it. Once natural gas is liquefied, it is pumped into LNG tankers.
Processing efficiency is an important environmental factor. It can be influenced by weather or atmospheric temperature as well as by technology. LNG liquefaction technology is constantly improving, and newer plants tend to be more efficient. Environmental measures can include increasing the efficiency of power generating gas turbines, utilizing waste heat, increasing the efficiency of compressors, putting boil-off gas to good use instead of flaring it, increasing the efficiency of pumps and preventing fugitive emissions and leakage of methane. Such measures can reduce both energy use and direct GHG emissions.
LNG Tankers
Natural gas is converted to LNG at liquefaction plants and transported over long distances by LNG tankers. There are two major means of creating higher-efficiency tankers: increasing the size to carry larger volumes of LNG, and designing them to reduce friction with air and seawater during maritime transport. Improvements can also be made in components of the ship’s propulsion system such as engines and motors. Technology to improve performance, utilisation of advanced, computerized control systems and use of renewable energy can all contribute to environmental performance. For instance, out of the three propulsion systems – gas or oil boiler with steam engine, gas re-liquefaction and low speed diesel engine, and gas or oil diesel engine and electric motor – the steam engine is the one most commonly used today.
In the past, the use of diesel engines increased rapidly for energy conservation. However, steam engines are more popular these days and a new high-efficiency steam turbine, the Ultra Steam Turbine, has been developed. Steam engines use boil-off gas, which is a low-sulphur fuel. (However, some engines use heavy oil for economic reasons.) One technology for promotion of efficiency is the use of waste heat to preheat the fuel, which works basically the same as for industrial boilers.
LNG receiving terminal
The major functions of LNG receiving terminals are: (1) regasification of LNG, (2) in some countries, calorific value adjustment by adding LPG, and (3) pressurization of the natural gas for supply to customers. These processes all use energy.
Reduction of energy usage at critical points in the process is a big concern. CO2 is emitted mainly from equipment for regular and emergency generation, but also from heating units such as LPG vaporizers and water heaters. Electricity is also used to drive pumps and compressors.
Methane is another concern. Releases are the result of purging prior to maintenance of equipment and facilities and of leaks from defects in apparatuses during normal operation. Some release may occur due to gas bleed-off during the gas quality testing process.
Figure 2.6 LNG flow

36
Satellite supply (coastal vessel, truck)
The satellite supply method is used for consumers of natural gas, primarily industrial, in areas where the consumers are located far from the pipeline grid and extension of distribution pipelines would be difficult. In this case, the gas is transported as LNG by tank truck, railcar or ship to secondary receiving (satellite) terminals, where it is stored in tanks at the ultra-low temperature of approximately -160°C. It is regasified when needed. It is adjusted for calorific values and odorized, and then sent through distribution lines.
Satellite terminals are generally designed for distribution of low-pressure gas and are usually designed without LNG pressurizing equipment.
Distribution
Distribution is the final step in delivering natural gas to end users. While large industrial, commercial and electric power generation customers get natural gas directly from high capacity pipelines, i.e. high pressure gas, most other users receive natural gas from local distribution companies through small-diameter low pressure distribution lines.
Natural gas flows under high pressure to custody transfer stations or pressure regulator stations where the pressure is reduced before entering the distribution pipeline system. Because the gas need not be pressurized in the delivery process, compressors are unnecessary.
However, a pressure regulator is needed to lower the high pressure at the receiving end to medium pressure for usage. To prevent freezing, it may be necessary at times to consume energy to heat the gas. In some countries there may also be leakage of gas from old cast iron pipe joints.
Figure 2.7 LNG satellite terminal
Figure 2.8 Gas distribution
37
Chapter 3 - BEST PRACTICES AND TECHNOLOGIES OF GREENHOUSE GAS EMISSIONS REDUCTION: Exploration,
Production and Storage
Introduction to Greenhouse Gas Emissions from Exploration, Production and Storage
The upstream of the gas production chain consists of field exploration and extraction of hydrocarbon resources. Exploration is a complex set of activities for assessment of the production capability of the field in terms of gas, condensate, or oil. Once the field is located and assessed, it becomes necessary to prepare it for further development. This includes drilling of exploration wells, conducting of studies needed for the calculation of the identified field hydrocarbon reserves, and development of the field project design. Exploration activities create a number of results. Reservoirs are delineated. Studies are done of porosity and permeability, capacity and gas saturation gradient, and the variations of these parameters square and profile. The physical and chemical features of water, gas and condensate and the well debit are determined. It should be noted that this guide covers only associated gas that is put into the commercial market; it does not cover circumstances in which produced associated gas is flared upstream due to lack of a natural gas market or other operational constraints.
Several methods are very effective for identification of the best places to explore for gas. These include theoretical projections, modelling, air-photo scouting and space surveys. These can achieve high accuracy with the least environmental impact. This low-impact principle is being followed more and more in gas and condensate extraction. Application of modern drilling technologies results in an increase in the amount extracted as well as a decrease in material costs and the number of wells drilled.
Conventional and unconventional natural gas formations are located underground and below sea floors at a depth of 1,000 metres to several kilometres. Gas is trapped in microscopic niches in the interior of the earth (pores). Pores are connected with microscopic channels. These are cavities through which the gas flows from higher pressure pores to lower pressure pores until it enters the well. The gas flow within the rock is determined by the rock’s geological characteristics.
Gas is gathered from onshore field wells through well flow lines. The well organization implies the even distribution of wells along the field territory, which lowers the well pressure steadily. The gradual lowering of the well pressure prevents gas cross flow and premature flooding of the reservoir. The gas is vented from the earth via wells. The mass of the overburden rock exerts a force that is many times atmospheric pressure. Thus the driving force is the pressure difference between the rock and the collector wells.
Unconventional gas formations such as tight sands, deep coal seams and shale are the primary focus of gas production in North America and of great interest in other parts of the world. Evaluation of productivity and production from these reservoirs may require hydraulic fracturing. Hydraulic fracturing is a rapidly developing drilling technology that pumps large quantities of water with an emulsion of “proppant” (typically sand) into the well and into the reservoir. This is done under high enough pressure to fracture the reservoir rock and greatly expand the open face of formation rock to allow gas to flow to the well. Backflow of fracture water, excess sand proppant and eventually formation fluids and gas can result in the venting of large quantities of methane gas to the atmosphere.
During production of natural gas, whether conventional or unconventional, onshore well pads can include one or multiple well heads, wellhead separators, a compressor, condensate tanks, a glycol dehydrator, and several natural gas powered pneumatic control devices. All of these emit GHGs in the form of combustion CO2 and/or emissions of methane into the atmosphere. Offshore production is conducted on platforms with several decks to house the

38
gas-liquid separators, gas compressors, oil storage, gas dehydrators and gas flares. This equipment on offshore platforms is similar to onshore production except it is generally larger, with many wells flowing into a single platform. The same GHG emission sources exist on offshore platforms but some sources have higher emission rates.
In older gas reservoirs, gas pressure and flow velocities up the wells are depleted. These wells can become so loaded with water and condensate liquids that the gas flow to the surface is decreased by the back-pressure of the gas-gathering pipeline. A common practice is to vent these wells to the atmosphere periodically to “blow-out” the accumulated liquids. This uncontrolled venting of methane gas can be a large source of methane emissions from producing gas wells.
Crude oil and condensate are gathered from the wellhead separators into field stock tanks. The oil and condensate are pushed into the atmospheric-pressure tanks by gas pressure in the wellhead separator. When the oil enters the stock tank, gas dissolved in the oil under pressure ”flashes” out of the liquid and often vents to the atmosphere. This is another large source of methane emissions. In some isolated locations, the gas released from the produced oil at the gas-liquid separator is disposed of by burning in field flares. This is one of the largest avoidable sources of combustion CO2 emissions in the production and transportation of natural gas.
In remote unmanned production, gathering and transmission sites, automatic control of process equipment is often powered by the pressure of the natural gas using pneumatic valve controllers. These include liquid-level controls in gas-liquid separators, pressure controls on compressors and temperature controls on glycol dehydrator regenerators. While individual control devices have small emissions levels, the very large number of these devices adds up to a large share of methane emissions.
The produced gas often needs processing before it enters the transmission pipeline and reaches the end consumer. This is necessitated by the presence of various mixtures besides the target components in the gas content, which could complicate gas transmission. The high content of water, liquid hydrocarbons, and non-hydrocarbon gases in the produced gas creates many problems. It decreases the pipeline gas throughput and the capacity of the compressor stations. It accelerates equipment corrosion, which results in an increase of the use of inhibiting agents. It increases the frequency of accidents and incidents at compressor stations and site pipelines. And it lowers system reliability.
There are different methods of gas processing. One involves construction of a gas processing plant very close to the field, which scrubs and dries the gas in absorption towers.
Despite improvements, gas and condensate production facilities have a substantial impact on the environment. This effect is observed at each stage from drilling of exploration wells to end use and involves atmospheric pollution and emissions of greenhouse gases including CO2 and methane. Realizing their responsibility, companies are working on environmental protection measures, including accounting of methane and CO2 emissions.
Production activities at industrial facilities result in process and fugitive emissions of pollutant substances, including greenhouse gases. The major greenhouse gases emitted during exploration, production and storage of natural gas are methane and CO2. Greenhouse gas emissions are divided into combustion emissions (primarily CO2), process emissions (methane and CO2) and fugitive (mainly methane).
The major sources of combustion and natural gas process emissions at gas and condensate production facilities are flares, exhaust pipes on engines and turbines, gas venting from well drilling with hydraulic fracturing, venting from expelling liquids from gas wells, venting from crude oil and condensate production tanks, gas compressor seals, chimneys of boiler houses, heaters and auxiliary power stations, vent stacks (valve position “open”) and (in all of the above equipment) vents from gas powered pneumatic control valves.

39
The majority of fugitive emissions sources originate from onshore process equipment, particularly the unsealing of the equipment in operation (welding joint, flange and thread joints, etc.) due to the imperfect leak integrity of the fittings. Fugitive emissions result in a loss of useful products, hence assets.
The global community has considerable expertise in detection and assessment of methane leak emissions from gas extracting facilities, which includes tools for measurement studies and subsequent analysis of data gathered. Methane emissions studies in the gas sector employ state-of-the-art technologies for methane leak emissions assessment. Specialized detection and measurement equipment is required since, prior to odorization, the gas is odourless and colourless and emissions can go unnoticed. These studies determine actual methane-emission sources and minimize both environmental risks and financial losses.
Figure 3.1 Technological processes that create methane and CO2 emissions
Detection technologies include specially designed infrared (IR) cameras that provide real-time images of gas leaks and vents and infrared laser devices that provide a digital measure of beam absorption by methane and an audible signal when pointed at a leak. IR cameras work on the principle that hydrocarbon emissions absorb infrared light in a certain wavelength (spectral range of 3 to 5 microns) and surveys with this equipment produce a moving image of (otherwise invisible) gas plumes due to the gas’ absorption of IR light. These technologies can be operated with handheld devices or from helicopters or airplanes to quickly survey cross country pipelines and remote, widely separated field equipment such as wellheads and oil or condensate field tanks.
At primary stages of production-site development, environmental impact studies enable the operator to meet environmental safety requirements and prevent negative anthropogenic events. Production sites can then be deployed in a way that lowers possible negative impact and methane discharge into the atmosphere. Designing a site to minimize greenhouse gas emissions is a more cost- and operationally-efficient way to achieve reductions than retrofitting existing sites. During the operation of production sites, companies have become more attentive to modernization and timely replacement of parts in process equipment and adjacent pipelines.
A considerable number of projects are being implemented in the areas of modernization of gas dehydration, efficiency enhancement of process equipment operated at gas fields, replacement of pneumatic devices and valve equipment, optimization of gas well operations and flare units, utilisation of associated petroleum gas and utilisation of natural gas vented

40
from reservoirs and process equipment. A large number of projects refer to the production site design, which is aimed at locating the facility in a way to reduce the probable negative environmental impact and methane emissions. It is noteworthy that the energy efficient technologies and practices of greenhouse gas reduction in the sector of extraction described in this chapter are also suitable for the storage sector.
Table 3.1 List of measures to reduce greenhouse gas emissions
Type of activity Measures
Exploration and extraction
1 Optimization of the field operation and development. 1.1 Application of heating technologies for well casing and tubing.
1.2 Hydraulic efficiency improvement for the Well - Production Site Pipeline system.
2 Optimization of extracting and processing operations. 2.1 Use of more energy-efficient process equipment and materials.
2.2 Improvement of booster-compressor station energy efficiency, Reconstruction and modernization of compressor fleet.
3 Gas dynamic and geophysical studies using telemetric media to avoid gas discharge.
4 Using associated petroleum gas to supply the needs of a field site.
Gas storage
1 Reduction of gas loss during storage facility operation and maintenance. Reduction of the technological gas loss.
2 Reducing costs of auxiliary production technological needs.
3 Adoption of automated control systems, telemechanics and enhancement of gas measuring and control devices.
4 Replacement and modernization of process equipment at gas storage facilities.
5 Reduction of buffering gas in reservoirs. 6 Pumping of associated petroleum gas into rock. 7 Optimization of storage facility operations.
Major Sources of Methane Emissions and Emission Reduction Technologies
This section briefly describes the major sources of methane emissions in oil, gas and condensate production, and the technologies and practices that can capture or prevent these emissions. As discussed above, the segments of the production industry where methane emissions occur begin with gas well drilling, then gas production operations on the well pad, gas, oil and condensate gathering and field pumping/compressor stations, and, in all this equipment, gas powered pneumatic control valves and fugitive emissions. Offshore production has many of these same sources in very crowded offshore platforms with generally larger equipment and often larger emissions.
Oil and gas well drilling completion generally does not create large quantities of gas venting or flaring unless the gas reservoir is hydraulically fractured. The backflow of fracture fluids with entrained reservoir gas is normally vented or flared over an earthen impoundment. Reduced Emission Completions provide specially designed equipment to separate hydraulic fracture backflow water and sand from reservoir gas, such that the gas can be directed to a gas gathering pipeline. Sales of this captured gas often pay for the equipment used in capturing it.
Gas production operations in depleted gas reservoirs are often plagued by liquids (mainly water) accumulating in the tubing, which eventually stops gas flow. Without special equipment, operators must “blow” the liquids out of the tubing to the atmosphere to re-establish gas production flow. Several options to avoid blowing (or “unloading”) wells to the

41
atmosphere include Installing Plunger Lift Systems in Gas Wells and Options for Removing Accumulated Fluid and Improving Flow in Gas Wells. The last includes installing velocity tubing strings and using foaming agents to unload liquids, so as to avoid well blowdown emissions of methane.
The projects on efficiency enhancement of crude oil and natural gas gathering from wells are also noteworthy. These projects balance the growth of the extracted amounts with the appropriate investments. Operations are also noteworthy. Natural gas wells that produce through tubing may collect methane and other gases in the annular space between the casing and tubing. This gas, referred to as casing head gas, is often vented directly to the atmosphere. There are ways to utilize this gas, thus avoiding gas venting and loss of useful resources.
Some oil production reservoirs and offshore platforms do not have access to gas pipelines, and these dispose of the associated gas by burning it or venting it. Even when there are pipeline connections to gas collection systems, oil and condensate tanks may vent methane-rich gas to the atmosphere. Oil and condensate stock tank emissions are captured by Installing Vapour Recovery Units on Storage Tanks. This same technology can be used to capture oil wellhead casing gas emissions if operators Connect Casing to Vapour Recovery Unit or Install Compressors to Capture Casinghead Gas. Another approach when oil and gas production is declining and original equipment is oversized to handle current capacity is to Eliminate Unnecessary Equipment and/or Systems. For condensate collected by tank truck or pumped to a pipeline, methane emissions can be reduced by Installing Pressurized Storage of Condensate, and Recovering Gas during Condensate Loading.
Wellhead compressors are often in remote areas, and the piston rod packing equipment may become worn and have excessive leakage. Rod alignment as a maintenance practice should be conducted at regular intervals. Reciprocating compressor rod packing is normally designed for small leakage, which can grow large when packing is not installed properly or operators do not replace the packing rings (and rods) often enough. Reducing Methane Emissions from Compressor Rod Packing Systems entails using company-specific financial objectives and monitoring data to determine emission levels at which it is cost-effective to replace rings and rods (based on the value of saved gas). Benefits of calculating and utilizing this “economic replacement threshold” include methane emission reductions, cost savings, and operational benefits, including a longer life for existing equipment, improvements in operating efficiencies, and long-term savings.
On offshore platforms, centrifugal compressors with wet (oil) seals can be a major source of methane emissions from venting of natural gas when the seal oil is de-gassed and that gas is released to the atmosphere. This can be prevented by Replacing Wet Seals with Dry Seals in Centrifugal Compressors. Dry seals, which use high-pressure gas to seal the compressor, emit less natural gas (up to 6 scfm), have lower power requirements, improve compressor and pipeline operating efficiency and performance, enhance compressor reliability, and require significantly less maintenance. Dry gas seal technology may not always be cost-effective, especially when retrofitting older centrifugal compressors. In such cases, there are available alternative methods to capture gas for use as fuel, such for high pressure turbine fuel gas and low pressure engine or heater fuel gas.
All of these production sector gas emissions sources, vented and fugitive, are typically odourless (unless containing hydrogen sulphide) and colourless, and therefore go un-noticed. Projects on replacement of various parts and elements of site pipelines include broad scale field measurement studies of methane leaks, involving different measurement and detection media. Regular repair aimed at preventing the leaks from growing over time has become a common practice. Although the implementation of such projects results in considerable resource saving, they consume much time and the financial benefit can be assessed from a long-term perspective.

42
Larger operators are finding that using IR cameras can be cost effective to periodically Conduct DI&M (Directed Inspection and Maintenance) at Remote Sites.56 DI&M is a voluntary screening practice in which operators use specialized equipment to identify methane emissions and then measure those emissions in order to prioritize repairs. While these cameras do not quantify the emissions, the visual image is an indicator of the largest emission sources, and the DI&M technical documents discuss the instruments and methods to quantify those emissions to help determine the economics of recovery. IR leak-imaging cameras are revolutionizing the methane emissions control efforts of production companies.
Operators find that they can reduce gathering system emissions when they Inspect Flow-lines Annually, which is cost-effective with aerial leak detection using infrared leak imaging cameras. Infrared laser leak detection can reduce the cost and improve the accuracy of identifying pipeline leaks.
The natural gas production sector has a very large population of gas pneumatic controls at wellheads and gathering/booster stations on compressors, dehydrators, and gas-liquid separators. In remote areas, with no electrical power, the pressure of gas production is used to power automated control valves for level control, pressure control, temperature control and flow control. Options for Reducing Methane Emissions from Pneumatic Devices in the Natural Gas Industry covers replacing high-bleed instruments with low-bleed or snap-acting non-bleed controllers. At gas gathering stations with a large population of controllers and electrical power available, one can Convert Gas Pneumatic Controls to Instrument Air. For liquid level controllers, one can Convert Pneumatics to Mechanical Controls.
The projects on modernization or replacement of gas dehydrators can also reduce methane emissions. Modern dehydrators have a higher efficiency that can improve the dehydration process, which in combination with advanced technological solutions eliminate methane emissions from glycol circulation pumps, gas strippers, and most of the still column effluent. In addition to methane-emission reduction, the resultant gas and financial savings enable such projects to have a short payback period (1-3 years). These methane emissions reduction technologies include Replacing Gas-Assisted Glycol Pumps with Electric Pumps. Where there is no electricity available, the pneumatic gas can be reduced or captured by Optimizing Glycol Circulation and Installing Flash Tank Separators in Dehydrators. When there is a crude oil or condensate stock tank, one can Pipe Glycol Dehydrator to Vapour Recovery Unit.
Operating practices that can reduce methane emissions include Rerouting Glycol Skimmer Gas (non-condensable vapour from the glycol re-boiler vent) to the re-boiler fire tubes to replace fuel gas. In some cases of high-pressure, low-temperature gas, one can Replace Glycol Dehydrators with Desiccant Dehydrators or Replace Glycol Dehydration Units with Methanol Injection to move the wet gas to a processing plant where it will be fully dehydrated. In remote, un-manned sites such as wellhead dehydrators, operators should Install BASO® Valves to shut off the fuel gas flow should the flame go out, in order to avoid methane venting.
Process equipment efficiency improvement can not only increase equipment productivity but also decrease the loss of saleable product and energy demand (hence emissions of methane and CO2).57
There are quite a number of technological solutions that facilitate greenhouse-emission reductions due to flaring. One of the most efficient practices is the utilisation of associated petroleum gas and its subsequent compressing for energy generation. Installing Electronic
56 However, the high cost of IR leak-imaging cameras often greater $90,000 per camera) may price this
technology out of range for small operators. 57 Another interesting practice used in gas field development is the sorption and capacitance method of gas
product humidity determination. This can reduce gas product losses.

43
Flare Ignition Devices is being used more frequently. They are designed as sparking pilots, which require low electrical power. Operators can also Install BASO® Valves.
Another example of greenhouse gas emission reduction is the use of gas reciprocating power generators which utilize flare gas. The application of this technology can decrease greenhouse gas emissions per unit of energy generated, both at the production site where flaring takes place and at large heat and power stations. These units are designed to be able to work autonomously and in combination with the existing gas power generators. An alternative to reciprocating engine driven generators is the use of micro turbine generators to generate electricity from low quality, low pressure gas. Drilling of horizontal and sub-horizontal wells is being implemented with zero methane emissions, as the wells are permanently online during operation without any interruptions. This practice reduces the time required for exploration and reduces gas emissions.
Modern companies implement specific environmental programs and invest heavily in environmental protection measures. This enables them to meet sustainable development criteria and to elevate their international competitiveness.
Table 3.2 Emission Sources and Reduction Technologies 58
Source Category Emissions Source Reduction Technology
Compressors /Engines
Wellhead compressor emissions (reciprocating)
Reducing Methane Emissions from Compressor Rod Packing Systems
Compressors /Engines
Offshore platforms with centrifugal compressors: Venting of gas entrained in the seal oil
Replacing Wet Seals with Dry Seals in Centrifugal Compressors
Dehydrators Emissions from gas-assisted glycol pumps on dehydrator units
Replacing Gas-Assisted Glycol Pumps with Electric Pumps
Convert Gas-Driven Chemical Pumps
Dehydrators Emissions from glycol dehydrators Optimize Glycol Circulation and Install Flash
Tank Separators in Dehydrators Pipe Glycol Dehydrator to Vapour Recovery Unit
Dehydrators and Valves Other dehydrator emissions
Reroute Glycol Skimmer Gas Replace Glycol Dehydrators with Desiccant
Dehydrators Replace Glycol Dehydration Units with Methanol
Injection Install BASO® Valves
Other Field flaring emissions when the flame is out Install Electric Flare Ignition Devices
Other (Fugitives) Fugitive emissions from wells Conduct DI&M at Remote Sites
Pipelines Gathering system emissions Inspect Flowlines Annually Pneumatics /Controls Pneumatic device emissions Options for Reducing Methane Emissions from
Pneumatic Devices in the Natural Gas Industry Pneumatics /Controls
Pneumatic device emissions(at gas gathering stations)
Convert Gas Pneumatic Controls to Instrument Air
Pneumatics /Controls Liquid level controller emissions Convert Pneumatic to Mechanical Controls
Pneumatics/ Controls and Valves
Flare emissions Install Electronic Flare Devices Install BASO® Valves
Tanks Oil and condensate stock tank emissions Install Vapour Recovery Units on Storage Tanks
58 Many technologies shown above can be found in the section “Recommended Technologies and Practices” on
the USEPA Natural Gas STAR web site.

44
Tanks Condensate tanks collected by tank truck on pumped to a pipeline
Install Pressurized Storage of Condensate Recover Gas Condensate Loading
Wells Oil wellhead casing gas emissions Connect Casing to Vapour Recovery Unit Install Compressors to Capture Casinghead Gas
Wells Vented emissions during completions of hydraulically fractured gas wells Reduced Emission Completions (RECs)
Wells Gas well venting to remove liquids accumulation in well tubing
Installing Plunger Lift Systems in Gas Wells Options for Removing Accumulated Fluid and
Improving Flow in Gas Wells
Wells Well blowdown emissions(less severe liquids loading in a well)
Install Velocity Tubing Strings Use Foaming Agents
* Detailed explanations of the Best Practices are shown in the attached CD.

45
Chapter 4 - BEST PRACTICES AND TECHNOLOGIES OF GREENHOUSE GAS EMISSIONS REDUCTION: Pipeline Transmission System, LNG and Distribution Network
The two basic methods for long distance transport of natural gas, from remote gas fields to end-user/consumer areas, are natural gas high pressure pipeline transmission and shipping of liquefied natural gas (LNG).
Transmission through high pressure pipelines is an important transport infrastructure for natural gas through which large quantities of energy can be moved over distances of several thousand kilometres. Different technologies are used in this process. This process will be discussed first, along with the characteristics of various emissions, emissions regulations and ways of reducing emissions. Then a description will be given of the LNG basics and main process steps such as liquefaction, LNG shipping and gasification.
Introduction to the pipeline transmission system
Transmission of natural gas is made by either pipelines or via shipping. Pipeline transport is less costly, with some exceptions, at distances below 4,000 km.
Pressure is required for gas to move through the transmission pipeline. Friction between the gas and the pipe results in a pressure drop along the way. After 100 to 150 km the initial pressure has decreased so much that it becomes necessary to increase the pressure to restore the reasonable flow. This is done at compressor stations, and these use energy. The gas flowing inside the pipeline is usually utilized as the fuel to generate this energy.
Figure 4.1 Pipeline pressure maintained by compressor stations
Transmission of natural gas is highly subject to seasonal fluctuation. Industrial consumers and power stations are relatively steady consumers of gas throughout the year, and therefore, the gas needs to be supplied to them in warm seasons as well. The customers who need gas only for heating purposes during the winter use a great deal of gas but far less during the summer. This influences the flow of gas and how the compressors are used. During summer, the gas in the pipelines may move at walking speed, sometimes as slow as at 5 km/h; in winter, on the other hand, the gas velocity can reach or exceed 50 km/h.
Long-distance transmission of natural gas is often done through a high pressure transport system in huge pipelines. Higher pressure means higher energy flow.
The higher the pressure, the more gas can be transported. But the amount of energy used by the compressor must also be taken into account. Doubling the gas pressure means the compressor needs to do eight times the work and use eight times the energy. The other

46
factor to consider is the pressure on the pipeline. Deep water creates higher external wall pressure and influences the pipeline. The gas pressure ranges up to 100 bar in onshore pipelines, but in offshore pipelines the pressure can be even greater.
Gas is distributed to consumers at much lower pressures, and pipelines are much smaller, e.g., less diameter. Although the exact definition differs depending on each country’s regulations and each corporation’s rules, in general, transport higher than 5 bar is called transmission and anything lower is distribution.
Naturally, gas producers are interested in delivering at a constant flow throughout the year. Customers, on the other hand, usually have a seasonal usage profile. The conflict between demand and supply are often addressed by utilisation of underground gas storage. During the summer, natural gas is fed into storage. It can be used during the cold winter times to respond to peaks in consumption or serve as reserves in case of supply interruptions.
Pipeline systems
The network of main transport pipelines is a highway system for gas transportation. The diameter of the pipes ranges from 140 cm to 30 cm (56 inches to 12 inches) or even less. Pipes are made of various grades of steel protected by a cathodic corrosion-resistant finish. If a big flow of gas is needed, parallel pipes may be installed. Sometimes as many as up to 10 pipelines are constructed side by side. The gas highways are interlinked at various points along the line to improve supply security in case of disruptions.
With valve systems, the additional transmission capacity can be used. Valves permit the opening up of “new lanes on this gas highway” or can isolate sections of the line so that a specific gas flow can be shut off for such purposes as pipe repair work. Sometimes the link between two pipelines must be closed. Usually, valve stations are spaced at intervals of 30 km for long transmission pipeline systems. Distance can be shorter when there are more interlinks.
Pipelines have main shutoff valves and bypass valves installed at switching points as well as at some other locations. Smaller bypass valves are used first to gradually balance pressure differences, and then the main valve is opened after the gas pressure has been equalized.
Before the gas is transferred to the main pipelines, the gas must be cleaned for transmission. Sand, water, condensate and other impurities are removed by the producers according to the contracts. Gas is purchased in delivery installations at some specified condition. After processing, gas may still contain a very small amount of higher hydrocarbons. They mainly come from compressor sealing systems at the compressor bearings. Condensation comes from precipitate in the parts in the system that are at lower elevations, e.g. in valleys. Special condensate traps are installed where necessary keep the system dry.
Figure 4.2 Building phase
Figure 4.3 Pipeline after one year
Pipeline operation does not impact the environment. Environmental impact occurs mainly at the time of construction. All foliage and plants are displaced where the pipes will be laid and

47
facilities will be built. Additionally, the maintenance work may remove additional overgrown foliage. No trees or tall foliage are allowed to grow on the corridor. Equipment used for pipeline systems are pipelines of different sizes and valves of different sizes.
Compressor stations
The purpose of a compressor station is to restore the pipeline pressure to the desired level after it has decreased substantially in the pipeline. The pressure loss is inversely related to the distance from the previous compressor station. But it also depends on the flow rate. To ensure the gas flow specified in the contract, pressure needs to be increased every 100 -150 km. The locations of the compressor stations are determined by the locality and technology used.
A typical compressor station adds pressure, cleans the gas in a battery of filters and cools the gas before feeding it back into the transmission pipe.
The compressor is typically turned by a gas turbine. Sometimes, an electric or gas motor is used. Because of the easy access to gas as a fuel, gas fuelled machinery is popular. Electric supply can be expensive, hard to access and risky along the pipeline going through largely remote areas.
Figure 4.5 Gas compressor
Figure 4.6 Gas turbine as compressor drive
The compressor stations have a modular design, which can respond easily to changing gas flows. Gas turbines are not economical if they are only operated part of the time. Stations are typically equipped with a number of smaller capacity turbines for efficient use. Each gas turbine operates at maximum efficiency at nearly the designed capacity and they can be added one at a time as needed. The nameplate capacity of gas turbines usually varies between 15 and 70 MW depending on the power required for the given pipe. To ensure the level of contracted gas flow, additional compressors are installed to provide capacity beyond the contracted flow. If any unexpected repairs are needed for one of the compressors, the extra additional compressors can be operated.
The size of compressor stations varies by the number and capacity of the pipelines. There can be two or three compressors on a single pipeline. For large compressor stations or those dealing with many pipelines such as 10 parallel pipelines, there may be as many as 80 compressors.
Figure 4.4 Typical compressor station

48
The major environmental impact is from waste gas. It contains CO2, NOx and CO among other contaminants, but only a negligible amount of SO2 or particulates. Natural gas is cleaned of sulphur at the production stage. This makes SO2 emissions negligible during combustion. However, compressor drives are very noisy so it is fortunate that the stations are usually located in remote areas with no or very few residents.
Gas turbines are increasingly becoming more sophisticated with higher efficiency. But even the highest efficiency turbines as compressor drivers will not provide the highest efficiency compression. Robust compressor operation requires constant operation at a certain level. When gas demand varies by day or season, start-stop-operations responding to changing loads may be economical but this does not equal compressor efficiency.
Compressor stations use pipelines of different sizes, valves of different sizes, compressors, compressor drivers like gas turbines, gas motors or electrical motors, filters and gas coolers.
Blending and quality control
Natural gas composition varies by source. It is a natural product that is highly variable according to local conditions. The customer needs gas which allows for safe operation of equipment. Gas needs to be adjusted to hold the quality within only a narrow band of variation in composition and characteristics. The Wobbe index and calorific value are important.
Gas quality control is important to ensure a constant composition of those characteristics for safe operation of equipment. Where streams of different regional areas come together, the gases are mixed at blending stations. The blending stations have sophisticated control systems to monitor automatically the resulting composition of the gas blend.
Another reason to monitor the gas composition is the determination of correct emission factors for large combustion plants, which are more commonly required to declare their emissions of CO2. In countries with an emission trading system the correctly measured composition is the basis for the calculation of required emission certificates.
Equipment used for blending and quality control includes pipelines of different sizes, valves of different sizes, physical detectors and chemical analysing equipment and pressure control equipment.
Metering stations
At different points of the gas grid it is necessary to determine the flow of gas. That is needed for the payment of natural gas or at locations where pipes of different operators join together.
Correct metering of the flow of gas in the pipe requires a straight pipeline to prevent additional turbulences caused by bends in the pipe. The metering station usually does not have any impact on the environment.
Figure 4.7 Compressor station in Germany with 8 compressor units

49
Equipment used for metering stations includes pipelines of different sizes, valves of different sizes and physical detectors for pressure, temperature and flow.
Pressure-regulating stations
The design of pipelines depends on the needed flow and the material available at that time. As a consequence, the design pressure of pipelines can vary, i.e. older pipes cannot handle as high a pressure as newer ones. Smaller pipelines are usually operated at lower pressures. Often the connections between different operators, e.g. from transmission to distribution networks, require a pressure regulating station sometimes called a “city gate station”.
When connecting pipes of different design pressures, the pressure needs to be adjusted below or at the maximum allowed level. Safety valves prevent the pressure from exceeding the design level. Usually the pressure drop is controlled pneumatically by the natural gas pressure, but this operation often requires a release of gas to the atmosphere. To ensure the safety of supply the pressure regulating stations usually contain at least one spare line designed identically to the one in operation.
The temperature of the gas decreases after a drop in pressure. When the difference in pressure is too high, the gas is often preheated to prevent the gas from freezing (forming ice). This heating is done by burning natural gas. The burner creates environmental impact through emissions of CO2, NOx and CO.
The purpose of odorants is safety, to detect leaks in the low pressure grid. In some countries the high-pressure natural gas is odorized, but in many countries the addition of odorants is done at the city gate stations that move the gas from transmission to distribution pipes. The odorant might consist of chemicals containing sulphur, but new agents are on the market to prevent the gas from creating unnecessary pollution.
The usual design of each pressure regulating line contains a filter, a heater, a pressure regulating valve, a safety valve to allow excess pressurized gas to escape into the atmosphere and the odorizing system. Very often the pressure regulating station is combined with a metering station.
Equipment used for pressure regulating stations includes pipelines of different sizes, valves of different sizes, physical detectors for pressure and temperature, regulators for pressure control, heaters and the odorization plant (depending on the country).
Sources of Emissions
Natural gas can be released to the atmosphere during operation of transmission systems. This is problematic not only in terms of product loss, but also due to the fact that the primary component of natural gas is methane, a powerful greenhouse gas 25 times more potent than carbon dioxide. Generally natural gas emissions are divided into intended releases and unintended emissions. Intended releases highly depend on the technology involved in the process. For example, compressor seals try to minimize the flow of natural gas between the rotating shaft and the casing of the compressor. Emission levels depend on the technology
Figure 4.8 Metering station
Figure 4.9 Pressure-regulating station

50
used, the age of equipment and the availability of new technology. Often retrofitting is not possible due to space requirements or other local circumstances.
Pressure controllers and other such equipment periodically release a certain amount of gas, but this can be used for purposes such as preheating of gas before pressure reduction.
Maintenance of equipment is necessary, but this often requires internal inspections of parts containing natural gas. This gas must be released first for worker safety.
All extensions or repairs of the pipeline network, for example by welding, can only be executed if the natural gas is purged and replaced by air to avoid incidents. Those releases contribute a high percentage of the total emissions of gas companies.
The unintended releases can be the result of leakage from equipment in use or damage to pipelines. All flange connections between parts should in theory be tight, but in some cases there are gaps that allow gas to escape into the atmosphere. Also, valves are intended to seal completely to restrict the flow of gas, but this does not always happen. Finding these leaks is an important task for worker safety but also helps both the environment and profitability.
Pipe damage can either be caused by material failures or corrosion, but the main cause is third-party damage, commonly during excavation. Companies take care to prevent such damage, e.g. through internal pigging or cathodic corrosion protection and through educating people doing excavation.
Regulations for Emissions and Technologies and Practices to Reduce Emissions
In most of the countries the emissions of pollutants like NOx and CO are limited by regulations. Some countries such as Russia require a fee per ton of pollutant emissions.
Greenhouse gas emissions are the subject of the Kyoto Protocol, but in most of the countries the limitations aim only at CO2 as the main contributor to global warming. This can be seen for example in the Emissions Trading System of the European Union. The idea is to reduce emissions at the lowest cost possible. Each firing source of more than 20 MW thermal input was required to be registered with its historical emissions. The system requires that each ton of CO2 emissions be covered by one certificate. In the first years free allocations to operators were granted according to their historical emissions, free of charge.
In years of high emissions the demand is higher than the supply, so prices rise. During recessions, emissions were reduced, so the price fell as well. This system will stepwise be replaced by an auctioning system, where all emission certificates must be bought on the stock exchange. In addition, authorities will reduce the volume of certificates. The resulting higher prices of certificates will put financial pressure on industry. As a result it is expected that investment into lower-emissions technologies will occur at emission sources where this effect creates the highest efficiency.
For other greenhouse gases such as methane, there are no general emission limits. Instead, the authorities focus on emissions of methane connected to operations. To obtain permits for a new compressor station in countries such as Germany the operator must explain how the emissions from compressor seals are utilized instead of being released into the atmosphere.
The Global Methane Initiative (GMI) is a worldwide country-level partnership that promotes voluntary, cost-effective reductions of atmospheric methane emissions. As a member country of GMI, the U.S. contributes to this initiative by operating the Natural Gas STAR International Program, which is a partnership between the EPA and oil and gas companies to promote implementation of methane emission reduction activities in the oil and natural gas sector. Through this program, as well as the domestic U.S. Gas STAR Program, there has been significant advancement in understanding the sources and volumes of methane emissions, as well as the operational changes that can reduce or eliminate those emissions. The primary sources of intended (vented) methane emissions and unintended (fugitive)
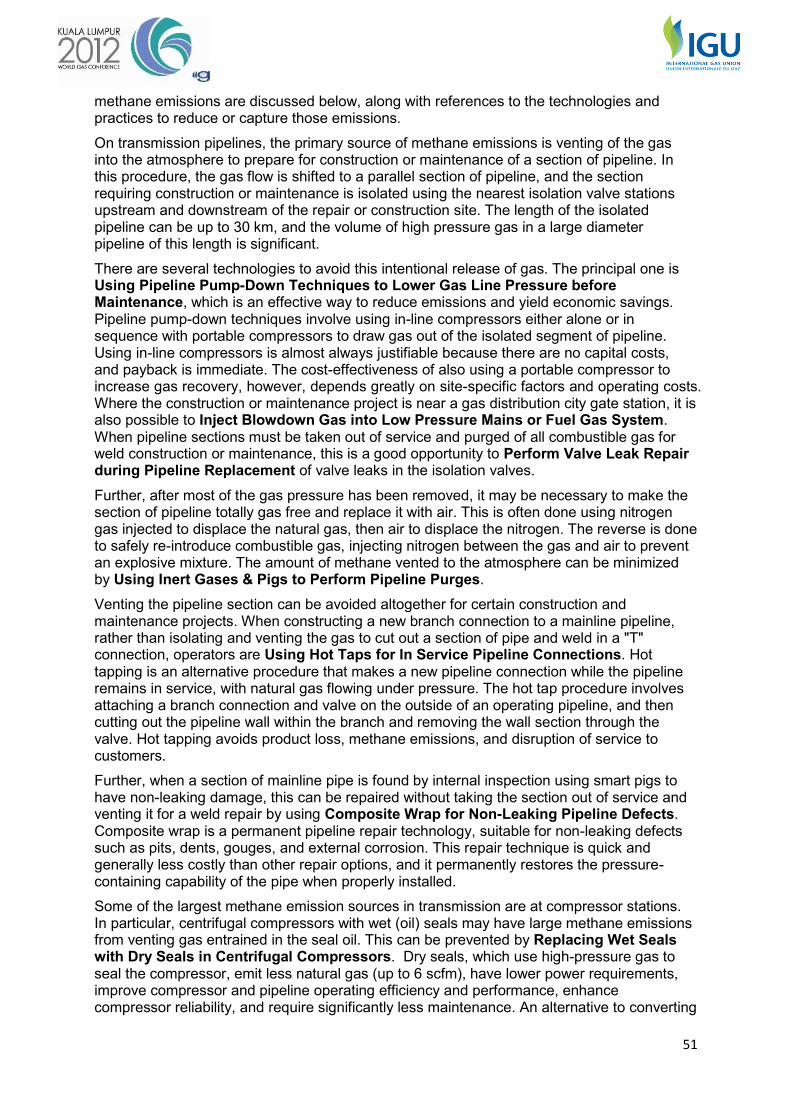
51
methane emissions are discussed below, along with references to the technologies and practices to reduce or capture those emissions.
On transmission pipelines, the primary source of methane emissions is venting of the gas into the atmosphere to prepare for construction or maintenance of a section of pipeline. In this procedure, the gas flow is shifted to a parallel section of pipeline, and the section requiring construction or maintenance is isolated using the nearest isolation valve stations upstream and downstream of the repair or construction site. The length of the isolated pipeline can be up to 30 km, and the volume of high pressure gas in a large diameter pipeline of this length is significant.
There are several technologies to avoid this intentional release of gas. The principal one is Using Pipeline Pump-Down Techniques to Lower Gas Line Pressure before Maintenance, which is an effective way to reduce emissions and yield economic savings. Pipeline pump-down techniques involve using in-line compressors either alone or in sequence with portable compressors to draw gas out of the isolated segment of pipeline. Using in-line compressors is almost always justifiable because there are no capital costs, and payback is immediate. The cost-effectiveness of also using a portable compressor to increase gas recovery, however, depends greatly on site-specific factors and operating costs. Where the construction or maintenance project is near a gas distribution city gate station, it is also possible to Inject Blowdown Gas into Low Pressure Mains or Fuel Gas System. When pipeline sections must be taken out of service and purged of all combustible gas for weld construction or maintenance, this is a good opportunity to Perform Valve Leak Repair during Pipeline Replacement of valve leaks in the isolation valves.
Further, after most of the gas pressure has been removed, it may be necessary to make the section of pipeline totally gas free and replace it with air. This is often done using nitrogen gas injected to displace the natural gas, then air to displace the nitrogen. The reverse is done to safely re-introduce combustible gas, injecting nitrogen between the gas and air to prevent an explosive mixture. The amount of methane vented to the atmosphere can be minimized by Using Inert Gases & Pigs to Perform Pipeline Purges.
Venting the pipeline section can be avoided altogether for certain construction and maintenance projects. When constructing a new branch connection to a mainline pipeline, rather than isolating and venting the gas to cut out a section of pipe and weld in a "T" connection, operators are Using Hot Taps for In Service Pipeline Connections. Hot tapping is an alternative procedure that makes a new pipeline connection while the pipeline remains in service, with natural gas flowing under pressure. The hot tap procedure involves attaching a branch connection and valve on the outside of an operating pipeline, and then cutting out the pipeline wall within the branch and removing the wall section through the valve. Hot tapping avoids product loss, methane emissions, and disruption of service to customers.
Further, when a section of mainline pipe is found by internal inspection using smart pigs to have non-leaking damage, this can be repaired without taking the section out of service and venting it for a weld repair by using Composite Wrap for Non-Leaking Pipeline Defects. Composite wrap is a permanent pipeline repair technology, suitable for non-leaking defects such as pits, dents, gouges, and external corrosion. This repair technique is quick and generally less costly than other repair options, and it permanently restores the pressure-containing capability of the pipe when properly installed.
Some of the largest methane emission sources in transmission are at compressor stations. In particular, centrifugal compressors with wet (oil) seals may have large methane emissions from venting gas entrained in the seal oil. This can be prevented by Replacing Wet Seals with Dry Seals in Centrifugal Compressors. Dry seals, which use high-pressure gas to seal the compressor, emit less natural gas (up to 6 scfm), have lower power requirements, improve compressor and pipeline operating efficiency and performance, enhance compressor reliability, and require significantly less maintenance. An alternative to converting

52
to dry seals is to capture vent gas and route it to high pressure turbine fuel gas and low pressure engine or heater fuel gas.
Rod alignment as a maintenance practice should be conducted at regular intervals. Reciprocating compressor rod packing is normally designed for small leakage, which can grow large when packing is not installed properly or operators do not replace the packing rings (and rods) often enough. Reducing Methane Emissions from Compressor Rod Packing Systems entails using company-specific financial objectives and monitoring data to determine emission levels at which it is cost-effective to replace rings and rods (based on the value of saved gas). Benefits of calculating and utilizing this “economic replacement threshold” include methane emission reductions, cost savings, and operational benefits, including a longer life for existing equipment, improvements in operating efficiencies, and long-term savings.
Pneumatic devices powered by pressurized natural gas are used widely in the natural gas industry as liquid level controllers, pressure regulators, and valve controllers. Methane is emitted by pneumatic devices. While each individual gas pneumatic control loop has relatively small emissions, the large number of these devices adds up to one of the larger methane emission sources that can be economically prevented. There are a number of equipment and operational Options for Reducing Methane Emissions from Pneumatic Devices in the Natural Gas Industry, including reducing these emissions by replacing high-bleed devices with low-bleed devices, retrofitting high-bleed devices, and improving maintenance practices.
Transmission compressor stations are designed with spare compressors which are started up when demand is high and shut down for routine maintenance or low demand. It is common to depressurize the compressor when it is shut down by closing unit isolation valves and venting the gas to the atmosphere. In a depressurized system, methane emissions result from the venting of the high-pressure gas left within the compressor and from continued leakage of unit isolation valves. Reducing Emissions when Taking Compressors Offline can be accomplished with simple changes in operating practices, such as keeping compressors pressurized when they are offline, or connecting the blowdown vent lines to the fuel gas system so that normally vented gas can instead be utilized as fuel gas. In a fully pressurized system, natural gas can leak from the closed blowdown valve and the compressor rod packing. A static seal can be installed on a pressurized compressor’s rods to eliminate rod packing leaks during shutdown.
Furthermore, the unit isolation valves must hold a pressure differential of up to 100 bar. With the compressor blowdown valve open, leakage through these valves can be very large and go unnoticed from the compressor building roof vent. This leakage and other unintentional emissions can be found and repaired by practicing Directed Inspection and Maintenance at Compressor Stations.
There are a number of design improvements that minimize intentional methane gas venting emissions during compressor station blowdowns. These include Redesign Blowdown Systems and Alter Emergency Shutdown (ESD) Practices (including using Yale Closures), Installing Electric Motor Starters, and Installing Electric Compressors. There are also a number of operational practices that reduce methane emissions as well as engine combustion emissions, for example, Reducing Emissions When Taking Compressors Offline and Automated Air/Fuel Ratio Controls to minimize fuel gas consumption.

53
Table 4.1 Technologies and Practices to Reduce Emissions
Source Category Emissions Source Reduction Technology Compressors/Engines Vented gas entrained in the seal oil of
centrifugal compressors with wet seal systems
Replacing Wet Seals with Dry Seals in Centrifugal Compressors
Compressors/Engines Leakage from reciprocating compressor rod packing
Reducing Methane Emissions from Compressor Rod Packing Systems
Compressors/Engines Vented gas when compressor is shut down and depressurized by closing unit isolation valves
Reducing Emissions When Taking Compressor Off-Line
Compressors/Engines and Valves
Intentional gas venting emissions from compressor stations
Redesign Blowdown Systems and Alter Emergency Shutdown (ESD) Practices
Reducing Emissions When Taking Compressors Offline
Install Electric Motor Starters
Install Electric Compressors
Compressors/Engines Methane emissions from engine combustion
Automated Air/Fuel Ratio Controls
Other (Fugitives) Leakage and other unintentional emissions from compressor stations
Directed Inspection and Maintenance at Compressor Stations
Pipelines Vented gas due to construction or maintenance of a section of pipeline
Using Pipeline Pump-Down Techniques to Lower Gas Line Pressure Before Maintenance
Pipelines Vented gas from a pipeline near a gas distribution city gate station
Inject Blowdown Gas into Low Pressure Mains or Fuel Systems
Pipelines Vented gas when removing and re-introducing gas in a section of pipeline
Use Inert Gases & Pigs to Perform Pipeline Purges
Pipelines Vented gas when constructing a new branch connection to a mainline pipeline
Using Hot Taps for In Service Pipeline Connections
Pipelines Vented gas when a section of mainline pipe is found to have non-leaking damage
Composite Wrap for Non-Leaking Pipeline Defects
Pneumatics/Controls Vented emissions from pneumatic devices
Options for Reducing Methane Emissions From Pneumatic Devices in the Natural Gas Industry
Valves Valve leaks on pipelines Perform Valve Leak Repair During Pipeline Replacement

54
Liquefied Natural Gas introduction
This section describes the LNG basics and main process steps: liquefaction, LNG shipping and gasification, as shown by steps 4, 5 and 6 in the next figure. All these steps include a common process, LNG storage.
Figure 4.10 Gas processing steps
Major characteristics and environmental aspects of LNG
The boiling point of natural gas at an absolute pressure of 1 bar is -162ºC. At this temperature and pressure, the gas volume/liquid volume ratio is more or less 600 (619 for pure methane). That is to say that the volume of one kilogram of natural gas (NG) is approximately 600 times the volume of liquefied natural gas (LNG). Density at the boiling point is approximately 450 kg/m3.
Regarding environmental and safety issues, LNG does not have any additional significant environmental features compared with the gaseous form, since LNG immediately gasifies on contact with air at atmospheric pressure. The main differences are related to detection and containment of LNG spills, thermal radiation prevention, contact between LNG and nature, and control of gas cloud dispersion.
The main environmental aspects in the LNG supply chain are GHG emissions due to combustion processes, especially at the liquefaction and shipping stages and waste generation during gas treatment processes. The gasification step does not show significant environmental impacts. One of the advantages of LNG is that it offers security of supply since it ensures multiple LNG sources. It provides an additional trading structure and it is cost effective for distances over 4,000km.

55
The LNG production system consists of several operational units coupled together to form a plant. The main steps of the LNG supply chain are shown in Figure 4.11.
Figure 4.11 Simplified LNG Block
Natural Gas Pre-treatment
The first stage of LNG production consists of purification processes, since the liquefaction process is much more sensitive to certain impurities (moisture, acid gases, mercury and heavy hydrocarbons) than high pressure pipeline transmission.
The first step is the removal of acid gases, such as CO2, H2S, mercaptans and COS. The most common acid gas removal process is absorption using amines or carbonates. The next step is usually dehydration, with the objective of preventing water condensation and hydrate formation in pipes and equipment, mostly by adsorption with molecular sieves.
Once the gas is dry, clean and sweet, it is conveyed through the mercury removal columns, where mercury is removed by adsorption on sulphur-impregnated carbon or alumina. Finally, heavy hydrocarbons are removed in the fractionation unit, adjusting the natural gas heating value and producing NGL (C2, C3 and C4+) used onsite as refrigerants or sold as a by-product.
Liquefaction
Once natural gas has been purified, it must be cooled down to -162ºC using mechanical refrigeration, i.e. axial or centrifugal compressors, and different types of refrigerants.
There are three main types of liquefaction cycles: cascade, mixed refrigerant and expansion cycles. Differences among the different liquefaction processes are basically in the number of cooling system circuits (up to three), refrigerant composition (pure or mixed refrigerants) and types of heat exchangers used at each stage of the process (plate fin, kettle or spiral wound exchangers). The most common liquefaction technology is by far the APCI process (C3MR and AP-X), accounting for more than 75% of the current installed LNG production capacity.
During pressurization and cooling of the gas, the heavier hydrocarbon fractions such as ethane, propane, and butane are liquefied and separated. The gas is further cooled until the methane is liquefied at very low temperature.
Processing efficiency is an important environmental factor. It can be influenced by weather or atmospheric temperature as well as by technology. LNG liquefaction technology is constantly improving, and newer plants tend to be more efficient. Environmental measures can include
Acid Gas Dehydratation MercuryRemoval Liqiuefaction LNG
StofageLNG
Shipping
Fractionation CondensateStorage
SIMPLEFIED LNG BLOCK
NATURAL GAS
LIQUEFACTION LNG
HIGH PRESSURE GASLNGUnloading
HighPressure Vaporization Measurement
OdorizationLNG
GASFICATION
LNG : Liquefied Natural Gas
NG : Natural Gas

56
increasing the efficiency of power generating gas turbines, utilizing waste heat, increasing the efficiency of compressors, putting boil-off gas to good use instead of flaring it, increasing the efficiency of pumps and preventing fugitive emissions and leakage of methane. Such measures can reduce both energy use and direct GHG emissions.
Once LNG is produced, it must be stored in LNG tanks. The main characteristic of the tank is the containment construction. There are basically three types of LNG tanks (single, double and full containment), but all of them have an inner shell of 9% nickel steel, a concrete outer shell and insulation between the shells and the base. Tanks can be built on the ground or in ground. All tanks built in the last twenty years are full containment tanks usually greater than 100,000 m3 in size. The main mechanical equipment in LNG tanks is the in-tank cryogenic pumps, designed to operate while continually submerged in LNG.
Boil-off vapour from the LNG tank at the liquefaction plant is usually compressed and used as fuel for power generation, but some plants unfortunately flare it.
LNG Shipping
LNG is loaded from the tanks to LNG tankers, ships with an insulation system specially built to carry LNG at atmospheric pressure and -162º C, and then transported over long distances to an LNG receiving terminal. The main characteristics of LNG tankers are their containment and powering systems and their large size. (LNG tankers range from 40,000 m3 to nearly 270,000 m3 for the latest Q-Max vessels.)
LNG tankers have usually between 3 and 6 individual tanks, each of them completely autonomous for load/unload operations and fully insulated to ensure a reduced boil off gas generation rate (usually less than 0.15%). All containment systems consist of an inner structure of aluminium alloy or 9% nickel steel, covered by insulation and an external support structure. Common containment systems are spherical (Moss) tanks, prismatic SPB tanks (from IHI Corp.) and membrane (GTT) tanks.
Most of the LNG tankers currently in operation are powered by steam turbines (able to burn either boil-off gas or fuel oil). The most recently built tankers have more efficient powering systems based on different combinations of diesel and electric engines.
Figure 4.12 Liquefaction Plant – SEGAS, Damietta

57
Improvements can be made in components of the ship’s propulsion system such as engines and motors. Technology to improve performance, utilisation of advanced, computerized control systems and use of renewable energy can all contribute to environmental performance. For instance, out of the three systems gas or oil boiler and steam engine, gas re-liquefaction and low speed diesel engine, and gas or oil diesel engine and electric motor the steam engine is the propulsion system most commonly used today.
In the past, the use of diesel engines rapidly increased in popularity for energy conservation. However, steam engines are more popular these days and a new high-efficiency steam turbine, the Ultra Steam Turbine, is developed. Steam engines use boil-off gas, which is a low-sulphur fuel. (However, some engines use heavy oil for economic reasons.) One technology for promotion of efficiency is the use of waste heat to preheat the fuel, which is basically the same as for industrial boilers.
Figure 4.14 LNG receiving terminal
Regasification
The first step of the receiving process is to unload LNG from tankers at the terminal jetty through articulated cryogenic arms into thermally-insulated LNG storage tanks. Boil-off gas, evaporated from LNG during the transfer process or during storage in the tanks, is recovered by suitable boil-off-gas compressors and injected into low pressure grid pipe to local consumers (ex. Power plant, industrial factory) or re-liquefied at the re-condenser plant in the terminal.
Figure 4.13 LNG tanker

58
LNG is pumped up by low pressure multistage cryogenic pumps into LNG tanks, mixed with re-liquefied boil-off gas and pumped up again by high pressure pumps (similar to low pressure pumps except for the number of stages and design pressure) and finally regasified in an Open Rack Vaporizer (ORV), which consists of panel shaped heat exchanger tubes and uses seawater as a thermal source. A Submerged Combustion Vaporizer (SCV) is also used as backup. In the tropics, air-heating LNG vaporizers can be practical.
The major functions of LNG receiving terminals are: (1) regasification of liquefied natural gas, (2) in some countries, calorific value adjustment by adding LPG, and (3) pressurization of the natural gas for supply to customers. These processes all use energy.
Reducing the amount of energy used in the process is a big concern. CO2 is emitted from on-site generation equipment both for regular and emergency use and from heating units such as LPG vaporizers and water heaters. Electricity is also used to drive process pumps and compressors.
The cryogenic energy in LNG can be used for power generation, freezing, and liquid industrial gases or dry ice production.
Methane leakage, including intended purges before periodic maintenance and unintended leaks caused by troubles in facilities during operation, is another concern. Some releases occur due to gas bleed-off during the gas quality testing process.
Table 4.2 Technologies to reduce GHG emissions and energy use
Optimizing equipment at LNG regasification plants.
Improving the conductivity of open rack vaporizers (ORV) to reduce the power use at the pump.
Improving the efficiency of submerged burner of submerged combustion type vaporizer (SMV).
Liquefying boil-off gas to reduce the power use at the compressor.
Introducing liquid-to-liquid calorific value adjustment method (LPG sprayed into LNG) for calorific adjustment, to save the energy that would otherwise be used for LPG gasification.
Utilizing the cryogenic energy in LNG for power generation.
Utilizing the cryogenic energy in LNG for freezer, or as an energy source to manufacture dry ice or industrial gases such as oxygen or nitrogen.
Using Combined Heat and Power to increasing the efficiency level of the plant.
Using a vent line returning to the LNG tank to reduce methane leakage.
Using high-performance seals for equipment or facilities at flange joints or valves, such as lip seal flanges or leak-proof valves to reduce methane leakage.
Continuous improvement of the operation and careful maintenance.
Natural gas from the vaporizers is driven through regulation, measurement and odorization systems and is introduced into the gas transmission pipelines.
Satellite supply
The satellite supply method is used when the consumers are located far from the pipeline grid. In this case, LNG is not regasified at the primary terminal. Instead it is transported as LNG to secondary receiving (satellite) terminals by land or sea.
LNG satellite terminals are commonly for industrial consumers of natural gas in areas where extension of distribution pipelines from the existing main pipelines is difficult. LNG is
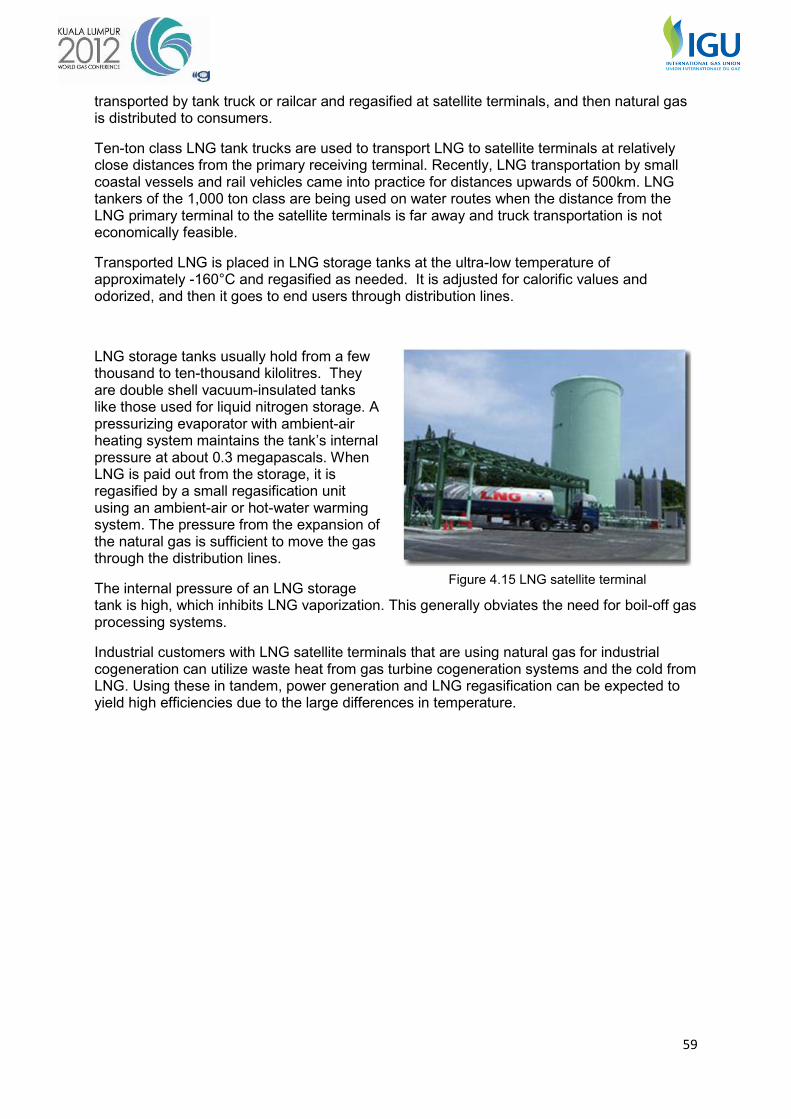
59
transported by tank truck or railcar and regasified at satellite terminals, and then natural gas is distributed to consumers.
Ten-ton class LNG tank trucks are used to transport LNG to satellite terminals at relatively close distances from the primary receiving terminal. Recently, LNG transportation by small coastal vessels and rail vehicles came into practice for distances upwards of 500km. LNG tankers of the 1,000 ton class are being used on water routes when the distance from the LNG primary terminal to the satellite terminals is far away and truck transportation is not economically feasible.
Transported LNG is placed in LNG storage tanks at the ultra-low temperature of approximately -160°C and regasified as needed. It is adjusted for calorific values and odorized, and then it goes to end users through distribution lines.
LNG storage tanks usually hold from a few thousand to ten-thousand kilolitres. They are double shell vacuum-insulated tanks like those used for liquid nitrogen storage. A pressurizing evaporator with ambient-air heating system maintains the tank’s internal pressure at about 0.3 megapascals. When LNG is paid out from the storage, it is regasified by a small regasification unit using an ambient-air or hot-water warming system. The pressure from the expansion of the natural gas is sufficient to move the gas through the distribution lines.
The internal pressure of an LNG storage tank is high, which inhibits LNG vaporization. This generally obviates the need for boil-off gas processing systems.
Industrial customers with LNG satellite terminals that are using natural gas for industrial cogeneration can utilize waste heat from gas turbine cogeneration systems and the cold from LNG. Using these in tandem, power generation and LNG regasification can be expected to yield high efficiencies due to the large differences in temperature.
Figure 4.15 LNG satellite terminal

60
Introduction into the
Distribution Network
Gas distribution is the process whereby gas is taken from the high pressure transmission system and distributed through low pressure networks of pipes to industrial complexes, offices and homes. The natural gas pipeline distribution network consists of the complex of pipeline, plants and accessories to distribute gas.
Distribution is the final step in delivering natural gas to end users. While large industrial, commercial and electric power generation customers get natural gas directly from high capacity pipelines, i.e. high pressure gas, most other users receive natural gas from local distribution companies through small-diameter low pressure distribution lines.
Regulators are needed to lower the high pressure at the receiving end to medium pressure for usage. To prevent freezing, it may be necessary at times to consume energy to heat the gas59.
During pipeline construction, there are times that natural gas is released into the atmosphere60. In some countries there may also be leakage of gas from old cast iron pipe joints.
59 Natural gas is primarily composed of methane. Because of this, the temperature becomes lower when pressure
is reduced, due to the Joule-Thomson effect. If the gas temperature becomes lower than 0°C after the pressure is lowered by the use of a regulator, it will be necessary to heat the gas with hot water. The heater is used on a part of the high-pressure line such as the main pipe, as there is an especially great temperature decrease there due to the change in pressure. To minimize the environmental impact, it is important not to use the heater more than necessary to raise the temperature, even if it is a highly efficient heater. In the future, it may be feasible to utilize solar thermal heat for this purpose.
60 During construction of the gas pipeline, the gas remaining inside must removed. Methane, the main element of natural gas, has a stronger greenhouse effect than CO2. Therefore, it is necessary to limit release of natural gas into the atmosphere as much as possible. While construction is taking place on the gas pipeline, gas inside the distribution pipeline in the area being worked on should be moved to the lower pressure line. It is a basic process, but when there is no regulator present in the working area, this method is infeasible. However, if it is possible to transfer the gas to a different distribution pipeline by using the portable booster pump vehicle, then the atmospheric release of natural gas can be prevented. When doing construction in this area, use a regulator to move gas to the lower pressure side. When working in an area where there is no regulator available, use a pump to expel the gas outside of the construction work area.
Figure 4.16 Gas distribution
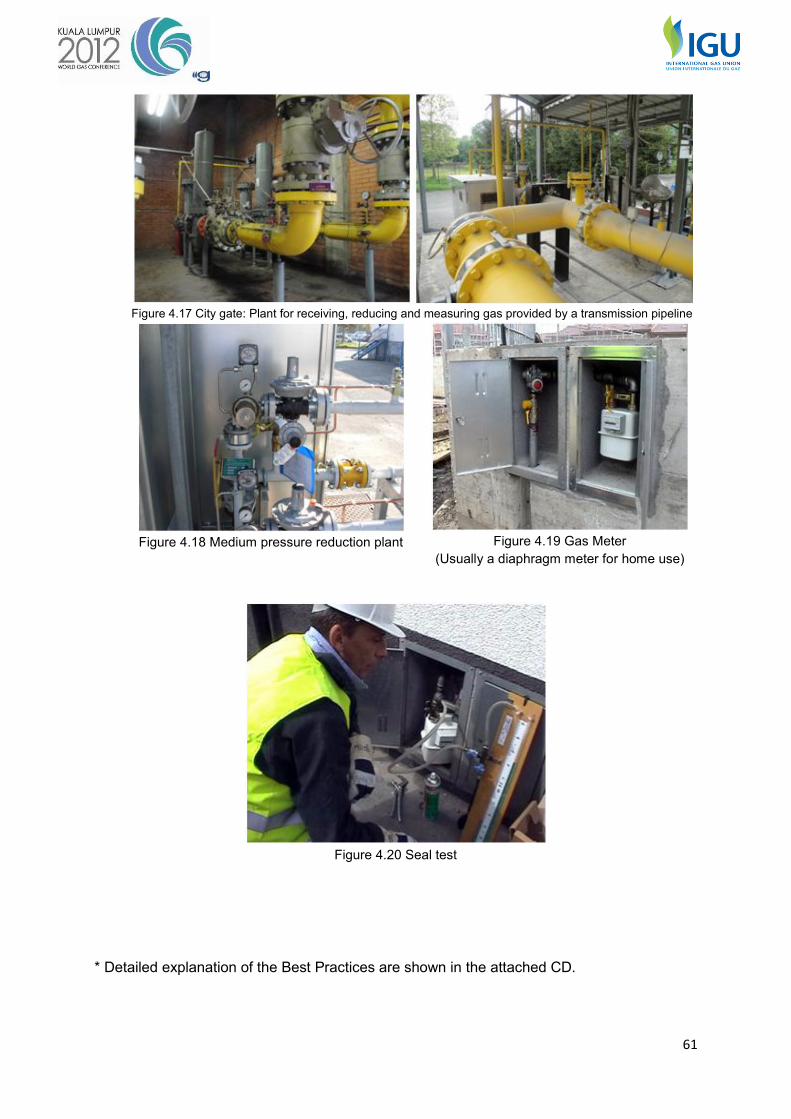
61
Figure 4.17 City gate: Plant for receiving, reducing and measuring gas provided by a transmission pipeline
Figure 4.18 Medium pressure reduction plant
Figure 4.19 Gas Meter
(Usually a diaphragm meter for home use)
Figure 4.20 Seal test
* Detailed explanation of the Best Practices are shown in the attached CD.

62
Chapter 5 - BEST PRACTICES AND TECHNOLOGIES OF GREENHOUSE GAS EMISSIONS REDUCTION: UTILISATION
Natural gas burns cleaner than the other major fossil fuels. The U.S. Department of Energy has reported that combustion of natural gas produces 50% less CO2 than coal and 30% less CO2 than oil, and less nitrogen oxide than either. It produces virtually no SOx, particulates or mercury emissions.61 Energy efficiency is one of the most powerful ways of reducing GHG emissions. Since only 8% of the energy in natural gas is lost from well head to the point of combustion versus an average of 68% lost in fossil-fuels power generation,62 substituting natural gas for resistance heating can produce marked emission savings while conserving natural resources.
Natural gas’ other characteristics are its versatility and interchangeability in a wide variety of uses. Infrastructure for providing various kinds of energy services has been integrated into the infrastructure of many of the technologically advanced countries over the years. The natural gas infrastructure, particularly the gas pipeline system, is a well-established and fully built-out energy system that efficiently provides energy for a diverse range of applications in multiple economic sectors. Gas is used for generating electricity, supplying both heat and power, and direct combustion heat or steam heat. With this infrastructure, natural gas is used in various shapes and forms and used in various areas and scales, from gigantic electric power plants to small kitchen ranges.
While natural gas is a significant player, it is not free of greenhouse gas emissions. Looking at the entire natural gas chain, the largest quantity of greenhouse gas emissions are created by CO2 emitted during combustion. Of the various points where carbon reduction technologies can be applied, this is the point where the most savings can be had. This also leads to energy conservation and saving of resources, as the result is frequently an increase in energy efficiency. Here, it may be quite possible to apply GHG reduction technologies at the point of utilisation in the different areas and different scales. Therefore, there are many opportunities to implement the technology.
Generation
Figure 5.1 breaks down worldwide energy use by type of generation and the prediction for 2035. Worldwide generation in 2035 is estimated to be 35,336TWh, approximately 1.5 times as much as in 2008 (20,183TWh). Although the developed countries will see some increase in the amount of generation, the emerging countries such as China and India will see an especially large increase (up to 3 to 4 times). It is anticipated that the percentage of coal will decrease and renewable energy will increase worldwide.
An important response to global warming is to increase the efficiency of fossil power generation, which is often used as the marginal power source to respond to variability in demand. Figure 5.2 shows the weighted average efficiency of fossil-fired power production in various countries. In 2007, the United Kingdom and Ireland were the most efficient countries at 44% (LHV). Japan (43%) and Korea (42%) came next. Large-scale greenhouse gas emitters such as China, Australia, and India have very low heat efficiency, about 10% below the most efficient countries.
61 AGA, Natural Gas Policy Handbook, p. 34 (2011), http://www.aga.org/our-issues/playbook/Pages/default.aspx 62 Ibid., p30-31

63
Source: World Energy Outlook 2010
Figure 5.1 Breakdown of current worldwide usage of energy by type of generation and prediction for 2035
Source: ECOFYS, INTERNATIONAL COMPARISON OF FOSSIL POWER EFFICIENCY AND CO2 INTENSITY, September 2010, v.2.0
Figure 5.2 Weighted average efficiency of fossil-fired power production in various countries
The combined cycle generation system, which uses the combination of a gas turbine and a steam turbine, is a highly efficient method of power generation. In the first step, fuel is combusted with compressed air to produce high-pressure gas. This is fed into a gas turbine to generate electricity. In addition, the waste heat from the gas turbine is used to generate steam, which then in turn, is used to produce more electricity. This method of power generation creates more electricity than conventional fossil power plants using the same amount of fuel. It also produces fewer CO2 emissions per kilowatt hour.

64
Advanced Combined Cycle power generation (ACC) is a further improvement in power generation (Figure 5.3). Its use is on the increase. With ACC power production, heat efficiency is about 55% (LHV). The 1,500°C class More Advanced Combined Cycle (MACC), based on the ACC generation system, has even more advanced features (59% LHV). The gas enters into the gas turbine at a very high temperature. This design achieves higher efficiency and has a larger generation capacity. This heat efficiency is achieved through the use of heat-resistant materials developed for the gas turbine and technological innovations for cooling it. These are recognized as the core technologies for the future fossil power plants, because of fuel savings from higher efficiency, reduction of CO2 emissions, and the potential for larger capacity to reduce construction costs through economies of scale.
Discussion in the United States about Replacing Coal-fired Generation with Natural Gas
Simply replacing coal-fired generation with electricity from existing natural gas plants would sharply reduce GHG emissions. This has been proposed in the United States.
Cf. “Stan Mark Kaplan, Displacing Coal with Generation from Existing Natural Gas-Fired Power Plants, January 19, 2010”
This report advises Congress on reducing coal use by generating more electricity from existing natural gas power plants. The US has more gas generation capacity than for coal (39% vs. 31%), but the gas plants have lower utilisation (42% vs. 75%). If all of the gas capacity were used first, replacing some of the current coal generation, the outcome would be a 19% drop in emissions from coal-fired plants.
The US Environmental Protection Agency (EPA) Cross-State Air Pollution Rule was enacted in 2011 after this report was published. Many older types of coal-fired power plants might have to be shut down and these could be replaced with natural gas plants or high efficiency power plants using natural gas as a fuel. This is also regarded as one of the less costly responses to global warming.
Combined Heat and Power (CHP)
Combined heat and power (CHP) technologies are reliable, cost-effective solutions to generate simultaneously usable heat and power for residential, commercial and industrial applications. In the United States, 71% of CHP capacity is fuelled by natural gas, harnessing an abundant, clean fossil fuel resource to a higher efficiency technology. Gas-powered CHP systems operate at higher efficiencies than conventional power generation, reducing operating costs at all stages of the energy value chain. Particularly for on-site electricity generation, CHP units enhance power reliability to commercial buildings and industrial facilities, ease constraints on the electric grid and enable manufacturers to generate their own low-cost, low-emissions electricity. Industrial and large commercial customers traditionally have been the primary market for CHP. Today, 82 gigawatts of installed CHP serve almost 4,000 industrial and commercial facilities.
Source: global-greenhouse-warming.com
Figure 5.3 Advanced Combined Cycle power generation
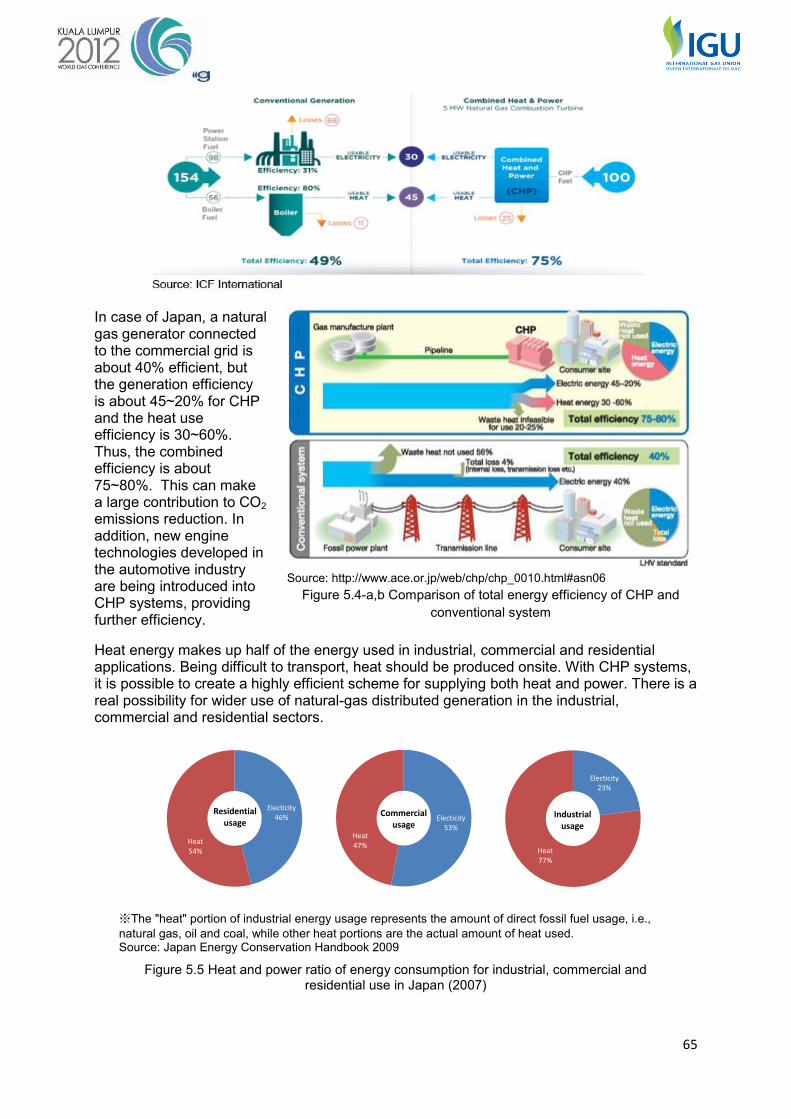
65
In case of Japan, a natural gas generator connected to the commercial grid is about 40% efficient, but the generation efficiency is about 45~20% for CHP and the heat use efficiency is 30~60%. Thus, the combined efficiency is about 75~80%. This can make a large contribution to CO2 emissions reduction. In addition, new engine technologies developed in the automotive industry are being introduced into CHP systems, providing further efficiency.
Heat energy makes up half of the energy used in industrial, commercial and residential applications. Being difficult to transport, heat should be produced onsite. With CHP systems, it is possible to create a highly efficient scheme for supplying both heat and power. There is a real possibility for wider use of natural-gas distributed generation in the industrial, commercial and residential sectors.
※The "heat" portion of industrial energy usage represents the amount of direct fossil fuel usage, i.e., natural gas, oil and coal, while other heat portions are the actual amount of heat used. Source: Japan Energy Conservation Handbook 2009
Figure 5.5 Heat and power ratio of energy consumption for industrial, commercial and residential use in Japan (2007)
Electicity46%
Heat54%
Residential usage
Electicity53%
Heat47%
Commercial usage
Electicity23%
Heat77%
Industrial usage
Source: http://www.ace.or.jp/web/chp/chp_0010.html#asn06
Figure 5.4-a,b Comparison of total energy efficiency of CHP and conventional system

66
Heat energy used in cascade fashion in CHP
The high-temperature heat energy produced from combustion of natural gas can be used for various purposes. When high-temperature energy is converted into power, waste heat is produced. This can be recycled as the heat source for lower temperature steam or hot water. The use of this heat in a cascade fashion creates a system that uses the heat supply with high efficiency (Figure 5.6).
Figure 5.7 shows the degree of use of CHP in power generation facilities in the countries of the world. In Europe and North America, CHP has been promoted alongside renewable energy through official policies. In 2007, the environmental superiority of CHP was recognized at the G8 Summit in Heiligendamm. The summit declaration called for more adoption of CHP technologies.
Manufacturing facilities, chemical production plants, petroleum refineries, and paper mills comprise much of the industrial CHP installed capacity, and about 12 percent of the total CHP capacity is used in the commercial / institutional sector such as universities, hospitals, and prisons.63 CHP gas-powered technologies are particularly promising for the immediate future because abundant gas supplies have led to lower, more stable prices that support current and future investment in the required infrastructure. In the United States, increased regulatory oversight and control technologies imposed on coal and oil-fired boilers makes CHP a viable, efficient solution for complying with these regulations.
In the EU, there are subsidies and other tax incentives for introducing highly efficient CHP. In 2004, the CHP Directive was issued. It required EU member countries to examine the potential for CHP and to come up with the support systems for promoting and developing CHP on a wider scale. Here are the major points:
1. Incentives should be given for electricity generated by CHP64.
2. Member States must establish an analysis of the national potential for the application of high-efficiency cogeneration and barriers which may prevent its realization. 65
63 See, e.g. U.S. Environmental Protection Agency, CHP Database, at http://www.epa.gov/chp/index.html 64 In its Resolution of 15 November 2001 on the Green Paper, the European Parliament called for incentives to
encourage a shift towards efficient energy production plants, including combined heat and power. (CHP Directive Preamble, Clause 3)
Figure 5.6 Cascade utilisation of the heat produced from CHP
Figure 5.7 Cogeneration share of global generation facilities

67
3. The European Commission will evaluate the application of support mechanisms used in Member States.66
4. Member States must clarify the rules for parties working together between cogeneration implementers and grid owners.67
5. Member States may particularly facilitate access to the grid system of electricity produced from high-efficiency cogeneration plants smaller than 1MW and the use of renewable energy sources. 68 69 70
6. Member countries are required to evaluate the existing legislative and regulatory framework with a view to reducing regulatory barriers to an increase in cogeneration.71
EU member countries have taken various measures under this Directive. The United Kingdom is undertaking multiple support measures. As part of the coalition government agreement, it is implementing the Green Deal that will provide householders, private landlords and businesses with up-front finance for qualifying energy savings schemes. Payments will be collected through energy bills, which will be a combination of the lower energy charge and the finance charge. There is a Business Rates exemption for CHP power generation plant and machinery and a reduction in VAT on certain grant-funded domestic micro-CHP installations (from 17.5 down to 5%).
In Germany, the amended German CHP Law, effective January 1, 2009, targets an increase in the CHP share of the domestic power supply to 25% by 2020 by giving time-limited protection to cogeneration facilities for maintenance, and support for upgrading of existing facilities and for new installations. It also supports license renewal and new construction of cogeneration facilities. This law emphasizes bonus payments for the total amount of electricity generated by newly constructed cogeneration and price incentives for the power 65 Member States shall establish an analysis of the national potential for the application of high-efficiency
cogeneration, including high-efficiency micro-cogeneration. … The analysis shall … include a separate analysis of barriers, which may prevent the realization of the national potential for high-efficiency cogeneration. (Article 6: National potentials for high-efficiency cogeneration)
66 The Commission shall evaluate the application of support mechanisms used in Member States, according to which a producer of cogeneration receives, on the basis of regulations issued by public authorities, direct or indirect support… The Commission shall consider whether those mechanisms contribute to the pursuit of the objectives set out in Articles 6 and 174(1) of the Treaty. (Article 7: Support schemes, clause 2)
67 Article 8: Electricity grid system and tariff issues 1) For the purpose of ensuring the transmission and distribution of electricity produced from high-efficiency
cogeneration the provisions of Article 7(1), (2) and (5) of Directive 2001/77/EC as well as the relevant provisions of Directive 2003/54/EC shall apply.
2) Until the cogeneration producer is an eligible customer under national legislation within the meaning of Article 21(1) of Directive 2003/54/EC, Member States should take the necessary measures to ensure that the tariffs for the purchase of electricity to back-up or top-up electricity generation are set on the basis of published tariffs and terms and conditions.
68 Subject to notification to the Commission, Member States may particularly facilitate access to the grid system of electricity produced from high-efficiency cogeneration from small scale and micro cogeneration units. (Article 8, Clause 3)
69 (m) ‘micro-cogeneration unit’ shall mean a cogeneration unit with a maximum capacity below 50 kWe; (n) ‘small scale cogeneration’ shall mean cogeneration units with an installed capacity below 1 MWe (Article 3: Definitions)
70 The definitions of cogeneration and of high-efficiency cogeneration used in this Directive do not prejudge the use of different definitions in national legislation, for purposes other than those set out in this Directive. It is appropriate to borrow in addition the relevant definitions contained in Directive 2003/54/EC and in Directive 2001/77/EC of the European Parliament and of the Council of 27 September 2001 on the promotion of electricity produced from renewable energy sources in the internal electricity market. (CHP Directive Preamble, Clause 16)
71 Member States or the competent bodies appointed by the Member States shall evaluate the existing legislative and regulatory framework with regard to authorisation procedures or the other procedures laid down in Article 6 of Directive 2003/54/EC, which are applicable to high-efficiency cogeneration units. Such evaluation shall be made with a view to ... reducing the regulatory and non-regulatory barriers to an increase in cogeneration... (Article 9: Administrative procedures, clause 1)

68
generated. There is an additional bonus payment paid by the distribution businesses to producers on top of the conventional purchase price of electricity. The criteria for qualified purchases of power produced by cogeneration are based on the EU CHP Directive. The law requires that qualifying power create at least a 10% reduction in primary energy over heat and power supplied separately.
Other measures include a requirement to utilize renewable energy in newly constructed buildings. Waste heat use in high efficiency cogeneration is regarded as equivalent to renewable energy; therefore, if waste heat use addresses more than 50% of heat needs, it can be a substitute for renewable energy.
Example from the USA
Cf. “OAK RIDGE NATIONAL LABORATORY, Combined Heat and Power: Effective Energy Solutions for a Sustainable Future, December 1, 2008”
CHP, or cogeneration, has been around in one form or another for more than 100 years; it is proven, not speculative. Despite this proven track record, CHP remains underutilized and is one of the most compelling sources of energy efficiency that could, with even modest investments, move the [United States] strongly toward greater energy security and a cleaner environment. Indeed, ramping up CHP to account for 20 percent of US electricity capacity—several European countries have already exceeded this level—would be equivalent to the CO2 savings of taking 154 million vehicles off the road.
The generating capacity of the more than 3,300 US CHP sites now stands at 85 gigawatts (GW) — almost 9 percent of total US capacity. In 2006 CHP produced 506 billion Kilowatt Hour (kWh) of electricity—more than 12 percent of total US power generation for that year.
If the United States adopted high-deployment policies to achieve 20 percent of generation capacity from CHP by 2030, it could save an estimated 5.3 quadrillion Btu (Quads) of fuel annually, the equivalent of nearly half the total energy currently consumed by US households. Cumulatively through 2030, such policies could also generate $234 billion in new investments and create nearly 1 million new highly-skilled, technical jobs throughout the United States. CO2 emissions could be reduced by more than 800 million metric tons (MMT) per year, the equivalent of taking more than half of the current passenger vehicles in the US off the road. In this 20 percent scenario, over 60 percent of the projected increase in CO2 emissions between now and 2030 could be avoided.
The state of cogeneration development
With distributed cogeneration having potential for wider use in various areas, there are many proven technologies and a wide variety already in the market, from large-sized units for power generation and district heating and cooling, medium-sized for hospitals and commercial outlets, and smaller-sized of about 1kW for residential heat and power (Figure 5.8).

69
Figure 5.8 Range of cogeneration facilities developed and currently in use in Japan
Historically, there were not so many commercially available products in the area of cogeneration systems using small gas engines. However, today the options are much greater. Recently, the rate of installations has accelerated. Table 5.1 shows a recent line-up. All have a combined efficiency of at least 85%.
Table 5.1 Recent line-up of cogeneration systems using small gas engines (LHV standard)
Type 5kW 6kW 9.9kW 25kW 35kW
Maker Yanmar Energy
Systems Aisin Seiki
Yanmar Energy Systems
Yanmar Energy Systems
Yanmar Energy Systems
Package overview
Power efficiency 29.0% 28.8% 31.5% 33.5% 34.0% Heat recovery
efficiency 56.0% 56.2% 53.5% 51.5% 51.0%
Combined efficiency 85.0% 85.0% 85.0% 85.0% 85.0%
Improvement of gas engine efficiency
Figure 5.9 shows the differences in gas engine power generation efficiency by power output. The lean-burn gas engine aims at improving the gas fuel efficiency by mixing combustion air with gas to make an extremely lean fuel. Fuel economy improves but cleaning up the exhaust takes special technology since combustion is incomplete. On the other hand, the mirror cycle gas engine achieves a 5% or greater efficiency increase over the conventional cycle type, inhibiting knocking by reducing the compression ratio relative to the expansion ratio and thus improving the cycle efficiency. Today’s gas engine has achieved high efficiency by combining lean combustion and mirror cycle technologies, achieving a 12% emissions reduction over conventional types. (The lean-burn gas engine is modified to use a mirror cycle, so that power generation efficiency of 40% is achieved.)

70
Source: Mitsubishi Heavy Industries, Ltd., Technical Review Vol. 45 No. 1 (Mar. 2008)
Figure 5.9 Gas engine efficiency improvements
Biomass cogeneration
In addition to increasing system efficiency to lower CO2 emissions, biomass such as wood can be used as fuel for cogeneration. The benefits of biomass are:
1. Energy conservation: reduced fossil fuel consumption
2. Reduction of CO2: helping to prevent global warming by being carbon neutral
3. Resource recycling: reduces the waste and utilize resources efficiently
4. Improvement of energy security: the fuel for energy can be distributed (biomass produced and consumed locally); therefore the level of supply security is enhanced.
However, there are only limited sites where enough biomass can be continuously provided as a fuel source. Also, the fermenting process can be unstable and vary with weather or time of day. Because of these characteristics, a new system was developed using city gas and gas from biomass mixed and combusted to keep the cogeneration facility operating stably. With this new system, 100% of the biogas produced from the biomass can be utilized in order to achieve further energy conservation and better economics (Figure 5.10).
Figure 5.10 Gas engine efficiency improvements
Examples of efficient conversion of waste to energy using biogas cogeneration include:
• Solid waste treatment facilities. Garbage is reformed into CO and H2. This reformed gas is combusted and generates power (and heat).

71
• Sewage treatment facilities. Digester gas is used for biomass cogeneration.
• Food factories. Biogas, primarily composed of CH4, is produced from the waste water from food factories
The power and steam (and low temperature heat) are consumed on site. If the generated power exceeds the facility’s demand, it can be sold to outside users.
Tri-generation
Tri-generation uses CO2 generated by cogeneration for growing plants. For example, the most efficient growing condition for roses is said to be heat, lighting and CO2 provided together around-the-clock.
District heating and cooling (DHC)
In European countries, traditionally district heating and cooling (DHC) has been widely used as the efficient heat supply for dense commercial areas and multiple housing. DHC is one major area where CHP can be used. It is a type of system, not a technology. The technologies used in DHC are CHP, highly-efficient turbines or engines, boilers, absorption chillers, and turbo chillers. Best practices for each of the technologies will be described under each heading.
DHC renovation is an effective measure to lower the carbon emissions in the urban area or building sector. But how one defines boundaries changes the emission calculations. Within the narrow boundary of a single building, its carbon emissions can be brought to zero by simply replacing all equipment that uses direct combustion with equipment run by electricity. However, this will increase electricity demand. If the electricity is generated using a high ratio of coal, for instance, then the total carbon emissions will be greater than before.
In order to lower the carbon emissions of urban areas or building sectors with lower social cost, we need to make maximum use of the existing energy infrastructure in combination with technologies for various aspects of the overall system to optimize, renovate and modify.
Smart Energy Network
The EU undertook the Smart Energy Network research project in its Seventh Framework Programme (FP7). Currently, wide-ranging R&D efforts are underway to increase the efficiency, flexibility, safety, reliability and quality of the European electricity and gas systems and networks to facilitate the transition to a more sustainable energy system.
For electricity networks, the goals are transforming the current electricity grids into a resilient and interactive (customers/operators) service network, controlling the real time flows and removing the obstacles to the large-scale deployment and effective integration of renewable energy sources and distributed generation (e.g. fuel cells, micro-turbines, reciprocating engines).
For gas networks, the objective is to demonstrate more intelligent and efficient processes and systems for gas transport and distribution, including the effective integration of renewable energy sources and the use of biogas in the existing networks.
In Japan, the Smart Energy Network pilot projects are underway to demonstrate the optimal control of energy supply and demand, combining telecommunication technologies with distributed generation using large quantities of renewable energy and un-utilized energy. This builds the social system where energy supply and demand are optimized by fine-grained control through information and communication technologies.

72
Figure 5.11 Smart Energy Network
Micro-CHP
Micro-CHP is one means for lowering CO2 emissions in residential areas and for promoting distributed generation. This versatile technology can be deployed in various scales. It uses waste heat from power production. Some of the residential micro-CHP units are highly efficient, using a wide variety of technologies.
Sterling engine
The Sterling engine has a high-temperature space and a lower-temperature space. The engine is driven by gas going back and forth between the two spaces. A commercial residential model manufactured by Whisper Tech Limited is being sold in Europe and the United States.
Reciprocating engine
A residential cogeneration unit using a gas engine is being sold in Japan. It can be used for power supply and water heating. The engine can produce 1kW of power and its generation efficiency is 26.3% (LHV). The combined efficiency rate is very high (92.0%) due to its use of waste heat from the engine. This is effective for energy conservation and CO2 reduction. Figure 5.12 shows a diagram of the overview and its use inside the home.
Fuel cell
The fuel cell cogeneration system reforms natural gas to extract hydrogen that then chemically reacts to atmospheric oxygen inside the cell stack (generating power through reverse electrolysis of the water: Figure 5.13). Heat is a by-product of the power generation. This heat is used to supply hot water. The chemical reaction producing electricity does not create noise or vibration. Its only by-product is water. Therefore, its impact on the environment is minimal. Currently, fuel cells developed for home use with cogeneration systems have generation efficiencies of 35~65% (LHV). The combined efficiency including the heat use is up to 80~90%. The Proton Exchange Fuel Cell (PEFC) and the Solid Oxide Fuel Cell (SOFC) are being used in residential fuel-cell cogeneration systems.
Figure 5.12 Cogeneration using engine for residential use

73
The PEFC developed in Japan is capable of learning the pattern of the home electricity and hot water use. It automatically adjusts its output to match the demand. The output of the hot water increases along with the power generated. It stops automatically when the hot water tank is full. When there is not enough hot water in the tank, it replenishes it using the backup water heater, alleviating concerns over running out of hot water. The combined efficiency is about 80%. SOFC has higher efficiency especially with homes that use a large volume of electricity. The new commercial product named the “W generation,” combining PEFC (or Reciprocating engine type CHP) and solar panels, is already in the market. The surplus electricity from solar panels can be sold back to power utilities.
Industrial Sector
Figure 5.14 City gas as industrial energy
Industries have diverse heat demands. Steam, combustion and drying are some of the uses for heat. The demand for heat is provided by heavy oil if there is no natural gas supply infrastructure.
Figure 5.15 Reduction of CO2 by changing the energy source and burner system
Switching from heavy oil to natural gas greatly reduces CO2 emissions. Upgrading to high efficiency equipment results in additional reductions. For instance, replacing heavy oil as the fuel for a forging furnace with natural gas reduces CO2 by about 25%. Replacing a
Figure 5.13 Diagram of fuel cell

74
conventional burner with a regenerative burner (Figure 5.15) provides additional CO2 reduction, nearly halving total emissions.
Regenerative Burner System
The regenerative burner system is the combustion heating system which can collect exhaust heat from an industrial furnace with extremely high efficiency. It is especially used for higher temperature furnaces such as roll heating furnaces, forging furnaces, heat treatment furnaces, dissolution furnaces, baking kilns, and deodorization furnaces.
The regenerative burner system (Figure 5.16) uses a pair of burners connected to media cases. The media works as a heat storage body. The media are alternately heated in a cycle lasting under a minute. As shown in Figure 5.17, when one regenerative burner is firing, the exhaust gas passes through the media case of the other burner. This way, the media case recovers the heat energy from the exhaust. When this burner subsequently ignites, the combustion is more efficient due to the air being preheated in the media case. In a conventional system, the exhaust heat is wasted completely, but this system picks up the waste heat to increase the combined efficiency. For instance, the exhaust at 1,200°C preheats the air to over 1,000°C. When this happens, 50% of the energy is conserved over the system with no waste-heat recovery.
Figure 5.17 Regenerative burner system
Commercial Sector
Figure 5.18 breaks down the market for air-conditioning systems in Japan. For buildings with more than 10,000㎡ of floor space, gas absorption chillers and water heaters are appropriate. For the smaller buildings, gas heat pumps (GHP) are more appropriate. Outside of Japan, gas absorption chillers and water heaters are used in China and Korea. GHP is mostly used in Japan and Korea.
Figure 5.16 Regenerative burner

75
Figure 5.18 Diagrammatic illustration of market breakdown for air-conditioning system with gas
absorption chiller and gas heat pump in Japan
Promotion of gas air conditioning is a national policy in Japan for realizing peak shift and peak shaving in the summer power load, when air-conditioning demand rapidly increases. Levelling off the power load leads to lower investment requirements and supply cost reductions, by more effectively utilizing power supply facilities.
Figure 5.19 shows the performance of gas air conditioning. Efficiency has been improving constantly over the years for both gas absorption chillers/heaters and GHP. Technology developments after 1990 led to particularly significant performance improvements.
(HHV standard)
Figure 5.19 Changes in performance of gas air-conditioning systems (absorption chillers and GHP)
The High Power Multi GHP has been developed, which supplies supplemental power to move the fan motors and cooling water pumps using the electricity generated efficiently from the air conditioner engine’s extra power while the air conditioner is running. This uses approximately 1/50th of the electricity required for an electric heat pump. Another new GHP for commercial use, the High Power Excel (shown in Figure 5.20), can supply 2~4kW of electricity and the efficiency ratio is as high as 40% (HHV). The commercially available XAIR uses the latest automotive-engine technology. This GHP minimizes the emissions from the engine to reach higher efficiency and also achieve efficiency under partial loads. These gas air-conditioners consume approximately half as much gas as GHP built in 1992 did.
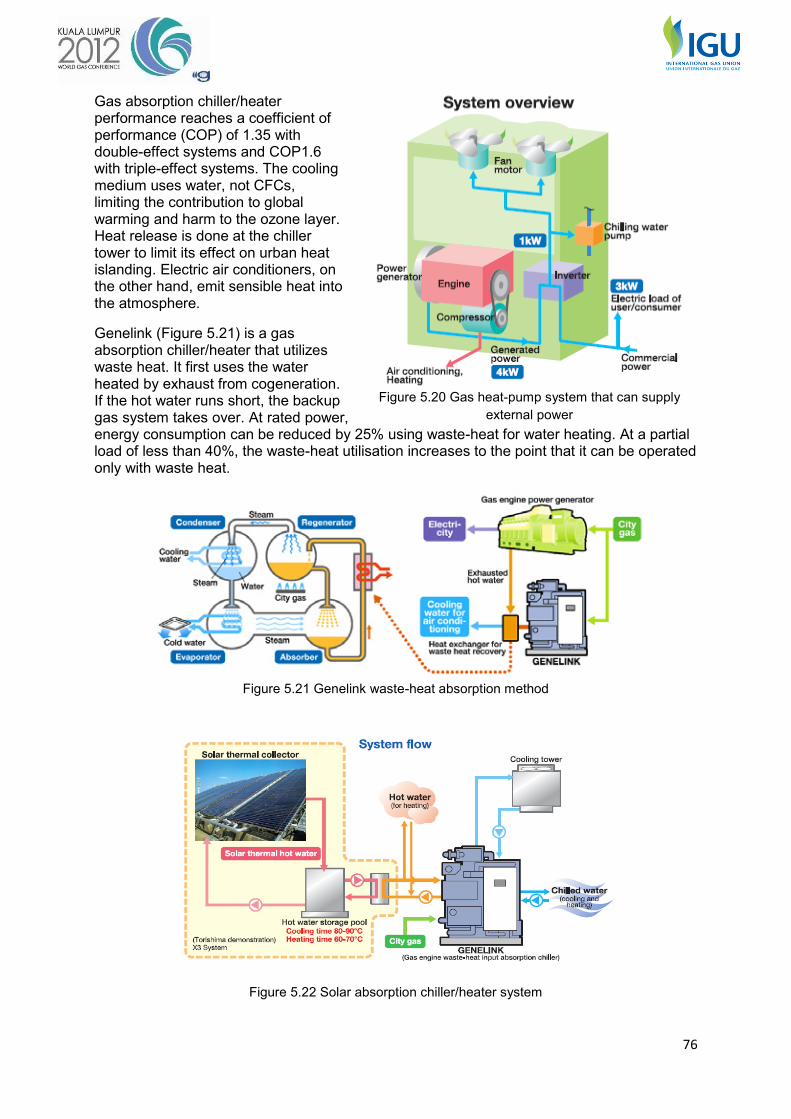
76
Gas absorption chiller/heater performance reaches a coefficient of performance (COP) of 1.35 with double-effect systems and COP1.6 with triple-effect systems. The cooling medium uses water, not CFCs, limiting the contribution to global warming and harm to the ozone layer. Heat release is done at the chiller tower to limit its effect on urban heat islanding. Electric air conditioners, on the other hand, emit sensible heat into the atmosphere.
Genelink (Figure 5.21) is a gas absorption chiller/heater that utilizes waste heat. It first uses the water heated by exhaust from cogeneration. If the hot water runs short, the backup gas system takes over. At rated power, energy consumption can be reduced by 25% using waste-heat for water heating. At a partial load of less than 40%, the waste-heat utilisation increases to the point that it can be operated only with waste heat.
Figure 5.21 Genelink waste-heat absorption method
Figure 5.22 Solar absorption chiller/heater system
Figure 5.20 Gas heat-pump system that can supply
external power
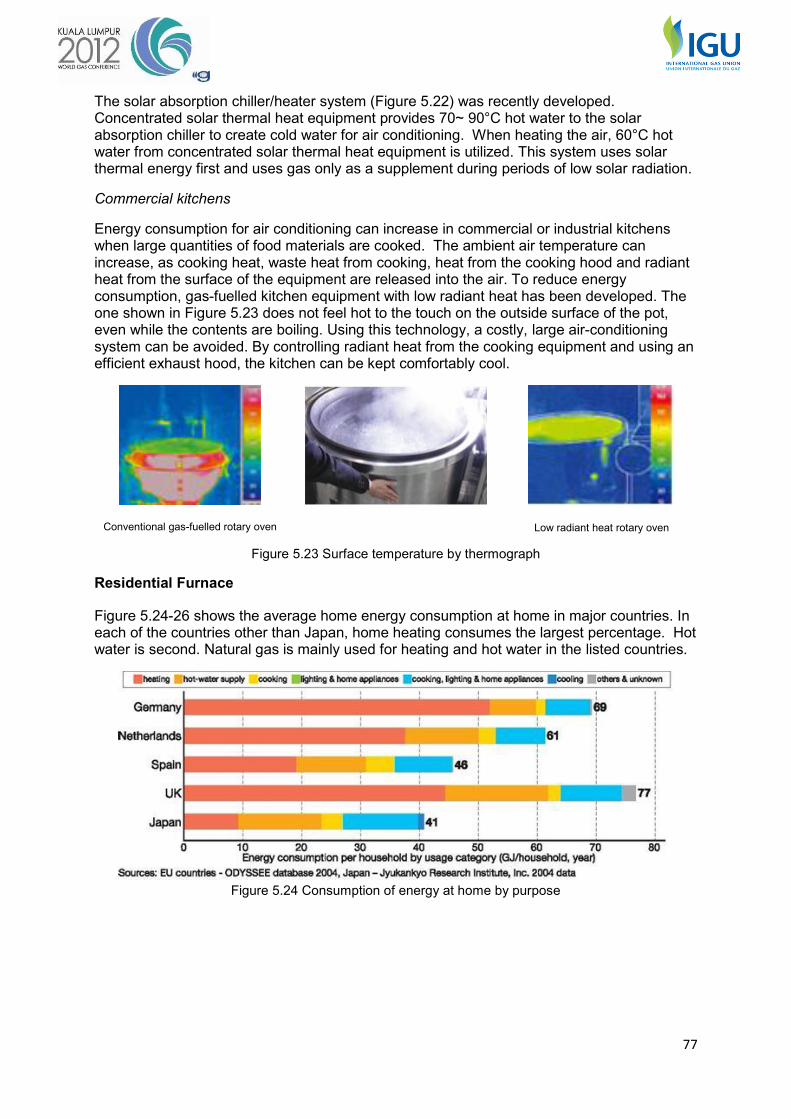
77
The solar absorption chiller/heater system (Figure 5.22) was recently developed. Concentrated solar thermal heat equipment provides 70~ 90°C hot water to the solar absorption chiller to create cold water for air conditioning. When heating the air, 60°C hot water from concentrated solar thermal heat equipment is utilized. This system uses solar thermal energy first and uses gas only as a supplement during periods of low solar radiation.
Commercial kitchens
Energy consumption for air conditioning can increase in commercial or industrial kitchens when large quantities of food materials are cooked. The ambient air temperature can increase, as cooking heat, waste heat from cooking, heat from the cooking hood and radiant heat from the surface of the equipment are released into the air. To reduce energy consumption, gas-fuelled kitchen equipment with low radiant heat has been developed. The one shown in Figure 5.23 does not feel hot to the touch on the outside surface of the pot, even while the contents are boiling. Using this technology, a costly, large air-conditioning system can be avoided. By controlling radiant heat from the cooking equipment and using an efficient exhaust hood, the kitchen can be kept comfortably cool.
Conventional gas-fuelled rotary oven
Low radiant heat rotary oven
Figure 5.23 Surface temperature by thermograph
Residential Furnace
Figure 5.24-26 shows the average home energy consumption at home in major countries. In each of the countries other than Japan, home heating consumes the largest percentage. Hot water is second. Natural gas is mainly used for heating and hot water in the listed countries.
Figure 5.24 Consumption of energy at home by purpose

78
Figure 5.25 Consumption of energy for home heating Figure 5.26 Consumption of energy for hot-water supply
Recently, rules and regulations have been put in place for heightening the efficiency of the residential furnace. The heat recovery furnace is being promoted that utilizes the waste heat effectively instead of just exhausting it as in the past. In the United Kingdom, the large percentage of natural gas consumption, i.e. 70% for home use, is on the increase every year. Since April, 2005, the equipment efficiency standard is included in the building energy conservation standard. Campaigns promoting installation of high-efficiency equipment are the natural result. In the Netherlands, the intensive campaign promoting the wider use of high-efficiency equipment began about 28 years ago. Currently, it is the standard. In addition, the standard for energy usage in buildings is becoming stricter every year, and it cannot be met without installing a heat recovery furnace. This furnace is recognized as being the low NOx equipment as well. In Germany, it became widely used due to the NOx regulations pursuant to the Federal Air Pollution Control Act.
In the United Kingdom, the coloured labels from A to G showed the efficiency of the commercially available furnaces. Manufacturers were not required to use this labelling. (The coloured banks were discontinued in 2010 to avoid confusion with the proposed European energy label using similar ratings based on different principles.72) Installation of heat-recovery water heaters has been required since April 2005 based on the Building Regulations 2000, Conservation of Fuel and Power, Parts L1A and L1B. For oil-fired furnaces, heat-recovery equipment had to be installed after January 2007. As of October 2010, new construction or replacement furnaces must be gas heaters rated at 90% or greater efficiency by the SEDBUK 2005 standard or 88% by the new 2009 standard. This is the means for creating greater energy efficiency. There are also subsidies to promote the wider use.
Status of renewable energy use (solar thermal use)
Figure 5.28 shows the target values for 2020 in the European countries for renewable energy and the level of actual installations in 2005. The highest rate is about 40% in Sweden. The target for the EU is 20% renewable energy by 2020.
72 http://www.sedbuk.com/pages/sap2009.htm
Figure 5.27 Colour-coded furnace efficiency ratings

79
Figure 5.28 Renewable energy in 2005 and target by 2020
The status of solar thermal use in the EU
Figure 5.29 shows the changes of the market for solar thermal in the 27 countries of the EU and Switzerland. Over 10 years since 2000, the solar thermal use has tripled. Germany has the major share - almost one third - of the total solar thermal market. After Germany are Austria, France, Greece, Italy and Spain. Solar thermal use is promoted in these countries.
Germany is most advanced in terms of using solar thermal energy. The 2009 Erneuerbares- Energien-Wärmegesetz (EEWärmeG, Heat Act) requires all new buildings to satisfy some portion of their heat demand through renewable energy or, alternatively, improve insulation or use district heating or CHP. Germany is also raising its energy-related requirements for buildings by an average of 30%. With amendments to the Energy Conservation Act and the Renewable Energy Sources Act, the use of renewable energy has become mandatory.
In Spain, the CTE (Technical Building Code) was enacted September 2006. This is a building construction standard that promotes renewable energy use. For new construction and modifications or renovation of existing buildings, solar thermal energy is a requirement for any hot water supply including pool heating, but excluding the heating of water for space heating.
Source: ESTIF (The European Solar Thermal Industry Federation), Solar Thermal Markets in Europe: Trends and Market Statistics 2010, June 2011
Figure 5.29 Solar Thermal Market in the EU and Switzerland (2010)

80
In the countries where solar thermal use is promoted and is well advanced, government often supports the effort by offering subsidies. In Germany, gas companies are giving rebates when old furnaces are replaced with the heat recovery type, and for solar thermal installations. The amount of the payment differs depending on the gas company. The reserve fund is created through surcharges on customer bills.
Smart Energy House
In Japan, there is a CHP system demonstration project for the residential system to show zero CO2 emissions with a comfortable and environmentally friendly lifestyle. This utilizes natural gas to generate the electricity and efficiently uses the heat produced. The system has two forms of generation – a SOFC fuel cell with a 700W power generating capacity and polycrystalline solar panel with 5.08kW generation capacity tied in with a lithium-ion battery with a storage capacity of 3.5kWh. Both heat and power are produced, stored and consumed in a smart fashion, making full use of information technology.
The demonstration house for the experiment has been constructed. The technology implementation and the effect of the systems are being tested, starting in January 2011. The test will run until March 2014. The development of the marketable commercial technology is targeted for completion in 2015. In this study, the Home Energy Management System (HEMS) provides (1) optimum control of the three batteries shown in Figure 5.30, (2) management and control of home appliances, the hot water supply system, and the automated control systems, (3) visualization of energy flows, (4) energy conservation and (5) energy conservation advice. Finally, energy conservation level and the degree of comfort will be examined. In addition, the residents’ pattern of HEMS usage will be analyzed. It is also planned to analyze any changes in the awareness or lifestyles before and after using HEMS.
Figure 5.30 Smart Energy House

81
Cooking equipment
Residential energy consumed in the kitchen per household in 2005 was smaller than hot water supply or heating, but a not insignificant amount. The major appliances in the kitchen provide cooking heat. The induction cooker using magnetic induction heating is a competitor to the gas range, but gas ranges have recently become very efficient.
Figure 5.31 shows the comparison of heat distribution in the bottom of a pot while cooking with a gas range and an induction cooker. It shows that temperature distribution is more consistent and also higher in the case of the gas range. The latest type of gas range has a heat sensor built in. It measures the temperature of the pot bottom to prevent overheating as well as keeping the set temperature automatically.
Source: Osaka Gas pamphlet
Figure 5.32 Comparison of total energy consumed
When comparing the total energy efficiency, electricity has waste heat loss at the power plant and transportation loss, but gas has very little loss in production or transportation. From this perspective, the primary energy use of the gas range is about half that of the electric induction cooker (Figure 5.32). As Figure 5.33 shows, the recent home gas ranges come with the sensor so that the flame is well controlled for efficient use, improving heat efficiency.
Source: Osaka Gas pamphlet
Figure 5.33 Comparison of high efficiency [L] and conventional [R] burners
Figure 5.31 Comparison of pan bottom temperature distribution
for gas range and induction cooker

82
Transportation
Figure 5.34 Breakdown of world greenhouse gas emissions
The transportation segment emits 21.2% of the total greenhouse gases. (See Figure 5.34) The major source of the emissions is automobiles (17.2%). To prevent global warming and environmental pollution from automobile exhaust, it is necessary to introduce more low-pollution vehicles such as electric vehicles (EV), hybrid vehicles and natural gas vehicles (NGV).
Some options for reaching zero greenhouse gas emissions are the wide use of electric vehicles running on renewable energy, biogas vehicles and biodiesel vehicles. However, each of these has its drawbacks. Supply insecurity is an issue for biogas and biodiesel vehicles. Although EVs may be the most environmentally friendly vehicles, they have a number of issues that will slow their uptake. Table 5.2 compares EVs and NGVs in key areas:
Table 5.2 Comparison of EVs and NGVs
Electric Vehicle Natural Gas Vehicle High cost of renewable power sources and batteries
Low cost of natural gas
Limited range Longer range Require extensive modifications and upgrades to electric distribution systems and upgrading of local distribution transformers
Distribution system already exists in most areas.
Lengthy fuelling time Brief fuelling time Lack of world standards for fast chargers Standardized fuelling methods. Cannot be used for heavy-duty vehicles Well adapted for heavy-duty vehicles. Cannot be used in remote, off-grid locations CNG and propane vehicles can be used in
remote, off-grid locations. Natural gas is especially useful for displacing petroleum in heavy-duty transportation such as trucks and buses. NGV are becoming more prevalent in fleet vehicles. In the United States, compressed natural gas and liquefied natural gas (CNG and LNG) transit buses now account for about 2/3 of all vehicular natural gas use. Waste collection and transfer vehicles, (11%), are the fastest growing NGV segment.73 In San Francisco, the city requires taxi fleets to meet aggressive carbon emission reduction targets. As a result, over 55% of San Francisco taxis 73 NGV America, http://www.ngvc.org/mktplace/index.html

83
are either hybrids or NGV. Taxi drivers are experiencing between 20% and 40% savings in fuel costs.74 Internationally, NGV have begun to show a presence on the market in Pakistan, Argentina and Brazil since around the year 2000. So far, 10 million vehicles have been sold globally. (See Figure 5.35)
NGV are clean burning and reduce carbon emissions, as shown in Table 5.3.
Table 5.3 - Fossil Fuel Emission Levels Pounds per Billion Btu Energy Input 75
Pollutant Natural Gas Oil Carbon Dioxide 117,000 164,000 Carbon Monoxide 40 33 Nitrogen Oxides 92 448 Sulphur Dioxide 1 1,122 Particulates 7 84 Mercury 0 0.007 Source: EIA - Natural Gas Issues and Trends 1998
In order to promote wider use of natural gas vehicles, more natural gas fuelling stations will be necessary. Currently, bi-fuel vehicles using natural gas as a main fuel source and gasoline or liquid propane gas as a secondary fuel source are increasingly coming into use. Natural gas hybrid vehicles are also in development in Japan. They use natural gas as the engine fuel and combine that with batteries and an electric motor. Natural gas vehicles are thought to become one of the mainstream vehicles for the global market as they can help prevent global warming and provide energy security by breaking oil dependency.
Figure 5.35 Worldwide sales of natural gas vehicles
Hydrogen vehicles and fuel-cell vehicles use hydrogen and both are clean, because the exhaust is only water. Hydrogen vehicles use the combustion heat of hydrogen to run the engine. Mazda and BMW developed them but they are not commercially available yet. Recently, more effort was shifted to developing fuel cell vehicles, which run the electric motor by power produced from a chemical reaction of hydrogen and oxygen in air. Hydrogen fuelling stations are commercially available now. The barriers for wide use for now are production cost and durability. 74 SF Taxi Driver Wages 10-Year Battle to Reduce Fleet Emissions, And Wins,
http://www.hybridcars.com/environment/sf-taxi-driver-wages-10-year-battle-reduce-fleet-emissions-and-wins-28788.html
75 http://www.naturalgas.org/environment/naturalgas.asp

84
Figure 5.36 Appropriate uses for different types of vehicles in different segments
Figure 5.36 shows the appropriate use of different types of vehicles in different segments. Segments are divided up by total weight of the vehicles and running distance. The vehicle types are by type of low carbon technology use. In the long-term outlook, some segments are most appropriate for natural gas, such as midrange-distance and urban use.
Natural gas use in other areas such as maritime transport
Natural gas may be used in maritime and railroad transportation. China and Norway are developing LNG marine engines. Heavy oil is currently the main energy source for the maritime industry, so there could be a huge potential for switching to natural gas as a fuel. As for railroads, JR East Japan modified locomotives to be fuel cell hybrids. Trial runs started in 2006. The challenge to lower the cost is still an issue but, nevertheless, natural gas can become a fuel for the maritime and railway industries as well.
Feedstocks
Natural gas is also used as a source material for industrial products. Natural gas provides the base ingredients for such varied products as plastic, fertilizer, antifreeze, pharmaceutical products, and fabrics.
Methane is a major element of natural gas and it is transformed into chemical products such as ammonia, formalin and methanol (methyl alcohol). The first step in making methanol is to convert natural gas into synthesis gas, a mixture of hydrogen and carbon monoxide. In this process, natural gas is exposed to a catalyst that causes oxidization of the natural gas when brought into contact with steam (steam reforming). Synthesis gas is the building block for methanol, which in turn is used to produce such substances as formaldehyde, acetic acid, plastics, adhesives and MTBE (methyl tertiary butyl ether), used as an additive for cleaner

85
burning gasoline76. Methanol is also used as a solvent for chemical reactions, as a fuel for power generation systems and as a fuel source in fuel cells.
Ammonia is a material for basic chemical products such as nitric acid and ammonium-sulphur compounds for fertilizer. It is an industrially important compound. Formalin is used as a disinfectant, but is also a raw material for plastics and adhesives with a large market.
Ammonia, methanol and pure ethylene and their downstream products can be recycled. Commercial products can be created out of fertilizer, pharmaceuticals, plastics and the like.
Enhancing the level of production efficiency leads to resource and energy saving.
Table 5.4 Products produced from natural gas
Chemical material product Products Methanol Plastic, Adhesives, Acetic acid, Solvents, Fuel Ammonia Nitric acid, Fertilizer Formalin Disinfectant, Plastic, Adhesives
Recently, we can find a unique best practice using cold-temperature liquid natural gas (LNG). LNG consists of methane, ethane, and LPG. The calorific value differs depending on the ratio of ethane to LPG. Far East countries such as Japan and Korea accept LNG with a high calorific value, but in the United States, LNG with the low calorific value is sought after. Development of technologies for removal of LPG elements to reduce the calorific value at the LNG receiving terminal is becoming a hot topic. The ethane and LPG can then be used as source materials for the petrochemical industry.
* Detailed explanation of the Best Practices are shown in the attached CD.
76 MTBE has been phased out as a gasoline additive in the United States due to water pollution concerns.

86
List of Figures
Figure 1.1 Annual per capita electricity use of world countries Figure 1.2 Annual Installation of Wind Capacity Figure 1.3 Examples of variations in daily output of wind and solar power Figure 1.4 Uranium prices Figure 1.5 “Peak Oil” of Selected Major Producers Figure 1.6 Forecasts of world oil production Figure 1.7 New Coal Generation Build Rate (China & US) Figure 1.8 Mercury Deposition in the U.S. Figure 1.9 2009 Gas Net Global Trade Movements (Billion Cubic Meters) Figure 1.10 Natural Gas Prices Figure 1.11 World primary energy demand by fuel in the GAS scenario Figure 1.12 World energy-related CO2 emissions Figure 1.13 Global Remaining Recoverable Gas Resource & Global Gas Supply Cost Curve Figure 1.14 U.S. Natural Gas Consumption Figure 1.15 Emission Reduction Contribution by lever Figure 1.16 Optimized pathway for achieving abatement targets Figure 1.17 Shares of world primary energy & Growth of fuel inputs to power Figure 1.18 Natural gas demand by region & Natural gas production by type Figure 1.19 Uses for natural gas Figure 1.20 World shale gas resources Figure 2.1 Life-cycle emissions for power generation by fuel type Figure 2.2 GHG emissions associated to the various steps of the life cycle of the 3 natural
gas uses assessed in the Eurogas-Marcogaz LCA Figure 2.3 Technological processes that create methane and CO2 emissions Figure 2.4 Flare Gas Reduction Figure 2.5 Natural gas flow Figure 2.6 LNG flow Figure 2.7 LNG satellite terminal Figure 2.8 Gas distribution Figure 3.1 Technological processes that create methane and CO2 emissions Figure 4.1 Pipeline pressure maintained by compressor stations Figure 4.2 Building phase Figure 4.3 Pipeline after one year Figure 4.4 Typical compressor station Figure 4.5 Gas compressor Figure 4.6 Gas turbine as compressor drive Figure 4.7 Compressor station in Germany with 8 compressor units Figure 4.8 Metering station Figure 4.9 Pressure-regulating station Figure 4.10 Gas processing steps Figure 4.11 Simplified LNG Block Figure 4.12 Liquefaction Plant – SEGAS, Damietta Figure 4.13 LNG tanker Figure 4.14 LNG receiving terminal Figure 4.15 LNG satellite terminal

87
Figure 4.16 Gas distribution Figure 4.17 City gate: Plant for receiving, reducing and measuring gas provided by a
transmission pipeline Figure 4.18 Medium pressure reduction plant Figure 4.19 Gas Meter Figure 4.20 Seal test Figure 5.1 Breakdown of current worldwide usage of energy by type of generation and
prediction for 2035 Figure 5.2 Weighted average efficiency of fossil-fired power production in various countries Figure 5.3 Advanced Combined Cycle power generation Figure 5.4 Comparison of total energy efficiency of CHP and conventional system Figure 5.5 Heat and power ratio of energy consumption for industrial, commercial and
residential use in Japan (2007) Figure 5.6 Cascade utilisation of the heat produced from CHP Figure 5.7 Cogeneration share of global generation facilities Figure 5.8 Range of cogeneration facilities developed and currently in use in Japan Figure 5.9 Gas engine efficiency improvements Figure 5.10 Gas engine efficiency improvements Figure 5.11 Smart Energy Network Figure 5.12 Cogeneration using engine for residential use Figure 5.13 Diagram of fuel cell Figure 5.14 City gas as industrial energy Figure 5.15 Reduction of CO2 by changing the energy source and burner system Figure 5.16 Regenerative burner Figure 5.17 Regenerative burner system Figure 5.18 Diagrammatic illustration of market breakdown for air-conditioning system with gas
absorption chiller and gas heat pump in Japan Figure 5.19 Changes in performance of gas air-conditioning systems (absorption chillers and
GHP) Figure 5.20 Gas heat-pump system that can supply external power Figure 5.21 Genelink waste-heat absorption method Figure 5.22 Solar absorption chiller/heater system Figure 5.23 Surface temperature by thermograph Figure 5.24 Consumption of energy at home by purpose Figure 5.25 Consumption of energy for home heating Figure 5.26 Consumption of energy for hot-water supply Figure 5.27 Colour-coded furnace efficiency ratings Figure 5.28 Renewable energy in 2005 and target by 2020 Figure 5.29 Solar Thermal Market in the EU and Switzerland (2010) Figure 5.30 Smart Energy House Figure 5.31 Comparison of pan bottom temperature distribution for gas range and induction
cooker Figure 5.32 Comparison of total energy consumed Figure 5.33 Comparison of high efficiency [L] and conventional [R] burners Figure 5.34 Breakdown of world greenhouse gas emissions Figure 5.35 Worldwide sales of natural gas vehicles Figure 5.36 Appropriate uses for different types of vehicles in different segments

88
List of Tables
Table 1.1 Production, reserves and consumption of primary energy by region Table 1.2 Annualized growth and percentage share for most-prevalent forms of renewable
energy Table 1.3 Environmental impacts of fuel sources Table 3.1 List of measures to reduce greenhouse gas emissions Table 3.2 Emission Sources and Reduction Technologies Table 4.1 Technologies and Practices to Reduce Emissions Table 4.2 Technologies to reduce GHG emissions and energy use Table 5.1 Recent line-up of cogeneration systems using small gas engines (LHV standard) Table 5.2 Comparison of EVs and NGVs Table 5.3 Fossil Fuel Emission Levels Table 5.4 Products produced from natural gas