
REDUCTION OF GHG EMISSIONS FROM SHIPS … de plan gestion...The SEEMP is written using IMO circular...
39
I:\MEPC\62\INF-10.doc E MARINE ENVIRONMENT PROTECTION COMMITTEE 62nd session Agenda item 5 MEPC 62/INF.10 8 April 2011 ENGLISH ONLY REDUCTION OF GHG EMISSIONS FROM SHIPS Example of a Ship Energy Efficiency Management Plan Submitted by Oil Companies International Marine Forum (OCIMF) SUMMARY Executive summary: This submission gives an example of a Ship Energy Efficiency Management Plan currently in use by an oil tanker operator Strategic direction: 7.3 High-level action: 7.3.1 Planned output: 7.3.1.1 Action to be taken: Paragraph 4 Related documents: MEPC.1/Circ.683, MEPC.1/Circ.684; and MEPC 62/INF.12 Introduction 1 The Marine Environment Protection Committee (MEPC) at its fifty-ninth session agreed to circulate a "Guidance for the Development of a Ship Energy Efficiency Management Plan" (MEPC.1/Circ.683) and "Guidelines for Voluntary Use of the Ship Energy Efficiency Operational Indicator" (EEOI) (MEPC.1/Circ.684), which encouraged the voluntary development and use of the Ship Energy Efficiency Management Plan (SEEMP). 2 This document gives, it its annex, an example of a SEEMP currently in use by an oil tanker operator. 3 It is the intention of the sponsor of this document to advise MEPC of real examples where use of the SEEMP has resulted in fuel consumption reduction and consequently in CO 2 emission reductions from tankers using it, which is provided in document MEPC 62/INF.12. Action requested of the Committee 4 The Committee is invited to note the information contained in this document. ***
Transcript of REDUCTION OF GHG EMISSIONS FROM SHIPS … de plan gestion...The SEEMP is written using IMO circular...
I:\MEPC\62\INF-10.doc
E
MARINE ENVIRONMENT PROTECTION COMMITTEE 62nd session Agenda item 5
MEPC 62/INF.108 April 2011
ENGLISH ONLY
REDUCTION OF GHG EMISSIONS FROM SHIPS
Example of a Ship Energy Efficiency Management Plan
Submitted by Oil Companies International Marine Forum (OCIMF)
SUMMARY
Executive summary: This submission gives an example of a Ship Energy Efficiency Management Plan currently in use by an oil tanker operator
Strategic direction: 7.3
High-level action: 7.3.1
Planned output: 7.3.1.1
Action to be taken: Paragraph 4
Related documents: MEPC.1/Circ.683, MEPC.1/Circ.684; and MEPC 62/INF.12
Introduction 1 The Marine Environment Protection Committee (MEPC) at its fifty-ninth session agreed to circulate a "Guidance for the Development of a Ship Energy Efficiency Management Plan" (MEPC.1/Circ.683) and "Guidelines for Voluntary Use of the Ship Energy Efficiency Operational Indicator" (EEOI) (MEPC.1/Circ.684), which encouraged the voluntary development and use of the Ship Energy Efficiency Management Plan (SEEMP). 2 This document gives, it its annex, an example of a SEEMP currently in use by an oil tanker operator. 3 It is the intention of the sponsor of this document to advise MEPC of real examples where use of the SEEMP has resulted in fuel consumption reduction and consequently in CO2 emission reductions from tankers using it, which is provided in document MEPC 62/INF.12. Action requested of the Committee 4 The Committee is invited to note the information contained in this document.
***

MEPC 62/INF.10 Annex, page 1
I:\MEPC\62\INF-10.doc
ANNEX
Ship Energy Efficiency Management Plan
(SEEMP) Version 1.0 January 1, 2011

MEPC 62/INF.10 Annex, page 2
I:\MEPC\62\INF-10.doc
TABLE OF CONTENTS
Document Holders ..................................................................................................................... 4
Revision History ........................................................................................................................ 4
Introduction ................................................................................................................................ 4
SEEMP Documentation and Sources ............................................................................ 4
Fuel-Efficient Operations ................................................................................................ 5
Weather Routing System .......................................................................................................... 6
Description ....................................................................................................................... 6
WNI Routing Procedure .................................................................................................. 7
Best Practices .................................................................................................................. 8
Virtual Arrival, Speed Control and Voyage Planning ............................................................. 8
Speed Control Orders ..................................................................................................... 9
Performance Trials .......................................................................................................... 9
Best Practices .................................................................................................................. 9
Propeller and Hull Cleaning .................................................................................................... 10
Best Practices ................................................................................................................ 10
Engine Performance Management (Optimization) ................................................................ 10
Best Practices ................................................................................................................ 11
Boiler Performance Management (Optimization).................................................................. 11
Boiler Operations and Optimization ............................................................................ 11
Steam Control ................................................................................................................ 11
Combustion Control ...................................................................................................... 11
High Efficiency DFO Burner ......................................................................................... 12
Air Modelling .................................................................................................................. 12
Best Practices ................................................................................................................ 12
Onboard Bunker Management ............................................................................................... 12
Best Practices ................................................................................................................ 13
MEPC 62/INF.10 Annex, page 3
I:\MEPC\62\INF-10.doc
Power Generation .................................................................................................................... 13
Onboard Energy Audit .................................................................................................. 14
Best Practices ................................................................................................................ 14
Cargo and Bunker Heating ..................................................................................................... 15
General Principle ........................................................................................................... 15
Cargo Heating Plan ....................................................................................................... 16
Best Practices ................................................................................................................ 17
Draft and Trim Optimization ................................................................................................... 18
Process .......................................................................................................................... 19
Crew Familiarization and Training ......................................................................................... 19
Accommodation – Specific Energy Conservation Program ................................................ 19
Monitoring and Verification .................................................................................................... 19
Explanations for the Operational Index Calculator .................................................... 20
Best Practices Summary .............................................................................................. 21
Appendix 1 – ******* .................................................................................................................. 23
Appendix 2 – Sample Heating Plan and Heating Abstract ................................................... 24
Appendix 3 – Example of how to use a Sample Heating Plan and Heating Abstract ........ 27
Appendix 4 – Operational Index Calculator .......................................................................... 30
Appendix 5 – GPS Log Function ............................................................................................ 37
MEPC 62/INF.10 Annex, page 4
I:\MEPC\62\INF-10.doc
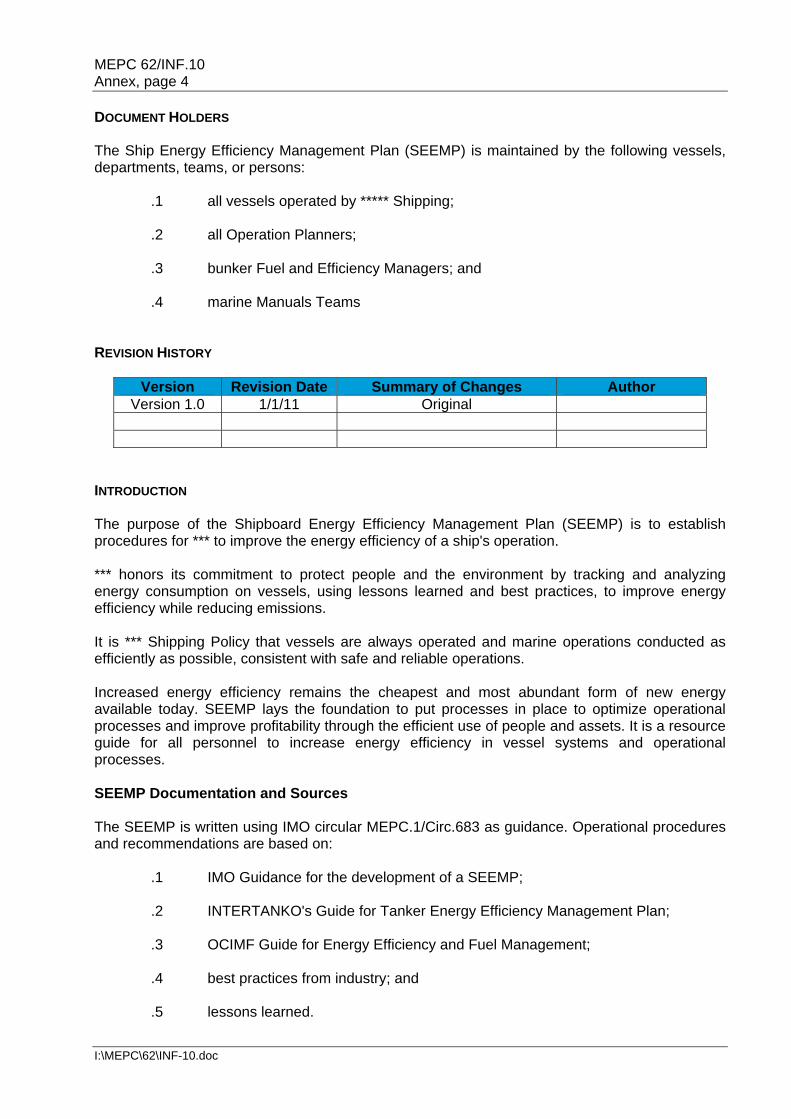
DOCUMENT HOLDERS The Ship Energy Efficiency Management Plan (SEEMP) is maintained by the following vessels, departments, teams, or persons:
.1 all vessels operated by ***** Shipping;
.2 all Operation Planners;
.3 bunker Fuel and Efficiency Managers; and
.4 marine Manuals Teams REVISION HISTORY
Version Revision Date Summary of Changes Author Version 1.0 1/1/11 Original
INTRODUCTION The purpose of the Shipboard Energy Efficiency Management Plan (SEEMP) is to establish procedures for *** to improve the energy efficiency of a ship's operation. *** honors its commitment to protect people and the environment by tracking and analyzing energy consumption on vessels, using lessons learned and best practices, to improve energy efficiency while reducing emissions. It is *** Shipping Policy that vessels are always operated and marine operations conducted as efficiently as possible, consistent with safe and reliable operations. Increased energy efficiency remains the cheapest and most abundant form of new energy available today. SEEMP lays the foundation to put processes in place to optimize operational processes and improve profitability through the efficient use of people and assets. It is a resource guide for all personnel to increase energy efficiency in vessel systems and operational processes. SEEMP Documentation and Sources The SEEMP is written using IMO circular MEPC.1/Circ.683 as guidance. Operational procedures and recommendations are based on:
.1 IMO Guidance for the development of a SEEMP; .2 INTERTANKO's Guide for Tanker Energy Efficiency Management Plan; .3 OCIMF Guide for Energy Efficiency and Fuel Management; .4 best practices from industry; and .5 lessons learned.
MEPC 62/INF.10 Annex, page 5
I:\MEPC\62\INF-10.doc
Fuel-Efficient Operations The strategy of SEEMP is to achieve maximum fuel efficiency while maintaining organizational effectiveness. The plan focuses on the systems and processes with the highest energy conservation potential and implements procedures without placing unnecessary burdens on VMTs and Voyage Managers. Weather Routing System Vessels using Weather Routing have demonstrated potential for efficiency saving on specific routes. This allows ***** Shipping to plan routes, when possible, to take advantage of favourable weather and avoid adverse weather to obtain the best performance in speed or consumption. Virtual Arrival, Speed Control and Voyage Planning Communication and team work between the Charterer, Customer, and Ship Owners can yield significant savings in energy usage. Unexpected delays, timely arrivals, and wait time are all key factors that contribute to energy consumption. By using Virtual Arrival and maintaining appropriate speed control in voyage planning, all parties involved each play a key role in ensuring that a ship arrives at its destination as efficiently as possible. Propeller and Hull Inspection Ship resistance is improved by keeping the propeller and hull clean. Hull and propeller cleaning (polishing) is a very effective way to reduce hull resistance and improve overall efficiency. In general, propellers are cleaned on a six month basis. Hull Cleaning is carried out based on a condition assessment. Engine Performance Management (Optimization) By regularly monitoring the performance of the main engine and generators and keeping the performance of the engines optimized, *** Shipping can attain fuel savings. The energy optimization program consists of visual inspection and performance monitoring using the *** and/or other monitoring equipment. Boiler Performance Management (Optimization) Improving onboard steam management and improving overall boiler efficiency can improve reliability and reduce operational costs. Managing the boilers and new techniques for air modelling, improved steam controls, oxygen trim combustion controls and burners can improve efficiency. Onboard Bunker Management Managing bunkers is important in improving reliability and reducing the chances of incompatible fuel related incidences. The crew of a ship should have well developed stowage plans and be familiar with each parcel of fuel and the specifications of that fuel. Power Generation The generation and consumption of power onboard represents an opportunity to save fuel and minimize running hours on the power generators. The crew of a ship should be conscious of the high electrical consumers and try to reduce their use as much as possible or operate this equipment when additional generating capacity is required for other uses.
MEPC 62/INF.10 Annex, page 6
I:\MEPC\62\INF-10.doc
Cargo and Bunker Heating A comprehensive voyage-specific cargo heating plan can greatly reduce emissions and heating costs. Cargo and bunker should be heated in the most economical way possible and a heating plan thereof should be implemented shortly after departure. Create and implement a heating plan shortly after loading a cargo. Once en route, the heating plan should be reviewed and updated daily, taking into consideration the various factors that affect the heating and customer requirements. Draft and Trim Optimization Operating the vessels at the optimum trim and draft can significantly improve efficiency. The VMT should have plans to manage the trim of the vessel to compensate for fuel consumed and maintain the vessel at the most fuel efficient draft and trim consistent with operational requirements. Crew Familiarization and Training As the operators of the vessel, each crew member plays a key role in making the vessel and each voyage more energy efficient. As part the of initial vessel familiarization, each crew member should have a complete understanding of the specific vessel's operations and how the crew's interactions with that specific piece of equipment has the potential to waste or save energy. A key component of the vessel familiarization process should be a discussion on energy conversation and consumption. Other Energy Conservation Measures Crews should be trained in best practices for managing the power onboard such as switching off equipment which is not being used etc. WEATHER ROUTING Weather Routing has demonstrated efficiency savings on specific voyages. Weather Routing allows *** Shipping to plan routes, when possible, to take advantage of favourable weather and avoid adverse weather to obtain the best performance in speed or consumption. Efficient weather routing helps the vessel Master and the crew to improve the speed, performance, scheduling, fuel consumption, and safety of a ship. Description Our Weather Routing Program consists of two parts:
.1 The Bridge Weather Routing System is an onboard weather information and route guidance system.
.2 The Fleet Management System (FMS) is a web-based application. It enables
shore-side managers to monitor vessel and fleet performance and then use this data to take more informed decisions.
MEPC 62/INF.10 Annex, page 7
I:\MEPC\62\INF-10.doc
All vessels are outfitted with the Bridge Weather Routing System, which enables VMTs to take strategically and economically sound decisions at the voyage planning stage. It provides the VMT with various route options, a weather forecast of 10 days, route optimization, post-voyage analysis, bunker reports, and route reports. The Weather Routing System also allows VMTs to update the forecast during the voyage, to make adjustments if necessary and to review collected data after the voyage. The Fleet Management System is a web-based application that enables users to track the vessel's position and see the world's weather in surrounding areas. Office staff can also set parameters which can be monitored and alarms can be set such as high fuel consumption or under speed performance. WNI Routing Procedure All vessels navigating in regions of storm activity and vessels on trans-ocean passages are required to request weather routing advice from Weather News International (WNI) on each voyage. Vessels on coastal voyages are not required to participate in weather routing. Vessels are required to request weather routing prior to each passage. An email is to be sent to [email protected] to request weather routing advice. The email should include information on:
.1 departure port (or position); .2 estimated Time of Departure (ETD); .3 destination port (or position); .4 voyage Plan (Master's voyage plan should consist of Master's planned route
already optimized by using onboard Orion system); .5 intended speed; .6 load condition; and .7 any special concerns or requirements.
Once WNI receives the routing request from a vessel, it will provide the vessel with its suggested route (Master's route further optimized for weather) and its instructions for reporting the vessel's position (usually a copy on noon reports). Upon receiving the WNI routing plan, vessels are to follow the procedure set out below:
.1 Update the Bridge system daily for the duration of the voyage to continue tracking the changing weather conditions. If the vessel decides to deviate from the suggested track, the vessel must then contact WNI, discuss the Master's concerns, and request updated routing advice. This is an excellent opportunity for open dialogue between WNI and the vessel where a customized route can be generated taking into account the advice of WNI and the valuable experience of the Master.
.2 WNI generates a Voyage Comparison Report to compare WNI's recommended
route and the vessel's actual route to track the deviation of bunker consumption, weather, and speed. The Master has the final authority on whether to follow the
MEPC 62/INF.10 Annex, page 8
I:\MEPC\62\INF-10.doc
WNI routing advice. If the Master decides to deviate from the advice of the WNI, he must notify the Operations Planner of the decision.
The WNI meteorologists and coordinators are always available to offer assistance and receive feedback. Report any missed forecast or other problems with weather routing or weather forecast to the Fuel Manager as soon as possible after the event. WNI's Operations Centre operates 24 hours a day. To contact WNI via landline, use the Master's hotline number: 1-405-310-2919. Through the Fleet Management System (FMS), which is the shore-based computer system, the shore-based staff is able to continuously track the performance of each vessel. Data from the FMS system will be used to review each ship's performance under given weather conditions. At the end of the voyage, the Master should send WNI an end of sea passage notice. The Master and the Operations Planner are to discuss the voyage comparison report, and the lessons learned. The Master has the right to tailor a custom route using the advice of the WNI for the best optimization. At the end each quarter, WNI sends a return on investment (ROI) report highlighting voyage performance including time and fuel savings. Voyage Managers and shore-based staff will review and analyze performance results. Best Practices
.1 During the voyage, the Master should contact WNI if the experienced weather differs from the forecasted weather using the Master's hotline.
.2 Prior to any tank cleaning and preparing for shipyard, the Master should contact
WNI to seek advice on the best time to perform the procedures to maintain optimum sea-keeping.
VIRTUAL ARRIVAL, SPEED CONTROL AND VOYAGE PLANNING The concept of Virtual Arrival is about identifying delays at discharge ports so as to better manage the vessel's arrival time at that port by managing/reducing the vessel's speed, resulting in reduced fuel consumption and emissions but not reduced capacity. By taking advantage of known inefficiencies in the supply chain and reducing speed when the terminal is not ready to discharge the cargo, fuel can be saved and emissions reduced. In addition, there are other regional benefits including reduced port congestion, improved safety, reduced anchorage congestion and lower emissions in the port area. Taking advantage of time in the schedule and slowing down the vessel is one of the easiest and most effective ways to save fuel. The importance of involving the Charterer, Customer and Ship Owner as well as other parties cannot be underestimated. A holistic approach can lead to significant savings. In ideal situations, the ships should arrive in ports at the required time, by operating the main engine in the most efficient way. The complexity and the many variables involved will require good communication with the customer.
MEPC 62/INF.10 Annex, page 9
I:\MEPC\62\INF-10.doc
Anyone involved in the decision making process should be aware of cost/benefit before defining a ship's arrival time. Small speed adjustments can save huge amounts of energy. The relationship between speed and fuel consumption should be considered during the voyage planning process. Speed Control Orders Reducing the vessel's speed offers the best possible chance for fuel savings. VMTs should work with Operation Planners to fully understand what speed orders they are being given. The following definitions should be considered as the standard operating procedures when discussing speed orders. Speed order (WSNP) = Weather safe navigation permitting ================================================ Full Service Speed = XX RPM's weather neutral (vessels actual speed will fluctuate basis weather/currents etc.) Most Economical Speed = This is the minimum speed that the vessel can operate at on a continuous basis (e.g. where you have sufficient steam generation to be able to heat the fuel oil and make water, and you do not need to run the main engine auxiliary blower.) Super Slow Steaming = A speed below the most economical speed where you need to run an additional boiler and main engine auxiliary blowers. It is a speed considered to be between 8 and 13 knots. Proceed basis xx.xx knots = Vessel permitted to adjust RPM's basis WSNP and min/max rpm's as needed to stay within +/- .5 knots of ordered speed. Adjust speed for timed arrival = Adjust RPM's closest to most economical speed in order to arrive prior to or at a specific time. Performance Trials The purpose of the performance trial is to ascertain the consumption at a given speed so that the predicted consumption can be accurately estimated for future voyages. The trials can also identify possible causes of changes in efficiency. In the future, these trials may be used to schedule propeller cleanings and hull fouling assessments. The VMT can also look at loss of performance for hull and propeller surfaces. However, at the current writing of this manual, it should be done on an interval of between 5 and 7 months. Best Practices
.1 Ships are to communicate economy impacts and choices of voyage orders to Voyage Managers and commercial planners.
.2 Voyage Managers are to provide the desired ETA at ports to allow the ship's
crew to better manage the speed and fuel consumption of the vessel. .3 Operation Planners are to advise each voyage if it is possible to transfer engine
slops to slop tanks to avoid diesel consumption in incinerator. Upon completion of the voyage, Operation Planner and VMT, in conjunction with the commercial group, will review the voyage plan. This review will compare planned versus actual fuel consumption.
MEPC 62/INF.10 Annex, page 10
I:\MEPC\62\INF-10.doc
The goal is to achieve an actual fuel consumption that deviates no more than 10% from the predicted fuel consumption. PROPELLER AND HULL CLEANING Marine growth on the hull and the propeller will increase their resistance. Regular in-service propeller polishing is required to reduce surface roughness caused by material organic growth and fouling. This can be done relatively quickly without disrupting service operation by using divers. Regular scheduled cleaning of the hull can reduce drag and minimize total fuel consumption. At an interval of 5 to 7 months from previous propeller polish or dry-docking, the VMT is to coordinate with the Repair Superintendant for propeller polish during the next available port visit. The interval between polishes should not exceed 7 months unless there is compelling documentation to support longer intervals and approved by the Hull and Coatings Engineer. In conjunction with every propeller polish, the hull is inspected for damage and marine growth as follows:
A. Within one year of new build: Divers assess the entire hull B. Less than 2 years after dry-docking: Divers assess stern and rudder C. More than 2 years after dry-docking: Divers assess the entire hull
If there is significant growth on the hull, an immediate decision to clean the hull can be made by the VMT in conjunction with the Repair Superintendent or the Hull & Coatings Engineer. The divers are to compile a detailed report containing the fouling condition details before and after cleaning. Forward two copies to the Hull and Coatings Engineer. Records are maintained onboard and in the office. Best Practices
.1 Monitor the propeller ship and overall efficiency of the vessel to look for possible hull fouling signs and schedule cleaning ahead of regularly scheduled cleaning. This performance loss can also be highlighted during the performance trials.
ENGINE PERFORMANCE MANAGEMENT (OPTIMIZATION) The engine optimization program is made up of two parts: Visual Inspection and Engine Performance Monitoring (***). The engine performance monitoring allows the engineers to optimize the cylinder pressure by adjusting the Variable Injection Timing (VIT). These two programs ensure the engine is optimized for peak performance. *** Shipping has an Engine Management Contract (EMC) with MAN/PrimeServ Los Angeles, which includes monitoring of the main engine and generator performance. The vessels use the *** (or other performance monitoring equipment), which is equipment that measures exhaust pressure. The ship's crew takes readings and forwards the results to MAN/PrimeServ so that they can generate monthly reports. The reports contain the following information:
MEPC 62/INF.10 Annex, page 11
I:\MEPC\62\INF-10.doc
A. Number of engines monitored as 100% of the engines available B. Vessels submitting reports within 48 hours after obtaining data onboard C. MAN/PrimeServ performance evaluations accomplished within 5 working days
of receipt of data D. Fleet wide and vessel specific status of outstanding open conditions E. Number of unplanned major engine maintenance activities per individual vessel F. Number of planned/requested maintenance where work order was generated
For more information on the *****, refer to appendix 1. Best Practices
.1 Stop M/E LO + Camshaft LO Pump in port if M/E notice allows. Many terminals require the M/E on short notice so it is not possible all the time, but when possible this should be done. Chief can use his discretion on this best practice.
BOILER PERFORMANCE MANAGEMENT (OPTIMIZATION) Boiler optimization can increase the overall boiler efficiency, increase reliability, and reduce operational cost. When operating boilers, the engineering staff should survey and optimize original boilers installed onboard to look for inefficiencies. When working with a boiler optimization company, the following steps should be taken. Boiler Operations and Optimization Significant fuel conservation can be achieved by minimizing overall steam consumption onboard. The correct boiler should be used for the expected demand. When boilers are needed, the operator should ensure that they are not started too far in advance from the time they are needed. Vessels should avoid dumping steam to avoid getting alarms throughout the night. Pipe and valve laggings are to be maintained in good order to minimize thermal losses. Boiler optimization is a new service that can take the ship's existing boiler and increase the overall boiler efficiency using modelling to look for inefficiencies in the current system. After modelling, inefficiencies can be corrected by installing special ducting and improved boiler electronic controls. Steam Control Convert the existing differential atomizing steam pressure system to a constant 6 bar steam pressure system. This will allow greater fuel flow turndown and reduce the operational maintenance cost. Please note that retuning of the combustion controls at the lower firing rates would be required. Combustion Control Upgrade the existing combustion controls to fully metered, cross limited with oxygen trim combustion controls using the modern Yokogawa YS1700 loop controllers.
MEPC 62/INF.10 Annex, page 12
I:\MEPC\62\INF-10.doc
High Efficiency DFO Burner Change out the existing rotary cup burner on the Donkey Boiler with a modern high efficiency DFO burner. This package burner comes complete with DFO pump and fully automated controls (BMS and combustion controls) with a 6:1 turndown. Air Modelling Air flow within the boiler combustion chamber can be modelled to look for inefficient air flow. Actual scale models of the boiler are constructed out of plastic. Air flow is simulated across the chamber. Air baffles are then added to improve the air flow achieve optimum combustion. The goal of the model is to lower the excess air requirements; decrease fuel gas emissions, increase boiler/burner turndown which will allow the burner to light-off with the air registers full open; increase carbon burnout; and greatly reduce the visible opacity at the lower excess air rates on the auxiliary boiler onboard. Air modelling can yield at least 10% fuel oil savings from present levels. Best Practices
.1 Use composite boiler – during anchorages and other relevant opportunities;
.2 Do not start auxiliary boilers too far in advance of intended use;
.3 Minimize steam dumping when possible; .4 Maintain pipe/vale laggings in good order to minimize heat loss; .5 Maintain steam traps in good order; .6 Use steam tracing judiciously; .7 Optimize bunker tank heating; .8 During loading operation, if no ballast pump is running, stop auxiliary boiler and
operate only on composite boiler. Also start auxiliary boiler prior to starting the ballast pump. This comes down to good communications between the departments;
.9 Auxiliary boilers should only be shut down if they are not needed for a
reasonable amount of time; and .10 Check the O2 analyzer and the piping system prior to every operation. Most
ships do not clean the sensing/sample line and condensation/dirt in the line prevents good flow of sample to the analyzer and hence the O2 comes down very slowly. This causes a lot of fuel wastage as engineers increase load on the boiler to produce better O2.
ONBOARD BUNKER MANAGEMENT Bunkers come in a wide variety of quality, levels and are blended in various ways to meet the ISO specification 8217. We currently buy all our fuel on the ****** Shipping specification that can be viewed in MWS OBH-02-06/Attachment 1.
MEPC 62/INF.10 Annex, page 13
I:\MEPC\62\INF-10.doc
Various blend components can keep heavy material in suspension that could precipitate out over time or when mixed with dissimilar bunker fuels. These heavy particulates can fall out of suspension and cause heavy sludge generation in the purifier. For this reason, good onboard bunker fuel management is essential. Before ordering bunkers, each ship should use the bunker worksheet to calculate the expected bunker consumption and verify the amount with the appropriate Voyage Manager. A copy of the final agreed-upon bunker nomination should be sent to CSC Bunkers. As a minimum, vessels should have enough onboard to complete the current voyage maintaining the following:
.1 HFO - 3 days (maximum consumption)
.2 MGO – 10 days (minimum generator load) The VMT should consult with the operations planner if the above cannot be met. The decision to carry excess bunkers above the inventory limit is to be justified by economic and operational considerations. Factors that can influence this decision include bunker cost, quality, the absence of firm orders, and cargo heating requirements. Best Practices
.1 Vessels should carry the most economical amount of bunker in inventory. .2 All fuels are purchased on an internationally recognized standard known as ISO
8217. .3 Every precaution should be made to try to avoid comingling of parcels of fuel.
Incompatible fuel is the most common problem with the incompatible fuel leading to clogged filters and in the worst case scenario, engine shut down.
.4 Fuel should be consumed in a first in, first out fashion. Avoid carrying fuel that is
over a few months old. The longer fuel is kept onboard, the longer the solids in the fuel are likely to drop out, and the more potential for reliability problems the ship is likely to face in terms of filter clogging and other problems. Fuel that cannot be used for any reason should be de-bunkered off the ship as soon as possible.
POWER GENERATION Power generation comes from the running of auxiliary engines. The cost of running such engines can be reduced by efficient use of these engines in their optimum condition. Onboard management of the power load can result in significant fuel oil savings (i.e. only run the generators needed for safe operations). The Department of Energy (DOE) of America has a standard to which household appliances must be constructed to have an energy star rating. This standard known as the Energy Star Standard with a prefix of 3.0 and now 4.0 (being the latest) gives the manufacturers of these appliances clear guidance on the wattage consumption of these appliances.
MEPC 62/INF.10 Annex, page 14
I:\MEPC\62\INF-10.doc
For example, take a LCD television. The average ship has approximately 15 television sets onboard. With an energy star rating of 3.0, one such TV consumes 318 watts. The same sized TV with an energy star 4.0 rating, consumes a maximum of 153 watts. Replacing the TV's onboard from 3.0 to 4.0 energy star could lead to a reduction in kilowatts consumed resulting in a decrease of fuel cost. If this were to be applied to all household appliances used onboard, (e.g. refrigerators and microwaves), then the savings could be significant over a period of time. Where appropriate, this principle can also be applied to simple things such as incandescent light bulbs, as CFL lamps are 75% more efficient. The replacement of onboard computers from old cathode ray screens to more energy efficient flat screens may also be considered. The company has demonstrated this principle ashore by replacing all the computer screens. Other things that can easily be done are: use compact fluorescent light bulbs, turn off computers when not in use, turn off/plug out items such as DVDs/TVs/audio systems and microwaves as these use several watts when in standby mode. Wise and not excessive use of washing machines and dryers to save water and watts. Onboard Energy Audit An onboard energy audit is an independent survey and assessment of the overall energy consumption and efficiency of each electrical consumer. These surveys and assessments normally involve the periodical survey of a vessel's engine room and other locations for sources of energy loss, for example, the use of infrared detectors to search for heat sinks, steam leaks, and inefficient electric motors. Upon completion of the energy audit, the crew of a ship can do the following:
.1 locate and minimize heat sinks and steam leaks by use of infrared detectors;
.2 install Variable Frequency drives on high energy consuming circulating pumps and forced draft fans. This would allow soft starting of large motors like fire pumps; and/or
.3 as electric motors need to be replaced, install new electric motors with better
energy efficient ratings. In the future, one onboard vessel survey will be performed with an independent contractor in conjunction with ****** Energy Technology Company (ETC) and ****** Energy Solutions. The goal is to develop in-house expertise for these audits. Best Practices
.1 Minimize use of unnecessary machinery – e.g. deck hydraulic, fire pumps, engine room fan etc.;
.2 Deck department to communicate better with engine room on ballast and cargo
pump usage avoid rolling pumps unnecessarily for long periods; .3 Ships to have a meeting to discuss the impacts of running various pieces of
machinery and efficient use; .4 Maximize D/G load when possible to run on one generator when safe to do so;
MEPC 62/INF.10 Annex, page 15
I:\MEPC\62\INF-10.doc
.5 Switch off lights in unused spaces in accommodation; .6 Try to minimize use of washing machine and drier with only one or two items;
and .7 Ships to have discussion on judicious use of pump room fans, bosun store fans
etc.
CARGO AND BUNKER HEATING In order to reduce fuel consumption and reduce heating costs, a voyage-specific cargo heating plan should be developed with the Voyage Managers and VMT. The following should be considered:
.1 Vessel tank configuration;
.2 Number of heating coils and surface area;
.3 Auxiliary and composite boilers specifications;
.4 Cargo details including specific heat and pour point;
.5 Cloud point, viscosity, and wax content;
.6 Weather en route including ambient air temperatures;
.7 Sea water temperatures, wind force, sea and swell;
.8 Estimated heat loss and drop in temperatures;
.9 Recommended return condensate temperatures; and
.10 Estimated daily heating hours and consumption.
Various parameters such as daily air/sea temperatures, weather, cargo temperatures at three levels, steam pressures, return condensate temperature, actual against estimated consumptions and temperatures are discussed with the Voyage Manager and the VMT and this heating plan is reviewed and revised appropriately throughout the voyage. General Principle The optimum temperature to which cargo should be heated for carriage and discharge largely depends on the following factors:
.1 Pour Point: It is the lowest temperature at which it will pour or flow under prescribed conditions. It is a rough indication of the lowest temperature at which oil is readily pumpable. General principle is to carry cargo at 10 deg C above pour point temperature.
.2 Cloud Point: It is the temperature at which dissolved solids are no longer
completely soluble, precipitating as second phase and is synonymous with wax appearance temperature (WAT) and was precipitation temperature (WPT). Once separated, it requires temperature over 80 deg C to dissolve the wax.
MEPC 62/INF.10 Annex, page 16
I:\MEPC\62\INF-10.doc
Cargo temperature should not be allowed to fall below the cloud point of the temperature.
.3 Wax Content: High wax crudes tend to deposit sludge, and you need to
maintain loaded or higher recommended temperature from commencement of loading to prevent wax fall out.
.4 Viscosity: High oils do not necessarily deposit sludge, and may be carried at
lower than the discharge temperatures. Optimum viscosity for main cargo pumps is about 250cst while for stripping pumps viscosity should not exceed 600cst.
.5 COW Requirement: When COW is required, the slop tank should be heated up
to 5 deg C above the bulk cargo temperature. .6 Ambient Weather and Sea Conditions: This will also influence the carriage and
discharge temperatures.
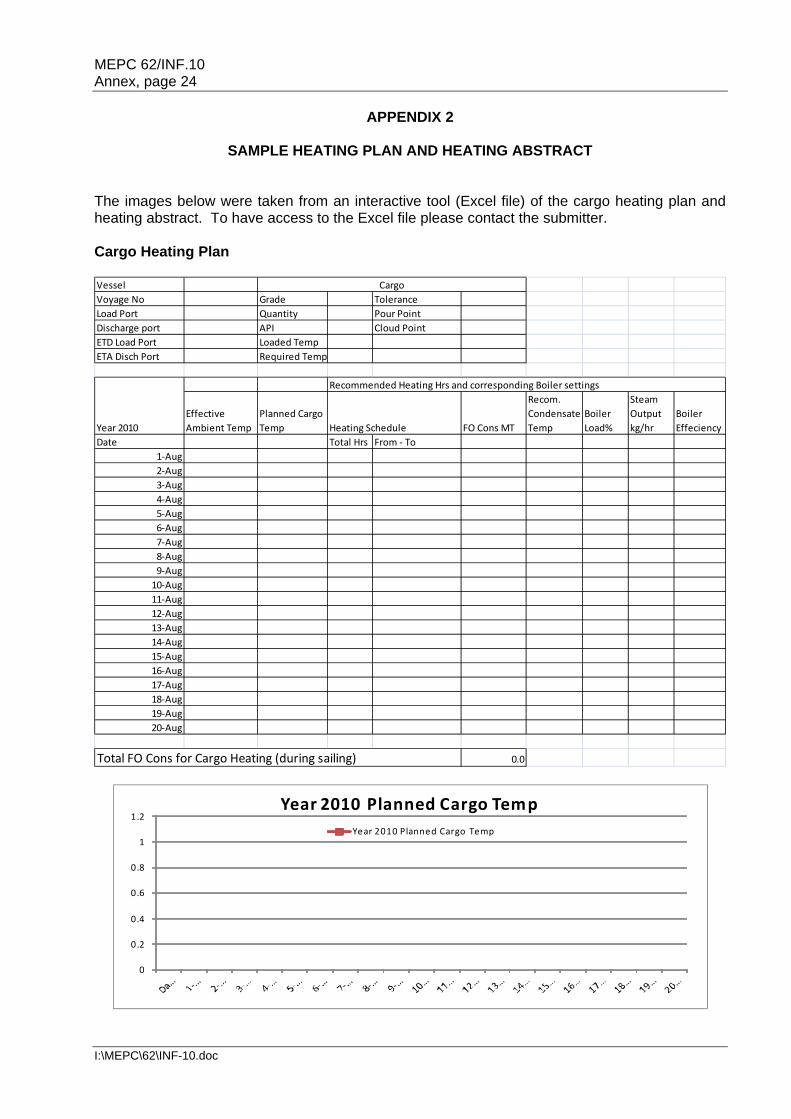
Data for various cargoes for density, pour point, cloud point, wax content, viscosity, recommended temperature for discharge and carriage is available in IP publication HP 40. The crude oil data link below can be used as reference: http://www.oil-transport.info/Crude_oil_data/crude_oil_data.html Heating instructions shall be reviewed after loading cargo and permission to carry and discharge the cargo at optimum temperatures shall be requested. Cargo Heating Plan It is prudent to have and follow a proper cargo heating plan to verify the effectiveness of actual heating progress. A heating plan should be made soon after loading cargo and reviewed/updated on daily basis considering the various factors that affect the heating and customer requirements. The sample heating plan and heating abstract template are set out as appendix 2 to this document. A review of the heating log abstract with the following will help with better future planning and identifying the gaps:
.1 Actual vs. Planned temperature .2 Actual vs. Planned FO consumption .3 Actual vs. Planned Heating hours
An example of how a vessel can use this template is set up as appendix 3 to this document. Vessels should complete the heating abstract after completion of each voyage and send it along with the Cargo Heating Log. Vessels are to send the heating plan to the Voyage Manager. A discussion related to the following should take place between Voyage Manager and the vessel in finalizing the plan:
MEPC 62/INF.10 Annex, page 17
I:\MEPC\62\INF-10.doc
.1 Heating Plan; .2 Passage Weather; .3 Receiver requirements; .4 Cargo Specifications; and .5 Heating Log (for claims).
Best Practices
.1 Vessel should have a greater understanding of the Voyage Manager/Charterer's heating instructions;
.2 Seek the Receiver/Charterer's permission for allowable range of cargo temperature;
.3 Avoid heating during adverse weather period;
.4 Closely monitor and analyze cargo heating reports;
.5 Create and follow the proper cargo heating plan to verify the effectiveness of actual heating progress;
.6 Monitor heating daily to address deviations from the heating plan;
.7 Do not heat for short frequent periods and running boiler at low loads;
.8 Follow the recommended condensate temperature and optimum boiler settings for efficient cargo heating. Heating instructions, accompanying the heating plan, should further highlight these points;
.9 Maintain efficient and good communication between the vessel and the Voyage Manager about the plan and execution; and
.10 Develop a Heating Abstract after completion of discharge for gap identification and continuous improvement.
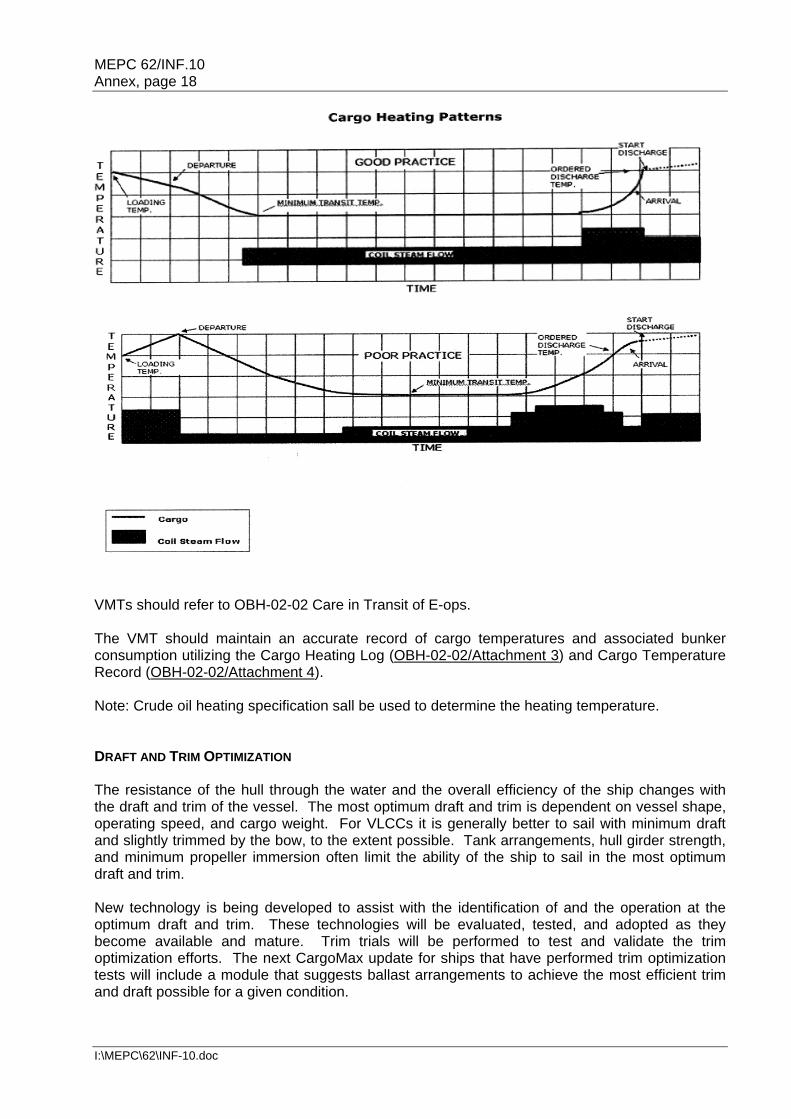
Cargo should be heated as economically as possible and planned soon after departure. Heating at the end of the cargo passage may cause off gassing which in turn could delay cargo discharge from high H2S usually above 10 ppm. See the Cargo Heating Patterns graph below.
MEPC 62/INF.10 Annex, page 18
I:\MEPC\62\INF-10.doc
VMTs should refer to OBH-02-02 Care in Transit of E-ops. The VMT should maintain an accurate record of cargo temperatures and associated bunker consumption utilizing the Cargo Heating Log (OBH-02-02/Attachment 3) and Cargo Temperature Record (OBH-02-02/Attachment 4). Note: Crude oil heating specification sall be used to determine the heating temperature. DRAFT AND TRIM OPTIMIZATION The resistance of the hull through the water and the overall efficiency of the ship changes with the draft and trim of the vessel. The most optimum draft and trim is dependent on vessel shape, operating speed, and cargo weight. For VLCCs it is generally better to sail with minimum draft and slightly trimmed by the bow, to the extent possible. Tank arrangements, hull girder strength, and minimum propeller immersion often limit the ability of the ship to sail in the most optimum draft and trim. New technology is being developed to assist with the identification of and the operation at the optimum draft and trim. These technologies will be evaluated, tested, and adopted as they become available and mature. Trim trials will be performed to test and validate the trim optimization efforts. The next CargoMax update for ships that have performed trim optimization tests will include a module that suggests ballast arrangements to achieve the most efficient trim and draft possible for a given condition.
MEPC 62/INF.10 Annex, page 19
I:\MEPC\62\INF-10.doc
Process The VMT should be familiar with the safe and correct sailing draft and trim of their vessel. A Ballast Exchange plan is to be developed in advance of each voyage and updated as needed. This plan is to show the planned ballast movements during the voyage to keep the ship at or near the optimum trim and draft as fuel oil is consumed. When possible, gravity transfers should be used to reduce hours on the generators and ballast pumps. At no time shall the plan exceed the allowable bending moment and shear force for the hull girder, or allow the propeller immersion to be reduced to the point that the propeller cavitates or causes significant vibrations CREW FAMILIARIZATION AND TRAINING As the operators of the vessel, each crew member plays a key role in being more energy efficient and saving energy. As part the of initial vessel familiarization, each person should have an understanding of the specific vessel operations and how the crew's interactions with that specific piece of equipment has the potential to waste or save energy. Very simple good habits can have the potential to save a lot of electricity. For instance, switching lights, television sets, and forced draft fans off have a great potential for saving energy. Each ship should have an awareness program for new and returning seafarers referring to energy conservation. A list of energy best practices should be developed on what the major onboard consumers are and what can be done to save energy. ACCOMMODATION - SPECIFIC ENERGY CONSERVATION PROGRAM The accommodations can offer a number of energy saving opportunities. Air conditioning is one of the major energy consumers. Windows account for nearly 50% of the heat or heat loss (depending on the season) this in turn places close to 50% of the workload on the air conditioning system or heating system. Untreated windows will allow about 20 times more heat into a space than an equal amount of insulated wall space. Personnel on board can limit the consumption by keeping the blinds closed when sun light is not needed or the space is unoccupied. Refrigerant gases can leak causing significant impact on total GHG emissions. Regular inspections of the entire refrigerant systems onboard can reduce leaks and improve system efficiency. New regulation against the use of R22 has started in January 1st 2010. From that time the use of virgin hydrochlorofluorocarbons is prohibited in the maintenance and servicing of refrigeration and air-conditioning equipment existing from this date. The use of R22 shall be prohibited from January 1st 2015. New alternatives for refrigeration and air conditioning equipment will have to be sourced after that date. MONITORING AND VERIFICATION The aggregated result of these efforts above is the lowering of the Operational Index (OI) which is reported in Tonnes of CO2 per nautical mile and the miles per ton of fuel consumed. For practicality, vessels should report the consumption in grams of CO2 per nautical mile. Vessels should use the Operational Index Calculator Worksheet for their vessel (appendix 4). For each voyage, vessels will include the following:
MEPC 62/INF.10 Annex, page 20
I:\MEPC\62\INF-10.doc
.1 Voyage Number; .2 Cargo carried in tons; .3 Average speed; .4 HFO and Diesel used to propel the vessel; .5 Miles travelled between departure and departure of the discharge port. If there
are two discharge ports, all the miles should be reported between those ports. The last discharge port is considered the end of the voyage;
.6 Fuel used for cargo heating if applicable; .7 Fuel used for discharge; .8 Diesel fuel used at PAL for the discharge of the cargo; and .9 Days of weather over Force 4
Explanations for the Operational Index Calculator
.1 If the vessel is in port just "waiting" and it only used 5 tons that day, then this figure is the vessel consumption for the day even though it did not move;
.2 If the vessel is "Discharging" then all the fuel used on that day should be
counted in the discharge column; .3 If the vessel is "Loading" then all the fuel used in that operation is counted as
the operation of the vessel on that day; and .4 If the vessel is going to the shipyard, the voyage is still considered to start after
the departure in the last discharge port. Do not include the fuel used for the sea trials etc.
The output of the worksheet includes:
.1 Miles per ton- miles the ship travelled by using one ton; .2 Tons to go 5,000 miles; .3 Tons to go 10,000 miles; .4 Grams of CO2 per nautical mile (Operational Index); and .5 Grams of CO2 per kilometer.
****** Shipping calculates the voyage from discharge to discharge. It is very important that the vessel's distance is accurately tracked and reported. The preferred way is to use the GPS Log function, for instance, if the vessel has the MX420 Navigation System (appendix 5). Each individual ship should set a goal for the miles per ton number improvement.
MEPC 62/INF.10 Annex, page 21
I:\MEPC\62\INF-10.doc
The Energy Efficiency Design Index (EEDI) is contained in the Operational Index Calculator Worksheet. The EEDI is currently the most likely mechanism to base line the efficiency of a given ship. Significant potential exists to improve the efficiency of existing ships through technologies such as waste heat recovery and propeller duct optimization, and other onboard energy efficiency improvements. Increased efficiency would reduce fuel consumption and GHG emissions, provide financial rewards to efficient ship owners and operators, and illustrate the maritime sector's commitment to tackling climate change even while carrying the majority of the world's trade. Each Operational Index Calculator has the calculated EEDI included for each ship. It is believed that an Efficiency Credit (EC) trading for ships will be established in the future. Under this proposal, the fundamental requirement is that a ship's Energy Index be lowered over the course of time. Recognizing that not all ships will be able to meet this requirement, the Efficiency Credit trading allows more efficient ships to sell their (EC) surplus to ships that are not as efficient. The concept of Efficiency Credit trading is distinct from other emission reductions in that it does not directly cap maritime activities or emissions, yet it has the potential to quickly achieve significant emission reductions from the maritime sector. Each ship will evaluate their Operational Index on a continuous basis. The results of these voyages are reported to the leadership team of ****** Shipping and to the highest levels of the corporation. Best Practice Summary
.1 The Operational Index should be calculated for each voyage. Large variations of planned versus actual fuel consumption will be addressed and diagnosed.
.2 Use of composite boiler during anchorages and other relevant opportunities.
.3 Do not start auxiliary boilers too far in advance of intended use.
.4 Follow reliability program to optimize performance of main engine and auxiliaries using the *** and ***.
.5 Minimize steam dumping when possible.
.6 Maintain pipe/valve laggings in good order to minimize heat loss.
.7 Maintain steam traps in good order.
.8 Use steam tracing judiciously.
.9 Carefully monitor the propeller slip and hull condition.
.10 Optimize vessel trim.
.11 Use auto pilot settings effectively.
.12 Seek advice of the WNI for weather routing.
.13 Minimize the use of unnecessary machinery – e.g., deck hydraulic, fire pumps, engine room fan etc.
MEPC 62/INF.10 Annex, page 22
I:\MEPC\62\INF-10.doc
.14 Deck department is to communicate better with the engine room on ballast and cargo pump usage to avoid rolling pumps unnecessarily for long periods – a more robust plan.
.15 Ship's crew should meet and discuss the impacts of running various pieces of machinery and how to use them most efficiently.
.16 Maximize D/G load when possible to run on one generator when it is safe to do so.
.17 Ships are to communicate economical impacts and choices of voyage orders to Voyage Managers and Operations Planners.
.18 Voyage Managers are to provide desired ETA at ports to allow more judicious use of the ship's power.
.19 Operations Planners to advise each voyage if it is possible to transfer engine slops to slop tanks to avoid diesel consumption in incinerator.
.20 Minimize water in sludge by settling not intense heating when transferring to slop tanks (when possible).
.21 Optimize bunker tank heating.
.22 Switch off lights in unused spaces in accommodation.
.23 Avoid using the washing machine and dryer with only one or two items.
.24 Ships are to discuss on the judicious use of pumproom fans, bosun store fans etc.
.25 Careful use of gravity for deballasting can save fuel.
.26 Ballast water exchange should be reviewed for energy efficiency – but not at the cost of exchange objectives
.27 Stop M/E LO + Camshaft LO Pump in port if M/E notice allows. Many terminals require the M/E on short notice so it is not possible all the time, but when possible this should be done. The Chief can use his discretion on this practice.
.28 During loading operation, if no ballast pump is running, stop auxiliary boiler and operate only on composite boiler. Also start auxiliary boiler prior to starting the ballast pump: This comes down to good communications between departments. Auxiliary boilers should only be shut down if they are not needed for a reasonable amount of time
.29 Check the O2 analyzer and the piping system prior to every operation. Most ships do not clean the sensing/sample line and condensation/dirt in the line prevents good flow of sample to the analyzer and hence the O2 comes down very slowly. This causes a lot of fuel waste as engineers increase load on the boiler to produce better O2.
MEPC 62/INF.10 Annex, page 23
I:\MEPC\62\INF-10.doc
APPENDIX 1
******* *** - Machinery and Diesel Engine Condition Monitoring Software Founded in 1993, *** is a specialist leader in machinery condition monitoring and diesel engine performance monitoring. Products that are particularly applicable to the marine industry include the *** (portable software monitoring of cylinder pressure and fuel pressure), the *** (a flexible Ethernet network system that provides information on your machinery) and the *** (a fully featured monitoring software package for rotating machinery). ***: Portable, Integrated Ship Engine Monitoring System The *** systems provide extensive information on the performance of engines quickly, simply and accurately. Older engines can benefit just as much as new ones and the systems can provide a rapid payback of the investment cost. The portable *** series is an industry standard for cylinder pressure measurement, having built its reputation on reliability, accuracy and ease-of-use. The ***, as it is often known, is housed in a rugged plastic case and is fully sealed against moisture and dirt. A complete system, including sensors and cables, fits into a convenient shoulder bag about the same size as a camcorder case. Installed *** systems are available in two versions. The *** is a single channel unit for measuring cylinder pressure while the *** measures cylinder and fuel pressure simultaneously. Advantages of Cylinder and Fuel Pressure Monitoring with the *** The *** provides the following advantages:
.1 Reduced maintenance costs - maintenance can be targeted at the areas requiring attention, meaning disturbance of engine components that are performing well can be minimized.
.2 Improved performance - provides accurate pressure readings and cylinder power calculations; the performance of injectors and combustion can clearly be seen on the high resolution graphs.
.3 Reduced fuel consumption - engine balancing and tuning can be achieved and maintained, resulting in greater efficiency engine running and consequent fuel saving.
.4 Reduced emissions through combustion optimization. Once the readings are sent in the *** and *** can make the necessary recommendations for adjustment of P-Max. 1 Bar in improvement in PMAX can reduce the fuel consumption of the engine by .25kg/ kw* hr. The formula of =.25 x number of days x horse power of the engine x 24/ 1,000,000,000 can be used to derive tons saved per year.
***
MEPC 62/INF.10 Annex, page 24
I:\MEPC\62\INF-10.doc
VesselVoyage No Grade ToleranceLoad Port Quantity Pour PointDischarge port API Cloud PointETD Load Port Loaded TempETA Disch Port Required Temp
Effective Ambient Temp
Planned Cargo Temp Heating Schedule FO Cons MT
Recom. Condensate Temp
Boiler Load%
Steam Output kg/hr
Boiler Effeciency
Date Total Hrs From - To1-Aug2-Aug3-Aug4-Aug5-Aug6-Aug7-Aug8-Aug9-Aug
10-Aug11-Aug12-Aug13-Aug14-Aug15-Aug16-Aug17-Aug18-Aug19-Aug20-Aug
0.0
Cargo
Recommended Heating Hrs and corresponding Boiler settings
Year 2010
Total FO Cons for Cargo Heating (during sailing)
0
0.2
0.4
0.6
0.8
1
1.2Year 2010 Planned Cargo Temp
Year 2010 Planned Cargo Temp
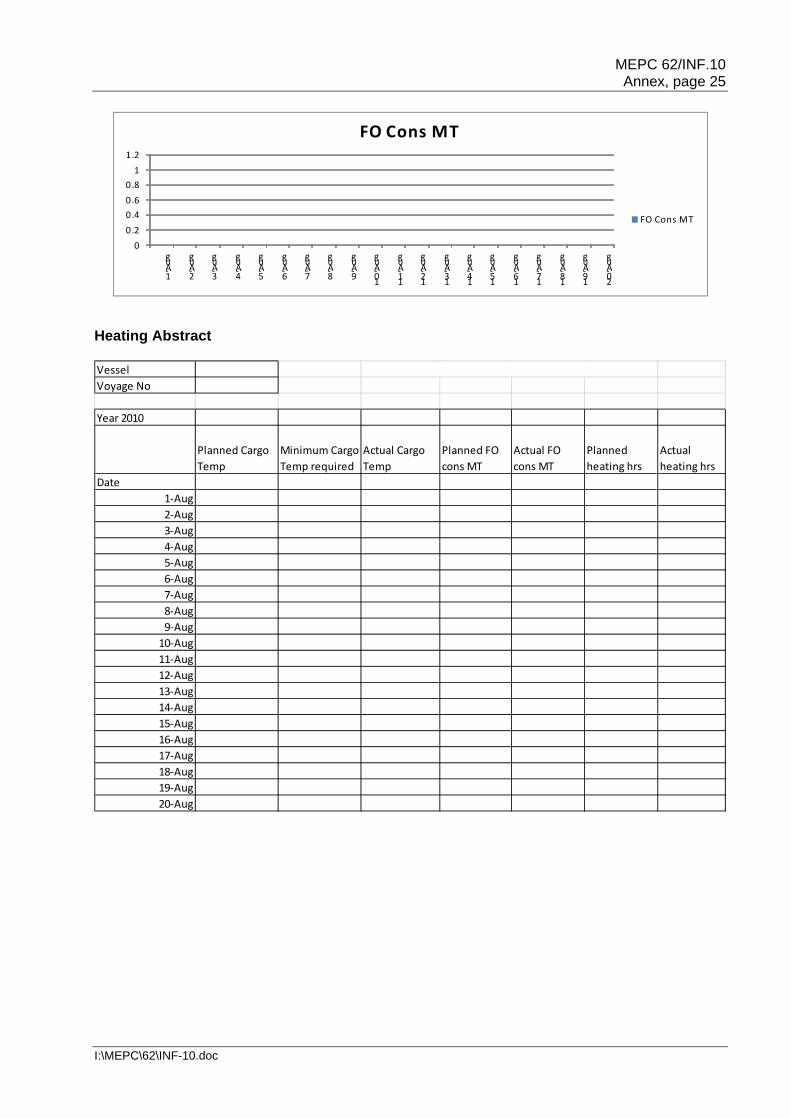
APPENDIX 2
SAMPLE HEATING PLAN AND HEATING ABSTRACT The images below were taken from an interactive tool (Excel file) of the cargo heating plan and heating abstract. To have access to the Excel file please contact the submitter. Cargo Heating Plan
MEPC 62/INF.10 Annex, page 25
I:\MEPC\62\INF-10.doc
00.20.40.60.8
11.2
1-Aug
2-Aug
3-Aug
4-Aug
5-Aug
6-Aug
7-Aug
8-Aug
9-Aug
10-Aug
11-Aug
12-Aug
13-Aug
14-Aug
15-Aug
16-Aug
17-Aug
18-Aug
19-Aug
20-Aug
FO Cons MT
FO Cons MT
VesselVoyage No
Year 2010
Planned Cargo Temp
Minimum Cargo Temp required
Actual Cargo Temp
Planned FO cons MT
Actual FO cons MT
Planned heating hrs
Actual heating hrs
Date1-Aug2-Aug3-Aug4-Aug5-Aug6-Aug7-Aug8-Aug9-Aug
10-Aug11-Aug12-Aug13-Aug14-Aug15-Aug16-Aug17-Aug18-Aug19-Aug20-Aug
Heating Abstract
MEPC 62/INF.10 Annex, page 26
I:\MEPC\62\INF-10.doc
0
0.2
0.4
0.6
0.8
1
1.2
Planned Cargo Temp Minimum Cargo Temp required Actual Cargo Temp
0
0.2
0.4
0.6
0.8
1
1.2
Date
1-Aug
2-Aug
3-Aug
4-Aug
5-Aug
6-Aug
7-Aug
8-Aug
9-Aug
10-Aug
11-Aug
12-Aug
13-Aug
14-Aug
15-Aug
16-Aug
17-Aug
18-Aug
19-Aug
20-Aug
Planned FO cons MT Actual FO cons MT
0
0.2
0.4
0.6
0.8
1
1.2
Date
1-Aug
2-Aug
3-Aug
4-Aug
5-Aug
6-Aug
7-Aug
8-Aug
9-Aug
10-Aug
11-Aug
12-Aug
13-Aug
14-Aug
15-Aug
16-Aug
17-Aug
18-Aug
19-Aug
20-Aug
Planned heating hrs Actual heating hrs
***
MEPC 62/INF.10 Annex, page 27
I:\MEPC\62\INF-10.doc
50
52
54
56
58
60
62
64
Date 1-Aug 2-Aug 3-Aug 4-Aug 5-Aug 6-Aug 7-Aug 8-Aug 9-Aug 10-Aug11-Aug12-Aug13-Aug14-Aug15-Aug16-Aug17-Aug
Year 2010 Planned Cargo TempYear 2010 Planned Cargo Temp
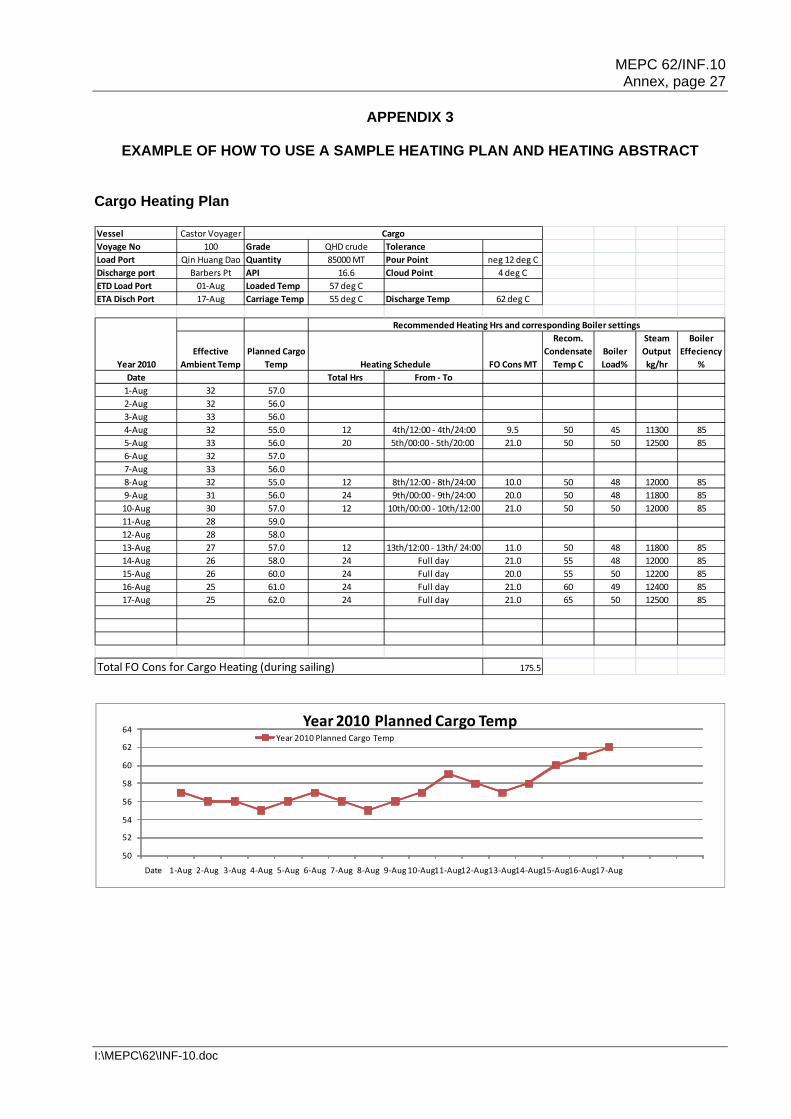
Vessel Castor VoyagerVoyage No 100 Grade QHD crude ToleranceLoad Port Qin Huang Dao Quantity 85000 MT Pour Point neg 12 deg CDischarge port Barbers Pt API 16.6 Cloud Point 4 deg CETD Load Port 01-Aug Loaded Temp 57 deg CETA Disch Port 17-Aug Carriage Temp 55 deg C Discharge Temp 62 deg C
Effective Ambient Temp
Planned Cargo Temp FO Cons MT
Recom. Condensate
Temp CBoiler Load%
Steam Output kg/hr
Boiler Effeciency
%Date Total Hrs From - To
1-Aug 32 57.02-Aug 32 56.03-Aug 33 56.04-Aug 32 55.0 12 4th/12:00 - 4th/24:00 9.5 50 45 11300 855-Aug 33 56.0 20 5th/00:00 - 5th/20:00 21.0 50 50 12500 856-Aug 32 57.07-Aug 33 56.08-Aug 32 55.0 12 8th/12:00 - 8th/24:00 10.0 50 48 12000 859-Aug 31 56.0 24 9th/00:00 - 9th/24:00 20.0 50 48 11800 8510-Aug 30 57.0 12 10th/00:00 - 10th/12:00 21.0 50 50 12000 8511-Aug 28 59.012-Aug 28 58.013-Aug 27 57.0 12 13th/12:00 - 13th/ 24:00 11.0 50 48 11800 8514-Aug 26 58.0 24 Full day 21.0 55 48 12000 8515-Aug 26 60.0 24 Full day 20.0 55 50 12200 8516-Aug 25 61.0 24 Full day 21.0 60 49 12400 8517-Aug 25 62.0 24 Full day 21.0 65 50 12500 85
175.5
Cargo
Recommended Heating Hrs and corresponding Boiler settings
Year 2010
Total FO Cons for Cargo Heating (during sailing)
Heating Schedule
APPENDIX 3
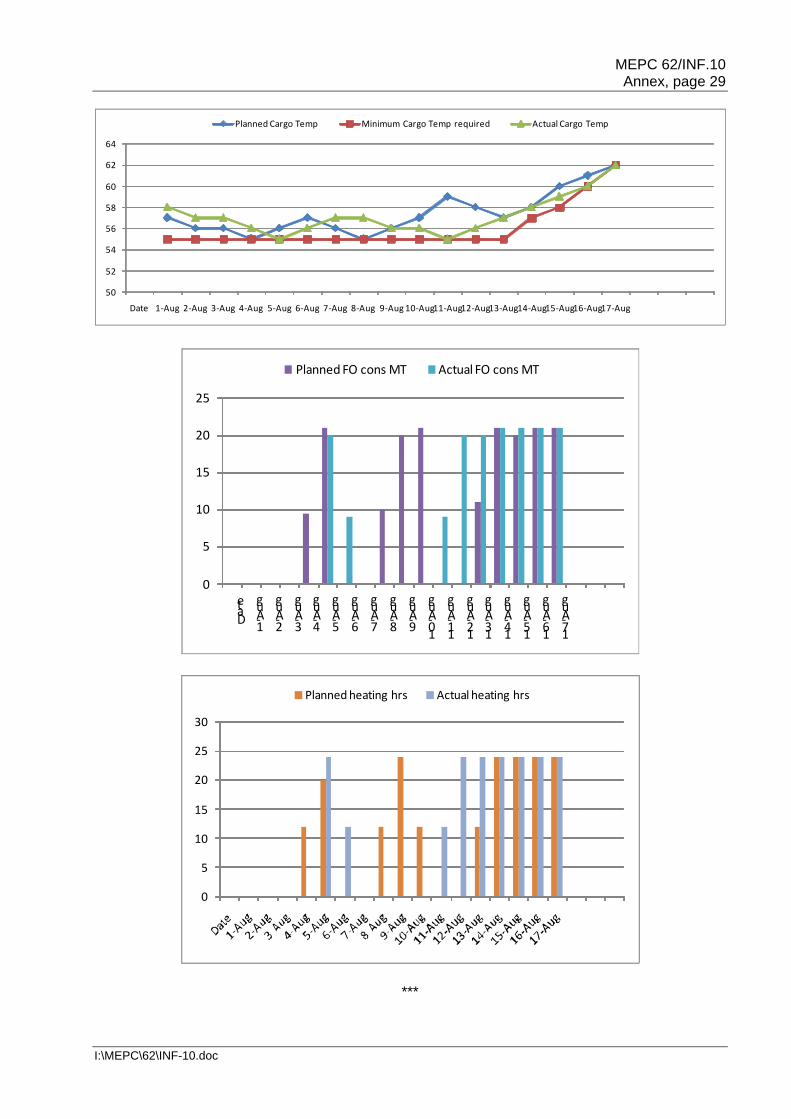
EXAMPLE OF HOW TO USE A SAMPLE HEATING PLAN AND HEATING ABSTRACT Cargo Heating Plan
MEPC 62/INF.10 Annex, page 28
I:\MEPC\62\INF-10.doc
0
5
10
15
20
25
FO Cons MT
FO Cons MT
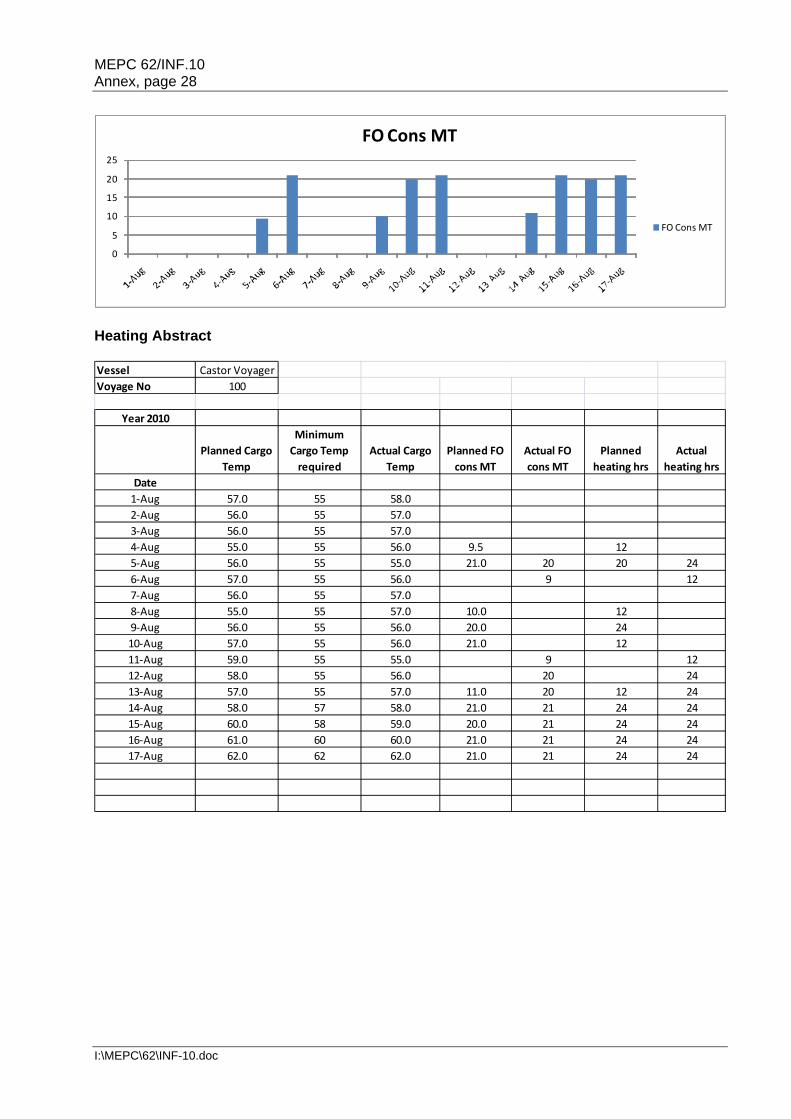
Vessel Castor VoyagerVoyage No 100
Year 2010
Planned Cargo Temp
Minimum Cargo Temp
requiredActual Cargo
TempPlanned FO
cons MTActual FO cons MT
Planned heating hrs
Actual heating hrs
Date1-Aug 57.0 55 58.02-Aug 56.0 55 57.03-Aug 56.0 55 57.04-Aug 55.0 55 56.0 9.5 125-Aug 56.0 55 55.0 21.0 20 20 246-Aug 57.0 55 56.0 9 127-Aug 56.0 55 57.08-Aug 55.0 55 57.0 10.0 129-Aug 56.0 55 56.0 20.0 2410-Aug 57.0 55 56.0 21.0 1211-Aug 59.0 55 55.0 9 1212-Aug 58.0 55 56.0 20 2413-Aug 57.0 55 57.0 11.0 20 12 2414-Aug 58.0 57 58.0 21.0 21 24 2415-Aug 60.0 58 59.0 20.0 21 24 2416-Aug 61.0 60 60.0 21.0 21 24 2417-Aug 62.0 62 62.0 21.0 21 24 24
Heating Abstract
MEPC 62/INF.10 Annex, page 29
I:\MEPC\62\INF-10.doc
0
5
10
15
20
25
Date
1-Aug
2-Aug
3-Aug
4-Aug
5-Aug
6-Aug
7-Aug
8-Aug
9-Aug
10-Aug
11-Aug
12-Aug
13-Aug
14-Aug
15-Aug
16-Aug
17-Aug
Planned FO cons MT Actual FO cons MT
0
5
10
15
20
25
30
Planned heating hrs Actual heating hrs
50
52
54
56
58
60
62
64
Date 1-Aug 2-Aug 3-Aug 4-Aug 5-Aug 6-Aug 7-Aug 8-Aug 9-Aug 10-Aug11-Aug12-Aug13-Aug14-Aug15-Aug16-Aug17-Aug
Planned Cargo Temp Minimum Cargo Temp required Actual Cargo Temp
***
MEPC 62/INF.10 Annex, page 30
I:\MEPC\62\INF-10.doc
END OF VOYAGE REPORTVOYAGE # Cargo carried in tons Ave. Speed
25 264999Load portdischarge port HFO Diesel miles
BALLAST LEGLOADED LEGDISCHARGETOTAL 1025.6 0 2372
Miles per ton 2.312793tons to go 5000 miles 2161.889Tons to go 10,000 miles 4323.777grams of CO2 per naticle mile 5.081518grams of CO2 per kilometer 3.157509Total Average SpeedTons of fuel used/per tons dischargedHFODiesel
FUEL USED
END OF VOYAGE REPORTVOYAGE # Cargo carried in tons Ave. Speed
26 263912Load portdischarge port HFO Diesel miles
BALLAST LEGLOADED LEGDISCHARGETOTAL 823 0 3000
Miles per ton 3.6452tons to go 5000 miles 1371.667Tons to go 10,000 miles 2743.333grams of CO2 per naticle mile 3.237381grams of CO2 per kilometer 2.011615Ave. SpeedTons of fuel used/per tons dischargedHFODiesel
FUEL USED
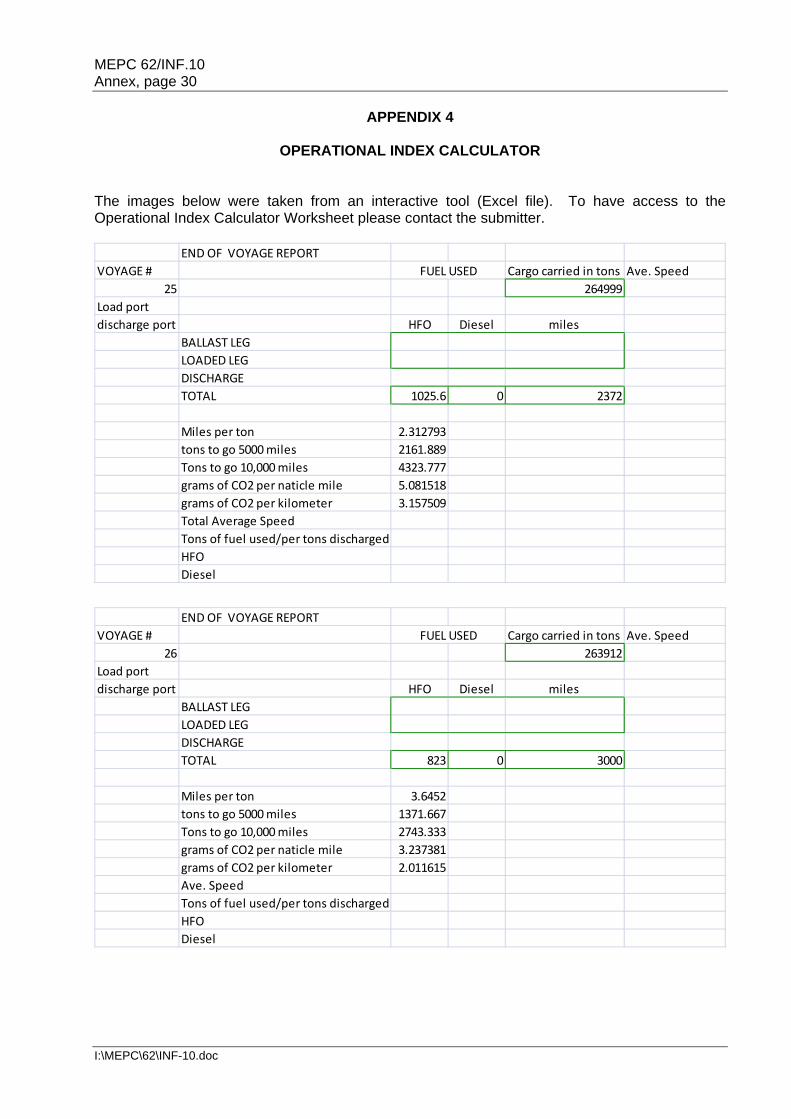
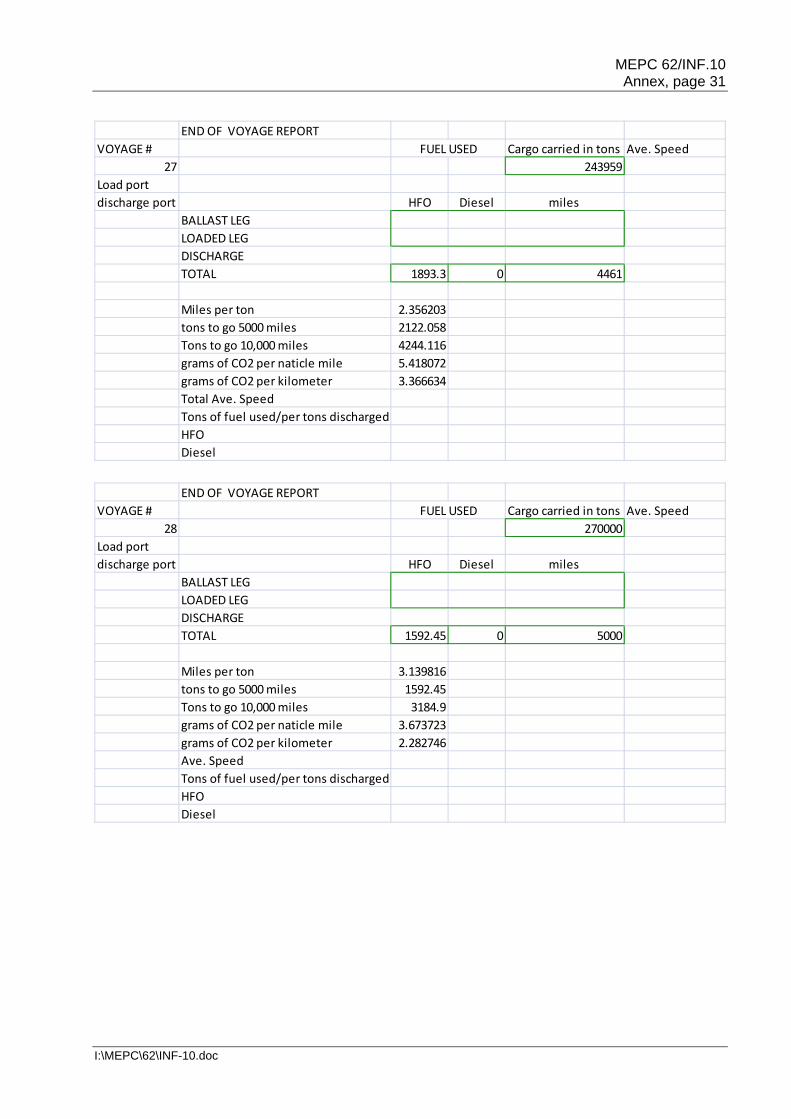
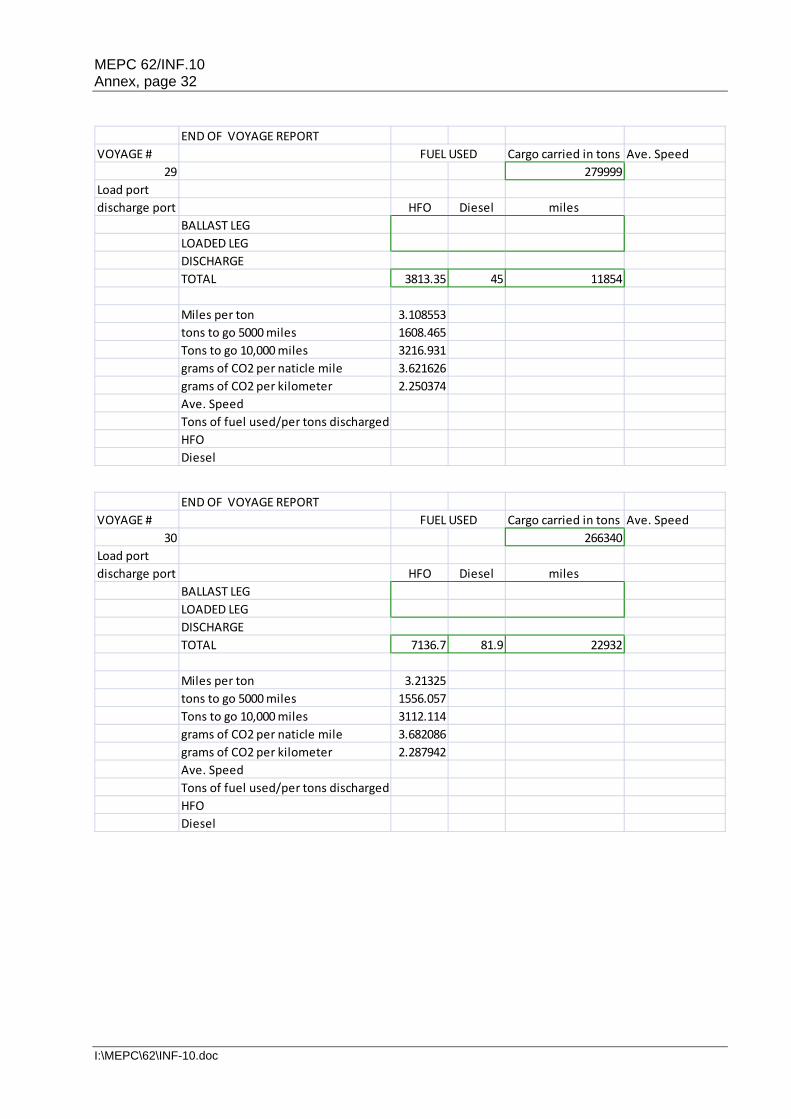
APPENDIX 4
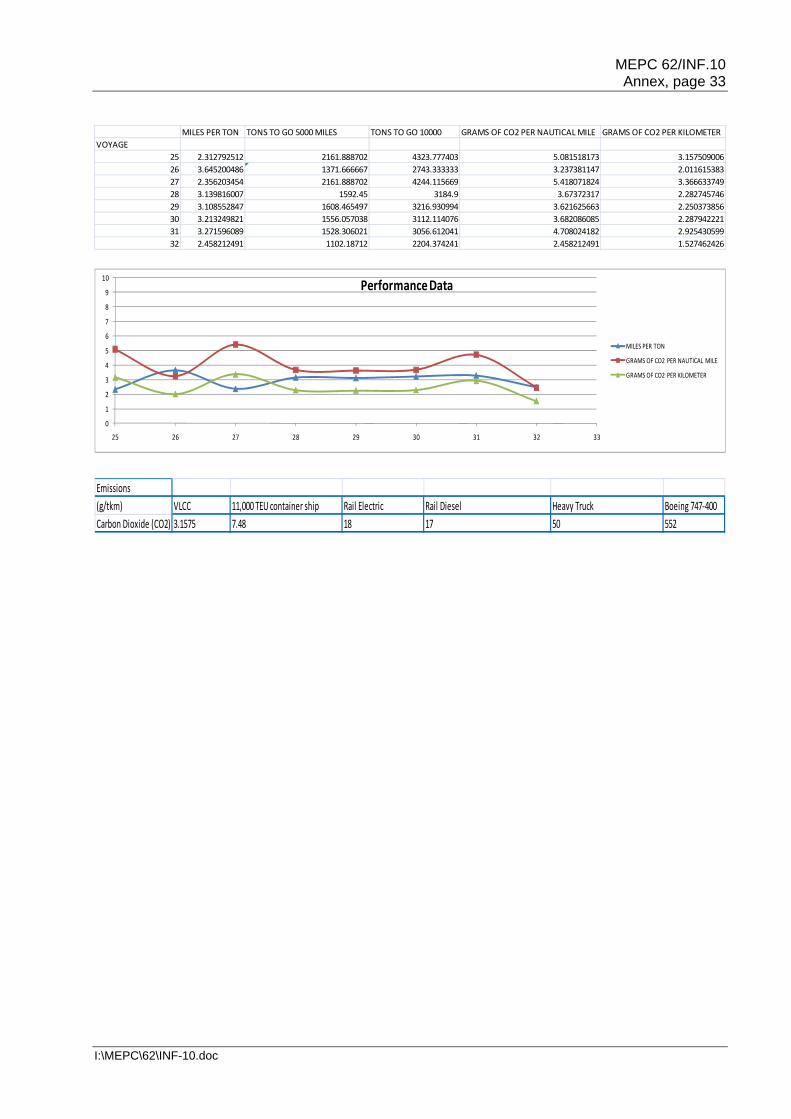
OPERATIONAL INDEX CALCULATOR The images below were taken from an interactive tool (Excel file). To have access to the Operational Index Calculator Worksheet please contact the submitter.
MEPC 62/INF.10 Annex, page 31
I:\MEPC\62\INF-10.doc
END OF VOYAGE REPORTVOYAGE # Cargo carried in tons Ave. Speed
27 243959Load portdischarge port HFO Diesel miles
BALLAST LEGLOADED LEGDISCHARGETOTAL 1893.3 0 4461
Miles per ton 2.356203tons to go 5000 miles 2122.058Tons to go 10,000 miles 4244.116grams of CO2 per naticle mile 5.418072grams of CO2 per kilometer 3.366634Total Ave. SpeedTons of fuel used/per tons dischargedHFODiesel
FUEL USED
END OF VOYAGE REPORTVOYAGE # Cargo carried in tons Ave. Speed
28 270000Load portdischarge port HFO Diesel miles
BALLAST LEGLOADED LEGDISCHARGETOTAL 1592.45 0 5000
Miles per ton 3.139816tons to go 5000 miles 1592.45Tons to go 10,000 miles 3184.9grams of CO2 per naticle mile 3.673723grams of CO2 per kilometer 2.282746Ave. SpeedTons of fuel used/per tons dischargedHFODiesel
FUEL USED
MEPC 62/INF.10 Annex, page 32
I:\MEPC\62\INF-10.doc
END OF VOYAGE REPORTVOYAGE # Cargo carried in tons Ave. Speed
29 279999Load portdischarge port HFO Diesel miles
BALLAST LEGLOADED LEGDISCHARGETOTAL 3813.35 45 11854
Miles per ton 3.108553tons to go 5000 miles 1608.465Tons to go 10,000 miles 3216.931grams of CO2 per naticle mile 3.621626grams of CO2 per kilometer 2.250374Ave. SpeedTons of fuel used/per tons dischargedHFODiesel
FUEL USED
END OF VOYAGE REPORTVOYAGE # Cargo carried in tons Ave. Speed
30 266340Load portdischarge port HFO Diesel miles
BALLAST LEGLOADED LEGDISCHARGETOTAL 7136.7 81.9 22932
Miles per ton 3.21325tons to go 5000 miles 1556.057Tons to go 10,000 miles 3112.114grams of CO2 per naticle mile 3.682086grams of CO2 per kilometer 2.287942Ave. SpeedTons of fuel used/per tons dischargedHFODiesel
FUEL USED
MEPC 62/INF.10 Annex, page 33
I:\MEPC\62\INF-10.doc
MILES PER TON TONS TO GO 5000 MILES TONS TO GO 10000 GRAMS OF CO2 PER NAUTICAL MILE GRAMS OF CO2 PER KILOMETERVOYAGE
25 2.312792512 2161.888702 4323.777403 5.081518173 3.15750900626 3.645200486 1371.666667 2743.333333 3.237381147 2.01161538327 2.356203454 2161.888702 4244.115669 5.418071824 3.36663374928 3.139816007 1592.45 3184.9 3.67372317 2.28274574629 3.108552847 1608.465497 3216.930994 3.621625663 2.25037385630 3.213249821 1556.057038 3112.114076 3.682086085 2.28794222131 3.271596089 1528.306021 3056.612041 4.708024182 2.92543059932 2.458212491 1102.18712 2204.374241 2.458212491 1.527462426
0
1
2
3
4
5
6
7
8
9
10
25 26 27 28 29 30 31 32 33
Performance Data
MILES PER TON
GRAMS OF CO2 PER NAUTICAL MILE
GRAMS OF CO2 PER KILOMETER
Emissions (g/tkm) VLCC 11,000 TEU container ship Rail Electric Rail Diesel Heavy Truck Boeing 747-400Carbon Dioxide (CO2) 3.1575 7.48 18 17 50 552
MEPC 62/INF.10 Annex, page 34
I:\MEPC\62\INF-10.doc
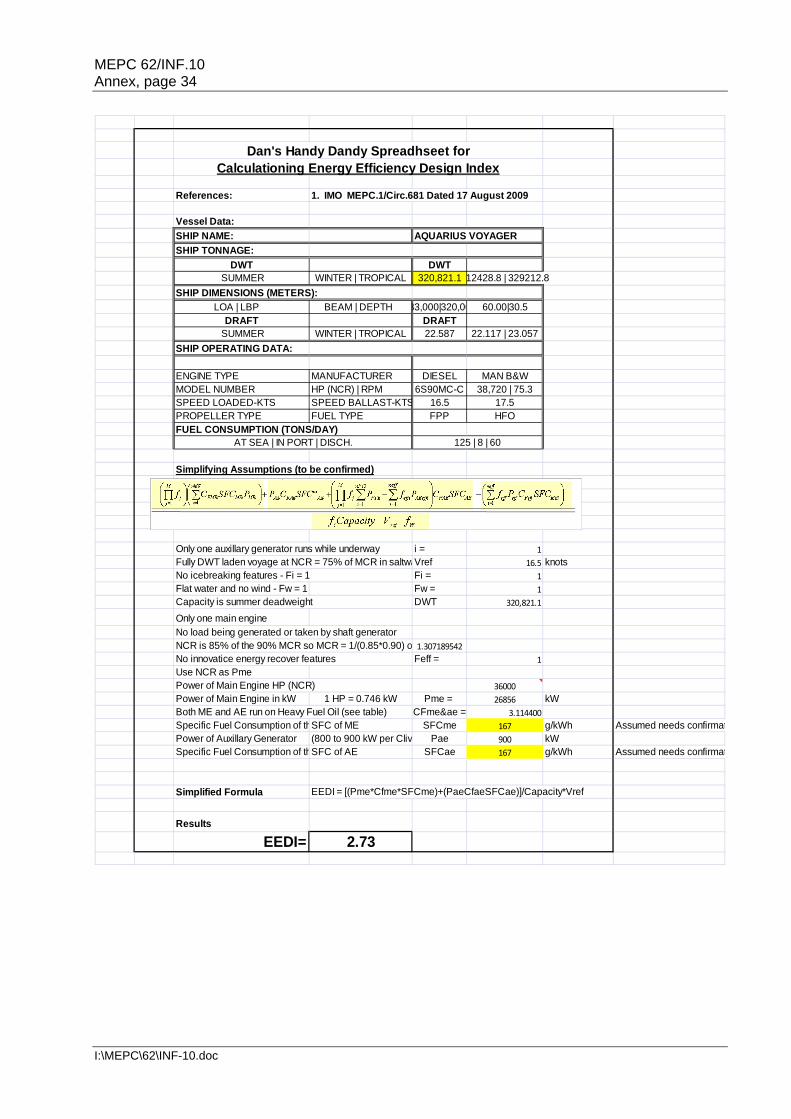
References: 1. IMO MEPC.1/Circ.681 Dated 17 August 2009
Vessel Data:
SHIP NAME: AQUARIUS VOYAGER
SHIP TONNAGE:
DWT DWT SUMMER WINTER | TROPICAL 320,821.1 12428.8 | 329212.8
SHIP DIMENSIONS (METERS):
LOA | LBP BEAM | DEPTH 33,000|320,00 60.00|30.5DRAFT DRAFT
SUMMER WINTER | TROPICAL 22.587 22.117 | 23.057
SHIP OPERATING DATA:
ENGINE TYPE MANUFACTURER DIESEL MAN B&WMODEL NUMBER HP (NCR) | RPM 6S90MC-C 38,720 | 75.3SPEED LOADED-KTS SPEED BALLAST-KTS 16.5 17.5PROPELLER TYPE FUEL TYPE FPP HFOFUEL CONSUMPTION (TONS/DAY)
Simplifying Assumptions (to be confirmed)
Only one auxillary generator runs while underway i = 1Fully DWT laden voyage at NCR = 75% of MCR in saltwaVref 16.5 knotsNo icebreaking features - Fi = 1 Fi = 1Flat water and no wind - Fw = 1 Fw = 1Capacity is summer deadweight DWT 320,821.1
Only one main engineNo load being generated or taken by shaft generatorNCR is 85% of the 90% MCR so MCR = 1/(0.85*0.90) o 1.307189542No innovatice energy recover features Feff = 1Use NCR as PmePower of Main Engine HP (NCR) 36000Power of Main Engine in kW 1 HP = 0.746 kW Pme = 26856 kWBoth ME and AE run on Heavy Fuel Oil (see table) CFme&ae = 3.114400Specific Fuel Consumption of thSFC of ME SFCme 167 g/kWh Assumed needs confirmatPower of Auxillary Generator (800 to 900 kW per Cliv Pae 900 kWSpecific Fuel Consumption of thSFC of AE SFCae 167 g/kWh Assumed needs confirmat
Simplified Formula EEDI = [(Pme*Cfme*SFCme)+(PaeCfaeSFCae)]/Capacity*Vref
Results
EEDI= 2.73
Dan's Handy Dandy Spreadhseet forCalculationing Energy Efficiency Design Index
AT SEA | IN PORT | DISCH. 125 | 8 | 60
MEPC 62/INF.10 Annex, page 35
I:\MEPC\62\INF-10.doc
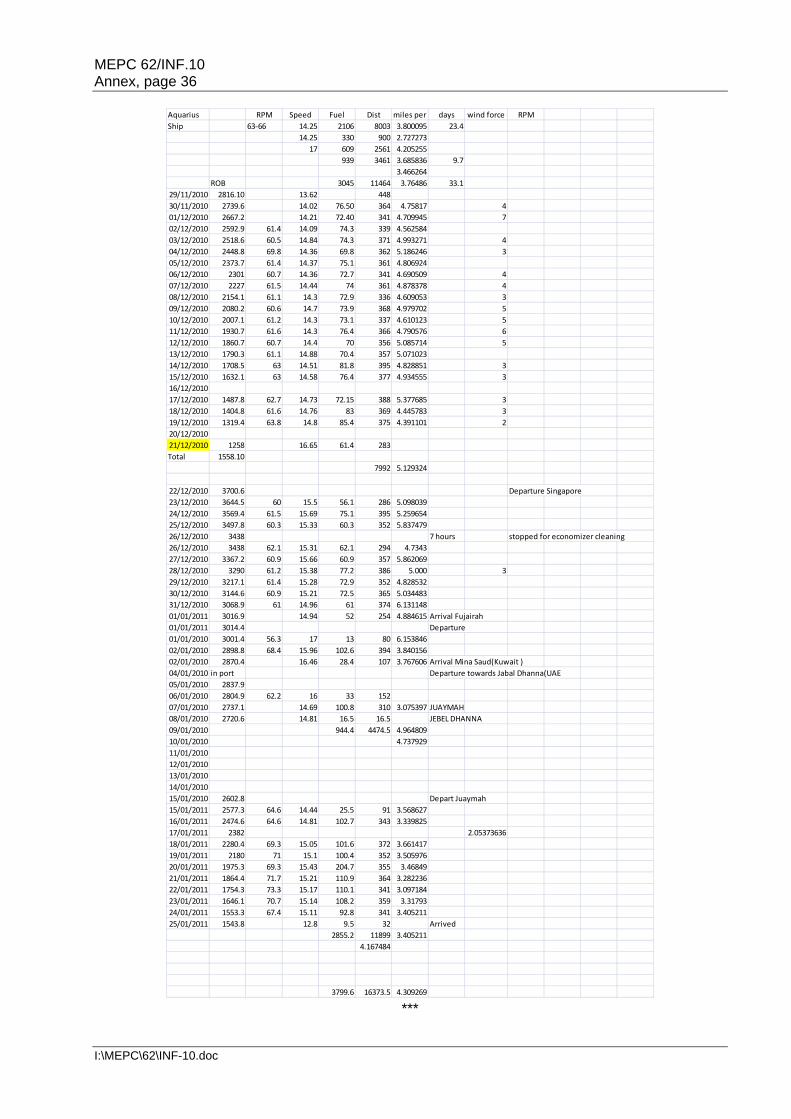
MEPC 62/INF.10 Annex, page 36
I:\MEPC\62\INF-10.doc
Aquarius RPM Speed Fuel Dist miles per days wind force RPMShip 63-66 14.25 2106 8003 3.800095 23.4
14.25 330 900 2.72727317 609 2561 4.205255
939 3461 3.685836 9.73.466264
ROB 3045 11464 3.76486 33.129/11/2010 2816.10 13.62 44830/11/2010 2739.6 14.02 76.50 364 4.75817 401/12/2010 2667.2 14.21 72.40 341 4.709945 702/12/2010 2592.9 61.4 14.09 74.3 339 4.56258403/12/2010 2518.6 60.5 14.84 74.3 371 4.993271 404/12/2010 2448.8 69.8 14.36 69.8 362 5.186246 305/12/2010 2373.7 61.4 14.37 75.1 361 4.80692406/12/2010 2301 60.7 14.36 72.7 341 4.690509 407/12/2010 2227 61.5 14.44 74 361 4.878378 408/12/2010 2154.1 61.1 14.3 72.9 336 4.609053 309/12/2010 2080.2 60.6 14.7 73.9 368 4.979702 510/12/2010 2007.1 61.2 14.3 73.1 337 4.610123 511/12/2010 1930.7 61.6 14.3 76.4 366 4.790576 612/12/2010 1860.7 60.7 14.4 70 356 5.085714 513/12/2010 1790.3 61.1 14.88 70.4 357 5.07102314/12/2010 1708.5 63 14.51 81.8 395 4.828851 315/12/2010 1632.1 63 14.58 76.4 377 4.934555 316/12/201017/12/2010 1487.8 62.7 14.73 72.15 388 5.377685 318/12/2010 1404.8 61.6 14.76 83 369 4.445783 319/12/2010 1319.4 63.8 14.8 85.4 375 4.391101 220/12/201021/12/2010 1258 16.65 61.4 283Total 1558.10
7992 5.129324
22/12/2010 3700.6 Departure Singapore23/12/2010 3644.5 60 15.5 56.1 286 5.09803924/12/2010 3569.4 61.5 15.69 75.1 395 5.25965425/12/2010 3497.8 60.3 15.33 60.3 352 5.83747926/12/2010 3438 7 hours stopped for economizer cleaning26/12/2010 3438 62.1 15.31 62.1 294 4.734327/12/2010 3367.2 60.9 15.66 60.9 357 5.86206928/12/2010 3290 61.2 15.38 77.2 386 5.000 329/12/2010 3217.1 61.4 15.28 72.9 352 4.82853230/12/2010 3144.6 60.9 15.21 72.5 365 5.03448331/12/2010 3068.9 61 14.96 61 374 6.13114801/01/2011 3016.9 14.94 52 254 4.884615 Arrival Fujairah01/01/2011 3014.4 Departure01/01/2010 3001.4 56.3 17 13 80 6.15384602/01/2010 2898.8 68.4 15.96 102.6 394 3.84015602/01/2010 2870.4 16.46 28.4 107 3.767606 Arrival Mina Saud(Kuwait )04/01/2010 in port Departure towards Jabal Dhanna(UAE05/01/2010 2837.906/01/2010 2804.9 62.2 16 33 15207/01/2010 2737.1 14.69 100.8 310 3.075397 JUAYMAH08/01/2010 2720.6 14.81 16.5 16.5 JEBEL DHANNA09/01/2010 944.4 4474.5 4.96480910/01/2010 4.73792911/01/201012/01/201013/01/201014/01/201015/01/2010 2602.8 Depart Juaymah15/01/2011 2577.3 64.6 14.44 25.5 91 3.56862716/01/2011 2474.6 64.6 14.81 102.7 343 3.33982517/01/2011 2382 2.0537363618/01/2011 2280.4 69.3 15.05 101.6 372 3.66141719/01/2011 2180 71 15.1 100.4 352 3.50597620/01/2011 1975.3 69.3 15.43 204.7 355 3.4684921/01/2011 1864.4 71.7 15.21 110.9 364 3.28223622/01/2011 1754.3 73.3 15.17 110.1 341 3.09718423/01/2011 1646.1 70.7 15.14 108.2 359 3.3179324/01/2011 1553.3 67.4 15.11 92.8 341 3.40521125/01/2011 1543.8 12.8 9.5 32 Arrived
2855.2 11899 3.4052114.167484
3799.6 16373.5 4.309269
***
MEPC 62/INF.10 Annex, page 37
I:\MEPC\62\INF-10.doc
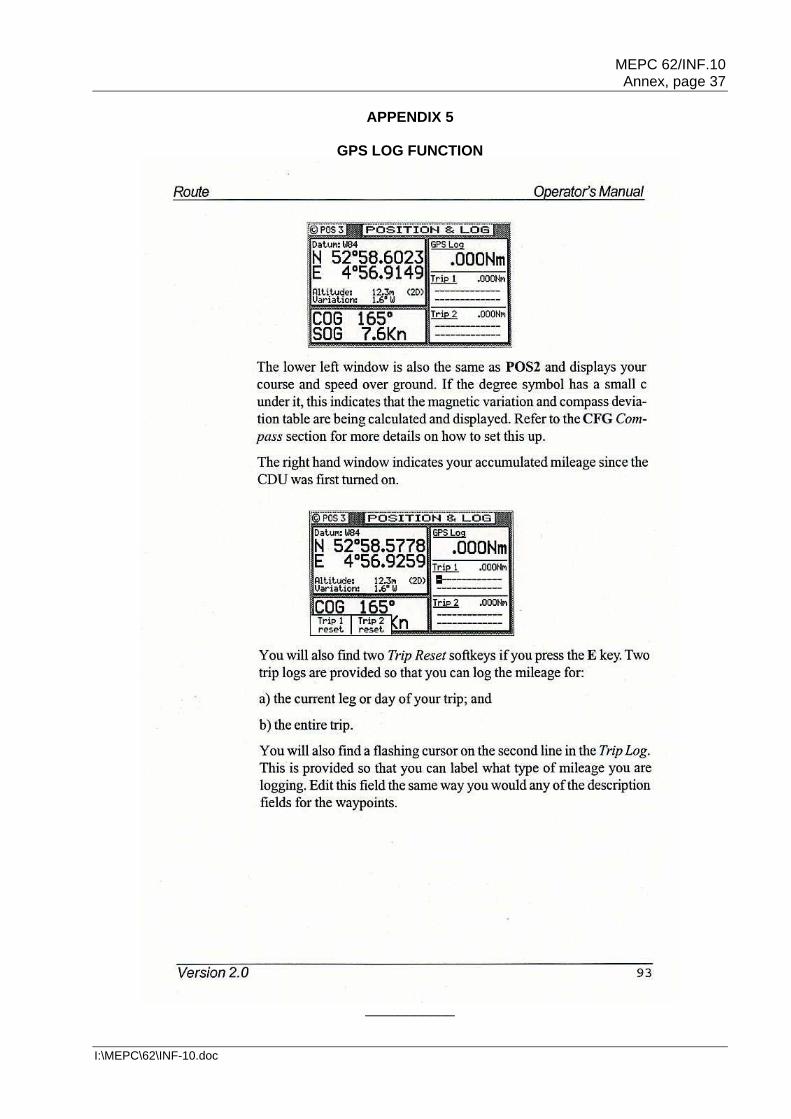
APPENDIX 5
GPS LOG FUNCTION
___________