Reducing Wait Times for Health Care - Fraser Institute · 6 d Reducing Wait Times for Health Care...
168
Reducing Wait Times for Health Care What Canada Can Learn from eory and International Experience edited by Steven Globerman Reducing Wait Times for Health Care
Transcript of Reducing Wait Times for Health Care - Fraser Institute · 6 d Reducing Wait Times for Health Care...

Reducing Wait Times for Health Care What Canada Can Learn from Theory and International Experience
edited by Steven Globerman
Reducing Wait Tim
es for Health C
are edited by Steven Globerm
an

Copyright ©2013 by the Fraser Institute. All rights reserved. No part of this book may be reproduced in any manner whatsoever without written permission except in the case of brief quotations embodied in critical articles and reviews.
The authors of this publication have worked independently and opinions expressed by them are, therefore, their own, and do not necessarily reflect the opinions of the Fraser Institute or its supporters, trustees, or staff. This publication in no way implies that the Fraser Institute, its trustees, or staff are in favour of, or oppose the passage of, any bill; or that they support or oppose any particular political party or candidate.
Date of issue: October 2013 Printed and bound in Canada
Cover design and artwork Bill C. Ray
Library and Archives Canada Cataloguing in Publication Data
Reducing Wait Times for Health Care: What Canada Can Learn from Theory and International Experience / Steven Globerman (editor)
Includes bibliographical references. ISBN 978-0-88975-269-6.

www.fraserinstitute.org d Fraser Institute d iii
Contents 1 Introduction / 3
Steven Globerman
2 Measuring How Long Canadians Wait for Health Care / 15Nadeem Esmail
3 The Consequences of Waiting / 45Dr. Brian Day
4 The Inefficiency of Health Care Rationing—and a Solution / 77David R. Henderson
5 Health Status of the Workforce and Economic Growth / 95Steven Globerman
6 Understanding Differences in Wait Times / 119Nadeem Esmail
About the authors / 157
Acknowledgments / 159
Publishing information / 160
Supporting the Fraser Institute / 161
Purpose, funding, and independence / 162
About the Fraser Institute / 163
Editorial Advisory Board / 164

Fraser Institute d www.fraserinstitute.org

www.fraserinstitute.org d Fraser Institute
Reducing Wait Times for Health Care


www.fraserinstitute.org d Fraser Institute d 3
Chapter 1
IntroductionSteven Globerman
Public opinion polls in recent years show that Canadians are generally satis-fied with their government-funded health care system.1 If there is any con-sistent source of dissatisfaction with the “single-payer” system, it is with the amount of time people wait to receive medical care.2 As the Fraser Institute has documented in an ongoing series of annual surveys of health care wait-ing lists, Canadian patients face wait times for a wide range of health care services, particularly specialty services and procedures. For example, in 2012 Canadians could expect to wait 8.5 weeks on average from GP referral to con-sultation with a specialist (ranging from 1.6 weeks for radiation oncology to 20 weeks for orthopedic surgery). They could also expect to wait 9.3 weeks on average from specialist appointment to treatment (ranging from 1.7 weeks for medical oncology treatment to 19.6 weeks for orthopedic surgery treatment (Barua and Esmail, 2012).
Requiring patients to wait for medical services is the primary way that access to a scarce resource, in this case physicians’ services, is rationed in most countries characterized by a publicly funded, universally accessible health
1 Canada does not have a single health care system, as each province and territory administers its own system. However, the federal government strongly influences most aspects of the provincial systems so that the similarities across provinces are much stronger than the differences. Given the strong similarities across provinces, as well as for convenience, the chapter will simply refer to publicly funded health care in Canada.2 While “medically necessary” physician and hospital health care services are provided to Canadians under the government-funded system, a significant percentage of health care expen-ditures are paid for primarily by households and through supplemental private insurance plans. The percentage of health care expenditures paid for privately was 29.5% of all health care expen-ditures in Canada in 2010 (CIHI, 2012).

Fraser Institute d www.fraserinstitute.org
4 d Reducing Wait Times for Health Care
insurance system. Conversely, in most markets for goods and services, price is the instrument by which the quantity demanded for the good or service in question is equated to quantity supplied. Thus, if demand exceeds supply at a given price, competition among buyers will lead to a rising price. This, in turn, will encourage an increase in the quantity supplied of the good or service, as well as a decrease in the quantity demanded. Price will keep rising until quantity demanded equals the available quantity supplied. The dynamic will work in the opposite direction if supply exceeds demand at a given price. That is, price will decline until the quantities supplied and demanded are equal. However, under Canada’s Medicare system, patients do not pay for even a portion of health care services directly through co-payments or cost-sharing, since health care providers cannot charge user fees.3 As a consequence, the price to patients for using the services of health care providers is effectively zero, although physicians are paid by the government primarily on a per-service basis. As David Henderson explains in chapter 4 of this volume, the
“first dollar” coverage feature of the government-funded system results in the demand for health care services exceeding the supply of those services, and some instrument must be substituted in place of price to ration access to health care. That instrument is waiting lists.
The purpose of this book is to assess various policy-related issues associated with waiting lists for health care services in Canada.4 One basic issue is how to measure wait times for health care, and whether the estimates reported to date systematically overstate or understate wait times in Canada. A second is the relevance of waiting lists to public policy. Requiring patients to queue for medical services, rather than ensuring sufficient output to meet the existing demand, presumably saves the government money directly in terms of reduced expenditures on hospitals and doctors, at least in the short-run.
3 If user fees or payments required of consumers were absolutely fixed and unresponsive to supply and demand conditions, they would fail to equate supply and demand at the market-clearing rate of output, although they should discourage “excessive” use of the health care system to some extent.4 In this volume, we will use the terms “health care services” and “medical services” as syn-onyms, although the former will generally encompass a broader range of services, e.g., physical therapy, than the latter. Also, we use the terms “waiting lists” and “wait times” interchangeably although, strictly speaking, they measure different phenomena. Specifically, waiting lists refer to the number of individuals waiting for medical services, whereas wait times refer to the actual period of waiting experienced by patients. The total time Canadians spend waiting for health care is obviously the product of the two.

www.fraserinstitute.org d Fraser Institute
Chapter 1: Introduction d 5
However, waiting lists impose indirect costs on those required to wait for health care, often including anxiety and physical pain and limitations. The larger the indirect costs, the more likely it is that waiting lists have net overall costs for Canadian society. Furthermore, waiting for medical services may lead to a worsening of the health status of patients such that it is ultimately more costly to treat them once they come off the waiting list or, in the extreme, impossible to restore them to health. If the costs associated with waiting are, indeed, substantial, a third policy issue becomes increasingly relevant; namely, what can and should be done to reduce or eliminate wait times for health care?
Measuring wait timesWhile it might seem a straightforward task to measure queuing for health care services, a host of conceptual and practical issues confront the measurement process. One fundamental issue is how to define “waiting” in the context of health care. In principle, waiting would seem to encompass the delay between the time an individual wants to “acquire” a health care service and the time the service is actually acquired. In practice, individuals often do not make deci-sions about when and what types of health care services they should acquire. Rather, their family doctors typically determine whether and what follow-up services are required after a consultation. Furthermore, the timing of an initial consultation with a family doctor will reflect the patient’s decision to actually book an appointment, as well as the availability of the family doctor to see the patient once contacted. Hence, as Nadeem Esmail discusses in chapter 2, most available data on wait lists and wait times focus on queuing for spe-cialty medical services and treatments. Presumably, if a patient is referred to a specialist by a family doctor or general practitioner, there is an identifiable medical health issue that needs investigation or treatment; however, it is not necessarily the case that immediate investigation or treatment is “optimal” from a medical or an economic perspective. For example, some health con-ditions may be difficult to diagnose, and delays in further investigation and treatment may yield additional information to practitioners that allows more effective and efficient “follow-on” services to be selected. For another, indi-vidual patients may have personal or work-related reasons to delay receiving specialized medical investigation and treatment, and measured wait times in such cases may reflect patient preferences rather than “involuntary” waiting.

Fraser Institute d www.fraserinstitute.org
6 d Reducing Wait Times for Health Care
While one must therefore be cautious in interpreting any waiting time for health care as a sign of a health care system’s inefficiency, changes in wait-ing over time (at least over shorter periods of time) are more likely to reflect changes in the performance of the system, rather than changes in the prefer-ences of health care suppliers and patients for quick service. Likewise, differ-ences in wait times across countries are more likely to reflect differences in the ability of national health care systems to serve the demand for health care in a timely manner than to reflect differences across countries in the preferences of health care suppliers and patients to delay diagnoses and treatment for medical or personal reasons. In chapter 2, Esmail discusses the complexities involved in comparing wait times across countries. In particular, wait time data are col-lected in different ways, and definitions of medical specialties are not identical across countries. Nevertheless, a number of comparative studies of wait times carried out over almost two decades show fairly consistently that Canada has longer wait times for health care than most other developed countries.
The policy relevance of wait timesLonger wait times in Canada than in other countries should concern policy-makers to the extent that waiting for health care imposes substantial costs on Canadians. A wide range of costs are identified in the chapters contributed by Brian Day, David Henderson, and Steven Globerman. The chapter by Day concentrates primarily on the medical consequences of delaying diagnoses and treatment of physical and mental health problems. The chapter reviews a wide range of studies documenting how delaying the delivery of medical ser-vices can make subsequent treatment more costly and less effective for many health problems. Day also discusses the personal costs of delayed treatment to patients and their families, including anxiety and depression, reduced mobility, and a reduced quality of personal relationships. It is very difficult to quantify the adverse medical and social consequences of delayed delivery of health care; however, Day’s chapter provides a convincing argument that wait lists cannot be justified on grounds that many medical tests and procedures could be safely avoided through “watchful waiting.” On the contrary, more typically, delaying tests and procedures will result in medical complications that make it less likely that patients’ health will be fully restored by subsequent diagno-sis and treatment. While it would be inaccurate to say that policymakers in

www.fraserinstitute.org d Fraser Institute
Chapter 1: Introduction d 7
Canada have ignored wait times or viewed them as benign, Day argues that wait times that are “acceptable” to policymakers are unacceptable from the perspective of best medical practice. He expresses dismay that medical doc-tors and other health care practitioners in Canada are not more vocal in their disapproval of health care policymakers.
While Henderson is primarily concerned with policy approaches for reducing wait times in Canada, he also provides some discussion of the costs of waiting for health care. In broad terms, the costs are associated with a reduction in the value of time to individuals suffering from health problems or concerns. Individuals can spend time in work or non-work related activi-ties. To the extent that individuals can meaningfully chose to work somewhat more or less, the value of time spent in leisure activities should, at the margin, approximate the value of time spent in work-related activities. The implication is that the implicit monetary value of an additional hour of “quality” leisure time is equal to the explicit monetary value of an additional hour of “qual-ity” work time. While most studies of the costs of wait times focus on the linkage between an individual’s health status and the economic value of that individual’s time spent in the workplace, Henderson underscores the point that the value of the individual’s leisure time will also be adversely affected by health problems or concerns about one’s health status. Hence, estimates of the economic cost of wait times that focus exclusively on the consequences of health problems in the workplace will seriously understate the overall eco-nomic costs of waiting for medical care, since they ignore the reduced mon-etary value of compromised leisure time.
While acknowledging that health problems have consequences that extend beyond the boundaries of the workplace, Globerman, in his chapter, focuses in detail on the labour market consequences of wait times and the broader impacts of wait times for Canada’s economic growth. He identifies two phenomena that are widely discussed in the literature: absenteeism and presenteeism. The former identifies time spent out of the workforce, either as an active employee or someone looking for employment, as a consequence of untreated health problems. The latter identifies reduced on-the-job produc-tivity of employees as a consequence of health problems. A fairly large litera-ture documents the practical relevance of the two phenomena as impediments to faster real economic growth, although very few studies provide quantitative estimates of the growth-related impacts of absenteeism and presenteeism.

Fraser Institute d www.fraserinstitute.org
8 d Reducing Wait Times for Health Care
Those studies, including one for Canada, offer a range of estimates. The impor-tant point is that the estimates are substantial. For example, according to a study summarized by the Conference Board of Canada (2013), mental and physical illnesses contribute to real GDP in Canada being as much as 8 percent below what it would otherwise be.
Improving the health status of the current population might also provide longer-run economic growth benefits by encouraging individuals to increase their investments in education and training which, in turn, would contribute to a more productive labour force over time. Healthier individuals are more likely to stay in school longer than fellow students suffering physical or mental ailments and to perform better than their fellow students during the time that they are in school. Empirical studies support this expectation, and the underlying explanations of the findings are fairly straightforward. For one thing, healthy individuals are more likely than people with physical or mental illnesses to have the strength and mobility to attend school. They are also more likely to be able to concentrate on the material being taught and absorb cognitive information. While most of the available studies in this vein focus on children and young adults, there is an inter-generational aspect to the phe-nomenon as well. Specifically, parents suffering physical or mental illnesses are less able to provide support and encouragement for their children who attend school. The disadvantages may range from not being able to ensure that their children attend school regularly to not being actively involved in monitoring and modifying at-home studying and other related behaviours of their children.
A less-obvious connection between health status and investment in education and training reflects the fact that an individual’s decision to go on to college or university involves deferring current income in favour of presum-ably higher future income associated with the added value that higher educa-tion creates in the workplace. The magnitude of the economic benefits to the person who invests time and money (including foregone income) in higher education will depend on how long the person remains in the workforce after finishing college or university, as well as how intensively and consistently the person can carry out his or her occupational activities.5 If people expect that
5 The relevant idea here is that individuals who can work more consistently and intensively at their jobs are likely to be more productive, and more productive workers can expect to earn higher incomes over their lifetimes, other things being constant.

www.fraserinstitute.org d Fraser Institute
Chapter 1: Introduction d 9
physical and mental ailments will receive prompt and effective attention from health care providers, they are more likely to project a relatively long and productive employment history for themselves. This, in turn, should encour-age more investment on their part in skills training and higher education. Increases in what economists call “human capital” contribute to long-run improvements in labour productivity and, therefore, in real GDP that augment the previously identified increases associated with reductions in absenteeism and improvements in productivity among currently active workers.
In sum, reducing wait times can be expected to improve the health sta-tus of Canadians which, in turn, would contribute to increased real economic growth, along with other improvements in the quality of life of Canadians currently suffering from physical or mental ailments. While it is not feasible to offer any precise estimates of the economic and non-economic gains asso-ciated with any given reduction in current wait times, there is sufficient evi-dence to suggest that the short-run and long-run gains would be substantial. To be sure, reducing wait times for health care services will likely require additional resources, at least in the short run, and the associated costs rep-resent an offset to the anticipated benefits. Efficient initiatives to reduce wait times are therefore an important focus for policymakers.
Reducing wait timesTraditionally, governments in Canada have attempted to reduce wait times primarily by increasing funding of provincial health care systems and through bureaucratic management approaches. An alternative approach that has been periodically debated in the public policy forum is to allow a larger role for privately funded medical care in Canada.6 The most prominent objection to allowing an expanded role for private insurance in the financing of basic health care in Canada is that it will contribute to inequalities in the distribution of health care. Specifically, those who are sufficiently wealthy, or who are in occu-pations where employers are willing and able to contribute financially to their employees’ private insurance plans, will receive more timely and, possibly, bet-ter health care than those who rely strictly upon the public insurance program.
6 For an overview of the issues raised in the Canadian public policy debate, see Globerman and Vining (1996).

Fraser Institute d www.fraserinstitute.org
10 d Reducing Wait Times for Health Care
The issue of whether Canadian governments can prohibit private insurance coverage parallel to the coverage provided by the government insur-ance program came to a head in the 2005 Chaoulli vs. Quebec case heard by the Supreme Court of Canada. The majority opinion was that the prohibition was in breach of the Quebec Charter. Specifically, prohibiting health insur-ance that would permit ordinary Canadians to gain access to health care in circumstances when the government was failing to deliver health care in a reasonable manner interferes with life and security as protected by the Charter.7 Notwithstanding the decision, most policy analysts believe that the legal status of private health insurance in Canada remains uncertain.
David Henderson’s chapter addresses various facets of this argument. He notes that if some patients who are waiting for medical care under the publicly funded system choose to obtain care that is paid for privately, the queue for health care services paid for by the public insurance program should get shorter, all other things constant. The key idea here is that real health care resources available to patients using the public insurance program do not decrease as an increasing level of service is provided to patients paying privately for the service. In this case, the quality of care provided to pub-licly funded patients should not necessarily decline, while the access of those patients to timely health care should improve.
Henderson discusses the likelihood that real resources available to treat publicly insured patients will be “bid away” to the privately financed segment of health care consumers. A critical issue in this regard is the elas-ticity of supply of doctors and other health care inputs over time. The elas-ticity of supply is a measure of how responsive the quantity supplied of any good or service is to higher prices for that good or service. The greater the elasticity of supply, the smaller the increase in price required to encourage any given increase in the quantity supplied. While it certainly takes time to train doctors and other health care professionals, as well as expand hospi-tals, clinics, and other facilities, the quantity supplied of these inputs can be expected to be quite responsive to higher prices, barring public policies that restrict responsiveness. For example, governments can delay or disapprove the construction and licensing of facilities serving privately insured patients
7 An extensive discussion and assessment of Chaoulli vs. Quebec is provided by Yeo, Emery, and Kary (2009).

www.fraserinstitute.org d Fraser Institute
Chapter 1: Introduction d 11
or prevent privately insured patients from receiving health care services in publicly funded facilities, even when those patients are willing to pay a com-petitive price for access to the facilities. They can also limit the increase in the number of health care workers by restricting admissions to publicly funded medical schools, maintaining tight quotas on the immigration of qualified foreign doctors, and allowing professional groups such as provincial colleges of physicians and surgeons to retain exclusive legal rights to supply medical services that could be as safely, and more cheaply, supplied by adequately trained non-members of the group.8 In short, the elasticity of supply of health care services would increase substantially by eliminating government barriers to the growth of facilities, physicians, and nurse practitioners.
Opponents of expanding privately funded health care in Canada argue that waiting lists can be shortened in Canada by greater public funding with-out risking the creation of a two-tier health care environment.9 However, Henderson notes, as have others, that wealthy Canadians currently enjoy the option of acquiring health care services outside of Canada, so that equality of access does not exist under the current funding system. Indeed, Curtis and MacMinn (2008) provide evidence that a positive relationship exists between socio-economic status and health care use in Canada, as well as in other coun-tries offering public health care.10 Furthermore, O’Neill and O’Neill (2007) show that compared to the United States, Canada has a steeper health gradi-ent with respect to income. That is, rationing access to doctors and hospitals disproportionately affects persons of lower socio-economic status. Henderson also raises a moral issue: if we allow individuals to buy goods and services such as food and housing in private markets, what moral justification is there for preventing individuals from buying health care services in private markets? Yeo, Emery, and Kary (2009) discuss yet another moral issue: can harming indi-viduals in the pursuit of absolute equality of access to health care be justified?
8 In order to be recognized as a medical doctor in Canada, a physician must be a member of a provincial college of physicians and surgeons according to provincial government legislation.9 Globerman and Vining (1998) provide some evidence that restricting the expansion of privately funded health care might actually cause an erosion of voter support for the publicly funded system, thereby leading to longer wait times in the public system.10 While use is not equivalent to access, Curtis and MacMinn cite evidence from surveys show-ing that the percentage of low-income individuals reporting problems gaining access to care is about 1.5 times higher than the average for all individuals.

Fraser Institute d www.fraserinstitute.org
12 d Reducing Wait Times for Health Care
Other countries’ policiesWaiting lists for health care are not unique to Canada. Moreover, most devel-oped countries, including Canada, have implemented policies to reduce wait times. The various initiatives, as well as the varied outcomes of the initiatives undertaken, help inform the policy debate about how to provide timelier health care in the context of a government-funded, universal health care sys-tem. In chapter 6 of this volume, Esmail reviews the international experience with wait times and reductions in wait times in an effort to identify policies that might work to improve the timeliness of access to health care in Canada.
Esmail observes notable differences across OECD countries in waiting lists and wait times. Consistent with his discussion of waiting list measure-ments in chapter 2, he cautions that the differences in wait times described in chapter 6 are subject to the measurement problems identified in his earlier chapter. Nevertheless, he finds several consistent attributes of national health care systems that can be characterized as having relatively short queues for health care services. One attribute is a greater reliance on social insurance models for health care financing rather than tax-financed models. Among other things, the former generally impose a greater degree of cost-sharing upon patients in the form of co-payments, which discourages “overconsump-tion” of health care services. Another attribute is the use of fee-for-service arrangements rather than salaried arrangements for the payment of medical practitioners and providers. This is a controversial claim in light of ongoing concerns expressed by policymakers in the United States and Canada about the incentives of doctors to perform medically unnecessary and expensive tests and procedures given that they are paid on a per-service basis with more complex tests and procedures reimbursed at a higher rate. Esmail’s assess-ment is that health care providers who are paid on a fee-for-service basis that
“follows the consumer” are generally more responsive to their patients’ needs and priorities than should be expected under a system where doctors are paid a salary or a fixed amount per patient.
Perhaps most fundamentally, Esmail finds that expansions in health care management and expenditures alone are unlikely to be effective in reduc-ing waiting lists and wait times. However, policies that incorporate or mimic incentives and allocation mechanisms found in private competitive markets can lead to shorter wait times. He also concludes that in countries character-ized by relatively limited waiting, people have access to privately funded health

www.fraserinstitute.org d Fraser Institute
Chapter 1: Introduction d 13
care services. The latter provide competition for the government-funded sec-tor, which might improve accountability in the sector, and also demonstrate market-based mechanisms to improve the timeliness and quality of health care delivery that can often be implemented in some form in the government-funded sector. Henderson identified this latter phenomenon as a potentially important benefit of allowing a privately funded health care option in Canada. Indeed, health care systems that rely to a greater extent on market-based policies seem to outperform others in terms of timeliness of treatment, even when patients make limited use of privately funded alternatives.
It is unclear whether market-based incentives would be widely adopted by government-funded health care systems in the absence of a pri-vately funded segment. Conversely, the presence of privately funded alterna-tives does not necessarily mean that efficiency reforms will be implemented in the government-funded segment. Indeed, Esmail points out that encour-aging patients to seek privately financed care in the absence of policies deal-ing with the underlying causes of long wait times in the public sector may not always reduce waiting times in the government-funded segment of the industry. What arguably still requires additional research is why bureau-crats in some government-funded national systems are more willing to adopt market-based mechanisms than those in others. The presence of actual or potential competition from privately funded options is a relevant factor but clearly does not completely explain the differences that Esmail observes. Nevertheless, the key point for Canadian policymakers is that maintaining status quo health care policies is unlikely to improve the timeliness of the provision of health care services in Canada or improve the efficiency of the government-funded system.
Fraser Institute d www.fraserinstitute.org
14 d Reducing Wait Times for Health Care
References
Barua, Bacchus, and Nadeem Esmail (2012). Waiting Your Turn: Wait Times for Health Care in Canada, 2012 Report. The Fraser Institute.
Canadian Institute for Health Information [CIHI] (2012). National Health Expenditure Trends, 1975-2012. CIHI.
The Conference Board of Canada (2013). Health Matters: An Economic Perspective. The Conference Board of Canada.
Curtis, Lori, and William MacMinn (2008). Health Care Utilization in Canada: Twenty-five Years of Evidence. Canadian Public Policy xxxiv (1): 65-87.
Globerman, Steven, and Aidan Vining (1996), Cure or Disease? Private Health Insurance in Canada, Toronto: University of Toronto Press.
Globerman, Steven, and Aidan Vining (1998). A Policy Perspective on “Mixed” Health Care Financing Systems. The Journal of Risk and Insurance 65 (1): 57-80.
O’Neill, June, and Dave O’Neill (2007). Health Status, Health Care and Inequality: Canada vs. the US. Working Paper 13429. National Bureau of Economic Research. <http://www.nber.org/papers/w13429>, as of May 24, 2013.
Yeo, Michael, J.C. Herbert Emery, and Daniel Kary (2009). The Private Insurance Debate in Canadian Health Policy: Making the Values Explicit. SPP Research papers 2 (3) (June). University of Calgary, School of Public Policy. <http://policyschool.ucalgary.ca/sites/default/files/research/yeo-emery-
kary-oline-final.pdf>, as of May 24, 2013.
www.fraserinstitute.org d Fraser Institute d 15
Chapter 2
Measuring How Long Canadians Wait for Health CareNadeem Esmail
Among the most discussed topics in Canadian health policy debates is timeliness of care. For many reasons (some of which will be discussed in later chapters of this volume), timeliness of health care is usually deemed to be an important attribute of health system performance and quality. As noted in the introduc-tory chapter, waiting times are often used as a method to ration access to health care in countries with universal health insurance, minimal patient payments for services, and governmental control of the supply of services (Willcox et al., 2007; Hurst and Siciliani, 2003a).1 But can we accurately measure waiting times in order to compare them between nations and even within nations? If we can, how does Canada stack up in comparison with other nations with respect to timely delivery of health care? These two important issues are addressed in this chapter.
Measuring waitingMeasuring waiting times for health care services is not a simple or straightfor-ward task, particularly when the goal of measurement is comparison between jurisdictions. Beyond the important details of the measurement approach and the definition of when the waiting process begins, concerns exist about accu-racy, and whether patient groupings (such as within surgical specialties), and prioritization categories (such as elective or non-urgent), are classified the same
1 Under these circumstances, non-price rationing in the form of waiting times supplants price rationing as a means of allocating resources and dealing with shortages.

Fraser Institute d www.fraserinstitute.org
16 d Reducing Wait Times for Health Care
way across jurisdictions. Importantly, not all nations may classify procedures under a given medical speciality identically, or prioritize medical conditions the same way. For example, some jurisdictions may have stricter definitions of what is “urgent” than others. The discussion below aims to provide a brief overview of the complexities surrounding wait time measurement with the goal of providing context for the international comparisons of wait times that follow.
MethodsFundamentally, there are three broad approaches to measuring waiting for care: 1) retrospectively—the actual measured waiting time for those who received care; 2) prospectively—the expected waiting time for those who need care; 3) cross-sectional—the elapsed waiting time of those currently waiting for care as of a specific date.2 There are fundamental differences between these methods and each has its own strengths and weaknesses. For example, retrospective approaches measure the time that individuals actually spent waiting for care. However, they will not capture the wait times of those who have had unlimited waits or who were removed from wait lists due to death, spontaneous improvement, or deterioration sufficient to no longer qualify for treatment. Prospective wait time measurements, on the other hand, can better capture the wait time consequences of adverse events, deaths, and sponta-neous improvement. On the other hand, they may inappropriately include patients who appear to be waiting interminably but who should have been removed from the wait list for various reasons. Cross-sectional measures of waiting times can differ from both prospective and retrospective measure-ments if the rate of treatment changes over the measured waiting time. This might occur, for example, because of holiday-related or seasonal slowdowns.3
In addition, all of the approaches must somehow account for patients who were not formally waitlisted, for example those taken into emergency, as well as for patients who elected to extend their wait for personal reasons.
2 Waiting lists are not simple queues that are cleared on a first-come, first-served basis. Rather, a typical waiting list is composed of different streams of patients in different urgency categories, and patients may move from one stream to another if their condition deteriorates or becomes unstable. 3 Siciliani and Dixon (2013) note that wait times for patients on the wait list (such as cross sec-tional studies) can also report longer wait times than measures of wait times for patients treated (retrospective studies) because of the possibility of over-sampling those waiting a long time as those waiting for short times may enter and leave the queue quickly.

www.fraserinstitute.org d Fraser Institute
Chapter 2: Measuring How Long Canadians Wait for Health Care d 17
Sources of dataThere are various sources of waiting list data, or data that can be used to gener-ate measures of waiting, each again having its own strengths and weaknesses.
Hospital booking systems are one source of waiting time data. These are operat-ing room reservation systems used by care providers to schedule patients for surgery. The use of booking systems to measure wait times is perhaps the most basic and straightforward approach to measuring waiting. However, this source has important limitations. For one thing, hospital booking systems only capture one portion of the wait experience, i.e., the wait time between the scheduling of a hospital procedure and the completion of that proce-dure. It does not, therefore, measure waiting times outside of this booking-to-treatment range. More comprehensive booking systems that encompass more of the care process (for example, specialist consultations or diagnostic scans) mitigate this limitation. Furthermore, if there is a significant delay between the decision to treat and the booking of a date for treatment, or some administrative limitation on how far into the future bookings can be made, hospital booking systems may end up markedly underestimating the wait time from the specialist’s decision to provide a service to the time that the service is actually provided.
Administrative systems are a second source of waiting times data. Administrative data are generated within the health care system, either to satisfy regulations or to serve management processes, or, more commonly, to facilitate billing practices. For example, Canadian physicians paid on a fee-for-service basis will bill the government insurer for each care episode. This is also true for hos-pitals paid on an activity-funded basis. In Canada, hospitals record individual patient encounters in a standardized manner for governments and statistical agencies, although not necessarily strictly for payment. Such standardized data can be used to measure waiting times with particular events serving as proxies for the starting and midpoints of the waiting process. For example, the last physician visit billed prior to surgery can be used to date the “deci-sion to treat,” while the first specialist visit billed can be used to date the first
“consultation after physician referral.”Data gathered from administrative systems can fill in some of the gaps
from hospital booking systems by capturing the dates when patients met with

Fraser Institute d www.fraserinstitute.org
18 d Reducing Wait Times for Health Care
various providers, or when they received specific services prior to or after hospital visits. The use of administrative data to measure health system per-formance is a well-established approach, and such data are used to measure the quality of inpatient care and patient safety in many jurisdictions. Also, like hospital booking systems, administrative systems have the advantage of capturing all or nearly all patients in the care process, which may not be the case with other data sources. On the other hand, both administrative data and hospital booking data are subject to potential entry errors that can result in misclassification or incorrectly recorded patient events.
Interpretation of administrative data and assignment of various events as proxies for time points in the waiting process must be undertaken with care. Importantly, while some studies use the last physician appointment prior to treatment as the start point of waiting (see, for example, De Coster et al., 1998), this procedure may serve to underestimate waiting if wait times are very long and require additional physician follow-up during the wait. This is also the case if, for any other reason, a decision to treat is made at an appointment prior to the final pre-surgical appointment. Further, administrative data can work well in estimating waiting for some care processes (see, for example, De Coster et al., 2007) but may have difficulty with more complex care pathways, or with more complex patients for whom many encounters with care provid-ers will occur over time and not all of which may necessarily be related to the wait time being measured.
Patient chart reviews are a third source of data. These encompass summaries of information from individual patient records to measure waiting along a given care pathway or along multiple pathways. Patient chart reviews will often be more detailed and provide more in-depth information than can be obtained from administrative systems data, since chart reviews encompass not just major medical events, but all the information contained in patient records, both electronic and paper-based. Unlike administrative data in which particular events are used to estimate time points in the care process, assess-ments of chart reviews, which contain physicians’ notes, letters, and so forth, have the potential to more accurately identify when decisions were made. Furthermore, chart reviews may be able to overcome the central data limita-tion of administrative systems approaches by capturing events that were not necessarily reported to government or statistical agencies but were recorded

www.fraserinstitute.org d Fraser Institute
Chapter 2: Measuring How Long Canadians Wait for Health Care d 19
for patients on charts in a health care facility.4 Notwithstanding these advan-tages, the extensive work associated with preparing chart reviews makes this approach a poor candidate for regular, ongoing wait time measurement.
Waiting list registries provide a fourth data source. These registries are central-ized databases that measure wait times within a health care system. In some cases, these are simply programs that undertake routine wait time measure-ments using one of the processes described above. For example, they might regularly measure surgical wait times gathered through hospital booking sys-tems or through provider surveys. In other cases, these registries are central-ized booking systems for services in a given area. In yet other cases, they may be central data repositories into which care providers in clinics, hospitals, and other facilities enter data about their patients.
To some extent, comprehensive data-repository registries attempt to replicate chart reviews on a larger scale, but they do not necessarily meet the same standard of accuracy and detail. Importantly, registries must have data entered into them, and any delay in doing so may lead to wait times being under-estimated. Furthermore, while registries can be designed to capture the full spectrum of waiting, they are very costly, which limits their use, as does resis-tance from care providers who must spend the time to maintain the databases.
Some observers have raised the issue of potential “gaming” of the regis-try and booking data by physicians. For example, in the presence of long waits, physicians may add patients to waiting lists before those patients are ready for treatment in the expectation that the patients’ conditions will deteriorate enough that they will be ready for treatment when they reach the front of the queue. Similarly, physicians may add patients to waiting lists prematurely in order to allow more time for decision-making without adversely affecting patients’ access to timely care when it is needed.
There is also the issue of data quality with registries. Specifically, it is critical that patients be removed from waiting lists if they have moved away, died, already received care, or spontaneously improved so that care is no lon-ger required.5 Managing patient and physician requests for delays and ensur-
4 These can include, for example, the date diagnostic scans were completed, or when other related diagnostic tests were undertaken.5 This is also a relevant consideration for administrative and booking systems.
Fraser Institute d www.fraserinstitute.org
20 d Reducing Wait Times for Health Care
ing that these requests are handled appropriately in measurements of waiting is also important. Studies and audits of waiting lists have shown that there can be substantial room for error if patients waiting are not monitored and removed from waiting lists when it is appropriate to do so. However, upward and downward biases may effectively cancel each other out, at least to some extent, in registry-based measurements. Hence, it cannot be concluded that registry-based estimates of waiting are biased in one or another direction.
Surveys constitute yet another source of data on waiting times. Surveys can focus on either patients or health care providers, and they can be retrospective, pro-spective, or cross-sectional. For example, some surveys of physicians ask how long patients can expect to wait for specific procedures (prospective). Some sur-veys of patients ask how long they have been waiting for care (cross-sectional) or how long they waited for care before it was finally received (retrospective).
Surveys are able to capture a broad range of information, as well as iden-tify total delay across complex care pathways, often more cost-effectively than other methods. However, they are also imperfect. Importantly, while surveys of patients and care providers can readily measure wait times along the care con-tinuum and may be less susceptible to list maintenance problems such as those associated with registries and booking systems, they are subject to recall error, response bias, sampling error, and biases introduced by survey design. Recall errors arise when individual survey respondents do not accurately recall waiting times. Response biases can occur when non-respondents and respondents to a survey differ in certain characteristics that are, in turn, linked to waiting times. Finally, poor survey and questionnaire designs may lead to biased or misleading information. Each of these problems can be overcome, most readily through peer review of the survey tool, use of large survey pools, and the design and implementation of survey instruments that generate a relatively large response rate. Econometric testing and follow-up surveying of non-respondents can also be used to determine if specific biases are present in the responses.
In addition, all these methodologies must somehow account for patients who were not wait-listed (often emergencies), for patients who were treated as emergency cases from the queue, and for patients who voluntarily elected to extend their wait for personal reasons. All three types of cases have important implications for the interpretation of waiting.

www.fraserinstitute.org d Fraser Institute
Chapter 2: Measuring How Long Canadians Wait for Health Care d 21
Overall assessmentNo method is necessarily superior to the other, nor has any research pointed to the superiority of one approach. The method selected for measurement of wait times can vary depending on the purpose of measurement, data avail-ability, and affordability. Further, each of these approaches provides valuable information to policy debates and decision making, even if they fall short of the “perfect” standard of a complete and audited registry. This said, measures produced using different methodologies cannot be directly compared with one another, and they may vary considerably, even when correctly and accu-rately measuring the same wait time.
Beyond these larger issues lie important definitional issues surround-ing the measurement of waiting times. These may seem trivial, but they are extremely important when measuring waiting for health care. Of course, the ultimate end of waiting is fairly straightforward to identify: it is the time when the required care is delivered. The start and intermediate points are, however, much more complex to identify, particularly when the limitations of alterna-tive measurement approaches are taken into consideration. For example, a general practitioner’s (GP’s) referral to a surgeon might be considered the start of waiting. Yet this ignores any delay to see the GP in the first instance, delays related to diagnostic tests ordered by the GP,6 and delays between the GP’s decision to refer and completion of the referral. More pertinent to inter-national waiting time comparisons, some nations do not require GPs to play a gatekeeping function and allow patients to self-refer directly to specialists, thereby complicating comparisons.
Furthermore, any one of several starting points in the process can be used to measure the specialist-to-treatment wait time. Using the initial spe-cialist consultation with a patient as the start time has the benefit of capturing any delays related to diagnostic testing, secondary specialist consultations, and so forth. But it may also introduce some error into the measurement when compared with “decision to treat” as the starting point of waiting. Importantly, it may capture “watchful waiting” by physicians, or patient-generated delays. It may also include unrelated care for patients with complex health condi-tions. This is not to say that initial physician contact is necessarily a poor starting point for the measurement of waiting: limiting the measurement of
6 In Canada, GPs may have limited ability to order diagnostic scans, such as CTs and MRIs.

Fraser Institute d www.fraserinstitute.org
22 d Reducing Wait Times for Health Care
wait times to the period between the decision to treat and the actual receipt of treatment can result in significant underestimation of wait times. That is because the total wait from GP referral, or even from presentation to GP with a problem, and including time for diagnostic tests can be much longer than—and can even be multiples of—that captured by measuring only the final stage of waiting.
Besides the considerations associated with the definition of wait times, there are also issues around the prioritization of patients and clinical thresh-olds for treatment. Importantly, waiting is most often a phenomenon associ-ated with “elective” or “scheduled” conditions, and the triaging of patients into groups that are made to wait might not necessarily be the same across nations.7 The same can be said of the measurement of shorter wait times for urgent or emergent health care.8 Because there is no international agreement on the prioritization of surgery, it should not be assumed that the terms set out in a measurement of wait times are used in the same way across countries.
In addition, policy approaches to prioritization and clinical thresholds for treatment can play a potentially confounding role. An example to consider here is that of New Zealand, where the wait list is limited only to those patients who pass a particular clinical threshold that is set by government funding levels.9 This contrasts with approaches by nations such as Canada, where physicians individually determine which patients will and will not be added to the queue and where standardized clinical assessments are less common.
Governments may also be focused on particular wait times or particu-lar segments of waiting, which may have the effect of creating longer waits in other areas. For example, a program focused on limiting wait times to
7 Procedures such as cataract surgery, hip and knee replacement, coronary artery bypass sur-gery, percutaneous transluminal coronary angioplasty (PTCA), hernia repair, cholecystectomy, prostatectomy, and varicose vain surgery are prominent among procedures that regularly account for the bulk of surgical waiting lists (Hurst and Siciliani, 2003a).8 This has further importance if, as is typical, emergency wait times are not included in conven-tional wait time statistics. If the ratio of emergency to non-emergency procedures is different in one country from another, wait time measures may provide a misleading comparison of the average speed with which patients are being treated in one country versus another.9 Changes in wait times in New Zealand have not always been the result of improvements in access. In 2006, more than 35,000 patients originally accepted onto waiting lists were removed from the list and referred back to their family doctor in response to a six-month waiting time target that was tied to financial penalties (Willcox et al., 2007).
www.fraserinstitute.org d Fraser Institute
Chapter 2: Measuring How Long Canadians Wait for Health Care d 23
some maximum may result in longer waits for more urgent patients in order to ensure that less urgent patients do not exceed the time limit. Similarly, a focus on only the specialist-to-treatment or booking-to-treatment wait time may lead to longer wait times for specialist consultations as resources are reallocated across patients. Such a focus might also lead to delays in booking patients or registering patients for treatment, at the same time that measured wait times improve and move within target time frames. In effect, measured waiting time can decrease, while unmeasured waiting time can increase.
Finally, there is the important matter of data aggregation in inter-national comparisons. While comparisons between countries for particular treatments (e.g., cataract surgery, and total hip or knee replacement) are fairly straightforward to carry out, aggregating wait times up to the specialty level for purposes of comparison is more complex. This is because the scope of specialty practices is not standardized across countries.
These various caveats suggest caution when comparing waiting times across countries. In particular, when making comparisons outside geographic regions or outside groups of nations with common specialty classifications, comparisons of wait times must be made either at the very detailed procedure level or at higher aggregate levels.
International comparisons of waitingGiven the numerous complexities and limitations surrounding the creation of internationally comparable waiting list estimates, it is unsurprising that there are relatively few studies comparing the length of wait times across countries. However, some available studies identify wait times for various procedures. In addition, the Commonwealth Fund has, for some years, mea-sured wait times along the care continuum, with the notable exception of diagnostic services.
Measurements of waiting by procedureCoyte et al. (1994) used a survey of patients who underwent treatment for knee replacement to measure waiting times for that procedure in Ontario and the US in the late 1980s. They found that Canadians waited longer than Americans for orthopaedic consultations and for surgery post-consultation. American wait times for consultation averaged 3.2 weeks (median 2 weeks)

Fraser Institute d www.fraserinstitute.org
24 d Reducing Wait Times for Health Care
compared to Canadian wait times that averaged 5.4 weeks (median 4 weeks). American wait times for treatment averaged 4.5 weeks (median 3 weeks) while Canadian wait times for treatment averaged 13.5 weeks (median 8 weeks).
Collins-Nakai et al. (1992) studied international differences in access to cardiovascular care using data collected from cardiovascular specialists and substantiated through government, OECD, and WHO data collections, where possible. They discovered that Canadians waited longer than Germans and Americans for cardiac catheterization (2.2 months for Canadians versus 1.7 months for Germans and 0 months for Americans), angioplasty (11 weeks (Canada) versus 7 weeks (Germany) and 0 weeks (America)), and bypass surgery (5.5 months (Canada) versus 4.4 months (Germany) and 0 months (America)).
Carroll et al. (1995) studied wait times for cardiac procedures using a survey of clinic directors, measuring projected wait times from referral to treatment for standardized medical cases. Their survey revealed that in 1992, Canadians generally waited longer for both elective and urgent coronary artery bypass than did Americans (whether in private or public Veteran’s Administration hospitals) and Swedes, and longer than Americans for either elective or urgent angiography. At the same time, Canadians had shorter waits than the British for elective and urgent bypasses and angiographies, and shorter waits than Swedes for both types of angiographies.10
Dunn et al. (1997) surveyed patients over age 50 in a study exam-ining the acceptability of wait times for cataract surgery. They reported an expected median waiting time of approximately 5 months in both Manitoba and Denmark. This compared to an expected median waiting time of approxi-mately 2 months in Barcelona, Spain.
Jackson et al. (1999) compared waiting times for coronary artery bypass in New Zealand in 1994-95, generated from a chart and referral letter review, with wait times in Ontario for the same period generated from a wait
10 It is noteworthy that the studies by Carroll et al. (1995), Collins-Nakai et al. (1992), and Coyte et al. (1994) predate a period of fiscal restraint in the 1990s during which health care expenditures in Canada decreased in real per capita terms for several consecutive years. To the extent that wait times existed prior to the reduction in spending, these findings suggest that wait times are endemic to the Canadian model. This is supported by broader research on wait times. For example, Willcox et al. (2007) note that waiting lists are generally found in countries with no or low patient cost-sharing, constraints on surgical capacity, and public (or tax-funded and government run) health insurance.

www.fraserinstitute.org d Fraser Institute
Chapter 2: Measuring How Long Canadians Wait for Health Care d 25
times registry (from Naylor et al., 1995). They found that the New Zealand mean and median waiting times (232 and 106 days, respectively) were longer than the Canadian mean and median wait times (34 and 17 days, respectively).
Lofgren (2003), in a study examining wait list initiatives in Sweden, compared Swedish wait list registry data for Greater Stockholm against Canadian physician survey data for Greater Vancouver compiled by the Fraser Institute. He found that wait times in Canada and Sweden were fairly similar. This was true for both longest and shortest reported waiting times from GP to specialist and specialist to treatment.
Siciliani and Hurst (2003) used information from administrative data-bases to compare wait times in nations involved in the OECD waiting time project. They focused on “inpatient waiting time for patients admitted for treatment” (p. 62), as this measure is the most widely available in OECD coun-tries. Wait times were reported in their study for Australia, Canada, Denmark, Finland, Norway, the Netherlands, Spain, Sweden, and the United Kingdom (England), and are shown in table 2.1 (mean data) and table 2.2 (median data). Siciliani and Hurst report that the countries with the highest waiting times were the UK and Finland, followed by Denmark, Norway, Australia, and Spain. The shortest waiting times were most often found in the Netherlands. The data confirm that wait times for less urgent procedures (e.g., joint replacement and cataract surgery) are systemically higher than wait times for more urgent procedures (e.g., bypass surgery). Siciliani and Hurst also note that their focus on inpatient waiting time omits a significant portion (at least one third) of the total wait that patients experience, including the waiting time from GP referral to specialist consultation.
Aggregate comparisons of waitingSince 1998, the Commonwealth Fund has undertaken an annual interna-tional health policy survey that, in part, measures access to health care ser-vices. This data makes possible international comparisons of the full range of waiting, including for emergency care, to see a primary care provider, to see a specialist, and the more commonly reported wait for non-emergency treatment. Their survey reports also allow some limited tracking of changes in waits over time. An important advantage of these surveys is that they are collected according to common definitions and common methodologies across countries, thereby improving comparability. Being retrospective and

Fraser Institute d www.fraserinstitute.org
26 d Reducing Wait Times for Health Care
Tabl
e 2.
1: M
ean
inpa
tient
wai
ting
times
(day
s) o
f pat
ient
s adm
itted
by
surg
ical
pro
cedu
re, 2
000
Hip
repla
cem
ent
Knee
re
place
men
tCa
tara
ct
surg
ery
Varic
ose
veins
Hyste
recto
my
Pros
tate
ctom
yCh
ole-
cyste
ctom
yIn
guina
l and
fem
oral
hern
iaCA
BGPT
CA
Austr
alia*
163
201
179
216
5469
8387
44
Denm
ark
112
112
7199
7573
Finlan
d20
627
423
328
010
081
159
125
4230
Norw
ay13
316
063
***
142
6475
103
109
4653
Neth
erlan
ds96
8511
110
761
6071
7518
Spain
(Ins
alud)
**12
314
810
411
710
262
107
102
3981
Swed
en19
9
UK (E
nglan
d)24
428
120
622
715
952
156
150
213
80
Not
es: C
ABG
= C
oron
ary
arte
ry b
ypas
s sur
gery
. PT
CA =
Per
cuta
neou
s tra
nslu
min
al c
oron
ary
angi
opla
sty.
* Q
ueen
sland
, Sou
th A
ustr
alia
, and
Wes
tern
Aus
tral
ia.
** D
ata
for S
pain
incl
ude
only
Insa
lud,
whi
ch p
rovi
ded
heal
th se
rvic
es to
mor
e th
an 1
5 m
illio
n pe
ople
(of a
tota
l pop
ulat
ion
of 4
0.3
mill
ion
peop
le in
200
0).
***
2001
.
Sour
ce: S
icili
ani a
nd H
urst
, 200
3.

www.fraserinstitute.org d Fraser Institute
Chapter 2: Measuring How Long Canadians Wait for Health Care d 27
Tabl
e 2.
2: M
edia
n in
patie
nt w
aitin
g tim
es (d
ays)
of p
atie
nts a
dmitt
ed b
y su
rgic
al p
roce
dure
, 200
0Hi
p re
place
men
tKn
ee re
place
men
tCa
tara
ct
surg
ery
Varic
ose
veins
Hyste
recto
my
Pros
tate
ctom
yCh
ole-
cyste
ctom
yIn
guina
l and
fem
oral
hern
iaCA
BGPT
CA
Austr
alia*
9812
012
094
3824
4846
22
Cana
da **
BC: 1
12
MB:
105
SK: 1
62
BC: 1
36
MB:
105
SK: 2
91
BC: 8
0O
N: 2
3
SK: 1
0
Denm
ark
8790
3669
5746
Finlan
d14
820
218
915
570
3990
7434
20
Norw
ay99
132
28**
*11
037
4763
7425
18
UK (E
nglan
d)21
126
118
217
811
037
9795
191
58
Not
es: C
ABG
= C
oron
ary
arte
ry b
ypas
s sur
gery
. PT
CA =
Per
cuta
neou
s tra
nslu
min
al c
oron
ary
angi
opla
sty.
* Q
ueen
sland
, Sou
th A
ustr
alia
, and
Wes
tern
Aus
tral
ia.
** D
ata
for C
anad
a da
ta fr
om
Briti
sh C
olum
bia
(BC)
, Man
itoba
(MB)
, Ont
ario
(ON
), an
d Sa
skat
chew
an (S
K). T
he so
urce
for w
ait t
imes
in B
ritish
Col
umbi
a ha
s pre
viou
sly b
een
susp
ecte
d of
mar
kedl
y un
ders
tatin
g w
ait t
imes
for
care
(Wal
ker,
with
Wils
on, 2
001)
. **
* 20
01.
Sour
ce: S
icili
ani a
nd H
urst
, 200
3.
Fraser Institute d www.fraserinstitute.org
28 d Reducing Wait Times for Health Care
often patient focused also means avoiding some of the confounding factors associated with list management that were noted earlier. Unfortunately, like all surveys, those produced by the Commonwealth Fund may be subject to response bias and recall error. However, to the extent that such biases are consistent across nations, they may not distort comparisons across countries over time.
The Commonwealth Fund surveys focus on different population groups each year, with some population groups repeated semi-regularly. Over the years, the Commonwealth Fund has surveyed the general population, the non-institutionalized elderly, physicians, sicker adults (or adults with health problems), and hospital executives. In more recent years, the Commonwealth Fund surveys have moved to a yearly rotation between adults, sicker adults, and primary care physicians.
Surveys of the general populationIn 1998, the Commonwealth Fund undertook a survey of adults aged 18 and older in Australia, Canada, New Zealand, the UK, and the US. They found that just 10 percent of Canadians reported waiting more than four months for non-emergency surgery. This compared to 13 percent of respondents in Australia, 21 percent of respondents in New Zealand, 29 percent of respondents in the UK, and just 1 percent of respondents in the US (table 2.3).
In 2001, the Commonwealth Fund returned to surveying all adults in these five nations. This survey included an expanded measurement of wait times for medical treatment. It found that Canadian outcomes were relatively poor with respect to the proportion of respondents reporting rela-tively short wait times. On the other hand, Canadian reports of long wait times were comparable to or better than those of the other Commonwealth countries (table 2.4).
The 2004 Commonwealth Fund survey was once again an all-adult survey, but focused particularly on primary care (Schoen and Osborn, 2004). In this survey, Canada’s performance was relatively poor compared with that reported for other nations. Specifically, Canadians were less likely to report short delays and more likely to report long delays for primary care and emer-gency room care compared to respondents from other nations (table 2.5).
The 2007 Commonwealth Fund survey focused on seven countries, with the Netherlands and Germany added to the list of nations included in

www.fraserinstitute.org d Fraser Institute
Chapter 2: Measuring How Long Canadians Wait for Health Care d 29
Table 2.3: Adult (18+) Reported Wait Times from the 1998 Commonwealth Fund International Health Policy Survey
Australia Canada New Zealand
United Kingdom
United States
Waiting more than four months for non-emergency surgery
13% 10% 21% 29% 1%
Source: Commonwealth Fund (1998).
Table 2.4: Adult (18+) Reported Wait Times from the 2001 Commonwealth Fund International Health Policy Survey
Australia Canada New Zealand
United Kingdom
United States
1998 2001 1998 2001 1998 2001 1998 2001 1998 2001
Percent of patients able to get same day appointment when sick
62% 35% 69% 42% 36%
Waited less than one month for elective or non-emergency surgery
46% 51% 28% 37% 26% 43% 23% 38% 60% 63%
Waited four months or more for elective or non-emergency surgery
17% 23% 12% 27% 22% 26% 33% 38% 1% 5%
Source: Commonwealth Fund (2001).
Table 2.5: Adult (18+) Reported Wait Times from the 2004 Commonwealth Fund International Health Policy Survey
Australia Canada New Zealand
United Kingdom
United States
Waited 2 hours or more in ER before being treated
29% 48% 27% 36% 34%
Access to doctor when sick or need medical attention: same day appointment
54% 27% 60% 41% 33%
Access to doctor when sick or need medical attention: wait of 6 days or more
7% 25% 2% 13% 19%
Source: Schoen and Osborn (2004).

Fraser Institute d www.fraserinstitute.org
30 d Reducing Wait Times for Health Care
earlier survey years (Schoen et al., 2007). The survey identified reported wait times for emergency room care, primary care, and elective surgery. Once again, Canada performed poorly in all measures in comparison to other devel-oped nations (table 2.6). Specifically, Canadians were among the most likely to report relatively long waits for care and the least likely to report relatively short waits for care.
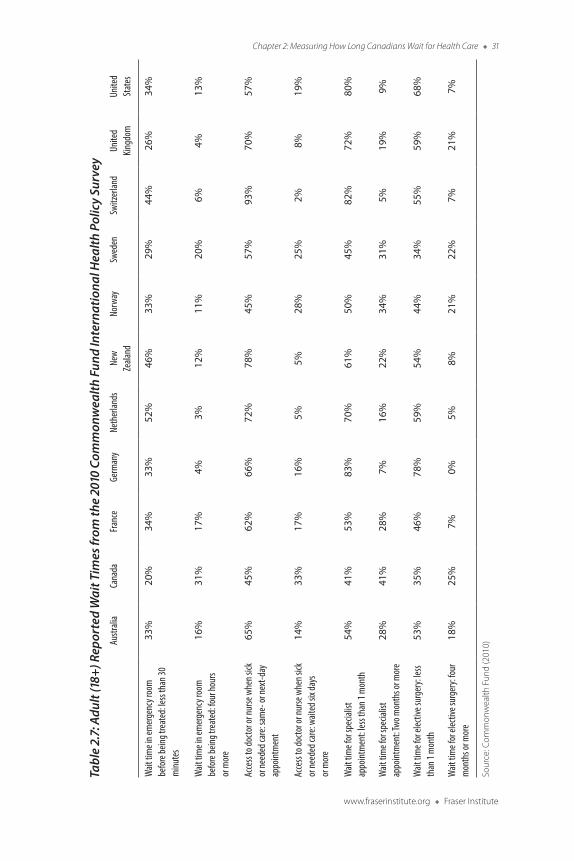
The 2010 Commonwealth Fund survey returned to focus on all-adult experiences. The list of countries from 2007 was revised, both in the inter-vening years and for this survey, to include France, Norway, Sweden, and Switzerland, in addition to the 7 countries included in the 2007 survey.11 This survey provides more complete wait time information for a broad range of health care services than previous surveys. Consistent with the results of earlier surveys, Canada ranked at or near the bottom in every comparison of wait times for health care, in some cases by a sizable margin (table 2.7).
11 Italy was added to the sample in 2009 but dropped in 2010.
Table 2.6: Adult (18+) Reported Wait Times from the 2007 Commonwealth Fund International Health Policy Survey
Australia Canada Germany Nether lands New Zealand
United Kingdom
United States
Waited two or more hours in emergency room before being treated
34% 46% 11% 9% 25% 32% 31%
Access to doctor when sick or need medical attention: same day appointment
42% 22% 55% 49% 53% 41% 30%
Access to doctor when sick or need medical attention: wait of 6 days or more
10% 30% 20% 5% 4% 12% 20%
Waited less than 1 month for elective or nonemergency surgery
55% 32% 72% 47% 55% 40% 62%
Waited more than 6 months for elective or nonemergency surgery
9% 14% 3% 2% 4% 15% 4%
Source: Schoen et al. (2007).
www.fraserinstitute.org d Fraser Institute
Chapter 2: Measuring How Long Canadians Wait for Health Care d 31
Tabl
e 2.
7: A
dult
(18+
) Rep
orte
d W
ait T
imes
from
the
2010
Com
mon
wea
lth F
und
Inte
rnat
iona
l Hea
lth P
olic
y Su
rvey
Austr
alia
Cana
daFra
nce
Germ
any
Neth
erlan
dsNe
w
Zeala
ndNo
rway
Swed
enSw
itzer
land
Unite
d Kin
gdom
Unite
d St
ates
Wait
tim
e in e
mer
genc
y roo
m
befo
re be
ing tr
eate
d: le
ss th
an 30
m
inute
s
33%
20%
34%
33%
52%
46%
33%
29%
44%
26%
34%
Wait
tim
e in e
mer
genc
y roo
m
befo
re be
ing tr
eate
d: fo
ur ho
urs
or m
ore
16%
31%
17%
4%3%
12%
11%
20%
6%4%
13%
Acce
ss to
docto
r or n
urse
whe
n sick
or
need
ed ca
re: s
ame-
or ne
xt-d
ay
appo
intm
ent
65%
45%
62%
66%
72%
78%
45%
57%
93%
70%
57%
Acce
ss to
docto
r or n
urse
whe
n sick
or
need
ed ca
re: w
aited
six d
ays
or m
ore
14%
33%
17%
16%
5%5%
28%
25%
2%8%
19%
Wait
tim
e for
spec
ialist
ap
point
men
t: les
s tha
n 1 m
onth
54%
41%
53%
83%
70%
61%
50%
45%
82%
72%
80%
Wait
tim
e for
spec
ialist
ap
point
men
t: Two
mon
ths o
r mor
e28
%41
%28
%7%
16%
22%
34%
31%
5%19
%9%
Wait
tim
e for
elec
tive s
urge
ry: le
ss th
an 1
mon
th53
%35
%46
%78
%59
%54
%44
%34
%55
%59
%68
%
Wait
tim
e for
elec
tive s
urge
ry: fo
ur
mon
ths o
r mor
e18
%25
%7%
0%5%
8%21
%22
%7%
21%
7%
Sour
ce: C
omm
onw
ealth
Fun
d (2
010)

Fraser Institute d www.fraserinstitute.org
32 d Reducing Wait Times for Health Care
Surveys of sicker adults12In 2002, the Commonwealth Fund focused on adults with health problems in five countries. The criteria for including respondents was that they had be in fair or poor self-reported health, have had a serious illness in the past 2 years, or been hospitalized or had major surgery in the previous 2 years. The reported wait time measures were more qualitative in this survey than in other Commonwealth Fund survey reports, but they still show Canadian wait times comparing poorly to those of other nations (table 2.8). Due to the qualitative nature of the data, this may be either the result of longer wait times, or less tolerance for waiting.
In 2005, the Commonwealth Fund once more surveyed sicker adults and expanded the list of nations to include Germany (Schoen et al., 2005). In this survey, the definition of “sicker adult” included those who met at least one of the following criteria: fair or poor self-reported health; a self-reported serious illness, injury, or disability that required intensive medical care in past two years; or a self-reported major surgery or hospitalization in the previous two years. Once more, wait times in Canada were reported in most cases to be longer than in the other nations surveyed (table 2.9). This is a departure from what hospital executives reported in the 2004 survey (discussed below), and a departure from Canada’s mid-pack performance in earlier surveys.
The 2008 Commonwealth Fund survey (Schoen and Osborn, 2008) also focused on sicker adults. The Netherlands was added to the country list in 2006, while France was added in 2008. Sicker adults in this survey were defined as those with at least one chronic condition including hyper-tension, heart disease, diabetes, arthritis, lung problems, depression, or cancer. Continuing the historical trend, Canada performed relatively poorly. Specifically, Canadians were more likely to report relatively long waits and less likely to report relatively short waits to see medical practitioners in com-parison with their counterparts in other nations (table 2.10).
In 2011, the Commonwealth Fund survey again focused on sicker adults (Schoen and Osborn, 2011). The survey returned to a broader defini-tion of sickness severity that required patients to meet at least one of the fol-lowing criteria: self-reported health being fair or poor; received medical care for serious chronic illness, injury, or disability in the past year; or had surgery
12 Readers should note that the definition of “sicker adults” changed somewhat from survey to survey.

www.fraserinstitute.org d Fraser Institute
Chapter 2: Measuring How Long Canadians Wait for Health Care d 33
Table 2.8: Sicker Adult (18+) Reported Wait-Times Experiences from the 2002 Commonwealth Fund International Health Policy Survey
Australia Canada New Zealand
United Kingdom United States
Waiting time for emergency care a big problem
31% 37% 28% 36% 31%
Waiting time for appointment with regular physician a big problem in past 2 years
17% 24% 5% 21% 14%
Very or somewhat difficult to see a specialist
41% 53% 36% 38% 39%
Long wait to be admitted to the hospital a big problem in past 2 years
19% 32% 24% 21% 13%
Source: Commonwealth Fund (2002).
Table 2.9: Sicker Adult (18+) Reported Wait Times from the 2005 Commonwealth Fund International Health Policy Survey
Australia Canada Germany New Zealand United Kingdom
United States
Access to doctor when sick or need medical attention: same day appointment
49% 23% 56% 58% 45% 30%
Access to doctor when sick or need medical attention: wait of 6 days or more
10% 36% 13% 3% 15% 23%
Waited more than four weeks to see a specialist doctor
46% 57% 22% 40% 60% 23%
Waited less than 1 month for elective or non-emergency surgery
48% 15% 59% 32% 25% 53%
Waited more than 4 months for elective or non-emergency surgery
19% 33% 6% 20% 41% 8%
Source: Schoen et al. (2005).
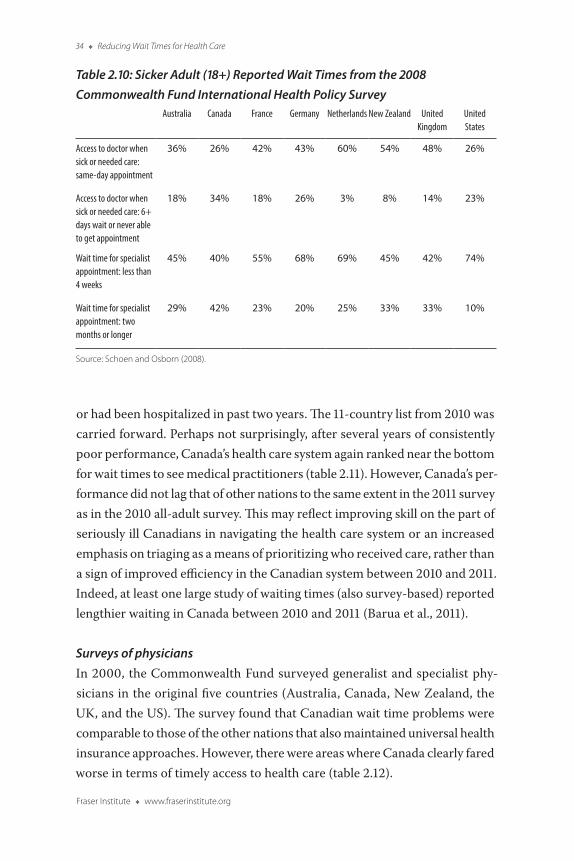
Fraser Institute d www.fraserinstitute.org
34 d Reducing Wait Times for Health Care
or had been hospitalized in past two years. The 11-country list from 2010 was carried forward. Perhaps not surprisingly, after several years of consistently poor performance, Canada’s health care system again ranked near the bottom for wait times to see medical practitioners (table 2.11). However, Canada’s per-formance did not lag that of other nations to the same extent in the 2011 survey as in the 2010 all-adult survey. This may reflect improving skill on the part of seriously ill Canadians in navigating the health care system or an increased emphasis on triaging as a means of prioritizing who received care, rather than a sign of improved efficiency in the Canadian system between 2010 and 2011. Indeed, at least one large study of waiting times (also survey-based) reported lengthier waiting in Canada between 2010 and 2011 (Barua et al., 2011).
Surveys of physiciansIn 2000, the Commonwealth Fund surveyed generalist and specialist phy-sicians in the original five countries (Australia, Canada, New Zealand, the UK, and the US). The survey found that Canadian wait time problems were comparable to those of the other nations that also maintained universal health insurance approaches. However, there were areas where Canada clearly fared worse in terms of timely access to health care (table 2.12).
Table 2.10: Sicker Adult (18+) Reported Wait Times from the 2008 Commonwealth Fund International Health Policy Survey
Australia Canada France Germany Nether lands New Zealand United Kingdom
United States
Access to doctor when sick or needed care: same-day appointment
36% 26% 42% 43% 60% 54% 48% 26%
Access to doctor when sick or needed care: 6+ days wait or never able to get appointment
18% 34% 18% 26% 3% 8% 14% 23%
Wait time for specialist appointment: less than 4 weeks
45% 40% 55% 68% 69% 45% 42% 74%
Wait time for specialist appointment: two months or longer
29% 42% 23% 20% 25% 33% 33% 10%
Source: Schoen and Osborn (2008).

www.fraserinstitute.org d Fraser Institute
Chapter 2: Measuring How Long Canadians Wait for Health Care d 35
Table 2.11: Sicker Adult (18+) Reported Wait Times from the 2011 Commonwealth Fund International Health Policy Survey
Australia Canada France Germany Nether lands
New Zealand
Norway Sweden Switzer land
United Kingdom
United States
Access to doctor or nurse when sick or needed care: same- or next-day appointment
63% 51% 75% 59% 70% 75% 59% 50% 79% 79% 59%
Access to doctor or nurse when sick or needed care: waited six days or more
10% 23% 8% 23% 12% 5% 14% 22% 4% 2% 16%
Waited less than a month to see specialist
59% 52% 67% 79% 81% 68% 47% 63% 92% 80% 88%
Source: Schoen and Osborn (2011).
Table 2.12: Physician-Reported Wait Times and Wait-Times Experiences from the 2000 Commonwealth Fund International Health Policy Survey
Australia Canada New Zealand
United Kingdom
United States
Limitations on or long waits for specialist referrals 56% 66% 81% 84% 29%
Long waiting times for surgical or hospital care 67% 64% 82% 78% 8%
Wait times for treatment: breast biopsy (defined case)
Less than 1 week 49% 14% 24% 12% 50%
1-2 weeks 34% 46% 39% 71% 34%
3-4 weeks 12% 30% 29% 15% 7%
More than 1 month 5% 7% 9% 1% 1%
Wait times for treatment: hip replacement (defined case)
Less than 1 week 3% 1% 2% — 9%
1 week to less than 1 month 2% 3% 1% — 62%
1 to 6 months 24% 32% 5% 6% 20%
more than 6 months 71% 60% 92% 93% 1%
Source: Commonwealth Fund (2000).

Fraser Institute d www.fraserinstitute.org
36 d Reducing Wait Times for Health Care
In 2006, the Commonwealth Fund survey focused on the experiences of primary care physicians (Schoen and Osborn, 2006). The seven-nation list included Germany (added in the 2005 survey) and the Netherlands (added in this survey). Wait times information in the 2006 survey was not reported to the same extent as in other Commonwealth Fund surveys. However, in the one reported qualitative measure of waiting time, Canada ranked second to last and well behind most other nations (table 2.13).
In 2009, the Commonwealth Fund surveyed primary care doctors and expanded the list of nations from 2006 to include Italy, Norway, and Sweden; France had been added in the 2008 survey (Schoen and Osborn, 2009). As in the previous survey of primary care doctors, wait times measures were limited and qualitative. Still, in the one question related directly to wait times, Canada tied for last place with Italy (table 2.14).
Survey of hospital executivesIn 2003, the Commonwealth Fund focused on hospital executives from the largest general or paediatric hospitals in the original five nations (Schoen et al., 2003). In this survey, Canada’s health care system was shown to be a mid-pack performer among nations with universal-access health insur-ance (table 2.15). This said, Canadian executives were not as positive in their qualitative responses and were more likely to report that elective surgery wait times had grown longer in the previous 2 years than were their coun-terparts in other nations (44 percent in Canada versus 27 percent or less in other nations).
Survey of the elderlyIn 1999, the Commonwealth Fund surveyed non-institutionalized adults aged 65 and older in the original five countries. The survey found that the percentage of Canadian elderly who waited five weeks or more for non-emer-gency surgery was higher than in all other nations save the UK. Specifically, 40 percent of Canadian elderly reported such wait times compared to 51 percent of UK elderly and 34 percent or less of elderly in the other nations (table 2.16).

www.fraserinstitute.org d Fraser Institute
Chapter 2: Measuring How Long Canadians Wait for Health Care d 37
Table 2.13: Primary Care Physician-Reported Wait-Times Experiences from the 2006 Commonwealth Fund International Health Policy Survey
Australia Canada Germany Netherlands New Zealand
United Kingdom
United States
Percent reporting patients often experience long waits for diagnostic tests
6% 51% 8% 26% 28% 57% 9%
Source: Schoen and Osborn (2006).
Table 2.14: Primary Care Physician-Reported Wait-Times Experiences from the 2009 Commonwealth Fund International Health Policy Survey
Australia Canada France Germany Italy Nether lands
New Zealand
Norway Sweden United Kingdom
United States
Percent reporting patients experience long waiting times to see a specialist
34% 75% 53% 66% 75% 36% 45% 55% 63% 22% 28%
Source: Schoen and Osborn (2009).
Table 2.15: Hospital Executive-Reported Wait Times from the 2003 Commonwealth Fund International Health Policy Survey
Australia Canada New Zealand
United Kingdom
United States
Patients wait six months or more to be admitted for elective surgery (very often or often)
26% 31% 43% 57% 1%
Average wait of two or more hours in emergency room 23% 46% 17% 58% 39%
Average wait times for treatment: breast biopsy (defined case)
Less than three weeks 74% 70% 48% 73% 93%
Three weeks or more 15% 21% 44% 20% 2%
Average wait times for treatment: hip replacement (defined case)
Less than six months 54% 43% 25% 15% 92%
Six months or more 39% 50% 65% 81% 1%
Source: Schoen et al. (2003).

Fraser Institute d www.fraserinstitute.org
38 d Reducing Wait Times for Health Care
ConclusionThe measurement of the length of time people wait for health care is far more complex than often appreciated, particularly in the international context. Hence, it is unsurprising that relatively few international comparisons of wait times have been undertaken. Notwithstanding that, the available studies that do measure wait times internationally show a relatively consistent pattern for Canada. In the 1990s and early 2000s, wait times for health care in Canada were longer than in some countries, particularly the US, but not as long as in other nations, including the UK. However, over the 2000s, wait times in Canada appear to have increased relative to those in other nations. By the late 2000s and the early part of this decade, international comparisons consis-tently show Canadians enduring longer delays to receive all forms of medical care than their counterparts in other developed nations.
References
Barer, Morris L., and Steven Lewis (2000). Waiting for Health Care in Canada: Problems and Prospects. Atkinson Foundation.
Barua, Bacchus, Mark Rovere, and Brett J. Skinner (2011). Waiting Your Turn: Wait Times for Health Care in Canada. 2011 Report. Fraser Institute.
Carroll, R.J., et al. (1995). International Comparison of Waiting Times for Selected Cardiovascular Procedures. Journal of the American College of Cardiology 25(3): 557-563.
Table 2.16: Adult (65+) Reported Wait Times from the 1999 Commonwealth Fund International Health Policy Survey
Australia Canada New Zealand
United Kingdom
United States
Waited five weeks or more for non-emergency surgery
19% 40% 34% 51% 7%
Source: Commonwealth Fund (1999).

www.fraserinstitute.org d Fraser Institute
Chapter 2: Measuring How Long Canadians Wait for Health Care d 39
Collins-Nakai, Ruth L., Hans A. Huysmans, and Hugh E. Scully (1992). Task Force 5: Access to Cardiovascular Care: An International Comparison. Journal of the American College of Cardiology 19(7): 1477-85.
Commonwealth Fund (1998). The Commonwealth Fund 1998 International Health Policy Survey. Chartpack. Commonwealth Fund. <http://www.
commonwealthfund.org/Surveys/1998/1998-International-Health-Policy-Survey.
aspx>, as of July 23, 2013.
Commonwealth Fund (1999). The Commonwealth Fund 1999 International Health Policy Survey of the Elderly in Five Nations. Chartpack. Commonwealth Fund. <http://www.commonwealthfund.org/Surveys/1999/1999-
-International-Health-Policy-Survey-of-the-Elderly.aspx>, as of July 26, 2013.
Commonwealth Fund (2000). The Commonwealth Fund 2000 International Health Policy Survey of Physicians. Chartpack. Commonwealth Fund. <http://www.commonwealthfund.org/Surveys/2000/2000-
-International-Health-Policy-Survey-of-Physicians.aspx>, as of July 26, 2013.
Commonwealth Fund (2001). The 2001 Commonwealth Fund International Health Policy Survey. Chartpack. Commonwealth Fund. <http://www.
commonwealthfund.org/Surveys/2001/2001-International-Health-Policy-Survey.
aspx>, as of July 26, 2013.
Commonwealth Fund (2002). The 2002 Commonwealth Fund International Health Policy Survey: Adults with Health Problems. Chartpack. Commonwealth Fund. <http://www.commonwealthfund.org/Surveys/2002/2002-
International-Health-Policy-Survey-of-Adults-with-Health-Problems.aspx>, as of July 26, 2013.
Commonwealth Fund (2010). The Commonwealth Fund 2010 International Health Policy Survey in Eleven Countries. Full Chartpack. Commonwealth Fund. <http://www.commonwealthfund.org/Surveys/2010/Nov/2010-International-
Survey.aspx>, as of July 26, 2013.

Fraser Institute d www.fraserinstitute.org
40 d Reducing Wait Times for Health Care
Coyte, Peter C., James G. Wright, Gillian A. Hawker, Claire Bombardier, Robert S. Diggus, John E. Paul, Deborah A. Freund, and Elsa Ho (1994). Waiting Times for Knee Replacement Surgery in the United States and Ontario. New England Journal of Medicine 331: 1068-1071.
De Coster, Carolyn (2002). Measuring and Managing Waiting Times: What’s To Be Done? Healthcare Management Forum 15(2): 6-10.
De Coster, Carolyn, Angelo Luis, and Mark C. Taylor (2007). Do Administrative Databases Accurately Measure Waiting Times for Medical Care? Evidence from General Surgery. Journal of the Canadian Chiropractic Association 50(5): 394-396.
De Coster, Carolyn, Dan Chateau, Matt Dahl, Ruth-Ann Soodeen, and Nancy McKeen (2007). Waiting Times for Surgery, Manitoba 1999/2000 to 2003/04. Manitoba Centre for Health Policy.
De Coster, Carolyn, Leonard MacWilliam, and Randy Walld (2000). Waiting Times for Surgery: 1997/98 and 1998/99 Update. Manitoba Centre for Health Policy and Evaluation.
De Coster, Carolyn, K.C. Carrière, Sandra Peterson, Randy Walld, and Leonard MacWilliam (1998). Surgical Waiting Times in Manitoba. Manitoba Centre for Health Policy and Evaluation.
Dunn, Elaine, Charlyn Black, Jordi Alonso, Jens Christian Norregaard, Gerard F. Anderson (1997). Patients’ Acceptance of Waiting for Cataract Surgery: What Makes a Wait Too Long? Social Science & Medicine 44(11): 1603-1610.
Health Council of Canada (2005). Wait Times and Access—A Background Paper to Accompany Health Care Renewal in Canada: Accelerating Change. Health Council of Canada.
Hurst, Jeremy, and Luigi Siciliani (2003a). Tackling Excessive Waiting Times for Elective Surgery: A Comparison of Policies in Twelve OECD Countries.

www.fraserinstitute.org d Fraser Institute
Chapter 2: Measuring How Long Canadians Wait for Health Care d 41
OECD Health Working Papers, number 6. Organisation for Economic Cooperation and Development.
Hurst, Jeremy, and Luigi Siciliani (2003b). Tackling Excessive Waiting Times for Elective Surgery: A Comparison of Policies in Twelve OECD Countries. Annexes 1, 2, 3. OECD Health Working Papers, number 6. Organisation for Economic Cooperation and Development.
Lewis, Steven, Morris L. Barer, Claudia Sanmartin, Sam Sheps, Samuel E.D. Shortt, and Paul W. McDonald (2000). Ending Waiting-list Mismanagement: Principles and Practice. Canadian Medical Association Journal 162(9): 1297-1300.
Lofgren, Ragnar (2003). Health Care Waiting List Initiatives in Sweden. Public Policy Sources, number 62. Fraser Institute.
Jackson, N.W., M.P. Doogue, and J.M. Elliott (1999). Priority Points and Cardiac Events while Waiting for Coronary Bypass Surgery. Heart 81: 367-373.
Naylor, C.D., K. Sykora, S.B. Jaglal, and S. Jefferson (1995). Waiting for Coronary Artery Bypass Surgery: Population-based Study of 8518 Consecutive Patients in Ontario, Canada. The Steering Committee of the Adult Cardiac Care Network of Ontario. Lancet 346: 1605-1609.
Sanmartin, Claudia, and Steering Committee of the Western Canada Waiting List Project (2003). Toward Standard Definitions for Waiting Times. Healthcare Management Forum (Summer): 49-53.
Sanmartin, Claudia, Samuel E.D. Shortt, Morris L. Barer, Sam Sheps, Steven Lewis, Paul W. McDonald (2000). Waiting for Medical Services in Canada: Lots of Heat, but Little Light. Canadian Medical Association Journal 162(9): 1305-1310.
Schoen, Cathy, Robert J. Blendon, Catherine M. DesRoches, Robin Osborn, Elizabeth Raleigh, Phuong Trang Huynh, Alice Ho, and Kinga Zapert (2003).

Fraser Institute d www.fraserinstitute.org
42 d Reducing Wait Times for Health Care
2003 Commonwealth Fund International Health Policy Survey of Hospital Executives. Summary Chartpack. Commonwealth Fund. <http://www.
commonwealthfund.org/Surveys/2003/2003-International-Health-Policy-Survey-of-
Hospital-Executives.aspx>, as of July 26, 2013.
Schoen, Cathy and Robin Osborn (2004). The Commonwealth Fund 2004 International Health Policy Survey of Primary Care in Five Countries. Chartpack. Commonwealth Fund. <http://www.commonwealthfund.org/
Surveys/2004/2004-Commonwealth-Fund-International-Health-Policy-Survey-of-
Adults-Experiences-with-Primary-Care.aspx>, as of July 26, 2013.
Schoen, Cathy and Robin Osborn (2006). The Commonwealth Fund 2006 International Health Policy Survey of Primary Care Physicians in Seven Countries. Chartpack. Commonwealth Fund. <http://www.
commonwealthfund.org/Surveys/2006/2006-International-Health-Policy-Survey-of-
Primary-Care-Physicians.aspx>, as of July 26, 2013.
Schoen, Cathy and Robin Osborn (2008). The Commonwealth Fund 2008 International Health Policy Survey in Eight Countries. Chartpack. Commonwealth Fund. <http://www.commonwealthfund.org/Surveys/2008/2008-
Commonwealth-Fund-International-Health-Policy-Survey-of-Sicker-Adults.aspx>, as of July 26, 2013.
Schoen, Cathy, and Robin Osborn (2009). The Commonwealth Fund 2009 International Health Policy Survey of Primary Care Physicians in Eleven Countries. Chartpack. Commonwealth Fund. <http://www.
commonwealthfund.org/Surveys/2009/Nov/2009-Commonwealth-Fund-
International-Health-Policy-Survey.aspx>, as of July 26, 2013.
Schoen, Cathy, and Robin Osborn (2011). The Commonwealth Fund 2011 International Health Policy Survey of Sicker Adults in Eleven Countries. Chartpack. Commonwealth Fund. <http://www.commonwealthfund.org/
Surveys/2011/Nov/2011-International-Survey.aspx>, as of July 26, 2013.
Schoen, Cathy, Robin Osborn, Meghan Bishop, and Sabrina How (2007). The Commonwealth Fund 2007 International Health Policy Survey in Seven

www.fraserinstitute.org d Fraser Institute
Chapter 2: Measuring How Long Canadians Wait for Health Care d 43
Countries. Chartpack. Commonwealth Fund. <http://www.commonwealthfund.
org/Surveys/2007/2007-International-Health-Policy-Survey-in-Seven-Countries.aspx>, as of July 26, 2013.
Schoen, Cathy, Robin Osborn, Phuong Trang Huynh, Michelle M. Doty, and Jennifer A. Fenley (2005). The Commonwealth Fund 2005 International Health Policy Survey of Sicker Adults in Six Countries. Chartpack. Commonwealth Fund. <http://www.commonwealthfund.org/
Surveys/2005/2005-Commonwealth-Fund-International-Health-Policy-Survey-of-
Sicker-Adults.aspx>, as of July 26, 2013.
Siciliani, Luigi, and Huw Dixon (2013). Measuring Waiting Times across OECD Countries. In Luigi Siciliani, Michael Borowitz, and Valerie Moran (eds.). Waiting Time Policies in the Health Sector: What Works? (Organisation for Economic Cooperation and Development): 33-47.
Siciliani, Luigi, and Jeremy Hurst (2003). Explaining Waiting Times Variations for Elective Surgery across OECD Countries. OECD Health Working Papers, number 7. Organisation for Economic Cooperation and Development.
Sobolev, Boris, Peter Brown, David Zelt, and Samuel Shortt (2000). Bias Inherent in Retrospective Waiting-times Studies: Experience from a Vascular Surgery Waiting List. Canadian Medical Association Journal 162(13): 1821-1822.
Walker, Michael, with Greg Wilson (2001). Waiting Your Turn: Hospital Waiting Lists in Canada. 11th Edition. Fraser Institute.
Willcox, Sharon, Mary Seddon, Stephen Dunn, Rhiannon Tudor Edwards, Jim Pearse, and Jack V. Tu (2007). Measuring and Reducing Waiting Times: A Cross-National Comparison of Strategies. Health Affairs 26(4): 1078-1087.

44 d Fraser Institute d www.fraserinstitute.org
www.fraserinstitute.org d Fraser Institute d 45
Chapter 3
The Consequences of WaitingDr. Brian Day
Waiting has become a defining feature of Canadian health care. Canadians are expected to queue up patiently until the government-run system is willing or able to take care of them. Forced waiting condemns many Canadians to suffer prolonged pain, disability, and sometimes death.
Delayed diagnosis and treatment can be devastating for individuals, their families, their employers, and those who rely on them. Disease might advance, potentially affecting treatment and outcomes, sometimes to the extent that, in some cases, effective treatment is impossible. That deterioration can also lead to complications, putting patients’ lives and well-being in jeopardy.
Waiting for health care often involves significant personal costs and, even if short, entails some measure of pain and suffering, mental anguish, lost productivity at work and leisure, and strained personal relationships. A similar toll may be placed on family and friends. An individual’s inability to provide for themselves and their dependents may add a significant personal burden.
One of the biggest factors in the rising costs of health care is chronic illness. Delayed care often transforms an acute and potentially reversible illness or injury into a chronic, irreversible condition that involves permanent disability.
Even those who acknowledge the medical consequences of waiting often ignore the associated personal costs.
Medical consequences of waitingThe scientific literature is increasingly reporting harm related to long wait times, including poorer medical outcomes from care and an increased risk of adverse events. While the review of studies below is by no means exhaustive,

Fraser Institute d www.fraserinstitute.org
46 d Reducing Wait Times for Health Care
it reveals that rationing health care by waiting is extremely costly. This is particularly true for those who have no option but to accept a position on a Canadian queue. The evidence summarized below confirms the strange real-ity that Canadians are literally being forced to pay to prevent patients from receiving prompt treatment.
Cardiovascular conditionsThe relationship between wait times and undesirable outcomes in the field of cardiovascular surgery has been studied extensively. Importantly, illnesses of the heart and circulatory system can have sudden severe consequences. Many studies emphasize that long waits for cardiovascular care can be dangerous for patients.
In a study that sought to identify those at risk for negative events while waiting for care, Chester and colleagues (1995) reported serious consequences when coronary angioplasty was delayed. They found that patients who waited for care were at risk of experiencing myocardial infarction, unstable angina, total coronary occlusion, and death. They determined that such events as these are not uncommon in patients waiting for routine percutaneous trans-luminal coronary angioplasty.
Cox and colleagues (1996) examined the impact of waiting lists for coronary artery bypass graft surgery. They found that deaths were rare and could not be attributed to the triage process, but they also found that more than 10 percent of patients had to be reclassified to a higher priority as their symptoms had worsened. Equally importantly, 64 percent of patients expe-rienced at least moderate anxiety while waiting for care.
Beanlands and colleagues (1997) assessed the impact of waiting for cardiac revascularization on mortality, cardiac events (e.g., heart attacks), and heart functioning. They found that patients who were revascularized earlier had significantly lower preoperative mortality than those who were treated later. Those treated earlier also tended to have a lower rate of subsequent cardiac events, and significant improvement in heart function, compared with those whose treatment was delayed.
Plomp and colleagues (1998) examined the risk of death while waiting for cardiac surgery. They calculated that approximately 100 patients per year die in the Netherlands because of waiting for cardiac surgery and that at least half of the deaths occur within the first six weeks of waiting. They concluded that waiting lists engender high risk for patients involved.

www.fraserinstitute.org d Fraser Institute
Chapter 3: The Consequences of Waiting d 47
Morgan, Sykora, and Naylor (1998) examined the effect of waiting on death rates of patients waiting for heart surgery in Ontario, and found those who waited longer had a higher probability of death. This was true both in absolute terms and relative to the maximum wait recommended by Canadian guidelines.
Rosanio and colleagues (1999) examined the relationship between wait times and coronary angiography. They found that those who waited longer were more likely to experience unplanned hospitalization, longer stays, myo-cardial infarction, and cardiac-related death. They also found that long waits may lead to a poorer prognosis.
Koomen and colleagues (2001) examined the consequences of wait-ing for both urgent and routine coronary artery bypass surgery. They found that waiting for care put patients at increased risk of myocardial infarction, unstable angina requiring immediate hospitalization, and death. As these tended to occur early in the waiting process, they recommended that reduc-ing the wait time to no more than 1 to 2 weeks was the only way to markedly reduce the incidence of adverse events. Ray and colleagues (2001) found that death or upgrades to a more urgent queue for patients waiting for bypass surgery and/or valve replacement tended to occur early in the waiting process. They also found that prolonged waiting for treatment was not associated with worse surgical outcomes. Shuhaiber and Reston (2008) pointed out some potential flaws and the effects of confounders (inappropriate or inaccurate interpretation of data) in some of these studies.
Natarajan and colleagues (2002) looked at waits for cardiac catheteriza-tion. They studied 8,000 patients and found only 37 percent of procedures were carried out within the time requested by the physician and, even then, half of the observed adverse events occurred within the waiting time requested by the referring physician. Waiting was associated with potentially preventable myocardial infarction and congestive heart failure. Fifty patients died.
Rexius and colleagues (2004) examined the risk of death while waiting for coronary artery bypass surgery. They found that long waits for surgery caused mortality risks for patients to increase by 11 percent per month after acceptance for treatment.
Talwar and colleagues (2005) studied the consequences of waiting for elective percutaneous coronary intervention (PCI). In their study, patients who waited for long periods were at higher risk for emergency admission with

Fraser Institute d www.fraserinstitute.org
48 d Reducing Wait Times for Health Care
unstable angina, or suffering significant disease progression, sometimes to the point that PCI was no longer feasible.1 While some of these consequences may have occurred regardless of the intended intervention, they neverthe-less concluded that a long waiting time reduced quality of life and potentially reduced the benefit from treatment.
In a study of wait times for valvular aortic stenosis surgery, Munt and colleagues (2006) found that at least 1.7 percent of patients waiting for treatment died while waiting. Further, one in seven patients deteriorated during their wait and used significantly more resources than patients who did not deteriorate.
Sobolev and colleagues (2006a) examined the consequences of waiting for elective coronary bypass surgery. They determined that extended delays carry significant risk of death, even for low-severity patients. This finding was echoed in a separate paper by Sobolev and colleagues (2006c), who found that both non-urgent and semi-urgent patients waiting for coronary artery bypass graft surgery were at risk of death while waiting. In another paper, Sobolev and colleagues (2006b) again found that long wait lists were associated with an increased probability of death before surgery and recommended physicians consider the risk of pre-surgical death when advising patients.
In 2008, Sobolev and colleagues again reported on waiting for coro-nary artery bypass surgery. They found that those who were treated earlier were only two-thirds as likely to experience in-hospital death as those whose treatment was delayed. They identified a 5 percent increase in the odds of in-hospital death for every additional month of delay before surgery.
StrokeFairhead and colleagues (2005) looked at the risk of recurrent stroke from delaying carotid imaging. They found that longer wait times were associated with an increase in the risk of stroke, with half of these strokes being disabling or fatal. They concluded that delays were associated with high risks of other-wise preventable strokes.
1 Interestingly, some of the patients in the study saw their symptoms improve, while there was evidence that the disease had regressed in a small number. This raises interesting questions about who is on the wait list, and what actions patients can take when faced with a degenerative medical condition.
www.fraserinstitute.org d Fraser Institute
Chapter 3: The Consequences of Waiting d 49
Gall bladder diseaseSobolev and colleagues (2003) examined the impact of waiting for cholecys-tectomy (gall bladder surgery) on emergency admissions. They found that the risk of emergency cholecystectomy, a more dangerous procedure with a much higher risk of complications, increased with time. This was particularly true for waits that were 20 weeks or longer.
Cancer treatmentDelayed treatment for cancer increases the risk that it will spread. Kulkarni and colleagues (2009) examined the impact of waiting for radical cystectomy for bladder cancer. They found that longer wait times led to a lower survival rate. They questioned the existing approach to prioritizing high-stage cancers ahead of low-stage cancers since the risk of death with extended wait times increased more for patients with low-stage cancers. They note that patients with less invasive disease may be put at greater relative risk by waiting. This is likely because those with advanced disease may have progressed to the level where treatment, even when done quickly, has a lower likelihood of cure.
Saad and colleagues (2006) reviewed the impact on patients of waiting for prostate cancer treatment. In a review of six Canadian studies, wait times ranged from 42 days (consultation to operation) to 83 days (consultation to hospital admission). This was in contrast to national and international guide-lines, which recommended a maximum wait time of 2 to 4 weeks. Notably, the wait time from family physician referral to consultation was not included in the calculation.
Jewett and colleagues (2006), in a Canadian epidemiological study on urological cancer, found the median wait time was 64 days from referral to surgery. National and international guidelines recommend a maximum wait time of 2 and 4 weeks for all cancer surgeries.
Spine surgeryBraybrooke and colleagues (2007) examined the impact of waiting for spinal surgery on outcomes. They found that longer waits were associated with a lower likelihood of improvement in physical function and pain severity mea-sures. They also reported that patients with shorter wait times experienced a greater improvement from treatment than those with longer wait times, despite starting off at a lower level of health status.

Fraser Institute d www.fraserinstitute.org
50 d Reducing Wait Times for Health Care
Joint replacementGarbuz and colleagues (2006) examined the consequences of waiting for total hip arthroplasty on outcomes from treatment. They found that each addi-tional month waiting for treatment was associated with an 8 percent decrease in the odds of a better-than-expected functional outcome from treatment. Waiting longer than six months, according to their study, was linked to a 50 percent decrease in the odds of a better-than-expected outcome compared with waiting less than six months. They point out that delaying treatment may result in deterioration that may not be recoverable after surgery.
Davis and colleagues (2008) studied the consequences of waiting for revision joint arthroplasty. They found that patients with extended waiting times had increased pain and disability compared to those who endured shorter waits.
Vergara and colleagues (2011) also examined the impact of waiting for total hip arthroplasty. They found that functional capacity gain was poorer for patients who waited longer than six months for surgery. Further, the likelihood of improved functional gain fell as the wait time increased.
Similarly, Desmeules and colleagues (2012) examined the impact of waiting for total knee replacement on pain, function, and quality of life after surgery. They found that longer waits were associated with greater pain in the non-operated knee and reductions in health-related quality of life. Specifically, those in the group with the longest wait time (greater than 9 months) tended to have more pain and functional limitations than those in the groups where the wait was shorter, though the differences were not always statistically significant.
Johansson and colleagues (2010) studied the relationship between pre-operative function and outcome for patients undergoing total hip arthroplasty. They found that patients with poorer preoperative function had worse early postoperative pain and function. Their recommendation was that total hip arthroplasty be done earlier. While their study did not focus on long wait times, studies by Mahon and colleagues (2002) and by Ostendorf and col-leagues (2004) show that patients do deteriorate while waiting for total hip arthroplasty, suggesting that these findings could be extended to the experi-ences of patients who endure long waits for total hip arthroplasty.
In the presence of long waiting times, it can be expected that some patients and some physicians will defer treatment of patients who are good candidates for care, or who do require care but whose condition is not

www.fraserinstitute.org d Fraser Institute
Chapter 3: The Consequences of Waiting d 51
considered acutely serious enough. This prioritization process is one of the methods by which rationing is imposed. Johansson and colleagues (2010) reported that this delay might mean that patients can expect poorer outcomes from care because of a poorer starting point once the decision is made to proceed with treatment (and join the queue).
Cataract surgeryAlthough vision is a key and vital sense, wait times for vision correction in Canada can take a very serious toll on those in need of care.
Hodge and colleagues (2007) reviewed studies on the consequences of waiting for cataract surgery. They determined that patients who endure extended waits experience more vision loss, a reduced quality of life, and are at greater risk of falls.
Conner-Spady and colleagues (2007) reviewed the evidence on the consequences of prolonged waits for cataract surgery. They found that indi-viduals with cataracts are at increased risk of falls, hip fractures, and motor vehicle crashes. They also found that long wait times are associated with a decline in visual acuity in patients, which is important because superior base-line visual acuity (superior visual function) is associated with better outcomes from treatment.
Boisjoly and colleagues (2010) studied cataract surgery outcomes for a group of patients from 1999-2000 and compared them with those for a group of patients from 2006-2007 who experienced shorter delays. They found that those with shorter delays had better vision, less difficulty and fewer symptoms prior to surgery, and lower rates of accidents while waiting for care. Further, the patients from the 2006-2007 group reported greater satisfaction after surgery and achieved significantly better visual function after surgery.
Primary and emergency careAs discussed in chapter 2, Canadians do not just wait for elective surgical care. Wait times in Canada are also remarkably long for primary care, specialist consultations, and emergency care. The consequences of waiting for these health care services are also being increasingly studied and recognized in the medical literature.
Plunkett and colleagues (2011) examined the consequences of wait times for emergency care. They found that longer delays from door to team
Fraser Institute d www.fraserinstitute.org
52 d Reducing Wait Times for Health Care
and from team to ward were associated with increased risk of death within 30 days. This trend was across the entire spectrum of patients, from those most critically ill to those who were felt likely to survive.
Solberg and colleagues (2004) examined the impact of reduced wait-ing times for access to primary care on patients with coronary heart disease, diabetes, and depression. They found that improved access was related to increased continuity of primary care and a reduction in urgent care visits. Further, for patients suffering from coronary heart disease, their study also observed reduced hospital admissions and length of stay.
Excessive waiting in the emergency department is a serious issue for patients with acute medical and surgical issues. Appendicitis can usually be treated very successfully with complete and early recovery through early surgi-cal intervention (appendectomy). However, delayed assessment and treatment is relatively common in Canada. Pittman-Waller and colleagues (2000) studied 5,755 patients and found a median time from onset of symptoms to evaluation of 16.5 hours in patients with non-perforated appendices compared with 39.8 hours in those with perforated appendices. Within the United States, those living in poorer areas had higher perforation rates than those living in richer areas. Comparing American and Canadian data, it appeared that in Canada’s richest areas, the perforation rates were higher than those living in the poorest areas of the United States. This observation points out, at least in this example, that the Canadian system very equitably distributes lower-quality care.
Pizer and Prentice (2011) reviewed studies examining the effect of outpatient wait times on use and outcomes in the US Veterans Affairs health care system. Their review found that a wait time increase of 21 days occurred with a 2 to 4 percent decrease in primary care use. They also found that longer wait times increased the risk of poor health outcomes for veterans aged 70 or older, including mortality, stroke, acute myocardial infarction, and diabetes control. Longer wait times were also associated with an increase in hospital admissions for conditions that would otherwise have been treatable on an out-patient basis.
Waiting times for childrenPerhaps one of the more troubling realities of waiting for health care in Canada is that it is not only adults who are forced to queue for necessary treatment. Children in Canada experience long and unacceptable queues for health care

www.fraserinstitute.org d Fraser Institute
Chapter 3: The Consequences of Waiting d 53
services, with sometimes serious consequences. Delayed treatment of chil-dren often leads to irreversible heath issues and deformities. Children with neurological diseases causing muscle imbalance may develop permanent skeletal malformations as they wait for relatively minor muscle or tendon transfer procedures. Waiting for care can therefore have important lifelong consequences for young Canadians.
A Canadian survey by Miller and colleagues (2004) of parents of children waiting for elective “non-critical surgery” revealed that 50 percent regarded the wait as deleterious to their child’s health and 83 percent regarded a wait of more than 3 months as unacceptable.
Blair (2008) stated that “Children have been implicitly ignored in the recent national 10-year action plan to establish benchmarks for wait times for health care.” He also reported comparing children’s surgery wait times with those suggested by professional organizations and found that only 35 percent of children in British Columbia undergoing elective surgery did so within recommended wait times.
How bad is the waiting problem for children? In a paper that received considerable media attention, Wright and colleagues (2011) examined the wait for children’s surgeries in Canada. They found that more than one-quarter of children wait longer than maximum acceptable waiting periods for treat-ment. The highest percentages of surgeries completed past target were in dentistry, ophthalmology, plastic surgery, cancer surgery, neurosurgery, and cardiac surgery.
The fact that more than 25 percent of child cancer patients in this study were treated beyond the maximum acceptable waiting period is a national dis-grace. Long waits for dental surgery, including severe dental decay and dental pain (leading to life-long dental and jaw problems); ophthalmology, including treatment for strabismus (risking permanent visual impairment); and plastic surgery, including cleft palate (risking life-long speech impediments) are also of great concern. It is alarming that neurosurgery and cardiac surgery (23 percent of child patients) were among the specialties with the worst waits. The serious consequences of delayed treatment for these children are surely clear to all.
Studies have identified worrying negative consequences that can be imposed on children forced to wait for health care. For example, Zamakhshary and colleagues (2008) examined the risks to infants and young children of waiting for surgical hernia repair. They found that longer wait times were

Fraser Institute d www.fraserinstitute.org
54 d Reducing Wait Times for Health Care
associated with increased risk of incarceration, which may lead to bowel obstruction and necrosis (death) of the bowel. Wait times longer than 14 days doubled the risk of incarceration in their study.
Chen and colleagues (2008), in a comparison of children under age 2 with inguinal hernia in Canada and the US, also found that longer wait times were associated with a higher rate of incarceration. They found that infants in the Canadian setting were older at presentation and more likely to present to the emergency department. They reported the incidence of incarceration was highest in Canada, and infants there were also more likely to have episodes of recurrent incarceration. Emergency department usage was also higher in the Canadian setting.
Anh and colleagues (2011) examined the impact on adolescents of waiting for treatment for scoliosis (abnormal curve of the spine). They found that longer waits were associated with additional surgeries, progression of deformity, longer surgeries, and longer hospital stays.
Adolescents with longer waits were at greater risk of adverse events including more than 10 degrees of progression of curvature, less than 50 percent correction of curvature, blood transfusion, prolonged surgery, and perioperative neurologic injury. Patients who waited longer experienced less surgical correction than patients who endured shorter delays. Fayerman (2012) reported a case of permanent paralysis in a British Columbia child who had a severe delay in receiving necessary spinal surgery.
The personal costs of waitingDelayed care imposes medical harm and considerable personal costs.
Even a short wait for care entails some measure of pain and suffer-ing, mental anguish, and lost productivity at work and leisure. In some cases, patient’s lives may be put on hold and activities curtailed. Patients may be struggling with immense pain requiring high doses of painkillers and narcot-ics. This may lead to chronic addiction. There will often be lost productivity and enjoyment of life, and lost time while waiting for a diagnosis or treatment.2
2 Globerman’s chapter in this volume discusses in detail evidence bearing upon the linkages between waiting for care and labour market outcomes. The chapter by Henderson includes some discussion of the personal costs of waiting.

www.fraserinstitute.org d Fraser Institute
Chapter 3: The Consequences of Waiting d 55
Sometimes physicians take a wait-and-see approach to a medical con-dition. Investigations may be deferred for appropriate reasons and immediate medical tests or imaging may not always be the preferred option. Such delays are justifiable when based on medical indications, but not, as is often the case in Canada, when forced on the doctor and patient as a result of inappropriate rationing of access.
The sometimes severe impacts on life that can accompany waiting for medical treatment have been researched in the medical literature. These studies, a few of which I discuss here, generally confirm that waiting for care may have an impact on the individual.
Coronary artery bypassSampalis and colleagues (2001) studied the lives of patients waiting for coro-nary artery bypass grafting. They found that longer waits for surgery were associated with significantly reduced physical functioning, vitality, social functioning, and general health prior to surgery. They also found reduced physical functioning, vitality, mental health, and general health six months after surgery. Patients who waited longer were also more likely to experience postoperative problems, and were less likely to return to work after surgery.
Jonsdottir and Baldursdottir (1998) examined the patient experi-ence while waiting for coronary artery bypass graft surgery. They found that patients waiting for surgery endured reductions in their physical and psycho-logical functioning in addition to the expected pain, while spouses of those waiting also endured emotional hardship.
Hip and knee joint replacementDerrett and colleagues (1999) examined the consequences on quality of life for those waiting for hip or knee joint replacement. While they found no physical deterioration associated with longer wait times, they did find that those wait-ing endured significant hardship. All of those waiting for joint replacement experienced pain related to their untreated condition, and for half of them the pain was so severe that it resulted in substantial or serious limitation of activities. Waiting for hip and knee joint replacement was associated with dif-ficulties walking any great distance, gardening or doing housework, as well as participating in recreational activities such as dancing, running, and climbing. Some patients were suffering so badly that they were housebound. (They also

Fraser Institute d www.fraserinstitute.org
56 d Reducing Wait Times for Health Care
studied those waiting for prostatectomy, where patients waiting suffered from restricted drinking of fluids, struggled with long car drives, had difficulties getting enough sleep at night, and avoided places that might not have toilets.) Results from a standardized health survey found that those waiting for joints had generally poorer physical functioning. They also suffered from bodily pain, and impaired general health perception, vitality, social functioning, and emotional and mental well-being compared to the general population. The latter was also true for those waiting for a prostatectomy. Overall, those wait-ing had a generally poorer health related quality of life.
Similarly, Mahon and colleagues (2002) in an examination of the con-sequences of waiting for total hip arthroplasty found that patients waiting longer than 6 months experienced clinically important reductions in mobility and health related quality of life.
Ostendorf and colleagues (2004) studied the consequences of waiting for total hip arthroplasty. They determined that every month of waiting was associated with an avoidable loss of 3.5 quality-adjusted life years per 100 patients based on curable reductions in health-related quality of life while waiting for care. Further, patients who waited longer experienced a small but significant deterioration in their health status while those with higher preop-erative function had less pain and better function one year after surgery than those with lower preoperative function.
Cataract surgeryFreeman and colleagues (2009) examined the mental health consequences of waiting for cataract surgery. They found that, in spite of the temporary nature of the visual impairment prior to their corrective surgery, those with very poor visual acuity were at higher risk of depression while waiting than those with better visual acuity. They suggest that shortening of wait times may reduce the risk or shorten the duration of depression.
Assessment of personal costsYoung elite athletes may experience a life-changing personal loss as a con-sequence of waiting for care. Examples include individuals who may have received offers of athletic scholarships to prestigious universities. The inability to obtain early treatment that would allow the individual to accept the offer and play on a college team with subsidized tuition will especially affect children

www.fraserinstitute.org d Fraser Institute
Chapter 3: The Consequences of Waiting d 57
from lower socioeconomic backgrounds. Their whole future, and their ability to gain access to an otherwise unaffordable educational experience, will be harmed by the failure of a health system to treat them expeditiously.
Other patients may suffer lesser, but still significant losses, such as the need to cancel or put off vacations. This may be because they feel they can no longer enjoy them or may be taking too great a risk travelling because of the untreated medical condition. It may also be because waiting for health care can sometimes be an uncertain process where surgical slots are sud-denly available earlier, or are suddenly cancelled because of other more urgent patients needing care, or are sometimes booked at very short notice.
Some may experience immense embarrassment as a result of their condition while waiting. Frequent urination and the inability to wait for a bathroom can have a significant impact on life. As noted in the study above, it may mean long drives are abandoned or activities are avoided in cases where bathrooms may be scarce. For some, this could mean losing valuable time with children or grandchildren, spouses, or dear friends. Even worse, a person waiting for repair of an anal sphincter may suffer from fecal incontinence, which may have an even greater impact on quality of life.
Falls, one adverse consequence of waiting for cataract surgery, are not only dangerous to health, but can also be embarrassing to the individual. As a result of long waits for cataract surgery, there are no doubt some Canadians who view stairs with trepidation or are fearful of being in public or at others’ homes. Some may even have limited mobility within their own multi-floor homes or buildings because of their untreated medical condition. There is also an indignity that comes with loss of function or limited function while waiting. It may be that an adult is no longer able to bathe without assistance. The feeling of helplessness and loss of independence from not being able to do housework, garden, or undertake the simple necessities of life surely must also be counted.
Some may be in so much pain, or have such restricted vision, or be otherwise so affected by their untreated medical condition that they can no longer drive a car. Some may be fortunate enough to have family, friends, or spouses upon whom they can rely for transport. Others may have few alterna-tives, and even public transit may prove arduous because of stairs, steps on buses, or limited vision.
As patients waiting for care adapt to their new reality, they may make more measured decisions about valued activities that they are forced to give

Fraser Institute d www.fraserinstitute.org
58 d Reducing Wait Times for Health Care
up. The result is a loss of pleasure and full engagement in life. It may also lead, if they are home bound and living alone, to a terrible loneliness forced upon them by a health care system unwilling or unable to solve their medical problem in a timely fashion. In addition to loneliness are other mental health consequences that may accompany waiting for health care. A patient waiting may have a bad or short temper stemming from possible frustration, helpless-ness, or depression. That will have an impact on personal relationships and the ability to engage with others.
All of this says nothing of the hardships endured by close friends and family of the person waiting for care. Their mental anguish, lost productivity at work and leisure, and reductions in quality of life are often missed in dis-cussions of health care. The burden imposed on them by delayed treatment is often significant and must not be ignored.
There is the question of the impact that delayed treatment has on the elderly or those with terminal illnesses. For them, long waits consume a much greater proportion of their remaining life. To experience pain, indignity, and embarrassment under such circumstances represents cruelty on a scale that is unacceptable for both patients and their loved ones.
The economic costs of waitingThat the medical and personal consequences of waiting for health care can have a significant economic impact should come as no surprise. The economic costs may be explicit in the form of lost wages and income, as well as implicit in the form of pain and suffering. The costs can be borne by the patient, and by other members of society such as family and co-workers.
Economists and labour market experts have primarily studied the explicit costs of waiting for health care. Because Globerman provides a more detailed review in this volume, this chapter includes only a brief overview of several important studies. The main point is that while differ-ences in methodology and data prevent a precise estimate of the monetary costs of waiting for health care, the available evidence points to the costs being substantial.
Because paying for private care is the alternative to waiting for pub-licly-provided care in the UK, Cullis and Jones (1986) infer that the cost of waiting for treatment is, at a maximum, the cost of private care. Taking the
www.fraserinstitute.org d Fraser Institute
Chapter 3: The Consequences of Waiting d 59
actual costs of private care for a variety of important and common treatments, they estimated that the cost of waiting in the UK in 1981 was about $5,600 per patient. Propper (1990) estimated the cost of waiting through an experiment in which subjects were asked to choose between immediate treatment (at a varying range of out-of-pocket costs) and delayed treatment (at varying time intervals) at no out-of-pocket cost. From this, she determined that the cost per patient was approximately $1,100 in the UK in 1987.
Closer to home, Globerman (1991) treated waiting time as a period during which productive activity (either for pay or in the household) is poten-tially precluded, making the cost of waiting the wage or salary foregone. Using the Canadian average wage for those who report “significant difficulties in carrying out their daily activities” (some 41 percent of those waiting), he esti-mated the cost per patient to be about $2,900 in Canada in 1989. Esmail (2012) uses the same methodology as Globerman, but with an 11 percent overall loss of productivity in place of Globerman’s procedure-specific measures, and found that the cost of waiting was approximately $1,144 per patient, if only hours during the normal working week were considered “lost,” and $3,490 per patient if all hours of the week (minus 8 hours per night of sleeping) were considered “lost.”
In an attempt to value more completely the economic cost of waiting lists, the Centre for Spatial Economics (2008) at the request of the Canadian Medical Association analyzed the economic costs of wait times in excess of a “maximum medically reasonable wait time for treatment” (2008: 2). Their focus was limited to four procedures/services under Canada’s governmen-tally-defined priority areas: total joint replacement surgery, cataract surgery, coronary artery bypass graft surgery, and MRI scans. Further, they examined three types of costs: 1) Patient costs, including direct losses from individu-als unable to work while waiting, as well as a reduction in economic activity caused by reduced incomes and lower spending; 2) Caregiver costs including income losses for those who had to give up work in order to care for family members or relatives waiting for health care; and 3) Health care system costs including avoidable costs such as additional appointments, tests, procedures, and medications associated with extended waiting.
It is worth looking a little deeper at these cost estimates to understand the differential impacts of wait times. The study estimates that 32 percent of joint replacement patients, 7 percent of cataract surgery patients, 95 percent

Fraser Institute d www.fraserinstitute.org
60 d Reducing Wait Times for Health Care
of bypass surgery patients, and 22 percent of MRI patients needed to discon-tinue their regular activities. Further, 20 percent of those waiting for joint replacement, 5 percent of those waiting for cataract surgery, and 25 percent of those waiting for bypass surgery were estimated to require a caregiver. Finally, the study estimates the health system costs of additional waiting to be $227 for joint replacement patients, $36 for cataract surgery patients, and $328 for bypass surgery patients.
Among the conditions studied, it would appear that waiting for bypass surgery has the greatest impact on the individual, on caregivers, and on the health care system. However, once all of the calculations were complete, and once the differences in wait times (bypass surgery waits are much shorter than joint replacement waits) and demographics of those waiting and caregivers were included, the highest economic cost per patient was generated in joint replacement surgery at $26,400 per patient. Next were MRI scans at $20,000 per patient,3 and bypass surgery at $19,400 per patient, with cataract surgery yielding the lowest economic costs at $2,900 per patient nationally.
The final estimate of the economic cost of waiting was a substantial $14.8 billion in Canada. This in spite of a very limited focus on “excess” waits for only four areas. This did not include $4.4 billion in foregone govern-ment revenues resulting from reduced economic activity. That number is, of course, clearly an underestimate of the actual economic cost of waiting for health care. It doesn’t include any valuation for lost quality of life outside of economic activity; the value of lost leisure time is not included. It doesn’t include the cost of “presenteeism”—lost productivity at work as people are unable to focus on their job because of an untreated medical condition (their own or that of a family member or close friend). Such presenteeism or limited productivity, or even an increase in sick days as a result of an untreated medical condition, could lead to worry about job loss—or pos-sibly even job loss itself.
The estimate above also doesn’t include time taken off work to wait in doctors’ offices or endure substantial delays in the emergency room. While
3 Recent work in this area suggests that perhaps a significant proportion of MRI scans in Canada are inappropriate or unnecessary. To the extent this lengthens wait times unnecessarily or increases the proportion of people who might benefit from a scan not getting one (discussed below), it compounds the negative consequences of waiting.
www.fraserinstitute.org d Fraser Institute
Chapter 3: The Consequences of Waiting d 61
that may seem trivial, it is nevertheless a reality that a visit to a doctor’s office or emergency room in Canada can come with long wait times. Such delays may unnecessarily take employees away from work for long periods.
Finally, and perhaps most obviously, this estimate covers only a small segment of health care. The vast majority of health care (not to mention any consequences of non-“excess” waiting) falls outside this measurement. Further, even in these areas (total joint replacement surgery, cataract surgery, coronary artery bypass graft surgery, and MRI scans), the wait to see specialists in the first place, or other associated wait times ahead of those being studied, were not counted. While it is not straightforward to extend the $14.8 billion estimate to the remainder of health care, we can surely say with some confidence that the true burden of waiting to the Canadian economy is a large multiple of that number.
Medical errorsIn addition to the medical, personal, and economic consequences of waiting, there is a troubling suggestion that there might also be a quality of care or safety issue associated with waiting. Two recent studies of emergency room care have suggested that longer wait times and the related phenomenon of hospital overcrowding may have safety implications or impose a negative impact on patient care. Guttman and colleagues (2011) examined the conse-quences of waiting in emergency rooms in Ontario between April 2003 and March 2008.4 They found that patients well enough to leave the department who presented during periods of longer wait times5 had a greater risk of death within seven days of their visit (with risk of death increasing with each additional hour of average waiting time) and admission to hospital within seven days. Their results also suggested that the relative increase in risk was greater for less seriously ill or injured patients. They concluded that a one hour reduction in average length of stay in the emergency department could have potentially reduced the number of deaths in higher-risk patients by 558 (6.5%) and in lower-risk patients by 261 (12.7%). The risks associated with busy, overcrowded hospital emergency departments are very real for sicker patients.
4 Their study included 13,934,542 patients who were seen and discharged.5 Patients who left without being seen were not found to be at higher risk of death or hospital admission within a week of their visit in the study.
Fraser Institute d www.fraserinstitute.org
62 d Reducing Wait Times for Health Care
When systems are stressed by constrained resources, or when people are rushed, the rate of error may increase. Further, important processes of care may be impeded during busy times and decision making altered as a result. This may result in caregivers limiting tests, shortening consultations, or shortening observation periods to free space for others.
The important concerns about the impact of wait times and over-crowding on emergency care can probably be extended to all of Canada’s health care system. Physicians in primary care practices are in short supply, and specialist consultations and diagnostic tests often come after long waiting periods. Non-urgent surgeries can have remarkably long waits associated with them. It is entirely possible in this system, where every stage of care is associ-ated with delay, that caregiver decision making may be altered in a manner that puts patients at greater risk of a poor outcome. Can we really be sure that providers, as a result of limited resources and long wait lists, are not pressured into taking risky diagnostic or therapeutic shortcuts in order to treat patients expeditiously? It is likely that the triage of patients into emergent, urgent, and elective groupings is affected by rationed resources.
The policy contextWaiting for health care is not a benign process or inconvenience for those who need treatment. Health conditions are often degenerative, or can have sud-den serious consequences if left untreated. These realities mean that patients are forced to experience deteriorating health as they wait for treatment. The limitations of medicine mean that patients may not receive the benefits of good outcomes because they suffer irreversible deterioration while waiting for consultation or treatment.
This is a reality that was not lost on the Supreme Court of Canada. In the landmark Chaoulli decision on the permissibility of private parallel health insurance in Quebec, after hearing the evidence from all sides, Chief Justice McLachlin and Justices Major and Bastarache stated:
Access to a waiting list is not access to health care. As we noted above, there is unchallenged evidence that in some serious cases, patients die as a result of waiting lists for public health care. Where lack of timely health care can result in death, s. 7 protection of life itself is engaged. The

www.fraserinstitute.org d Fraser Institute
Chapter 3: The Consequences of Waiting d 63
evidence here demonstrates that the prohibition on health insurance results in physical and psychological suffering that meets this threshold requirement of seriousness. (Supreme Court of Canada, 2005: para. 123)
As mentioned earlier, governments are at least paying some small amount of attention to these realities. In 2005, Canada’s provincial and territorial gov-ernments announced a set of “Pan-Canadian Benchmark Wait Times” for care in previously agreed to priority areas. These benchmark wait times, which it was made clear are not standards or lines beyond which the health care system has failed, were evidence-based maximum wait times intended to provide goals for provinces to improve access to care. The benchmark wait times are:
• Curative Radiotherapy: within 4 weeks of being ready to treat• Coronary bypass surgery: within 2 weeks for level 1 (non-emergent),
within 6 weeks for level 2, and within 26 weeks for level 3 patients• Cataract: within 16 weeks for patients who are high risk• Hip fracture: fixation within 48 hours• Hip or Knee Replacement: within 26 weeks.
It is worth noting that many of the studies reviewed earlier in this chapter tell us that some patients can wait for short periods without much greater medical risk, at least for most non-emergent conditions. However, the Pan-Canadian Benchmarks seem to take this concept to a whole new level of delay. According to Canada’s provincial and federal governments, it is acceptable in a health system that claims excellence a feature, for an elderly Canadian to wait in pain, and possibly housebound, for 6 months for joint replacement. This is clearly not an appropriate benchmark. Nor is it appropriate to wait 6 months for necessary cardiac bypass surgery, or four months for sight restor-ing cataract surgery.
Canada’s provincial and federal governments took the recognition of wait time limits one step further in 2006 when they announced (following a federal commitment of $612 million in funding) wait time guarantees for some of these priority areas in each province. Some provinces simply set the prom-ised guaranteed wait time (to be in place by March 31, 2010) equal to the Pan-Canadian Benchmark wait time. Others decided their guaranteed wait time would be substantially longer than the previously-agreed-to evidence-based

Fraser Institute d www.fraserinstitute.org
64 d Reducing Wait Times for Health Care
benchmark. For example, British Columbia, Alberta, New Brunswick, Nova Scotia, and PEI all decided to implement a guaranteed wait time for radiation therapy that was double the “evidence based maximum.”
Of course, announcements are important to governments. Much more important to individuals is the result of government promises, and whether the promises are kept at all. It seems that, in this instance, the guarantees have, in at least some cases, simply not come to fruition, while in others cases, the scope is very limited and the guarantee is concealed from the public’s view (Wait Time Alliance, 2010).
On the subject of weak or empty promises, it is important to recognize the very limited scope of the governmental focus on wait times. The benchmark wait times, along with most provincial wait time initiatives, focus on the wait from seeing a specialist to treatment. Governments do not account for the initial barrier in seeing a family physician. Canadian patients cannot consult a specialist without a referral from a family physician, and 1 in 7 do not have a family doctor because of government policies that cut back medical school intake in the 1990s. These barriers add to the delay and to the substantial wait times that exist to see a specialist after referral, and other delays caused by wait-ing for rationed access to diagnostic testing. Some hospitals now add another delay through a process that occurs after a specialist has made a decision to treat and has booked a procedure. Administrators designate the patient in a category called “triage,” which involves various processes of chart and his-tory review and analysis of priority. Various examinations of wait times have found that these added delays can double or even triple the actual wait time for patients from first presentation (see, for example, Barua and Esmail, 2012 and Munt et al., 2006). The failure to document such delays means that the benchmark times are manipulated to ensure that reported wait times (falsely) fall within the governments’ targeted ranges. As officially reported waits fall and are replaced with hidden or unmeasured waits, governments may satisfy their own political requirements, but patients suffer and remain at risk.
A second important point is that governments have committed to benchmark wait times that are longer than Canada’s physicians consider medically reasonable. The Wait Time Alliance, an alliance of several national physician societies published wait time benchmarks for radiation therapy (10 working days to consultation and treatment within 10 working days of con-sultation) and bypass surgery (within 6 weeks) that are substantially shorter
www.fraserinstitute.org d Fraser Institute
Chapter 3: The Consequences of Waiting d 65
than the governmental targets (Wait Time Alliance, 2005). Further, a national survey of physicians finds that doctors are far less tolerant of long waits than are governments with regards to their definition of clinically reasonable waits (Barua and Esmail, 2012). It seems there is some possibility that the Pan-Canadian Benchmark Wait Times were defined according to a standard that was not entirely focused on the well-being of ill Canadians. Patient input into their perception of appropriate benchmarks should form an essential part of a patient-focused system.
Even these stricter measures of “reasonable” waiting must be viewed with suspicion. It is possible that persistently long wait times for health care in Canada have numbed some caregivers to the impact of the harm that comes with waiting. As a result, they may not be adequately fulfilling their mandated role as patient advocates. There is some evidence this may indeed be taking place. For example, Mackillop and colleagues (1995), in a study of wait times for radiation therapy in Canada and the US, found that Canadian heads of radia-tion oncology were willing to accept a longer delay than Americans in cancer treatment. In addition, the Fraser Institute’s annual waiting list survey shows a troubling increase in the physician-defined reasonable wait time for surgery over the years, increasing by 48 percent from 4.2 weeks in 1997 to 6.2 weeks in 2012 (with a high of 6.7 weeks reached in 2011) (Barua and Esmail, 2012).
It must also be noted that surveys have reported that some patients accept waiting times for certain procedures (see, for example, Hurst and Siciliani, 2003). This raises the possibility that governments may try to con-vince individuals that even longer waits are acceptable. Perhaps this explains the recommendations for inappropriately long Pan-Canadian Benchmark wait times. Some may even question the ethical and human rights issues relat-ing to Canadian governments eliminating patient choice, and forcing their definitions of appropriate wait times on the patients they purport to serve.
Finally, as noted above, the personal and economic costs of waiting are rarely considered by governments in the discussion of how long Canadians can and should wait for treatment. Perhaps the dollar figures are too small to matter in governmental decision making. Or perhaps the small number of people affected is not sufficiently important politically to warrant action. Neither possibility negates the importance of the personal costs of waiting. What might seem trivial to a government bureaucracy can be of immense importance to an individual.

Fraser Institute d www.fraserinstitute.org
66 d Reducing Wait Times for Health Care
Government appointed and regulated Worker’s Compensation Boards are responsible to the employers that fund their activities. They must pay wage loss benefits and fund long-term disability and pensions for those who do not return to work after treatment. It is well established that the likeli-hood of returning to work diminishes with waiting time. They employ private surgeries when it is economically efficient to do so, because their costs would otherwise be increased. Sadly, when government is directly footing the bill (as in the case of non-work-related injuries), it appears to be oblivious to the costs involved in delayed treatment.
Since health care is primarily funded through taxation, wait times have an impact on Canada’s public finances (Esmail, 2008). There are sev-eral reasons for this. Sicker patients (including those who deteriorate while waiting) are more difficult to care for and may require additional surgeries, lengthier surgeries, and greater post-surgical care. Also, patients in the queue often require additional visits with physicians and may require treatments to help maintain function and quality of life while waiting. They may also require repeated additional testing. All of these may not be necessary if timely care were available. Also, in a system with too few resources, emergent and urgent patients often take the surgical place of elective or routine patients, thereby causing changes to surgical schedules and possibly personnel requirements. Beds may be filled with patients waiting for care themselves (in addition to those waiting to move to long-term care), and resources must be com-mitted to manage the queue of patients, leading to greater inefficiency and increased costs (not to mention the added costs imposed on those whose surgeries are cancelled).
ConclusionWait times for medically necessary health care impose real and important costs on waiting patients, as well as their relatives and friends. Wait times impose important medical risks, including deterioration while waiting, adverse events, lifelong impacts on health, and sometimes death. Wait times often lead to important personal costs including reduced quality of life and depression. Finally, wait times for health care have large economic costs, not just for individuals unable to work but also on the economy as a whole.

www.fraserinstitute.org d Fraser Institute
Chapter 3: The Consequences of Waiting d 67
The impact of waiting varies by condition. For conditions including heart disease, diseases of the circulatory system, and cancer, long wait times can often lead to serious sudden adverse events, disability, or death. For ortho-paedic surgeries, long wait times may have a significant impact on quality of life and mental and emotional well-being. For some conditions, long waits may carry less serious risks, although there may still be some harm in terms of personal costs.
In some instances, a period of waiting can take place without a major increase in medical risk. Nevertheless, wait times in Canada, including gov-ernmental standards for waiting, appear to stretch far beyond what might be considered medically safe. Governments also ignore the personal costs that can accompany waiting for medical treatment.
In addition to important medical, personal, and economic conse-quences is the risk that wait times may also affect patient safety and care. By making some services less available or by changing the behaviours of practi-tioners, it is possible for long wait times to result in poorer patient outcomes than would occur in the absence of such long waits. Canada’s caregivers may have become too conditioned to long waits over the years, and may feel help-less and disempowered regarding the significant negative impact of waiting on their patients.
Waiting for health care is not a benign process or mere inconvenience for patients and can be extremely harmful to patients. Rising health costs are a major source of concern for all governments in Canada, and considerable component of those rapidly escalating costs is directly attributable to delayed care and rationing. The paradox that significantly rationing care in order to limit government health spending is actually achieving the reverse, is a reality that governments must address.
References
Anh, Henry, Hans Kreder, Nizar Mahomed, Dorcas Beaton, and James G. Wright (2011). Empirically Derived Maximal Acceptable Wait Time for Surgery to Treat Adolescent Idiopathic Scoliosis.” Canadian Medical Association Journal 183(9): E565-E570.

Fraser Institute d www.fraserinstitute.org
68 d Reducing Wait Times for Health Care
Barua, Bacchus, and Nadeem Esmail (2012). Waiting Your Turn: Wait Times for Health Care in Canada. 2012 Report. Fraser Institute.
Beanlands, Rob S.B., Paul J. Hendry, Roy G. Masters, Robert A. deKemp, Kirsten Woodend, and Terrence D. Ruddy (1998). Delay in Revascularization is Associated with Increased Mortality Rate in Patients with Severe Left Ventricular Dysfunction and Viable Myocardium on Fluorine 18-fluorodeoxyglucose Positron Emission Tomography Imaging. Circulation, 19(Supplement II): 51-56.
Blair, Geoffrey K. (2008). Children are Waiting for Care and Answers. Canadian Medical Association Journal 179(10): 983-984.
Boisjoly, Hélène, Ellen E. Freeman, Fawzia Djafari, Marie-Josée Aubin, Simon Couture, Robin P. Bruen, Robert Gizicki, and Jacques Gresset (2010). Reducing Wait Time for Cataract Surgery: Comparison of Two Historical Cohorts of Patients in Montreal. Canadian Journal of Ophthalmology 45: 135-139.
Braybrooke, Jason, Henry Ahn, Aimee Galant, Michael Ford, Yigel Bronstein, Joel Finkelstein, and Albert Yee (2007). The Impact of Surgical Wait Time on Patient-based Outcomes in Posterior Lumbar Spinal Surgery. European Spine Journal 16: 1832-1839.
Centre for Spatial Economics (2008). The Economic Cost of Wait Times in Canada. Canadian Medical Association.
Chen, Li Ern, Mohammed Zamakhshary, Robert P. Foglia, Douglas E. Coplen, and Jacob C. Langer (2009). Impact of Wait Time on Outcome for Inguinal Hernia Repair in Infants. Pediatric Surgery International 25: 223-227.
Chester, Michael, Lijia Chen, and Juan Carlos Kaski (1995). Identification of Patients at High-Risk for Adverse Coronary Events While Awaiting Routine Coronary Angioplasty. British Heart Journal 73(3): 216-222.
Conner-Spady, Barbara, Claudia Sanmartin, Suren Sanmugasunderam, Carolyn De Coster, Diane Lorenzetti, Lindsay McLaren, John McGurran,

www.fraserinstitute.org d Fraser Institute
Chapter 3: The Consequences of Waiting d 69
and Tom Noseworthy (2007). A Systematic Literature Review of the Evidence on Benchmarks for Cataract Surgery Waiting Time. Canadian Journal of Ophthalmology 42: 543-51.
Cox, Jafna L., Jean F. Petrie, P. Timothy Pollak, and David E. Johnstone (1996). Managed Delay for Coronary Artery Bypass Graft Surgery: The Experience at One Canadian Center. Journal of the American College of Cardiology 27(6): 1365-73.
Cullis, John G., and Philip R. Jones (1986). Rationing by Waiting Lists: An Implication. American Economic Review 76(1): 250-256.
Davis, Aileen M., Zoe Agnidis, Elizabeth Badley, J. Roderick Davey, Amiram Gafni, Jeffrey Gollish, Nizar N. Mahomed, Khaled J. Saleh, Emil H. Schemitsch, John Paul Szalai, Jampes P. Waddell, and Allan E. Gross (2008). Waiting for Hip Revision Surgery: The Impact on Patient Disability. Journal of the Canadian Chiropractic Association 51(2): 92-96.
Derrett, Sarah, Charlotte Paul, and Jenny M. Morris (1999). Waiting for Elective Surgery: Effects on Health-related Quality of Life. International Journal for Quality in Health Care 11(1): 47-57.
Desmeules, François, Clermont E. Dionne, Étienne L. Belzile, Renée Bourbonnais, and Pierre Frémont (2012). The impacts of pre-surgery wait for total knee replacement on pain, function and health-related quality of life six months after surgery. Journal of Evaluation in Clinical Practice 18: 111-120.
Esmail, Nadeem (2012). The Private Cost of Public Queues, 2012 Edition. Fraser Alert. Fraser Institute.
Esmail, Nadeem (2008). Medicare’s Steep Price. Fraser Forum (September): 31-34.
Fairhead, J.F., Z. Mehta, and P.M. Rothwell (2005). Population-based Study of Delays in Carotid Imaging and Surgery and the Risk of Recurrent Stroke. Neurology 65(3): 371-375.

Fraser Institute d www.fraserinstitute.org
70 d Reducing Wait Times for Health Care
Freeman, Ellen. E., Jacques Gresset, Fawzia Djafari, Marie-Josée Aubin, Simon Couture, Robin Bruen, Annie Laporte, and Hélène Boisjoly (1999). Cataract-related Vision Loss and Depression in a Cohort of Patients Awaiting Cataract Surgery. Canadian Journal of Ophthalmology 44: 171-176.
Garbuz, Donald S., Min Xu, Clive P. Duncan, Bassam A. Masri, and Boris Sobolev (2006). Delays Worsen Quality of Life Outcome of Primary Total Hip Arthroplasty. Clinical Orthopaedics and Related Research 447: 79-84.
Globerman, Steven (1991). A Policy Analysis of Hospital Waiting Lists. Journal of Policy Analysis and Management 10: 247-62.
Guttmann, Astrid, Michael J. Schull, Marian J. Vermeulen, and Therese A. Stukel (2011). Association between Waiting Times and Short Term Mortality and Hospital Admission after Departure from Emergency Department: Population Based Cohort Study from Ontario, Canada. British Medical Journal 342: d2983.
Hodge, William, Tanya Horsley, David Albiani, Julia Baryla, Michel Belliveau, Ralf Buhrmann, Michael O’Connor, Jason Blair, and Elizabeth Lowcock (2007). The Consequences of Waiting for Cataract Surgery: A Systematic Review. Canadian Medical Association Journal 176(9): 1285-1290.
Hurst, Jeremy, and Luigi Siciliani (2003). Tackling Excessive Waiting Times for Elective Surgery: A Comparison of Policies in Twelve OECD Countries. Annexes 1, 2, 3. OECD Health Working Papers number 6. Organisation for Economic Cooperation and Development.
Jewett M., R. Rendon, G. Dranitsaris, D. Drachenberg, S. Tanguay, B. Donnelly, N. Fleshner (2006). Canadian Surgical Wait Times (SWAT) Initiative. Canadian Journal of Urology (June) 13(Supplement 3):37-47.
Johansson, Henning R., Philipp Bergschmidt, Ralf Skripitz, Susanne Finze, Rainer Bader, and Wolfram Mittelmeier (2010). Impact of Preoperative Function on Early Postoperative Outcome after Total Hip Arthroplasty. Journal of Orthopaedic Surgery 18(1): 6-10.

www.fraserinstitute.org d Fraser Institute
Chapter 3: The Consequences of Waiting d 71
Jónsdóttir, Helga, and Lovísa Baldursdóttir (1998). The Experience of People Awaiting Coronary Artery Bypass Graft Surgery: The Icelandic Experience. Journal of Advanced Nursing 27: 68-74.
Koomen, Egbert M., Barbara A. Hutten, Johannes C. Kelder, W. Ken Redekop, Jan G. P. Tijssen, and J. Herre Kingma (2001). Morbidity and Mortality in Patients Waiting for Coronary Artery Bypass Surgery. European Journal of Cardio-thoracic Surgery 19: 260-265.
Kulkarni, Girish S., David R. Urbach, Peter C. Austin, Neil E. Fleshner, and Andreas Laupacis (2009). Longer Wait Times Increase Overall Mortality in Patients With Bladder Cancer. The Journal of Urology 182(4): 1318-1324.
Légaré, Jean-Francois, Debbie Li, and Karen J. Buth (2010). How Established Wait Time Benchmarks Significantly Underestimate Total Wait Times for Cardiac Surgery. Canadian Journal of Cardiology 26(1): e17-e21.
Mackillop, William J., Yunzheng Zhou, and Carol F. Quirt (1995). A Comparison of Delays in the Treatment of Cancer with Radiation in Canada and the United States. International Journal of Radiation Oncology Biology Physics, 32(2): 531-539.
Mahon, Jeffrey L., Robert B. Bourne, Cecil H. Rorabeck, David H. Feeny, Larry Stitt, and Susan Webster-Bogaert (2002). Health-related Quality of Life and Mobility of Patients Awaiting Elective Total Hip Arthroplasty: A Prospective Study. Canadian Medical Association Journal 167(10): 1115-1121.
Miller, Grant G. (2004). Waiting for an Operation: Parents’ Perspectives. Canadian Journal of Surgery 47(3): 179-181.
Morgan, C.D., K. Sykora, C.D. Naylor, and the Steering Committee of the Cardiac Care Network of Ontario (1998). Analysis of Deaths while Waiting for Cardiac Surgery among 29,293 Consecutive Patients in Ontario, Canada. Heart 79: 345-349.

Fraser Institute d www.fraserinstitute.org
72 d Reducing Wait Times for Health Care
Munt, Brad I., Karin H. Humphries, Min Gao, Robert R. Moss, and Christopher R. Thompson (2006). True versus Reported Waiting Times for Valvular Aortic Stenosis Surgery. Canadian Journal of Cardiology 22(6): 497-502.
Natarajan, Madhu K., Shamir R. Mehta, Douglas H. Holder, David R. Goodhart, Amiram Gafni, Donald Shilton, Fizwan Afzal, Koon Teo, and Salim Yusuf (2002). The Risks of Waiting for Cardiac Catheterization: A Prospective Study. Canadian Medical Association Journal 167(11): 1233-1240.
Ostendorf, Marieke, Erik Buskens, Henk van Stel, Augustus Schrijvers, Louis Marting, Wouter Dhert, and Abraham Verbout (2004). Waiting for Total Hip Arthroplasty: Avoidable Loss in Quality Time and Preventable Deterioration. The Journal of Arthroplasty 19(3): 302-309.
Pizer, Steven D., and Julia C. Prentice (2011). What Are the Consequences of Waiting for Health Care in the Veteran Population? Journal of General internal Medicine 26(Supplement 2): 676-682.
Plomp, J., W.K. Redekop, F.W. Dekker, T.R. van Geldorp, M.M.P. Haalebos, G. Jambroes, J.H. Kingma, F. Zijlstra, J.G.P. Tijssen (1999). Death on the Waiting List for Cardiac Surgery in the Netherlands in 1994 and 1995. Heart 81: 593-597.
Plunkett, Patrick K., Declan G. Byrne, Tomás Breslin, Kathleen Bennett, and Bernard Silke (2011). Increasing Wait Times Predict Increasing Mortality for Emergency Medical Admissions. European Journal of Emergency Medicine 18: 192-196.
Propper, Carol (1990). Contingent Valuation of Time Spent on NHS Waiting Lists. Economic Journal 100: 193-9.
Ray, A. Andrew, Karen J. Buth, John A. Sullivan, David E. Johnstone, and Gregory M. Hirsch (2001). Waiting for Cardiac Surgery: Results of a Rick-Stratified Queuing Process. Circulation 104: I92-I98.
www.fraserinstitute.org d Fraser Institute
Chapter 3: The Consequences of Waiting d 73
Rexius, Helena, Gunnar Brandrup-Wognsen, Anders Odén, and Anders Jeppsson (2004). Mortality on the Waiting List for Coronary Artery Bypass Grafting: Incidence and Risk Factors. Annals of Thoracic Surgery 77: 769-774.
Rosanio, Salvatore, Monica Tocchi, David Cutler, Barry F. Uretsky, George A. Stouffer, Christopher R. deFilippi, Edward J. MacInerney, Susan R. Runge, Joann Aaron, Javier Otero, Sandeep Garg, and Marschall S. Runge (1999). Queuing for Coronary Angiography During Severe Supply-Demand Mismatch in a US Public Hospital: Analysis of a Waiting List Registry. Journal of the American Medical Association 281(2): 145-152.
Saad F, Finelli A, Dranitsaris G, Goldenberg L, Bagnell S, Gleave M, Fleshner N. (2006). Does Prolonging the Time to Prostate Cancer Surgery Impact Long-term Cancer Control? A Systematic Review of the Literature. Canadian Journal of Urology (June) 13(Supplement 3):16-24.
Sampalis, John, Stella Boukas, Moishe Liberman, Tracey Reid, and Gilles Dupuis (2001). Impact of Waiting Time on the Quality of Life of Patients Awaiting Coronary Artery Bypass Grafting. Canadian Medical Association Journal 165(4): 429-433.
Shuhaiber, Jeffrey, Reston James (2008). Time to Intervention During Cardiac Interventions. Are We Forgetting a Confounder? Asian Cardiovascular Thoracic Annals (January) 16(1):1-3.
Sobolev, Boris G., Guy Fradet, Robert Hayden, Lisa Kuramoto, Adrian R. Levy, and Mark J. FitzGerald (2008). Delay in Admission for Elective Coronary-artery Bypass Grafting is Associated with Increased In-hospital Mortality. BMC Health Services Research 8: 185.
Sobolev, Boris G., Lisa Kuramoto, Adrian R. Levy, and Robert Hayden (2006a). Methods for Studying Adverse Events on Surgical Wait Lists. Health Services and Outcomes Research Methodology 6: 139-151.

Fraser Institute d www.fraserinstitute.org
74 d Reducing Wait Times for Health Care
Sobolev, Boris G., Lisa Kuramoto, Adrian R. Levy, and Robert Hayden (2006b). Cumulative Incidence for Wait-list Death in Relation to Length of Queue for Coronary-artery Bypass Grafting: A Cohort Study. Journal of Cardiothoracic Surgery 24(1): 21.
Sobolev, Boris G., Adrian R. Levy, Lisa Kuramoto, Robert Hayden, and J. Mark FitzGerald (2006c). Do Longer Delays for Coronary Artery Bypass Surgery Contribute to Preoperative Mortality in Less Urgent Patients? Medical Care 44: 680-686.
Solbert, Leif I., Michael V. Maciosek, JoAnn M. Sperl-Hillen, A. Lauren Crain, Karen I. Engebretson, Brent R. Asplin, and Patrick J. O’Connor (2004). Does Improved Access to Care Affect Utilization and Costs for Patients With Chronic Conditions? The American Journal of Managed Care 10(10): 717-722.
Supreme Court of Canada (2005). Chaoulli v. Quebec (Attorney General). SCC 35.
Talwar, S., M. Karpha, R. Thomas, C. Vurwerk, I.C. Cox, C.J. Burrell, J.G. Motwani, T.J. Gilbert, G.A. Haywood (2005). Disease Progression and Adverse Events in Patients Listed for Elective Percutaneous Coronary Intervention. Postgraduate Medical Journal 81: 459-462.
Vergara, Itziar, Amaia Bilbao, Nerea Gonzalez, Antonio Escobar, and José M. Quintana (2011). Factors and Consequences of Waiting Times for Total Hip Arthroplasty. Clinical Orthopaedics and Related Research 469: 1413-1420.
Wait Time Alliance (2010). Promises, Promises: Canadians Still Waiting for Wait Time Guarantees. Media release. Canadian Medical Association. <http://
www.waittimealliance.ca/media/Promises-Mar2010_e.pdf>, as of May 28, 2013.
Wait Time Alliance (2005). It’s About Time! Achieving Benchmarks and Best Practices in Wait Time Management. Final Report. Canadian Medical Association. <http://www.waittimealliance.ca/images/wta_final_Aug05.pdf>, as of May 28, 2013.

www.fraserinstitute.org d Fraser Institute
Chapter 3: The Consequences of Waiting d 75
Wright, James G., Rena J. Menaker, and the Canadian Paediatric Surgical Wait Times Study Group (2011). Waiting for Children’s Surgery in Canada: The Canadian Paediatric Surgical Wait Times Project. Canadian Medical Association Journal 183(9): E559-E564.
Zamakhshary, Mohammed, Teresa To, Jun Guan, and Jacob C. Langer (2008). Risk of Incarceration of Inguinal Hernia Among Infants and Young Children Awaiting Elective Surgery. Canadian Medical Association Journal 179(10): 1001-1005.

Fraser Institute d www.fraserinstitute.org
www.fraserinstitute.org d Fraser Institute d 77
Chapter 4
The Inefficiency of Health Care Rationing—and a SolutionDavid R. Henderson
The problem of rationingOne of the main problems with a single-payer health care system, such as Canada’s Medicare, is that it causes health care to be rationed. Under Medicare, the provincial governments negotiate physician compensation with provincial medical associations. The provincial governments typically fund hospitals by setting global budgets for government-run regional health authorities. For any medical care from doctors or hospitals that is covered by Medicare, the government-set price to beneficiaries is zero. The result is a shortage: at any given time, some patients want more medical care than is available. Therefore, medical care is rationed; people wait for medical services. Government funded systems typically use what doctors call triage to ration access to services: the more serious the illness, all else equal, the shorter the wait. Nevertheless, there is a wait, and it is often substantial. There is often a wait even for an appointment with a general practitioner. The wait between an appointment with a general practitioner and a referred appointment with a specialist is often weeks or months. The wait between an appointment with a specialist and recommended treatment, which is often a more serious wait, is also often weeks or months.1
1 See Barua and Esmail, 2012, for the latest data. Of course, all three waits (and the wait for emergency room care) can be serious depending on the condition for which care is being sought. A delay for a general practitioner appointment for someone with cancer, for example, can be serious because the patient might not learn in time that he or she has cancer.

Fraser Institute d www.fraserinstitute.org
78 d Reducing Wait Times for Health Care
To see the shortage of medical services graphically, consider figure 4.1. The line DD is the demand for health care by Canadian residents who are covered by Medicare and the line SS is the supply of services provided by the health care sector, primarily by physicians. The equilibrium price in an unsubsidized competitive market where users paid the market price for ser-vices would be Pc. Now introduce a single-payer system under which the gov-ernment pays doctors PP, which is lower than Pc. Because it is a single-payer system under which the government is the payer, the consumer (patient) pays P0, a price of zero. The result is that the amount supplied is QP and the amount demanded is Q0. The single-payer system thus causes a shortage equal to Q0 – QP. Because the price is kept artificially low—at zero—to obtain medi-cal care, many patients must wait, often for weeks or months, particularly for non-emergent problems. In effect, waiting lists are the instrument that rations access to medical services.
Just as rationing by waiting is inefficient when the good being sold is gasoline, so also is rationing by waiting inefficient when the service being provided is medical care. The inefficiency takes several forms. First, some people will use the health care system simply because there is no use-related fee, and the value of their time is low. For example, someone who wakes up with a headache that could be treated through self-medication—aspirin, say, or Advil—might visit a doctor, and thereby displace someone else with a more serious condition but with a relatively tight time schedule. This is, or could be, a relatively innocuous example. A more serious one would be that of a patient who badly needs an MRI but who, because of the queue, does not get one in time and, as a result, dies.
The second form of inefficiency is the loss of productive time. Those who wait for medical care that could have alleviated their health problem(s) will, in many cases, lose valuable time that could have been used productively. For example, someone who needs to wait for cardiovascular surgery is less likely to be able to perform on the job than healthier counterparts, or, if able, is less likely to be able to work normal hours. Even if the only harm suffered is pain and worry, there is a reduction in the individual’s quality of life, if not a loss of productive time in the workplace.
Because age is often a criterion for rationing access to medical care, the loss of productive time can accumulate over years for some older patients. Consider the case of Bill Murray, a 57-year-old Alberta resident with an

www.fraserinstitute.org d Fraser Institute
Chapter 4: The Inefficiency of Health Care Rationing—and a Solution d 79
arthritic hip. His specialist recommended a “Birmingham” hip resurfacing surgery. But the government medical care bureaucracy vetoed the procedure on the grounds that Mr. Murray was “too old” to benefit from the procedure,2 a finding that presumably came as a surprise to Mr. Murray (Esmail, 2009). Unless the bureaucracy reverses itself in such situations, no amount of waiting will result in actually getting health care.
The cost of waiting: An estimateTwo major costs of rationing are the loss of productivity and the pain and discomfort that people bear while waiting for medical care. These costs will vary widely depending mainly on two factors: 1) the extent to which waiting for care reduces one’s productivity and 2) the per-hour value of the foregone productivity.
2 Mr. Murray was offered a lower quality (and apparently less expensive) alternative. Ultimately, he could have received care, just not the care he wanted for his active lifestyle.
SD
D
S
Qc QoQp
Pp
Pc
Po
Shortage
Figure 4.1: The shortage as a result of single-payer medical care

Fraser Institute d www.fraserinstitute.org
80 d Reducing Wait Times for Health Care
In a study done for the Fraser Institute, health economist Nadeem Esmail estimates this element of the cost of waiting for care after seeing a specialist (Esmail, 2013). He notes that in 2012, the median wait for treat-ment for the 870,000 Canadian residents who saw a specialist was 9.3 weeks. Esmail then does an adjustment according to medical specialty and province, and finds that Canadians waited a total of 10.6 million weeks for treatment in 2012. He cites an estimate by Statistics Canada that 11.0 percent of people who waited for non-emergency surgery in 2005 reported that the wait “affected their life” (Statistics Canada, 2006: 10). Assuming that same percentage was accurate for 2012, he concludes that the lost time to Canadians from waiting for health care was 1.2 million weeks.
Esmail then applies the average weekly wage, by province, to this estimate of lost time to estimate the monetary value of lost productivity in the workplace. The average weekly wage in 2012 varied from a low of $733 in Prince Edward Island to a high of $1,022 in Alberta, and the average for Canada was $867. Using these data, Esmail concludes that the total value of lost productivity was $982 million.
At first blush, one might be tempted to argue that this is an overesti-mate. There are two reasons. First, it is possible that the 11 percent of people whose waits “affected their life” were still able to be somewhat productive, and so did not lose all their productivity as Esmail’s estimate implicitly assumes. Second, because not all medical care is totally effective at eliminating dif-ficulties caused by various illnesses, some of the 11 percent would have had difficulties anyway. Hence, at least part of the lost productivity, though real, should not properly be attributed to waiting for medical care.
However, three factors working in the opposite direction might cause Esmail’s estimate to understate the loss of productive time due to waiting. The most important factor is that pain or disability that hampers productivity will also likely hinder the enjoyment of leisure, and leisure is valuable. Indeed, a reasonable minimum estimate of the value of an hour of leisure to someone is that person’s after-tax hourly wage. This is because people show by their behaviour that they are choosing an extra hour of leisure over an extra hour of work, and so they must value that hour of leisure at more than their after-tax wage rate. Of course, this assertion assumes that people are free to choose the number of hours they work, something that is not literally true in many cases. However, the standard 40-hour week came about for most workers before it

www.fraserinstitute.org d Fraser Institute
Chapter 4: The Inefficiency of Health Care Rationing—and a Solution d 81
was legislated, and so it likely reflects the wishes of the majority of workers. In an aggregate sense, therefore, although not for each individual, the length of the work week does reflect free choice. There are approximately 128 hours of potential leisure in a week, if leisure is defined as not working, and assuming a 40 hour work week. The result: much of the value of lost time due to waiting for medical care is due to the lost value of leisure, and the magnitude of this lost value could plausibly be of the same order of magnitude as Esmail’s $982 million estimate of lost workplace income.
The second reason Esmail’s $982 million estimate could understate the value of lost time is that some of the 89 percent of the people surveyed whose wait did not “affect their life” may well still have had some difficulties. Even if only one quarter of the 89 percent had difficulty that was only one quarter of the difficulty of the self-assessed people with significant difficulties, it would amount to an added difficulty of one sixteenth of 89 percent, or 5.5 percent. This would add another 50 percent (5.5 percent is half of 11.0 percent) to the 11.0 percent figure underlying Esmail’s estimate.3
Third and finally, it is not the case that the only loss from waiting for health care is lost workplace productivity or lost value of leisure. Pain is a loss all its own. One can certainly imagine someone being willing to pay not just his weekly wage and his lost value of leisure, but also something more, to avoid pain.
Another shortage-induced loss: Misallocation of scarce medical resourcesUnder a single-payer system, as noted, there is a shortage of medical care. Medical care, therefore, tends to be provided to those who are willing to wait, assuming that they are not excluded because the government judges them to be too old. This means that medical care is misallocated among patients. As noted earlier, the system uses triage. But triage has its own misalloca-tions, the main one being that the patient himself or herself gets no direct say in the setting of priorities. Consider the person—call him Mr. X—who badly wants medical care so that he can heal and travel. Assume that he is willing to pay $2,000 for it. Of course, under a single-payer system, he is not
3 I believe that Esmail (2013) makes this same point in a different way in his footnote 3.

Fraser Institute d www.fraserinstitute.org
82 d Reducing Wait Times for Health Care
allowed to pay. Now consider Mr. Y who has the same condition but who values medical care at $200. Under the rationing system, there is no assur-ance that medical care will go to Mr. X rather than Mr. Y. Medical care is not allocated efficiently, since the allocation does not reflect the value of the care to individual patients.
But couldn’t medical care be allocated first to those who need it most? The problem is in defining “need.” The person who has a cold and who could self-medicate with over-the-counter drugs might see himself as “needing” a doctor’s appointment. Because this person pays a zero price, he may well go to see a doctor and cost the medical system say, $50, even if he values the doctor’s services at only $10. But in doing so, he might displace another potential patient who has a more serious ailment that cannot be cured with over-the-counter drugs. Both will compete for the doctor’s time, and, in many cases, therefore, a “needs-based” system of rationing would face a difficult task in determining, in many instances, who “deserves” priority in receiv-ing medical care.4 In short, the problem of misallocating medical resources cannot be solved through the use of a triage system within the context of a single-payer system.
A true single-payer storyAn actual example from a single-payer system will illustrate the point. The sys-tem I have in mind is not Canada’s but that of the US Navy. I teach economics to officers in the US Navy and for one of my students, a doctor at a US Navy base in Norfolk, the economics light bulb went on when she connected what I was teaching with the following incident.
A 9-year old child of a US Navy sailor had broken her leg and my student put the leg in a cast. She told the parents and child that they should make sure they didn’t get the cast wet because then it would be destroyed. A week later, the parents brought the child in, asking for another cast. What had
4 Often, individual physicians substitute their own determinations of the value of medical care to individual patients. At least one study (from the United Kingdom) suggests that physicians use a foregone present value of earnings criterion to guide their allocation of resources. Some Canadian evidence supports this finding, revealing that older patients wait longer for some services, even though they value their own lives highly.

www.fraserinstitute.org d Fraser Institute
Chapter 4: The Inefficiency of Health Care Rationing—and a Solution d 83
happened? The child had gone to a birthday party where the other children had been swimming in a pool. She hadn’t wanted to miss out on swimming and so she swam also. Again, the doctor put on a cast.
That was not the end. Her parents brought her in a few weeks later for another cast because, again, the child had gotten the cast wet. Nor was that the end. This happened a number of times so that, all told, the US Navy’s medical system used six casts for one break.
Why? The reason is straightforward. The US Navy has a single-payer system in which it, the Navy, is the payer. The out-of-pocket cost to the par-ents of what pretty much everyone would regard as irresponsible behavior was zero. The Navy’s medical system bore all the costs. So the parents’ and child’s only cost was their time and inconvenience. Presumably, some of the times that the child was getting a cast were times when other patients were kept waiting. Had the parents been required to pay even, say, $100 for the next cast, the odds are that they and their child would have been more care-ful, and the doctors’ time would have been freed up so that they could deal with other patients. Thus, this true story is an example of a misallocation of medical care.
Admittedly, my example is an extreme one. The typical case is likely less extreme than this Norfolk story. But extreme examples often illustrate and drive home important points. And the point here is that there is no assurance that under a single-payer system, medical care will go to those who value it most. A more mundane example is of the patient who could take Excedrin for a headache but, instead, goes to the doctor and gets a diagnosis—and Excedrin. The result will be misallocation of medical care and, therefore, inef-ficiency. Some people who value medical care a little will get it and some people who value medical care highly will not.
A longer term effect of being able to get medical care at a zero price is that people will take less care of themselves, indulge in bad habits such as over-eating, over-drinking, and smoking, and get too little exercise. This is such a concern that economists and actuaries have a term for it: moral hazard. The term is somewhat misleading: one not need be immoral to engage in moral hazard. But the term is a useful one, because it reminds us that incentives matter, that if one is insured against a bad outcome, one will take less care to avoid the bad outcome.

Fraser Institute d www.fraserinstitute.org
84 d Reducing Wait Times for Health Care
An antidote to rationing and inefficiency: Allow private paymentCanada has one of the most extreme health care systems in the world. Health economist John C. Goodman claims that Canada joins Cuba and North Korea as the only three countries in the world in which people are not legally allowed to pay for health care (Goodman, 2012: 48). Although Canada is extreme in making the acquisition of health care outside the government system difficult, Goodman’s characterization is itself too extreme. Because Medicare is largely a provincial program, the regulations vary by province, and generalizations are difficult. In only four of the ten provinces (Saskatchewan, New Brunswick, Nova Scotia, and Newfoundland) are people allowed to buy private insurance for the kinds of health care provided by the government system.5 These four provinces, moreover, contain less than 10 percent of the Canadian population. Also, although doctors in nine of the 10 provinces are free to opt out of the government system, since 2004, the largest province, Ontario, has prohibited doctors from opting out at all if they are providing “medically necessary” care (Flood and Haugan, 2008). The 2004 Ontario law grandfathered doctors who had already opted out but, by 2008, the number of opt-outs in Ontario, a province with over 25,000 doctors, was only 45 (Montreal Gazette, February 14, 2008). In three provinces—Ontario, Manitoba, and Nova Scotia—doc-tors who opt out must charge fees that are no greater than the allowable fees charged by doctors who do not opt out. In five of the seven provinces in which doctors are allowed to set their own fees—British Columbia, Alberta, Saskatchewan, Ontario, and Quebec—provinces that account for over 80 per-cent of Canada’s population, government coverage is denied for patients who receive services from opted-out doctors.
Flood and Archibald, in summarizing this complexity circa 2001, write that Canada’s health care regulations “seem to have as their primary objective preventing the public sector from subsidizing the private sector.” Although that is a fairly accurate summary, there are two exceptions, both noted above. One is the ban on opt-outs in Ontario since 2004. The other exception is the price controls on opt-out doctors in Manitoba and Nova Scotia. These restrictions on privately-paid-for health care discourage doctors and hospitals from offering health care services to patients outside the Medicare system and discourage potential patients from seeking such health care.
5 This information is taken largely from Flood and Archibald, 2001.

www.fraserinstitute.org d Fraser Institute
Chapter 4: The Inefficiency of Health Care Rationing—and a Solution d 85
I propose, therefore, a number of changes to allow more privately-paid-for health care. The main changes are:
1 allowing doctors and hospitals that provide health care to price without government price controls;
2 allowing people to buy private insurance that offers coverage for “medically necessary” health care; and
3 allowing doctors and hospitals that are paid by government also to provide medical care to paying customers.
People should be allowed to use their own money to buy medical care directly, and they should be allowed to use their own money to buy privately-provided health insurance that then pays for medical care, whether that medical care is sold by providers completely outside Medicare or by providers who also practice within Medicare.
I propose this solution because I believe that people should not be prevented from spending their own money on health care. Just as our bod-ies are our own, so our other resources are our own, and we should be able to spend these other resources on our bodies or, for that matter, on helping obtain medical care for other people whom we care about.
Of course, care should be taken to ensure that doctors and hospitals who engage in “dual practice” are charging paying patients the full cost of the health care that they provide to those patients. That way, the government would not be subsidizing paying patients.
Notice what these policy changes would mean for patients to whom the current system rations health care. People who do not want to wait for medical care would be able to use their own money or their own health insurance to buy care from willing health care providers. Those who would choose to buy such care would probably not be drawn randomly from the total population. Instead, they would be people who value their time relatively highly, have the least tolerance for pain, or face the longest waits, or some combination of all three. Notice that all three factors—time value, intolerance for pain, and long waits—are the largest contributors to the loss from rationing by waiting. Thus, these proposed changes would solve a large part of the problem.
Fraser Institute d www.fraserinstitute.org
86 d Reducing Wait Times for Health Care
Moreover, allowing people to spend their own money on medical care would permit people like the aforementioned Bill Murray, whom the system turned down on grounds of age for the treatment he desired, to have another alternative: they could buy health care on their own.
A two-tier system? But wouldn’t my proposed solution lead to a “two-tier” medical system?6 First, that train has already left the station. Canada already has a two-tier system. On the top tier are military personnel, the RCMP, prisoners, and Workers’ Compensation claimants (Jacobs, 2005). All are exempt from the Canada Health Act. More important, the changes I propose would create a thousand-tier medical system, just as we have a thousand-tier auto system, food system, housing system, and almost every other kind of system. Even people with the same income and wealth often spend very different amounts on cars and food. The same would be true of health care. Different people, even with similar wealth and income, put different values on health care. Allowing them to spend their own money would allow them to express their desires for health care in a tangible way, just as they now express their desires for food, clothing, cars, and housing in tangible and different ways.
Would the poor and less-wealthy people benefit? It seems clear that wealthier people would benefit from their ability to buy medical care. But what about poor and less-wealthy people? Would they ben-efit? The answer is probably yes, for two reasons.
First, the stereotype that non-wealthy people are unwilling or unable to pay for health care is false. Just as some non-wealthy people are sometimes will-ing to pay for a nice car or for expensive meals, so also they would sometimes be willing to pay for health care. The ability to buy medical care directly or to buy medical insurance gives them a new option that they did not have before. When you give people new choices in addition to the old ones, you don’t make them worse off; you make them better off, or at least as well off as before. To the
6 See Lewis, Donaldson, Mitton, and Currie, 2001: 927 for the claim that allowing doctors to serve private patients while not opting out of the government system could lead to “two tier service”.

www.fraserinstitute.org d Fraser Institute
Chapter 4: The Inefficiency of Health Care Rationing—and a Solution d 87
extent that they exercise their option to buy medical care or health insurance, they show by that choice that they are better off. Economists’ fancy name for this point is “revealed preference.” Simply by the act of buying medical care or medical insurance, they reveal their preference for this new option.
Imagine, for example, that a non-wealthy person who is considered old could get a knee replacement for $5,000 and currently, under the single-payer plan, is unable to get it at all. He might value the added mobility very highly. Indeed, he might even be able to make up the $5,000 by working longer hours at a job that pays $18 an hour or $15 an hour after-tax. With 333 hours of extra work, which is an extra 6 hours a week for 55 weeks, he could cover the financial cost of the knee replacement. And it is precisely the knee replacement that makes those extra hours easier to work.
The second reason that poor and non-wealthy people would likely be better off if people were allowed to pay for private health insurance and medical care is that some of the wealthier people would surely take advantage of this opportunity. In doing so, they would relieve some of the stress on the single-payer system. With a given supply in the single-payer system and a reduction in demand, queues would shorten. So even non-wealthy people who did not avail themselves of the opportunity to buy private insurance or medical care would benefit because of other people who do.
Would inequality of health care increase?One worry that some people might have (and this relates to the “thousand-tier” issue noted above) is that there would be increased inequality in health care use. The idea is that if people could purchase private health care, less-wealthy people would not buy much more care but wealthier people would.
This certainly could happen and, in fact, is likely to happen. But it’s not clear why this is a problem. We must separate the issue of well-being from the issue of inequality. As noted above, if wealthier people buy more health care, the queue for single-payer health care will fall. That increases availability of care under the public system for people who don’t buy private health care and rely totally on the single-payer system. If our concern is access to health care for the poor and less-wealthy, we can relax because they will get better access.
In judging my proposed solution, therefore, the issue of inequality in health care is a problem only if inequality matters per se. But life is not a race

Fraser Institute d www.fraserinstitute.org
88 d Reducing Wait Times for Health Care
unless you choose to make it so. What’s important is that people get good health care, and if getting good health care means that some get excellent health care versus all getting so-so health care, it’s worth it. Everyone is bet-ter off. Notice that even the strongly egalitarian US president, Barack Obama, always pitched his health care reform on the basis of its providing more care to lower-income people, not on the basis that it would provide equal care.
What about competition for scarce medical resources?There is one reason that people might worry that inequality in health care provision would lead to worse care for the less-wealthy. If the amount of health care is fixed, then if the wealthier people get more medical care, the less-wealthy people would necessarily get less. But to say that the amount of medical care is fixed is to say that the supply curve for medical care is per-fectly inelastic, that is, vertical. Another way of saying that the supply curve is perfectly inelastic is that when demand increases, the amount supplied stays exactly the same.
Is a perfectly inelastic supply curve plausible? No, it is not. Indeed, the supply of medical care is likely to be fairly elastic. That is, if the demand increased, not only would doctors and hospitals be paid more, but also this additional pay would attract more doctors and hospitals. Everyone under-stands that when Canada’s population increases, the available amount of steak, wine, pasta, cars, and toilet paper increases. The reason is that the increase in demand draws more resources into producing more of the things that people want. The same is true for an increase in the demand for medical care.
If people were allowed to buy medical care or health insurance, the resulting increase in demand would not, therefore, simply take medical resources that otherwise would be available in a single-payer system. Instead, under my proposal, there would be more resources in the medical care system.
Crunch all you want: We’ll make moreHow many more resources would be drawn into the medical care system? The answer to that question depends on two variables: 1) the increase in demand due to people’s new ability to buy health care, and 2) the elasticity of supply of medical care.

www.fraserinstitute.org d Fraser Institute
Chapter 4: The Inefficiency of Health Care Rationing—and a Solution d 89
Consider an extreme case in which the elasticity of supply is infinite. In laymen’s terms, this means that even a tiny price increase for doctors, nurses, and hospitals would lead to a huge increase in the number of doctors, nurses, and hospitals. In this extreme case, all of the additional medical care demanded would be satisfied without any loss of resources to the single-payer system. One is reminded of the late 1980s ad for Doritos in which comedian Jay Leno says, “Crunch all you want; we’ll make more” (YouTube: http://www.
youtube.com/watch?v=OCX2H2EgHxY&NR=1).While the extreme case of infinite elasticity of supply is unlikely, some-
thing very close to it is quite likely. The reason is that medical care is less like coal mining and more like Doritos. If the demand for coal increases, the increased price will lead to more coal production, but this coal production, absent a technological improvement in mining coal, will cause the price to be higher because the only way to get more coal, unless new deposits are found, is to go deeper—and that is expensive. But if the demand for Doritos increases, the increased demand causes more Doritos to be produced with nary an increase in the unit cost of production. Similarly, an increase in demand for medical care would lead to more hospitals being built and more people becoming nurses and doctors at a fairly constant unit cost over time.
One might think that a substantial increase in demand for medical care would not cause a substantial increase in the number of nurses and doc-tors. After all, the number of slots in nursing schools and medical schools is fixed in the short run, and it takes time to build and equip hospitals and other medical facilities.
While this concern is clearly relevant, it should be noted that this fixity, at least in the longer run, is due to government policy. In Canada, govern-ments provide the majority of the funds for all 16 medical schools (Gray and Ruedy, 1998; and Paris, Devaux, and Wei, 2010).7 Hence the number of slots in those schools is indirectly the result of a policy decision by the government. Of course, there is also the possibility of attracting more doctors and nurses through immigration, something that Canada, an attractive country to move to with a lot going for it, is already doing. If more doctors and nurses do not immigrate to Canada in response to an increase in demand for doctors and nurses, this, just as in the school-slot case, is due to government policy.
7 I thank Bacchus Barua for these references.

Fraser Institute d www.fraserinstitute.org
90 d Reducing Wait Times for Health Care
Government policy can be changed. First, the government could fund an increase in the number of slots in medical and nursing schools while insist-ing that all those admitted, or, at least all those admitted to the additional slots, pay all or a large part of their own way. Second, the government could further relax its immigration restrictions on doctors and nurses. Finally, even though foreign doctors can immigrate to Canada, they often find that they need to start almost from square one to be allowed to practice medicine in Canada. So, third, this could be altered so that someone with a license to practice in another country could be automatically allowed to practice in Canada as long as his or her specific degree were prominently displayed in the doctor’s waiting room and in all the doctor’s advertising. These three measures would likely make the supply of doctors and nurses quite elastic.
Indeed, one can imagine a grand bargain here where doctors and nurses would go along with relaxing the restrictions on supply, which would increase competition from the entry of new doctors and nurses, in return for the increased demand for their services that would occur if the government allowed people to buy medical care and private health insurance. Both poli-cies—allowing people to buy medical care and allowing increased supply—are desirable on their own. Implementing them together would even be more desirable and, possibly, more politically feasible.
Would there be “cream-skimming?”Another concern that some might have with allowing people to pay for medi-cal care is that the “good” doctors would be encouraged to spend more time taking care of private payers while the “bad” or less-good doctors would stay in the Medicare system. The fear is that those patients who stick with Medicare would get less-good treatment.
This could happen. It’s very hard, though, to measure quality in health care. There are two possibilities. The first is that there’s nothing to this argument and cream-skimming would not occur. The second is that there’s something to this argument and cream-skimming would occur. In the first case, the discus-sion is over. In the second case, the argument has just begun. Two effects would offset the decline in quality under Medicare, making it plausible that people in the Medicare system would get better treatment than they would have gotten

www.fraserinstitute.org d Fraser Institute
Chapter 4: The Inefficiency of Health Care Rationing—and a Solution d 91
had private payment been restricted, even if the cream-skimming concern is valid. First, as noted earlier, with the queue for health care being shorter, people in the Medicare system would get care more quickly. Second, to the extent that doctors and hospitals have an incentive to give high quality in return for pri-vate payments (which is the cream-skimming argument), doctors and hospitals would have an incentive to get better at what they do so that they, too, could earn private payments. In other words, the quality of the whole system would likely improve. Moreover, the higher-quality private care would become an external benchmark by which to measure Medicare’s results and improve clinical and management practices in the public system. There is no such baseline today.
The joint supply problem: Almost a free lunchEconomists are used to thinking that there is no such thing as a free lunch. And they are right. There are, however, cheap lunches. One I have in mind comes about in medical care because of something that economists call the
“joint supply problem.” The classic example is leather and beef, which are jointly supplied by cattle. Basic economics shows that when the demand for leather increases, the price of beef falls. The reason is that the demand for cattle is made up of the demand for leather plus the demand for beef. When the demand for leather increases, the overall demand for cattle increases. This added demand for cattle leads to a higher price for cattle, which, in turn, causes more cattle to be produced. The increased number of cattle produced leads to more beef being more produced. The higher amount of beef, com-bined with an unchanged demand for beef, leads to lower beef prices.
What does this have to do with medical care? Some of the resources used in medical care have this “joint supply” aspect. It might be, for example, that, given what Medicare will pay for CT scans, doctors and hospitals find it profi to buy only a few CT scanners and run them only a few hours per day. However, consider what might happen if people were allowed to pay for CT scans. Then, in deciding how many scanners to buy, doctors and hospital administrators would realize that to the government payers they could add the private payers and make more money by buying more machines. This would result in increased scanning capacity being available to patients in the single-payer Medicare system.

Fraser Institute d www.fraserinstitute.org
92 d Reducing Wait Times for Health Care
A case where allowing a market could well have made more CT scans available to Medicare patients is the infamous 1991 case in Richmond, Ontario, when York Central Hospital Guelph made CT scans available to animals (Daily Mercury, 1991). People in Ontario could not get a scan quickly because they were not legally allowed to pay for a CT scan. That’s because the govern-ment “cared” so much about people. However, animals were not (and are not) covered by Medicare, because the government doesn’t care as much about animals. So pet owners were allowed to pay $300 to get a scan for their pets during hours in which the scanners were not otherwise in use. When this
“scandal” was discovered, the bureaucracy did what bureaucracies do: it didn’t solve the underlying problem but, rather, made it illegal to use the machines on pets (Robson, 1993).
But what would have happened had the bureaucracy, instead, allowed people to buy scans for their pets? We need not speculate because it was already happening. John Robson notes, “[A]ccording to the doctor in charge, the user fees paid by dogs allowed him to operate the machine longer, thus treating more people” (Robson, 1993). It is even possible that the hospital would have made enough money on the CT scanners to justify buying an additional one, which would have meant that one additional scanner would have been available for humans. Had that happened, Medicare patients would have had even more access to CT scans, not less. Thus, my conclusion that the joint supply problem can lead to, if not a free lunch, at least a cheaper lunch.
Conclusion: First do no harmIt’s one thing to advocate that the government subsidize people’s health care, as Canadian governments do. It’s quite another to advocate that people who are dissatisfied with the current system not be allowed to spend their own money to try to do better. Whatever other policies one advocates, people should be allowed to spend their own money on medical care. Whose body is it, anyway?
www.fraserinstitute.org d Fraser Institute
Chapter 4: The Inefficiency of Health Care Rationing—and a Solution d 93
References
Barua, Bacchus, and Nadeem Esmail (2012). Waiting Your Turn: Wait Times for Health Care in Canada, 22nd edition. Fraser Institute. <http://
www.fraserinstitute.org/uploadedFiles/fraser-ca/Content/research-news/research/
publications/waiting-your-turn-2012.pdf>, as of June 18, 2013.
Daily Mercury (1991, June 14). Humans Wait in Pain, Dogs Don’t. Daily Mercury (Guelph, Ontario).
Esmail, Nadeem (2009, February 9). “Too Old” for Hip Surgery. Wall Street Journal. <http://online.wsj.com/article/SB123413701032661445.html>, as of June 18, 2013.
Esmail, Nadeem (2013). The Private Cost of Public Queues for Medically Necessary Care. Fraser Alert. Fraser Institute. <http://www.fraserinstitute.org/
research-news/display.aspx?id=20206>, as of July 18, 2013.
Flood, Colleen M., and Tom Archibald (2001). The Illegality of Private Health Care in Canada. Canadian Medical Association Journal 164, 6 (March 20): 825-830.
Flood, Colleen M., and Amanda Haugan (2009, February 26). Is Canada Odd? A Comparison of European and Canadian Approaches to Choice and Regulation of the Public/Private Divide in Health Care. Special Issue of Health Economics, Policy and Law (2010). <http://ssrn.com/abstract=1350012>, as of June 18, 2013.
Goodman, John C. (2012). Priceless: Curing the Healthcare Crisis. Independent Institute.
Gray, Jean D., and John Ruedy (1998). Undergraduate and Postgraduate Medical Education in Canada. Canadian Medical Association Journal 158: 1047-1050.

Fraser Institute d www.fraserinstitute.org
94 d Reducing Wait Times for Health Care
Jacobs, Mindelle (2005, June 11). Canada Has Four-Tiered Health Care. Edmonton Sun <http://www.freerepublic.com/focus/news/1420945/posts>, as of June 18, 2013.
Lewis, Steven, Cam Donaldson, Craig Mitton, and Gillian Currie (2001). The Future of Health Care in Canada. British Medical Journal 323, 7318 (October 20): 926-929. <http://www.ncbi.nlm.nih.gov/pmc/articles/
PMC1121447/>, as of June 18, 2013.
Montreal Gazette (2008, February 14). MDs Going Private at Faster Rate. Montreal Gazette. <http://www.canada.com/montrealgazette/news/story.
html?id=da83248c-1e48-40fb-9c6c-5503d564ec89>, as of June 18, 2013
Paris, V., M. Devaux, and L. Wei (2010). Health Systems Institutional Characteristics: A Survey of 29 OECD Countries. OECD Health Working Papers No. 50. Organization for Economic Cooperation and Development.
Robson, John (1993). You Will Die Like Dogs. Fraser Forum (April).
Statistics Canada (2006). Access to Health Care Services in Canada: January to December 2005. Catalogue No. 82-575 – XIE. Statistics Canada. <http://publications.gc.ca/Collection/Statcan/82-575-X/82-575-XIE2006002.pdf>, as of June 18, 2013.
YouTube. Doritos chip commercial with Jay Leno. Uploaded to YouTube December 18, 2007. <http://www.youtube.com/watch?v=OCX2H2EgHxY&NR=1>, as of June 18, 2013.

www.fraserinstitute.org d Fraser Institute d 95
Chapter 5
Health Status of the Workforce and Economic GrowthSteven Globerman
IntroductionAs discussed by Nadeem Esmail in chapter 2 of this volume, there is ongoing controversy surrounding the validity and practical relevance of estimated wait times for health care services in Canada. There is also controversy surround-ing the medical impacts of waiting lists, although the evidence reviewed by Brian Day in chapter 3 documents the adverse health consequences of delay-ing necessary medical procedures and treatments. Conversely, an important policy issue that has received comparatively little attention is whether the expected social benefits of reducing waiting times for health care services exceed the expected social costs associated with any targeted reduction of wait times. A related policy issue is whether relatively efficient and equitable initiatives can be identified and implemented to reduce wait times.1
Most of the economic discussion in the policy debate about reduc-ing wait times has focused on the financial costs of increasing the supply of health care services as paid for by government.2 Less attention has been paid to the potential economic benefits of reducing or eliminating wait times for health care. While relatively few in number and incomplete in their scope
1 In this regard, several authors have argued that simply providing more government funding to the health care system is not an efficient way to reduce waiting lists in Canada. See, for example, Lewis, Donaldson, Mitton, and Currie (2001). For a discussion of “market oriented” approaches to reducing wait times in Canada, see chapter 4 by David Henderson in this volume.2 Some discussion has also focused on the implications of allowing more health care services to be privately financed in Canada. See the chapter by Henderson in this volume.
Fraser Institute d www.fraserinstitute.org
96 d Reducing Wait Times for Health Care
of coverage, available studies document the economic benefits to society of timely health care delivery.3 Such benefits are realized both inside and outside the workplace.
This chapter focuses on the workplace-related benefits of improving the health status of Canadians. In particular, it reviews some empirical evidence on the magnitude of those benefits. While this chapter presents no original evidence, the published studies that are reviewed identify quite persuasively substantial economic benefits associated with improvements in the health sta-tus of the population. The chapter also discusses some evidence showing that the timely delivery of health care improves a society’s health status, although a much more extended discussion of evidence on this issue is found in Brian Day’s chapter in this book. In short, a good economic case can be made that rationing access to health care services through waiting lists imposes signifi-cant economic costs on the Canadian economy, and that policy initiatives to reduce wait times can promote the economic welfare of Canadians.
Health status and economic growth: A frameworkWhile economic growth is not the exclusive goal of policymakers, it is a promi-nent goal that arguably facilitates the attainment of other important public policy priorities, including government funding of social programs. Hence, the linkage between health status and economic growth is an important issue to all Canadians and not just to policymakers in the health care sector.
Economic growth is typically measured as the growth in the value of real goods and services produced in a country.4 Therefore, real economic growth in Canada equates to the growth in the inflation-adjusted value of goods and services produced by the residents of Canada, which is basically the growth of Canada’s real gross domestic product (GDP). The real value of the goods and services produced in a country is determined by the quantity
3 For an early Canadian study in this vein, see Globerman (1991), who estimates the value of foregone economic output associated with wait lists in British Columbia. For a recent summary of some evidence on the economic burden of illness in Canada, see the Conference Board of Canada (2013).4 Some might argue that the consumption of goods and services is a better measure of a society’s economic well-being than the production of goods and services. Since the argument is largely immaterial to the main issues addressed in this chapter, the more ubiquitous production-based measure of economic growth is used.

www.fraserinstitute.org d Fraser Institute
Chapter 5: Health Status of the Workforce and Economic Growth d 97
of labour used to produce output multiplied by the real output produced per unit of labour. Real output per unit of labour is commonly referred to as the average productivity of labour (see Appendix).
Hence, the relationship between health status and economic growth should arguably focus on how changes in a population’s health status might influence the growth of labour input, as well as the growth of labour produc-tivity.5 This, in turn, suggests a need to understand the proximate determi-nants of the growth of labour and the growth of labour productivity, and then relate those determinants to the population’s health status.
Determinants of the quantity of labour inputThe growth in the amount of labour used to produce output will reflect the interaction between the supply of labour and the demand for labour.6 The market-clearing real wage rate equates supply and demand which, in turn, determines the amount of labour used to produce output in any period of time. An increase in the supply of labour occurs when people in the population are willing to work more hours for the same real wage rate. An increase in the demand for labour occurs when employers are willing to hire more workers for the same real wage rate. Hence, the growth of labour input will be positive if there is an increase in the supply of labour and/or the demand for labour.
First consider the supply of labour. Given the size of a country’s pop-ulation, the supply of labour will increase, all other things constant, if the percentage of the population looking for employment at current real wage rates increases. The percentage of the working age population either currently employed or looking for work at existing wage rates is called the labour force participation rate. The latter excludes unemployed working-age individuals who are not seeking jobs. An increase in the labour force participation rate is therefore equivalent to an increase in the supply of labour.
A number of factors will influence the decision of individuals to par-ticipate in the labour force. One is age. Younger people will tend to remain out of the labour force while they are going to school. However, both younger, and (particularly) older people will tend to leave the work force for a variety
5 A conceptual discussion of the linkages between health status, labour force participation, and productivity is also found in Sharpe and Murray (2011).6 The amount of labour used in the production of output is typically measured as either hours of employment or the number of full-time equivalent employees.

Fraser Institute d www.fraserinstitute.org
98 d Reducing Wait Times for Health Care
of reasons, including declining physical and mental abilities to perform the tasks required in order to obtain or maintain employment in occupations for which they are otherwise qualified. Any such decline in health status reduces the expected real wage associated with employment both directly (by reducing the economic value of the worker to employers, and indirectly (by increas-ing the likelihood of being laid off or fired from one’s employment because of inadequate performance). These potential outcomes reduce the expected rewards from remaining in the workforce. Furthermore, older workers who are laid off from their jobs have a relatively high probability of leaving the work force permanently. This dynamic establishes one potential link between waiting times, health status, and economic growth. Namely, a reduction in waiting times for health services could mitigate or even prevent the deteriora-tion of physical and mental capabilities of older workers, thereby increasing the labour force participation rate of those workers.7
A second factor influencing the decision of individuals to participate in the labour force is their perceived likelihood of finding employment at existing real wage rates. Specifically, individuals are more likely to look for employ-ment when they have higher subjective probabilities of finding employment. The likelihood of finding employment should be related to an individual’s employment search process. Specifically, the probability of finding employ-ment should be positively related to the time and effort spent searching for employment. This suggests a second possible link between wait times and economic growth. Namely, to the extent that reduced wait times for health care services result in improvements in the physical mobility, mental acuity, and stamina of job seekers, on average, it should encourage efforts to search for employment and, therefore, increase the labour force participation rate and the subsequent employment of labour.8 Furthermore, if healthier indi-viduals are more “effective” job seekers, employment will increase for any given labour force participation rate.
7 Although conventionally defined as being beyond working age, many individuals 65 years of age and over might be willing and able to participate in the labour force if their health permitted.8 Cai and Kalb (2006) identify another potential link between health status and labour force participation. Namely, poor health may cause individuals to value time out of the labour market more, since the time needed to care for one’s health increases with ill health. On the other hand, increased income may be required to pay for increased health services, at least for some individu-als who do not have comprehensive “first-dollar” coverage.

www.fraserinstitute.org d Fraser Institute
Chapter 5: Health Status of the Workforce and Economic Growth d 99
In short, improved health status owing to timelier health care delivery should increase the labour force participation rate. All else constant, this should result in growth of employment and real output. Obviously, the labour force participation rate cannot increase indefinitely. It reaches a conceptual, if not realistic, limit when everyone in the population is either employed or looking for work. As a practical matter, there is some scope in Canada for increased labour force participation, particularly for males. Specifically, the percentage of Canadian males ages 15 and older participating in the labour force was 71.5 in 2010. Its highest value over the past 20 years was 76.0 percent. The equivalent labour force participation rate for Canadian females was 86.4 percent in 2010 compared to 76.2 percent in 1990.9
Next, consider the demand for labour. The amount of labour used to produce output will increase if the demand for labour increases, other things held constant. One factor likely to encourage an increase in the demand for labour is a reduction in anticipated labour hours lost because of absenteeism. Absenteeism owing to mental and physical health problems contributes to higher effective costs and lower profits for Canadian companies.10 Among other things, reduced absenteeism would enable companies to reduce costs associated with hiring temporary replacement workers and stockpiling inven-tories. In effect, reduced health-related absenteeism should make it more profitable for Canadian companies to hire workers, presuming that those companies cannot completely shift the anticipated costs of absenteeism to employees in the form of lower wages which, in turn, reflect the likelihood and economic consequences of each employee’s absenteeism. Some available evidence on the relationship between health status and workplace absentee-ism is therefore discussed below.
Determinants of labour productivityIncreases in labour productivity will directly increase real output given any quantity of labour input.11 Improvements in the average health status of
9 These data are taken from Index Mundi (2013).10 Some evidence on the economic significance of health-related worker absenteeism will be discussed below.11 Improved labour productivity should also increase the demand for labour, although we are concerned here with the real output that companies are capable of producing for any given amount of labour being used.

Fraser Institute d www.fraserinstitute.org
100 d Reducing Wait Times for Health Care
employees should contribute directly to improved labour productivity. In par-ticular, healthier employees should be able to work more efficiently when they are on the job.12 Since many workers in Canada are employed in “white collar” jobs, it might be argued that physical disabilities and chronic illnesses are not important contributors to lost productivity. However, physical illnesses and ailments can be expected to impair mental functioning. Furthermore, the stress associated with unresolved health care issues can certainly impair concentration and critical thinking required for most human capital-inten-sive occupations.13 Whether improvements in the health status of employees directly and significantly increase their productivity is an empirical issue for which evidence is available and reviewed below.
Improvements in the health status of workers can also indirectly increase labour productivity by encouraging workers to invest in general human capital by, say, extending the period of time for formal education or by taking informal education and training courses.14 The relevant notion here is that investment in general education and job training involves a decision to delay or reduce participation in the workplace in the near-term in order to participate in the workforce later on while possessing additional human capital that makes one more economically valuable in the labour market. The value of the human capital acquired will depend positively upon the length of time the potential investor expects to work over his or her life-time, as well as how intensely he or she expects to be able to work. Thus, if one anticipates that future health problems will be relatively quickly and effectively addressed, one would be more willing to invest in human capital. An individual’s expectations about their future health status will likely be influenced, at least in part, by their current health status. Specifically, one is
12 Reductions in on-the-job output owing to poor health status are identified as “presenteeism” in the literature.13 For some evidence on the linkage between stress and productivity in the workplace, see Boles, Pelletier, and Lynch (2004). 14 Firms may also be more willing to supply specific training and education programs to employees who they expect will be in good health over the long run. More generally, health status might also influence savings decisions that individuals make. For example, longer life expectancy associated with good health might encourage greater retirement savings. On the other hand, poor health might increase savings as a precaution against early withdrawal from the workforce.
www.fraserinstitute.org d Fraser Institute
Chapter 5: Health Status of the Workforce and Economic Growth d 101
likely to be less optimistic about enjoying robust health in future if one is cur-rently struggling to resolve health problems today. Furthermore, observing peers, relatives, or co-workers waiting for health care services might promote expectations that wait times will exist in the future, and that unpredictable health problems may result in a shorter or less consistent work career than would justify ambitious investments in human capital.
An individual’s health status will also presumably affect his or her abil-ity to benefit from formal or informal education. For example, children with serious and persistent health problems are more likely to suffer frequent and prolonged school absences. They are also more likely to have comprehension problems when attending school (Currie, 2009). Parents in poor health are less likely to monitor and supervise their children’s education, thereby increas-ing the likelihood of poorer and attenuated learning at school.
SummaryImproving the health status of Canadians can be expected to contribute to real economic growth through several channels of influence. Figure 5.1 summarizes those channels. One channel reflects a positive linkage between health status and labour force participation. Healthier individuals are more likely to enter or remain in the workforce, which results in an increased supply and employ-ment of labour. More real output can be produced with greater numbers of people employed, all other things constant. Furthermore, healthier individuals are less likely to miss work due to illness or other health-related causes. This contributes to increased real output by decreasing the gap between the poten-tial amount of labour input (given the number of employees hired) and the actual amount of labour input, thereby encouraging organizations to employ more labour. A second channel reflects a broad linkage between health status and on-the-job productivity. Specifically, healthier workers can be expected to perform their work-related tasks more efficiently and effectively than those suffering from health conditions while performing the same tasks. That is, better health reduces presenteeism, which translates into increased labour productivity. In addition, healthier individuals are more likely to invest in acquiring human capital, both before they enter the workforce and while they are employed. Investments in human capital can be expected to materialize in future increases in labour productivity.

Fraser Institute d www.fraserinstitute.org
102 d Reducing Wait Times for Health Care
Empirical evidence on the labour market impacts of health status What follows is a review of the empirical evidence for the main linkages between the population’s health status and economic growth that were identi-fied in the preceding section. While most of the available evidence is for other countries, the Canadian experience is likely to be consistent with that from elsewhere. Furthermore, while it is difficult to infer precise rates of return to private and public investments in improving health status, the evidence is quite persuasive in identifying potentially large and positive impacts of improvements in population health status on real economic growth.
Health status and labour force participation ratesThe labour force participation decision most frequently studied is the deci-sion to retire rather than remain in the workforce. This effectively means that many of the available studies of labour force participation focus on the behaviour of older individuals. In this regard, a number of empirical studies find that poor health strongly and positively influences the probability of early retirement (Mitchell and Anderson, 1989; Gustman and Steinmeier, 1986). More generally, the probability of remaining in the work force increases with
Figure 5.1: Linkages between heath status and real GDP
* If people don’t show up for work, management has to scramble to �nd temporary workers to �ll the gaps, or
pay overtime to regular workers. All such “�xes” make labour e�ectively more expensive. Since the cost of labour
is higher, less labour is used.
** There will be increased demand for the increased output that is produced. As a small, open economy, Canada
can sell its output on the world market, so that a “shortage” of demand isn’t a problem.
Good health
Less absenteeism Less “presenteeism”
More investment in human capital
Increased labour force participation
More labour in the workforce (labour supply
INCREASED EMPLOYMENT
× More labour productivity = GREATER REAL OUTPUT **
*

www.fraserinstitute.org d Fraser Institute
Chapter 5: Health Status of the Workforce and Economic Growth d 103
the health status of individuals regardless of age and gender, although the probability is higher for older workers, particularly for older female workers (Currie and Madrian, 1999; Cai and Kalb, 2006). The available studies of the relationship between health status and labour force participation encompass different measures of physical and mental health. Hence, the findings vary somewhat with the measurement techniques used, as well as with gender, age, and other characteristics of the sample of individuals studied. Nevertheless, there is broad consistency in the literature showing that health has a positive and significant effect on labour force participation (Cai, 2010).
The measure of physical and mental health used in the relevant studies is an important research issue. Specifically, a substantial percentage of stud-ies use the self-reported health status of individuals in the empirical sample. A concern here is that people who retire early may understate their health status to interviewers as a justification of their retirement decisions. A related concern is that an individual’s “true” health status might be influenced by whether or not he or she is an active workforce participant. On one hand, looking for employment without success can cause mental stress leading to a diminished health status. On the other hand, being employed in a physical or mentally demanding occupation can directly contribute to diminished mental and physical health, although work that is materially and emotionally satisfy-ing can enhance health (Shain and Kramer, 2004). Hence, studies that address these concerns are particularly interesting to researchers and policymakers.
One technique used to address the concerns about using self-reported health status is to use more objective measures of an individual’s physical and mental health conditions. For example, Mitchell and Anderson (1989) construct a measure of mental health for respondents in three US cities using a battery of questions indicating symptoms of depression and alcohol abuse that the pair then use to generate diagnoses according to criteria outlined in the American Psychiatric Association’s Diagnostic and Statistical Manual. They also employ a statistical technique that allows for a possible simultane-ous relationship between mental health and labour force participation. They find that mental health problems are the most important reason for the early withdrawal of older workers from the labour market.
Frank and Koss (1995) review and summarize results from a number of studies that employ a methodology similar to Mitchell and Anderson’s (1989) and that focus on people of different ages. By and large, the results

Fraser Institute d www.fraserinstitute.org
104 d Reducing Wait Times for Health Care
are consistent in showing that mental illnesses reduce employment rates. To be sure, unemployment is not identical to being out of the workforce, since some unemployed people are presumably looking for work. Still, unemployed workers do not contribute to real output growth. Furthermore, those suffer-ing prolonged periods of unemployment are at high risk for dropping out of the workforce entirely. In the event, the specific studies that Frank and Koss reviewed identify a higher probability of unemployment for people diagnosed with mental illness. The relevant studies reviewed by Frank and Koss linking substance abuse to employment provide less conclusive evidence, although, on balance, alcohol and drug abuse is linked to unemployment.
Kalwij and Vermeulen (2008), use several objective health indicators, as well as self-reported health, to estimate a model of labour force participa-tion for older individuals in 11 European countries. The authors identify a number of physical and mental medical conditions of varying seriousness for their respondents, and also include self-reported health. The authors use an instrumental variables estimation technique and find that both self-reported and other health indicators have varying effects across countries. Specifically, the subjective measure of health has a statistically significant impact on both male and female labour force participation in some countries. In other countries, objective health indicators are statistically significant, while self-reported health is not.
Cai and Kalb’s (2006) study of labour force participation in Australia is particularly instructive for Canadian policymakers, since features of gov-ernment health insurance in Australia are quite similar to those in Canada. Conversely, in the US, many workers will remain in the labour force so they can continue to receive employer-sponsored health care insurance cover-age, a decision that can be expected to weaken the statistical relationship between poor health status and withdrawal from the labour market, other things constant. Cai and Kalb collect information identifying self-reported health status, as well as disabilities and measures of general health and well-being. They simultaneously estimate separate equations for health status and labour force participation across four separate groups: 1) Males aged 19-49; 2) Females aged 19-49; 3) Males aged 50-64; 4) Females aged 50-64. Their results indicate that better health increases the probability of labour force participation for all four groups. The effect is larger for the older groups and for women.

www.fraserinstitute.org d Fraser Institute
Chapter 5: Health Status of the Workforce and Economic Growth d 105
Health status, employment and labour productivityIf labour and product markets are competitive—and most labour and product markets in Canada’s private sector are arguably competitive—then changes in the average hourly income that workers earn should approximate changes in the average worker’s productivity. Hence, some studies linking health status to work-place productivity estimate the statistical relationship between wages or income earned and subjective or objective measures of health status; however, a majority of available studies estimate the relationship between health status and employ-ment status. Individuals suffering physical and mental illnesses but remaining in the workforce are less likely to be employed than their healthier counterparts. For one thing, the former are likely to be less efficient than the latter in the job search process. For another, the former may also be unwilling to accept lower wages to compensate for the higher risks they impose on employers, including an elevated likelihood that they will miss workdays due to illness. On balance, therefore, the probability of being employed should be statistically related to health status.
As noted above, unemployed individuals can still be in the workforce if they are seeking employment. However, unemployed individuals will not be earning labour income, so that periods of unemployment will contribute to lower average incomes. The implication is that empirical studies relating employment status to health status will likely overstate the strength of the rela-tionship between health status and labour force participation and understate the relationship between health status and on-the-job productivity.
The productivity of employed individuals is likely to be adversely affected by poor health status for two reasons mentioned earlier. One is that employed individuals with health problems are more likely to take time off from work (absenteeism). A second is that employees in relatively poor health are more likely to produce less output while working compared to their coun-terparts who enjoy relatively good health (presenteeism).
It might seem more appropriate to incorporate the effects of absentee-ism with those of reduced labour force participation, since employees who are absent from work are effectively, if only temporarily, out of the workforce. On the other hand, they will still be counted as full-time employees, even though they are missing time at work. Hence, absenteeism will adversely affect productivity (as measured by output per worker). Furthermore, the absence of specific employees from work might also adversely affect the on-the-job productivity of co-workers still at work.

Fraser Institute d www.fraserinstitute.org
106 d Reducing Wait Times for Health Care
Experts see both absenteeism and presenteeism as economically sig-nificant. For example, Davis, Collins, Doty, Ho, and Holmgren (2005) estimate that absenteeism cost the American economy around US$48 billion in 2003, while presenteeism had an opportunity cost of approximately US$27 billion that same year. The Conference Board of Canada (2013) estimates the value of the six most common mental ailments contributing to absenteeism among working-age Canadians at CA$20.1 billion in 2012.
The literature addressing the relationship between health status and productivity is vast and eclectic. In particular, available studies use different sampling methodologies, alternative approaches to measuring health status and workplace performance, and different statistical techniques to address the workplace costs of a wide range of physical and mental illnesses. Many studies also fail to identify the separate impacts of absenteeism and presenteeism on productivity, or simply focus on one or the other phenomenon. The eclectic nature of the relevant literature makes it impractical to summarize and discuss the results of individual studies. Hence, the following brief summary will focus on other authors’ reviews of the relevant literature.
In one relatively recent literature review (Econtech Pty Ltd., 2007), the authors note that the majority of available studies deal with the costs of absenteeism and presenteeism for the whole US workforce. In general, the studies identify a considerable economic burden related to both phenomena. For example, several studies estimate that the costs of presenteeism amount to up to 3 percent of the gross wages paid to US workers in any given year.15 The estimated costs of absenteeism are about one-third the cost of presentee-ism. It should be noted that the costs of presenteeism are implicit in that they reflect potential productivity improvements that companies could achieve if workers were not suffering impaired physical or mental health. Also, the relevant studies encompass the workplace consequences of a broad range of physical and mental health conditions.
Econtech also provides its own estimates of the cost of presenteeism to the Australian economy by using an economy-wide econometric model. Their approach allows for the reduced productivity of “unhealthy” workers who affect the productivity of healthy workers through several indirect link-ages, including reduced capital investment on the part of employers. The
15 These cost estimates are equivalent to a range of 1.7 to 2.5 percent of GDP.
www.fraserinstitute.org d Fraser Institute
Chapter 5: Health Status of the Workforce and Economic Growth d 107
direct costs of presenteeism to Australian employers in the form of foregone labour productivity are estimated to be around 1.9 percent of GDP. The total direct and indirect costs of presenteeism are around 2.8 percent of GDP. The five health conditions with the highest (presenteeism) cost shares are depres-sion, hypertension, arthritis, migraine, and diabetes. These five conditions account for approximately 75 percent of the costs of presenteeism.16 By com-parison, the Conference Board of Canada (2013) also estimated the cost to the Canadian economy (in 2010) of presenteeism associated with ten chronic diseases and health conditions. The board estimated the cost at almost 8 percent of GDP in that year.
Frank and Koss (2005) review the literature on the impacts of men-tal and addictive disorders on workplace performance. They summarize the results of a number of studies documenting that mental illnesses are associ-ated with lower levels of employment generally, and with lower earnings for those who are employed specifically. Note that lower employment earnings will typically reflect both absenteeism and presenteeism. The authors con-clude from their literature review that productivity losses differ across mental illnesses with anxiety disorders producing the largest losses.17 They also cite studies documenting a negative relationship between chronic drug use and labour force participation for men.
Loeppke and his co-authors (2007, 2009) use data collected from some 50,000 workers employed by nine firms in the United States. Their studies relate self-reported absences from work and self-assessed on-the-job productivity performance to subjectively assess health status for the sample of workers. The authors identified significant productivity losses associated with health-related absenteeism and presenteeism that were, on average, 2.3 times greater than the direct medical and pharmacy costs that the nine firms faced. The most costly illnesses and conditions were depression, obesity, arthritis, pain, and anxiety.
A study for employed individuals in Ontario suggests that the relation-ships between health status, absenteeism, and presenteeism for Canada are unlikely to differ much from those for other developed countries. Specifically,
16 Econtech notes that their study ignores two other conditions that have considerable presen-teeism costs: back pain and anxiety disorders.17 Boles, Pelletier, and Lynch (2004) analyze data for a cross-section of employees in a large US company and also find that stress disorder and diabetes are the two largest health risk factors adversely affecting the productivity of company employees.

Fraser Institute d www.fraserinstitute.org
108 d Reducing Wait Times for Health Care
Dewa and Lin (2000) analyze survey data from over 4,000 employed indi-viduals aged 18-54. The individuals comprise a subset of respondents to the government of Ontario’s Health Survey’s Mental Health Supplement, an epi-demiological survey of households across Ontario. The survey focused on psychiatric and physical disorders using an established diagnostic instrument. The study found that mental and physical health status had significant but different impacts on productivity. Physical conditions alone had a fairly con-stant effect across all types of disability days and were the largest contributor to work days lost (absenteeism). They also affected presenteeism, but were a far less important influence on the latter than conditions involving a mental illness. Respondents with mental health problems, either alone or in combi-nation with physical illnesses, were more likely to go to work but had lower on-the-job productivity than individuals with only a physical illness.
It is difficult to provide precise and reliable estimates of the concep-tually distinct relationships between health status, on the one hand, and the likelihood of being employed if in the workforce, as well as the extent of absenteeism and presenteeism among employed workers, on the other hand. For one thing, most available studies either focus on one or another of the latter three separable labour market outcomes, or they conflate two or more of the outcomes into a single measure of labour market performance. For another, there is variation across studies in the estimated degree and inten-sity of adverse health consequences on labour market outcomes (Shain and Kramer, 2004). Nevertheless, there is noticeable, perhaps surprising, consis-tency in the available estimates of the costs of presenteeism. Specifically, the available estimates cluster at around 2 percent of GDP. Furthermore, available studies point to the costs of absenteeism as being even higher than the costs of presenteeism in terms of lost output.18 While available studies generally do not focus specifically on the relationship between health status and the probability of being employed given that one is looking for a job, studies are quite consistent in identifying a negative relationship between health status and employment status.
There is also some degree of consensus on the relative importance of different physical and mental illnesses on labour market outcomes. This
18 One such study finding higher costs for absenteeism than for presenteeism is discussed in Musich, Hook, Baener, and Edington (2006).
www.fraserinstitute.org d Fraser Institute
Chapter 5: Health Status of the Workforce and Economic Growth d 109
observation is potentially useful in that such evidence could assist policymak-ers in making decisions about how to reallocate scarce health care resources. Specifically, to the extent that real economic growth is a consideration in allocating health care funding, relatively more funding should be allocated to reduce waiting lists for illnesses that have above-average costs in terms of foregone labour income. On the other hand, the reliability of findings identifying the labour market consequences of specific illnesses is somewhat compromised by the fact that most seriously ill patients have multiple health problems (Shain and Kramer, 2004).
Health status and educationWhile numerous studies have documented a positive linkage running from more education to better health, there is less evidence on the magnitude of the linkage running from better health to improved education outcomes (Murillo and Martinek, 2011). Nevertheless, there is a fair amount of evidence for developing countries that individuals with poor health during childhood also tend to accumulate less education throughout their lives, although the evidence for developed countries is much more limited.
One extensive literature review draws on 53 studies for OECD countries (Suhrcke and de Pozniever, 2011).19 It concludes that overall child health status positively affects educational performance and attainment of learning; how-ever, the impact of health status appears to be relatively modest, particularly given the contribution of “lifestyle behaviours” such as exercise and obesity to academic performance. Furthermore, aspects such as family background and children’s individual characteristics, such as physical energy, play an important role in conditioning the relationship between education and health. Of the health conditions adversely affecting both short and long-term educational outcomes, anxiety and depression appear to be particularly important.
In her review of the literature, Currie (2009) evaluates the evidence relating child health to future educational and labour market outcomes. She concludes that there is strong evidence for positive statistical links between parental socioeconomic status and child health, on the one hand, and between
19 Most of the studies pertain to the United States; however, a study by Oreopoulos et al. (2008) for Canada finds that infant health is a strong predictor of high school completion. For another review of the relevant literature on child health status and educational performance, see Sharpe and Murray (2011).

Fraser Institute d www.fraserinstitute.org
110 d Reducing Wait Times for Health Care
child health and future outcomes, on the other hand; however, it is difficult to assess the strength of the linkages. She also concludes that mental health conditions may be a particularly important mechanism, because they are rela-tively common, and because they may have particularly deleterious effects on learning. Again, while the bulk of the evidence she reviews is for the United States, it includes a study for the province of Manitoba which found that
“underweight” children are less likely than their heavier siblings to reach grade 12 by age 17 (Oreopoulos, et al., 2008). While the latter study finds that the long-term effects of low birth weight on education are statistically significant, they are relatively small compared to other influences.
SummaryThe available empirical evidence documents fairly persuasively that physical and mental illnesses and disorders contribute to reduced labour input and lower labour productivity. In particular, improving the health status of the Canadian population can be expected to encourage increased participation in the labour force, with a resulting increase in total employment.20 Also relevant in its impact on economic growth, an improvement in the health of Canadian workers should contribute to lower absenteeism and presen-teeism. While healthier children will do better in school and stay in school longer than their unhealthier counterparts, the available evidence does not identify a strong linkage between health status and educational attainment. This outcome might reflect the difficulty in statistically identifying the true magnitude of the linkage.
While available empirical evidence supports the relevance of the con-ceptual linkages identified in figure 1, it is very difficult to precisely quantify any of the specific impacts of improved health status outlined in that figure. Hence, it is impossible, as a practical matter, to provide precise estimates of the overall contribution that improving the health status of Canadians would make to real economic growth. The limited evidence identified earlier does suggest that the overall contribution is likely to be economically consequential. For example, the costs of ill-health in terms of foregone productivity from reduced on-the-job efficiency may be in the order of 2 to 3 percent of GDP
20 Based on their review of available Canadian data and empirical studies, Sharpe and Murray (2011) conclude that the most substantial impact of poor health may be on the labour force participation rate.

www.fraserinstitute.org d Fraser Institute
Chapter 5: Health Status of the Workforce and Economic Growth d 111
annually based on estimates for other countries, and might even be higher based on findings for Canada cited by the Conference Board of Canada (2013). The additional loss in real output from increased absenteeism and reduced employment would obviously further increase the opportunity cost of delayed treatment of health conditions.
To the extent that reductions in waiting times translate into improve-ments in the health of Canadians, those reductions should contribute to eco-nomically significant increases in real output for Canada. The issue then turns on the extent to which quicker access to relevant health care services will improve the health of Canadians. The chapter by Brian Day in this volume provides extensive and important observations on this issue. The next section of this chapter contains some additional analysis of the relevance of shorter waiting times on the health of Canadians.
Wait lists and health statusIt seems reasonable to assume that if Canadians did not have to wait as long as they do for diagnostic tests, medical evaluations, and appropriate treatment, they would be healthier, on average, since they would presumably be spend-ing less time suffering the consequences of health problems. However, the magnitude of the economic benefits from reducing waiting times will depend upon the extent to which the earlier diagnosis and treatment of specific health conditions will result in a quicker and/or more effective restoration of patients’ health. In particular, if health care conditions such as anxiety and depres-sion, which are prominently linked to absenteeism and presenteeism, are essentially chronic conditions whose resolution is not significantly affected by reduced waiting times to see a specialist and receive treatment, reducing waiting times for such conditions might have a very limited impact on labour market outcomes and economic growth. In addition, improvements in the health benefits for Canadians of reduced waiting times presumes that there is an effective protocol for the health problems in question, and that earlier diagnosis and treatment will result in health providers following medically effective protocols.
I am unaware of any available statistical studies that directly quan-tify the extent to which reducing wait times for specific health conditions improves subsequent labour market performance. There is some limited
Fraser Institute d www.fraserinstitute.org
112 d Reducing Wait Times for Health Care
evidence, however, bearing upon the degree to which the treatment of health problems results in improved labour market outcomes. On balance, the evi-dence supports the presumption that successful treatment of health problems results in improved labour market performance. For example, Berndt et al. (1998) present evidence supporting the hypotheses that the level of perceived at-work performance is negatively related to the severity of a depressive con-dition, and that a reduction in depressive status improves the patient’s work performance. As well, Frank and Koss (2005) discuss a meta-analysis of 10 randomized trials of treating depression which concludes that work out-comes were good when treatment was symptomatically effective. Specifically, intervention led to around a 7 percent improvement in absenteeism. On the other hand, they also cite several studies that conclude that receiving appropriate treatment for depression does not guarantee a rapid return to full work activity.
More generally, there is statistical evidence about the extent to which the availability of health care resources affects a population’s health. Such evidence provides indirect insight into the potential for reduced wait times to improve health status, particularly to the extent that wait times primarily reflect shortages of health care resources. In one relevant study, Or (2001) estimates the relationship between the number of medical doctors per capita and mortality rates across a sample of OECD countries from 1970 to 1995. Or presents evidence showing that increasing the number of doctors per capita is strongly and significantly associated with lower mortality rates, holding constant some other determinants of health status including GDP, alcohol and tobacco use, and air pollution. However, two other measures of medical care inputs (i.e., number of hospital beds and total health care employment) appear to have no statistically significant impact on a population’s health status. In a related study, Or, Wang, and Jamison (2005) identify significant differences across OECD countries in the relationship between the number of doctors per capita and mortality rates. Specifically, mortality rates fall more strongly in some countries than in others with increases in the number of doctors as a percentage of the population. The authors find that “more efficient” countries are characterized by a greater availability of advanced medical technology.21
21 In this context, countries are efficient if they are characterized by relatively large decreases in mortality for any given increase in the number of doctors. It might be noted that Canada was the third most efficient country of the 21 countries included in the authors’ sample.

www.fraserinstitute.org d Fraser Institute
Chapter 5: Health Status of the Workforce and Economic Growth d 113
Starfield, Shi, Grover, and Macinko (2005) review a number of empiri-cal studies that identify a statistically significant beneficial impact of increases in the number of physicians per capita on mortality rates for 3,075 counties in the United States from 1996 to 2000. However, the studies find that lower mortality rates are associated only with increases in the supply of primary care physicians. The rates do not decrease with increases in the supply of special-ist physicians. The authors offer several possible explanations for this finding which all essentially converge on the notion that primary care physicians are better able to diagnose health problems than their specialist counterparts which, in turn, means that patients are more likely to receive appropriate and effective treatment if they are diagnosed by a primary care physician.
Evidence that the mix, as well as the number of physicians affects health status underscores the difficulties in drawing precise conclusions about how reduced wait times will affect labour market outcomes and economic growth, since the linkages will be conditioned by the overall efficiency of a country’s health care system. The more efficient the delivery of health care, the larger the presumed economic benefits of reducing wait times. However, this caveat does not contradict a conclusion that greater availability of health care services improves health status which, in turn, promotes economic growth through the channels documented in this chapter. The challenge for policy-makers in Canada is to identify efficient ways to increase the availability of timely health care services or, equivalently, to reduce wait times for medically appropriate services.22
Summary and conclusionsWhile Canadians are generally satisfied with their health care system, many see waiting for health services as a distinct shortcoming of the system. Wait lists are a method for rationing access to health care resources, thereby reducing financing requirements on the part of the federal and provincial governments. However, delays in the diagnosis and treatment of health problems also have the potential to slow economic growth. In particular, a faster restoration of good health for Canadians suffering from physical and mental health illnesses
22 The final chapter by Esmail in this volume discusses how several countries have managed to lower wait times for health care services below those for Canada, while Henderson’s chapter proposes a market-oriented approach to reduce wait times in Canada.

Fraser Institute d www.fraserinstitute.org
114 d Reducing Wait Times for Health Care
can be expected to reduce workplace absenteeism and improve on-the-job productivity. The restoration of good health should also promote increased participation and employment of Canadians in the workforce. All three devel-opments should encourage real economic growth.
It is impossible to provide a precise and reliable estimate of the stim-ulus to economic growth resulting from improved health status, although some evidence suggests that successful treatment of several major mental and physical illnesses might increase Canada’s GDP by at least as much as 1 to 2 percent per year on an on-going basis. While better estimates of the impact of improved health on labour market outcomes and, therefore, on economic growth are obviously required for purposes of reliable benefit-cost analysis, this admittedly rough and ready estimate suggests that Canada, as a society, can justify allocating more resources to reduce current wait lists.
Under the current Medicare system, any increased spending on basic health care would be undertaken by provincial governments. In his chapter, Henderson makes a convincing argument that it would be more efficient and effective to allow patients on wait lists to pay privately for medical services, if they so choose. Increased private spending on basic health care, at the margin, would reduce wait times for both patients choosing the private spend-ing option and those who choose to remain waiting for care in the publicly funded system.
An aging population in Canada will likely increase demands on the health care system and exacerbate concerns about wait times among Canadians. Hence, there is a potentially large economic pay-off to society from institutional changes that reduce wait times without compromising universal access to health care. Canadian policymakers should be open and receptive to such changes.
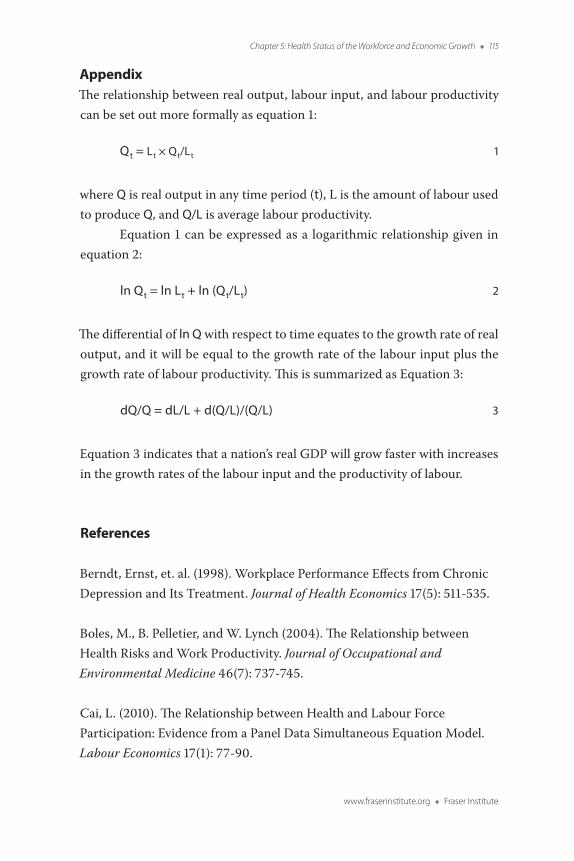
www.fraserinstitute.org d Fraser Institute
Chapter 5: Health Status of the Workforce and Economic Growth d 115
AppendixThe relationship between real output, labour input, and labour productivity can be set out more formally as equation 1:
Q t = L t × Q t/L t 1
where Q is real output in any time period (t), L is the amount of labour used to produce Q, and Q/L is average labour productivity.
Equation 1 can be expressed as a logarithmic relationship given in equation 2:
ln Q t = ln L t + ln (Q t/L t) 2
The differential of ln Q with respect to time equates to the growth rate of real output, and it will be equal to the growth rate of the labour input plus the growth rate of labour productivity. This is summarized as Equation 3:
dQ/Q = dL/L + d(Q/L)/(Q/L) 3
Equation 3 indicates that a nation’s real GDP will grow faster with increases in the growth rates of the labour input and the productivity of labour.
References
Berndt, Ernst, et. al. (1998). Workplace Performance Effects from Chronic Depression and Its Treatment. Journal of Health Economics 17(5): 511-535.
Boles, M., B. Pelletier, and W. Lynch (2004). The Relationship between Health Risks and Work Productivity. Journal of Occupational and Environmental Medicine 46(7): 737-745.
Cai, L. (2010). The Relationship between Health and Labour Force Participation: Evidence from a Panel Data Simultaneous Equation Model. Labour Economics 17(1): 77-90.
Fraser Institute d www.fraserinstitute.org
116 d Reducing Wait Times for Health Care
Cai, L., and G. Kalb (2006). Health Status and Labour Force Participation: Evidence from Australia. Health Economics 15: 241-261.
The Conference Board of Canada (2013). Health Matters: An Economic Perspective. The Conference Board of Canada.
Currie, Janet (2009). Healthy, Wealthy and Wise: Socioeconomic Status, Poor Health in Childhood and Human Capital Development. Journal of Economic Literature 47(1): 87-122.
Currie, J., and B.C. Madrian (1999). Health, Health Insurance and the Labor Market. In O. Ashenfelter and D. Card (eds.), Handbook of Labor Economics, Vol. 3 (Amsterdam: Elsevier Science BV): 3310-3415.
Davis, Karen, Sara Collins, Michelle Doty, Alice Ho, and Ayssa Holmgren (2005). Health and Productivity among US Workers. Issue Brief. The Commonwealth Fund, publication number 856. <http://www.
commonwealthfund.org/usr_doc/856_Davis_hlt_productivity_USworkers.pdf>, as of July 22, 2013.
Dewa, Carolyn, and Elizabeth Lin (2000). Chronic Physical Illness, Psychiatric Disorder and Disability in the Workplace. Social Science and Medicine 5(1): 41-50.
Econtech Pty Ltd (2007). Economic Modelling of the Cost of Presenteeism in Australia. Econtech.
Frank, Richard, and Catherine Koss (2005). Mental Health and Labor Markets Productivity Loss and Restoration. Disease Control Priorities Project, working paper number 38. World Bank. <http://www.dcp2.org/
file/50/>, as of July 22, 2013.
Gratzer, David (1999). Code Blue: Reviving Canada’s Health Care System. ECW Press.
www.fraserinstitute.org d Fraser Institute
Chapter 5: Health Status of the Workforce and Economic Growth d 117
Gustman, A.L., and T.L. Steinmeier (1986). A Structural Retirement Model. Econometrica 54(3): 555-585.
Index Mundi (2013). Canada—Labor Participation Rate: Labor Force Participation Rate for Ages 15-24, female (%). Web page. Index Mundi. <http://www.indexmundi.com/facts/canada/labor-participation-rate>, as of July 19, 2013.
Kalwij, A., and F. Vermeulen (2008). Health and Labor Force Participation of Older People in Europe: What Do Objective Health Indicators Add to the Analysis? Health Economics 17: 619-638.
Loeppke, Ronald, Michael Taitel, Dennis Richling, Thomas Parry, Ronald Kessler, Pam Humel, and Doris Konicvki (2007). Health and Productivity as a Business Strategy. Journal of Occupational Research and Environmental Medicine 49(7): 712-721. <http://www.dorncompanies.com/JOEM_MSD_Pain_
study_article.pdf>, as of July 22, 2013.
Loeppke, Ronald, Michael Taitel, Vince Haufle, Thomas Parry, Ronald Kessler, and Kimberly Jinnett (2009). Health and Productivity as a Business Strategy: A Multi-Employer Study. Journal of Occupational and Environmental Medicine 51(4): 411-428.
Mitchell, J.M., and K.H. Anderson (1989). Mental Health and Labor Force Participation of Older Workers. Inquiry 26(2): 262-271.
Murillo, R.H., and C. Martinek (2011). Which Came First—Better Education or Better Health? The Regional Economist (April). <http://www.
stlouisfed.org/publications/re/articles/?id=2092>, as of July 22, 2013.
Musich, Shirley, Dan Hook, Stephanie Baener, and Dee Edington (2006). The Association of Two Productivity Measures with Health Risks and Medical Conditions in an Australian Employee Population. American Journal of Health Promotion 20(5): 353-363.

Fraser Institute d www.fraserinstitute.org
118 d Reducing Wait Times for Health Care
Or, Zeynep (2001). Exploring the Effects of Healthcare on Mortality Across OECD Countries. OECD Labour Market and Social Policy Occasional Papers, number 46. OECD. <http://www.oecd-ilibrary.org/social-issues-
migration-health/exploring-the-effects-of-health-care-on-mortality-across-oecd-
countries_716472585704>, as of July 22, 2013.
Or, Zeynap, Jia Wang, and Dean Jamison (2005). International Differences in the Impact of Doctors on Health: A Multilevel Analysis of OECD Countries. Journal of Health Economics 24(3): 531-560.
Oreopoulos, Paul, et al. (2008). Short, Medium and Long-Term Consequences of Poor Infant Health: An Analysis Using Siblings and Twins. Journal of Human Resources 43(1): 88-138.
Shain, M., and D.M. Kramer (2004). Health Promotion in the Workplace: Framing the Concept, Reviewing the Evidence. Occupational and Environmental Medicine 61: 643-648.
Sharpe, Andrew, and Alexander Murray (2011). State of the Evidence on Health as a Determinant of Productivity. CSLS Research Report 2011-04. Centre for the Study of Living Standards.
Starfield, Barbara, Leiyu Shi, Atui Grover, and James Macinko (2005). The Effects of Specialist Supply on Populations’ Health: Assessing the Evidence. Health Affairs—Web Exclusive. <http://content.healthaffairs.org/content/
early/2005/03/15/hlthaff.w5.97.short>, as of July 26, 2013.
Suhrcke, Marc, and Carmen de Pozniever (2011). The Impact of Health and Health Behaviours on Educational Outcomes in High Income Countries: A Review of the Evidence. World Health Organization Regional Office for Europe.

www.fraserinstitute.org d Fraser Institute d 119
Chapter 6
Understanding Differences in Wait TimesNadeem Esmail
IntroductionWaiting for medically necessary health care can have important conse-quences for those waiting, for their friends and family, and for the whole economy.1 Wait times can vary considerably between countries and even within countries, both at a point in time and over time (see chapter 2 for more details). To a large extent, observed variations are the result of differences in health policy approaches. This chapter seeks to illuminate how different health care policy choices influence wait time experiences, and which health care policy choices contribute to improving the timeliness (and thus the quality) of health care.
Why waiting happensWait times for universally accessible or publicly-funded health care are a major health policy issue, as well as a political concern for many OECD countries. At the same time, as discussed below, some developed countries maintain universal-access health insurance systems that do not have problems with
1 While some studies identify no significant health consequences from waiting, this may say less about the consequences of delayed care and more about how well clinical prioritization is working and the availability of effective safety valves for those who experience deterioration. The chapter by Dr. Brian Day in this volume summarizes a large number of studies identifying adverse health outcomes from waiting.

Fraser Institute d www.fraserinstitute.org
120 d Reducing Wait Times for Health Care
queues for treatment. Understanding reasons for the difference between the two groups, and the policies that seem effective in reducing wait times, requires an understanding of why queuing occurs.
Figure 6.1 provides a model of a health care system with waiting lists and wait times previously presented by Borowitz et al. (2013a), Siciliani and Hurst (2005), and Siciliani and Hurst (2003) among others. The central and relatively straightforward implication of this model is that waiting lists and wait times increase when the provision of treatment does not match the demand for publicly funded and universally accessible elective surgery. These imbalances can be temporary or transitory (as, for example, when a sudden inflow of emergency cases disrupts the flow of elective surgeries), or they can be systemic, as is the case for a number of developed nations including Canada.
As figure 6.1 shows, there are two ways to reduce waiting lists and wait times in the presence of an imbalance between the demand for health care services and the supply of those services: increase supply (outflow) or reduce demand (additions). Increasing outflow may involve increasing pub-lic sector capacity, making greater use of private sector capacity, improving productivity in either public or private settings (that is, using current capacity more efficiently), or altering provider incentives through payment reform (for example by paying per service rather than pre-funding in bulk). An alternate approach to reducing wait times, particularly in situations where the volume of services delivered is considered to be sufficient, is to reduce the demand for health care services through approaches such as increasing cost sharing for publicly insured health care, increasing access to private (and quickly delivered) service alternatives, or even explicitly limiting access to publicly insured services based on medical criteria for access to care.
Of course, some factors cannot be readily controlled. Demand for publicly funded and universally accessible health care is also partly a function of population health status (including age) and patient preferences regarding the tradeoffs between potential benefits of treatment and the potential (non-monetary) costs. Population health status and age can also affect the supply of services by medical professionals. Further, medical technologies play an important role in the inflow of patients for treatment by advancing the iden-tification and treatment of disease, expanding the range of conditions that are treatable, providing more comfortable treatment regimes and reducing pain, and offering new treatment options where none previously existed.

www.fraserinstitute.org d Fraser Institute
Chapter 6: Understanding Differences in Wait Times d 121
Figure 6.1 also shows that to be successful, any policy to reduce waiting must also respond to feedback. Because wait times have a signaling function, changes in wait times may affect both demand and supply. For example, long wait times may encourage an increase in the demand for privately funded care, lead individuals to postpone publicly funded health care until their health conditions worsen or become more severe, and reduce physician referrals and acceptance of patients. Long wait times may also lead to an increase in supply by encouraging politicians and public authorities to focus on wait times, and by encouraging providers to spend additional effort treating patients. The private sector might also be prompted to expand activity in the presence of long wait times. In the publicly funded sector, on the other hand, shorter wait times may lead to an increase in demand for publicly funded surgery, either through reduced demand for private care or through an increase in demand for care overall (including demand for treatments for less severe conditions). Empirical studies of the relationship between the demand for health care
Figure 6.1: Conceptual framework of waiting lists and waiting times for elective treatment
Source: Reproduced, with permission, from Siciliani et al., 2013.
• health status• technology• severity
thresholds• patients’
preferences• cost sharing• PHI coverage• price of private
surgery
GP assessment
Private elective treatment
• public capacity (beds, doctors)
• capacity in the private sector
• productivity (public and private)
• hospitals’ and doctors’ payment system
Emergency treatmentEmergency
arrivals
Specialist assessment
Private treatment performed
Public treatment performed
Waiting time
Referrals
Return to GP
Additions
in�ow
Treatment
out�owWaiting
list (stock)
− +−+

Fraser Institute d www.fraserinstitute.org
122 d Reducing Wait Times for Health Care
and waiting lists, while limited, show that the reaction of demand for health care to waiting lists can vary considerably between countries from little or no reaction to considerable response (Borowitz et al., 2013a).
Policies of countries that have limited waitingWhile concerns about long wait times for medically necessary treatment are found in many developed countries with universal-access health insurance systems, a number of developed nations maintain universal access insurance schemes where wait times are not a problem. They include Belgium, France, Germany, Japan, Korea, Luxembourg, the Netherlands, and Switzerland. Importantly, this group of nations does not achieve this high performance through greater spending. Rather, they do so through a greater reliance on market-mechanisms for the allocation of health care resources.
As shown in figure 6.2, on an age-adjusted share of GDP basis,2 the nations in the group of superior performers are not all clustered at the high end of the spending spectrum among developed nations with universal-access health insurance systems.3 Rather, while some are relatively high spenders, others, including Germany, Korea, and Luxembourg, are below the OECD average, while Japan stands out as the lowest relative spender. In other words, higher health care spending does not necessarily result in more timely access to health care services.
Borowitz et al. (2013a) explore several other factors that may be related to the absence of problematic or lengthy wait times for treatment. They find that wait times have a clear and negative association with the availability of acute care beds (shown on an age-adjusted basis in figure 6.3), and a less clear association with higher public health expenditures (specifically, public
2 The age-adjustment methodology used here is from Esmail and Walker (2008). Age-adjustment is based on the percent of population over age 65 in a given country relative to the average of OECD nations that maintain universal access. A complete description of the methodology is avail-able in Esmail and Walker, 2008: 17-22, with a mathematical example shown in “Box 2” on page 21.3 Borowitz et al. (2013a) find that all of these nations but Korea are above-average spenders, based on public spending in US dollars (using purchasing power parity exchange rates, or a system of exchange rates based on purchasing power, as opposed to monetary exchange rates) with no adjust-ment for population age. The comparison, in figure 6.2, which adjusts for the age of the population (older people require more care) and includes private spending (thus counting all spending on health care, not only that in the universal scheme less cost sharing), comes to a different conclusion.

www.fraserinstitute.org d Fraser Institute
Chapter 6: Understanding Differences in Wait Times d 123
spending in US dollars (using purchasing power parity exchange rates) with no adjustment for population age). Conversely, they do not find a strong rela-tionship between waiting times and physician-to-population ratios.4 They also find a high level of variation in waiting among developed nations.
4 Borowitz et al. (2013a) note this may be related to how doctors are defined in their dataset.
Figure 6.2: Total health expenditures, age-adjusted share of GDP, 2009 or nearest year
Percentage of GDP
Notes: “OECD Average” is the average of OECD nations with universal access and excludes the United States and
Mexico. Turkey is also excluded because the data available is limited.
Source: OECD, 2011; calculations by author.
0 2 4 6 8 10 12 14
CanadaNetherlands
IrelandNew Zealand
IcelandFrance
DenmarkSlovak Republic
SwitzerlandBelgium
AustriaNorway
AustraliaOECD Average
GermanyUnited Kingdom
PortugalSweden
SpainKorea
FinlandLuxembourg
GreeceCzech Republic
PolandItaly
HungaryJapan
Wait times not a signi�cant policy issue

Fraser Institute d www.fraserinstitute.org
124 d Reducing Wait Times for Health Care
Siciliani and Hurst (2003) also investigate the relationship between wait times and various measures of resource availability and public policy. Their study includes an analysis of the length of waiting in 12 countries, and an analysis of countries with and without problematic wait times. In the first analysis, they find wait times are negatively related to physician-to-population ratios and to total health expenditures per capita. That is, in countries that
Figure 6.3: Curative care hospital beds, age-adjusted per 1,000 population, 2009 or nearest year
Number of beds
Notes: “OECD Average” is the average of OECD nations with universal access and excludes the United States and
Mexico. Turkey is also excluded because the data available is limited.
Source: OECD, 2011; calculations by author.
0 1 2 3 4 5 6 7 8
Korea
Japan
Slovakia
Austria
Czech Republic
Poland
Germany
Luxembourg
Hungary
Belgium
Australia
OECD Average
Greece
France
Ireland
Netherlands
Switzerland
Denmark
United Kingdom
Portugal
Italy
Norway
Spain
Canada
Sweden
Finland
Wait times not a signi�cant policy issue
www.fraserinstitute.org d Fraser Institute
Chapter 6: Understanding Differences in Wait Times d 125
have wait times, those waits are lower where spending is higher (all else con-stant) and where physician-to-population ratios are higher.5 In the second analysis, Siciliani and Hurst (2003) find that capacity is an important predictor of problems with waiting: fewer available acute care beds is significantly asso-ciated with longer waiting lists. They also find evidence that fee-for-service remuneration for specialists (as opposed to salaries) and activity-based fund-ing (as opposed to global budgets) were associated with not having prob-lematic waiting times. Both of these approaches ensure that money follows patients and so encourage greater competition with more focus on consumers.
While the relationships between wait times and the volume of resources (either financial or physical) are important, there appears to be another dimension to the superior performance of those countries that enjoy shorter waits for health care. Specifically, the multi-nation policy review con-ducted by Esmail and Walker in 2008 reveals that nations reporting they do not have problems with waiting all pursue a more market-based set of health care policies compared to other developed nations with universal-access health care systems (see table 6.1). Each of the better-performing nations requires cost sharing or user fees for universally accessible care, employs private providers in the provision of universally accessible services, at least partially employs an output-based physician compensation model, and funds health care through a social insurance construct rather than through a public tax-financed construct. That these conditions also characterize Austria, the Czech Republic, and Greece, which report problems with waiting, suggests that additional factors may be important for delivering care without queues or for explaining why these latter nations are exceptions.
Analyzing the policiesThe absence of cost sharing for medical services results in excessive demand for those services and wasted resources.
By encouraging patients to consider the costs associated with the demands they are making on the health care system when they seek treatment,
5 The applicability of this finding to Canada is questionable. Several studies of the relationship between health expenditures and wait times in Canada find that wait times are not lower in Canada given increased expenditures. In fact, the relationship may be positive (see for example, Barua and Esmail, 2010).

Fraser Institute d www.fraserinstitute.org
126 d Reducing Wait Times for Health Care
Table 6.1: Policy Variables for OECD Nations with Universal Access prior to 2008
Cost sharing for any of hospital, GP,
or specialist care
Private ownership of hospitals
Fee-for-service compensation for specialists
Social insurance financing
Australia Yes No Yes No
Austria Yes Yes Yes Yes
Belgium Yes Yes Yes Yes
Canada No No Yes No
Czech Republic Yes Yes Yes Yes
Denmark No No Yes No
Finland Yes No No No
France Yes Yes Yes Yes
Germany Yes Yes Yes Yes
Greece Yes Yes Yes Yes
Hungary Yes No No Yes
Iceland Yes No Yes No
Ireland Yes No No No
Italy Yes Yes No No
Japan Yes Yes Yes Yes
Korea Yes Yes Yes Yes
Luxembourg Yes Yes Yes Yes
Netherlands Yes Yes Yes Yes
New Zealand Yes No No No
Norway Yes No Yes No
Poland Yes No No Yes
Portugal Yes Yes Yes No
Slovak Republic No No Yes Yes
Spain No Yes No No
Sweden Yes No Yes No
Switzerland Yes Yes Yes Yes
United Kingdom No No No No
Source: Esmail and Walker, 2008.
www.fraserinstitute.org d Fraser Institute
Chapter 6: Understanding Differences in Wait Times d 127
cost sharing both increases the cost efficiency of health care (ultimately reduc-ing total spending) and improves access to practitioners for those in need of care as demand for services is reduced through a nominal out-of-pocket charge. This is borne out by studies showing the value of cost sharing in an insurance scheme (see, for example, Ramsay, 1998; Newhouse et al., 1993). Cost sharing policies have also been shown to have minimal impacts on health outcomes as long as specific populations are exempt (Newhouse et al., 1993; Esmail and Walker, 2008).
Private ownership and private competition also promote more timely access to health care services. Importantly, the economics literature generally finds that private businesses (both for- and not-for-profit) operate more effi-ciently, at higher quality, and with a greater consumer focus than their publicly owned counterparts. Findings of studies focused on hospital care specifically are broadly consistent with those for businesses more generally (Esmail and Walker, 2008). Indeed, a recent survey of the literature on hospitals and surgical clinics finds that competition, and a blend of public and private (both for- and not-for-profit) delivery, will likely have a positive impact on some measures of health care and little impact on others (Ruseski, 2009). The survey concludes that “… a care-fully crafted policy that encourages competition among non-profit, for-profit, and public providers can result in a health care system that is fiscally sustain-able, ensures access to quality health care, and results in better health outcomes” (Ruseski, 2009: 42). The finding that private competitive provision of services is beneficial to the performance of a health care system is not surprising when one considers the incentives associated with public versus private ownership.
Kornai (1992) identified budget constraints as one of the major and unchangeable differences between private-sector businesses and government. Government budget constraints are “soft,” since governments can effectively raise capital through their taxation powers. Private-sector businesses, on the other hand, face “hard” budget constraints: if they incur sustained losses, or even a few large losses, the damage to their capital can push them into bank-ruptcy. Kornai argued that this central difference between the two types of entities can result in extraordinary differences in operations. Private-sector businesses must provide consumers with the goods and services they demand in a timely manner and at affordable prices that are consistent with their qual-ity. Government business enterprises (GBEs) do not face the same constraints. They can consistently lose money by offering goods and services whose prices
Fraser Institute d www.fraserinstitute.org
128 d Reducing Wait Times for Health Care
do not reflect their quality or timeliness. Because private enterprises face the risk of going out of business if they fail to provide good value, they will usually behave differently than their public sector counterparts, who face much lower risks of bankruptcy. Further, Megginson and Netter (2001) found that GBEs tend to develop with less capital, and thus are more labour intensive than their private-sector counterparts. That GBEs do not use an “optimal” amount of capital has negative implications for both labour and total factor productivity.
Fee-for-service compensation for specialists whereby money follows the patient for physician care also helps create more timely access to health care services. Salaried compensation lacks the incentives inherent in fee-for-service to increase the volume or quality of services delivered beyond some minimal standard. Numerous studies have shown that physicians paid under a fee-for-service model provide more services of a potentially superior quality than do physicians paid a salary (see, for example, Esmail and Walker, 2008).
Finally, and perhaps most importantly, social insurance financing plays a critical role in ensuring more timely access to medically necessary health care services. In this financing model, an organization independent from gov-ernment (or competing private organizations in Germany, the Netherlands, and Switzerland, for example) collects premiums from insured individuals (with tax support for select populations) in return for universal access health coverage. One of the central differences between a social insurance construct and a government insurance system is the de-politicization of decision mak-ing. With social insurance or statutory insurers there is a clear connection between the payment of premiums (to an insurer) and the receipt of services (funded by the insurer). The independence of providers from government makes politically-motivated intervention and resource allocation decisions much less likely, and creates a greater focus on the needs of funders and con-sumers rather than administrators and providers.
A number of examinations of the relative performance of health care systems confirm that social insurance or statutory insurance models tend to outperform government-run tax-funded approaches. For example, Esmail and Wrona (2008), in a review of access to medical technologies, note superior access to advanced medical technologies in social insurance models. Recently, Matthews et al. (2012) undertook a broad review of health systems perfor-mance analyses including those by the World Health Organization, the Health Consumer Powerhouse, Canada’s Frontier Centre for Public Policy, and the

www.fraserinstitute.org d Fraser Institute
Chapter 6: Understanding Differences in Wait Times d 129
Commonwealth Fund. They find that social insurance models consistently outperform their tax-funded government-run counterparts, delivering “qual-ity care with minimal delays at a reasonable price” (Matthews et al., 2012: 111).
Hurst and Siciliani (2003) note that as long as money follows the patient through the system (for example through fee-for-service funding of physician care and activity-based funding of hospital care), market incentives exist in social insurance systems that will reduce wait times to their economi-cally optimal level, where the marginal benefit of waiting is equal to the mar-ginal cost of doing so. This observation gets back to the point that “optimal” waiting lists and wait times are not zero. Some waiting can be economically beneficial. For example, hospital efficiency is improved when there exists a pool of elective or scheduled patients such that hospital administrators are better able to ensure that resources are being used to full capacity (maintain less excess), as they balance unpredictable emergency arrivals with more pre-dictable scheduled or elective arrivals. On the other hand, waiting lists can increase costs for care providers when resources are used to manage the list of patients waiting, for patient re-assessments, for more costly treatments, and potentially for increased cancellations or missed surgery appointments. And it is, of course, possible to take waiting too far, leading not only to lengthy queues for elective or scheduled services, but also for emergency services, as appears to be the case in Canada.
Siciliani et al. (2009) find there are no additional hospital cost savings to be had from an increase in waiting over three months in England, while the waiting times that minimized total costs were always below 10 days. Similarly, Smet (2004) finds in Belgium (where wait times are not a problem) that hospi-tals with modest wait times have lower costs. Hurst and Siciliani (2003), citing Iversen and Luras (2002), note that: “Although some competing surgeons with high reputations may build up long waiting lists there are likely to be other surgeons, with lesser reputations, who will seek to make a living by offering rapid access to procedures” (p. 20). Under government-run, tax-financed insur-ance schemes, however, where resources are often allocated by governmental rather than market approaches, incentives and mechanisms to find optimal wait times are limited or unavailable. Esmail and Wrona (2008), and McMahon and Zelder (2002), note also that the political dynamics that control the allocation of resources in government-run systems may lead to funds being directed towards areas of health care that do not necessarily serve the interests of consumers.
Fraser Institute d www.fraserinstitute.org
130 d Reducing Wait Times for Health Care
Country examplesIn this section, we look more closely at “high performing” countries in order to expand upon their health care policies as they influence waiting and access to care more generally.
Health care in SwitzerlandThe Swiss health care system6 provides universal coverage through a system of some 90 competing private not-for-profit health insurers. 7 To ensure univer-sality, insurers are required to price insurance policies using community-rated premiums and to accept all comers, while access is ensured through tax subsi-dies for those who cannot afford insurance coverage. Individuals in Switzerland not only have a choice of insurer for their individual insurance contract, but are also able to select between a limited range of premium-reducing policy options including managed care policies and higher deductible options.
Swiss citizens are expected to share in the cost of their care to a larger extent than in other developed nations. With some exceptions, minimum deductibles apply to all insurance contracts, and a 10 percent coinsurance for most services applies after the annual deductible limit has been reached. Limits to cost sharing apply, as do exemptions and reductions for certain populations.
For those not covered by managed care insurance, primary care in Switzerland is delivered largely by self-employed (private) physicians in solo practices funded on a fee-for-service basis. Nurses and group practices play a relatively small role in the provision of care. General practitioners (GPs) in Switzerland do not play a gatekeeping function for non-managed care clients, and patients are free to seek specialist care without a GP referral. Managed care plans made up nearly 47 percent of insurance contracts in 2010; in the mid-2000s, by far the most common type was plans with gatekeeping provi-sions paired with traditional fee-for-service funding. Other managed care insurers use both staff GP and group practice models, with capitation (per registered patient payment) and salary payments.
Hospital care in Switzerland is provided through either public or pri-vate hospitals, with approximately 70 percent of care provided by public or
6 This summary of the Swiss health insurance system is based on information from Camenzind, 2012; Leu et al., 2009; Lundy and Finder, 2009; and Daley et al., 2011.7 Insurance companies do not always operate nationally. In 2005, including subsidiaries of insur-ance conglomerates, the maximum number of insurers in a canton was 65.
www.fraserinstitute.org d Fraser Institute
Chapter 6: Understanding Differences in Wait Times d 131
publicly subsidized hospitals. An activity-based funding model is used to pay for hospital care in Switzerland. Physicians are typically salaried employees of the hospital, and while patients can choose the hospital they want to go to, they cannot choose an individual doctor within that hospital .
In Switzerland, people can choose to buy supplemental health insur-ance if they so desire. Dual practice is permitted in Switzerland, which means physicians can offer services in both the supplementary sector and under the universal scheme. Those who have voluntarily bought supplemental health insurance have access to many benefits not available to those relying only on the universal scheme, including private rooms, dental care, access to private providers not on the canton’s hospital list, access to services outside the policy holder’s canton, choice of doctor in hospital, and guaranteed access to senior physicians.
Health care in JapanThe Japanese health care system provides universal insurance coverage through a system of over 3,500 statutory insurance companies. 8 Individuals in Japan cannot choose their insurance company. Rather, individuals must register with (and pay income-related premiums to) a specified insurer based principally on their occupation or employment status, place of residence, and age. Taxpayer-sourced funding assists specific population groups with the cost of insurance.
Japan’s health care system, like Switzerland’s, also relies on a relatively high level of cost sharing to encourage informed decision making from those wanting health care. All health services in Japan are subject to a uniform 30 percent co-insurance rate (70 percent reimbursement), which is reduced to 20 percent for children and to 10 or 20 percent (depending on income) for those aged 75 and older. A monthly limit to payments applies, beyond which a 1 percent copayment is applied up to a higher limit. Exemptions from cost sharing apply to certain populations.
Primary care and ambulatory or outpatient physician care in Japan is based on an open-access model with free choice of provider that is free of gate-keeping. Clinics in Japan are mostly physician led, with nurses playing a relatively
8 This summary of the Japanese health insurance system is based on information from Jeong and Hurst, 2001; Kawaguchi, 2012; Matsuda, 2012; OECD, 2009; Paris et al., 2010; Tajika and Kikuchi, 2012; Tanner, 2008; and Tatara and Okamoto, 2009.

Fraser Institute d www.fraserinstitute.org
132 d Reducing Wait Times for Health Care
minor role in patient care. Multi-specialty groups or clinics are uncommon. Care is funded on a fee-for-service basis, and Japanese patients can choose either a clinic or a hospital as their first point of contact with the health system.
The Japanese hospital sector is dominated by private hospitals, with some 70 percent of hospitals and 55 percent of the total bed stock (74 percent of acute care beds) privately owned. Japanese patients have free choice of hos-pital and are not restricted (other than by financial disincentive) from seeking hospital care without referrals. Hospital care in Japan is reimbursed using an activity-based approach including payment per procedure or service, and a diagnosis-adjusted per diem (per day of hospitalization) payment known as DPC or Diagnosis Procedure Combination.
Japan’s comprehensive insurance coverage provided by statutory insur-ance companies, combined with gatekeeping-free rapid access to all levels of care, has resulted in a small market for private duplicative health insurance. While private insurers are permitted to sell coverage for goods and services included in the universal scheme, a significant market does not appear to have formed.9 Japanese voluntary health insurance typically comes in the form of complementary coverage for hospitalization or for certain health conditions/diagnoses with cash payments paid daily for hospitalizations and in a lump sum for conditions/treatments.
Health care in GermanyThe German health care system provides universal insurance coverage through a system of some 145 competing private not-for-profit statutory health insur-ance (SHI) funds and 43 private health insurance companies (24 for-profit, 19 not-for-profit). 10 Statutory health insurance is available to nearly the entire population—and is required for most. It is funded by premiums based on income, and taxpayer-sourced funding is provided to assist with coverage for specific population groups. Those earning more than €50,850 (CA$65,340)
9 The Japanese system does, however, uniquely restrict mixed billing approaches other than for those items listed in the “specified medical costs” list. Individuals purchasing certain treatments (for example, special drugs or new treatments), are prohibited from using health insurance to fund other associated health services that would otherwise be covered if the unlisted service was not used. The OECD (2009) has recommended that this ban be relaxed to improve the quality of health care services in Japan.10 This summary of the German health insurance system is based on information from Green et al., 2013; Blümel, 2012; Busse and Riesberg, 2004; Lundy and Finder, 2009; and Tanner, 2008.
www.fraserinstitute.org d Fraser Institute
Chapter 6: Understanding Differences in Wait Times d 133
can choose to remain either in the statutory scheme on a voluntary basis (most do) or, along with civil servants and the self-employed, purchase private health insurance under the lifetime underwritten (to avoid large increases in pre-mium as consumers age), risk-related (assessed upon entry), guaranteed offer insurance premiums. 11 In either case, health insurance coverage is mandatory.
Cost sharing applies to insured services throughout the health care system. For example, under the SHI scheme, patients are responsible for a €10 charge per day for hospital care and post-hospital rehabilitation treatment, a €10 payment for the first visit to a physician in a quarter and for each con-tact with other physicians seen without a referral in that same quarter, and between €5 and €10 for some prescription drugs. Insurance funds are able to offer a range of deductibles and no-claims bonuses. Limits to payments apply, as do exemptions from cost sharing for certain populations.
Primary care in Germany is largely delivered by physicians in individ-ual or dual private practices on a fee-for-service basis. While most physicians employ doctors’ assistants, multi-specialty clinics are uncommon. Individuals have free choice of doctor and are not required to have a GP referral in order to see a specialist, although incentives are used to encourage GP gatekeeping.
About half of all hospital beds in Germany are found in public hospitals (30.5 percent of hospitals), with private not-for-profit hospitals accounting for a third of beds (36.6 percent of hospitals), and private for-profits (grow-ing in number and market share since the 1990s) the remainder (32.9 percent of hospitals). Hospitals are typically staffed by salaried doctors. While many hospitals (and most university hospitals) are publicly owned, German gov-ernments have virtually no role in the direct delivery of health care. Hospital care in Germany is funded using an activity-based model that was made obligatory in 2004.
In addition to playing a primary insurance role for higher income Germans, civil servants, and the self-employed, private health insurance in Germany also provides coverage for items not covered under the SHI scheme. For example, private insurance can provide access to better amenities and cover some copayments. Further, senior doctors in hospitals can treat pri-vately insured patients on a fee-for-service basis.
11 The exchange is based on average of 2012 conversions from the Bank of Canada’s 10-year currency converter (http://www.bankofcanada.ca/rates/exchange/10-year-converter/).

Fraser Institute d www.fraserinstitute.org
134 d Reducing Wait Times for Health Care
Health care in the NetherlandsThe Dutch health care system12 provides universal insurance coverage through a system of some 2913 competing for-profit and not-for-profit private statu-tory insurance providers. To ensure universality, insurers must price insur-ance policies using community-rated premiums and accept all comers, while access is ensured through tax subsidies for select populations and those who cannot afford insurance coverage. Individuals in the Netherlands can not only choose their insurer for their individual insurance contract, they can also select between a limited range of policy options including the form of insurance payment (reimbursement or direct provider payment) and higher deductible options.
As in the case of other nations described here, cost sharing applies throughout the Dutch health insurance system, although to a much lesser extent than in Switzerland or Japan. A €350 deductible applies to all insurance contracts for those over the age of 18. GP visits and other select services are exempt from the deductible.
Primary care providers in the Netherlands are expected to play a gatekeeping role, with non-emergency access to specialists available on a GP-referral basis only. Citizens are registered with a GP of their choice and can switch without restriction. Services are provided not only by doctors, but by nurses, many of whom are employed by GPs on a salaried basis. Most GPs are independent entrepreneurs or work in a partnership, with some 51 percent of GPs working in group practices of three to seven doctors, 29 percent in two-person practices, and 20 percent in solo practices. Payment for primary care services in the Netherlands is on a blended capitation/fee-for-service basis.
Hospital care in the Netherlands is largely provided by private not-for-profit hospitals, and insurance companies are permitted to selectively contract with hospitals though this is not common in practice. The majority of hospital specialists work independently or in partnership with other specialists under an output-based compensation model, with one third of specialists salaried.
12 This summary of the Dutch health insurance system is based on information from Daley et al., 2013; Leu et al., 2009; Paris et al., 2010; Schäfer et al., 2010; Schut and Varkevisser, 2013; and Westert, 2012.13 The insurance marketplace in the Netherlands is highly concentrated, with the four largest companies together having a 90 percent market share. Twenty of the 29 insurance providers belong to one of these four companies.

www.fraserinstitute.org d Fraser Institute
Chapter 6: Understanding Differences in Wait Times d 135
Approximately 70 percent of hospital care is funded through an activity-based model (known as Diagnosis Treatment Combinations/Diagnose behandeling combinaties or DBCs) where hospitals and insurers individually negotiate payment rates for outpatient, inpatient, and specialist costs.
Voluntary health insurance in the Netherlands serves complementary and supplementary roles. Items covered include some dentistry, additional physiotherapy, and coverage for some out-of-pocket payments, though not the compulsory deductible. Most of the population purchases voluntary health insurance in addition to the statutory insurance product.
SummaryClearly, some countries rely to a larger extent on private competition and pri-vate resource allocation, and to a lesser extent on government for the opera-tion of the insurance scheme (with government taking a strong regulatory and oversight role). They seem to have done a better job of providing timely access to health care services for their citizens than nations that have relied more heavily on government for the operation of health insurance and provision of health care. Put more succinctly, health care systems that rely to a greater extent on market-based policies seem to outperform others in offering timely treatment. As the next section will show, among nations that struggle with long wait times, some have been successful in reducing wait times by imple-menting policies that either adopt or mimic market mechanisms.
Reducing wait times: Incentives matterWait times and waiting lists for health care are a major concern in a num-ber of developed nations. Waiting lists are generally found in countries with no- or low-patient-cost-sharing, constraints on surgical capacity, and public (or tax-funded and government run) health insurance (Willcox et al., 2007). However, as chapter 2 of this book showed, wait times vary considerably between nations.
Much of the difference in waiting across countries is the result of differ-ences in health care policy. Some policies are simply more effective at ensuring care is delivered in a more timely fashion. Typically, those policies are built on a model whereby “money follows the patient” in a competitive scheme that includes patient choice. Under such a regime, providers are given financial

Fraser Institute d www.fraserinstitute.org
136 d Reducing Wait Times for Health Care
incentives that ensure their priorities are better aligned with the preferences of their patients, ultimately creating a more consumer-focused approach to health care delivery.
While both supply-side and demand-side policies have proven effec-tive at reducing wait times, a combination of the two has proven to be among the more successful approaches. Examples of these approaches include care guarantees with sanctions, or care guarantees with choice and competition. Interestingly, polices appear to be successful to the extent that they incorpo-rate or mimic the incentives and allocation mechanisms that would be found in a private competitive marketplace.
Dedicated or additional fundingOne of the most common approaches to reducing wait times in developed nations that are struggling with long queues is targeted funding programs. These have simply not worked over the longer term according to OECD reviews of waiting times policies (Borowitz et al., 2013b). This outcome may seem at odds with the finding noted above that higher expenditures may be related to lower wait times. However, the failure of funding programs is easily understood when viewed from a “cause of waiting” perspective.
Critically, in the absence of other reforms, targeted funding programs are unlikely to alter the dynamics that created waiting lists in the first place. While they may add temporarily to capacity, and thus temporarily reduce queues, they will not lead to longer term improvements in efficiency and activ-ity once the funding runs out. Equally importantly, once news of increased funding and plans to reduce waiting is announced, increased demand may overwhelm any temporary increase in capacity. In fact, changes in demand may lead to longer queues once temporary funding runs out.
Further, targeted funding programs may end up focusing only on select areas of health care or select segments of waiting (as has been the case in Canada). The effect of ignoring wait times in other areas or other waits on the continuum may leave patients no better off overall. For example, tar-geted funding may focus on the booking-to-treatment segment of waiting, yet in the absence of an increase in efficiency, the result may be longer wait times in prior areas, such as the referral-to-consultation or consultation-to-booking stages. Targeted funding may also lengthen wait times in other areas of health care depending on how the funding is allocated. For example, if
www.fraserinstitute.org d Fraser Institute
Chapter 6: Understanding Differences in Wait Times d 137
hospitals receive extra funds so they can provide more care in specific areas with long wait times, it is possible that activity in other non-targeted areas will be reduced to create capacity for the more profitable service.
Financial rewards for reducing waitingFinancial or other rewards for reducing wait times is a strategy that has been employed in several nations. England, Ireland, Spain, and Australia have all provided premiums and bonuses to providers for reducing wait times. New Zealand, England, and Australia have also used increased autonomy from government bureaucrats as a reward for delivering more timely access to care.
The track record of such rewards is mixed. Importantly, Siciliani and Hurst (2005) note that hospitals may respond to such incentives either by increasing supply, or by reducing demand by blocking additional patients from joining the waiting lists. The relative attractiveness of these two options will in part depend on how health care is compensated: through activity-based funding or through global budgets. This said, financial rewards for physicians who reduced wait times in Spain may have contributed to an accelerated reduction in wait times in that country.
Rationing by prioritization and thresholdsAn alternate approach to increases in supply is to restrict access to care based on criteria measuring the severity of illness in order to focus care on those who would benefit medically the most. The corollary to this is, of course, that those who are deemed to benefit less would be denied treatment, or end up waiting longer for care. This approach has been used most notably by New Zealand, and it is sometimes offered as a superior approach to individual provider-managed queuing and rationing.
While prioritization is not really an approach to reducing wait times (or eliminating them), it does, at least in theory, attempt to organize the queue in a manner that might be considered equitable and which attempts to reduce the risk of medical harm, as those in most need would ostensibly receive care more rapidly than those in lesser need.14 However, whether this happens in practice is questionable once one considers potential gaming by physicians,
14 Prioritization criteria may include severity of condition, expected benefit, need, urgency, decay rate of disease, and time spent on the wait list (Siciliani and Hurst, 2005).

Fraser Institute d www.fraserinstitute.org
138 d Reducing Wait Times for Health Care
questions about the reliability of prioritization tools, difficulties in measuring need and potential to benefit, and variations in patient scoring and clinical thresholds. Numerous studies in Canada and other countries have shown that non-price rationing through queuing does not necessarily result in equality of access independent of ability to pay. Rather, those with higher incomes or education tend to wait less time than others (Esmail, 2009; Borowitz et al., 2013a). It is by no means certain or obvious that a program requiring physi-cians or administrators to measure the severity of illness using a standardized approach to prioritize patients in the queue would resolve these concerns.
Prioritization can, however, be paired with pre-determined thresh-olds for treatment and wait time targets in an effort to reduce wait times. By reducing the number of patients added to the wait list, this strategy can reduce waiting times for patients in the queue. This is the approach followed by New Zealand for many years in select surgical areas, where patients who meet the treatment threshold (which may be determined by financial rather than clinical constraints) are guaranteed access to surgery within six months, while those who do not are not added to the waiting list and are referred back to their general practitioner for care and monitoring. While the tools used by physicians to prioritize patients have not been without their problems, the numbers of patients awaiting specialist consultation and treatment have been reduced in New Zealand (Willcox et al., 2007; Cumming, 2013). Though full credit for this improvement cannot be given to the prioritization approach, it has likely played some role alongside increases in the volume of surgeries, the application of financial incentives and targets, and increasing attention to services management. This said, reported improvements in New Zealand may not have been entirely in the interest of patients: Willcox et al. (2007) report that more than 35,000 patients who were accepted onto waiting lists originally were removed and sent back to their general practitioner in response to finan-cial penalties imposed when the six-month waiting time targets were not met.
While important questions remain about the reliability of the scoring mechanisms and physicians’ use of them, prioritization and access controls are clearly more effective at reducing wait times than increases in funding.
Encouraging private insuranceAnother approach to reducing waiting in the public system is to encourage patients to seek care in privately funded settings, thus reducing demand

www.fraserinstitute.org d Fraser Institute
Chapter 6: Understanding Differences in Wait Times d 139
for publicly funded health care. Both Australia and Denmark have experi-mented with such policies. However, neither country appears to have mark-edly reduced waiting times in the public system through this approach. To the extent that a greater proportion of patients are receiving queue-free care in the private sector, however, wait times may be shorter for the population as a whole.
In Australia, a series of policy interventions increased private health insurance coverage from 30.5% of the population in 1999 to 44.1% in 2002, with an accompanying increase in the privately-funded share of activity. Siciliani and Hurst (2005) note that wait times reductions were observed between 1999 and 2001. However, Borowitz et al. (2013b) find that the use of public hospitals did not fall significantly, and that wait times were not reduced meaningfully.
Denmark introduced a tax exemption for private health insurance in 2002. Following this policy change along with an increase in publicly funded purchases of care from private providers, the private sector underwent a marked expansion. While private hospital activity did increase, and while public sector usage fell following the policy change, waiting times in public hospitals remained unchanged (Borowitz et al., 2013b).
Encouraging patients to seek privately funded care in the absence of policies dealing with the underlying causes of long wait times in the public sector (lack of competition, lack of appropriate financial incentives, etc.) does not appear to be a promising route to reducing wait times for publicly funded care. This is not to say, however, that privately funded care does not benefit citizens.15 Importantly, to the extent that private health care allows some individuals to receive faster care while not adversely affecting the waits for others, access to care is improved for society as a whole. Further, to the extent that such a policy assists a public health care system in managing increases in demand over time, it may help to avoid increases in waiting lists. Finally,
15 There is concern about the extent to which private activity supplants publicly funded activity by consuming limited professional resources. While the evidence for this phenomenon is not clear, and while allowing physicians to work in both public and private sectors is not uncommon in developed nations, policy approaches have been employed to mitigate this concern (Hurst and Siciliani, 2003). Another way to contend with this possible (though not proven) problem would be to employ or contract with private sector providers from abroad, as Norway, Denmark, Ireland, England, and the Netherlands do (Siciliani and Hurst, 2005).

Fraser Institute d www.fraserinstitute.org
140 d Reducing Wait Times for Health Care
changes in demand that follow such a policy are important to consider when examining public waiting lists. If demand for public health care increased fol-lowing the policy change and news of hoped-for reductions in public queues, an unchanged public waiting list would mean that more patients are receiving care in total than under the previous approach.
Activity-based funding, choice, and competitionActivity-based funding for hospital and surgical care, or systems where pay-ments are provided for patients treated based on their condition or treatment, are widely recognized to increase efficiency and productivity compared to models that fund care independently of volume, such as the global budgeting used in Canada (see, for example, Esmail, 2007). On its own, activity-based funding does not appear to have a strong impact on wait times, at least based on the experiences of Denmark and Norway (Borowitz et al., 2013b). However, when paired with choice and competition (thus creating strong incentives for providers to attract and keep patients), activity-based funding appears to have a strong impact on access to health care.
As noted above, Siciliani and Hurst (2003) found in their analysis of wait times for health care that activity-based funding was related to a lack of problematic wait times. Borowitz et al. (2013b) further note that nations with no wait times share a common characteristic: patients are able to choose freely among hospitals. Borowitz et al. also emphasize the important relation-ship between choice and competition, and activity-based funding, in lowering waiting times.
In the absence of activity-based funding, choice and competition alone likely do not create the necessary incentives for reducing wait times. Critically, while patients may be able to choose what facilities or providers they use, those providers’ finances are not improved simply because they attract more patients (through shorter waits, for example). In fact, their monetary situa-tion may worsen if their financial resources are consumed more rapidly. Thus, even if patients have more choice, providers have little incentive to reduce waiting times or to work in other efficient or effective ways to attract patients. Indeed, it may even be in a provider’s economic interest to discourage patients by having longer waits or offering fewer of the services that patients want.
Combining activity-based funding with choice and competition results in a strong incentive for providers (hospitals, surgical clinics, etc.) to

www.fraserinstitute.org d Fraser Institute
Chapter 6: Understanding Differences in Wait Times d 141
reduce wait times and provide those services that patients desire. Of course, the potential for reducing wait times, and the incentives to do so, are limited by total capacity, the extent of excess demand, and the response to increased service availability and reduced waiting. The potential for reduction is also tempered by budgetary limitations and how they are applied to hospital fund-ing. Still, the combination of market-based incentives (including choice and competition) and money following the patient is highly effective at reducing waiting.16 For example, in Denmark, free-choice policies paired with activity-based funding that fully compensated health regions for the cost of care made it profitable to keep patients within a region, and even to attract patients from other regions. The introduction of activity-based funding in Denmark was followed by a 17 percent decrease in waiting times and a 13 percent increase in surgical activity (Borowitz et al., 2013b; Siciliani and Hurst, 2005). Indeed, several countries are encouraging more choice combined with activity-based funding to motivate patients to move from areas with high wait times to those with low wait times. Those countries also provide information about wait times in order to help patients make their decisions (Siciliani and Hurst, 2005).
To the extent that the private sector is involved in the marketplace, incentives will be further enhanced as a result of greater competition, and as a result of differences in response to financial incentives between public and pri-vate providers. Further, the private sector can increase capacity in the system, thereby enhancing the benefits of choice and activity-based funding. Studies have shown a positive benefit to including private providers within an activity-based funding model, particularly if a competitive bidding process is used to determine compensation rates. For example, OECD-DFEACC notes the “pres-ence of for-profit hospitals can be associated with 2.4 percent lower hospital payments in a geographic area,” that “[p]rice competition between selectively contracted hospitals can lead to price reductions of 7 percent or more”, and that “[b]enchmarking of payment levels against most efficient hospitals can lead to a 6 percent reduction in costs at less efficient hospitals” (2006: 25). An OECD economic survey of the UK has also noted that “[i]nvolving a broader mix of providers can stimulate productivity as public and private providers learn from each other’s innovations…” (OECD, 2004: 5). More closely related
16 The same is true for physicians when comparing salaried physician care with free choice of physician under a fee-for-service compensation model. As the latter is the norm in Canada, this policy shift is not discussed here.

Fraser Institute d www.fraserinstitute.org
142 d Reducing Wait Times for Health Care
to this discussion of wait times is the fact that Spain’s successful initiative to reduce waiting times involved relying on the private sector for approximately 20 percent of the total increase in activity (Siciliani and Hurst, 2005).
It is valuable to reiterate the benefits created by combining activity-based funding and competition with the private provision of services. Indeed, when it comes to efficiency and patient-focus (including waiting times), own-ership (though an important factor) may be less important than the extent of competition. Both public and private providers are likely to be less efficient in the absence of competition, while both are likely to operate more efficiently in the presence of competition. The key advantage of introducing more private provision in health care is that it would provide greater competition, putting pressure on all providers, public and private, to operate more efficiently.
Wait time guaranteesIn recent years, the most common policy implemented by developed nations attempting to reduce wait times is the provision of a maximum waiting time guarantee. Such guarantees are often built on a combination of supply-side and demand-side policy approaches. The international experience suggests that wait time guarantees are most effective when they are comprehensive (rather than focused only on a single segment of waiting or a single surgical area), include choice of provider, the ability of patients to change providers, and rewards for providers who attract patients through more timely care (Borowitz et al., 2013b). In this sense, wait times guarantees work best when they incorporate or mimic market-type incentives, with financial penalties for providers who fail to meet consumer expectations and rewards for those who meet and exceed them.
England’s experience with wait time guarantees connected to incen-tives for providers shows the potential effectiveness of such an approach. In England, increases in funding with a focus on broad and inclusive targets for the provision of care (for example, an expectation of no more than an 18-week wait from GP referral to treatment), combined with activity-based funding, choice of provider, and competition, alongside significant consequences for hospital administrators who do not meet the targets, has resulted in the virtual elimination of long waits in that country (Smith and Sutton, 2013).
Finland is another country that has pursued a successful program of wait times reductions; it has penalized providers who failed to meet wait

www.fraserinstitute.org d Fraser Institute
Chapter 6: Understanding Differences in Wait Times d 143
time targets.17 Importantly, these penalties seem to be central to explain-ing the reduction of wait times in that country. Wait times fell considerably when fines were threatened, but increased again when the threat of fines was removed (Jonsson et al., 2013). Indeed, reviews of the Finish experience find that wait times tend to rise when the supervision of the time targets slackens (Borowitz et al., 2013b). This mirrors the experience in Denmark where the patient’s free choice of hospital (with the region that did not provide timely care paying for the care provided more rapidly in another region) likely con-tributed significantly to wait time reductions (Borowitz et al., 2013b).
Portugal has also had a positive experience with waiting time guar-antees linked to market-type incentives for providers. Portugal’s effective approach to wait time targeting has involved providing comprehensive wait time information along with choice and competition through a system of vouchers (with activity-based payment) that has allowed patients free choice of any provider, public or private, when 75 percent of the waiting time guar-antee has been reached. 18 Between 2005 and 2010, the proportion of patients waiting beyond the target time in Portugal fell markedly (by 39 percent) despite an increase in the demand for care.
Spain has also had some success in introducing market-type incentives to reduce wait times and increase surgical activity. Spain’s package of reforms included setting maximum waiting time targets, providing extra funding for additional services, contracting with the private sector, and providing financial incentives, including bonuses for specialists who achieve wait times reductions. The results were impressive: a 28 percent increase in services provided and a 68 percent decrease in average wait times between 1996 and 2000 (Siciliani and Hurst, 2005). Furthermore, while wait times had been declining for some procedures prior to the implementation of waiting list reduction measures, the rate of the decline in waiting accelerated afterwards, and the introduction of financial rewards led to further marked reductions in wait times (Siciliani and Hurst, 2005).
While wait time targets combined with market-type incentives have clearly been successful, they are not without their drawbacks, particularly
17 There is some question about the sustainability of programs based on penalties given their unpopularity with health care professionals.18 The targets in Portugal are broad and segregated into 4 priority groups (normal, priority, high priority, and urgent) for three types of treatment (general, cancer, and obesity).
Fraser Institute d www.fraserinstitute.org
144 d Reducing Wait Times for Health Care
in the details of how the guarantee is defined and how it is met in practice. Importantly, wait time targets tend to focus on those waiting for a long time. But if clinical prioritization (even among individual physicians) is working reasonably well, the consequence is that the focus will be on those who are least in need of care. This is important if, in order to meet wait times targets, care for those waiting for a long time is prioritized at the expense of longer delays for those with shorter waits (and theoretically greater need, with asso-ciated increased risks of waiting).
One response to this concern is to introduce conditions into guaran-tees. Under such an approach, the wait time target or guarantee is specific to a particular patient’s priority, which is classified either formally through a standardized tool, or less formally through broad categories, such as high or low priority, or very urgent, urgent, or non-urgent. While physician gaming of such a system may be possible, this approach, at least in theory, miti-gates concerns about the lengthening of shorter wait times for more critical patients in order to accommodate the shortening of longer wait times for less critical patients.
It is also important to focus on the entire wait time continuum rather than on one particular segment of it. In the absence of a broadly defined wait time target, it is possible for providers to meet targets, not by increas-ing throughput, but by increasing other wait times that are not targeted or measured. For example, a wait time initiative that focuses only on the wait from specialist to treatment could have the effect of increasing the wait time to see a specialist in the first place, rather than reducing overall wait times. Similarly, a focus on the booking-to-treatment wait may lead to limited access to bookings. And focusing only on particular procedures or particular groups of patients may lead to deteriorations in timeliness for those not part of the focus as resources are shifted to the areas under scrutiny.
Finally, the responses of providers to incentive schemes may also lead to undesirable outcomes. In Sweden, for example, an apparently successful program focused on increasing the proportion of patients receiving treatment within a certain time frame may not have been as beneficial to patients as the data suggest. In particular, physicians bound by the guarantee may have raised the threshold for assigning patients to the guarantee, while departments with shorter wait times did not have the highest level of output and provided the guarantee to a smaller share of patients (Siciliani and Hurst, 2005).

www.fraserinstitute.org d Fraser Institute
Chapter 6: Understanding Differences in Wait Times d 145
The Dutch miracleAs noted earlier in this chapter, the Netherlands stands out for its ability to maintain a universal-access health care system that does not struggle with queues for treatment. However, in a 2003 review of waiting times, the Netherlands was counted among nations where wait times for health care were perceived to be a problem (Siciliani and Hurst, 2003). The introduc-tion of choice and competition with activity-based funding has enabled the Netherlands to be the only nation to solve that problem between 2003 and 2013 (Borowitz et al., 2013b). Further, the Netherlands has maintained its “no waiting” status for several years, suggesting that these policies have had more than a temporary impact, and that more recent market-based reforms have also been successful in maintaining high performance.
Wait times emerged as an important policy issue in the Netherlands in the 1990s. While wait times for care in the Netherlands may not have been as long as in other countries, such as in England, they were nevertheless a concern to Dutch citizens. Initial government policies aimed at reducing wait times failed. Those early approaches focused on increasing funding, but left unchanged incen-tives for hospitals and physicians to increase their activity (Schut and Varkevisser, 2013). In the end, the policy approach that proved successful in reducing wait-ing times was a combination of activity-based funding, the lifting of the cap on hospital spending, choice and competition, and the introduction of acceptable wait times limits for different forms of care (Treek norms).
The Treek norms were broad and inclusive: six weeks for day treatment, seven weeks for inpatient treatment, and four weeks for hospital specialist diagnosis and medical assessment. Further goals were included that related to the distribution of waiting: 80 percent of patients within four weeks, five weeks, and three weeks for each of these services respectively. Interestingly, the Dutch government did not introduce a wait time guarantee out of concern for the resulting increase in bureaucracy, increase in administrative burdens, and costs of implementation (Schut and Varkevisser, 2013).
In addition to these targets, hospitals moved from fixed budgets to activity-based funding (known as a “cash on the nail” scheme in the Netherlands), and governments simultaneously abolished restrictions on the number of medical specialist positions in hospitals. The result of this shift in incentives was a rapid increase in production and a related substantial decrease in waiting times (Schut and Varkevisser, 2013).

Fraser Institute d www.fraserinstitute.org
146 d Reducing Wait Times for Health Care
It is important to note that the reductions in wait times predated the introduction of competition between statutory social insurers. However, wait times have remained low in the Netherlands throughout the adoption of a greater role for competition in the financing of health care. Today, health insurers in the Netherlands actively work to keep wait times low and have introduced schemes that seek out hospitals with short waits to be offered as alternative providers for patients. The hospitals are sometimes in other coun-tries, including Belgium, Germany, and Spain. Insurers claim that wait times have been reduced considerably as a result of these programs. For example, waits were reduced by one to two months for some 47,000 patients in 2009, while several health insurers guaranteed treatment within days for a number of medical services, and within weeks for hip and laparoscopic operations (Schut and Varkevisser, 2013; Borowitz et al., 2013b).
Why Canada’s approach has failedGiven the experience of eight developed nations that maintain universal-access health insurance without queues for treatment (Belgium, France, Germany, Japan, Korea, Luxembourg, the Netherlands, and Switzerland), and the relative success of programs seeking to reduce waiting times in countries such as England and Portugal, Canada’s failure to improve upon the state of waiting over the past decade comes as a great disappointment. According to the Fraser Institute’s annual national waiting list survey,19 Canadian waiting times rose considerably through the 1990s, then stalled there (figure 6.4). This lack of improvement comes in spite of considerable increases in health expenditure (also shown in figure 6.4).
A central part of the explanation for this lack of improvement is that Canada’s attempts to cut wait times have failed to heed the lessons from other countries described above. Specifically, Canadian governments have failed to recognize the importance of combining activity-based funding and competi-tion with patient choice, the value of broad rather than limited and specific goals, and the importance of including or mimicking market-based methods of allocating resources.
19 This study is Canada’s only source for national, comparable, and comprehensive wait times data and can provide wait times measurements from 1993 onwards for all of Canada’s 10 provinces.

www.fraserinstitute.org d Fraser Institute
Chapter 6: Understanding Differences in Wait Times d 147
Consider, for example, the Pan-Canadian Benchmark wait times (shown in table 6.2) and the billions of dollars in additional funding pro-vided by the federal government to the provinces to support reductions in wait times and improvements in access. Setting aside concerns about lengthy targets, the benchmarks were not associated with any penalties for provinces that failed to reduce wait times or meet the benchmarks. Rather, the initia-tives ended up being nothing more than simple agreements of theoretical maximum lengths of time patients should wait, accompanied by substantial increases in funding.
Further, Canada’s Pan-Canadian Benchmark wait times focused only on the specialist-to-treatment wait time and ignored wait times to see spe-cialists in the first place. They also focused only on six areas of treatment: hip and knee replacement, hip fracture repair, cataract surgery for specific patients, bypass surgery, and radiation therapy. Together these made up just one fifth of surgical cases (CIHI, 2009). This meant that 80 percent of surgical
8
10
12
14
16
18
20
20122011201020092008200720062005200420032001200019991998199719961995199419931500
1700
1900
2100
2300
2500
2700
Figure 6.4: Wait times (GP referral to treatment by specialist) and provincial/ territorial health expenditures (per capita, in�ation-adjusted to 1997 dollars), Canada, 1993 to 2012
Wee
ks w
aite
d
Note: The Fraser Institute’s waiting time measurements were produced annually except for in 2000-01 and
2001-02. These measurements have been aligned with spending data for 2000 and 2001, respectively. Spending
data for 2011 and 2012 are forecasts.
Sources: Fraser Institute (various years); CIHI, 2012.
Spen
idin
g (C
AN
$ 19
97)

Fraser Institute d www.fraserinstitute.org
148 d Reducing Wait Times for Health Care
cases fell outside explicit governmental wait time goals. Furthermore, the wait times benchmarks ignored diagnostic services.20
Provincial approaches to reducing wait times, while somewhat differ-ent from one another in detail, also largely failed to recognize the importance of market mechanisms in improving access to care. While financial incen-tives, competition, and activity-based funding saw some limited application, at least at the margin, for the most part provinces focused on bureaucratic solutions, and did not attach consequences for failing to reduce waiting times or provide financial incentives for success. Strategies pursued by countries that were successful in reducing waiting (which, as discussed above, include activity-based funding, competition, and patient choice) were often either ignored, pushed off to the future, or dismissed on grounds that they would harm the universal-access health care system.
Not surprisingly, little has improved in the Canadian health care system under this regime. For example, the Canadian Institute for Health Information reported in 2009 that surgical activity within wait time priority
20 In practice, several provinces took the further step of including in their focus the wait times for diagnostic services (included as a priority area for wait times reduction under the 2004 Health Accord but without an identified Pan-Canadian Benchmark wait time) and a broad range of medi-cal services from specialist to treatment. However, nearly all ignored the wait times incurred to see a specialist in the first place.
Table 6.2: Pan-Canadian Benchmarks for Wait TimesService Benchmark
Coronary artery bypass graft (CABG) Level I (urgent) within 2 weeks/Level II (semi-urgent) within 6 weeks/ Level III (elective) within 26 weeks
Cataract surgery Within 16 weeks for patients at high risk
Hip replacement Within 26 weeks
Knee replacement Within 26 weeks
Hip fracture fixation Within 48 hours
Radiation therapy Within 4 weeks
Note: According to the Canadian Institute for Health Information, Benchmarks are "evidence-based goals each prov-
ince or territory will strive to meet, while balancing other priorities aimed at providing quality care to Canadians. Bench-
marks express the amount of time that clinical evidence show is appropriate to wait for a procedure." (CIHI, nd)
Source: Saskatchewan Surgical Care Network, nd; CIHI, nd.
www.fraserinstitute.org d Fraser Institute
Chapter 6: Understanding Differences in Wait Times d 149
areas increased some 8 percent after adjustments for population growth and ageing between 2004/05 and 2007/08. However, the age and population-adjusted rate of surgery in other areas remained about the same, suggesting little to no improvement for patients who were outside the focus of Canada’s governments. Further, Esmail et al. (2012) determined that (broadly defined) areas of the health care system that were focused on by government since 2004 had either improved or remained unchanged by the end of the decade, while areas outside of government focus all deteriorated.
ConclusionInternational experience supports the view that market-based policies, or policies that mimic market mechanisms, can reduce wait times. On the other hand, approaches that do not incorporate or mimic market mechanisms have little success in reducing wait times despite the increased expenditures that often accompany them. This is both to the detriment of those in need of care and to those who fund the health care system.
Eight developed nations have adopted this lesson to a greater extent than others and managed to deliver universal access to care without queues for treatment. Belgium, France, Germany, Japan, Korea, Luxembourg, the Netherlands, and Switzerland all employ choice and competition in the deliv-ery of services and require consumers to share the costs of their health care. Furthermore, all of these nations employ a social insurance construct for the funding and operation of health care which serves to depoliticize health care decision making and create a clearer connection between the payment for services and the provision of those services.
If Canadians want to enjoy more timely access to health care services, they must adopt more market-oriented policy approaches for the allocation of health care resources. Failure to do so will continue to condemn the country’s denizens to long wait times for medically necessary care.

Fraser Institute d www.fraserinstitute.org
150 d Reducing Wait Times for Health Care
References
Barua, Bacchus, and Nadeem Esmail (2010). Spend More, Wait Less? Fraser Forum (February): 16–17, 26.
Blümel, Miriam (2012). The German Health Care System, 2012. In Sarah Thomson, Robin Osborn, David Squires, and Miraya Jun (eds.). International Profiles of Health Care Systems, 2012. (Commonwealth Fund): 46–52.
Borowitz, Michael, Valerie Moran, and Luigi Siciliani (2013a). Waiting Times for Health Care: A Conceptual Framework. InLuigi Siciliani, Michael Borowitz, and Valerie Moran (eds.). Waiting Time Policies in the Health Sector: What Works? (OECD Health Policy Studies): 19–32.
Borowitz, Michael, Valerie Moran, and Luigi Siciliani (2013b). A Review of Waiting Times Policies in 13 OECD Countries. In Luigi Siciliani, Michael Borowitz, and Valerie Moran (eds.). Waiting Time Policies in the Health Sector: What Works? (OECD Health Policy Studies): 49–68.
Busse, Reinhard, and Annette Riesberg (2004). Health Care Systems in Transition: Germany. European Observatory on Health Systems and Policies.
Camenzind, Paul (2012). The Swiss Health Care System, 2012. In Sarah Thomson, Robin Osborn, David Squires, and Miraya Jun (eds.). International Profiles of Health Care Systems, 2012. (Commonwealth Fund): 99–105.
Canadian Institute for Health Information [CIHI] (no date). Benchmarks for treatment and wait time trending across Canada. <http://waittimes.cihi.ca/All>, as of July 25, 2013.
Canadian Institute for Health Information [CIHI] (2012). National Health Expenditure Trends, 1975–2012. CIHI.
Canadian Institute for Health Information [CIHI] (2009). Surgical Volume Trends, 2009: Within and Beyond Wait Time Priority Areas. CIHI.
www.fraserinstitute.org d Fraser Institute
Chapter 6: Understanding Differences in Wait Times d 151
Cumming, Jacqueline (2013). New Zealand. In Luigi Siciliani, Michael Borowitz, and Valerie Moran (eds.). Waiting Time Policies in the Health Sector: What Works? (OECD Health Policy Studies): 201–220.
Daley, Claire, James Gubb, Emily Clarke, and Elliod Bidgood (2013). Health Care Systems: The Netherlands. Civitas. Original paper by Daley and Gubb, updated in 2011 by Clarke, and in 2013 by Bidgood.
Daley, Claire, James Gubb, and Emily Clarke (2011). Health Care Systems: Switzerland. Civitas. Original paper by Daley and Gubb published 2007, updated in 2011 by Clarke.
Durand-Zaleski, Isabelle (2012). The French Health Care System, 2012. In Sarah Thomson, Robin Osborn, David Squires, and Miraya Jun (eds.). International Profiles of Health Care Systems, 2012. (Commonwealth Fund): 39–45.
Esmail, Nadeem (2009). Waiting Your Turn: Hospital Waiting Lists in Canada, 2009 edition. Fraser Institute.
Esmail, Nadeem (2007). More Efficient and Higher Quality Hospital Care through Better Incentives. Fraser Forum, June: 22–25.
Esmail, Nadeem, and Dominika Wrona (2008). Medical Technology in Canada. Fraser Institute.
Esmail, Nadeem, and Michael Walker (2008). How Good is Canadian Health Care? 2008 edition. Fraser Institute.
Esmail, Nadeem, Milagros Palacios, and Niels Veldhuis (2012). Canadian Federal Health Transfers to the Provinces, 2012 edition. Fraser Alert. Fraser Institute. <http://www.fraserinstitute.org/research-news/display.aspx?id=18135>, as of July 18, 2013.
Forget, Evelyn L., Raisa Deber, and Leslie L. Roos (2002). Medical Savings Accounts: Will they Reduce Costs? Canadian Medical Association Journal 167(2): 143–147.

Fraser Institute d www.fraserinstitute.org
152 d Reducing Wait Times for Health Care
Fraser Institute (various years). Waiting Your Turn: Hospital Waiting Lists in Canada. Fraser Institute.
Green, David, and Benedict Irvine, Emily Clarke, and Elliot Bidgood (2013). Health Care Systems: Germany. Civitas. Original paper by Green and Irvine published 2002, updated in 2012 by Clarke, and in 2013 by Bidgood.
Health Canada (2004). A 10-year Plan to Strengthen Health Care.” Health Canada. <http://www.hc-sc.gc.ca/hcs-sss/delivery-prestation/fptcollab/2004-fmm-
rpm/index-eng.php>, as of July 19, 2013. (Last updated May 9, 2006.)
Hurst, Jeremy, and Luigi Siciliani (2003). Tackling Excessive Waiting Times for Elective Surgery: A Comparison of Policies in Twelve OECD Countries. OECD Health Working Papers, number 6. Organisation for Economic Cooperation and Development.
Iversen, Tor, and Hilde Luras (2002). Waiting Times as a Competitive Device: An Example from General Medical Practice. International Journal of Health Care Finance and Economics 2: 189–204.
Jeong, Hyoung-Sun, and Jeremy Hurst (2001). An Assessment of the Performance of the Japanese Health Care System. OECD Labour Market and Social Policy Occasional Papers, number 56. Organisation for Economic Cooperation and Development.
Jonsson, Pia Maria, Pirjo Häkkinen, Jutta Järveli, and Jukka Kärkkäinen (2013). Finland. In Luigi Siciliani, Michael Borowitz, and Valerie Moran (eds.). Waiting Time Policies in the Health Sector: What Works? (OECD Health Policy Studies): 133–146.
Kawaguchi, Hiroyuki (2012). Unique Mixtures of Public and Private Funding in Japan—The Ban on Billing for Mixed Medical Care Service. Public Policy Review 8(2): 145–170.
Kornai, Janos (1992). The Socialist System: The Political Economy of Communism. Princeton University Press.

www.fraserinstitute.org d Fraser Institute
Chapter 6: Understanding Differences in Wait Times d 153
Leu, Robert E., Frans F.H. Rutten, Werner Brouwer, Pius Matter, and Christian Rütschi (2009). The Swiss and Dutch Health Insurance Systems: Universal Coverage and Regulated Competitive Insurance Markets. The Commonwealth Fund.
Lundy, Janet, and Benjamin D. Finder (2009). Cost Sharing for Health Care: France, Germany, and Switzerland. Kaiser Family Foundation.
Matsuda, Ryozo (2012). The Japanese Health Care System, 2012. In Sarah Thomson, Robin Osborn, David Squires, and Miraya Jun (eds.). International Profiles of Health Care Systems, 2012. Commonwealth Fund.
Matthews, Robert B., G. Keith Jenkins, and Joey Robertson (2012). Health Care Reform: Why Not Best Practices? American Journal of Health Sciences 3(1): 97–114.
McGurran, John J. (2013). Canada. In Luigi Siciliani, Michael Borowitz, and Valerie Moran (eds.). Waiting Time Policies in the Health Sector: What Works? (OECD Health Policy Studies): 99–113.
McMahon, Fred, and Martin Zelder (2002). Making Health Spending Work. Public Policy Sources, number 54. Fraser Institute.
Megginson, William L., and Jeffery M. Netter (2001). From State to Market: A Survey of Empirical Studies on Privatization. Journal of Economic Literature 39(2): 321–89.
Newhouse, Joseph P., and the Insurance Experiment Group (1993). Free for All? Lessons from the RAND Health Insurance Experiment. Harvard University Press.
Organisation for Economic Cooperation and Development [OECD] (2011). Health at a Glance 2011: OECD Indicators. OECD.
Organisation for Economic Cooperation and Development [OECD] (2009). OECD Economic Surveys: Japan 2009. OECD.

Fraser Institute d www.fraserinstitute.org
154 d Reducing Wait Times for Health Care
Organisation for Economic Cooperation and Development [OECD] (2004). OECD Economic Survey of the United Kingdom 2004: Activity-Based Funding, Incentives and Waiting Times in Health Care. OECD.
OECD Directorate for Financial and Enterprise Affairs Competition Committee [OECD-DFEACC] (2006). Competition in the Provision of Hospital Services. Organisation for Economic Cooperation and Development.
Paris, Valérie, Marion Devaux, and Lihan Wei (2010). Health Systems Institutional Characteristics: A Survey of 29 OECD Countries. OECD Health Working Papers, number 50. Organisation for Economic Cooperation and Development.
Ramsay, Cynthia (1998). Medical Savings Accounts: Universal, Accessible, Portable, Comprehensive Health Care for Canadians. Critical Issues Bulletin. Fraser Institute.
Ringard, Ånen, and Terje P. Hagen (2011). Are Waiting Times for Hospital Admissions Affected by Patients’ Choices and Mobility? BMC Health Services Research 11: 170.
Roos, Noralou P., Evelyn Forget, Randy Walld, and Leonard MacWilliam (2004). Does Universal Comprehensive Insurance Encourage Unnecessary Use? Evidence from Manitoba says “No.” Canadian Medical Association Journal 170(2): 209–214.
Ruseski, Jane E. (2009). Competition in Canadian Health Care Service Provision: Good, Bad, or Indifferent? SPP Research Papers: The Health Series 2(4). University of Calgary School of Public Policy.
Saskatchewan Surgical Care Network (no date). Pan Canadian Benchmarks for Surgery, Target Dates for Achievement. <http://www.sasksurgery.ca/pdf/
Benchmarks_Summary.pdf>, as of July 25, 2013.
Schäfer, Willemijn, Madelon Kroneman, Wienke Boerma, Michael van den Berg, Gert Westert, Walter Devillé, and Ewout van Ginneken (2010). The
www.fraserinstitute.org d Fraser Institute
Chapter 6: Understanding Differences in Wait Times d 155
Netherlands: Health System Review. Health Systems in Transition 12(1). (European Observatory on Health Systems and Policies): 183–199.
Schut, Frederik T., and Marco Varkevisser (2013). The Netherlands. In Luigi Siciliani, Michael Borowitz, and Valerie Moran (eds.). Waiting Time Policies in the Health Sector: What Works? OECD Health Policy Studies.
Siciliani, Luigi, and Jeremy Hurst (2005). Tackling Excessive Waiting Times for Elective Surgery: A Comparative Analysis of Policies in 12 OECD Countries. Health Policy 72: 201–215.
Siciliani, Luigi, and Jeremy Hurst (2003). Explaining Waiting Times Variations for Elective Surgery across OECD Countries. OECD Health Working Papers, number 7. Organisation for Economic Cooperation and Development.
Siciliani, Luigi, Anderson Stanciole, and Rowena Jacobs (2009). Do Waiting Times Reduce Hospital Costs? Journal of Health Economics 28: 771–780.
Siciliani, Luigi, Michael Borowitz, and Valerie Moran, eds. (2013). Waiting Time Policies in the Health Sector: What Works? OECD Health Policy Studies. OECD. <http://dx.doi.org/10.1787/9789264179080-en>.
Smet, Mike (2004). Multi-product Costs and Standby Capacity Derived from Queuing Theory: The Case of Belgian Hospitals. Applied Economics 36(13): 1475–1487.
Smith, Peter C., and Matt Sutton (2013). United Kingdom. In Luigi Siciliani, Michael Borowitz, and Valerie Moran (eds.). Waiting Time Policies in the Health Sector: What Works? (OECD Health Policy Studies): 293–323.
Tajika, Eiji, and Jun Kikuchi (2012). The Roles of Public and Private Insurance for the Health-care Reform of Japan. Public Policy Review 8(2): 123–144.
Tanner, Michael (2008). The Grass Is Not Always Greener: A Look at National Health Care Systems Around the World. Policy Analysis, number 613. Cato Institute.

Fraser Institute d www.fraserinstitute.org
156 d Reducing Wait Times for Health Care
Tatara, Kozo, and Etsuji Okamoto (2009). Japan: Health System Review. Health Systems in Transition 11(5). European Observatory on Health Systems and Policies.
Westert, Gert (2012). The Dutch Health Care System, 2012. In Sarah Thomson, Robin Osborn, David Squires, and Miraya Jun (eds.). International Profiles of Health Care Systems, 2012. (Commonwealth Fund): 72–78.
Willcox, Sharon, Mary Seddon, Stephen Dunn, Rhiannon Tudor Edwards, Jim Pearse, and Jack V. Tu (2007). Measuring and Reducing Waiting Times: A Cross-National Comparison of Strategies. Health Affairs 26(4): 1078–1087.

www.fraserinstitute.org d Fraser Institute
Reducing Wait Times for Health Care d 157
About the authors
Brian DayBrian Day was born in Liverpool, England and graduated in medi-
cine at the University of Manchester in 1970. He obtained specialist
qualifications in both internal medicine and general surgery before
moving to Canada, where he completed his orthopaedic training.
He is a Fellow of the Royal Colleges of Surgeons of Canada and
England and the American Academy of Orthopaedic Surgeons.
After further training in Switzerland, he practised in the field of orthopaedic trauma,
and introduced some of the minimally invasive techniques for fracture treatment to
Canada. He is Associate Professor at the University of British Columbia. He has been
a visiting professor at many universities and learned societies and has published over
150 scientific articles. In 1984, his collaborative work with a group of biomedical engin-
eers resulted in the development of “Arthrobot,” the world’s first surgical robot, which
received world-wide acclaim and was featured in National Geographic.
Dr. Day has specialized in the surgical treatment of sports injuries and is a past
president of the Arthroscopy Association of North America, the world’s leading aca-
demic society in that field. He has treated many world-class athletes. He is the founder,
president, and CEO of Cambie Surgeries Corporation, a company that in 1995 opened
the first private, for-profit hospital of its type in Canada. Maclean’s magazine has
described him as “an iconoclast, whose time is now.” Dr. Day is a former president of
the Canadian Medical Association. He is the only orthopaedic surgeon in its 145-year
history to have served as president. Dr. Day was named to the Globe and Mail’s annual
“Power 50,” in 2012, which ranked the players with the influence and desire to affect
sport in Canada during that year.
Nadeem EsmailNadeem Esmail is Director of Health Policy Studies at the Fraser
Institute. He completed his BA (Honours) in Economics at the
University of Calgary and received an MA in Economics from the
University of British Columbia. He has written or co-authored over 30
comprehensive studies and over 150 articles on a wide range of health
care topics including waiting lists, international comparisons of health
care systems, hospital report cards, medical technology, and the shortage of physicians.

Fraser Institute d www.fraserinstitute.org
158 d Reducing Wait Times for Health Care
Steven GlobermanSteven Globerman is the Kaiser Professor of International Business,
Director of the Center for International Business at Western
Washington University, and a Fraser Institute senior fellow. Previously,
he held tenured appointments at Simon Fraser University and York
University and has been a visiting professor at the University of
California, University of British Columbia, Stockholm School of
Economics, Copenhagen School of Business, and the Helsinki School of Economics. He
has published more than 150 articles and monographs and is the author of the book The
Impacts of 9/11 on Canada-U.S. Trade as well as a textbook on international business
management. In the early 1990s, he was responsible for coordinating Fraser Institute
research on the North American Free Trade Agreement. In addition, Dr. Globerman has
served as a researcher for two Canadian Royal Commissions on the economy as well as
a research advisor to Investment Canada on the subject of foreign direct investment. He
has also hosted management seminars for policymakers across North America and Asia.
Dr. Globerman was a founding member of the Association for Cultural Economics and is
currently a member of the American and Canadian Economics Associations, the Academy
of International Business, and the Academy of Management. He earned his B.A. in eco-
nomics from Brooklyn College, his M.A. from the University of California, Los Angeles,
and his Ph.D. from New York University.
David R. HendersonDavid R. Henderson is an associate professor of economics at the
Naval Postgraduate School in Monterey, California, a research fellow
with the Hoover Institution at Stanford University, and a Fraser
Institute senior fellow. Professor Henderson is a widely respected pub-
lic policy expert and educator. He is also the editor of The Concise
Encyclopedia of Economics, a comprehensive but accessible summary
of economics. Born and raised in Canada, Professor Henderson earned a B.Sc. degree in
mathematics from the University of Winnipeg before heading south to complete his Ph.D.
in economics at the University of California, Los Angeles. He is a frequent contributor to
the Wall Street Journal and was previously a frequent contributor to Fortune. He has also
written scholarly articles for the Journal of Policy Analysis and Management, Journal of
Monetary Economics, Cato Journal, Regulation, Contemporary Policy Issues, and Energy
Journal. Professor Henderson served as a senior economist on President Reagan’s Council
of Economic Advisers from 1982 to 1984, specializing in energy and health policy.

www.fraserinstitute.org d Fraser Institute
Reducing Wait Times for Health Care d 159
Acknowledgments
The authors wish to thank the Lotte & John Hecht Memorial Foundation for generously
funding this project. They also wish to thank the referees for their helpful comments
and critiques on earlier drafts of this study. The authors take full responsibility for
any remaining errors or omissions. The views expressed in this book do not neces-
sarily reflect the views of the supporters, trustees, or other staff of the Fraser Institute.

Fraser Institute d www.fraserinstitute.org
160 d Reducing Wait Times for Health Care
Publishing information
Distribution These publications are available from <http://www.fraserinstitute.org> in
Portable Document Format (PDF) and can be read with Adobe Acrobat® or Adobe
Reader®, versions 7 or later. Adobe Reader® X, the most recent version, is available
free of charge from Adobe Systems Inc. at <http://get.adobe.com/reader/>. Readers
who have trouble viewing or printing our PDF files using applications from other
manufacturers (e.g., Apple’s Preview) should use Reader® or Acrobat®.
Ordering publications For information about ordering the printed publications of
the Fraser Institute, please contact the publications coordinator via:
• e-mail: [email protected]
• telephone: 604.688.0221 ext. 580 or, toll free, 1.800.665.3558 ext. 580
• fax: 604.688.8539.
Media For media enquiries, please contact our Communications Department:
• 604.714.4582
• e-mail: [email protected].
• website: http://www.fraserinstitute.org.
Copyright Copyright© 2013 by the Fraser Institute. All rights reserved. No part of
this publication may be reproduced in any manner whatsoever without written per-
mission except in the case of brief passages quoted in critical articles and reviews.
Date of issue October 2013
ISBN 978-0-88975-269-6
Printed and bound in Canada.
Citation Globerman, Steven (2013). Reducing Wait Times for Health Care: What
Canada Can Learn from Theory and International Experience. Fraser Institute.
Cover design and artwork Bill C. Ray
Credits for cover ©Franck Boston, Bigstock (female doctor with …)
©leaf, Bigstock (row of multiethnic people …)
www.fraserinstitute.org d Fraser Institute
Reducing Wait Times for Health Care d 161
Supporting the Fraser Institute
To learn how to support the Fraser Institute, please contact:
• Development Department, Fraser Institute,
Fourth Floor, 1770 Burrard Street,
Vancouver, British Columbia, V6J 3G7 Canada
• telephone, toll-free: 1.800.665.3558 ext. 586
• e-mail: [email protected].
Lifetime patronsFor their long-standing and valuable support contributing to the success of the Fraser
Institute, the following people have been recognized and inducted as Lifetime Patrons
of the Fraser Institute.
Sonja Bata
Charles Barlow
Ev Berg
Art Grunder
Jim Chaplin
Serge Darkazanli
John Dobson
Raymond Heung
Bill Korol
Bill Mackness
Fred Mannix
Jack Pirie
Con Riley
Catherine Windels

Fraser Institute d www.fraserinstitute.org
162 d Reducing Wait Times for Health Care
Purpose, funding, and independence
The Fraser Institute provides a useful public service. We report objective information
about the economic and social effects of current public policies, and we offer evidence-
based research and education about policy options that can improve the quality of life.
The Institute is a non-profit organization. Our activities are funded by charitable
donations, unrestricted grants, ticket sales, and sponsorships from events, the licens-
ing of products for public distribution, and the sale of publications.
All research is subject to rigorous review by external experts, and is conducted and
published separately from the Institute’s Board of Trustees and its donors.
The opinions expressed by the authors are those of the individuals themselves, and
do not necessarily reflect those of the Institute, its Board of Trustees, its donors and
supporters, or its staff. This publication in no way implies that the Fraser Institute, its
trustees, or staff are in favour of, or oppose the passage of, any bill; or that they sup-
port or oppose any particular political party or candidate.
As a healthy part of public discussion among fellow citizens who desire to improve
the lives of people through better public policy, the Institute welcomes evidence-
focused scrutiny of the research we publish, including verification of data sources,
replication of analytical methods, and intelligent debate about the practical effects of
policy recommendations.

www.fraserinstitute.org d Fraser Institute
Reducing Wait Times for Health Care d 163
About the Fraser Institute
Our vision is a free and prosperous world where individuals benefit from greater choice,
competitive markets, and personal responsibility. Our mission is to measure, study,
and communicate the impact of competitive markets and government interventions
on the welfare of individuals.
Founded in 1974, we are an independent Canadian research and educational organ-
ization with locations throughout North America and international partners in over
85 countries. Our work is financed by tax-deductible contributions from thousands of
individuals, organizations, and foundations. In order to protect its independence, the
Institute does not accept grants from government or contracts for research.
Nous envisageons un monde libre et prospère, où chaque personne bénéficie d’un plus
grand choix, de marchés concurrentiels et de responsabilités individuelles. Notre mis-
sion consiste à mesurer, à étudier et à communiquer l’effet des marchés concurrentiels
et des interventions gouvernementales sur le bien-être des individus.
Peer review—validating the accuracy of our researchThe Fraser Institute maintains a rigorous peer review process for its research. New
research, major research projects, and substantively modified research conducted by
the Fraser Institute are reviewed by a minimum of one internal expert and two external
experts. Reviewers are expected to have a recognized expertise in the topic area being
addressed. Whenever possible, external review is a blind process.
Commentaries and conference papers are reviewed by internal experts. Updates
to previously reviewed research or new editions of previously reviewed research
are not reviewed unless the update includes substantive or material changes in the
methodology.
The review process is overseen by the directors of the Institute’s research depart-
ments who are responsible for ensuring all research published by the Institute passes
through the appropriate peer review. If a dispute about the recommendations of the
reviewers should arise during the Institute’s peer review process, the Institute has an
Editorial Advisory Board, a panel of scholars from Canada, the United States, and
Europe to whom it can turn for help in resolving the dispute.

Fraser Institute d www.fraserinstitute.org
164 d Reducing Wait Times for Health Care
Prof. Terry L. Anderson
Prof. Robert Barro
Prof. Michael Bliss
Prof. Jean-Pierre Centi
Prof. John Chant
Prof. Bev Dahlby
Prof. Erwin Diewert
Prof. Stephen Easton
Prof. J.C. Herbert Emery
Prof. Jack L. Granatstein
Prof. Herbert G. Grubel
Prof. James Gwartney
Prof. Ronald W. Jones
Dr. Jerry Jordan
Prof. Ross McKitrick
Prof. Michael Parkin
Prof. Friedrich Schneider
Prof. Lawrence B. Smith
Dr. Vito Tanzi
* deceased; † Nobel Laureate
Editorial Advisory Board
Members
Prof. Armen Alchian*
Prof. James M. Buchanan* †
Prof. Friedrich A. Hayek* †
Prof. H.G. Johnson*
Prof. F.G. Pennance*
Prof. George Stigler* †
Sir Alan Walters*
Prof. Edwin G. West*
Past members