Reducing the UK’s carbon footprint and managing competitiveness risks


2
REDUCING THE WATER FOOTPRINT OF THE GLOBAL COTTON-TEXTILE INDUSTRY
TOWARDS THE UN-SDGs
Dr. Frank-Andreas Weber (FiW) and InoCottonGROW Project Team
February 20th, 2019

3
MID-TERM CONFERENCE AT UNIVERSITY OF AGRICULTURE, FAISALABAD

4
COOPERATION PARTNERS

5
COTTON-TEXTILE VALUE CHAIN
Germany Pakistan
Population 82 million 208 million
Cotton Production - 1.8 million tons
People employed in Cotton Textile-Retailing Value Chain
94‘000 > 25 million
Import of Textiles and Clothing
42 Billion EUR (1.3 Billion EUR directly from Pakistan)
Turnover of Textile Retailing Business
63 Billion EUR -
UN-SDG 6 “Clean Water and Sanitation” and related Targets in 2015 (UN-STAT 2018, https://unstats.un.org/sdgs/)
6.1.1 Population using safely managed drinking water 99.2 % 35.6 %
6.3.2 River water bodies with good ambient water quality 35.1 % No data
6.4.2 Level of water stress 41.5 % 102.5 %
3.9.2 Mortality due to unsafe water and sanitation per 100,000 population 0.6 19.6
2.1.1 Prevalence of undernourishment <2.5% 19.9%
(?)

6
WASTEWATER TREATMENT AND WATER QUALITY
Due to public pressure, brands are increasingly demanding their producers to comply with environmental standards.
ZDHC (2016) OEKO-TEX (2017) GOTS (2014)
7
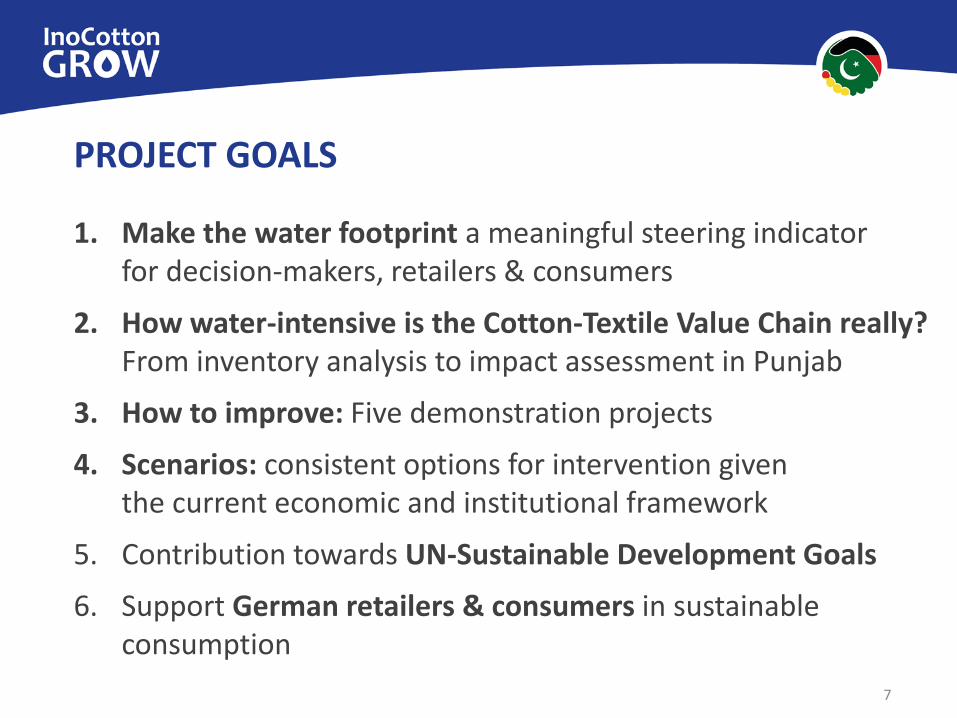
PROJECT GOALS
1. Make the water footprint a meaningful steering indicator for decision-makers, retailers & consumers
2. How water-intensive is the Cotton-Textile Value Chain really? From inventory analysis to impact assessment in Punjab
3. How to improve: Five demonstration projects
4. Scenarios: consistent options for intervention given the current economic and institutional framework
5. Contribution towards UN-Sustainable Development Goals
6. Support German retailers & consumers in sustainable consumption

8
WATER FOOTPRINT AS A STEERING INDICATOR
Impact Assessment: Cause-Effect Chains
Contributing to UN-SDGs
Water Scarcity
Water Pollution
Hu
man
H
eal
th
Intervention Strategies
Scenarios:
0. Business as Usual
1. Optimize the current system
2. Many pennies make a dollar
3. Think big
4. Regional shifting of water or crops
5. Quality instead of quantity
Inventory Analysis
Water Scarcity
Water Pollution
Eco
syst
em
D
amag
e
Options for WF Reduction
Water Footprint Methodology Policy Scenarios
Demonstrations:
1. Advanced irrigation techniques & scheduling
2. Textile machinery
3. Advanced dyestuff
4. Wastewater treatment
5. Montoring and pollution control

9
IMPACT ASSESSMENT: CAUSE-EFFECT CHAINS
Water Scarcity Water Pollution
Hu
man
He
alth
(CE1) Impact of water scarcity on loss of yield and malnutrition
(CE2) Impact of water pollution on drinking water quality
Eco
syst
em
Dam
age
(CE3) Impact of water scarcity on damage to freshwater ecosystems
(CE4) Impact on river water quality and toxicity to aquatic ecosystems
© F
iW
© F
iW
© F
iW
Kal
ho
ro e
t al
(2
01
6):
K
otr
i Bar
Rag
e

10
Land-Use in Rechna Doab: (2012)
Cotton
Rice
Dr. Usman (2018)
Land-Use Land-Cover Mapping (2005-2017)
Bas
emap
: Op
enSt
reet
Map
Multan
Lahore
(M1) SATELLITE REMOTE SENSING
• MODIS NDVI: 250 m resolution
• Sentinel 1 & 2: 20 m resolution
• Ground truthing: 1400 locations
• Both unsupervised and machine learning techniques
Cotton in Punjab province: 2.35 ± 0.21 million ha (47% of cultivated irrigated land)

11
Bas
emap
: Op
enSt
reet
Map
(M6) TEXTILE MILLS AND WASTEWATER IN LCC AREA
Central Drains
85 Textile processing mills in larger Faisalabad, approx. 10 with installed wastewater treatment
Multan
Lahore
Foto
: © F
iW
Baumann & Ferox (2018)

12
(M5) COTTON FARMERS IN WARABANDI SYSTEM FACE-TO-FACE INTERVIEWS WITH 152 + 69 FARMERS
Average (Range)
Age 42 (19 - 80)
Schooling 10 years (0 – 19)
Land ownership 2 ha (0 – 40 ha)
Net income 1768 €/a (177 - 42440 €/a)
Water shortage 70% experience water shortages (mainly April/May and winter)
Water theft 26% complain when upstream farmers use more water than allowed in Warabandi system
Raw Cotton Yield 2499 kg/ha ± 1500 kg/ha
Groundwater abstraction in Kharif
184 mm ± 27 mm
Ph
oto
: © F
iW
Zimmermann et al. (2018) and Usman et al. (2017) Ph
oto
: © Z
imm
erm
ann

13 Becker et al. (2019)
(M3) HYDROLOGIC SWAT MODEL IN LCC AREA CROP IRRIGATION IN KHARIF SEASON (MEAN 2004-2013)
Runoff 80 mm
Cotton All other Kharif crops Net irrigation demand 519 mm
Net irrigation demand 406 mm
Depletion of soil moisture: 82 mm
Percolation 97 mm
Percolation 135 mm
Depletion of soil moisture: 15 mm
Precipitation 374 mm
ETact 782 mm
ETact 550 mm
Precipitation 381 mm
Canal and Field Application Losses
GW pumping 199 mm
GW pumping 36 mm
Punjab Irrigation Department: Canal Entitlement 320 mm

14
(M3) DEMAND FOR COTTON IRRIGATION
0
50
100
150
200
Apr May Jun Jul Aug Sep Oct
Irri
gati
on
Rat
e [
mm
]
Canal Water Entitlement by Punjab Irrigation
Additional Irrigation Demand (Groundwater Abstraction)
15
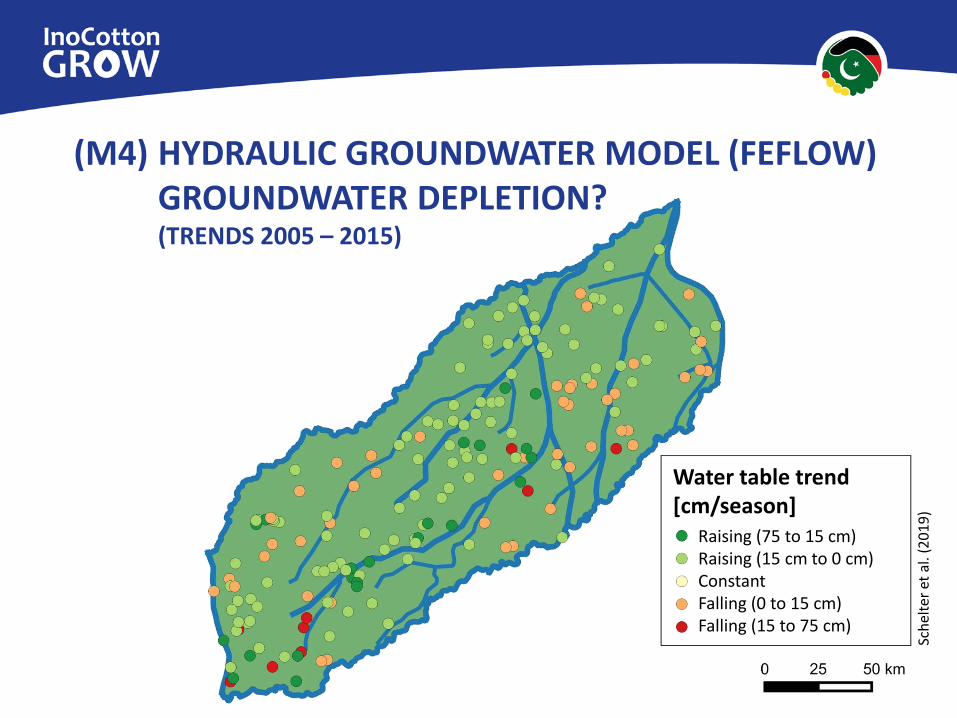
(M4) HYDRAULIC GROUNDWATER MODEL (FEFLOW) GROUNDWATER DEPLETION? (TRENDS 2005 – 2015)
Sch
elte
r et
al.
(20
19
)
Water table trend [cm/season]
Raising (75 to 15 cm) Raising (15 cm to 0 cm) Constant Falling (0 to 15 cm) Falling (15 to 75 cm)
16
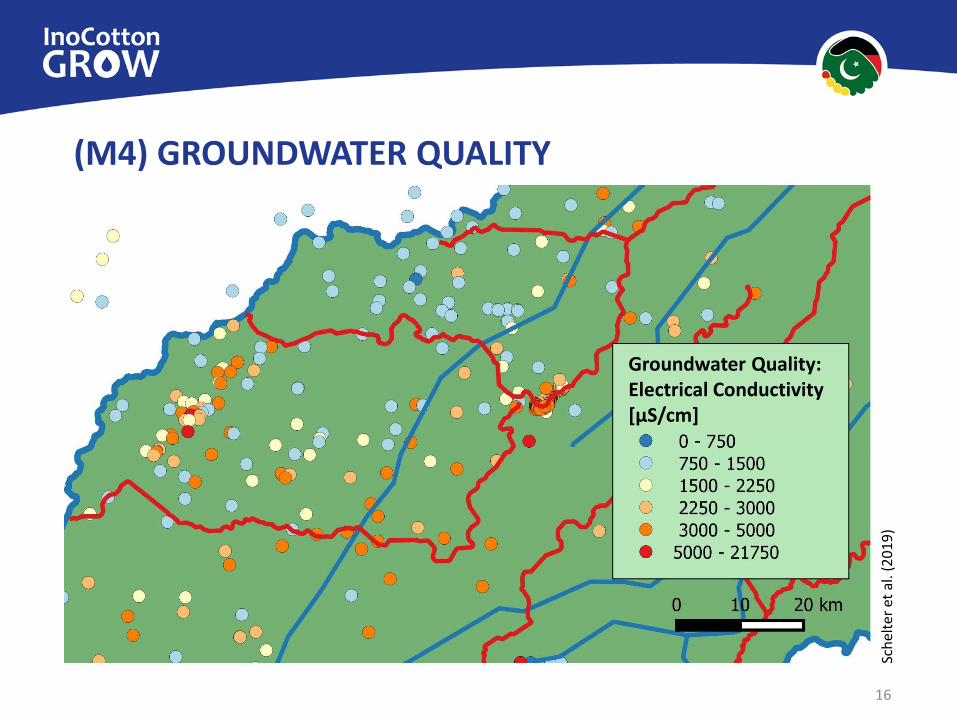
(M4) GROUNDWATER QUALITY
Sch
elte
r et
al.
(20
19
)
Groundwater Quality: Electrical Conductivity [µS/cm]

17
(M7) WATER USE OF EXHAUST DYEING MACHINERY THIES iMASTER OPERATED IN PAKISTAN (N=7-9)
Freericks, THIES (2018)

18
(M6) WASTEWATER OF TEXTILE PROCESSING PLANTS RESULTS OF 9 COMPANY SURVEYS
Box-Plot of Wastewaster Compositions (n=9)
Pakistan National Emission Standard
Zero Discharge of Hazardous Chemicals (ZDHC) - Foundational

Five Demonstration Projects: How to improve
20
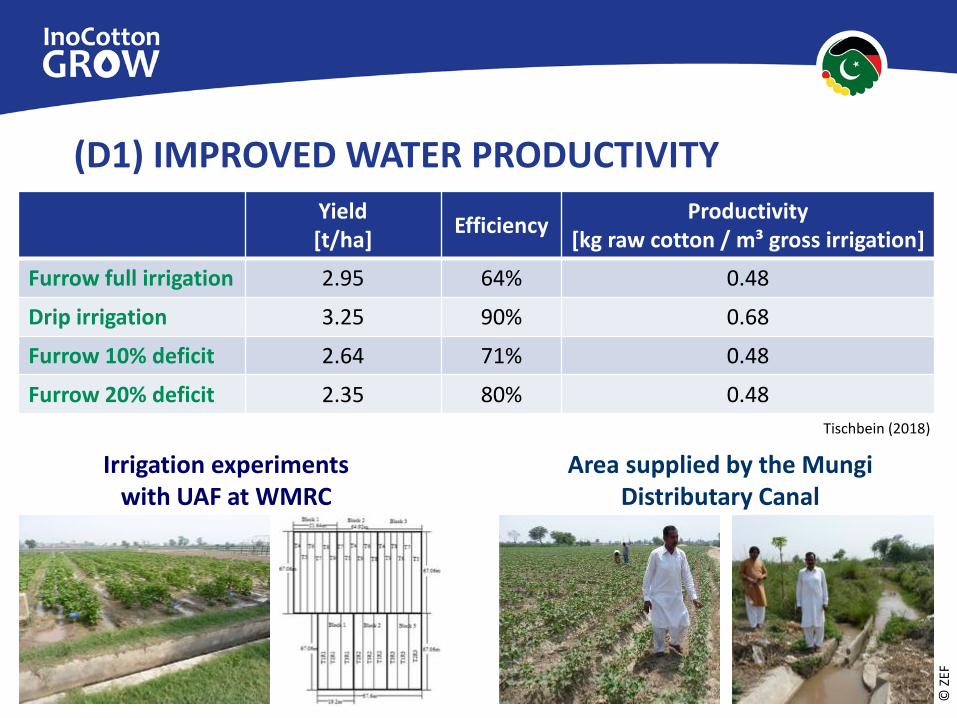
Irrigation experiments with UAF at WMRC
Area supplied by the Mungi Distributary Canal
(D1) IMPROVED WATER PRODUCTIVITY
© Z
EF
Yield [t/ha]
Efficiency Productivity
[kg raw cotton / m³ gross irrigation]
Furrow full irrigation 2.95 64% 0.48
Drip irrigation 3.25 90% 0.68
Furrow 10% deficit 2.64 71% 0.48
Furrow 20% deficit 2.35 80% 0.48
Tischbein (2018)

21
(M2) FLEXIBLE IRRIGATION SCHEDULING IN MUNGI Options evaluation by FAO-AquaCrop Model
Inflow to Mungi 9 May to 11 Nov 2017: 370 mm
Furrow, 7-d Warabandi
Effective precipitation 184 mm
Raw cotton yield: 2.2 t/ha Net irrigation: 352 mm Gross productivity: 0.51 kg/m³
ETact 600 mm
Percolation: 185 mm GW
replenishment: 18 mm
GW pumping 167mm
Depletion of soil moisture: 64 mm
Tischbein (2018)

22
(D2/D3) WATER-EFFICIENCY IN EXHAUST DYEING
From 69 to 52-62 L/kg for black shade dyeing by THIES online process control and down to 38 L/kg by CHT advanced dyestuff 4SUCCESS
Freericks, THIES (2018)

23
(D4) ANAEROBIC TREATMENT OF DESIZING WASTEWATER 63% COD reduction plus biogas production 0.33 m³/kg COD
Foto
: © F
iW

24
Full Aerobic Effluent Treatment Plant for Mixed Textile Wastewater
Aerobic Effluent Treatment Plant after Anaerobic Pretreatment of Desizing Wastewater
Biogas production: +60 PKR/m³ wastewater
Saved energy: +20 PKR/m³
Operation and Maintenance: -30 PKR/m³
(D4) ANAEROBIC TREATMENT OF DESIZING WASTEWATER 63% COD reduction plus biogas production 0.33 m³/kg COD
© F
iW
Baumann et al. (2018)

25
POLICY SCENARIOS FOR REDUCING THE WATER FOOTPRINT
TOWARDS ACHIEVING UN-SDGs

26
GREEN AND BLUE WATER CONSUMPTION
2415
1680
1676
2393
1513
2547
1757
2181
1712
2332
1874
2190
1870
2194
1122
1898
982
2156
PakistanPunjab
[Mekonnen & Hoekstra, 2011]Bas
emap
: O
pen
Stre
etM
ap
Water consumption in cotton farming (production weighted average):
2318 L blue/kg raw cotton 1723 L green/kg raw cotton higher than previous literature data for Punjab (Mekonnen & Hoekstra, 2011)
Finogenova et al. (2018)

27
Cotton
growing
season
January February March April
May June July August
September October November December
WATER SCARCITY ASSESSMENT
Fin
oge
no
va e
t al
. (2
01
8)

28
WATER SCARCITY FOOTPRINT (WSF)
Bas
emap
: O
pen
Stre
etM
ap
Water Scarcity Footprint (WSF) (production weighted average):
2269 L deprived/kg raw cotton above results obtained using water scarcity factors on a country and/or watershed level (Berger et al., 2014, 2018)
2214
2291
2447 2174
22802190
2194
Finogenova et al. (2018)

29
GREY WATER FOOTPRINT
Cotton Farming • Calculation based on NO3
- leaching from fertilizers (depend on threshold, leaching rate, and calculation method applied)
• Pesticide toxicity: impact assessment on human health and ecosystems under way
Textile Wastewater
• Calculation based on most penalizing water quality parameters (BOD or COD)
• Heavy metals toxicity: impact assess-ment under way
4.581
1.724 1.040
0
1000
2000
3000
4000
5000
6000
InoCottonGROW(PEF guidance)
InoCottonGROW(WFN method)
Hoekstra (2006)
Grey WF [L/kg raw cotton]
1.108
592
880
0
200
400
600
800
1000
1200
1400
InoCottonGROW(ZDHC-f)
InoCottonGROW(NEQS)
Hoekstra (2006)
Grey WF [L/kg fabric]
Product Environmental Footprint (PEF)
Water Footprint Network (WFN)
Zero Discharge of Hazardous Chemicals, foundational (ZDHC-f)
National Environmental Quality Standards of Pakistan (NEQS)

30
POLICY SCENARIO: „S2 MANY PENNIES MAKE A DOLLAR“
Options for intervention WF UN-SDGs Indicators
Co
tto
n • Promotion of flexible irrigation scheduling within
Warabandi system 6.4.2 (+) 2.1.1 (+)
• Promotion of advanced irrigaton techniques (e.g., drip) 2.3.1 (+)
Text
ile • Promotion of water-efficient machinery in textile processing 7.b.1 (+)
• Promotion of advanced dyestuff and process chemicals 6.4.1 (+) 12.4.1 (+)
Was
tew
ate
r
• Installation and operation of effluent WWTPs in all large- and medium-size textile finishing plants
6.1.1 (+) 6.3.1 (+) 3.9.3 (+) 7.3.1 (-)

31
PRELIMINARY CONCLUSION & NEXT STEPS
1. WF as a Steering Indicator • Installation of functioning wastewater treatment has a main
impact on reducing grey water footprint • For achieving UN-SDGs, other measures are also important
2. Workshops, Trainings, and Roadmap IWRM • Punjab irrigation reform: Institutional gaps in water allocation
prevail. Monitoring and sanctioning hardly exist • Environmental authorities are currently not in a position to
assure compliance with existing wastewater standards
3. Awareness Raising: Brands, Retailers, and Consumers • Internet-based WF tool • Integration of the WF concept into textile labels? • 12-min Documentary Video available on YouTube
32
آپ کی توجہ کے .لئے آپ کا شکریہ
Dr. sc. Frank-Andreas Weber Dr.-Ing. Friedrich-Wilhelm Bolle
Kackertstraße 15 – 17
52056 Aachen, Germany Phone: +49 (0) 241 8023952 [email protected]
www.fiw.rwth-aachen.de
Research Institute for Water and Waste Management at RWTH Aachen (FiW) e.V.
www.inocottongrow.net
The project is funded by the Federal Ministry of Education and Research (BMBF) within the framework of the funding measure “Water as a Global Resource (GRoW)”