Reducing Greenhouse Gas Emissions: The Carbon Tax … comments/discussion paper carbon taxes... ·...
75
DISCUSSION PAPER FOR PUBLIC COMMENT Reducing Greenhouse Gas Emissions: The Carbon Tax Option December 2010
Transcript of Reducing Greenhouse Gas Emissions: The Carbon Tax … comments/discussion paper carbon taxes... ·...
DISCUSSION PAPER FOR PUBLIC COMMENT
Reducing Greenhouse Gas Emissions:
The Carbon Tax Option
December 2010
2
Contents Overview ....................................................................................................................................................... 3
1: Background ............................................................................................................................................. 11
2: Introduction ............................................................................................................................................ 13
3: Climate change and its effects ................................................................................................................ 15
3.1 Effects of climate change ............................................................................................................ 15
3.2 Greenhouse gas emissions profile for South Africa .................................................................... 16
4: Economics of climate change .................................................................................................................. 20
4.1 Externalities ................................................................................................................................ 20
4.2 External and social costs of carbon ............................................................................................. 22
5: Policy instruments to address climate change ....................................................................................... 25
5.1 Market-based instruments versus command and control measures ......................................... 25
5.2 Environmentally related - Pigouvian taxation ............................................................................ 26
5.3 Carbon pricing options: carbon taxes and emissions trading schemes ...................................... 27
6: Tax policy design considerations ............................................................................................................ 30
6.1 Tax base and administration ....................................................................................................... 30
6.2 Tax incidence - distributional effects .......................................................................................... 37
6.3 Competitiveness.......................................................................................................................... 39
6.4 Border tax adjustments .............................................................................................................. 40
7: International practice ............................................................................................................................. 43
8: Revenue use – recycling, tax shifting and earmarking ............................................................................ 50
9: Potential effects of carbon taxation ....................................................................................................... 52
9.1 Summary of economic modelling studies on the potential economic impact of carbon taxes . 52
10: Summary ............................................................................................................................................... 58
References .................................................................................................................................................. 60
Annexure 1: Social costs of carbon ............................................................................................................. 62
Annexure 2: International examples ........................................................................................................... 63
Annexure 3: Economic efficiency gains of market-based instruments ...................................................... 74
Annexure 4: Acronyms ................................................................................................................................ 75
3
Overview Introduction Climate change is a serious global problem that requires both a concerted international response and national efforts to reduce greenhouse gas (GHG) emissions. The United Nations Framework Convention on Climate Change (UNFCCC) is the main global response to climate change. The associated Kyoto Protocol is an international agreement that classifies countries by their level of industrialisation and commits certain countries to GHG emission-reduction targets. The Kyoto Protocol commits annex 1 (developed) countries to reduce GHG emissions to 5 per cent below 1990 levels by 2012. South Africa, a non-annex 1 developing country, is ranked among the top 20 countries measured by absolute carbon dioxide (CO2) emissions. The vast majority of South Africa’s CO2emissions (about 80 per cent) are produced by the electricity sector, the metals industry and the transport sector. The electricity sector’s reliance on low-cost fossil fuels-based electricity generation is one of the main reasons for the carbon-intensive nature of our economy. These already high levels of GHG emissions are expected to increase as the economy grows. Government is of the view that South Africa needs to reduce GHG emissions while working to ensure economic growth, increase employment, and reduce poverty and inequality. These goals are not necessarily mutually exclusive. Environmentally related taxes have an important role to play in discouraging activities that impose high social costs and in helping to ensure that economic growth and development are sustainable. During the 2009 Copenhagen climate change negotiations, South Africa voluntarily announced that it would act to reduce domestic GHG emissions by 34 per cent by 2020 and 42 per cent by 2025 from business as usual subject to the availability of adequate financial, technological and other support. To combat climate change, which is by definition a global problem, a full-scale worldwide response is required. While there is a degree of global cooperation, a fully coordinated and concerted response is not on the immediate horizon: governments are unlikely to reach consensus on an equitable burden of shared responsibility for emissions reductions, or on an international carbon price, in the near future. The Long-Term Mitigation Scenarios report (2007) and the National Climate Change Response Green Paper (2010) for South Africa recommends the use of market-based instruments, specifically carbon taxes, to induce behavioural changes that contribute to lower GHG emissions. The role of such instruments to address climate change and support sustainable development has gained increased prominence in recent years. All countries could price carbon domestically, outside of an international arrangement, as this presents opportunities to pursue emission reductions and revenue-raising objectives simultaneously. The two main economic policy instruments available for putting a price on carbon and curbing GHG emissions are carbon taxation and emissions trading schemes. The carbon tax seeks to reduce emissions through the price mechanism directly, while emissions trading schemes establishes targets for
4
specific levels of emissions through the trade in allowances. To date, the relative merits and feasibility of these policies have been demonstrated primarily in Europe. Uniform application of carbon taxes, however, tends to be regressive, because a disproportionate share of the tax burden falls on the poor. In a South African context, government would need to counteract this tendency, addressing other economic development imperatives such as poverty alleviation, and ensuring access to basic and affordable energy services for low-income households. The design of the tax should include compensating measures to minimise adverse impacts on low income households. This paper attempts to build on the work contained in the Environmental Fiscal Reform Policy Paper (2006) and considers the economic rationale for introducing a carbon tax. Climate change and its effects Overwhelming scientific evidence has demonstrated the link between increasing atmospheric concentrations of GHGs and rising global temperatures. Average temperatures have increased over the past 50 years at a rate of 0.2°C per decade, largely as a result of human activity. Estimates suggest that if GHG emissions were stabilised at their 2006 levels, the atmospheric concentration of these gases could reach 550ppm of carbon dioxide equivalent (CO2e), double its pre-industrial level, by as early as 2035, committing the earth to an average temperature increase of about 2-5°C. Even at the lower end of this scale, global warming is likely to have a serious impact on human life and the environment:
• South Africa and many other developing countries are especially vulnerable to the effects of climate change given our economic dependence on the primary sector (agriculture, fisheries, mining, etc). About 64 per cent of people in Southern Africa are employed in the primary sector.
• According to some estimates, a temperature increase of 3-4°C, could lead to a 15 per cent decline in African crop yields, with extremely negative consequences in sub-Saharan Africa, where only about 4 per cent of arable land is irrigated.
• Projections suggest that a global temperature increase of 3°C would reduce crop yields, leading to food shortages for up to 550 million people, more than half of whom live in Africa.
• Warming is expected to increase mosquito prevalence, with a concomitant rise in malaria. • Extreme weather patterns are predicted to reduce growth rates in many developing countries.
Economic rationale for carbon taxes Command and control regulations and market based instruments are used to control pollution. However, market-based policy instruments, which complement regulatory policy, provide for greater flexibility in emissions reduction. Companies with low abatement costs1
have an incentive to undertake further measures to avoid paying the tax, while firms with high marginal abatement costs will tend to do less.
1Costs borne by a business for the removal and/or reduction of an undesirable item they have created – such as the costs of reducing pollutants.
5
The environment is essentially a “public good”: it is accessible to all and consumption of the good does not diminish availability. Climate change and its effects are the result of GHG emissions, which are not paid for by the emitters. Such emissions impose external costs on society – an “externality” in economic terms. Because these costs have not been factored into the prices of goods and services, this is a “market failure”, which can be corrected by a pricing instrument. The need for government policy intervention to address climate change concerns stems mainly from this market failure. Moreover, the fact that external costs of damages are not reflected in final prices encourages the over allocation of resources for the production and consumption of commodities. In this context, the pricing of environmental goods and services that generate excessive levels of GHG emissions should be adjusted to reflect the full costs of production and consumption. Carbon taxes can accomplish this objective by encouraging lower emissions, greater energy efficiency and the use of cleaner, low carbon technologies. The economic rationale for environmental taxation was developed by English economist Arthur Pigou during the first half of the 20th century.2
A carbon tax is one way in which external costs can be internalised into consumption and production decisions. The most efficient way to achieve such an outcome would be to set a uniform tax rate that is equal to the marginal external cost from emitting an additional unit of GHG. Most estimates of these marginal external costs are in the region of $5–30 per ton of CO2, consistent with least-cost stabilisation of atmospheric CO2 concentrations at 550ppm (see Table 4 on page 23).
Efficiency considerations are important when economic instruments are used to correct market failures. Economic instruments, such as a carbon tax, have the potential to be more efficient than regulatory policy instruments. As noted earlier, a carbon tax would create an incentive for activities with the lowest costs of abatement to reduce emissions while penalising those with high costs of abatement. Also, carbon taxes would generate revenues and may be easier to implement compared to regulatory policies that require substantial information on firms abatement costs. Overall, the use of market-based instruments can support environmental objectives at least cost to the economy. A carbon tax can help to internalise a negative externality– in other words, the external costs are integrated into the producers’ costs and consumer prices, creating incentives for changes in behaviour. Carbon taxes versus emissions trading schemes An Australian paper on reducing GHG pollution suggests that “The introduction of a carbon price will change the relative prices of goods and services, making emission-intensive goods more expensive relative to those that are less emissions-intensive. This provides a powerful incentive for consumers and businesses to adjust their behaviour, resulting in a reduction of emissions.”3
However, the appropriateness of carbon taxes and emissions trading schemes to effectively price carbon, particularly in a developing-country context, are the subject of debate.
2 Pigou, A. C. (1920)“The Economics of Welfare”. London: MacMillan. 3“Australia’s Low Pollution Future” (2008) White Paper Volume 1, December 2008, Carbon Pollution Reduction Scheme.
6
Developing an adequate, low-cost and competitive emissions trading mechanism to protect the atmosphere is imperative. In the South African context, however, the oligopolistic structure of the energy sector is likely to reduce efficiency gains that would result from such a mechanism. The lack of many industry players and appropriate market structure with diverse abatement costs suggests limited opportunities for domestic trade, resulting in inappropriate permit prices. This could result in the lock-in of emission-intensive technologies where permits could be used as a barrier of entry for newcomers. There are other concerns about emissions trading systems. The European Union emissions trading scheme (EUETS), for example, has experienced significant price volatility. Declining industrial activity in Europe and hence energy use, since the middle of 2008 in the face of fixed supply of carbon allowances and declining emissions also contributed to falling carbon prices.4
The price of carbon under the EU scheme appears to be too low due to the large number of free allowance allocations among industrial users, which results in economic distortions and the creation of unequal abatement incentives.
A carbon tax regime would have certain administrative advantages over emissions trading schemes: • Oversight of the tax by the existing revenue authority • Fewer players involved (and therefore lower costs) • A simpler structure, minimising opportunity for abuse and risk • A lower administrative burden, because no new accounting system is required • Lobbying efforts would be minimised.
Although a carbon tax would not set a fixed quantitative limit for carbon emissions over the short term, a tax set at an appropriate level and phased in over time would provide a strong price signal to both producers and consumers to change their behaviour over the medium to long term. Design of carbon taxes The following issues need to be carefully addressed in the design of a carbon tax:
• Environmental effectiveness – The ability of the tax to reduce GHG emissions. • Rate of tax – To the degree possible, the tax rate should be aligned with the marginal external
damage costs of each additional unit of CO2eemissions. • Distributional implications – Government should take measures – either in tax design or through
complementary expenditure programmes – to offset the burden such a tax will place on poor households.
• Competitiveness – Industries that participate in international trade might be at a disadvantage when competing with countries that do not price carbon.
• Technical and administrative feasibility – Consideration needs to be given to whether the tax is placed on carbon emissions or a proxy for such emissions (e.g. fuel inputs or outputs). The administrative and compliance costs of implementing the tax should be weighed against the need to create the correct incentives.
• Aligning policy objectives – The tax should be aligned with other government policy interventions. For example, policies to reduce energy sector carbon emissions should not be accompanied by policy measures that seek to encourage such emissions.
4 Ricard-Nihoul, E & Fabry, G (2010). The Contribution of 14 European Think Tanks to the Spanish, Belgian and Hungarian Trio Presidency of the European Union. Accessed on 13 August 2010 at: http://www.europeum.org/doc/publications/TGAE2010-final.pdf
7
• Legislative provisions – Robust legislation should provide certainty to the taxpayer and minimise opportunities for tax avoidance and evasion.
Tax base and administration Theoretically, taxes should be applied directly on the emissions of CO2. Other GHGs could be included in the tax base however; this may be administratively complex and therefore impractical. In practice, it is difficult and costly to measure emissions at source, especially when there are a large number of sources, which is often the case with GHGs. One solution is to define carbon taxes as a tax on the carbon content of energy products, which serves as a proxy for actual emissions resulting from combustion. There are two options: an upstream tax at the point where fuels enter the economy, according to their carbon content; or a downstream tax on emitters at the point where fuels are combusted. The administrative costs and complexity of an upstream tax are significantly lower. Arguably, an upstream tax does not provide adequate incentives to encourage carbon capture and storage and includes sectors which use fuels for non-combustion purposes. These processes may be removed from the tax base or given tax rebates. Impact on low-income households Poor households spend up to a quarter of their income on electricity, water and transport. The potential impact of a carbon tax on low-income households needs to be addressed through appropriately targeted compensating measures. A carbon tax would provide a revenue stream that could be used to support developmental programmes – from reducing distortionary taxes such as payroll taxes, to targeted rollout of free basic services such as electricity and water to poor households, to higher transfers to low- and middle-income households. The phasing-in of carbon tax policies over a specific timeframe and initiatives to retrain or move workers to alternate employment can help smooth the transition to a low carbon economy and minimise adverse impacts on employment. Competitiveness issues and border tax adjustments A carbon tax would have different effects on different businesses and industrial sectors, depending on factors such as emission intensity and levels of participation in international markets. Some companies may be at a competitive disadvantage depending on their ability to pass the tax on to consumers both domestically and abroad, particularly if its competitors do not face similar tax regimes. Competitiveness concerns should also be considered in the absence of a global agreement on carbon pricing. Competitiveness concerns may be addressed through gradually, phasing-in a carbon tax at a relatively modest level initially and increasing over the medium to long term to reflect the full external costs. Clear price signals will provide certainty to key role players and encourage low carbon and energy efficient practises. Carbon taxes can also be designed to neutralise the effects on competitiveness through sectoral exemptions (which may also be differentiated) and tax reduction. These measures give companies time to adjust to policy shifts, but should be awarded only for a short transition period. From an environmental point of view, exemptions for emissions-intensive sectors reduce the effectiveness of
8
the tax and require concurrent increases in the tax rate for non-exempt sectors. Economically, sectoral exemptions create uneven abatement incentives across sectors, which risks abatement inefficiency. Some commentators have proposed border tax adjustments based on the carbon content of goods as a way to defend competitiveness. Such taxes on imports would allow prices to reflect the comparative advantages of trading countries, and act as a disincentive to shift production to countries that have no carbon pricing regime. There are, however, practical difficulties associated with border tax adjustments. The carbon content of many products is not readily available and adjustments would need to be harmonised between countries that trade and apply carbonpricing. Without harmonisation, products could be subject to double taxation or zero taxation. There are also legal impediments associated with the need to stay within World Trade Organisation (WTO) rules. It is argued that the early adoption of a low carbon growth path can create a competitive advantage for countries taking cognisance of the effects of climate change and environmental pollution. International practice Several countries have undertaken environmental tax reforms, transforming existing energy taxes to focus on carbon content. They include Finland, the Netherlands, Sweden, Denmark and the United Kingdom. Carbon tax rates in these countries are usually set lower than the marginal external costs of climate change, with the exception of taxes levied on transport fuels. Some of the main reasons for this approach are the lack of a global carbon pricing regime and concerns around industry competitiveness and the difficulties of estimating the actual external costs. A discussion of international experience with carbon taxes is found in Section 7. Using carbon tax revenues: recycling, tax shifting and earmarking There is much debate on how environmental tax revenues should be used. Some form of revenue recycling through tax shifting could be considered. This would involve taxing “bads” and reducing taxes on “goods” such as labour (i.e. payroll taxes).5
Neither public finance theory nor good public finance practice support the full earmarking of specific revenue streams. There are several reasons for this approach:
• There is a risk of misallocation of public funds depending on the amount of money collected from a specific tax, with too much or too little funding going to a target area.
• Earmarking might impose undue constraints on government in a way that serves special interest groups. The state cannot allow special interests to capture public resources.
• Such practices may be an obstacle to continuous evaluation and modification of tax and spending programmes.
The National Treasury does not support full earmarking of revenues generated from environmental taxes. However, partial “on-budget” earmarking of some revenue for specific (e.g. environmental or
5 Cuervo and Ghandi(1998) “Carbon taxes: their macroeconomic effects and prospects for global adoption – A survey of the literature.” Fiscal Affairs Department, IMF, Washington.
9
social) purposes may be appropriate to promote public and political acceptance of the benefits of the reform. Such arrangements should not undermine the normal budgetary process and should allow adequate funding for changes in government priorities. Potential impacts of carbon taxation for South Africa Consideration of environmentally related taxes has been undertaken in line with the broad principles of South Africa’s tax policy: efficiency, equity, administrative feasibility and simplicity. Government has already introduced several excise taxes and incentives to support the transition to an environmentally friendly, low-carbon economy. In addition to the fuel taxes on petrol and diesel, the electricity levy of 2c/kWh was implemented in July 2009 as a step towards developing a comprehensive carbon pricing regime. Tax incentives and specifically targeted government programmes for renewable energy and energy efficiency measures form part of government’s policy response to climate change. This discussion document makes reference to several studies that attempt to assess the environmental and economic effects and implications of a carbon tax. Two papers in particular are cited in this document – the Long-Term Mitigation Scenarios (Department of Environmental Affairs and Tourism) and Tax Policy to Reduce Carbon Emissions in South Africa (Devarajan et al). The results of the models presented in these papers and reviewed in this discussion document involve various assumptions and should be applied with a certain degree of circumspection in recognition of their limitations. A necessary follow-up to this discussion paper will be an economic modelling exercise that builds on previous work. Summary A carbon tax appears to be the most appropriate mechanism to reduce GHG emissions in South Africa, creating incentives for emissions reduction at least cost to the economy. While it would not guarantee a fixed quantitative reduction in such emissions over the short term, a carbon tax set at an appropriate level and phased in over time would provide a strong price signal and certainty to both producers and consumers, acting as an incentive for more environmentally friendly behaviour over the long term. Taxes on carbon afford firms the flexibility to undertake emissions reductions according to their specific processes and provide the long-term price certainty necessary for investment decisions. Ideally, a carbon tax should apply directly to emissions of CO2 but for administrative reasons this is not feasible. The next best option is a proxy carbon tax on fossil fuel inputs. The development of a carbon tax policy should be informed by the following considerations:
• In the absence of an international climate change agreement and a global emissions pricing
system, a partial, rather than full, internalisation of the externality should be targeted as an interim measure.
• While a carbon tax based on measured and verified emissions is preferred, a proxy tax can be considered and levied according to the carbon content of fossil fuels (i.e. a fuel input tax). A tax of R75 per ton of CO2 and with an increase to around R200 per ton CO2 (at 2005 prices) would be both feasible and appropriate to achieve the desired behavioural changes and emission reduction targets.
• The carbon tax should be introduced at a modest rate, which will increase over a set time period, giving taxpayers an opportunity to adjust to the new tax.
10
• The tax should, over time, be equivalent to the marginal external damage costs of carbon. • Coverage should be comprehensive, covering all sectors. • Relief measures, if any, should be minimised and temporary. The design of the tax needs to
minimise the potential regressive impacts on low-income households and protect the competitiveness of key industries. Revenue recycling to minimise the costs of the tax could be achieved through some form of tax shifting. The full earmarking of revenues is not in line with sound fiscal policy principles, although some form of on-budget funding for specific environmental programmes should be considered.
The main body of this discussion document is structured as a technical paper. The remainder of the paper is structured as follows:
• Background • Climate change and its effects • Economics of climate change • Policy instruments to address climate change • Environmentally related Pigouvian taxes • Tax policy design considerations • International practice • Revenue use – revenue recycling, tax shifting and/or earmarking • Potential impacts of carbon taxation for South Africa.
The next phase of government’s investigation into a carbon pricing regime will elaborate on the economics, design and practicality of an emissions trading scheme. This will involve an analysis of implemented and proposed emissions trading schemes internationally. The policy discussion document is expected to be published for comment next year.
Submission of comments
Written comments on this discussion paper should be submitted to Sharlin Hemraj on email: [email protected] by 28 February 2011. For further information contact Sharlin Hemraj on 012 315 5875.
11
1: Background 1. The problem of climate change has generated extensive debate and controversy since the Rio Earth
Summit in the early 1990s.There has been much speculation concerning the science of climate change, and the merits and demerits of related models developed by the Intergovernmental Panel on Climate Change (IPCC).In recent years, however, there has been a growing global recognition that climate change is the largest environmental market failure facing the world today, and that urgent action is needed to curb emissions of GHGs responsible for climate change.
2. Climate change is an international problem that can lead to devastating consequences for all
countries. The main instrument used to control global GHG emissions and effect an international response to climate change is the UNFCCC. The convention sets the framework and principles to guide the allocation of responsibilities to countries for reducing GHG emissions. Accordingly, the Kyoto Protocol – an agreement made by member countries to reduce their GHG emissions –classifies countries according to their level of industrialisation and prescribes GHG emission limitations. Countries classified as annex 1, consisting mainly of industrial countries, are required to meet emission reduction commitments in line with the principle of common but differentiated responsibilities and take cognisance of their historical contribution to climate change. Both the Convention and Protocol are still subject to negotiation.
3. The climate change negotiations held in Copenhagen in December 2009 debated a number of issues under the Kyoto Protocol and the UNFCCC, which culminated in the Copenhagen Accord. The main issues under discussion were the allocation of emissions reductions responsibilities among the different countries, issues around the transfer of technology and the need for finance to facilitate developing countries’ efforts to mitigate and adapt to climate change. In terms of the Kyoto Protocol, South Africa is classified as a non-annex 1 developing country and not explicitly required to undertake specific emissions reduction commitments in the first commitment period of the Protocol.
4. As a growing developing country, South Africa’s economy is highly energy and carbon intensive, with the energy sector responsible for a significant proportion of GHG emissions. South Africa announced a willingness to undertake nationally appropriate mitigation actions to deviate from business-as-usual GHG emissions by 34 per cent by 2020 and 42per cent by 2025.The announcement was conditional on the availability of adequate, predictable levels of funding to support these actions, technology transfer and capacity building efforts by developed countries.
5. The Stern Review (2007) has stimulated this debate by elaborating on the economics of climate change and the role for a range of government policy interventions, both regulatory and market-based, to foster GHG emissions reductions. The two main policy instruments available to achieve net global emissions reductions are carbon taxes and emissions trading schemes. Internationally, this would mean that countries agree on a global price for carbon emissions, or an appropriate mechanism to arrive at such a price. In this context, ideally climate change policy should be a consistent, international response. For a number of reasons, this is not likely in the near term.
6. Developed and developing countries have implemented both market and non-market-based measures to mitigate climate change. The South African government has introduced a number of policy measures and programmes targeted at addressing climate change and recognise the need for
12
appropriate policy development. South Africa’s climate change policy development includes the Long-Term Mitigation Scenarios project which assesses the potential to curb GHG emissions in South Africa, focusing on various technological and pricing options. The project provides details of South Africa’s GHG emissions profile in two scenarios: a business-as-usual scenario and a required by science scenario where measures to reduce GHG emissions are implemented. The project explores policy mechanisms that could be used to lower the emissions gap under the business-as–usual approach and in the “required by science” approach. The report recognises the need for appropriate levels of carbon pricing to facilitate South Africa’s transition towards a low-carbon future, and informed government’s announcement during the 2009 climate change negotiations. The recently published National Climate Change Response Green Paper (2010) as well as the National Framework for Sustainable Development recognises the need for a domestic response to climate change and specifically the role for carbon taxes as part of a key policy response to climate change.
7. The National Treasury has conducted research and analysis on the role and scope of
environmentally related taxes in South Africa. This culminated in the policy document entitled A Framework for Considering the Use of Market-Based Instruments to Support Environmental Fiscal Reform in South Africa. This paper provides a guiding framework and criteria to develop and assess environmentally related taxes. Since 2008, government has implemented a range of taxes and incentives targeted at GHG emissions reductions, including the electricity generation levy, income tax exemption for revenues generated from the sale of certified emissions reduction units (Clean Development Mechanism projects), the taxation of incandescent light bulbs, the CO2vehicle carbon emissions tax and the proposed energy efficiency savings tax incentive.
8. To build on these efforts, government announced in the 2010 Budget Review its intention to
investigate the feasibility of a comprehensive carbon pricing regime for South Africa with a focus on carbon taxes. This paper elaborates on the merits of such taxes, and a follow-up paper will explore the practicalities and feasibility of a domestic emissions trading scheme.
13
2: Introduction 9. Climate change is defined as the change in climate attributed to human activities, mainly fossil fuel
combustion, that cause GHG emissions which alter the composition of the atmosphere, above and beyond the natural variability of the climate. Changes in the atmospheric concentration of GHGs, aerosols, solar radiation and land surface properties alter the energy balance of the climate system. These changes result in the greenhouse effect. There are six main GHGs, or gas compounds: CO2, methane, nitrous oxide, hydrofluorocarbons, perfluorocarbons and sulphur hexafluoride. Each type of GHG has a different warming capacity, referred to as the global warming potential of the gas. Methane has 25 times the global warming potential of CO2and hydrofluorocarbons have more than 1 000 times the potential of CO2.
10. Climate change is an example of a global market failure. The climate/atmosphere can be classified as a global public good, as it exhibits the characteristics of being non-excludable and non-rival in consumption – anyone can use it and use does not diminish it. Economic activities related primarily to energy production and transportation generates GHGs that accumulate in the atmosphere, contributing to climatic changes. Climate change is a global environmental externality, in terms of both its causes and consequences, and requires the reallocation of resources or property rights (emissions rights) across national boundaries to facilitate economically efficient outcomes. The global nature of climate change means that the emission of one ton of GHG anywhere in the world has the same effect and contribution to climate change.
11. While both developed and developing nations will face the effects of climate change, their ability to mitigate and adapt to changes in the climate differs significantly. Developing countries face the challenge of promoting development and climate change goals simultaneously. Yet these objectives are not necessarily mutually exclusive, and consideration needs to be given to the development of policies and strategies that aim to decouple economic growth and GHG emissions.
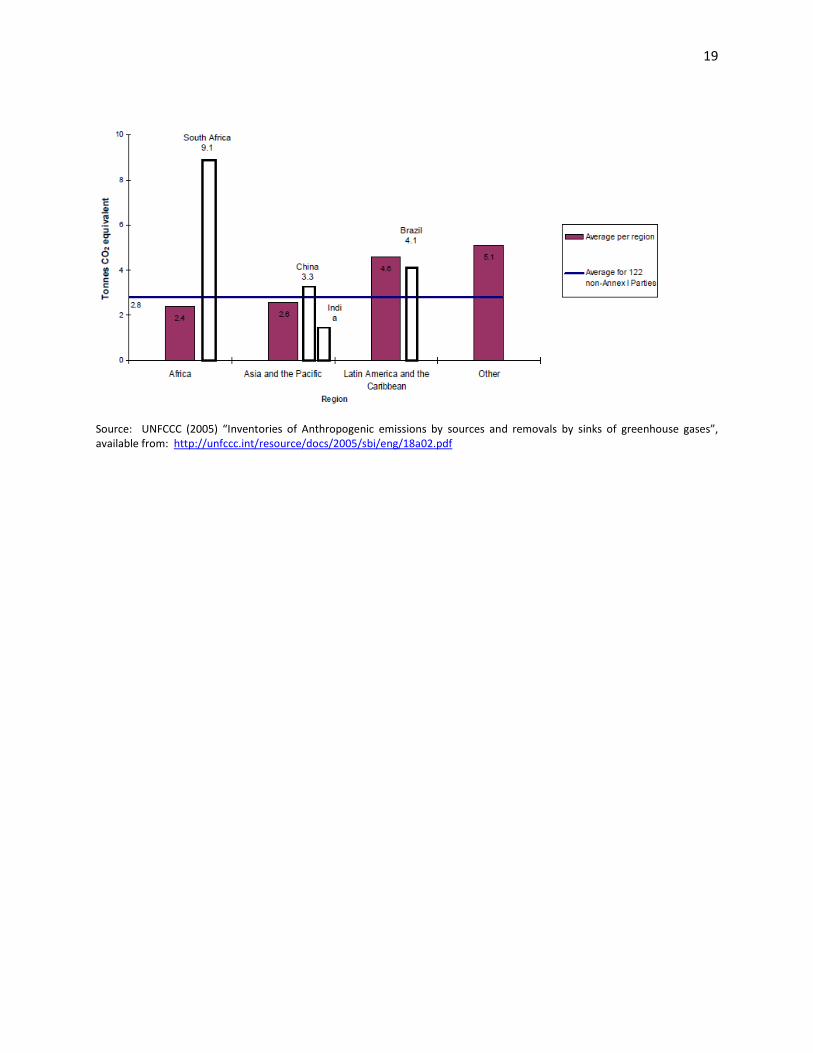
12. The policy response to climate change from a developing country’s perspective has been contested at an international level, in line with the principles of common but differentiated responsibilities and capabilities. An important point of departure has been the need to recognise the historical contribution of developed countries to the current stock of GHG emissions. The economic growth experienced by developing countries such as Brazil, India, China and South Africa and their increased contributions to emissions of GHGs is becoming a challenge. South Africa’s per capita emissions currently exceed the world average and are about 10 tons per capita.
13. The 2009 Carbon Disclosure Project notes that: “Whilst recognising the principle of common but
differentiated responsibilities, which places the greater burden on developed countries to reduce emissions, it is nevertheless clear that if we are to contain emissions within the required levels then energy-intensive sectors in developing countries will need to be included as soon as possible within global climate mitigation activities”.6
The nature and structure of our economy has implications for the type of policy interventions and design features that would best suit our country. Any commitment to reduce emissions needs to adequately consider the potential distributional and competitiveness impacts of proposed interventions.
6 Carbon Disclosure Project (2009) South Africa JSE 100, page 28.
14
14. Various policy instruments to achieve emissions reductions at a domestic level have been explored. Environmental regulations such as emissions standards tend to dominate domestic responses to environmental issues. However, market-based instruments, such as taxation, are increasingly being used to complement regulatory measures to support improved environmental outcomes.
15. Market-based instruments offer a least-cost way to reduce emissions. Such policies provide a real or implicit carbon price and create incentives for producers and consumers to invest in low-GHG products, technologies and processes. An effective carbon price signal could promote significant mitigation in all sectors. Modelling studies, consistent with stabilisation at about 550ppm CO2e by 2100, show prices rising to 80 US$/tCO2e by 2030 and 155 US$/tCO2e by 2050.For the same stabilisation level, studies that take into account induced technological change lower these price ranges to 65 US$/tCO2e in 2030 and 130 US$/tCO2e in 2050.Most top-down, as well as some bottom-up assessments, suggest that real or implicit carbon prices of 20-50 US$/tCO2e, sustained or increased over decades, could lead to a power generation sector with low-GHG emissions by 2050 and make many mitigation options in the end-use sectors economically attractive7
.
16. The two main policy options to price carbon are carbon taxes and emissions trading schemes. This paper considers various design options for a carbon tax as a mechanism to price carbon that would result in behavioural changes, including the uptake of clean energy and low-carbon technologies. The paper also provides a review of estimates of the social costs of carbon, the role of environmental taxes and regulations, the principles of a Pigouvian tax and the application of carbon taxes internationally, focusing on aspects of instrument design with the intention to inform policy options for South Africa.
77Pew Centre on Global Climate Change (2007). Highlights from Climate Change 2007: Mitigation of Climate Change Summary for Policy Makers. Accessible at: http://www.pewclimate.org/docUploads/IPCCSummary050407_050407_143632.pdf
15
3: Climate change and its effects 17. The burning of fossil fuels such as coal, oil and natural gas has a negative effect on the climate. The
combustion of these fuels generates CO2and other GHGs. Put simply, CO2gas traps solar heat in the atmosphere, resulting in an increase in average temperatures. As people burn more fossil fuel they add more CO2to the atmosphere. As this continues, the average temperature of the atmosphere is expected to rise. For this reason, CO2is called a "greenhouse gas", which acts as a blanket that traps heat in the atmosphere.
18. The two primary sources of GHGs are the energy and transport sectors. Other sources include: • Deforestation: wood burning releases CO2 contained in trees. When wood decays in
swamps methane can be produced. Living trees remove CO2from the atmosphere. • Rice paddies, cattle, coal mines, gas pipelines, and landfills produce methane. • Fertilisers and other chemicals release nitrous oxide, which causes about 10per cent as
much warming as CO2.
19. Global warming is defined as the increase in the average temperature of Earth’s near-surface air and oceans since the mid-20th century and its projected continuation. Global surface temperature increased by 0.74 ̊ C (± 0.18) between the start and the end of the 20th century. The IPCC concludes that most of the observed temperature increases since the middle of the 20th century were caused by increased GHG emissions resulting from human activities such as the burning of fossil fuels and deforestation. The IPCC also notes that variations in natural phenomena such as solar radiation and volcanism had a small cooling effect after 1950.These basic conclusions have been endorsed by more than 40 scientific societies and academies of science, including all of the national academies of science of the major industrialised economies.
20. Climate model projections summarised in the latest IPCC report indicate that the global surface temperature is likely to rise a further 1.1 to 6.4˚C during the 21st century. The uncertainty in this estimate arises from the use of models with differing sensitivity to GHG concentrations and the use of different estimates of future GHG emissions. Most studies focus on the period up to the year 2100.However, warming is expected to continue beyond 2100 even if emissions stop, because of the large heat capacity of oceans and the long life of CO2in the atmosphere8
.
3.1 Effects of climate change 21. An increase in global temperature is expected to cause sea levels to rise and change the amount and
pattern of precipitation, probably including the expansion of subtropical deserts. Warming is expected to be strongest in the Arctic with the continuing retreat of glaciers, permafrost and sea ice. Other likely effects include increases in the intensity of extreme weather events, species extinctions and changes in agricultural yields. Warming and related changes will vary from region to region around the globe, although the nature of these regional variations is uncertain.
8 IPCC, 2007: Summary for Policymakers. In: Climate Change 2007: The Physical Science Basis. Contribution of Working Group I to the Fourth Assessment Report of the Intergovernmental Panel on Climate Change [Solomon, S., D. Qin, M. Manning, Z. Chen, M. Marquis, K.B. Averyt, M.Tignor and H.L. Miller (eds.)]. Cambridge University Press, Cambridge, United Kingdom and New York, NY, USA.
16
• Africa will be under severe pressure from climate change. Many vulnerable regions, with high populations are likely to be adversely affected. These areas include the mixed arid-semi-arid regions in the Sahel, arid and semi-arid rangeland systems in parts of eastern Africa, the systems in the Great Lakes region of eastern Africa, the coastal regions of eastern Africa, and many of the drier zones of southern Africa.
• Some 250–550 million additional people may go hungry due to the effect of a 3°C temperature increase on agriculture, with more than half of these people concentrated in Africa and western Asia. And there are risks of higher temperatures still. Climate change is also predicted to decrease in size and/or shift the areas of suitable climate for 81-97 per cent of Africa’s plant species, with 25–42 per cent predicted to lose their entire area by 2085.
• Tens of millions of additional people could be at risk of malaria by the 2080s.Previously malaria-free areas in Zimbabwe could become prone to the transmission of malaria due to slight temperature and precipitation variations, while in South Africa the areas prone to malaria could double with 7.8 million people at risk by 2100.
• Water pressures may be intensified as rainfall becomes more erratic, glaciers retreat and rivers dry up. Several models suggest a decrease in river flow, with nine recent climate scenario impacts ranging from no change to more than 75 per cent reduction in flows by 2100.This will have a significant impact on the millions of people that have competing claims on its supplies.
• Many large cities in Africa that are situated on or very close to the coast could suffer severe damages from rising sea levels. According to national communications to the UNFCCC, a 1 meter rise in sea level (a possibility by the end of the century) could result in the complete submergence of the capital city of Gambia, and losses of more than $470million in Kenya for damage to three crops alone (mangos, cashew nuts and coconuts)9
.
3.2 Greenhouse gas emissions profile for South Africa
22. South Africa is the 12th largest emitter of CO2 in the world. In 2004, South Africa emitted about 387 million metric tons of CO2, just under half of CO2 emissions for all of Africa, and about 1.6 per cent of global emissions. South Africa’s per capita emissions are in the region of 10tonsCO2e.The South African economy is energy intensive, with fossil fuels accounting for more than 90 per cent of the primary energy demand. Coal accounts for 75per cent of the fossil fuel demand and 93 per cent of electricity generation (UNEP, 2004).10
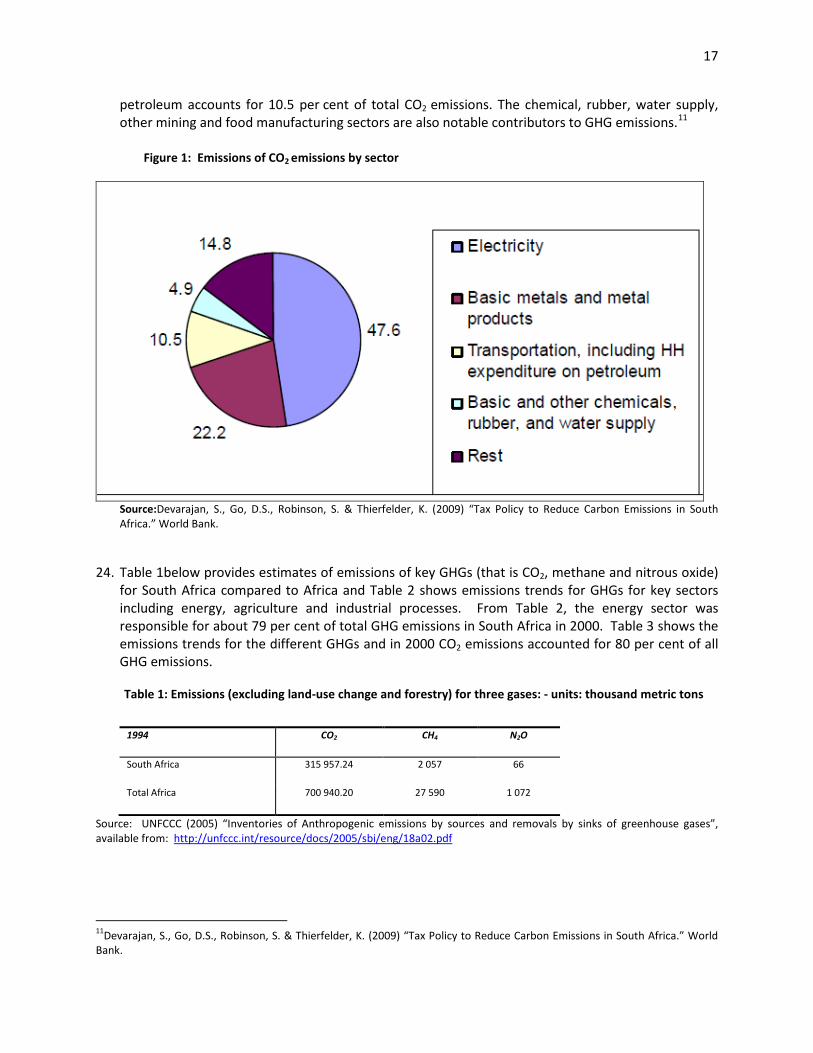
23. Given the developing nature of the South African economy, it is expected that emissions will grow as development goals are pursued. The sectors that generate the most carbon dioxide emissions are production activities that use large quantities of coal or electricity and the transportation sector. Figure 1 below provides a breakdown of carbon dioxide emissions by sector. Because of its heavy reliance on coal as an input, the power sector is the largest emitter of CO2 in South Africa, accounting for 48percent of total CO2 emissions. Metallic products use coal to fire up furnaces, emitting about 22 per cent of CO2 emissions. The transportation sector including households’ use of
9 Stern, N (2006). “Stern review: The Economics of Climate Change”, Part II: The Impacts of Climate Change on Growth and Development, Cambridge 10UNEP (2004). “Climate Policy Frameworks Beyond 2012: Development and Climate Change in South African Context.” Energy Research Centre. University of Cape Town. November 2004: pp 1-20.
17
petroleum accounts for 10.5 per cent of total CO2 emissions. The chemical, rubber, water supply, other mining and food manufacturing sectors are also notable contributors to GHG emissions.11
Figure 1: Emissions of CO2 emissions by sector
Source:Devarajan, S., Go, D.S., Robinson, S. & Thierfelder, K. (2009) “Tax Policy to Reduce Carbon Emissions in South Africa.” World Bank.
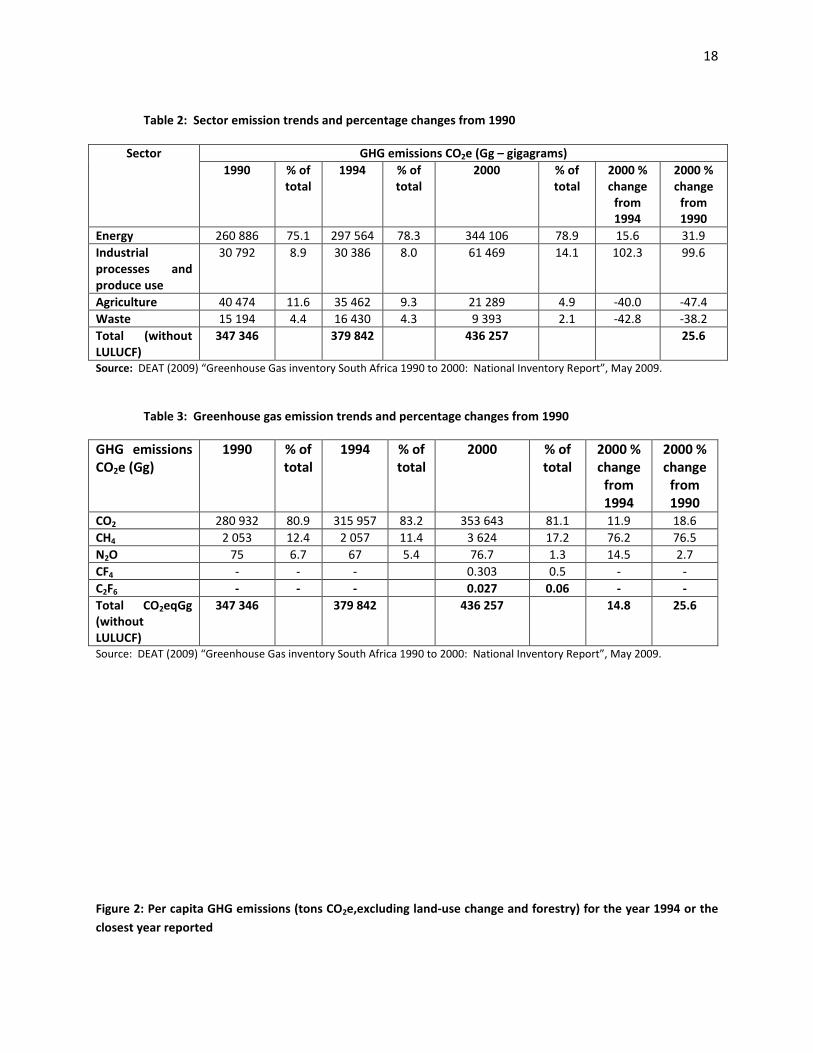
24. Table 1below provides estimates of emissions of key GHGs (that is CO2, methane and nitrous oxide) for South Africa compared to Africa and Table 2 shows emissions trends for GHGs for key sectors including energy, agriculture and industrial processes. From Table 2, the energy sector was responsible for about 79 per cent of total GHG emissions in South Africa in 2000. Table 3 shows the emissions trends for the different GHGs and in 2000 CO2 emissions accounted for 80 per cent of all GHG emissions.
Table 1: Emissions (excluding land-use change and forestry) for three gases: - units: thousand metric tons
1994 CO2 CH4 N2O
South Africa 315 957.24 2 057 66
Total Africa 700 940.20 27 590 1 072
Source: UNFCCC (2005) “Inventories of Anthropogenic emissions by sources and removals by sinks of greenhouse gases”, available from: http://unfccc.int/resource/docs/2005/sbi/eng/18a02.pdf
11Devarajan, S., Go, D.S., Robinson, S. & Thierfelder, K. (2009) “Tax Policy to Reduce Carbon Emissions in South Africa.” World Bank.
18
Table 2: Sector emission trends and percentage changes from 1990
Sector GHG emissions CO2e (Gg – gigagrams) 1990 % of
total 1994 % of
total 2000 % of
total 2000 % change
from 1994
2000 % change
from 1990
Energy 260 886 75.1 297 564 78.3 344 106 78.9 15.6 31.9 Industrial processes and produce use
30 792 8.9 30 386 8.0 61 469 14.1 102.3 99.6
Agriculture 40 474 11.6 35 462 9.3 21 289 4.9 -40.0 -47.4 Waste 15 194 4.4 16 430 4.3 9 393 2.1 -42.8 -38.2 Total (without LULUCF)
347 346 379 842 436 257 25.6
Source: DEAT (2009) “Greenhouse Gas inventory South Africa 1990 to 2000: National Inventory Report”, May 2009.
Table 3: Greenhouse gas emission trends and percentage changes from 1990
GHG emissions CO2e (Gg)
1990 % of total
1994 % of total
2000 % of total
2000 % change
from 1994
2000 % change
from 1990
CO2 280 932 80.9 315 957 83.2 353 643 81.1 11.9 18.6 CH4 2 053 12.4 2 057 11.4 3 624 17.2 76.2 76.5 N2O 75 6.7 67 5.4 76.7 1.3 14.5 2.7 CF4 - - - 0.303 0.5 - - C2F6 - - - 0.027 0.06 - - Total CO2eqGg (without LULUCF)
347 346 379 842 436 257 14.8 25.6
Source: DEAT (2009) “Greenhouse Gas inventory South Africa 1990 to 2000: National Inventory Report”, May 2009.
Figure 2: Per capita GHG emissions (tons CO2e,excluding land-use change and forestry) for the year 1994 or the closest year reported
19
Source: UNFCCC (2005) “Inventories of Anthropogenic emissions by sources and removals by sinks of greenhouse gases”, available from: http://unfccc.int/resource/docs/2005/sbi/eng/18a02.pdf
20
4:Economics of climate change 25. Prices play a vital role in production and consumption decisions. Market prices, however, seldom
take into account the environmental effects of a good or service. The costs of mitigating GHG emissions and adapting to the impacts of climate change are not usually reflected in the final price of goods and services that generate these emissions. These costs are referred to as external costs, or environmental externalities, that are borne by society at large. Environmental externalities are inherent in economic activities but they become problematic when the assimilative capacity of the environment is exceeded and result in adverse impacts on the environment and human health.
26. In economics, the climate can be defined as a public good. The failure of the market to price
environmental resources such as air, groundwater and the ozone layer stems from the public good nature of these resources. It is important to acknowledge the public good nature of the climate that gives rise to external costs associated with climate change mitigation and adaptation.
27. The section below elaborates on the externality concept, briefly summarises the different techniques used to value the costs of GHG emissions and presents various estimates of these costs.
4.1 Externalities 28. An externality is a market failure that occurs when a cost or benefit is imposed on a third party that
is not directly involved in an economic activity or transaction. In other words, externalities refer to situations when the production and/or consumption of goods and services imposes costs or benefits on others that are not reflected in the prices charged for the goods and services being provided. An external cost is often referred to as a negative externality while the benefits are classified as a positive externality.
29. Consumers or producers have to bear all the costs or reap all the benefits of an economic activity because the final price of a good or service does not fully reflect the external costs or benefits of the activity. This may mean that resources will not be allocated to their most efficient use as a result of inappropriate pricing of the good or service. In the case of negative externalities, goods and services are likely to be underpriced, and this can lead to either excessive consumption or too little of a good or service being supplied. The graph below illustrates the negative environmental externalities (including local air pollution)
21
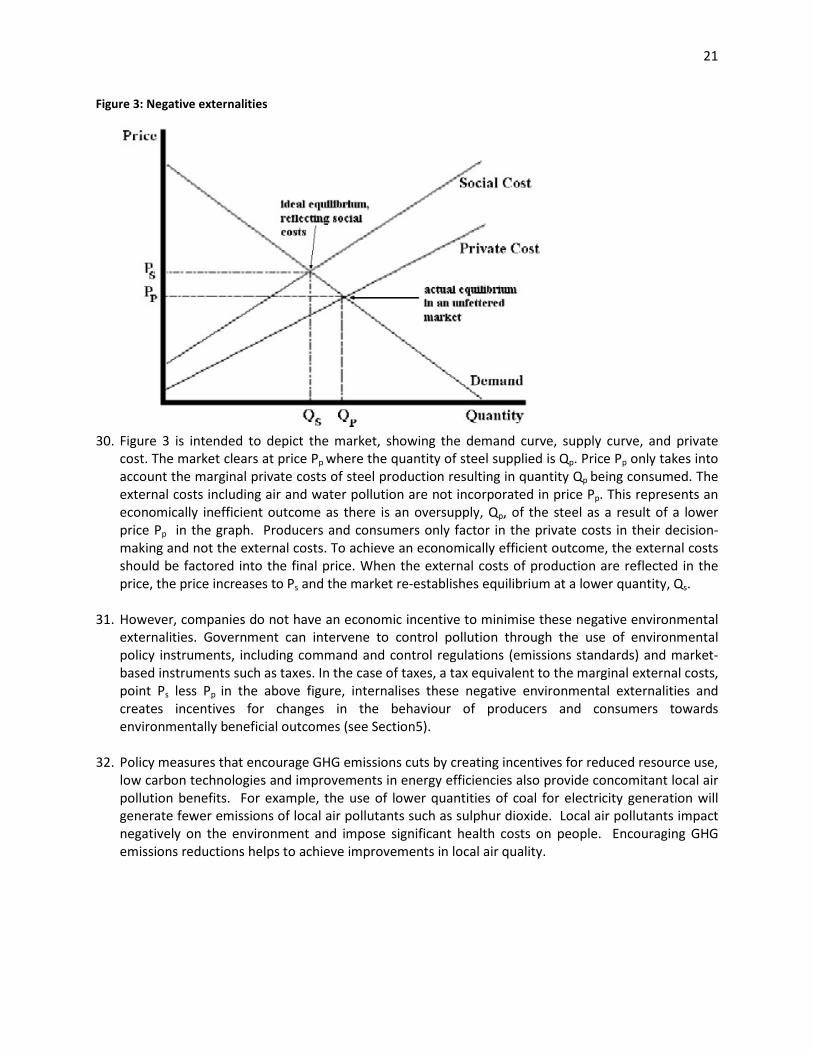
Figure 3: Negative externalities
30. Figure 3 is intended to depict the market, showing the demand curve, supply curve, and private
cost. The market clears at price Pp where the quantity of steel supplied is Qp. Price Pp only takes into account the marginal private costs of steel production resulting in quantity Qp being consumed. The external costs including air and water pollution are not incorporated in price Pp. This represents an economically inefficient outcome as there is an oversupply, Qp, of the steel as a result of a lower price Pp in the graph. Producers and consumers only factor in the private costs in their decision-making and not the external costs. To achieve an economically efficient outcome, the external costs should be factored into the final price. When the external costs of production are reflected in the price, the price increases to Ps and the market re-establishes equilibrium at a lower quantity, Qs.
31. However, companies do not have an economic incentive to minimise these negative environmental externalities. Government can intervene to control pollution through the use of environmental policy instruments, including command and control regulations (emissions standards) and market-based instruments such as taxes. In the case of taxes, a tax equivalent to the marginal external costs, point Ps less Pp in the above figure, internalises these negative environmental externalities and creates incentives for changes in the behaviour of producers and consumers towards environmentally beneficial outcomes (see Section5).
32. Policy measures that encourage GHG emissions cuts by creating incentives for reduced resource use, low carbon technologies and improvements in energy efficiencies also provide concomitant local air pollution benefits. For example, the use of lower quantities of coal for electricity generation will generate fewer emissions of local air pollutants such as sulphur dioxide. Local air pollutants impact negatively on the environment and impose significant health costs on people. Encouraging GHG emissions reductions helps to achieve improvements in local air quality.
22
4.2 External and social costs of carbon 33. From a climate change perspective, the external costs include the damages resulting from climatic
changes, and the costs to mitigate and adapt. The external cost of carbon12
is the cost of an additional ton of CO2e emitted into the atmosphere at a particular point in time and is determined by quantifying in monetary terms the damage costs of climate change, taking into account the residence time of CO2in the atmosphere.
34. There are two main approaches to estimate the marginal external costs of carbon:
• Marginal damage estimates – involves the direct valuation of the costs of climate change and includes assumptions on the expected degree of damage, climate risks and the frequency of extreme events.
• Cost effectiveness approach – indirect valuation of carbon, which quantifies the cost/price
trajectory that is needed to achieve a specific climate stabilisation target at least cost. 35. Marginal damage cost assessments of carbon have significant limitations. There are uncertainties
around the science of the impacts of climate change informing the economic effects. The use of limiting assumptions in economic modelling could further distort the final damage cost estimates. Concerns include:
• Risks of major changes in the climate system, such as reversal of deep ocean currents that
may create uncertainty over the accumulation of GHGs in the atmosphere and cannot be modelled.13
• Treatment of extreme, catastrophic risks.
• Existing valuation literature on predictable effects of climate change is outdated and generates inconsistent estimates.
• Difficult to assess the marginal damage costs of additions to the current stock of CO2 emissions that extend into future time periods.
• The use of discount rates in the treatment of large gains and losses in the distant future. This involves policy decisions that balance interests of present and future generations given the long-term horizon for climate change.
36. Studies have estimated the external costs of carbon linked to specific targets for stabilising GHG
emissions in the atmosphere (in line with work undertaken by the IPCC).The Stern Review argues that policy interventions should seek to stabilise emissions in the atmosphere to a maximum of 550ppmCO2e
14
12 The unit of measurement for carbon emissions into the atmosphere is the mass of the particle. Usually, these estimates are reported as the cost of CO2 or carbon emissions and is given according to the mass of the molecule that is, price per ton of CO2 or C where 1tonC is equivalent to 3.66tCO2.
and suggests that a global CO2price of $30/tCO2 would be needed to achieve this target. Some studies suggest total climate damage estimates in the region of1 to 2per cent of global
13 When there is a possibility of crossing a catastrophic threshold in atmospheric concentrations prior to future learning, which is not reversible given the non-negativity constraint on future emissions, benefits of short-term abatement are considerable (Pindyck 2007). 14Assumes a long-term stabilisation target of 550ppmCO2e which requires global emissions to peak within 20 years and emissions reductions in the region of 30 per cent by 2050 compared with 2000.
23
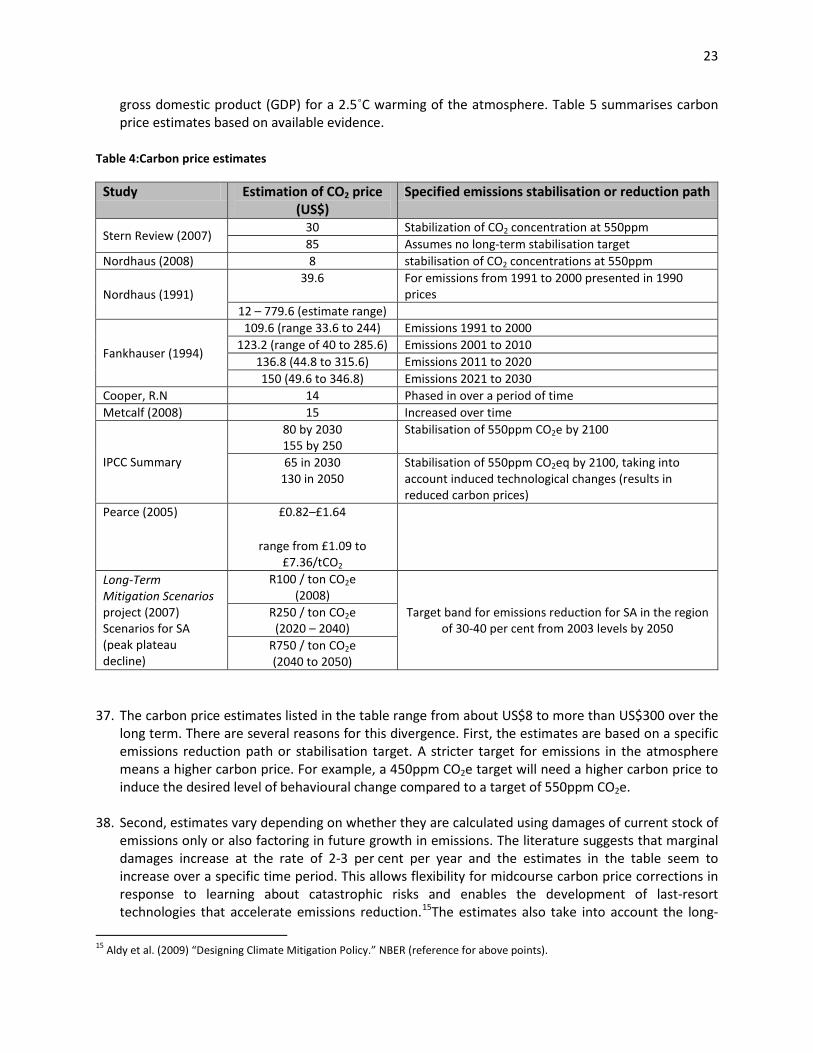
gross domestic product (GDP) for a 2.5˚C warming of the atmosphere. Table 5 summarises carbon price estimates based on available evidence.
Table 4:Carbon price estimates
Study Estimation of CO2 price (US$)
Specified emissions stabilisation or reduction path
Stern Review (2007) 30 Stabilization of CO2 concentration at 550ppm 85 Assumes no long-term stabilisation target
Nordhaus (2008) 8 stabilisation of CO2 concentrations at 550ppm
Nordhaus (1991) 39.6
For emissions from 1991 to 2000 presented in 1990 prices
12 – 779.6 (estimate range)
Fankhauser (1994)
109.6 (range 33.6 to 244) Emissions 1991 to 2000 123.2 (range of 40 to 285.6) Emissions 2001 to 2010
136.8 (44.8 to 315.6) Emissions 2011 to 2020 150 (49.6 to 346.8) Emissions 2021 to 2030
Cooper, R.N 14 Phased in over a period of time Metcalf (2008) 15 Increased over time
IPCC Summary
80 by 2030 155 by 250
Stabilisation of 550ppm CO2e by 2100
65 in 2030 130 in 2050
Stabilisation of 550ppm CO2eq by 2100, taking into account induced technological changes (results in reduced carbon prices)
Pearce (2005) £0.82–£1.64
range from £1.09 to £7.36/tCO2
Long-Term Mitigation Scenarios project (2007) Scenarios for SA (peak plateau decline)
R100 / ton CO2e (2008)
Target band for emissions reduction for SA in the region of 30-40 per cent from 2003 levels by 2050
R250 / ton CO2e (2020 – 2040)
R750 / ton CO2e (2040 to 2050)
37. The carbon price estimates listed in the table range from about US$8 to more than US$300 over the long term. There are several reasons for this divergence. First, the estimates are based on a specific emissions reduction path or stabilisation target. A stricter target for emissions in the atmosphere means a higher carbon price. For example, a 450ppm CO2e target will need a higher carbon price to induce the desired level of behavioural change compared to a target of 550ppm CO2e.
38. Second, estimates vary depending on whether they are calculated using damages of current stock of emissions only or also factoring in future growth in emissions. The literature suggests that marginal damages increase at the rate of 2-3 per cent per year and the estimates in the table seem to increase over a specific time period. This allows flexibility for midcourse carbon price corrections in response to learning about catastrophic risks and enables the development of last-resort technologies that accelerate emissions reduction.15
15 Aldy et al. (2009) “Designing Climate Mitigation Policy.” NBER (reference for above points).
The estimates also take into account the long-
24
term nature of the climate change problem and therefore differ according to the timeframe specified for achieving emissions stabilisation targets.
39. Third, the level of the discount rate used to value the costs of damages that will be imposed on future generations ranges from 0-5percent for the studies listed in the table. The long-term effects of our actions today need to be factored in the costing of climate change. Future generations will not experience any gains from current activities, but they are likely to incur costs to mitigate and adapt to the impacts of climate change. A higher discount rate may have benefits for current generations, but it shows little consideration of the damages imposed on future generations. For example, over a 200-year period, a discount rate of 4 per cent implies that damages of US$1 in the future is valued at US0.04 cents today. For a higher discount rate of 8percent, damages of $1 are valued at US0.0002 cents today, placing a small value on future climate change damages. Choosing the most appropriate discount rate to be used is important.
40. The Long-Term Mitigation Scenarios project, undertaken by the Department of Environmental
Affairs in 2006, modelled various carbon pricing scenarios through a tax on fossil fuel inputs. The modelling takes into account South Africa’s projected emissions trajectory, which is expected to peak between 2020 and 2025, level off and decline thereafter. Taking this into account, carbon taxes of R100-750 per ton of CO2 were modelled for the period 2008 to 2050.The study concluded that carbon taxes at all levels were most effective in achieving emissions reductions (See Section 9 for further details).The approach adopted in the Long-Term Mitigation Scenarios is largely in line with the studies presented in the table, which recommend the introduction of carbon prices at modest levels initially and increased over time. Most estimates of short-term CO2prices are relatively modest and in the region of US$5–30 per tonCO2, consistent with least-cost stabilisation of atmospheric CO2 concentrations at 550ppm.
25
5:Policy instruments to address climate change 41. The two main policy approaches used to address environmental challenges are command and
control (CAC) regulations and market-based instruments. CAC regulatory policy measures usually specify standards for emissions or prescribe technologies that polluters should use to maintain emissions below a certain limit. Market-based instruments use the price mechanism to encourage efficient pollution abatement responses and achieve emissions reductions in a cost-effective manner. The two main market-based instruments used to price CO2 are carbon taxes and emissions trading schemes.
42. The sections below consider the advantages and disadvantages of CAC and market-based
instrument policy measures and the economics of environmentally related Pigouvian taxation. Carbon taxes and emissions trading schemes are also compared.
5.1 Market-based instruments versus command and control measures 43. Market-based instruments such as environmentally related taxes have some advantages over CAC
measures. Market-based instruments offer companies flexibility in the way emissions are reduced and the quantity of emissions reduction that is achieved. Different firms are likely to face different costs to abate pollution. Those polluters who can reduce emissions at low cost will tend to do more, while those facing high abatement costs are likely to choose to do less. These are referred to as static efficiency gains, where individual firms have the choice whether to abate more or less. However, CAC instruments require all firms to comply with a specific regulation regardless of the costs to individual firms to abate pollution. Therefore, market-based instruments can reduce the overall cost to the economy for emissions reductions compared with less flexible regulatory instruments (see section 5.2).
44. Dynamic efficiency gains also exist for market-based instruments when polluters have a continuing
incentive to abate pollution through research and development and technological innovations. Where environmentally related taxes apply to pollution, polluters will face a cost for each unit of residual pollution equivalent to the tax on each unit of emissions. Firms that undertake all cost-effective abatement measures have an on-going incentive to innovate and develop new abatement methods to reduce their tax liability. With CAC regulatory measures the innovation incentive is limited, as the firm has no reason to go beyond compliance with the regulation. In instances where regulations are negotiated, polluters may be unwilling to exceed requirements as this could lead to stricter regulations for the firm in future.
45. Both CAC and market-based instruments could confer windfall profits on polluters. Market-based
instruments, however, provide opportunities to raise revenue. Limiting pollution through CAC and market-based instrument measures effectively reduces the output from polluting production processes. Firms are therefore able to raise output prices above the competitive level and earn additional profits (producer rents).The higher prices for output impose additional costs on the economy, including the worsening of inefficiencies caused by existing taxes on labour income. These effects may be observed with a wide range of instruments, but environmental taxes can raise revenue and allow for the recovery of producer rents created by environmental regulation. The
26
revenues raised may be used to reduce other distortionary taxes and generate the dual benefit of environmental gains– and possibly employment.
46. Market-based instruments are also robust in their operation. Generally, CAC measures involve significant information requirements about the abatement costs and opportunities for each individual polluter and government may need to enter into firm-by-firm bargaining. In contrast, setting a tax on emissions applies to all firms as stipulated in the relevant legislation and there is no need for government to enter into firm-by-firm bargaining on the basis of pollution abatement costs and the application of the tax. Importantly, this helps to maintain the environmental effectiveness of the policy as the potential for lobbying efforts and political pressure for exclusion from the tax base is minimised.
5.2 Environmentally related - Pigouvian taxation 47. An environmentally related Pigouvian tax (see page 5 of the Overview section) seeks to correct the
market price of a good or service by imposing a tax equivalent to the cost of the negative environmental externality or marginal external cost.
48. The tax internalises these externalities, which means that the external costs are integrated into the costs of producers and the purchase price of consumers. Producers and consumers face the full costs of production and consumption of that particular good and incentives are created for changes in their behaviour. The tax encourages reduced consumption of the good or service, and creates incentives to implement pollution abatement technologies and engage in further research and development. A key principle of Pigouvian taxes is that the tax should be uniformly applied and all polluters face the same tax rate, hence there is no tax differentiation between economic actors.
49. The appropriate rate of carbon tax should, in principle, reflect the marginal external costs of carbon –that is, the cost of an additional unit of CO2emitted into the atmosphere. The cost of the damages arising from climate change need to be estimated, and may include the costs of mitigation and adapting to climate change. Estimating the external cost of carbon, and therefore the Pigouvian tax, could prove to be very difficult.(Refer to sections 4.1 and 4.2, which elaborate on the externality concept and consider estimates of the external costs of carbon.)
50. Fullerton (2008) suggests setting an unambiguous price signal through a tax at a modest level initially with a commitment to increase it over time. This means that a partial, rather than immediate full internalisation of the external costs should be targeted. It is argued that CO2 stays in the atmosphere for hundreds of years, therefore implementing a carbon tax now and gradually increasing the level of the tax over time is more cost effective than having to undertake drastic emissions reductions in future. Such an approach also allows for the emergence of new information that might influence the appropriate time path for carbon prices.16
51. One of the great advantages of a carbon tax stems from the ability of market-based instruments to achieve efficient, least-cost emissions reductions.17
16 Fullerton, D., Leicester, A. & Smith, S. (2008) “Environmental Taxes”. NBER, Cambridge.
Taxes on CO2 may be able to reduce the costs of
17The potential use of environmental taxes is assessed by, among others, Smith (1992), OECD (1993, 1996), Bovenberg and Cnossen (1995), Fullerton (2001), Bovenberg and Goulder (2002), Stavins (2003), and Newell and Stavins (2003). The seminal work is Pigou (1920).
27
achieving a given level of environmental protection compared to traditionally implemented methods such as regulatory policies or emissions standards. This is usually the argument when the marginal cost of abating carbon emissions varies across firms or sectors. CAC policy instruments cannot fully differentiate between polluters with different marginal costs of abatement, and may force some to undertake high abatement costs that are less efficient. Market-based instruments provide each polluter with an incentive to abate in whichever way they see fit. Newell and Stavins (2003) find that the cost of abatement using CAC regulation can be several times the minimum cost achieved by using a carbon tax.
52. Market-based instruments equalise marginal abatement costs across all abatement opportunities within a company, or across various companies, production sectors and households by establishing a uniform emissions price. See Annexure 3.
5.3 Carbon pricing options: carbon taxes and emissions trading schemes 53. The two main market-based instruments used for putting a price on carbon and curbing GHG
emissions are carbon taxes and emissions trading schemes. The former seek to generate emissions reductions through the pricing of emissions directly, while the latter limit the quantity of emissions allowed and the carbon price is established through trade in allowances. Carbon taxes have been put in place in a number of European countries and the most notable example of an emissions trading scheme is the EUETS.
54. Carbon taxes and emissions trading schemes are similar instruments under ideal economic conditions of certainty, as they result in the same level of emissions reduction at the same cost (price).Emissions trading schemes are equivalent to taxes when emission allowances are auctioned to firms (and not granted freely), establishing a price for the allowances.
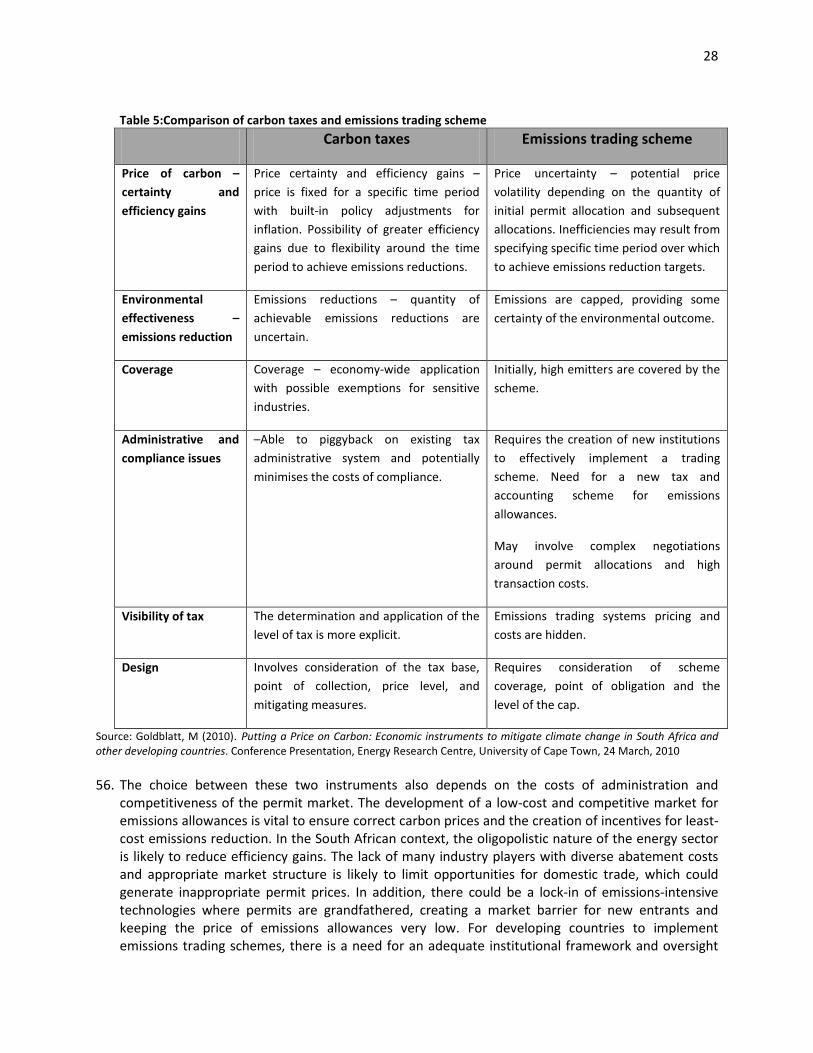
55. However, in the case of significant uncertainty of polluters’ abatement costs, the similarities between taxes and permits are reduced. Government has to determine the tax rate or the quantity of permits to be issued, which may not be the social optimum and could result in inefficiencies. Additional uncertainties arise for emissions trading schemes when the price of emission allowances remains low and the scheme is unable to create the correct incentives. For example, the price of carbon emission allowances under the EUETS appears to be too low due to the large number of free emissions allowance allocations among industrial users that drive down prices. Lower prices potentially create economic distortions as a result of unequal abatement incentives. If the EU opts for a higher emissions reduction target, an alternative mechanism would be needed to adequately reflect the costs of carbon and create correct incentives to encourage behavioural changes. Some observers argue that a rising EU-wide carbon tax may be a better way to raise carbon costs.18
18The Economist (2010) “Europe and Climate Change: Two into Three Won’t Go”, 29 May 2010.
28
Table 5:Comparison of carbon taxes and emissions trading scheme
Carbon taxes Emissions trading scheme
Price of carbon – certainty and efficiency gains
Price certainty and efficiency gains – price is fixed for a specific time period with built-in policy adjustments for inflation. Possibility of greater efficiency gains due to flexibility around the time period to achieve emissions reductions.
Price uncertainty – potential price volatility depending on the quantity of initial permit allocation and subsequent allocations. Inefficiencies may result from specifying specific time period over which to achieve emissions reduction targets.
Environmental effectiveness – emissions reduction
Emissions reductions – quantity of achievable emissions reductions are uncertain.
Emissions are capped, providing some certainty of the environmental outcome.
Coverage Coverage – economy-wide application with possible exemptions for sensitive industries.
Initially, high emitters are covered by the scheme.
Administrative and compliance issues
–Able to piggyback on existing tax administrative system and potentially minimises the costs of compliance.
Requires the creation of new institutions to effectively implement a trading scheme. Need for a new tax and accounting scheme for emissions allowances.
May involve complex negotiations around permit allocations and high transaction costs.
Visibility of tax The determination and application of the level of tax is more explicit.
Emissions trading systems pricing and costs are hidden.
Design Involves consideration of the tax base, point of collection, price level, and mitigating measures.
Requires consideration of scheme coverage, point of obligation and the level of the cap.
Source: Goldblatt, M (2010). Putting a Price on Carbon: Economic instruments to mitigate climate change in South Africa and other developing countries. Conference Presentation, Energy Research Centre, University of Cape Town, 24 March, 2010
56. The choice between these two instruments also depends on the costs of administration and
competitiveness of the permit market. The development of a low-cost and competitive market for emissions allowances is vital to ensure correct carbon prices and the creation of incentives for least-cost emissions reduction. In the South African context, the oligopolistic nature of the energy sector is likely to reduce efficiency gains. The lack of many industry players with diverse abatement costs and appropriate market structure is likely to limit opportunities for domestic trade, which could generate inappropriate permit prices. In addition, there could be a lock-in of emissions-intensive technologies where permits are grandfathered, creating a market barrier for new entrants and keeping the price of emissions allowances very low. For developing countries to implement emissions trading schemes, there is a need for an adequate institutional framework and oversight
29
body to ensure transparency in the allowance market, and rules for measuring, reporting and verifying emissions.
57. Although taxes and tradable permit schemes achieve least-cost emissions reductions in a given
period, over time price stability through taxation will reduce the long-term costs of carbon emissions cuts.19The tax system generates economic efficiency gains where emissions allowances are grandfathered. In addition, the tax raises revenues that could be used to reduce distortionary taxes and generate double dividend benefits.20
Although a carbon tax does not set a fixed quantitative limit for emissions over the short term, a tax at an appropriate level and phased in over time to the “correct level” will provide a strong price signal to both producers and consumers to change their behaviour over the medium to long term. In practice, the application of both environmentally related taxes and trading schemes requires careful consideration of their design, which is influenced not only by the objectives of economic efficiency, but also by other factors such as sectoral competitiveness and income distribution.
58. Given the developing nature of the South African economy, the implementation of a domestic emissions trading scheme does not present the most appropriate policy response to mitigate climate change in the short term. The reasons include:
• The administrative complexity of a cap-and-trade system • The uncertain environmental outcomes of some current regional emissions trading systems • The windfall gains experienced by some stakeholders • The uncertain economic costs to business. • The controversy associated with setting specific targets.
19 Freebairn, J. (2009) “Carbon Taxes vs. Tradable Permits: Efficiency and Equity Effects for a Small Open Economy”. University of Melbourne. 20 OECD (2008) “Environmentally Related Taxes and Tradable Permit Systems in Practice”.
30
6:Tax policy design considerations 6.1 Tax base and administration 59. Countries that have introduced carbon taxes or environmentally related taxes on energy have
generally used new excise taxes, which are applicable to the quantity of energy sold, and levied at a specific point in the supply chain. The tax serves as a proxy for an emissions tax rather than a tax levied directly on emissions.
60. An important characteristic of the tax system is to minimise the costs of administration and compliance for taxpayers. The key factor affecting the administrative costs of any tax instrument is the number of agents liable for payment of the tax. A tax that broadly covers many producers and consumers may be associated with large administrative costs. Arguably, taxing the inputs from which the pollutant arises as a by-product may result in significantly lower administrative costs. A second important determinant of administrative costs is measurability of the base. In most cases carbon emissions levels are likely to be more difficult to measure, report and record than input or output levels. Heterogeneity across industries and their technologies could further complicate the tax system.
61. Below we evaluate the different tax bases for their practical feasibility, their ability to create and
maintain incentives for changes in behaviour and achieve actual emissions reductions. The importance of measurement, verification and reporting systems to ensure the smooth implementation of a carbon tax is also emphasised.
6.1.1 Tax base: actual measured emissions
62. Ideally, a tax to curb atmospheric emissions of GHGs should be levied directly on the entity responsible for the emissions and based on the quantity of GHGs emitted. In principle, environmental taxes based directly on measured emissions can be very precisely targeted. When polluting emissions rise, the polluter’s tax liability rises and they pay additional tax proportional to the increase in emissions. Similarly, action by the polluter to reduce their tax liability results in a reduction in emissions.
63. In practice, this proves to be administratively complex because there are a number of emissions sources to monitor and measure. Practical examples of such taxes include Sweden’s tax on nitrogen oxides emissions (Millock and Sterner, 2004), and emissions charges for water pollution in the Netherlands (Bressers and Lulofs, 2004).In these cases, there are a small number of emissions sources involved. Arguably, it is important to relate the incentive precisely to the amount of pollution emitted rather than basing the tax on a more easily assessed proxy for emissions.21
64. To be able to apply the carbon tax on actual GHG emissions would require technological capacity or a system to measure and monitor the quantity of emissions. These costs will depend on the costs of measurement per source, the number of separate emissions sources that need to be covered and the extent to which measurement is incurred solely for regulatory and compliance purposes, rather than as part of normal business activities. This option is a first-best solution because it precisely
21 Smith, S (2008) “Environmentally related Taxes and Tradable Permit Systems in Practice”. OECD, University College, London.
31
targets the measured pollutant, which achieves the environmental and emissions reduction objectives.
65. Where the additional administrative costs of a direct charge for measured emissions are high, restructuring the existing tax system may provide an alternative way of introducing fiscal incentives to reduce environmental damage. An alternative to direct taxation of emissions is to set or modify a rate of indirect tax (excise duty) on fuel inputs.
6.1.2 Proxy tax bases
66. A proxy carbon tax base appears to be administratively more feasible than a pure tax on measured
carbon emissions. Two options exist for applying such a tax: upstream, where fuels enter the economy according to a fuel’s carbon content or downstream, on emitters at the point where fuels are combusted.22
Administrative costs are reduced if the tax is levied upstream on fuel producers rather than downstream on fuel users. Regulating GHG emissions at upstream facilities would likely involve fewer entities (coal mines or large burning coal facilities, oil refineries, and natural gas processors) than a purely downstream approach that regulates only large stationary emitters (primarily electricity generators and industrial sources).
67. A primary carbon tax, levied on primary fuels where they are mined, extracted or imported (e.g. crude oil, coal, and gas) would have some advantages relative to excises levied on final fuel products sold to industrial users or households(e.g. petrol).It would involve fewer taxpayers than a final tax, and it would have no need for fiscal supervision of the energy chain beyond the first point. Administrative costs would be expected to be low, and tight supervision could prevent evasion.
68. A tax on inputs could be applied to the different fossil fuels as follows:
• At the mine mouth for domestic coal, and at the border for imported coal. The tax would be based on the amount of coal extracted.
• Natural gas could be taxed at the processor or on import. • Petroleum products could be taxed on the crude as it enters the refinery or on the various
products produced from crude oil along with refinery process emissions.
69. Natural gas emits the least CO2 of any fossil fuel when burned, making it the most carbon-efficient fossil fuel. The majority of natural gas comes from stand-alone wells. Therefore the operating level or processing plant are the two most likely places to apply such a carbon tax. A potential problem with taxing the operator would be that some natural gas is put into the pipeline system without processing.
70. The benefits of using a proxy tax base is the close correlation between the energy source carbon content and the eventual levels of emissions, due to the lack of or unavailability of viable end-of-pipe emissions cleaning/reducing technologies. In principle, the carbon content of every form of fossil fuel, from anthracite to lignite coal, and residual oil to natural gas, is known and proportional to the quantity of CO2 released into the atmosphere when the fuel is burned.
22 In line with the EUETS.
32
71. The piggybacking of environmental taxes onto existing taxes may cost significantly less than setting up a new administrative system with apparatus and procedures. In practice, per unit of energy (or BTU), natural gas emits the least CO2 of any fossil fuel when burned, and coal the most, with petroleum (oil) products such as gasoline occupying the middle range. Generally, a BTU from coal produces 30 per cent more CO2than a BTU from oil, and 80 per cent more than natural gas. A proxy carbon tax should be in line with these ratios, with coal taxed at a marginally higher rate than petroleum products and at much higher rate than natural gas.
72. A potential drawback of proxy tax bases is that they are less precisely targeted to emissions than measured-emissions taxes, and may encourage an inefficient pattern of polluter responses (Sandmo, 1976).However, Fullerton et al. (2008), argues that the application of a carbon tax at an earlier stage in the production chain does not necessarily mean any difference in the economic incidence of the tax or its environmental effectiveness. There is an added advantage to applying the tax earlier as it would accurately reflect the carbon emissions during processing as well as in the final product, and encourage lower processing emissions, as well as the use of fuel products containing less carbon.
73. An exact equivalence could be achieved with fuel excises if these could be differentiated according to the carbon emissions associated with the processing of each product – its carbon “history” – as well as its actual content. Where different processing technologies are used resulting in different emissions during processing, a final tax levied on the basis of average carbon emissions during processing is likely to lead to inefficient technology choices, creating disincentives for firms to adopt low-emissions processes. In principle, a primary carbon tax is likely to be more efficient in both static and dynamic terms.23
74. Poterba and Rotemberg (1995) consider the case of the joint production of final fuel products where the output mix is a choice variable. In other words, a single primary fuel is processed into more than one final fuel product, and the mix of final fuels produced can be varied. They show that no objective basis can be used to estimate the intermediate carbon emissions associated with the production of particular final fuels. One implication of this argument is that environmental and economic efficiency is unlikely to be fully attainable with a carbon tax levied on final fuel products.24
75. A potential problem of linkage arises for indirect environmental taxes on inputs when pollution abatement can be efficiently achieved through effluent “cleaning” at the end of the production process. A tax on carbon content of fuels would lead to efficient abatement of GHG emissions, where effluent cleaning is not a commercially viable option. In a dynamic context, however, it would provide no incentive to develop new end-of-pipe technologies. The acceptability of a carbon tax on fuel inputs rather than on measured emissions therefore depends on the likely speed of these technological developments and the extent to which their development might be inhibited by the choice of a tax on inputs rather than on measured emissions.
76. Non-combustion CO2emissions account for a relatively small proportion of total CO2 emissions. For example, the emissions in cement manufacturing are generated from the production of clinker. Where a broad based carbon tax is considered, the tax should therefore be implemented and administered at this level. The infeasibility of monitoring emissions from vehicles, home heating
23 Fullerton, D., Leicester, A. & Smith, S. (2008) “Environmental Taxes”. NBER, Cambridge. 24 Fullerton, D., Leicester, A. & Smith, S. (2008) “Environmental Taxes”. NBER, Cambridge.
33
fuels and small-scale industrial boilers in a downstream system can be largely addressed through midstream measures targeted at refined transportation and heating fuels, which narrows the cost discrepancy between upstream and downstream systems.
77. Some argue that the tax should be levied downstream to ensure that the carbon price is more visible to end users and more likely to figure into energy consumption and planning decisions.25
Fullerton (2008), suggests that such an argument ignores the basic principle of tax incidence analysis, where the ultimate burden and behavioural response to a tax does not depend on where in the production process the tax is levied. Recently, economists have studied consumer responses to the visibility of the tax. In the case of carbon taxes, according to Fullerton, this effect is likely to be quite small for two reasons:
• Firms can advertise the embedded tax so that consumers would be aware that part of the cost of the fuel includes the tax they are paying.
• Key energy consumers—electric utilities and industrial energy users—are unlikely to be affected by this behavioural phenomenon. They are more influenced by the final price of energy, whether that price is affected by taxes or other factors. Offsetting any apparent advantage of downstream visibility is the greater administrative burden of levying the tax on many more firms and individuals.
78. There are two key differences between upstream and downstream points of taxation. First,
upstream systems should be combined with a crediting system to encourage development and adoption of carbon capture and storage technologies at coal plants and industrial sources. It might be necessary to provide tax credits for carbon capture and storage at downstream levels and for fossil fuels used as feedstock in manufacturing activities where the carbon is permanently stored.
79. Carbon capture and storage refers to technologies that remove carbon from the exhaust streams of fossil fuel-burning plants and store it underground – either locally or after transportation to a storage site – for many centuries. For example, electric utilities that burn coal in an advanced boiler with carbon capture and storage, technology would be allowed a tax credit or rebate equal to the tax paid on the carbon that is stored. The tax credit should equal the amount of carbon sequestered (measured by continuous emissions monitoring systems) multiplied by the emissions price.
80. Tax credits could also be an issue for fossil fuels that are used for purposes other than combustion to produce energy, which do not release the full amount of emissions. This includes feedstock (percentage of carbon stored: 62 per cent), the production of asphalt (100 per cent) or lubricants (4 per cent).An upstream tax would include such products in the tax base. One solution would be to allow certain products to receive partial tax rebates.
81. The use of indirect environmental taxes such as input taxes on carbon-based fuels is unlikely to achieve an efficient pattern of polluter responses on its own. Particularly when pollution abatement can efficiently be achieved through effluent cleaning at the end of the production process. For example, the cleaning of sulphur dioxide emissions of coal-fired power stations by fitting a “scrubber” (flue gas desulphurisation equipment).In these cases, taxes on production inputs alone cannot effectively encourage an efficient pattern of pollution abatement. A tax on the sulphur content of coal may discourage the use of this polluting material in production but it provides no
25 Duff (2008). “Carbon Taxation in British Columbia”. Vermont Journal of Environmental Law10, pp 87-107.
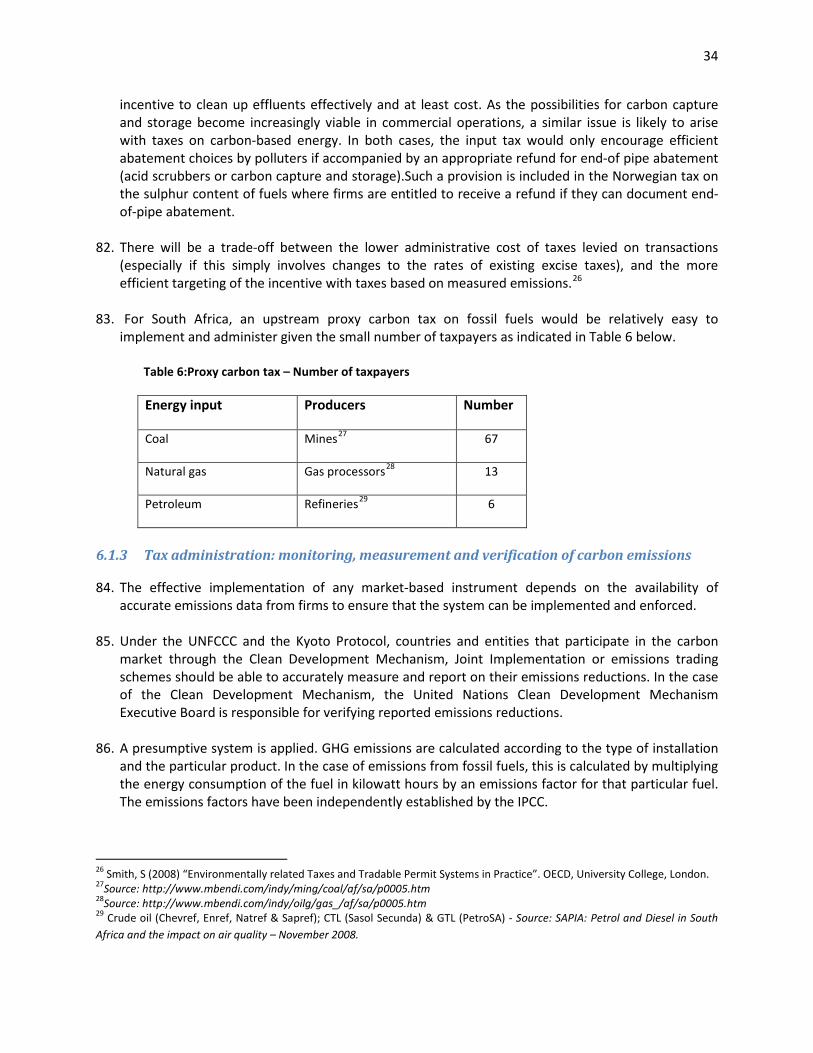
34
incentive to clean up effluents effectively and at least cost. As the possibilities for carbon capture and storage become increasingly viable in commercial operations, a similar issue is likely to arise with taxes on carbon-based energy. In both cases, the input tax would only encourage efficient abatement choices by polluters if accompanied by an appropriate refund for end-of pipe abatement (acid scrubbers or carbon capture and storage).Such a provision is included in the Norwegian tax on the sulphur content of fuels where firms are entitled to receive a refund if they can document end-of-pipe abatement.
82. There will be a trade-off between the lower administrative cost of taxes levied on transactions (especially if this simply involves changes to the rates of existing excise taxes), and the more efficient targeting of the incentive with taxes based on measured emissions.26
83. For South Africa, an upstream proxy carbon tax on fossil fuels would be relatively easy to implement and administer given the small number of taxpayers as indicated in Table 6 below.
Table 6:Proxy carbon tax – Number of taxpayers
Energy input Producers Number
Coal Mines27 67
Natural gas Gas processors28 13
Petroleum Refineries29 6
6.1.3 Tax administration: monitoring, measurement and verification of carbon emissions
84. The effective implementation of any market-based instrument depends on the availability of
accurate emissions data from firms to ensure that the system can be implemented and enforced.
85. Under the UNFCCC and the Kyoto Protocol, countries and entities that participate in the carbon market through the Clean Development Mechanism, Joint Implementation or emissions trading schemes should be able to accurately measure and report on their emissions reductions. In the case of the Clean Development Mechanism, the United Nations Clean Development Mechanism Executive Board is responsible for verifying reported emissions reductions.
86. A presumptive system is applied. GHG emissions are calculated according to the type of installation and the particular product. In the case of emissions from fossil fuels, this is calculated by multiplying the energy consumption of the fuel in kilowatt hours by an emissions factor for that particular fuel. The emissions factors have been independently established by the IPCC.
26 Smith, S (2008) “Environmentally related Taxes and Tradable Permit Systems in Practice”. OECD, University College, London. 27Source: http://www.mbendi.com/indy/ming/coal/af/sa/p0005.htm 28Source: http://www.mbendi.com/indy/oilg/gas_/af/sa/p0005.htm 29 Crude oil (Chevref, Enref, Natref & Sapref); CTL (Sasol Secunda) & GTL (PetroSA) - Source: SAPIA: Petrol and Diesel in South Africa and the impact on air quality – November 2008.
35
87. The EUETS has shown divergences in the monitoring, reporting and verification practices of member states. Currently, it is the responsibility of companies participating in the scheme to apply for a permit from their regulating authority to cover the six GHG emissions covered in the Kyoto Protocol. This permit certifies that a firm is capable of producing an emissions report and can accurately monitor its GHG emissions. Each firm must submit a report on its emissions on an annual basis, and it must be verified by an independent verification body. The current guidelines will be replaced by harmonised regulations from 2013. Verifiers will be able to seek a single accreditation that is valid in all EU member states.
88. The United States Environmental Protection Agency has issued the mandatory reporting of GHGs rule. The rule requires the reporting of GHG emissions from large sources and suppliers in the United States, and is intended to collect accurate and timely emissions data to inform future policy decisions. The Environmental Protection Agency decided upon a combination of direct emissions measurement and facility-specific calculations.
89. In Australia, the National Greenhouse and Energy Act (2007) states that all businesses must apply for registration with the Greenhouse and Energy Data Officer and registered corporations must report their GHG emissions, energy use and production for each year in which they meet a threshold. The National Greenhouse and Energy Reporting (Measurement) Determination 2008 introduced a single national framework for the reporting and assurance of information related to GHG emissions and projects, energy consumption and energy production.
90. The Carbon Disclosure Project is a voluntary international initiative that companies can participate in by submitting annual reports on their emissions profile. South Africa’s first Carbon Disclosure Project report generated a high response rate from the top JSE-listed companies. Table 8 below shows that South Africa’s carbon emissions are dominated by a few large players: Sasol, BHP Billiton and Anglo American, which are listed companies, and Eskom, a non-listed company. The Carbon Disclosure Project can play an important role in providing baseline company data on measured GHG emissions that should ideally feed into a future compulsory measuring, reporting and verification system, to be administered by the Department of Environmental Affairs in terms of the National Environmental Management: Air Quality Act (2004).
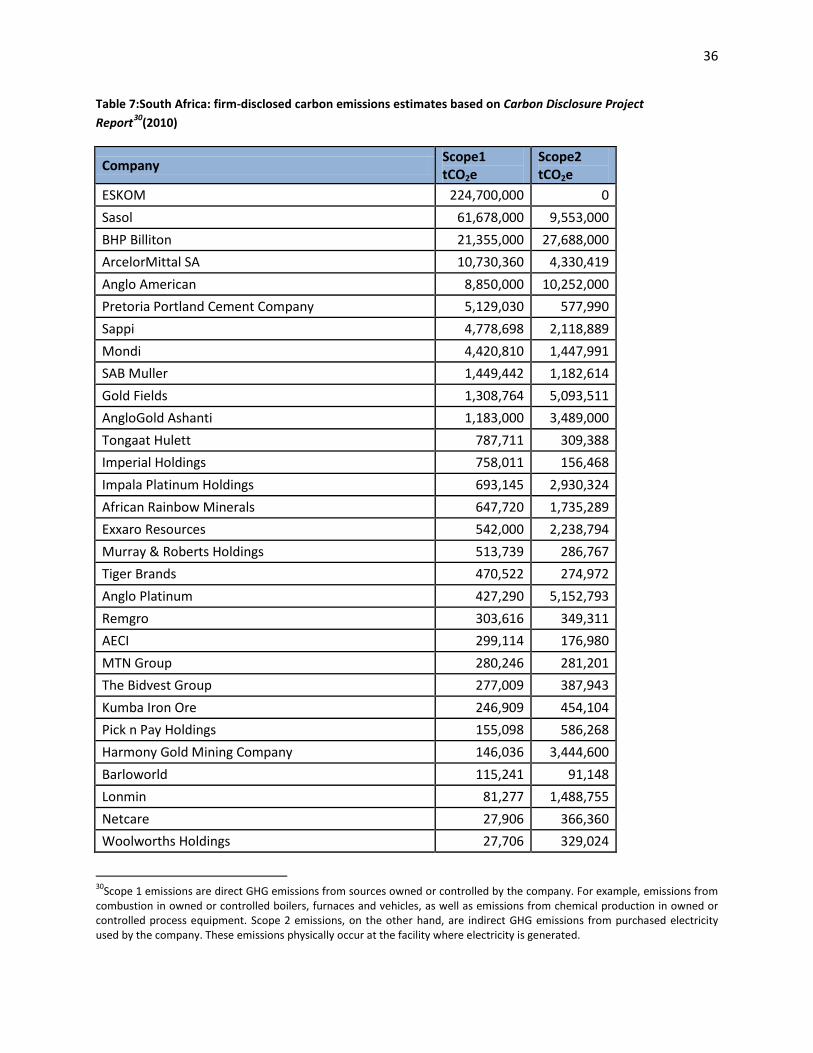
36
Table 7:South Africa: firm-disclosed carbon emissions estimates based on Carbon Disclosure Project Report30
Company
(2010)
Scope1 tCO2e
Scope2 tCO2e
ESKOM 224,700,000 0
Sasol 61,678,000 9,553,000
BHP Billiton 21,355,000 27,688,000
ArcelorMittal SA 10,730,360 4,330,419
Anglo American 8,850,000 10,252,000
Pretoria Portland Cement Company 5,129,030 577,990
Sappi 4,778,698 2,118,889
Mondi 4,420,810 1,447,991
SAB Muller 1,449,442 1,182,614
Gold Fields 1,308,764 5,093,511
AngloGold Ashanti 1,183,000 3,489,000
Tongaat Hulett 787,711 309,388
Imperial Holdings 758,011 156,468
Impala Platinum Holdings 693,145 2,930,324
African Rainbow Minerals 647,720 1,735,289
Exxaro Resources 542,000 2,238,794
Murray & Roberts Holdings 513,739 286,767
Tiger Brands 470,522 274,972
Anglo Platinum 427,290 5,152,793
Remgro 303,616 349,311
AECI 299,114 176,980
MTN Group 280,246 281,201
The Bidvest Group 277,009 387,943
Kumba Iron Ore 246,909 454,104
Pick n Pay Holdings 155,098 586,268
Harmony Gold Mining Company 146,036 3,444,600
Barloworld 115,241 91,148
Lonmin 81,277 1,488,755
Netcare 27,906 366,360
Woolworths Holdings 27,706 329,024
30Scope 1 emissions are direct GHG emissions from sources owned or controlled by the company. For example, emissions from combustion in owned or controlled boilers, furnaces and vehicles, as well as emissions from chemical production in owned or controlled process equipment. Scope 2 emissions, on the other hand, are indirect GHG emissions from purchased electricity used by the company. These emissions physically occur at the facility where electricity is generated.
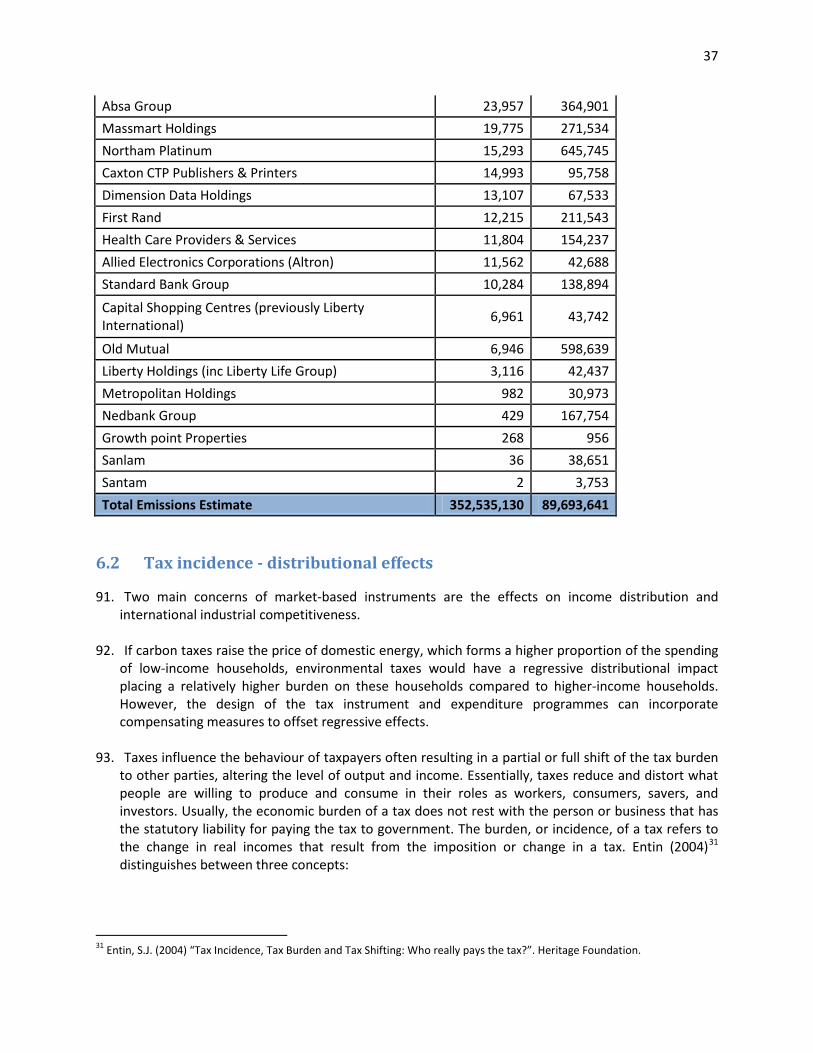
37
Absa Group 23,957 364,901
Massmart Holdings 19,775 271,534
Northam Platinum 15,293 645,745
Caxton CTP Publishers & Printers 14,993 95,758
Dimension Data Holdings 13,107 67,533
First Rand 12,215 211,543
Health Care Providers & Services 11,804 154,237
Allied Electronics Corporations (Altron) 11,562 42,688
Standard Bank Group 10,284 138,894
Capital Shopping Centres (previously Liberty International)
6,961 43,742
Old Mutual 6,946 598,639
Liberty Holdings (inc Liberty Life Group) 3,116 42,437
Metropolitan Holdings 982 30,973
Nedbank Group 429 167,754
Growth point Properties 268 956
Sanlam 36 38,651
Santam 2 3,753
Total Emissions Estimate 352,535,130 89,693,641 6.2 Tax incidence - distributional effects 91. Two main concerns of market-based instruments are the effects on income distribution and
international industrial competitiveness. 92. If carbon taxes raise the price of domestic energy, which forms a higher proportion of the spending
of low-income households, environmental taxes would have a regressive distributional impact placing a relatively higher burden on these households compared to higher-income households. However, the design of the tax instrument and expenditure programmes can incorporate compensating measures to offset regressive effects.
93. Taxes influence the behaviour of taxpayers often resulting in a partial or full shift of the tax burden
to other parties, altering the level of output and income. Essentially, taxes reduce and distort what people are willing to produce and consume in their roles as workers, consumers, savers, and investors. Usually, the economic burden of a tax does not rest with the person or business that has the statutory liability for paying the tax to government. The burden, or incidence, of a tax refers to the change in real incomes that result from the imposition or change in a tax. Entin (2004)31
distinguishes between three concepts:
31 Entin, S.J. (2004) “Tax Incidence, Tax Burden and Tax Shifting: Who really pays the tax?”. Heritage Foundation.
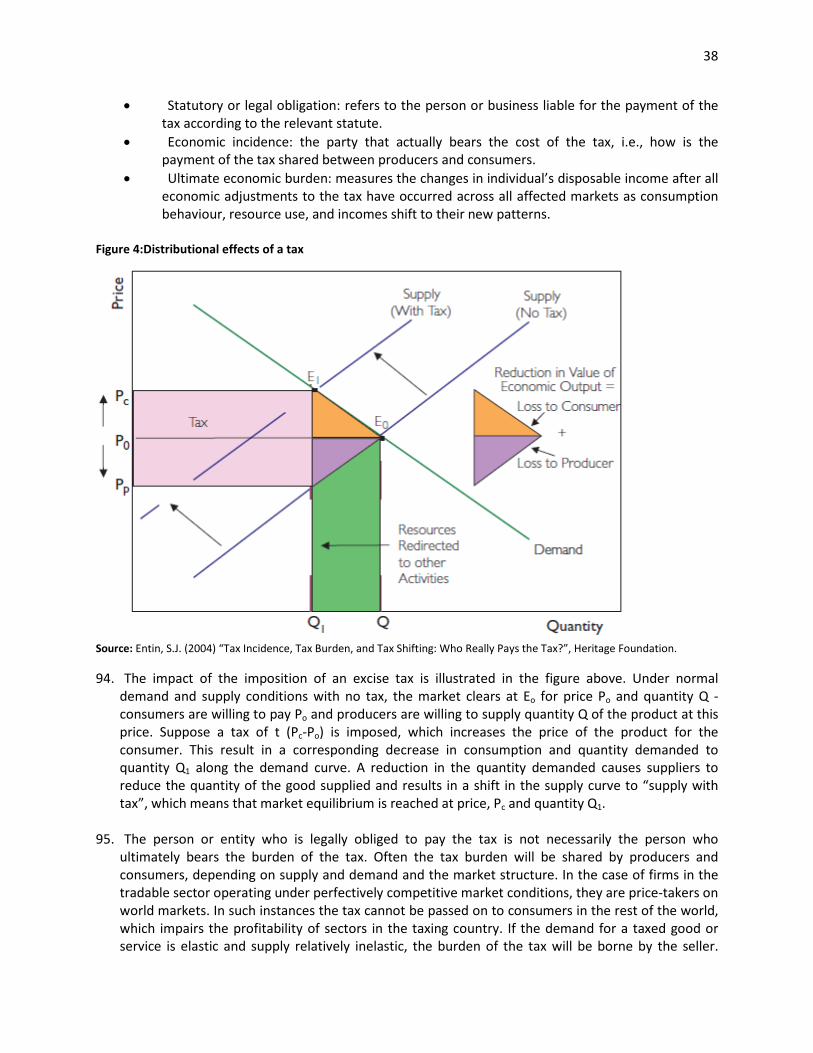
38
• Statutory or legal obligation: refers to the person or business liable for the payment of the tax according to the relevant statute.
• Economic incidence: the party that actually bears the cost of the tax, i.e., how is the payment of the tax shared between producers and consumers.
• Ultimate economic burden: measures the changes in individual’s disposable income after all economic adjustments to the tax have occurred across all affected markets as consumption behaviour, resource use, and incomes shift to their new patterns.
Figure 4:Distributional effects of a tax
Source: Entin, S.J. (2004) “Tax Incidence, Tax Burden, and Tax Shifting: Who Really Pays the Tax?”, Heritage Foundation. 94. The impact of the imposition of an excise tax is illustrated in the figure above. Under normal
demand and supply conditions with no tax, the market clears at Eo for price Po and quantity Q - consumers are willing to pay Po and producers are willing to supply quantity Q of the product at this price. Suppose a tax of t (Pc-Po) is imposed, which increases the price of the product for the consumer. This result in a corresponding decrease in consumption and quantity demanded to quantity Q1 along the demand curve. A reduction in the quantity demanded causes suppliers to reduce the quantity of the good supplied and results in a shift in the supply curve to “supply with tax”, which means that market equilibrium is reached at price, Pc and quantity Q1.
95. The person or entity who is legally obliged to pay the tax is not necessarily the person who ultimately bears the burden of the tax. Often the tax burden will be shared by producers and consumers, depending on supply and demand and the market structure. In the case of firms in the tradable sector operating under perfectively competitive market conditions, they are price-takers on world markets. In such instances the tax cannot be passed on to consumers in the rest of the world, which impairs the profitability of sectors in the taxing country. If the demand for a taxed good or service is elastic and supply relatively inelastic, the burden of the tax will be borne by the seller.
39
Buyers bear the burden of the tax on a good or service with inelastic demand and elastic supply. Similar demand and supply elasticities will imply equal sharing of the excise tax burden between buyers and sellers.
96. Measures to mitigate the impact of carbon taxes on low-income households should be considered. Such measures could include additional personal income tax relief and/or higher transfers to poorer households.32In the South African context, this can take the form of a more effective and targeted roll-out of free basic services (electricity and water) and block tariffs for both water and electricity consumed by households. In addition, high distortionary taxes such as payroll taxes can be reduced. The adoption of phasing-in policies according to a specific timeframe and helping workers to retrain or move to other forms of employment, are examples of measures that can help to smooth the transition to a low-carbon economy and minimise adverse impacts on employment.33
6.3 Competitiveness 97. The imposition of a carbon tax would have different effects on the international competitiveness of
industrial sectors depending on their GHG emissions intensity and the extent to which they are exposed to trade in international markets. The structure of the sector determines the extent to which firms can pass on some or all of the tax to consumers domestically and abroad. Under perfectly competitive market conditions, where the firm is a price taker, it is difficult for firms to recover these costs and the tax might reduce the profitability of the firm. In instances where the costs can be passed on fully or partially, the prices of goods and services prices will increase. Where firms in other jurisdictions are not subject to similar taxes (or other forms of carbon pricing), domestic firms could potentially face contractions due to unfair competition. It can also result in the international displacement of carbon-intensive production to countries that do not impose a price on carbon.
98. The net impact of the carbon tax is to reduce the relative competitive position of carbon-intensive sectors and improve the position of sectors with low carbon intensity. One of the desired long-term outcomes of a carbon tax is the contraction of carbon-intensive sectors that are expected to result in a net reduction in emissions.
99. Possible measures to neutralise or minimise the potential negative effects on the competitiveness of trade-exposed sectors include temporary sectoral exemptions or reduced tax rates. Temporary exemptions or reduced rates give businesses in carbon-intensive sectors time to adjust to the new policy environment. The effectiveness of these concessions will depend on the:
• Extent of actual and potential trade (imports and/or exports) • Nature of the market (competitive pressures will be stronger in markets for price-sensitive,
homogeneous commodities than for differentiated goods where price is only one of many attributes affecting sales)
• Significance of the environmental tax as a cost element.
100. However, such concessions raise a number of questions around economic efficiency, international coordination and political economy. When exemptions are granted to the most emissions-intensive
32 Fullerton, D., Leicester, A. & Smith, S. (2008) “Environmental Taxes”. NBER, Cambridge. 33 OECD (2007) “Policy Brief: Climate Change Policies”. OECD Observer.
40
sectors it reduces the effectiveness of the environmental tax and can require large increases in the rates of tax applying to emissions in other sectors in order to meet overall environmental goals. Sectoral concessions create uneven abatement incentives across sectors, which risks abatement inefficiency.
101. According to Fullerton, competitive pressures are unlikely to be so severe as to warrant complete exemption. He argues that the exchange-rate adjustments that would follow the introduction of an environmental tax would partly offset competitive pressures across all sectors. A case might be made for alternative regulations for sectors enjoying some form of temporary concessions, in order to reduce the resulting abatement inefficiencies.34
102. Any form of sectoral concessions raises important political economy considerations, given the advantages conferred on sectors that benefit from these measures compared to those that do not qualify. Lobbying efforts are likely to increase as sectors seek to influence the scope of tax exemptions and/or reductions. Businesses will divert resources and incur costs to influence the form of these arrangements and similarly government will incur costs to contain lobbying. A particularly problematic feature of sectoral tax exemptions and reductions is that once in place they become extremely difficult to reverse or change given their value to the beneficiaries.
103. In summary, special relief measures present several difficulties: • They are likely to lead to inefficiency in abatement. • Sectors likely to lobby for relief would tend to be those with the highest level of emissions,
and hence the greatest scope for abatement. If relief measures are approved, the same overall environmental effect will require more abatement elsewhere.
• Significant resources are likely to be consumed in socially unproductive (but privately profitable) lobbying.35
104. Competitiveness concerns might be best dealt with by the gradual phasing-in of a carbon tax, from relatively modest levels to more realistic levels, reflecting the full external costs, over the medium term. Clear policy signals will provide all role-players with certainty of the price trajectory for carbon.
105. Some would argue that the early adoption of a low carbon-intensive growth path can result in a competitive advantage in a world that is increasingly concerned about the possible impact of climate change and other forms of environmental degradation.
6.4 Border tax adjustments 106. A number of papers suggest that carbon-based tariffs or border tax adjustments policy proposals
are aimed at countries that do not participate in global emissions reduction agreements (Whalley &
34 An example where alternative regulation is applied to sectors paying an environmental tax at a lower rate can be seen in the UK Climate Change Programme. This requires sectors to make quantitative commitments to emissions reductions in the form of voluntary sectoral Climate Change Agreements, in order to qualify for an 80 per cent reduction in the applicable rate of energy tax (Climate Change Levy). Source: Smith, S. (2008) “Environmentally related Taxes and Tradable Permit Systems in Practice”. OECD, University College, London. 35 Fullerton, D., Leicester, A. & Smith, S. (2008) “Environmental Taxes”. NBER, Cambridge
41
Dong, 2009).36
Border tax adjustments are proposed to achieve two objectives: to provide competitiveness offsets for domestic producers and neutralise the potential negative effect on trade, and to address possible carbon leakage concerns where the reduction in emissions in a taxing country generates increases in emissions in other countries.
107. Border tax adjustments are based on the destination principle that traded goods are subject to taxes, based on their carbon content, by the importing country (destination) and exempted from taxes of the exporting country (origin).Border tax adjustments based on CO2 implies taxing imports according to the emissions associated with their production at the same price as domestically produced goods and services. So imports will be charged a tax equal to the carbon tax that would be borne by an equivalent domestic good. Refunds for exports might be considered and should reflect the costs of the tax incurred during the domestic manufacturing process. However, given the intent that all emissions should be taxed it might be appropriate to deny refunds for exports.
108. The introduction of border tax adjustments might face legal challenges as they may not be compatible with the WTO rules37 (OECD, 2006).Under those rules an excise tax on imports can only be imposed if there is an equivalent excise tax on like products in the home country. Protective import duties must also adhere to WTO guidelines. However, it may be argued that border tax adjustments for carbon taxation are allowed38
as an “environmental exception” to the normal rules. The exception applies if there is a need for a tariff to protect “human, animal or plant life or health” or if they relate “to the conservation of exhaustible natural resources”. The interpretation of these rules has been and remains controversial.
109. Border tax adjustments also involve difficult practical and economic issues:
• Adjustments may erode incentives for cost-effective pollution abatement, because of the possible rebating of the cost of carbon used in producing exported goods.
• A decision would have to be made as to whether border tax adjustments would apply to all imports and exports, or only to trade with countries that do not pursue broadly equivalent environmental policies. The latter case raises considerable difficulties in defining policies of equivalent stringency.
• It may be impossible to define the appropriate rate of tax adjustment, where domestic firms have a choice of production techniques involving different levels of pollution (Poterba and Rotemberg, 1995).If the border tax adjustment is calculated on the basis of average pollution characteristics, then they will over compensate some firms and under compensate others.39
110. Border adjustments may be considered in the context of sectoral differentiation of carbon tax rates, either in the form of exemptions for some sectors, or differential tax rates to enhance efficiency. According to Hoel (2006), countries that are not able to levy tariffs on trade with non-signatories to
36 Country emission reduction commitments are subject to negotiations. The Copenhagen meeting resulted in the Copenhagen Accord, it is still unclear whether this will result in legally binding outcome with key developed and advanced developing countries agreed to state specific emission reduction commitments and action by 31 January 2010. 37Goh, G. (2004) “The World Trade Organisation, Kyoto and Energy Tax Adjustment at the border”. Journal of World Trade 38, pp 395. 38General Agreement on Tariffs and Trade, art. III, para. 2, Oct. 30, 1947, 61 Stat. A11, 55 U.N.T.S. 187. 39 Smith, S. (2008) “Environmentally related Taxes and Tradable Permit Systems in Practice”. OECD, University College, London.
42
an international agreement to restrain GHG emissions may, in response, apply differentiated taxes across sectors to offset the competitive advantage that energy-intensive sectors receive in non-signatory countries. If these countries are able to set tariff rates without restriction, then tariffs should be employed for this purpose and the optimal pattern of tax rates across sectors would be uniform. In the absence of an international agreement on carbon pricing, either border tax adjustments or sectoral differentiation may be justified as temporary measures.40
111. According to Aldy (2009), as much as 15–25 per cent of GHG reductions in the United States could be offset by higher emissions in other countries if comparable emissions policies are not implemented in these countries. This is most significant for downstream, energy-intensive firms competing in global markets, such as chemicals and plastics, primary metals, and petroleum refining, where reduced production in the US may be largely offset by increased production in other countries with higher emissions intensity. Possible policy responses for the US include imposing border tax adjustments, subsidising the output of leakage-prone industries, granting these industries output-based allocations of free emissions allowances should an emissions trading policy be implemented.41
40 Fullerton, D., Leicester, A. & Smith, S. (2008) “Environmental Taxes”. NBER, Cambridge. 41 Aldy et al. (2009) “Designing Climate Mitigation Policy”. NBER.
Box 1: Trade and border tax adjustments
Some commentators argue that border tax adjustments do not contradict free trade. A country without carbon pricing (taxes or emissions trading with full auctioning) does not have a true competitive advantage in producing carbon-intensive goods when compared to a country with carbon pricing in place. Border tax adjustments would allow prices to reflect the comparative advantages of each country.
The problem with border tax adjustments in the case of carbon taxes is that the carbon content of many products is not readily available. Consider the following:
1. Carbon-intensive products can be imported or exported in exchange for non carbon-intensive products, such as services. For trade between two countries with harmonised carbon taxes and border tax adjustments, the recipient of revenues depends on whether an origin or a destination-based tax is imposed. A destination-based tax gives the revenue to the country where consumption takes place, while the opposite is true for an origin-based tax.
2. Suppose a carbon-intensive good like petrol is produced in three stages: extraction, refining and consumption and that these stages occur in different countries. Suppose C1 extracts the oil and sells to C2 where extraction and consumption takes place. If C1 imposes an origin-based tax and there are no border tax adjustments, then C1 keeps the revenue and some combination of individuals in C1 and C2 bear the tax. If there are border tax adjustments, C1 rebates the tax when it is exported and C2 imposes a tax when the oil is imported, transferring funds from C1 to C2. However, if the tax is imposed at consumption in C2 then their border tax adjustments have no effect because the tax is imposed at the same place as consumption.
3. Border tax adjustments must be harmonised between trading countries with carbon taxes. Without harmonisation, products can be subject to double taxation or zero taxation. This is also true in a world without border tax adjustments, when countries do not harmonise in their choice of origin vs. destination-based taxes.
4. Border tax adjustments ensure that the terms of trade are consistent with the principles of free trade and comparative advantage, when one country has a carbon tax and their trading party does not. If one country imposes a carbon price/tax but the other does not, it is not correct to say that the country without a carbon tax has a comparative advantage and is therefore an efficient producer of the good.
In a world where some countries impose a carbon tax and some do not, border tax adjustments play two major roles. The first is to prevent carbon “leakage” and the second is to encourage countries to put a price on carbon. Leakage refers to the case where a producer might shift production from a country with carbon taxes to a country without, in an attempt to avoid the tax. With border tax adjustments in place, the tax cannot be avoided.
Suppose that the production of a carbon-intensive good takes place in C1 and C2 where C1 applies a carbon tax and C2 does not. If border tax adjustments are applied then shifting production to C2 would not be an advantage because consumption in C1 would be taxed and consumption in C2 would not, regardless of where the product is produced. In a world with border tax adjustments there is no longer an advantage for counties to try to attract production by not to applying a carbon tax.
Source: David A. Weisbach, and Glibert E. Metcalf (2000) “The design of a carbon tax”, 52 Stan. L. Rev. 599, 603-13.
43
7:International practice 112. This chapter provides a brief overview of existing energy or carbon taxes in a few countries. More
detailed descriptions of these tax regimes are included as an annexure.
113. Carbon pricing, particularly in Europe, is achieved by a combination of emissions trading schemes and carbon taxes. The EUETS is said to cover about 45per cent of GHG emissions in Europe. Sectors or activities that are not covered by the scheme should in principle be covered by carbon taxes. There is a close link between energy taxes and carbon taxes, and many European countries have reformed or are reforming their energy taxes to include a specific carbon element. Most energy taxes preceded the EUETS and there are attempts to coordinate this system with energy and carbon taxes.
114. Several European countries have implemented energy/carbon taxes to raise revenue and curb GHG emissions and mitigate climate change. They differ by tax rates applied, tax bases, sectoral coverage and use of revenues.42
Finland (1990), Sweden (1991), Norway (1991), Denmark (1992) and Netherlands (1996) introduced carbon taxes in the 1990s.This was followed by pseudo-carbon/energy taxes in Italy (1999), Germany (1999) and United Kingdom (2001).In Canada, sub-national carbon taxes were introduced by the provinces of Quebec (2007) and British Columbia (2008).These taxes were implemented in addition to energy taxes, as a replacement for energy taxes and/or as part of wider country-specific tax reforms.
115. Historically, the implementation of energy and carbon taxes in Europe has been accompanied by discrimination between energy users in the form of tax exemptions and rebates, and reduced levels of taxation that apply to energy-intensive sectors. The main reason for the use of these special tax provisions is to address concerns of international competitiveness. A similar argument could apply to tax exemptions or rebates for low-income households that are likely to bear a disproportionate burden of the tax compared to high-income households, as a larger proportion of their income is spent on energy.43
116. Carbon tax policy in many European countries does not follow the theoretical rationale as laid down by Pigou, because tax rates are usually set lower than marginal damage costs of pollution, with the exception of taxes levied on transport fuels. There are a number of reasons why a true Pigouvian approach has not been adopted in Europe. These include:
• Complexities associated with specifying damage functions and placing a monetary value on
external costs and concerns for competitiveness. • Differentiated tax rates may be required initially to address concerns of industry relocation
due to high uniform tax rates. Stricter environmental regulations in one jurisdiction could induce relocation of industry and adversely affect levels of environmental pollution, resulting in net increases globally. Incidences of dumping of environmentally hazardous substances from developed to developing countries have occurred.
42 Lachapelle, E (2009) “What Price Carbon? Theory and Practice of Carbon taxation in the OECD”. Draft, prepared for 81st Annual Conference of Canadian Political Science Association. 43 COMETR: Speck, S. “Overview of Environmental Tax Reforms in EU Member States”, pp19-83.
44
117. The European Energy Taxation directive was adopted in 2003 following lengthy negotiations between EU member states. This directive stemmed from the initial proposal in 1997 by the European Commission for an EU-harmonised carbon/energy tax based on environmental considerations. The directive expanded the scope of the previous community framework, which was limited to mineral oil products, to include energy products specifically, such as natural gas, coal and electricity. Accordingly, all EU member states face a legal obligation to establish national tax rates as stipulated in the directive, and to be effected though national legislation.
118. In summary the European Energy Taxation directive sets the following rules: • Expansion of coverage to include other energy products, including natural gas, coal and
electricity • Increases in the minimum rates of taxation for mineral oils and specified new minimum
rates for other products • Lower minimum rates for business use.
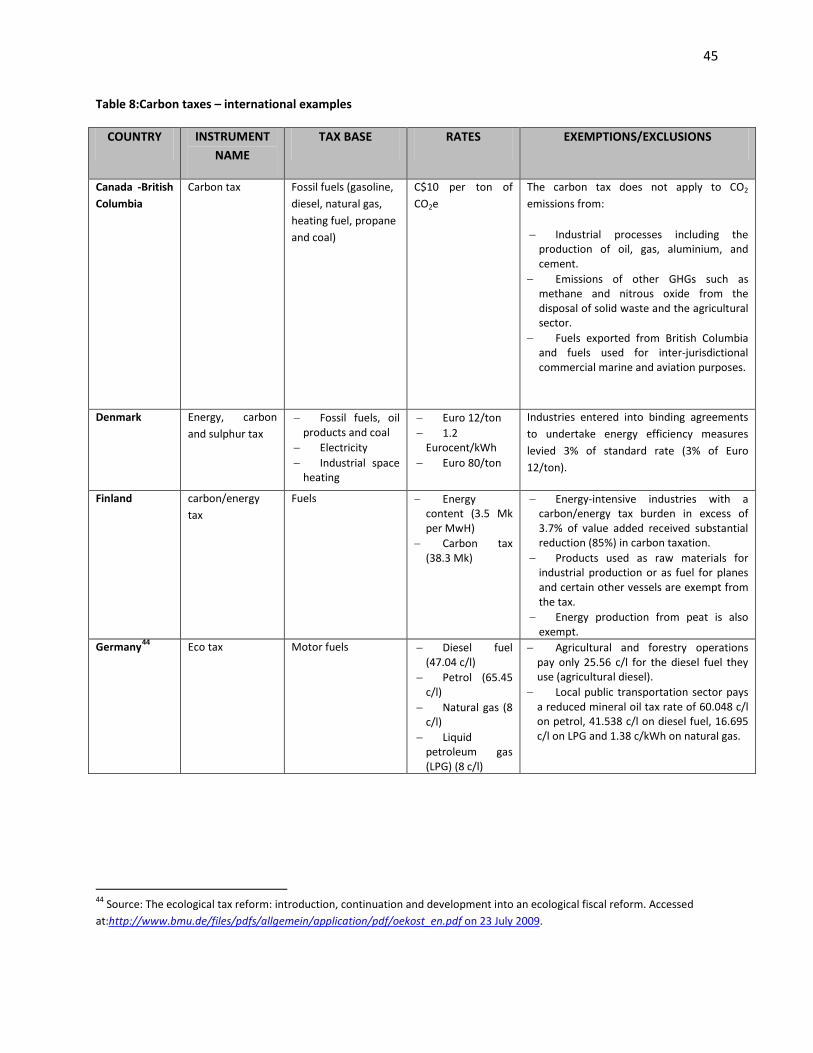
45
Table 8:Carbon taxes – international examples
COUNTRY INSTRUMENT NAME
TAX BASE RATES EXEMPTIONS/EXCLUSIONS
Canada -British Columbia
Carbon tax Fossil fuels (gasoline, diesel, natural gas, heating fuel, propane and coal)
C$10 per ton of CO2e
The carbon tax does not apply to CO2 emissions from:
− Industrial processes including the production of oil, gas, aluminium, and cement.
− Emissions of other GHGs such as methane and nitrous oxide from the disposal of solid waste and the agricultural sector.
− Fuels exported from British Columbia and fuels used for inter-jurisdictional commercial marine and aviation purposes.
Denmark Energy, carbon and sulphur tax
− Fossil fuels, oil products and coal
− Electricity − Industrial space
heating
− Euro 12/ton − 1.2
Eurocent/kWh − Euro 80/ton
Industries entered into binding agreements to undertake energy efficiency measures levied 3% of standard rate (3% of Euro 12/ton).
Finland carbon/energy tax
Fuels
− Energy content (3.5 Mk per MwH)
− Carbon tax (38.3 Mk)
− Energy-intensive industries with a carbon/energy tax burden in excess of 3.7% of value added received substantial reduction (85%) in carbon taxation.
− Products used as raw materials for industrial production or as fuel for planes and certain other vessels are exempt from the tax.
− Energy production from peat is also exempt.
Germany44 Eco tax Motor fuels − Diesel fuel (47.04 c/l)
− Petrol (65.45 c/l)
− Natural gas (8 c/l)
− Liquid petroleum gas (LPG) (8 c/l)
− Agricultural and forestry operations pay only 25.56 c/l for the diesel fuel they use (agricultural diesel).
− Local public transportation sector pays a reduced mineral oil tax rate of 60.048 c/l on petrol, 41.538 c/l on diesel fuel, 16.695 c/l on LPG and 1.38 c/kWh on natural gas.
44 Source: The ecological tax reform: introduction, continuation and development into an ecological fiscal reform. Accessed at:http://www.bmu.de/files/pdfs/allgemein/application/pdf/oekost_en.pdf on 23 July 2009.
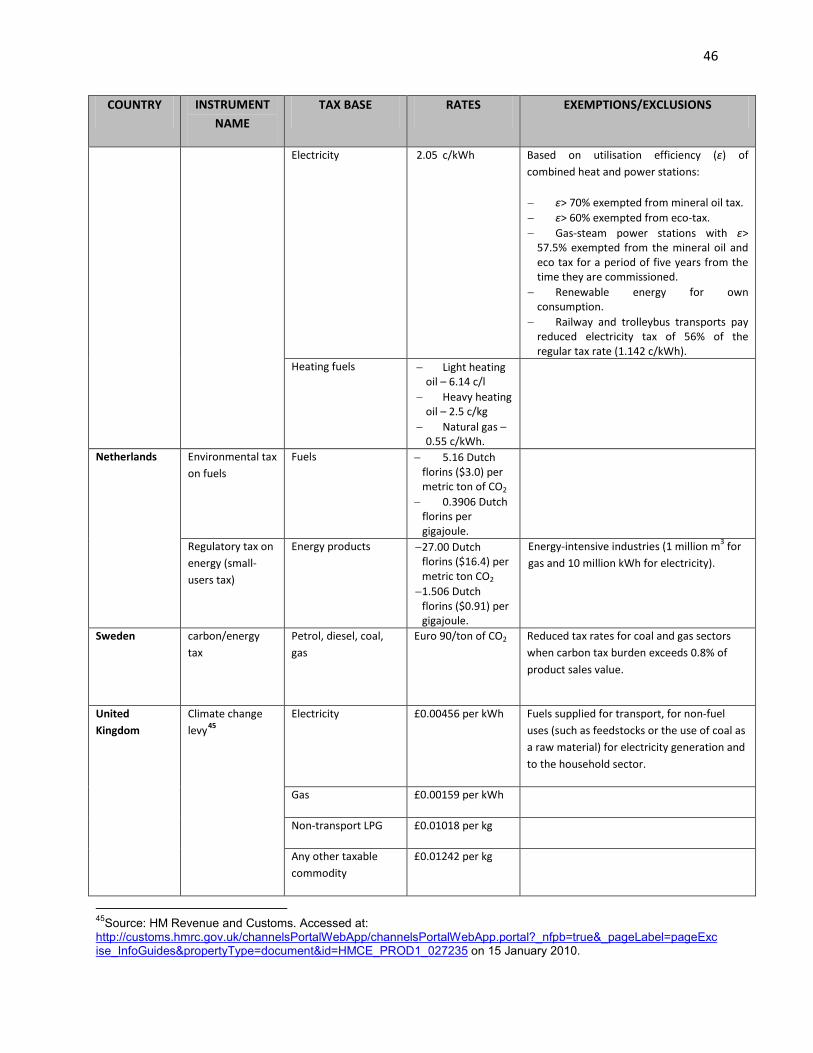
46
COUNTRY INSTRUMENT NAME
TAX BASE RATES EXEMPTIONS/EXCLUSIONS
Electricity 2.05 c/kWh Based on utilisation efficiency (ε) of combined heat and power stations:
− ε> 70% exempted from mineral oil tax. − ε> 60% exempted from eco-tax. − Gas-steam power stations with ε>
57.5% exempted from the mineral oil and eco tax for a period of five years from the time they are commissioned.
− Renewable energy for own consumption.
− Railway and trolleybus transports pay reduced electricity tax of 56% of the regular tax rate (1.142 c/kWh).
Heating fuels − Light heating oil – 6.14 c/l
− Heavy heating oil – 2.5 c/kg
− Natural gas – 0.55 c/kWh.
Netherlands Environmental tax on fuels
Fuels − 5.16 Dutch florins ($3.0) per metric ton of CO2
− 0.3906 Dutch florins per gigajoule.
Regulatory tax on energy (small-users tax)
Energy products − 27.00 Dutch florins ($16.4) per metric ton CO2
− 1.506 Dutch florins ($0.91) per gigajoule.
Energy-intensive industries (1 million m3 for gas and 10 million kWh for electricity).
Sweden carbon/energy tax
Petrol, diesel, coal, gas
Euro 90/ton of CO2 Reduced tax rates for coal and gas sectors when carbon tax burden exceeds 0.8% of product sales value.
United Kingdom
Climate change levy45
Electricity
£0.00456 per kWh Fuels supplied for transport, for non-fuel uses (such as feedstocks or the use of coal as a raw material) for electricity generation and to the household sector.
Gas £0.00159 per kWh
Non-transport LPG £0.01018 per kg
Any other taxable commodity
£0.01242 per kg
45Source: HM Revenue and Customs. Accessed at: http://customs.hmrc.gov.uk/channelsPortalWebApp/channelsPortalWebApp.portal?_nfpb=true&_pageLabel=pageExcise_InfoGuides&propertyType=document&id=HMCE_PROD1_027235 on 15 January 2010.
47
119. In most Organisation for Economic Cooperation and Development member countries carbon taxes were introduced incrementally by increasing the rates over time or gradually extending coverage of the tax and removing exemptions and rebates for sensitive industry. Finland introduced the tax in 1990at a modest level of US$1.4/tonCO2 and increased the rate to US$22/tonCO2 in 1998.The levy initially applied to heat and electricity production and was expanded to cover transportation and heating fuels. Sweden and Denmark applied a system of progressive reductions of exemptions. In the case of British Columbia, tax adjustments are specified at the outset as an annual increase of C$5, rising to C$30 in 2012.
120. The adoption of a phased-in, gradual approach to the implementation of carbon taxes is important for the following reasons. First, introduction of the tax at an initial low rate and allowing for incremental increases over time enhances the political acceptability of the tax. Second, an initial low rate provides certainty to industry sectors and allows emitters time to adjust. Denmark implemented a system of high initial refunds, which was decreased over time for low sulphur fuel oil introduced in 2002.The rebate was decreased over a five-year period:50per cent (1993), 40 per cent (1997), 30 per cent (1998), 20 per cent (1999) to 10 per cent (2000).Structured, automatic adjustments send a clear price signal for long-term investment decisions and encourage behavioural responses even at low tax rates.
121. In some countries, the principle of revenue neutrality has been achieved through the recycling of revenues. This can be accomplished through reductions in other distortionary taxes, such as payroll taxes. British Columbia provides for the recycling of carbon tax revenues through a refundable tax credit and reductions in personal and corporate income tax rates. This tax shifting exercise by imposing taxes on pollution and reducing taxes on goods (labour income) could yield the double benefit of a more efficient tax system and environmental protection. There is limited literature or empirical evidence on the extent to which the doubled dividend is actually achieved. Zhang and Baranzini (2004) argue that reducing distortionary taxes usually involves reducing taxes on capital, unlike labour, and although the system becomes more efficient, the tax may be more regressive.46
122. The Pigouvian tax principle, which stipulates that the tax should be uniform across all sectors of the economy, has often been violated. Lower rates for certain sectors are justified to address competitiveness concerns in the absence of internationally harmonised carbon taxes (see discussion on border tax adjustments).The average tax rate applied to fossil fuels varies across jurisdiction, and most carbon tax rates are below the relatively conservative estimate of about US$100/tonCO2 required to achieve a stabilisation of GHG concentration in the atmosphere. Taxes are highest in Sweden (US$41/tonCO2). Countries such as Finland, Norway and Denmark are imposing carbon taxes at almost half the rate of Sweden.47
In the Netherlands and British Columbia, carbon tax rates are considerably lower (US$2.96/tonCO2 and US$7.76/tonCO2 respectively).
123. In Finland, fossil fuels used for industrial purposes are exempt from the tax, while Denmark grants a 50per cent refund on the tax applied to the use of steam coal by industry. In both countries, households are subject to the full carbon tax. British Columbia grants tax exemption for emissions from industrial processes, while emissions linked to non-commercial activities are subject to the tax.
46 Lachapelle, E (2009) “What Price Carbon? Theory and Practice of Carbon taxation in the OECD”. Draft, prepared for 81st Annual Conference of Canadian Political Science Association. 47 Lachapelle, E (2009) “What Price Carbon? Theory and Practice of Carbon taxation in the OECD”. Draft, prepared for 81st Annual Conference of Canadian Political Science Association.
48
Thus, the household sector bears a disproportionately higher tax burden compared to the industrial and other sectors. The failure of these jurisdictions to implement uniform carbon tax rates across all sectors potentially undermines the cost-effectiveness and efficiency of these taxes.
124. Ideally, the carbon tax rates should differ according to the carbon content - a proxy for actual emissions - of the different fuels. Historically, these taxes took the form of specific excises in cents or $ per litre. Most of these taxes have been converted to specific excise taxes on each ton of carbon emitted, and also permit comparison across fuels with different carbon contents that are measured in different base units, such as tons of coal versus litres of petrol. A strict and consistent application of these taxes would mean that the tax applies to fuels according to the carbon content, and carbon-intensive energy products (coal) will be taxed higher than less carbon-intensive fuels (natural gas).
125. In 2009, France proposed a carbon tax on fossil fuel consumers in the form of a specific levy at a rate of Euro 17 per ton of CO2, applied to gasoline, diesel fuel, coal and natural gas, for implementation in January 2010.The proposed tax contained an extensive system of compensatory measures:
• Exemptions for industries that are subject to EUETS, including high-pollutant enterprises
(e.g. refinery, thermal power plant, cement manufacturing, public transport) • Partial refunds and/or reduced rates for specific sectors, including agriculture and fishery,
and transportation of commodities • Tax credits for households, subject to the individual income tax, etc.
126. In December 2009, the French Constitutional Council rejected the carbon tax provisions on the
grounds that the compensatory measures were contrary to the principle of equality between taxpayers, as provided by the French Constitution. The council deemed the compensatory measures disproportionate and not aligned with the intention of the tax to promote environmentally friendly behaviours and reduce carbon emissions. In particular, it found the following issues troublesome:
• The exemptions would cover 93 per cent of industrial emissions and less than half of all GHG emissions would be subject to the tax
• The tax would primarily target fuel for vehicles and heating (i.e. individuals targeted), but not other sources of emissions (industries not targeted).
127. The French government subsequently decided to put the implementation of the proposed carbon
tax on hold. 128. Many European countries are in the process of reforming their energy/carbon taxes to ensure that
they complement the EUETS. Given that the scheme covers only 45per cent of GHG emissions in Europe, there are moves underway to either extend its coverage to other sectors or to introduce or increase carbon tax rates in those sectors not covered by the scheme.
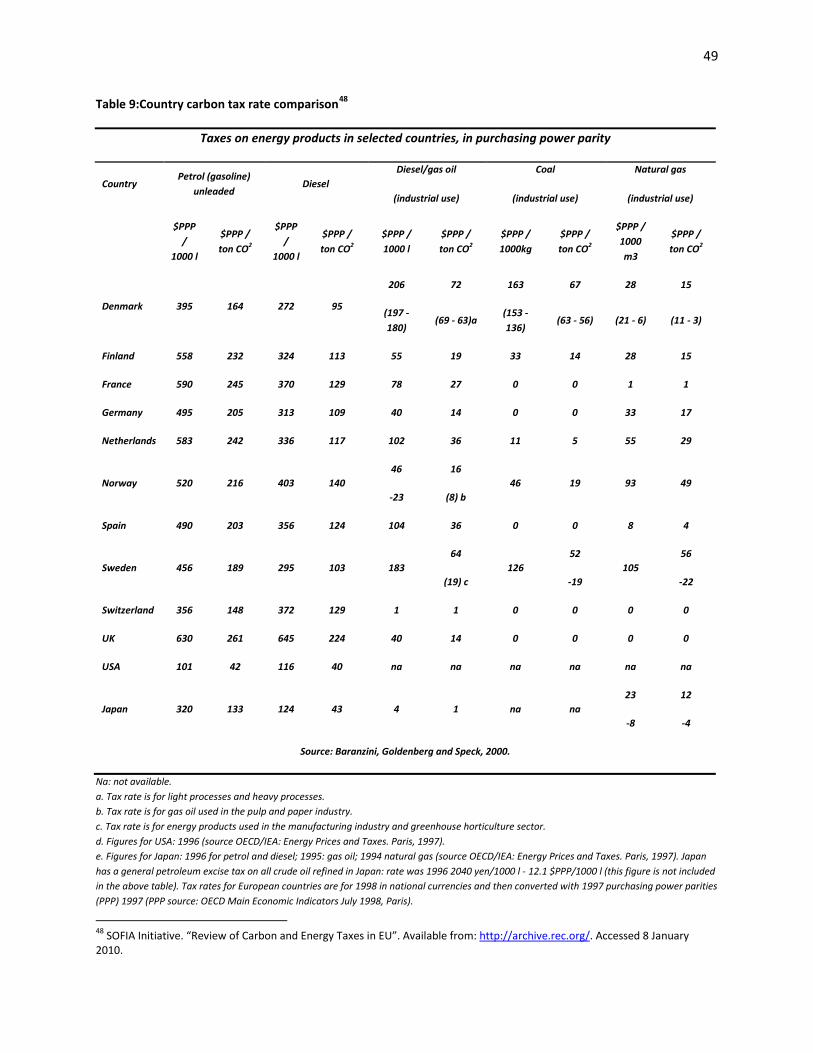
49
Table 9:Country carbon tax rate comparison48
Taxes on energy products in selected countries, in purchasing power parity
Country Petrol (gasoline)
unleaded Diesel
Diesel/gas oil Coal Natural gas
(industrial use) (industrial use) (industrial use)
$PPP
/ 1000 l
$PPP / ton CO2
$PPP /
1000 l
$PPP / ton CO2
$PPP / 1000 l
$PPP / ton CO2
$PPP / 1000kg
$PPP / ton CO2
$PPP / 1000 m3
$PPP / ton CO2
Denmark 395 164 272 95
206 72 163 67 28 15
(197 - 180)
(69 - 63)a (153 - 136)
(63 - 56) (21 - 6) (11 - 3)
Finland 558 232 324 113 55 19 33 14 28 15
France 590 245 370 129 78 27 0 0 1 1
Germany 495 205 313 109 40 14 0 0 33 17
Netherlands 583 242 336 117 102 36 11 5 55 29
Norway 520 216 403 140 46 16
46 19 93 49 -23 (8) b
Spain 490 203 356 124 104 36 0 0 8 4
Sweden 456 189 295 103 183 64
126 52
105 56
(19) c -19 -22
Switzerland 356 148 372 129 1 1 0 0 0 0
UK 630 261 645 224 40 14 0 0 0 0
USA 101 42 116 40 na na na na na na
Japan 320 133 124 43 4 1 na na 23 12
-8 -4
Source: Baranzini, Goldenberg and Speck, 2000.
Na: not available. a. Tax rate is for light processes and heavy processes. b. Tax rate is for gas oil used in the pulp and paper industry. c. Tax rate is for energy products used in the manufacturing industry and greenhouse horticulture sector. d. Figures for USA: 1996 (source OECD/IEA: Energy Prices and Taxes. Paris, 1997). e. Figures for Japan: 1996 for petrol and diesel; 1995: gas oil; 1994 natural gas (source OECD/IEA: Energy Prices and Taxes. Paris, 1997). Japan has a general petroleum excise tax on all crude oil refined in Japan: rate was 1996 2040 yen/1000 l - 12.1 $PPP/1000 l (this figure is not included in the above table). Tax rates for European countries are for 1998 in national currencies and then converted with 1997 purchasing power parities (PPP) 1997 (PPP source: OECD Main Economic Indicators July 1998, Paris).
48 SOFIA Initiative. “Review of Carbon and Energy Taxes in EU”. Available from: http://archive.rec.org/. Accessed 8 January 2010.
50
8:Revenue use – recycling, tax shifting and earmarking 129. The recycling of revenue through tax shifting is a viable option for consideration. This involves the
imposition of a tax on “bads”, such as carbon emissions, and the reduction of taxes on “goods”, such as labour (i.e. payroll taxes).A tax reform that introduces new environmental taxes may have a double dividend if it provides the dual gain of a cleaner environment and a more efficient tax system, achieved by reducing distortionary taxes that discourage work effort or investment.49
130. Public finance theory and good public finance practices do not support the full earmarking of specific revenue streams. A recent EU publication made the following observation: “Regarding the idea to raise revenues for development assistance of global public goods through transaction taxes, we are also somewhat sceptical. The public finance perspective simply offers little support for such goals. The reason is that earmarking of revenues of a particular tax for specific purposes risk the misallocation of public funds: either too much or too little money might be spent on the specific purpose chosen just because the revenues from the tax in question were lower or higher than the optimum level of spending. In order to avoid such misallocation, tax revenues should by default be used to fund the general budget so that the expenditure allocation can be optimised on the basis of the overall tax resources that are available, including those resources spent on global concerns”.50
131. Revenues should be allocated in terms of the priorities of the government. From a national perspective, the tax system is also used as a redistributive mechanism, and in general, there is no direct link between who pays taxes and who receives what level of benefits funded by tax revenues. A limited number of earmarked revenue streams are observed in South Africa; these include the Unemployment Insurance Fund, the Road Accident Fund, the skills development levy and other regulatory levies.
132. South Africa’s three-year budget cycle provides departments with greater certainty than an annual budgeting cycle and is highly transparent. Earmarked taxes tend to fragment and complicate the tax system and allow departments and agencies to escape the discipline of the budget process. In addition, dedicated funding sources can result in creeping mandates or “gold plating” in the case of a buoyant source of revenue, or demands for new revenue instruments, or higher rates when a revenue source turns out to be insufficient.
133. Earmarking introduces a number of complexities into the budget process and might impose undue
constraints on the executive in a manner that serves special interest groups. An environment in which particular purposes, controls and earmarking are built into specific categories of tax revenues is one in which special interest groups flourish. This is due to the fact that special interest groups are able to capture particular kinds of revenue/appropriations. It is necessary to avoid such developments in the public interest.
134. Requests for earmarking often stem from the hope that it will guarantee and possibly increase the source of funding for a particular cause. However, international experience has shown that the introduction of a hypothecated tax – the ring-fencing of a tax for specific expenditure -is almost
49 Cuervo and Ghandi (1998) “Carbon taxes: their macroeconomic effects and prospects for global adoption – A survey of the literature”. Fiscal Affairs Department, IMF, Washington. 50 European Parliament: Directorate-General for Internal Policies, Policy Department A; Economic and Scientific Policy. “Financial Transaction Tax: Small is Beautiful”, PE 429.989, January 2010, p.11.
51
universally ineffective in raising the level of expenditure on the service for which the tax is earmarked (over and above that which would have been spent if there was only general budgetary financing). In the long term any initial gain in increased spending on the targeted service is generally lost, and it should not be assumed that the earmarking of certain revenue streams will provide straightforward solutions to the more complex challenges that the budgeting process has to deal with.
135. The theoretical debate about the relative merits of earmarked taxes is not conclusive. Nonetheless, it has become accepted practice that government decisions on taxation should be made independently from decisions on specific expenditure priorities. The rationale for this separation is that it will make it easier for the government, subject to parliamentary approval, to pursue its distributional and economic stabilisation objectives. If the budget process broadly weighs up the full range of issues that need to be considered in public policy formation, and if there is confidence in the political oversight process, with a sound budgeting process that addresses environmental or any other issues appropriately, then there is no need for “unnecessary” constraints in the public finance terrain.
136. Where a revenue source (levy) closely resembles a tariff or a user charge, there is a stronger case for earmarking. In such circumstances levy changes will usually be made to strike an appropriate balance between costs and benefits under the supervision of representatives or stakeholders who have a genuine interest in ensuring this balance. In assessing earmarked levy proposals for regulatory functions, the National Treasury emphasises the importance of governance arrangements to ensure an appropriate balance between costs relative to benefits.
137. The current air passenger departure tax has been associated with significantly increased allocations for international tourism promotion, but this has not been a “hard” earmarking exercise. There has been some association between the source of revenue and a specific spending programme - a form of “soft” earmarking. A similar link exists between the general fuel levy and allocations for the national road network - there is a loose association but no direct earmarking of funds. Such implicit, soft or partial earmarking arrangements avoid the capture of revenue sources outside of the normal budget process and maintain the oversight role of the executive in budgetary and fiscal decisions.
138. The full earmarking of revenues generated from environmental taxes is not recommended as it will
result in rigidities in the public finance system that can create mismatches between revenue generation and allocations. It may also be an obstacle to the continuous re-evaluation and modification of tax and spending programmes. On the other hand, partial on-budget earmarking of some revenue for specific (e.g. environmental or social) purposes may be appropriate to promote public and political acceptance of the benefits of the reform. Such arrangements should not undermine the normal budgetary process and should allow for adequate funding for changes in government priorities.
52
9:Potential effects of carbon taxation
139. The development of tax policy in South Africa is underpinned by the principles of efficiency, equity and administrative feasibility and simplicity. The tax system consists of direct taxes on income and consumption-based (indirect) taxes (VAT and excise duties on selected goods).The role of environmental tax instruments to support the achievement of environmental objectives, and complement regulatory measures is now acknowledged. The National Treasury has investigated the feasibility of market-based instruments, particularly environmentally related taxes to encourage environmentally friendly practices in line with sound tax and fiscal policy principles. This work culminated in an Environmental Fiscal Reform Policy Paper(2006), which provides a guiding framework and criteria to ensure the consistent development and assessment of environmentally related tax proposals. A holistic approach to carbon tax policy development is necessary to ensure alignment with existing tax policy and other government interventions.
140. Government has introduced a number of environmentally related excise taxes and tax incentives to support the transition to an environmentally cleaner, low-carbon economy. In addition to the taxes on petrol and diesel, an electricity levy of 2c/kWh was implemented in July 2009 as a step towards developing a comprehensive carbon pricing regime in South Africa.
141. A flat-rate carbon emissions tax (specific excise duty) applies to new passenger vehicles effective from 1 September 2010.Income tax exemptions for income earned from the sale of primary certified emissions-reduction units from Clean Development Mechanism projects, and accelerated depreciation allowances for investments in biofuels and renewable energy act as incentives to encourage energy-efficient, environmentally friendly behaviour.
142. The Department of Energy is working to encourage renewable energy generation and energy-
efficiency measures to facilitate South Africa’s transition to a low-carbon development path. The National Energy Regulator of South Africa has introduced the renewable energy feed-in tariff scheme and is developing a cogeneration feed-in tariff scheme.(Cogeneration refers to an energy recycling process that simultaneously generates electricity and useful heat.) The Department of Energy is considering a tradable renewable energy certificate scheme and has implemented a subsidy scheme for investments in renewable energy. These interventions should form part of a comprehensive and coordinated climate change policy response and the recently published National Climate Change Response Green Paper (2010) seeks to ensure the coordination of domestic climate policy.
9.1 Summary of economic modelling studies on the potential economic
impact of carbon taxes 143. The Long-Term Mitigation Scenarios report, published in 2007, considered the economic impacts of
various carbon taxes. In 2007, Devarajan et al. (World Bank, 2007) also modelled the potential impacts of carbon taxes in South Africa. These studies used computable general equilibrium models to determine the economy-wide impacts of the taxes. Generally, the static nature of such models make them unsuitable for modelling the impacts of long-term problems such as climate change with significant uncertainty, and are more useful for short-term assessments linked to specific shocks to the model.
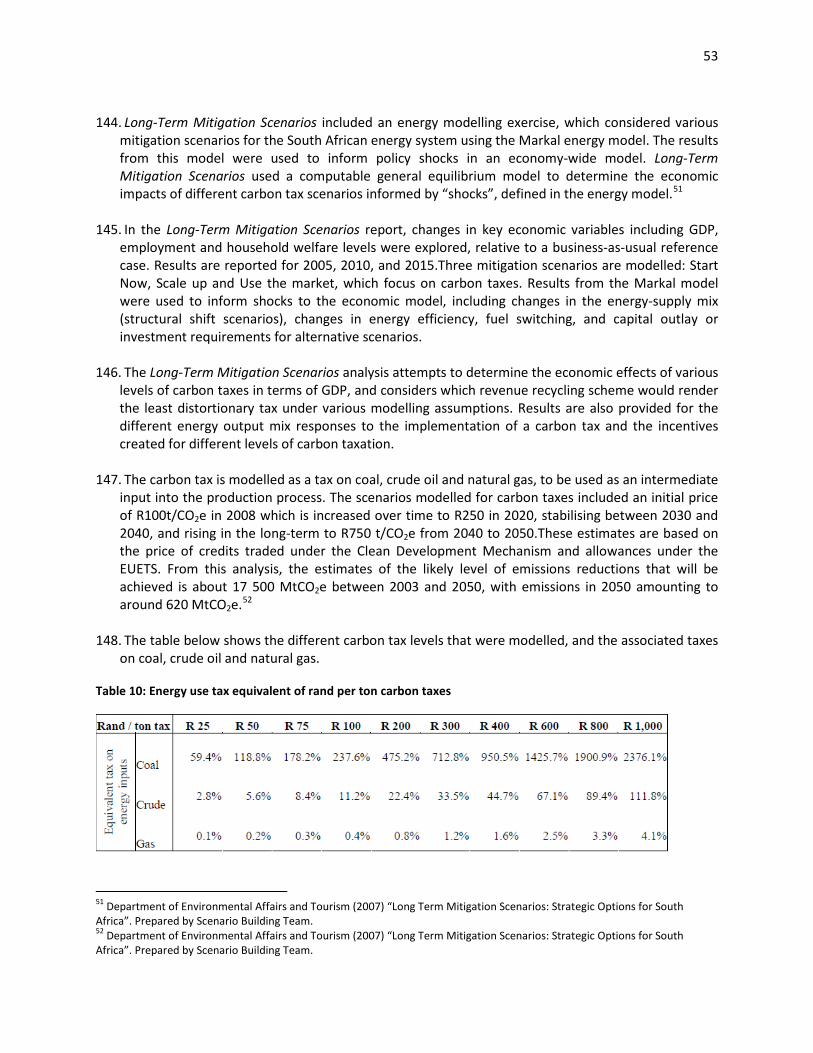
53
144. Long-Term Mitigation Scenarios included an energy modelling exercise, which considered various
mitigation scenarios for the South African energy system using the Markal energy model. The results from this model were used to inform policy shocks in an economy-wide model. Long-Term Mitigation Scenarios used a computable general equilibrium model to determine the economic impacts of different carbon tax scenarios informed by “shocks”, defined in the energy model.51
145. In the Long-Term Mitigation Scenarios report, changes in key economic variables including GDP, employment and household welfare levels were explored, relative to a business-as-usual reference case. Results are reported for 2005, 2010, and 2015.Three mitigation scenarios are modelled: Start Now, Scale up and Use the market, which focus on carbon taxes. Results from the Markal model were used to inform shocks to the economic model, including changes in the energy-supply mix (structural shift scenarios), changes in energy efficiency, fuel switching, and capital outlay or investment requirements for alternative scenarios.
146. The Long-Term Mitigation Scenarios analysis attempts to determine the economic effects of various
levels of carbon taxes in terms of GDP, and considers which revenue recycling scheme would render the least distortionary tax under various modelling assumptions. Results are also provided for the different energy output mix responses to the implementation of a carbon tax and the incentives created for different levels of carbon taxation.
147. The carbon tax is modelled as a tax on coal, crude oil and natural gas, to be used as an intermediate input into the production process. The scenarios modelled for carbon taxes included an initial price of R100t/CO2e in 2008 which is increased over time to R250 in 2020, stabilising between 2030 and 2040, and rising in the long-term to R750 t/CO2e from 2040 to 2050.These estimates are based on the price of credits traded under the Clean Development Mechanism and allowances under the EUETS. From this analysis, the estimates of the likely level of emissions reductions that will be achieved is about 17 500 MtCO2e between 2003 and 2050, with emissions in 2050 amounting to around 620 MtCO2e.52
148. The table below shows the different carbon tax levels that were modelled, and the associated taxes on coal, crude oil and natural gas.
Table 10: Energy use tax equivalent of rand per ton carbon taxes
51 Department of Environmental Affairs and Tourism (2007) “Long Term Mitigation Scenarios: Strategic Options for South Africa”. Prepared by Scenario Building Team. 52 Department of Environmental Affairs and Tourism (2007) “Long Term Mitigation Scenarios: Strategic Options for South Africa”. Prepared by Scenario Building Team.
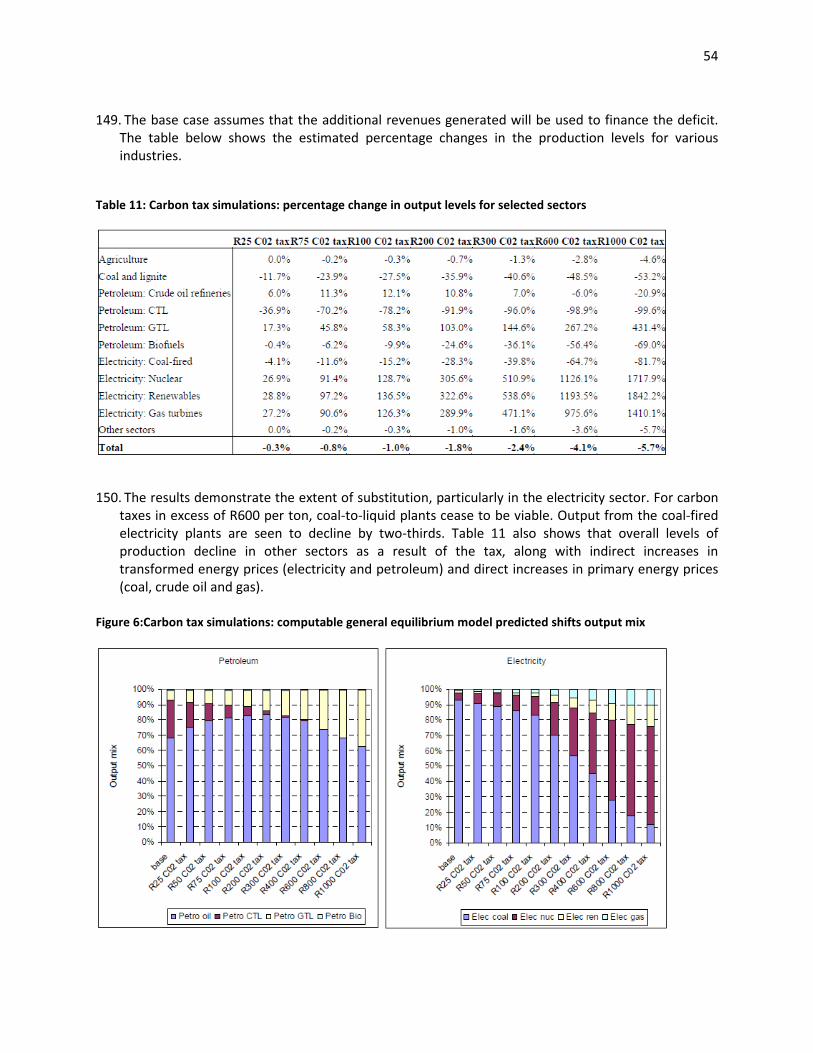
54
149. The base case assumes that the additional revenues generated will be used to finance the deficit.
The table below shows the estimated percentage changes in the production levels for various industries.
Table 11: Carbon tax simulations: percentage change in output levels for selected sectors
150. The results demonstrate the extent of substitution, particularly in the electricity sector. For carbon
taxes in excess of R600 per ton, coal-to-liquid plants cease to be viable. Output from the coal-fired electricity plants are seen to decline by two-thirds. Table 11 also shows that overall levels of production decline in other sectors as a result of the tax, along with indirect increases in transformed energy prices (electricity and petroleum) and direct increases in primary energy prices (coal, crude oil and gas).
Figure 6:Carbon tax simulations: computable general equilibrium model predicted shifts output mix
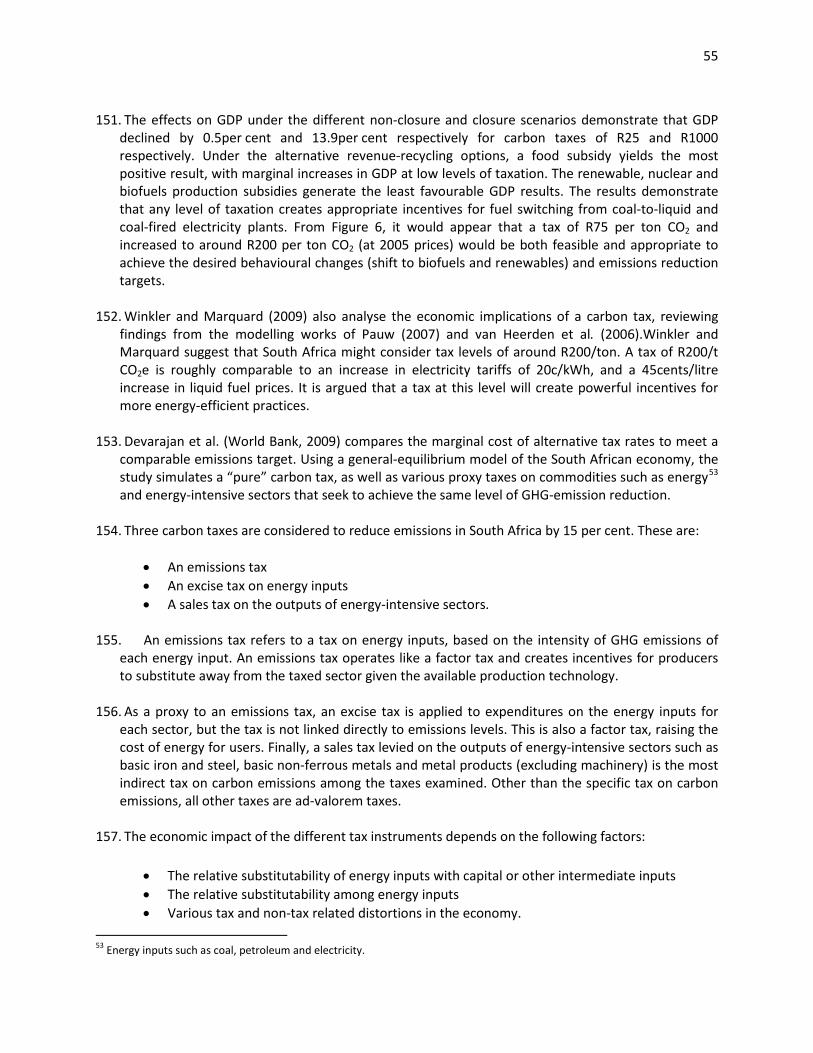
55
151. The effects on GDP under the different non-closure and closure scenarios demonstrate that GDP
declined by 0.5per cent and 13.9per cent respectively for carbon taxes of R25 and R1000 respectively. Under the alternative revenue-recycling options, a food subsidy yields the most positive result, with marginal increases in GDP at low levels of taxation. The renewable, nuclear and biofuels production subsidies generate the least favourable GDP results. The results demonstrate that any level of taxation creates appropriate incentives for fuel switching from coal-to-liquid and coal-fired electricity plants. From Figure 6, it would appear that a tax of R75 per ton CO2 and increased to around R200 per ton CO2 (at 2005 prices) would be both feasible and appropriate to achieve the desired behavioural changes (shift to biofuels and renewables) and emissions reduction targets.
152. Winkler and Marquard (2009) also analyse the economic implications of a carbon tax, reviewing findings from the modelling works of Pauw (2007) and van Heerden et al. (2006).Winkler and Marquard suggest that South Africa might consider tax levels of around R200/ton. A tax of R200/t CO2e is roughly comparable to an increase in electricity tariffs of 20c/kWh, and a 45cents/litre increase in liquid fuel prices. It is argued that a tax at this level will create powerful incentives for more energy-efficient practices.
153. Devarajan et al. (World Bank, 2009) compares the marginal cost of alternative tax rates to meet a comparable emissions target. Using a general-equilibrium model of the South African economy, the study simulates a “pure” carbon tax, as well as various proxy taxes on commodities such as energy53
and energy-intensive sectors that seek to achieve the same level of GHG-emission reduction.
154. Three carbon taxes are considered to reduce emissions in South Africa by 15 per cent. These are:
• An emissions tax • An excise tax on energy inputs • A sales tax on the outputs of energy-intensive sectors.
155. An emissions tax refers to a tax on energy inputs, based on the intensity of GHG emissions of
each energy input. An emissions tax operates like a factor tax and creates incentives for producers to substitute away from the taxed sector given the available production technology.
156. As a proxy to an emissions tax, an excise tax is applied to expenditures on the energy inputs for each sector, but the tax is not linked directly to emissions levels. This is also a factor tax, raising the cost of energy for users. Finally, a sales tax levied on the outputs of energy-intensive sectors such as basic iron and steel, basic non-ferrous metals and metal products (excluding machinery) is the most indirect tax on carbon emissions among the taxes examined. Other than the specific tax on carbon emissions, all other taxes are ad-valorem taxes.
157. The economic impact of the different tax instruments depends on the following factors:
• The relative substitutability of energy inputs with capital or other intermediate inputs • The relative substitutability among energy inputs • Various tax and non-tax related distortions in the economy.
53 Energy inputs such as coal, petroleum and electricity.
56
158. The study considers the impacts of a new tax on already existing distortions within developing
economies, including labour market distortions.
159. Production in each sector has a nested structure, combining different levels of inputs, and each level is depicted by imperfect substitution through a constant elasticity of substitution function or by zero substitution through a Leontief technology of fixed coefficients. Leontief technology is always based on fixed inputs with zero elasticity. Output by activity consists of value added and intermediate inputs. Except for energy inputs, intermediate inputs are held in fixed shares to output (Leontief technology), each input a composite of imported and domestic goods. Value added is a constant elasticity of substitution combination of labour and a capital-energy composite. Three types of labour are aggregated into a single labour input namely, skilled, semi-skilled and unskilled.
160. The model assumes that government’s real spending, real investment and aggregate foreign savings are constant. Private savings adjust in order to maintain a fixed total investment in the economy, so that all changes affect household consumption. This is a standard approach in public finance analysis, because it provides the welfare results of tax policy in isolation from other macroeconomic adjustments, such as changes in investment or government expenditure. Domestic savings (savings by institutions or households) are assumed to adjust, and the economic and welfare effects are driven primarily by changes in net household income and consumption as the changes in energy taxes filter through the economy. In addition, revenue is fixed in the government budget, allowing the substitution of energy-related taxes with lump-sum taxes (transfers) on household income or with pre-existing distortionary taxes such as sales and excise taxes, or import tariffs.
161. The following results were generated:
• A direct carbon tax imposes the lowest distortion compared to taxes on energy or energy-
intensive sectors. For a tax that reduces emissions by 15 per cent, the cost is roughly 0.3 per cent of household welfare, whereas a tax on energy-intensive sectors imposes a cost that is close to 10 times that amount.
• Recycling revenue through reductions in distortionary taxes lowers the direct and indirect welfare cost of a carbon tax. In the case of a tax on energy-intensive industries, the welfare cost with revenue recycling actually increases because of the extreme changes in output, and the high taxes on energy-intensive industries needed to meet GHG-emissions reduction targets.
162. The study found that the welfare cost is significantly lower when labour flexibility in production is
improved. It concludes that if South Africa were able to remove some of the distortions in the labour market, the cost of using tax policy to reduce carbon emissions would be lower.
163. All three taxes raise energy costs and reduce GHG emissions through a decrease in production and lowering welfare. In the reference case, the emissions (carbon) tax is the most economically efficient among the taxes with the smallest welfare loss. It operates like a factor tax and directly affects the carbon content in each sector without a cascading effect. This is followed by the excise (input) tax, where welfare impact is twice that of the carbon tax. The sales (output) tax on energy-intensive sectors is the worst, as these outputs are important intermediate goods for a number of economic activities.
57
164. Devarajan et al. suggest that a carbon tax on emissions appears to be the best option in terms of the consistency of its aggregate efficiency or welfare results, in both low and higher elasticity cases. If a carbon tax is not feasible, an excise tax on energy inputs would be the next best choice. Except for the sales (output) tax on energy-intensive sectors, the welfare changes are all quantitatively small, generally measuring much less than 1 per cent from the base value of welfare.54
165. However, it is important to note that the simulations do not account for the social gains of emissions reduction, and with computable general equilibrium modelling there are no dynamic or productivity gains included in the model, such as benefits from clean technologies. The study is conservative, as it does not include welfare gains, although it does find welfare costs small and manageable.
166. Results from the above studies are generally consistent, although the use and interpretation of these modelling results should be applied with a certain degree of circumspection. Policies on carbon pricing are crucial as a first step towards facilitating the transition to a low-carbon economy, but should be complemented by policy interventions that adequately consider the economic impacts of climate change, given the scale of this problem.
54 Sections draw largely from: Devarajan, S., et al. (2009) “Tax Policy to reduce Carbon Emissions in South Africa”.
58
10:Summary 167. Although a carbon tax does not set a fixed quantitative limit to GHG emissions over the short term,
such a tax at an appropriate level and phased in over time to the “correct” level will provide a strong price signal to both producers and consumers to change their behaviour over the medium to long term.
168. An Australian paper suggests that “Unless businesses and individuals bear the full responsibility for their consumption and production decisions, the level of carbon pollution will remain too high. Placing a limit, hence a price, on emissions has the potential to change the things we produce, the way we produce them, and the things we buy”.
169. “The introduction of a carbon price will change the relative prices of goods and services, making emissions-intensive goods more expensive relative to those that are less emissions intensive. This provides a powerful incentive for consumers and businesses to adjust their behaviour, resulting in a reduction of emissions.”55
170. A carbon tax regime has certain advantages: • Participation and oversight of the tax by the existing revenue administration authority • Involves fewer players and therefore incurs lower costs • Minimises the opportunity for abuse and risk within the system as it follows a much simpler
structure • Creates less of an administrative burden associated with creating an entirely new
accounting scheme for carbon allowances • Minimises lobbying efforts.
171. In the South African context, a carbon tax seems to be the more appropriate mechanism to price
carbon and begin to internalise externalities associated with GHG emissions:
• The design of a carbon tax can be relatively easy. • Measuring and monitoring of direct GHG emissions might be a challenge. • A proxy tax base can be considered, i.e. a fuel input tax. • The level of the tax can be phased in over time. Such a price trajectory will provide certainty. • Distributional and competitiveness concerns to be dealt with in a transparent manner.
172. An emissions trading system can theoretically achieve the same objectives as a carbon tax, but the
necessary conditions to make an emissions trading scheme work seems far more complex. Some of the challenges of an emissions trading scheme include:
• The credibility of emissions caps • The allocation of permits freely and/or auctioning of permits • A competitive market to facilitate trading • Price uncertainty (can fluctuate significantly)
55“Australia’s Low Pollution Future” (2008) White Paper Volume 1, December 2008, Carbon Pollution Reduction Scheme.
59
• New set of financial regulations will be necessary • Tax implications (income tax and VAT) of income derived from emissions trading • Distributional implications and incidence are neither obvious nor transparent.
173. The pricing of carbon through an appropriate tax will create the necessary incentives to change
behaviour and achieve emissions reductions at least overall cost to the economy. Taxes on carbon afford firms the flexibility to undertake emissions reductions according to their specific processes and provide the long-term price certainty which is essential for investment decisions.
174. The development of carbon taxation policies for South Africa should be informed by the following key considerations:
• The tax rate should, over time, be equivalent to the marginal external damage costs of GHGs
to affect appropriate incentives. • Comprehensive coverage should be targeted, and the tax should, as far as possible, cover all
sectors. • Should a proxy tax base be used, the tax should be levied according to the carbon content of
fossil fuels. • Relief measures, if any, should be minimal and temporary.
175. However, in the absence of an international climate change agreement and therefore a global
emissions pricing system, a partial, rather than full, internalisation of the externality should be targeted as an interim measure. The literature also supports the introduction of carbon taxes at initial low rates with a commitment to phase-in increased levels of taxation over a specific time period. This would grant taxpayers an opportunity to adjust to the new tax.
176. The design of the tax needs to minimise the potential regressive impacts on the poor and protect the competitiveness of key industries. Revenue recycling to minimise the costs of the tax could be achieved through some form of tax shifting. The full earmarking of revenues is not in line with sound fiscal policy principles, although some form of on-budget funding for specific environmental programmes should be considered.
177. A carbon tax based on measured and verified emissions is preferred, although a proxy tax base based on the carbon content of fuel inputs could be considered. It would appear that a tax of R75 per ton of CO2, with an increase to about R200 per ton CO2 (at 2005 prices) would be both feasible and appropriate to achieve the desired behavioural changes and emissions-reduction targets.
60
References Aldy, J.E., Krupnick, A.J., Newell, R.G., Parry, I.W.H., and Pizer, W.A. (2009).Designing Climate Mitigation Policy. National Bureau of Economic Research.. Black, P.,Calitz,E., Ajam, T.,Van der Berg, S., Siebrits, K., Steenkamp, T. (2006). Public Economics. Oxford University Press. Bovenberg, A. L. and Cnossen, S. (1995). Public Economics and the Environment in an Imperfect World. Dordrecht: Kluwer Academic Publishers. Bovenberg, A. L. and L. H. Goulder. (2002). “Environmental taxation and regulation” in A. J. Auerbach and M. Feldstein (eds.), Handbook of Public Economics, Vol. 3, Amsterdam: North Holland Elsevier. British Columbia Government. Available from: http://www.bcbudget.gov.bc.ca/2008/bfp/2008_Budget_Fiscal_Plan.pdf.(Accessed on 19 January 2010). Cohen, M. (1999). “Monitoring and enforcement of environmental policy”, in T. Tietenberg and H. Folmer (eds.), International Yearbook of Environmental and Resource Economics 1999/2000, Cheltenham: Edward Elgar. Cuervo, J. and Ghandi, V.P. (1998). Carbon taxes: their macroeconomic effects and prospects for global adoption – A survey of the literature. Washington: Fiscal Affairs Department, IMF. Department of Environmental Affairs and Tourism. (2007). Long-term Mitigation Scenarios brochure. Available from: http://www.environment.gov.za/HotIssues/2008/LTMS/A%20LTMS%20Scenarios%20for%20SA.pdf. (Accessed on 19 January 2010). Devarajan, S., Go, D.S., Robinsons, S., Thierfelder, K. (2009). Tax Policy to Reduce Carbon Emissions in South Africa. World Bank. Du Plooy, P. (2007). Rethinking Investment in South Africa. WWF, pp32-38. Duff, D.G. (2008).“Carbon Taxation in British Columbia”. 10 Vermont Journal of Environmental Law, pp 87-107. Entin, S.J. (2004). Tax Incidence, Tax Burden and Tax Shifting: Who really pays the tax? Heritage Foundation. Fullerton, D. (2001). “A framework to compare environmental policies”. Southern Economic Journal, Vol. 68, Issue 2 (October), pp 224–48. Fullerton, D., Leicester, A. and Smith, S. (2008). “Environmental taxes”. Mirlees Review, Institute for Fiscal Studies, Oxford University Press. Gavin, G. (2004). “The World Trade Organisation, Kyoto and Energy Tax Adjustment at the border”.Journal of World Trade 38, pp 395. HM Revenue and Customs (n.d). “Climate Change Levy (CCL): Changes to rates”.Available from:http://customs.hmrc.gov.uk/channelsPortalWebApp/channelsPortalWebApp.portal?_nfpb=true&_pageLabel=pageExcise_InfoGuides&propertyType=document&id=HMCE_PROD1_027235 (Accessed on 15 January 2010). IPCC (2007). Summary for Policymakers. “Climate Change 2007: Mitigation”. Contribution of working group III to the fourth assessment report of the IPCC. Lachapelle, E. (2009). What Price Carbon? Theory and Practice of Carbon taxation in the OECD. Draft, prepared for 81st Annual Conference of Canadian Political Science Association. Magat, W.and Viscusi, K. (1990). “Effectiveness of the EPA’s regulatory enforcement: the case of industrial effluent standards”. Journal of Law and Economics, Vol. 33, No. 2, pp 331–60. Metcalf, G.E. (2008). Designing a Carbon Tax to Reduce US Greenhouse Gas Emissions. National Bureau of Economic Research. National Treasury. (2006). Draft policy paper: A Framework for Considering Market-Based Instruments to Support Environmental Fiscal Reform in South Africa. South Africa: National Treasury.
61
Newell, R. G. and Stavins, R.N. (2003). “Cost heterogeneity and the potential savings from market-based policies”. Journal of Regulatory Economics, Vol. 23, No. 1, pp 43–59. OECD. (1993). Taxation and the Environment: Complementary Policies. Paris: OECD. OECD. (1996). Implementation strategies for environmental taxes. Paris: OECD. Pigou, A. C. (1920). The Economics of Welfare. London: MacMillan. Rivers, N. and Sawyer, D. (2008).Pricing Carbon: Saving Green: A Carbon Price to Lower Emissions Taxes and Barriers to Green Technology. David Suzuki Foundation. Ryelund, A. Improvements in Energy Efficiency and Gross carbon – Energy Tax Burdens of Energy Intensive and less energy intensive sectors: Subsector.National Energy Research Institute, pp 148-197. SAPIA (2008). “Petrol and Diesel in South Africa and the impact on air quality”. Available from: http://www.sapia.co.za/ffuels/docs/Petrol-and-Diesel-in-South-Africa.pdf (Accessed on 19 January 2010). Smith, S. (1992). “The distributional consequences of taxes on energy and the carbon content of fuels”. European Economy, Special Edition No 1/1992: The economics of limiting CO2 emissions, pp 241–68. Smith, S. (2008). Environmentally related Taxes and Tradable Permit Systems in Practice.University College, London: OECD. SOFIA Initiative. “Review of Carbon and Energy Taxes in EU”. Available from: http://archive.rec.org/. (Accessed on 8 January 2010). Speck, S. (2007). Overview of Environmental Tax Reforms in EU Member States. Denmark: National Environmental Research Institute / University of Aarhus. Package 1 of the final report of the COMETR project,pp19-83. Speck, S. (2008). “The design of carbon and broad-based energy taxes in European countries”. Vermont Journal of Environmental Law,Vol. 10, pp 31-59. Stavins, R.N. (2005). “Vintage Differentiated Environmental Regulation”.Resources for the Future Discussion Paper, pp 5–59. United Nations Environment Programme. (2004). Climate Policy Frameworks Beyond 2012: Development and Climate Change in South African Context.Energy Research Centre, University of Cape Town. November 2004, pp1-20. Van Heerden, J., Gerlagh, R., Blignaut, J., Horridge, M., Hess, S., Mabugu, R., and Mabugu, M. (2006). “Searching for Triple Dividends in South Africa:Fighting CO2 Pollution and Poverty While Promoting Growth”. The Energy Journal.vol. 27, no. 2, pp 113-141. Weisbach, D.A. and Metcalf, G.E. (2009). “The design of a carbon tax”. Available from: http://www.pricecarbon.org/pdf/design_of_a_carbon_tax.pdf.Williams, L. and Zabel, A. (2009). Why acid rain is the wrong template and the 1990 CFC Tax is closer to the mark – and why cap & trade won’t solve the climate crisis but carbon fees with 100% rebate can. Discussion paper, Available from:
(Accessed on 19 January 2010).
www.carbonfees.org. Winkler, H. and Marquard, A. (2009). Analysis of the Economic Implications of a Carbon Tax. Energy Research Centre, University of Cape Town.
62
Annexure 1:Social costs of carbon Cost effectiveness valuation method 178. Studies that attempt to estimate the social cost of carbon are usually accompanied with a
significant degree of uncertainty, due to the complex models, parameters and assumptions involved.
179. In the case of the cost-effectiveness approach, integrated assessment models consisting of
engineering-economic models and computable general equilibrium models are implemented to present both climate and economic systems respectively. Modelling climate systems involves the use of engineering-economic models, which make assumptions based on available mitigation energy technologies and the uptake of these technologies. Computable general equilibrium models are used to model the impacts of changes in economic parameters. These models are usually hybrid, static models that focus primarily on the energy sector, and assume the current set of technologies as given. The models are particularly sensitive to:
• Baseline data assumptions • Technology options available and future costs of mitigation.
180. In turn, the cost of mitigation is influenced by business-as-usual emissions, which are based on
assumptions around GDP and population growth, energy intensity of GDP and the energy/fuel mix. Further uncertainties arise when dealing with the future availability and cost of emissions-saving technologies, such as renewables and nuclear, alternative transport fuels and carbon capture and storage.
Marginal damage estimation 181. Marginal damage estimations directly quantify the social costs of carbon emissions. Models
quantify the impacts of climate change and categorise these effects according to predictability - for example, extreme catastrophic events are categorised as unpredictable. Predictable effects may include changes in agricultural productivity as a result of increased global temperatures and reduced rainfall.
182. The costs from each of these models are used to construct a marginal damage cost function, which
is then compared to the marginal abatement costs of reducing emissions. Government policy on abatement levels is determined by the point where the marginal damages costs of carbon equals the marginal cost of abatement, which is the carbon price.
63
Annexure 2:International examples Sweden 183. The current environment tax system in Sweden is a combination of carbon, energy, nuclear power
and consumption taxes. Sweden undertook environmental tax reform in 1989 and transformed the existing practice of energy taxation on industry to a combined energy and carbon tax base. A carbon tax was introduced in 1991 at an initial rate of $36.8 per metric ton (which currently stands at Euro 90/ton of CO2), however, the industry was only charged 50 per cent. This system of taxation replaced the traditional energy tax regime that was in place since 1974. The tax rates for industries are similar to those for households. Overall, the initial tax rates corresponded to the European Commission’s 1990 proposal for a carbon/energy tax of 10 US$ per barrel of oil.
184. The initial scheme was in need of reform to address competitiveness concerns. The rate was
adjusted in 1993 with the carbon tax for industry falling to around $12 per metric ton, but increasing for consumers to around $47.2 per metric ton. Since then the rate has increased every year, reaching $50.1 per metric ton in 1996, however the rate applicable (industry) declined to 25 per cent. In 2006, industry paid 21 per cent of the carbon tax rate to households. From 1993, until the implementation of the Energy Taxation Directive, Swedish industry was also exempt from electricity taxation.
185. The effect of the carbon tax in Sweden was positive. The level of carbon emissions was reduced by
13 per cent (6–8 million metric tons) between 1987 and 1994, which was significantly lower than the government’s original target. Fossil fuel use decreased, while the use of biomass in energy increased.
186. The initial scheme, as well as its successor, allowed a cap on carbon/energy-intensive (taxed)
sectors where energy taxation exceeded 1.7 per cent of the value of product sales. The mitigation approach was, to some extent, discretionary in that companies applied individually in order to obtain the cap on energy taxation. The exemption mechanism has been continued and the cap was lowered for a while to a level where the tax burden exceeded 1.2 per cent of product sales value, and substantial reductions (75 per cent) were available already - at a point where 0.8 per cent was exceeded.56 From 2006, the 0.8 per cent offers a threshold rather than a cap, and provides the possibility for reduced tax rates only, not a complete exemption. Furthermore, these tax reductions are limited to coal and gas. The reduced rates are only about 15 per cent (1/6) of the nominal rates for industry and are somewhat similar to the EU minimum rates. About 50-60 energy-intensive companies are believed to benefit from the threshold for reduced carbon taxation.57
A requirement for agreements or voluntary measures to reduce carbon emissions in order to benefit from the lower tax rates above the threshold was introduced from 2006.
56Speck, S. (2007). Overview of Environmental Tax Reforms in EU Member States. Denmark: National Environmental Research Institute / University of Aarhus. Package 1 of the final report of the COMETR project, pp 19-83. 57Speck, S. (2007). Overview of Environmental Tax Reforms in EU Member States. Denmark: National Environmental Research Institute / University of Aarhus. Package 1 of the final report of the COMETR project, pp 19-83.
64
Finland 187. Finland was the first country to introduce a carbon tax, which took effect in 1990. The Finnish
carbon tax provides uniform tax rates for all industrial sectors and applies according to the CO2 content of fuels, with a tax rate of Mk 6.66 ($1.45) per metric ton of CO2. One reason for the application of a uniform carbon tax rate is the prevalence of hydropower and nuclear power in Finland - although fossil fuels still contribute more than 60 per cent to energy supply. The initial tax scheme had no special exemption mechanism for energy-intensive industries, possibly due to the relatively modest level of the initial carbon tax.
188. From 1993, the level of the carbon tax has been gradually increased, and has become comparable to recent Swedish levels of carbon/energy taxation for industries. It is no longer based purely on carbon content but rather 60/40 on carbon/energy content, the energy content portion being 3.5 Mk per MwH ($0.21 per gigajoule). The carbon tax was raised to Mk 13.59 ($2.96) in 1993 and to Mk 38.3 ($8.34) in 1995. In 1998, a relief mechanism for energy-intensive industries was introduced. This mechanism involves a threshold, which allows for a substantial reduction in carbon taxation (85 per cent) for energy-intensive industries where the carbon/energy taxation burden exceeds 3.7 per cent of value added. This tax relief mainly benefits the pulp and paper industry.58
Products used as raw materials for industrial production, fuel for planes and certain other vessels, and energy from peat production are all exempt from the tax.
189. A pioneering element of the early carbon/energy taxation scheme in Finland was the principle of fuel-input taxation for electricity production, rather than a conventional end-user tax. The tax scheme applied a uniform tax rate for imported electricity, although this was found to be in conflict with EU competition rules. In 1997, Finland changed the tax base and an end-user electricity tax has been applied ever since. The end-user electricity tax is unable to discriminate according to carbon emissions and so the environmental effectiveness of the energy taxation scheme – regarding electricity - has lost its original precision.
Denmark 190. The energy/carbon tax in Denmark is threefold, including an energy, carbon and sulphur tax. The
energy tax is based on the energy content of fossil fuels, oil products and coal. The Danish carbon tax rate for industry is Euro 12/ton for fuels (which was reduced in 2005 from its original level of Euro 13/ton in 1992), which is about half that of the reduced Swedish tax rate for carbon from fuels. In the first phase, from 1992-1995, there was a possibility for a further 50 per cent refund of the carbon tax for all sectors in Denmark. In addition, tax payments exceeding a threshold of 3 per cent of net sales value were reduced by 90 per cent. As a result, the effective carbon tax rate for heavy industry was 5 per cent of the nominal rate. The sulphur tax, which was introduced in 1996, is levied on all fossil fuels with a sulphur content exceeding 0.05 per cent.
58Speck, S. (2007). Overview of Environmental Tax Reforms in EU Member States. Denmark: National Environmental Research Institute / University of Aarhus. Package 1 of the final report of the COMETR project, pp 19-83.
65
191. In the second phase, implemented from 1996, the mitigation measures were constrained. This phase significantly reduced the exemption allowances from the energy and carbon taxes faced by most firms, particularly the energy-intensive sector. Three different tax rates were introduced for standard industrial processes, heavy industrial processes and heating purposes, respectively. The standard rate continued at Euro 12/ton CO2, and reductions were phased out - except for industries that had entered into binding agreements to undertake energy-efficiency measures. Heavy industry with agreements continued to benefit from arrangements that allowed them to lower their tax rate to 3 per cent of the standard rate. It is estimated that about 100 companies benefit from the reduced rates for heavy industries, and that these companies are responsible for more than half of industrial sector emissions of CO2. Only the tax rate for industrial space heating is similar to tax rates paid by households (about Euro 80/ton CO2).
192. An end-user carbon tax on electricity reflects the average carbon content of the Danish energy
supply system and applies equally to households and industry with a rate of 1.2 Eurocent/kWh (as in 2009). This is similar to the Dutch approach, but with a higher rate than in the other Nordic countries, reflecting the higher carbon content in Danish electricity generation.
Netherlands 193. The Netherlands first adopted a carbon tax in 1990, but replaced it in 1992 with the Environmental
Tax on Fuels - a 50/50 carbon/energy tax. 194. In 1996, a “small-users” tax, the Regulatory Tax on Energy, was implemented. This carbon/energy
tax scheme was similar to the European Commission’s proposal for the EU as a whole. The Dutch small-users tax was combined with two existing taxes to increase energy taxation and constitute an important source of revenue. The small-users tax applies to a range of energy products, but tax rates for two important energy products were mitigated.
195. The tax scheme provided a cap for all energy-intensive industries from taxes above certain
thresholds (initially 170 000 m3 natural gas or 50 000 kWh electricity) - a very generous treatment of energy-intensive industries. These thresholds were adjusted several times and are now much higher: 1 million m3 for gas and 10 million kWh for electricity. Most companies were affected by the small-users tax, but even with the high caps, about 60 per cent of industrial energy consumption of gas and electricity was subject to the reductions.
196. From 2001, a zero rate is no longer available above the thresholds, but tax rates are reduced
according to a scheme that differentiates between different consumption-level groups. From 2004, following the implementation of the Energy Taxation Directive, the energy-intensive industries are, via the reductions, effectively liable to the European minimum rates for energy products for consumption above the thresholds. For smaller users, the tax rates in the Netherlands are generally modest when compared to the Nordic countries; the level for natural gas (1-10 million m3) is about half the level in Denmark. For electricity, however, the tax rates in Netherlands are comparable to the Danish rates for industry, and are significantly higher than those in Finland and Sweden.
Slovenia 197. The Slovenian carbon tax, which was introduced in 1997, supplemented the former energy taxation
of liquid fuels. The carbon tax was an indirect tax on the consumption of fossil fuels and the burning
66
of flammable organic materials, excluding: wood used for heating, fuels made from biomass, and the use of biogas generated from cleaning equipment or at waste-dumping sites. The tax was initiated at a rate of approximately Euro 5.5 per ton of CO2, followed by an increase in March 1998 to Euro 16 per ton of CO2. It was extended in 1999 and 2000 to include excise duties for transport fuels and natural gas.
198. More than 50 per cent of Slovenia’s electricity is produced from hydro and nuclear power. From
1992-1999, electricity was subject to a 5 per cent non-deductible sales tax that also applied to industry.59
The EU minimum rate was introduced in 2007. In total, about 150 companies benefited from direct reductions, although a broader range of companies benefit indirectly from the treatment of the electricity generators. A complex range of reductions available from the carbon tax are listed below.
• Certain energy-intensive industries, including power plants, with more than 10 tons of annual CO2 emissions, were allowed a basic deduction according to their baseline emissions.
• Coal used for power generation has been explicitly exempt. • Combined heat and power units received a tax reduction, and reductions were also available
for district heating. • Specific companies producing heat-insulation materials and transport installations for
natural gas were exempt. 199. The situation changed fundamentally when Slovenia joined the EU in May 2004. The scheme was
changed by 1 May 2005, and the reductions for specific companies were phased out over a period of five years from that time. The reductions for power-plant fuels and combined heat and power operators remain in place, as they are in accordance with the principles of the Energy Taxation Directive. Although the Commission was not explicit in its decision, it seems that reductions for power plants are admissible because the Energy Taxation Directive requires an end-user tax for electricity.
200. According to the accession agreement, Slovenia introduced the minimum rates for electricity
taxation of industries by 1 January 2007. The nominal tax rates in Slovenia for liquid fuels are comparable to those found in other member states. Energy-intensive industries have not received special mitigation treatment under Slovenia’s carbon taxation scheme, other than a recent attempt to exempt sectors involved in emissions trading schemes.
Germany 201. Taxes on liquid fuels have been levied in Germany since the 1950s, and were broadened in 1989
with the introduction of a tax on natural gas, and extending to coal in 2007.60
Germany introduced Environmental Tax Reform between 1999 and 2003, which entailed an extension of the earlier system of taxation of liquid energy products for industry and transport. This involved fundamental reforms to electricity taxation, which was phased out in 1996 and succeeded by a new electricity tax from 1999.
59 Ministry of Environment, 1997: 132. 60 See Speck, “The design of carbon and broad-based energy taxes in European countries” (2008).
67
202. Taxes on fuels were gradually increased by Euro 154 per 1 000 litres of petrol and diesel, and taxes on heating fuels also increased while the tax on natural gas was doubled. Taxes on heavy fuel oil were also introduced but, unlike the Danish example, heavy fuel oil for electricity generation was also included. In addition, an electricity tax was introduced in 1999 with annual increases.
203. The current tax base is not adjusted according to the carbon content of fuels, and it is important to note that coal as fuel for industrial purposes was not taxed until 2006. While the nominal tax rates per ton of CO2 for liquid fuels and natural gas are comparable to those of Sweden and Finland, the reduction mechanisms for energy-intensive industries result in much lower effective tax rates for companies.
204. The tax reforms in Germany were part of an environmental tax reform process in which the
revenue raised was used to induce specific tax shifts. In particular, the revenue was used to reduce employer and employee pension contributions. All of the revenue raised from the electricity tax was earmarked for this tax shift and about half of the tax shift comes from revenues raised from transport fuel taxes.
205. There are a number of special provisions and tax exemptions available for the manufacturing,
agriculture, forestry and fishing industries in Germany, in the form of a tax relief of 40 per cent of the standard rates on electricity, heating oil and natural gas. However, this exemption only applies to the consumption of energy exceeding Euro 512.5 annually. These provisions interact to significantly reduce the effective tax rates for these sectors (Speck, 2008).61
Nevertheless, the German authorities have shown that the reduced rates are sufficient to meet the minimum rates of the EU’s Energy Taxation Directive.
206. In the German system there is a cap on tax payments and a threshold for peak adjustments, above which significantly reduced rates apply. During the first four years, from 1999-2002, the net tax rates for all manufacturing industries and the agriculture, fishery and forestry sectors were set at 20 per cent of the nominal rates. From 2003, the net rates have been adjusted to 60 per cent of the nominal rates.
61 See Speck, “The design of carbon and broad-based energy taxes in European countries” (2008).
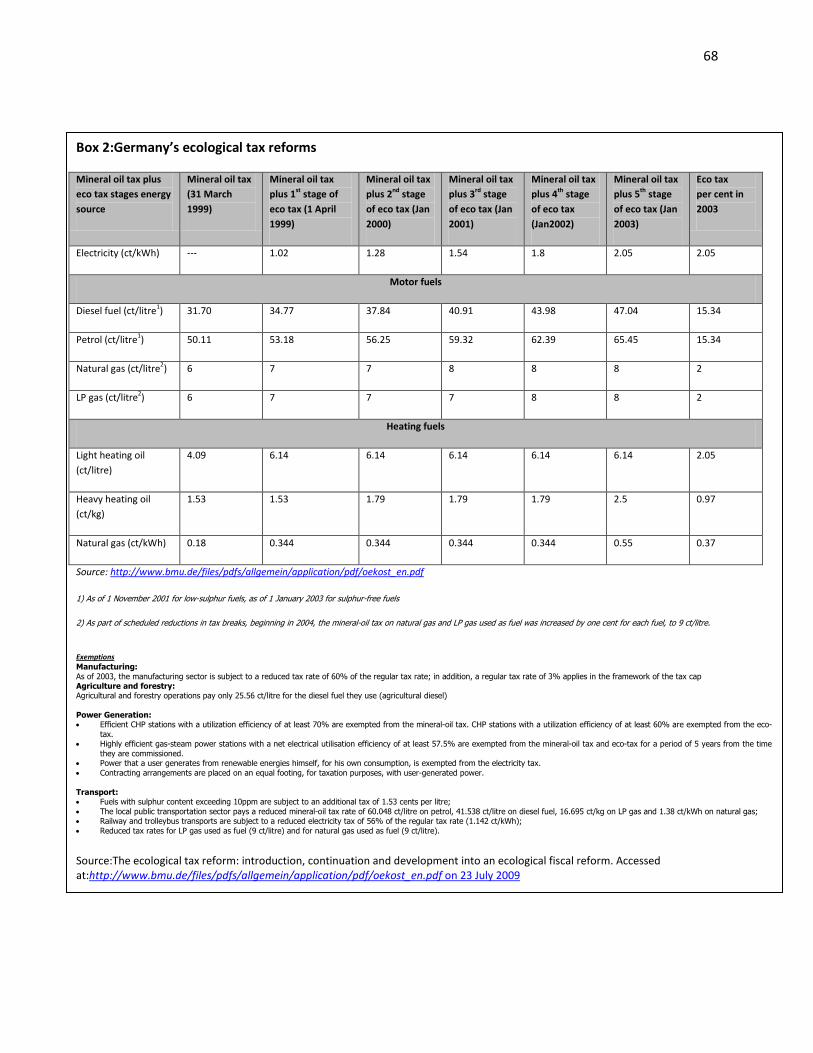
68
Box 2:Germany’s ecological tax reforms
Mineral oil tax plus eco tax stages energy source
Mineral oil tax (31 March 1999)
Mineral oil tax plus 1st stage of eco tax (1 April 1999)
Mineral oil tax plus 2nd stage of eco tax (Jan 2000)
Mineral oil tax plus 3rd stage of eco tax (Jan 2001)
Mineral oil tax plus 4th stage of eco tax (Jan2002)
Mineral oil tax plus 5th stage of eco tax (Jan 2003)
Eco tax per cent in 2003
Electricity (ct/kWh) --- 1.02 1.28 1.54 1.8 2.05 2.05
Motor fuels
Diesel fuel (ct/litre1) 31.70 34.77 37.84 40.91 43.98 47.04 15.34
Petrol (ct/litre1) 50.11 53.18 56.25 59.32 62.39 65.45 15.34
Natural gas (ct/litre2) 6 7 7 8 8 8 2
LP gas (ct/litre2) 6 7 7 7 8 8 2
Heating fuels
Light heating oil (ct/litre)
4.09 6.14 6.14 6.14 6.14 6.14 2.05
Heavy heating oil (ct/kg)
1.53 1.53 1.79 1.79 1.79 2.5 0.97
Natural gas (ct/kWh) 0.18 0.344 0.344 0.344 0.344 0.55 0.37
Source: http://www.bmu.de/files/pdfs/allgemein/application/pdf/oekost_en.pdf
1) As of 1 November 2001 for low-sulphur fuels, as of 1 January 2003 for sulphur-free fuels
2) As part of scheduled reductions in tax breaks, beginning in 2004, the mineral-oil tax on natural gas and LP gas used as fuel was increased by one cent for each fuel, to 9 ct/litre.
Exemptions Manufacturing: As of 2003, the manufacturing sector is subject to a reduced tax rate of 60% of the regular tax rate; in addition, a regular tax rate of 3% applies in the framework of the tax cap Agriculture and forestry: Agricultural and forestry operations pay only 25.56 ct/litre for the diesel fuel they use (agricultural diesel) Power Generation: • Efficient CHP stations with a utilization efficiency of at least 70% are exempted from the mineral-oil tax. CHP stations with a utilization efficiency of at least 60% are exempted from the eco-
tax. • Highly efficient gas-steam power stations with a net electrical utilisation efficiency of at least 57.5% are exempted from the mineral-oil tax and eco-tax for a period of 5 years from the time
they are commissioned. • Power that a user generates from renewable energies himself, for his own consumption, is exempted from the electricity tax. • Contracting arrangements are placed on an equal footing, for taxation purposes, with user-generated power. Transport: • Fuels with sulphur content exceeding 10ppm are subject to an additional tax of 1.53 cents per litre; • The local public transportation sector pays a reduced mineral-oil tax rate of 60.048 ct/litre on petrol, 41.538 ct/litre on diesel fuel, 16.695 ct/kg on LP gas and 1.38 ct/kWh on natural gas; • Railway and trolleybus transports are subject to a reduced electricity tax of 56% of the regular tax rate (1.142 ct/kWh); • Reduced tax rates for LP gas used as fuel (9 ct/litre) and for natural gas used as fuel (9 ct/litre).
Source:The ecological tax reform: introduction, continuation and development into an ecological fiscal reform. Accessed at:http://www.bmu.de/files/pdfs/allgemein/application/pdf/oekost_en.pdf on 23 July 2009
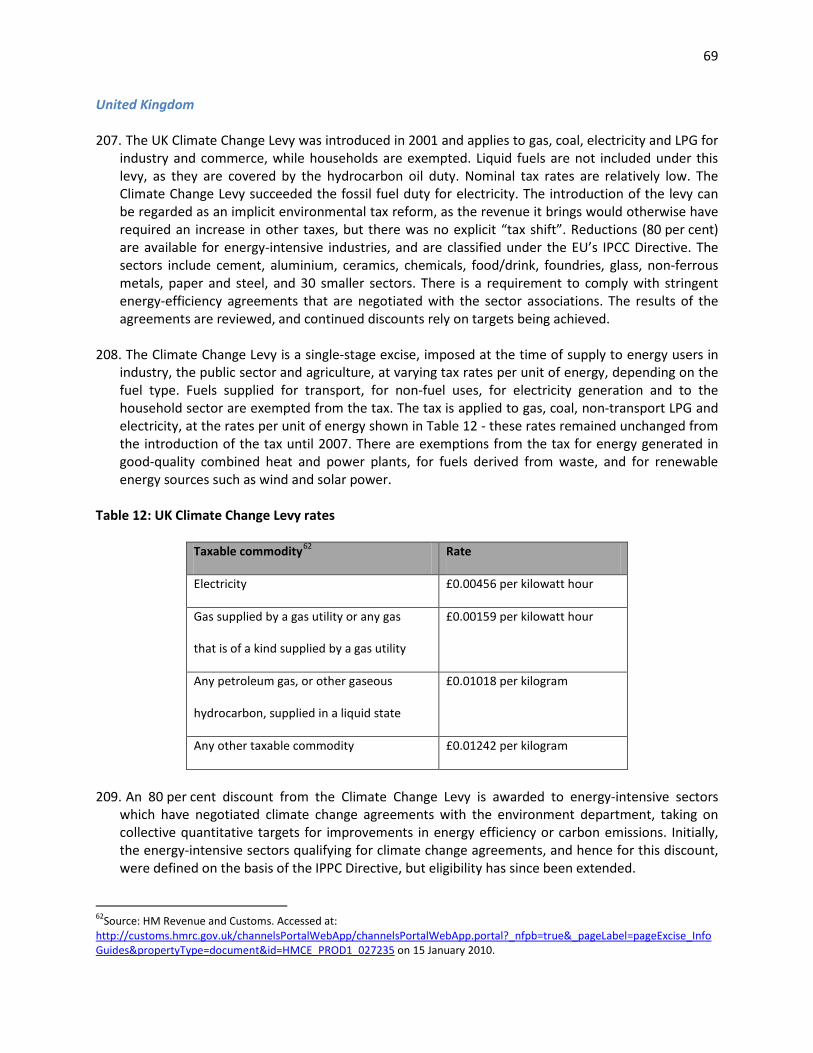
69
United Kingdom 207. The UK Climate Change Levy was introduced in 2001 and applies to gas, coal, electricity and LPG for
industry and commerce, while households are exempted. Liquid fuels are not included under this levy, as they are covered by the hydrocarbon oil duty. Nominal tax rates are relatively low. The Climate Change Levy succeeded the fossil fuel duty for electricity. The introduction of the levy can be regarded as an implicit environmental tax reform, as the revenue it brings would otherwise have required an increase in other taxes, but there was no explicit “tax shift”. Reductions (80 per cent) are available for energy-intensive industries, and are classified under the EU’s IPCC Directive. The sectors include cement, aluminium, ceramics, chemicals, food/drink, foundries, glass, non-ferrous metals, paper and steel, and 30 smaller sectors. There is a requirement to comply with stringent energy-efficiency agreements that are negotiated with the sector associations. The results of the agreements are reviewed, and continued discounts rely on targets being achieved.
208. The Climate Change Levy is a single-stage excise, imposed at the time of supply to energy users in industry, the public sector and agriculture, at varying tax rates per unit of energy, depending on the fuel type. Fuels supplied for transport, for non-fuel uses, for electricity generation and to the household sector are exempted from the tax. The tax is applied to gas, coal, non-transport LPG and electricity, at the rates per unit of energy shown in Table 12 - these rates remained unchanged from the introduction of the tax until 2007. There are exemptions from the tax for energy generated in good-quality combined heat and power plants, for fuels derived from waste, and for renewable energy sources such as wind and solar power.
Table 12: UK Climate Change Levy rates
Taxable commodity62 Rate
Electricity £0.00456 per kilowatt hour
Gas supplied by a gas utility or any gas
that is of a kind supplied by a gas utility
£0.00159 per kilowatt hour
Any petroleum gas, or other gaseous
hydrocarbon, supplied in a liquid state
£0.01018 per kilogram
Any other taxable commodity £0.01242 per kilogram
209. An 80 per cent discount from the Climate Change Levy is awarded to energy-intensive sectors
which have negotiated climate change agreements with the environment department, taking on collective quantitative targets for improvements in energy efficiency or carbon emissions. Initially, the energy-intensive sectors qualifying for climate change agreements, and hence for this discount, were defined on the basis of the IPPC Directive, but eligibility has since been extended.
62Source: HM Revenue and Customs. Accessed at: http://customs.hmrc.gov.uk/channelsPortalWebApp/channelsPortalWebApp.portal?_nfpb=true&_pageLabel=pageExcise_InfoGuides&propertyType=document&id=HMCE_PROD1_027235 on 15 January 2010.
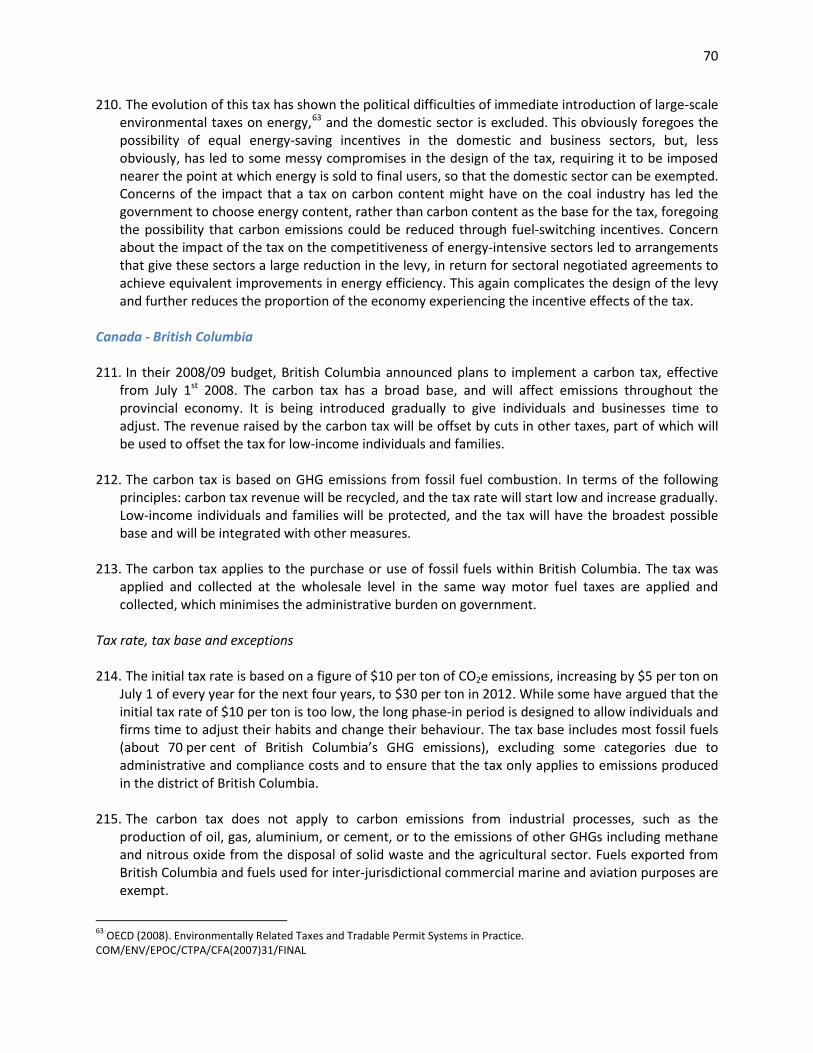
70
210. The evolution of this tax has shown the political difficulties of immediate introduction of large-scale environmental taxes on energy,63
and the domestic sector is excluded. This obviously foregoes the possibility of equal energy-saving incentives in the domestic and business sectors, but, less obviously, has led to some messy compromises in the design of the tax, requiring it to be imposed nearer the point at which energy is sold to final users, so that the domestic sector can be exempted. Concerns of the impact that a tax on carbon content might have on the coal industry has led the government to choose energy content, rather than carbon content as the base for the tax, foregoing the possibility that carbon emissions could be reduced through fuel-switching incentives. Concern about the impact of the tax on the competitiveness of energy-intensive sectors led to arrangements that give these sectors a large reduction in the levy, in return for sectoral negotiated agreements to achieve equivalent improvements in energy efficiency. This again complicates the design of the levy and further reduces the proportion of the economy experiencing the incentive effects of the tax.
Canada - British Columbia 211. In their 2008/09 budget, British Columbia announced plans to implement a carbon tax, effective
from July 1st 2008. The carbon tax has a broad base, and will affect emissions throughout the provincial economy. It is being introduced gradually to give individuals and businesses time to adjust. The revenue raised by the carbon tax will be offset by cuts in other taxes, part of which will be used to offset the tax for low-income individuals and families.
212. The carbon tax is based on GHG emissions from fossil fuel combustion. In terms of the following
principles: carbon tax revenue will be recycled, and the tax rate will start low and increase gradually. Low-income individuals and families will be protected, and the tax will have the broadest possible base and will be integrated with other measures.
213. The carbon tax applies to the purchase or use of fossil fuels within British Columbia. The tax was
applied and collected at the wholesale level in the same way motor fuel taxes are applied and collected, which minimises the administrative burden on government.
Tax rate, tax base and exceptions 214. The initial tax rate is based on a figure of $10 per ton of CO2e emissions, increasing by $5 per ton on
July 1 of every year for the next four years, to $30 per ton in 2012. While some have argued that the initial tax rate of $10 per ton is too low, the long phase-in period is designed to allow individuals and firms time to adjust their habits and change their behaviour. The tax base includes most fossil fuels (about 70 per cent of British Columbia’s GHG emissions), excluding some categories due to administrative and compliance costs and to ensure that the tax only applies to emissions produced in the district of British Columbia.
215. The carbon tax does not apply to carbon emissions from industrial processes, such as the production of oil, gas, aluminium, or cement, or to the emissions of other GHGs including methane and nitrous oxide from the disposal of solid waste and the agricultural sector. Fuels exported from British Columbia and fuels used for inter-jurisdictional commercial marine and aviation purposes are exempt.
63 OECD (2008). Environmentally Related Taxes and Tradable Permit Systems in Practice. COM/ENV/EPOC/CTPA/CFA(2007)31/FINAL
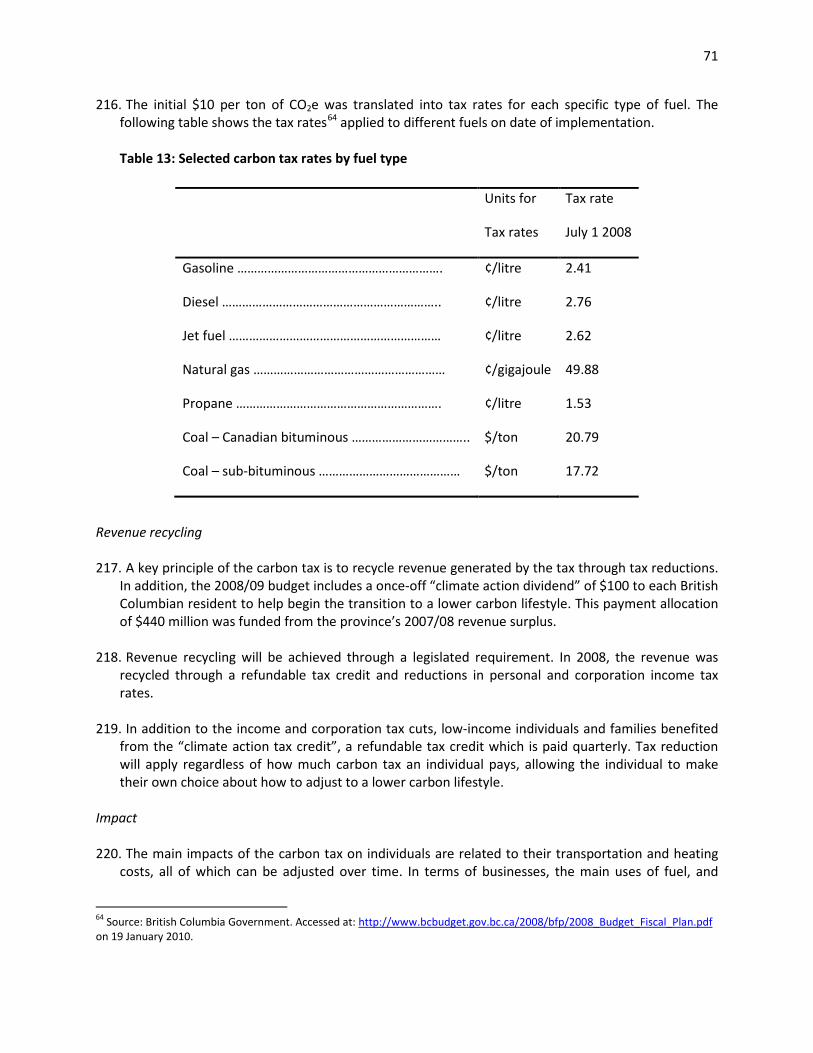
71
216. The initial $10 per ton of CO2e was translated into tax rates for each specific type of fuel. The following table shows the tax rates64
applied to different fuels on date of implementation.
Table 13: Selected carbon tax rates by fuel type
Revenue recycling 217. A key principle of the carbon tax is to recycle revenue generated by the tax through tax reductions.
In addition, the 2008/09 budget includes a once-off “climate action dividend” of $100 to each British Columbian resident to help begin the transition to a lower carbon lifestyle. This payment allocation of $440 million was funded from the province’s 2007/08 revenue surplus.
218. Revenue recycling will be achieved through a legislated requirement. In 2008, the revenue was recycled through a refundable tax credit and reductions in personal and corporation income tax rates.
219. In addition to the income and corporation tax cuts, low-income individuals and families benefited from the “climate action tax credit”, a refundable tax credit which is paid quarterly. Tax reduction will apply regardless of how much carbon tax an individual pays, allowing the individual to make their own choice about how to adjust to a lower carbon lifestyle.
Impact 220. The main impacts of the carbon tax on individuals are related to their transportation and heating
costs, all of which can be adjusted over time. In terms of businesses, the main uses of fuel, and
64 Source: British Columbia Government. Accessed at: http://www.bcbudget.gov.bc.ca/2008/bfp/2008_Budget_Fiscal_Plan.pdf on 19 January 2010.
Units for Tax rate
Tax rates July 1 2008
Gasoline ……………………………………………………. ¢/litre 2.41
Diesel ……………………………………………………….. ¢/litre 2.76
Jet fuel ……………………………………………………… ¢/litre 2.62
Natural gas ………………………………………………… ¢/gigajoule 49.88
Propane ……………………………………………………. ¢/litre 1.53
Coal – Canadian bituminous …………………………….. $/ton 20.79
Coal – sub-bituminous …………………………………… $/ton 17.72
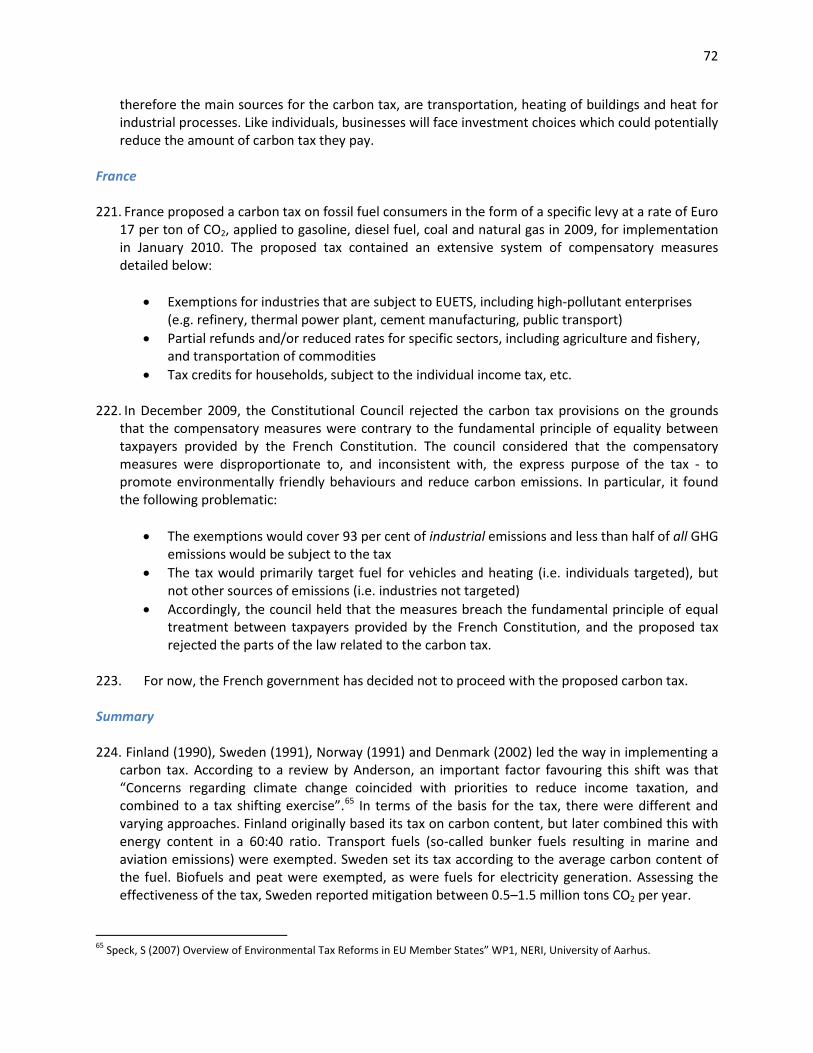
72
therefore the main sources for the carbon tax, are transportation, heating of buildings and heat for industrial processes. Like individuals, businesses will face investment choices which could potentially reduce the amount of carbon tax they pay.
France
221. France proposed a carbon tax on fossil fuel consumers in the form of a specific levy at a rate of Euro
17 per ton of CO2, applied to gasoline, diesel fuel, coal and natural gas in 2009, for implementation in January 2010. The proposed tax contained an extensive system of compensatory measures detailed below:
• Exemptions for industries that are subject to EUETS, including high-pollutant enterprises (e.g. refinery, thermal power plant, cement manufacturing, public transport)
• Partial refunds and/or reduced rates for specific sectors, including agriculture and fishery, and transportation of commodities
• Tax credits for households, subject to the individual income tax, etc.
222. In December 2009, the Constitutional Council rejected the carbon tax provisions on the grounds that the compensatory measures were contrary to the fundamental principle of equality between taxpayers provided by the French Constitution. The council considered that the compensatory measures were disproportionate to, and inconsistent with, the express purpose of the tax - to promote environmentally friendly behaviours and reduce carbon emissions. In particular, it found the following problematic:
• The exemptions would cover 93 per cent of industrial emissions and less than half of all GHG emissions would be subject to the tax
• The tax would primarily target fuel for vehicles and heating (i.e. individuals targeted), but not other sources of emissions (i.e. industries not targeted)
• Accordingly, the council held that the measures breach the fundamental principle of equal treatment between taxpayers provided by the French Constitution, and the proposed tax rejected the parts of the law related to the carbon tax.
223. For now, the French government has decided not to proceed with the proposed carbon tax. Summary 224. Finland (1990), Sweden (1991), Norway (1991) and Denmark (2002) led the way in implementing a
carbon tax. According to a review by Anderson, an important factor favouring this shift was that “Concerns regarding climate change coincided with priorities to reduce income taxation, and combined to a tax shifting exercise”.65
In terms of the basis for the tax, there were different and varying approaches. Finland originally based its tax on carbon content, but later combined this with energy content in a 60:40 ratio. Transport fuels (so-called bunker fuels resulting in marine and aviation emissions) were exempted. Sweden set its tax according to the average carbon content of the fuel. Biofuels and peat were exempted, as were fuels for electricity generation. Assessing the effectiveness of the tax, Sweden reported mitigation between 0.5–1.5 million tons CO2 per year.
65 Speck, S (2007) Overview of Environmental Tax Reforms in EU Member States” WP1, NERI, University of Aarhus.
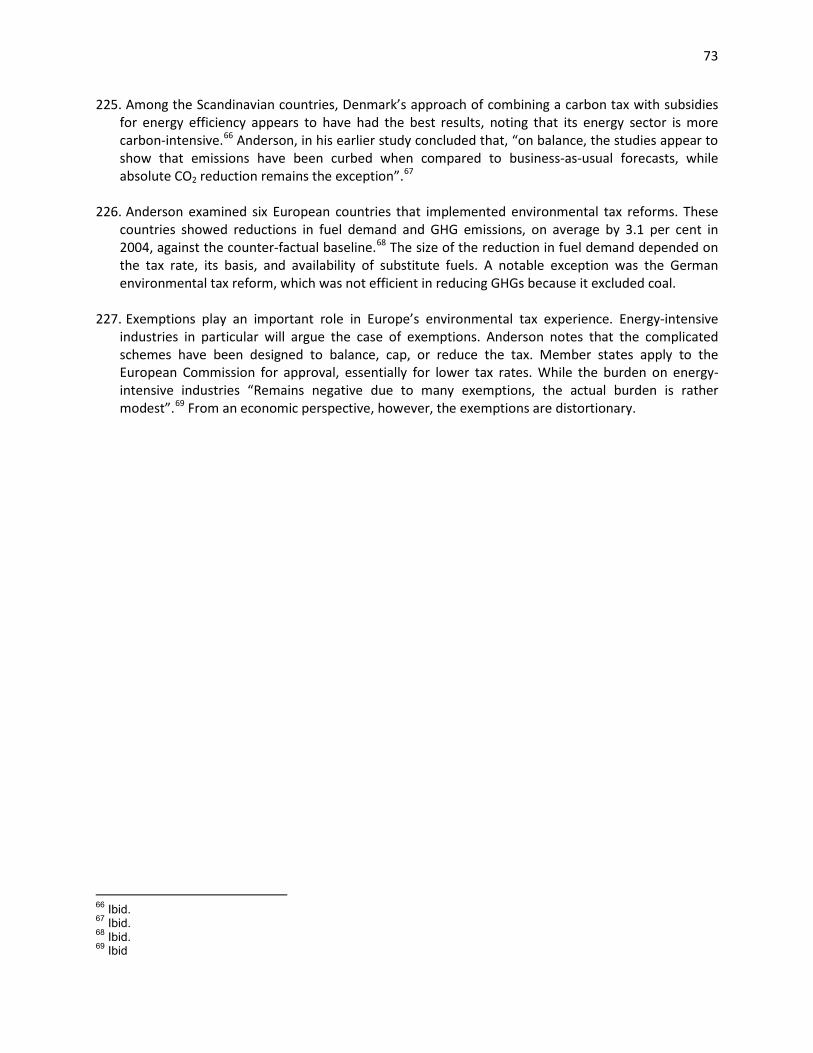
73
225. Among the Scandinavian countries, Denmark’s approach of combining a carbon tax with subsidies for energy efficiency appears to have had the best results, noting that its energy sector is more carbon-intensive.66 Anderson, in his earlier study concluded that, “on balance, the studies appear to show that emissions have been curbed when compared to business-as-usual forecasts, while absolute CO2 reduction remains the exception”.67
226. Anderson examined six European countries that implemented environmental tax reforms. These countries showed reductions in fuel demand and GHG emissions, on average by 3.1 per cent in 2004, against the counter-factual baseline.68
The size of the reduction in fuel demand depended on the tax rate, its basis, and availability of substitute fuels. A notable exception was the German environmental tax reform, which was not efficient in reducing GHGs because it excluded coal.
227. Exemptions play an important role in Europe’s environmental tax experience. Energy-intensive industries in particular will argue the case of exemptions. Anderson notes that the complicated schemes have been designed to balance, cap, or reduce the tax. Member states apply to the European Commission for approval, essentially for lower tax rates. While the burden on energy-intensive industries “Remains negative due to many exemptions, the actual burden is rather modest”.69
From an economic perspective, however, the exemptions are distortionary.
66 Ibid. 67 Ibid. 68 Ibid. 69 Ibid
74
Annexure 3: Economic efficiency gains of market-based instruments Figure 7:Market-based instruments versus CAC policy measures
Source: Fullerton, D. Leicester, A. and Smith, S. “Environmental taxes”, Mirlees Review, Institute for Fiscal Studies, Oxford University Press, (2008).
228. Figure 7 shows the abatement cost schedule for two firms, A and B, presented in MACA and MACB
respectively. The CAC regulation is set at quantity of abatement Ā and the tax rate is set at P*. Point A* represents the least-cost position of a given total abatement requirement between firms A and B with different marginal abatement costs, represented by the schedules MACA and MACB, measured from the origins 0A and 0B respectively. The tax achieves point A* (e.g. through an emissions tax set at a rate P* per unit of emissions). The use of a CAC regulation that sets the required level of abatement at point Ā in the diagram for both firms’ results in higher total abatement costs shown by the shaded area.70Market-based instruments equalise the marginal abatement costs across all abatement opportunities within the firm, across various firms, production sectors and households by establishing a uniform emissions price.71
70Fullerton, D. Leicester, A. and Smith, S. (2008) “Environmental taxes”, Mirlees Review, Institute for Fiscal Studies, Oxford University Press.
71 Dales, 1968; Kneese and Bower 1968; Baumol and Oates 1971; Montgomery 1972.
75
Annexure 4: Acronyms
BTU British thermal unit
CAC Command and control
C02 Carbon dioxide
C02e Carbon dioxide equivalent
EU European Union
EUETS European Union emissions trading scheme
GDP Gross domestic product
GHG Greenhouse gas
IPCC Intergovernmental Panel on Climate Change
LPG Liquid petroleum gas
PPP Purchasing power parity
UNFCCC United Nations Framework Convention on Climate Change
WTO World Trade Organisation