
Reducing fuel consumption in industry: Assessment of … · Reducing fuel consumption in industry:...
12
Reducing fuel consumption in industry: Assessment of the economic efficiency of the integration of solar thermal energy into industrial processes Marcus HUMMEL, Vienna University of Technology, Energy Economics Group Felix HUMMEL, University of Vienna, Center for Computational Materials Science Lukas KRANZL, Vienna University of Technology, Energy Economics Group Christoph BRUNNER, AEE INTEC Jürgen FLUCH, AEE INTEC ABSTRACT In order to reach a long term sustainable production system it is essential to increase energy efficiency and by this reduce the amount of energy needed for the production of goods significantly. Furthermore, solar thermal energy has a great potential to reduce the fossil fuel input for process heat supply especially in branches using process heat temperatures between 30 and 150 °C. The aim of this research is to analyze the economic feasibility of the integration of solar thermal systems into industrial processes. We investigate various process characteristics, economic and climatic conditions as well as the impact of energy efficiency measures and carry out sensitivity analyses. A techno-economic modeling tool was developed that simulates industrial solar thermal systems on an hourly basis. The results show that under current conditions solar thermal systems for the supply of process heat are long term investments: for the investigated process and system characteristics payback periods range from 8 up to 12 years and longer, taking into account the investment subsidies currently in place in Austria. The main reasons are the high investment costs and the low market prices for fossil energy carriers. We show that the supply temperature of the solar system, the temporal load profiles of the processes and the climatic conditions have an important influence on the economic feasibility. The economic impact of energy efficiency measures is characterized by two opposite effects: a reduction of process temperatures leads to higher efficiencies of the solar system and makes further energy demand segments accessible, this increases economic efficiency. In contrast, waste heat recovery reduces the energy demand supplied by the solar system, this leads to smaller installations with higher specific costs (including planning and distribution costs) and therefore reduced economic efficiency. Introduction In 2005 the worldwide production of goods consumed 115 EJ of final energy causing a total amount of 9.9 Gt CO 2 -emissions, both direct and indirect emissions (Banerjee et al., 2012). In order to reach a long-term sustainable production system the amount of fossil energy needed for the production of goods has to be reduced significantly. This can be achieved with a combination of increased energy efficiency (process and supply) and the extensive implementation of renewable energies. Especially in branches using process heat temperatures between 30 and 150°C solar thermal energy can be used to reduce the input of fossil fuels remarkably. The IEA Task 33/IV – Potential for Solar Heat in Industrial Processes – identified the following key sectors with favorable conditions for the integration of solar heat: food and
Transcript of Reducing fuel consumption in industry: Assessment of … · Reducing fuel consumption in industry:...
Reducing fuel consumption in industry: Assessment of the economic efficiency of the integration of solar thermal energy into industrial processes
Marcus HUMMEL, Vienna University of Technology, Energy Economics Group Felix HUMMEL, University of Vienna, Center for Computational Materials Science
Lukas KRANZL, Vienna University of Technology, Energy Economics Group Christoph BRUNNER, AEE INTEC
Jürgen FLUCH, AEE INTEC
ABSTRACT
In order to reach a long term sustainable production system it is essential to increase energy efficiency and by this reduce the amount of energy needed for the production of goods significantly. Furthermore, solar thermal energy has a great potential to reduce the fossil fuel input for process heat supply especially in branches using process heat temperatures between 30 and 150 °C.
The aim of this research is to analyze the economic feasibility of the integration of solar thermal systems into industrial processes. We investigate various process characteristics, economic and climatic conditions as well as the impact of energy efficiency measures and carry out sensitivity analyses. A techno-economic modeling tool was developed that simulates industrial solar thermal systems on an hourly basis.
The results show that under current conditions solar thermal systems for the supply of process heat are long term investments: for the investigated process and system characteristics payback periods range from 8 up to 12 years and longer, taking into account the investment subsidies currently in place in Austria. The main reasons are the high investment costs and the low market prices for fossil energy carriers. We show that the supply temperature of the solar system, the temporal load profiles of the processes and the climatic conditions have an important influence on the economic feasibility. The economic impact of energy efficiency measures is characterized by two opposite effects: a reduction of process temperatures leads to higher efficiencies of the solar system and makes further energy demand segments accessible, this increases economic efficiency. In contrast, waste heat recovery reduces the energy demand supplied by the solar system, this leads to smaller installations with higher specific costs (including planning and distribution costs) and therefore reduced economic efficiency.
Introduction In 2005 the worldwide production of goods consumed 115 EJ of final energy causing a
total amount of 9.9 Gt CO2-emissions, both direct and indirect emissions (Banerjee et al., 2012). In order to reach a long-term sustainable production system the amount of fossil energy needed for the production of goods has to be reduced significantly. This can be achieved with a combination of increased energy efficiency (process and supply) and the extensive implementation of renewable energies. Especially in branches using process heat temperatures between 30 and 150°C solar thermal energy can be used to reduce the input of fossil fuels remarkably. The IEA Task 33/IV – Potential for Solar Heat in Industrial Processes – identified the following key sectors with favorable conditions for the integration of solar heat: food and
beverages, textile, transport equipment, metal and plastic treatment and the chemical industry (Vannoni et al., 2008). The study estimated the potential of solar thermal heat in the European industry based on five country analyses. It identifies a technical potential of about 260 PJ per year providing the industrial sector with 3 to 4% of its thermal energy demand. Further studies conducted later on for other countries came to similar results, (Lauterbach et al., 2012) e.g. calculated a technical potential of 3.4% of total industrial heat demand for Germany (58 PJ/a).
Many studies have been carried out focusing on the technical implementation of solar thermal heat in industry (e.g. (Atkins et al., 2010) or (Quijera et al., 2011)). However, only a handful of studies explicitly refer to the economics of those installations. (Kalogirou, 2003) presents an economic optimization of different collector types to be used in industry. Optimal collector areas and storage tank volumes are calculated for various demand temperatures. (Muneer et al., 2008) calculate the economic payback period for water heating in the Southern Turkish textile industry, being equal to 5.5 and 5.6 years for systems without storage tank providing heat at 40°C and 80°C respectively. (Schnitzer et al., 2007) calculate the economic performance of the integration of solar thermal energy into an Austrian dairy plant. They conclude that the cash flow of solar thermal industrial installations can be positive at current energy prices. (Kulkarni et al., 2007) and (Kulkarni et al., 2008) developed a methodology for the economic optimization of solar thermal industrial systems. The application is demonstrated through an example.
The core research question of this paper is: “What is the economic feasibility of industrial solar thermal systems under different conditions?” The aim is to identify the parameters that have the highest influence on the economic efficiency of solar thermal industrial systems, and to describe the effect of efficiency measures in industrial applications on the economic feasibility of such systems. In order to carry out this analysis the following steps are carried out: (1) The techno-economic modeling tool SOLiS is developed that simulates industrial solar thermal systems on an hourly basis. It is able to carry out sensitivity analyses automatically. (2) Data research is conducted on costs of solar thermal applications, representative process specifications, climate data and prices for energy carriers and (3) a reference scenario is defined and a sensitivity analysis is carried out in order to identify the parameters with the highest influence on the economic feasibility.
In this paper the integration of solar thermal systems into industrial processes is investigated. The system boundary chosen for the analysis is the delivery of solar thermal energy into the industrial process. Thus, the whole solar thermal system including the collectors, the storage tank, the back-up system and the heat distribution system to the process and back to the storage tank is included. The process itself is not included. Moreover, the demand for auxiliary energy for the pumps or the back-up system is not taken into account. A more detailed description of the investigated system is given in the methodology chapter below. Economic data were derived from Austrian technology providers.
Methodology Description of the technical simulation and the main technical input parameters Investigated Solar Thermal System
For industrial applications a wide range of different solar thermal system concepts exist. The reason is the great variety of process and plant characteristics as well as individual climatic conditions that have to be addressed in the choice of the appropriate solar system. The solar thermal system chosen for this survey has the following characteristics (see Figure 1): a storage

tank is integrated to balance supply and demand. The heat distribution from the solar collectors to the processes is organized in three separated sections (collector circuit, storage tank circuit and process supply system). The heat distribution medium used in the collector circuit is a mix between propylene-glycol and water, in the storage tank circuit and the process supply system water is used. The heat supply system used to backup the thermal energy that cannot be provided by the solar and storage system is placed in the process supply circuit between the supply of the storage tank circuit and the distribution to the processes. The process supply circuit is a closed loop, which means that thermal energy that is not used in the process can be returned to the storage.
Figure 1: Solar Thermal System Concept used for the study
The modeled system reflects a solar thermal installation that feeds into the heat supply
system of an industrial plant with one or more processes implemented at the demand side. In order to draw conclusions regarding the influence of the process load profile on the economic efficiency of the solar thermal installation for this analysis only one process is assumed at the demand side.
Calculations with the simulation software T*SOL have shown that the losses in the pipes between the collectors and the storage tank are in the range of 0.6 – 0.7%. In the SOLiS model developed for this analysis they are therefore neglected.
Solar Collectors
The efficiency of an area element (A) of the solar collector depends on the temperature difference between the fluid in the collector (T) and the environment (Tenv) and on the solar irradiation (I) according to the following formula:
Collec
tor fie
ld
Heat storage
Process supply system
P-21
E-23
Storage tank circuitCollector circuit
Boiler
E-24
E-25
Process
Solving the differential equation below gives the temperature profile and the solar yield for the entire solar collector, where m is the mass flow and cp is the heat capacity.
Capacity effects, the impact of changes in the incidence angle and shading that might
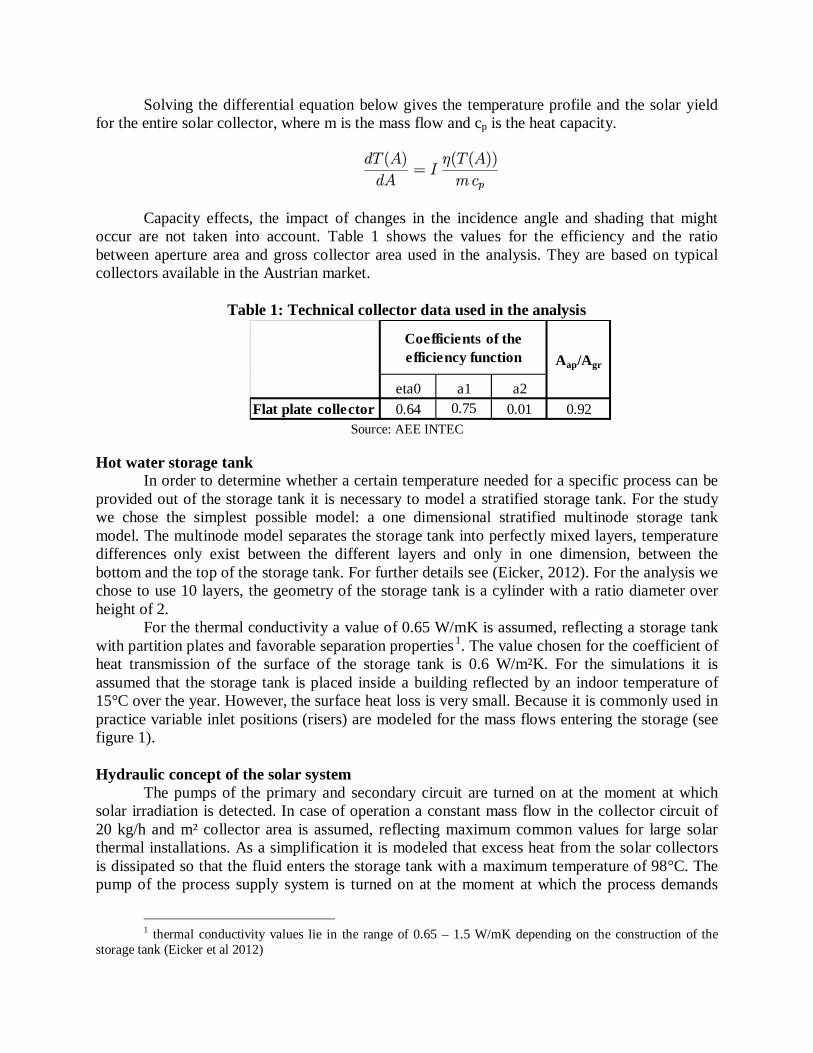
occur are not taken into account. Table 1 shows the values for the efficiency and the ratio between aperture area and gross collector area used in the analysis. They are based on typical collectors available in the Austrian market.
Table 1: Technical collector data used in the analysis
eta0 a1 a2Flat plate collector 0.64 0.75 0.01 0.92
Coefficients of the efficiency function Aap/Agr
Source: AEE INTEC
Hot water storage tank In order to determine whether a certain temperature needed for a specific process can be
provided out of the storage tank it is necessary to model a stratified storage tank. For the study we chose the simplest possible model: a one dimensional stratified multinode storage tank model. The multinode model separates the storage tank into perfectly mixed layers, temperature differences only exist between the different layers and only in one dimension, between the bottom and the top of the storage tank. For further details see (Eicker, 2012). For the analysis we chose to use 10 layers, the geometry of the storage tank is a cylinder with a ratio diameter over height of 2.
For the thermal conductivity a value of 0.65 W/mK is assumed, reflecting a storage tank with partition plates and favorable separation properties0 F
1. The value chosen for the coefficient of heat transmission of the surface of the storage tank is 0.6 W/m²K. For the simulations it is assumed that the storage tank is placed inside a building reflected by an indoor temperature of 15°C over the year. However, the surface heat loss is very small. Because it is commonly used in practice variable inlet positions (risers) are modeled for the mass flows entering the storage (see figure 1).
Hydraulic concept of the solar system
The pumps of the primary and secondary circuit are turned on at the moment at which solar irradiation is detected. In case of operation a constant mass flow in the collector circuit of 20 kg/h and m² collector area is assumed, reflecting maximum common values for large solar thermal installations. As a simplification it is modeled that excess heat from the solar collectors is dissipated so that the fluid enters the storage tank with a maximum temperature of 98°C. The pump of the process supply system is turned on at the moment at which the process demands
1 thermal conductivity values lie in the range of 0.65 – 1.5 W/mK depending on the construction of the storage tank (Eicker et al 2012)

energy. If not enough energy at the required temperature level can be provided out of the storage tank the backup system is turned on. Method for the assessment of the economic efficiency Parameter used for the description of the economic performance
In order to quantify the economic performance of investments in solar thermal systems the concept of the Levelized Costs according to e.g. (Branker et al., 2011) is used. The idea of the Levelized Costs of Heat Generation (LCOH) is to compare the costs of the heat supply (C) with the resulting heat supplied by the system (E). Since both the costs of the heat supply and the supplied heat itself are subject to the time preference of the investors, the costs as well as the energy amounts are discounted at the interest rate r with an economic assessment period of τ . The following equation is used to calculate the LCOH:
Investigated investment case With an investment in a solar thermal system a reduction of running energy costs can be
achieved. The economic efficiency of the investment is determined comparing the investment costs of the solar thermal system with the energy cost savings for the system in place over a certain time period. For the calculations within this study a gas boiler is assumed as standard existing system as this is the most frequently used system in industrialized countries at the moment. For the assessment the LCOH of the solar thermal system is compared to the LCOH of the reference gas boiler taking into account only the energy costs of the gas boiler, because the solar thermal system does not provide a guaranteed capacity and so, the back-up boiler has to be designed for the full load without solar thermal system. The average yearly efficiency of the gas boiler for the assessment is assumed to be 70%. In practice the average yearly efficiencies of the boilers installed in industry can vary widely between 85 and 50% or lower, depending on the structure of the plant and the age of the boiler.
Description of relevant input data Cost data of the solar thermal systems
The cost data used in the analysis are based on large scale solar system projects realized in Austria. Budget proposals of different solar system suppliers and final costs of various projects were compared and average system costs were generated in relation to the system size. They include the collectors, the pipes and pumps for the primary and secondary circuit, the control system including the sensors as well as the installation costs. For the storage tank a separate cost function is used in order to be able to analyze effects of different specific storage tank volumes on the economic performance of solar thermal systems. To determine the cost function the prices of two different vendors of storage tanks in Austria are analyzed. The costs include the tank, the insulation and the installation at the site. The operation and maintenance costs (O&M) for the solar thermal system are taken from (Kalogirou, 2009), the value used for the storage tank is an assumption. Table 2 presents the parameters used in the calculations, according to the following fit, where c are the specific costs and S is the collector area or the storage tank volume respectively:

Table 2: Cost data used in the analysis
*yearly costs in % of investment costs
a0 a1 a2 min max unitFlat plate collector 3,320 -0.30 53 100 5,000 m² 2%Storage tank 11 -0.27 0 2,000 400,000 l 1%
Coefficients of the cost function
Range of usability of the cost function O&M
costs*
Source: own calculations based on Austrian market data
In practice deviations from the cost data used in the analysis might occur according to the individual plant situation regarding roof properties, motivation and knowledge of the energy related personnel at the plant, solar planners’ prices, etc. Furthermore integration costs at the process side are not taken into account. These can add another 5 to 100%, depending on the individual plant situation.
Gas Price Developments
For a simplification of the interpretation of the results the following gas price developments are assumed: increase of 10% in 10 years for the low price scenario, and 20% increase in 10 years for the high price scenario. The gas price at the moment in Austria for medium size industrial consumers is 54.6 €/MWh (Kratena et al., 2013).
Process data
As it facilitates the interpretation of the results it is assumed that only one industrial process is to be fed by the solar thermal system. It is reflected by the required process temperature, by the load profile and by its annual energy demand. As a reference case for the analysis a cleaning process with the following characteristics is chosen: the temperature level required is 75°C, the plant and the process is working in two shifts (from 6 a.m. to 10 p.m.), the heating of the installation to working temperature in the morning requires a 50% higher load than during normal operation, weekends no production is taking place, no plant holidays during the year. Furthermore for the reference case it is assumed that no heat can be recovered from the process and therefore the return flow from the process corresponds to fresh water with a temperature level of 15°C.
To quantify the influence of the load profile on the technical and economic performance of the solar thermal system the following sensitivity cases are calculated: 1) three-shift production during the entire week and no plant holidays, 2) three-shift production during the entire week and plant holidays in week 33 (around August 15th), 3) two-shift production during the entire week and no plant holidays, and 4) two-shift production during the entire week and plant holidays in week 33. Figure 2 shows the characteristics of the chosen load profiles.
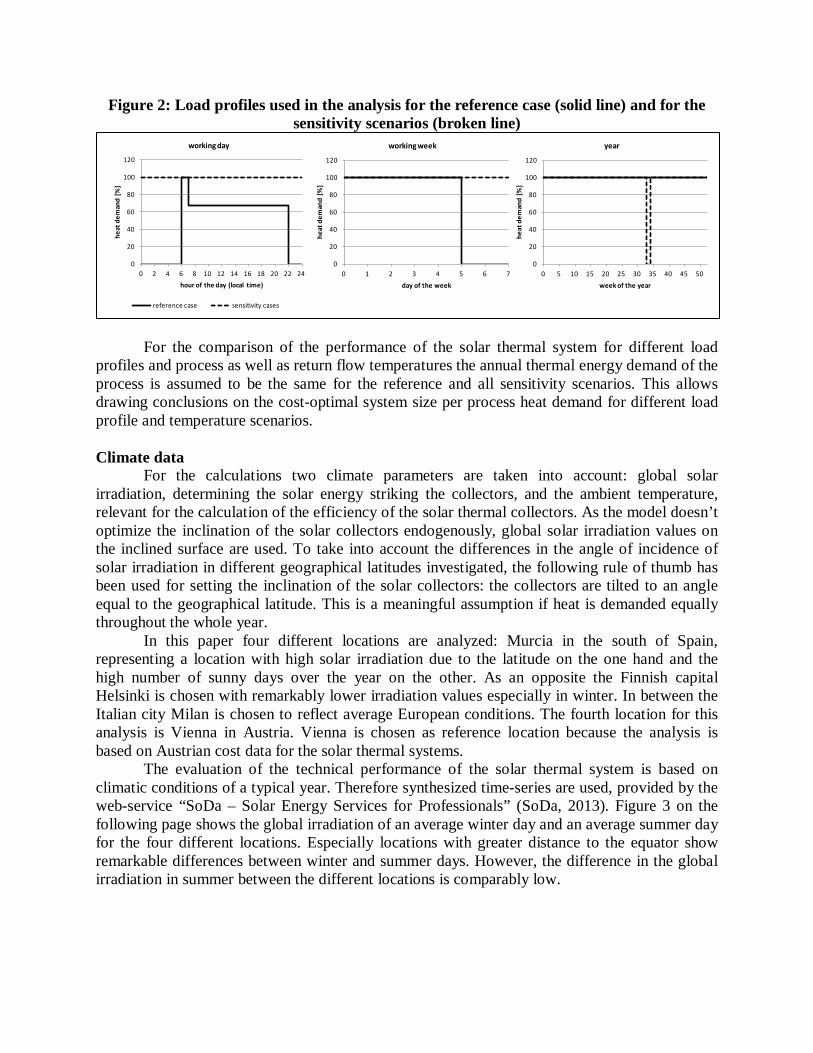
Figure 2: Load profiles used in the analysis for the reference case (solid line) and for the sensitivity scenarios (broken line)
For the comparison of the performance of the solar thermal system for different load
profiles and process as well as return flow temperatures the annual thermal energy demand of the process is assumed to be the same for the reference and all sensitivity scenarios. This allows drawing conclusions on the cost-optimal system size per process heat demand for different load profile and temperature scenarios.
Climate data
For the calculations two climate parameters are taken into account: global solar irradiation, determining the solar energy striking the collectors, and the ambient temperature, relevant for the calculation of the efficiency of the solar thermal collectors. As the model doesn’t optimize the inclination of the solar collectors endogenously, global solar irradiation values on the inclined surface are used. To take into account the differences in the angle of incidence of solar irradiation in different geographical latitudes investigated, the following rule of thumb has been used for setting the inclination of the solar collectors: the collectors are tilted to an angle equal to the geographical latitude. This is a meaningful assumption if heat is demanded equally throughout the whole year.
In this paper four different locations are analyzed: Murcia in the south of Spain, representing a location with high solar irradiation due to the latitude on the one hand and the high number of sunny days over the year on the other. As an opposite the Finnish capital Helsinki is chosen with remarkably lower irradiation values especially in winter. In between the Italian city Milan is chosen to reflect average European conditions. The fourth location for this analysis is Vienna in Austria. Vienna is chosen as reference location because the analysis is based on Austrian cost data for the solar thermal systems.
The evaluation of the technical performance of the solar thermal system is based on climatic conditions of a typical year. Therefore synthesized time-series are used, provided by the web-service “SoDa – Solar Energy Services for Professionals” (SoDa, 2013). Figure 3 on the following page shows the global irradiation of an average winter day and an average summer day for the four different locations. Especially locations with greater distance to the equator show remarkable differences between winter and summer days. However, the difference in the global irradiation in summer between the different locations is comparably low.
0
20
40
60
80
100
120
0 2 4 6 8 10 12 14 16 18 20 22 24
heat
dem
and
[%]
hour of the day (local time)
working day
reference case sensitivity cases
0
20
40
60
80
100
120
0 1 2 3 4 5 6 7
heat
dem
and
[%]
day of the week
working week
0
20
40
60
80
100
120
0 5 10 15 20 25 30 35 40 45 50
heat
dem
and
[%]
week of the year
year

Assessment Results Based on the input data and modeling framework described the sensitivity of the
economic efficiency to various influencing factors is analyzed. Therefore, we define a reference case and vary the most influencing factors to quantify the impact on the LCOH. Table 3 shows the values chosen for the reference case.
Table 3: Specification of the reference case for the assessment
value unitgross collector area 3,000 m²specific storage tank volume 70 l/m²T process 75 °C
T return flow 20 °CEconomic assessment period 10 ainterest rate 4 %Heat demand process 3,500 MWh/aLocation Vienna
To determine the economic efficiency of the investment in the solar thermal system the
LCOH of the solar thermal system is compared to the LCOH of the reference gas boiler taking into account only the energy costs of the boiler. Figure 3 (right side) shows the LCOH for the four locations analyzed plot against different economic assessment periods (parameter t in the definition of LCOH given above).
Figure 3: Left side: Global solar irradiation on inclined surface for a) the three different
locations analyzed and b) for a typical summer and a typical winter day1F
2, right side: Levelized Costs of Heat Generation for different locations
2 The number in brackets in the legend states the inclination angle of the solar collectors used for the respective location
0
100
200
300
400
500
600
700
800
900
1000
1 2 3 4 5 6 7 8 9 10 11 12 13 14 15 16 17 18 19 20 21 22 23 24
Glob
al h
ourly
irra
diat
ion
[Wh/
m²]
Hour of the day (Local Time)
Murcia (38°) Milan (45°) Vienna (48°) Helsinki (60°)
0
100
200
300
400
500
600
700
800
900
1000
1 2 3 4 5 6 7 8 9 10 11 12 13 14 15 16 17 18 19 20 21 22 23 24
Glob
al h
ourly
irra
diat
ion
[Wh/
m²]
Hour of the day (Local Time)
Murcia (38°) Milan (45°) Vienna (48°) Helsinki (60°)
0.00
0.02
0.04
0.06
0.08
0.10
0.12
0.14
0.16
5 10 15 20 25
Leve
lized
Cos
ts o
f Hea
t Gen
erat
ion
[€/k
Wh]
Economic assessment period [a]
gas boiler - low pricegas boiler - high pricesolar thermal - Viennasolar thermal - Murciasolar thermal - Helsinkisolar thermal - Milan
0.00
0.02
0.04
0.06
0.08
0.10
0.12
0.14
0.16
5 10 15 20 25
Leve
lized
Cos
ts o
f Hea
t Gen
erat
ion
[€/k
Wh]
Economic assessment period [a]
gas boiler - low pricegas boiler - high pricesolar thermal - Viennasolar thermal - Murciasolar thermal - Helsinkisolar thermal - Milan

The intersection between the LCOH for the solar thermal systems and the LCOH of the gas boiler for the two selected gas price developments shows the economic payback period of the investment. It can be seen that the annual global solar irradiation has remarkable influence on the economic efficiency of the investment: for the reference system and plant conditions economic payback periods between 12 and 13 years result for Austria. The same investment under Spanish climatic conditions would lead to a payback period of about 8 years. The values do not take into account financial policies or CO2-prices to promote the use of solar thermal energy. In Austria a subsidy system is currently in place where around 38% of the investment costs of the solar thermal installation can be refunded. Taking into account this subsidy leads to a significant reduction of the payback periods of approximately 30%.
The size of a solar thermal system is determined by the solar collector area on the one hand and the storage tank volume on the other hand. Figure 4 shows the effect of the size of the solar thermal system on the LCOH (left side) and on the technical performance (right side) for different specific storage tank volumes (per solar collector area). The technical performance of the solar thermal system is characterized by two values: the specific solar energy yield, which is the ratio between the total solar energy that can be integrated into the industrial process (Qsolar) and the gross collector area, and the solar fraction, which is the ratio between Qsolar and the total energy demand of the process. The results are shown against the specific thermal energy demand of the process, which is defined as the heat demand of the process per m² gross collector area installed. It can be seen that the installation of smaller solar thermal collector fields leads to higher system efficiencies resulting in higher yearly solar yields per m², while the solar fractions decrease (right side). The combination with the fact that the specific investment costs decrease with larger installations leads to cost optimal system sizes (left side).
Figure 4: Levelized Costs, Solar Fraction and Yearly Solar Yield for different specific
thermal energy demands and storage tank volumes
Different specific storage tank volumes are further analyzed in combination with the
influence of the process load profile (Figure 5 left side). We found specific storage tank volumes between 50 and 100 l/m² to be cost optimal depending on the load profile of the process. As expected, the effect of the increase of the specific storage tank volume is higher for plants
0
100
200
300
400
500
600
700
800
900
0
0.1
0.2
0.3
0.4
0.5
0.6
0.7
0.8
0.9
0 1000 2000 3000 4000 5000
Year
ly So
lar Y
ield
[kW
h/m
²a]
Sola
r Fra
ctio
n [-]
specific thermal energy demand of the process [kWh/m²a]
0
100
200
300
400
500
600
700
800
900
0
0.1
0.2
0.3
0.4
0.5
0.6
0.7
0.8
0.9
0 1000 2000 3000 4000 5000
Year
ly So
lar Y
ield
[kW
h/m
²a]
Sola
r Fra
ctio
n [-]
specific thermal energy demand of the process [kWh/m²a]
0.07
0.08
0.08
0.09
0.09
0.10
0.10
0.11
0.11
0.12
0.12
0 1000 2000 3000 4000 5000Leve
lized
Cos
ts o
f Hea
t Gen
erat
ion
[€/k
Wh]
specific thermal energy demand of the process [kWh/m²a]
30 l/m² specifc storage tank volume
50 l/m² specifc storage tank volume (reference case)
70 l/m² specifc storage tank volume
90 l/m² specifc storage tank volume

without production on weekends. Furthermore there is a remarkable effect of one week holidays in summer, while the difference between two or three production shifts is far smaller.
The effect of the temperatures of the process to be supplied and of the return flow from the process into the storage tank is shown in figure 5 (right side). The yearly solar yield and the LCOH are shown against the temperature of the return flow for different process temperatures. Solar thermal systems are limited in their supply temperature. The higher the temperature demand of the process, the lower is the fraction of the energy demand that can be covered by a solar thermal system. Thus, smaller solar thermal systems are cost-optimal for higher process temperatures assuming a constant thermal energy demand. Therefore we chose approximately cost-optimal solar system sizes for the comparison of various process temperatures (see legend in figure 5, right side). We vary the process temperatures between 50 and 200°C. The storage tank temperature in the simulation is limited to 100°C, therefore the solar system can be used for preheating only if process temperatures higher than 100°C are required. The results show that both the temperature of the return flow from the process as well as the process temperature itself has essential influence on the economic efficiency of the solar thermal installation.
Figure 5: Levelized Costs and Yearly Solar Yield for different process load profiles (left
side) and for different process and return flow temperatures (right side)
Discussion and Conclusions
The aim of this paper is to analyze the economic feasibility of industrial solar thermal systems, to identify the parameters that have the highest influence on the economic efficiency and to describe the effect of efficiency measures in industrial applications on the economic feasibility of such systems. As a reference case we defined an industrial cleaning process requiring 75°C in 2-shift operation inactive during the weekend, which is supplied by a conventional gas boiler. With an interest rate of 4% we calculated economic payback periods of the investment in an approximately cost-optimal solar thermal flat plate collector system of 3000 m² collector field area and 70 l/m² specific storage tank volume. The periods vary between 8 and 12 years depending on the geographical location, not taking into account financial support policies. In Austria a subsidy system is currently in place where around 38% of the investment costs of the solar thermal installation can be refunded. Taking into account this subsidy leads to a significant reduction of the payback periods of approximately 30%. Note that the dimensions of
-
100
200
300
400
500
600
700
800
0.07
0.08
0.09
0.10
0.11
0.12
0 50 100 150 200 250
Yiea
rly So
lar Y
ield
[kW
h/m
²a]
Leve
lized
Cos
ts o
f Hea
t Gen
erat
ion
[€/k
Wh]
specific storage tank volume [l/m²]
2-shift-opeartion + weekends off3-shift-operation3-shift-operation + holidays2-shift-operation2-shift-operation + weekends off + holidays
0
100
200
300
400
500
600
700
800
0.07
0.09
0.11
0.13
0.15
0.17
0.19
0.21
10 20 30 40 50 60
Year
ly So
lar Y
ield
[kW
h/m
²a]
Leve
lized
Cos
ts o
f Hea
t Gen
erat
ion
[€/k
Wh]
Temperature return flow [°C]
T process = 50°C, A = 3250 m²T process = 100°C, A = 3000 m²T process = 150°C, A = 1750 m²T process = 200°C, A = 1250 m²

the cost-optimal solar system vary with the geographical location. In northern locations larger collector field areas with smaller storage tanks are optimal, while in southern locations the opposite is the case. Also note that the inclination of the solar collectors has not been optimized for the analyzed locations, the rule of thumb described above has been used. Country-specific costs of solar systems and gas prices have not been taken into account as well.
We found specific storage tank volumes between 50 and 100 l/m² to be cost optimal depending on the load profile of the process. As expected, the effect of plant operation brakes at weekends and of one week holidays in summer on the economic performance of the solar thermal system is remarkable, especially for lower specific storage tank volumes. However, the dominant influencing factors are the supply temperature to the process and the temperature of the return flow from the process. For higher process temperatures a lower fraction of the energy demand can be covered by the solar thermal system due to the limited solar thermal supply temperatures. We calculated an increase of about 40% in the LCOH for a process temperature difference between 50 and 200°C, assuming a constant energy demand of the process. Certain efficiency measures therefore lead to a remarkable increase of the economic efficiency of solar thermal installations. The insulation of pipes or reaction vessels, the integration of larger heat exchangers and the implementation of new process technologies with lower supply temperatures support the investments in solar thermal systems. A crucial measure to increase energy efficiency in industry is the recovery of waste heat. It is furthermore a very cost effective solution to decrease the thermal energy demand. Therefore it is meaningful to primarily use existing waste heat streams, the remaining demand can then be supplied partly with solar thermal systems to further decrease the fossil fuel input. Waste heat recovery from the process essentially reduces the energy demand that can be supplied by the solar system and therefore leads to smaller cost-optimal system sizes with higher specific costs.. The operation of the solar thermal systems at higher temperature ranges furthermore decreases the technological efficiency especially for flat plate systems and therefore their economic feasibility. Although waste heat recovery increases the LCOH of the solar thermal system, it reduces the running costs of the back-up system and therefore increases the economic efficiency of the entire heat supply system.
The analysis showed that investments in solar thermal industrial systems lead to payback periods much lower than the lifetime of such systems. Taking into account the financial support policies in many countries and considering the interaction with efficiency measures in industrial applications can lead to an economically feasible opportunity to reduce the running energy costs and the CO2 emissions for many companies in industry.
References Atkins, M.J., Walmsley, M.R.W., Morrison, A.S., 2010. Integration of solar thermal for
improved energy efficiency in low-temperature-pinch industrial processes. Energy 35, 1867–1873.
Banerjee, R., Cong, Y., Gielen, D., Jannuzzi, G., Maréchal, F., McKane, A.T., Rosen, M.A., van Es, D., Worrell, E., 2012. Chapter 8 - Energy End Use: Industry, in: Global Energy Assessment - Toward a Sustainable Future. Cambridge University Press, Cambridge, UK and New York, NY, USA and the International Institute for Applied Systems Analysis, Laxenburg, Austria, pp. 513–574.

Branker, K., Pathak, M.J.M., Pearce, J.M., 2011. A review of solar photovoltaic levelized cost of electricity. Renewable and Sustainable Energy Reviews 15, 4470–4482.
Eicker, U., 2012. Solare Technologien für Gebäude: Grundlagen und Praxisbeispiele. Vieweg + Teubner, Wiesbaden.
Kalogirou, S., 2003. The potential of solar industrial process heat applications. Applied Energy 76, 337–361.
Kalogirou, S., 2009. Solar energy engineering: processes and systems. Elsevier/Academic Press, Burlington, MA.
Kratena, K., Meyer, I., Sommer, M.W., 2013. Energy Scenarios 2030 - Model Projections of Energy Demand as a Basis to Quantify Austria’s Greenhouse Gas Emissions.
Kulkarni, G.N., Kedare, S.B., Bandyopadhyay, S., 2007. Determination of design space and optimization of solar water heating systems. Solar Energy 81, 958–968.
Kulkarni, G.N., Kedare, S.B., Bandyopadhyay, S., 2008. Design of solar thermal systems utilizing pressurized hot water storage for industrial applications. Solar Energy 82, 686–699.
Lauterbach, C., Schmitt, B., Jordan, U., Vajen, K., 2012. The potential of solar heat for industrial processes in Germany. Renewable and Sustainable Energy Reviews 16, 5121–5130.
Muneer, T., Asif, M., Cizmecioglu, Z., Ozturk, H.K., 2008. Prospects for solar water heating within Turkish textile industry. Renewable and Sustainable Energy Reviews 12, 807–823.
Quijera, J.A., Alriols, M.G., Labidi, J., 2011. Integration of a solar thermal system in a dairy process. Renewable Energy 36, 1843–1853.
Schnitzer, H., Brunner, C., Gwehenberger, G., 2007. Minimizing greenhouse gas emissions through the application of solar thermal energy in industrial processes. Journal of Cleaner Production 15, 1271–1286.
SoDa, 2013. SoDa - Solar Energy Services for Professionals. URL http://www.soda-is.com/eng/services/service_invoke/gui.php?xml_descript=chain_5a.xml#parameters (accessed 3.29.13).
Vannoni, C., Battisti, R., Drigo, S., 2008. Potential for Solar Heat in Industrial Processes, IEA Task 33/IV. CIEMAT, Madrid.