Test Procedure for Determining Evaporative Emissions from ...

Page 1 of 45
Reducing Evaporative Emissions -
the Largest Source of VOC Emissions Leading to Haze,
PM2.5 and Ozone Formation in China's Major Cities:
A Macro and Micro Analysis with Information on
International Experience and Related Implications for
China

Page 2 of 45
EXECUTIVE SUMMARY
VOC emissions are causing 20-30% of the PM2.5 and 47% of the haze problems in China. Additionally, a large
fraction of these VOCs is evaporated gasoline from automobiles. The European-based evaporative emissions
standards, combined with Stage II vapor recovery, are providing China with only 46% control efficiency of
combined diurnal, running loss, refueling, permeation, and hot-soak evaporative emissions. This low efficiency
is resulting in 1.1 million metric tons per year of evaporative emissions across China, concentrated in major
cities with large vehicle populations, and is directly responsible for 7-12% of PM2.5 and 15-20% of haze.
Very effective evaporative control technologies that cost less than 200 RMB per vehicle, such as ORVR
(onboard refueling vapor recovery) and multi-day diurnal controls, have been required in the United States
since the 1990s and increase the evaporative emissions control efficiency to 95-98%. Similar evaporative
emissions regulations should be quickly applied to Chinese vehicles as an amendment to existing light-duty-
vehicle emissions standards, or as portion of the next version of such standards, or as a separate regulatory
measure. If no such action is undertaken soon to reduce evaporative emissions in China within the next ten
years, the evaporative inventory will grow to 3 million metric tons per year and increasingly contribute toward
PM2.5, ozone, and haze formation.
If ORVR plus multi-day "diurnal" (i.e., fuel-tank vented fuel-vapor emission) requirements were added by 2018,
these emissions would be limited to 1 million metric tons per year. ORVR would augment and improve China’s
previous investment in Stage II gasoline refueling vapor recovery controls, without waste or regulatory
confusion, by providing the maximum control of all types of evaporative emissions from both the existing and
new vehicle fleet. This combined approach was demonstrated in the US and led, alongside other efforts, to
better air quality in US cities than in Europe. Although ORVR and multi-day diurnal requirements result in
added cost to the automakers, the energy conservation aspect provides about 500 RMB of recovered fuel
value to the vehicle owner and more than off-sets the cost of the controls. The additional vehicle content will
also benefit a large number of Chinese and China-based fuel system component manufacturers that supply
everything from vent hoses to fuel tank vent valves to charcoal canisters. As China prepares to invest billions
of RMB to apply expensive stationary-source emissions-reduction technologies, it would be disappointing to
continue and allow evaporative emissions to grow and negate any stationary source improvements, while
evaporative emissions could otherwise be controlled and quickly implemented at zero net cost.

Page 3 of 45
INTRODUCTION
In order to reduce particulate matter (PM) and haze problems, Chinese regulators have reduced vehicle
exhaust emissions through regulatory action and improvement in fuel quality. However, there is another type
of pollution that also comes from light-duty and other vehicles. This type of pollution is called evaporative
emissions. Evaporative emissions are caused by the evaporation and venting of gasoline from a vehicle and
result in substantial amounts of VOC pollution that form PM2.5, haze, and ozone. These emissions are
released when the vehicle is parked, driven, and refueled. The equivalent of approximately twelve liters of
gasoline is evaporated from each vehicle per year in China, and so the losses also represent wasted energy and
lost economic value to the vehicle owner. Evaporative emissions are particularly problematic in urban areas
that have large and growing vehicle populations and heavy traffic congestion. These emissions can be
exacerbated in those cities that have traffic jams or traffic control requirements that force vehicle owners to
park their vehicles certain days of the week. While industrial VOC sources – such as petrochemical, painting
operations, and solvent-based manufacturing – can be the largest emissions-source inventories in local areas
where those industries exist, this is usually not the case in the major and mega cities across China. In these
cities, concentrated vehicle populations are the dominant source of VOC emissions. So, local VOC sources
must be controlled to improve air quality.
To improve air quality in Chinese cities, a multi-pollution control effort must be made that includes VOC
reductions. This approach would be consistent with Premier Li Keqiang's goals of upgrading China's
development model to enable people to enjoy clean air, stated at the first session of the 12th National People's
Congress. Fudan University Professor Zhuang Guoshun and others have shown 90-100% of VOC emissions are
photochemically converted to secondary organic aerosols (SOAs), which make up 20-30% of total PM2.5.
More importantly, these VOC-produced SOAs make up to 47% of visible haze components, and the remaining
53% is made up of sulfates (20-30%), nitrates (10-20%), black carbon (7%), and other constituents. In urban
areas, emissions inventories suggest that gasoline light-duty vehicles (LDV) make up over 38%-50% of VOCs,
while the remaining 50-62% of VOCs is derived from a large number of point sources.
As this report will show, evaporative emissions are by far the largest contributor of VOCs from automobiles
and the largest single source in cities. Because VOCs do not transport regionally, this means that evaporative
emissions are likely the largest source of VOC emissions that lead to haze, PM2.5, and ozone formation in
China’s major cities. Luckily, these emissions may be cost-effectively and summarily reduced by modernizing
Chinese vehicles to include evaporative controls that have been required on US vehicles for over sixteen years.
1. The US, including the federal and California governments, are more advanced with respect to vehicle
emissions control laws than the EU and other jurisdictions, such as Japan.
It is a common misperception that Europe has the most stringent and effective motor vehicle emissions
standards in the world. Since 2007, however, the US has had stricter standards than Europe for exhaust NOx
and hydrocarbon standards, and the upcoming US Tier 3 standards will further widen the gap between the US
and Europe. Also, the evaporative emissions standards of Europe lag the US standards by twenty years. Since
1996, the US has forced technology onto its gasoline vehicle fleet, through regulatory measures, to control
extended parking emissions, running loss, refueling control on all vehicles, permeation, and leaks; plus the US
has improved in-use performance by forcing automakers to calibrate the vehicle to purge the evaporative
control canister during slow or short driving events and added in-use compliance and monitoring standards.
Yet, the European standards remain fixed at a 24-hour diurnal, high emissions standard, with no in-use

Page 4 of 45
requirements. The result of the more stringent vehicle emissions standards, among other measures, is that
the US has cleaner air than Europe. Ambient PM2.5 and PM10 concentrations are twice as high in Europe’s
cities as they are in the US. At the same time, ozone levels remain almost the same between these two
regions of the globe. The range of temperature conditions and LDV fleet makeup, and thus the potential for
vehicle exhaust and evaporative emissions, are very similar between the US and China. In light of these facts,
Chinese regulators should reconsider whether the European or US vehicle emissions standards would serve as
a better model to lessen vehicle emissions and improve Chinese air quality.
2. Evaporative emissions contribute more than 80% of total NOx and HC vehicle emissions into the
environment in circumstances involving typical driving styles in normal temperature conditions.
When all evaporative emissions classes are accurately accounted for – including hot soak, running loss,
permeation, refueling, and diurnal – each vehicle in China is producing about 8,200 grams of evaporative VOC
emissions each year. This is six times higher than the mass of hydrocarbons that exit vehicle tailpipes each
year, almost eleven times higher than NOx emissions, and represents an equivalent loss of 11.7 liters per year
of evaporated gasoline. The European inventory model produced by Emisia, called COPERT 4, estimates
evaporative emissions of only 80 grams per vehicle per year, which is 80% lower than the US EPA’s
MOVES2010 estimate for the cleanest vehicles required today in the US, and is a severely flawed estimate.
The majority of evaporative emissions constitute running loss, but substantial levels of diurnal and refueling
emissions remain, even with the addition of Stage II vapor recovery. The evaporative control efficiency is now
only 46% in China, but could be increased to 90-95% by adding enhanced evaporative requirements and ORVR.
VOCs lead to SOA formation, which accounts for 47% of haze and 20-30% of PM2.5. Controlling evaporative
emissions – particularly in cities with concentrated, high vehicle populations – will have the largest impact on
improving air quality.
3. ORVR is the most efficient and effective evaporative emissions control tool, particularly for countries with
warm seasonal temperatures and predominantly gasoline powered, light-duty vehicle fleets, such as China.
ORVR is the most efficient and effective evaporative emissions control tool, particularly for countries with
warm seasonal temperatures and predominantly gasoline-powered, light-duty vehicle fleets, such as China.
The larger canister capacity and higher purge rates that come with ORVR will provide the greatest incremental
reduction possible. Ideally, ORVR would be combined with a low 48-hour diurnal standard and shortened
drive cycle. Advanced evaporative controls must be regulated on Chinese vehicles to keep VOC emissions and
the resulting PM2.5 and haze components from continuing to climb. ORVR can moderate these emissions over
the very short-term and reduce the emissions over the long-term as the Chinese vehicle population continues
growing. Looking at the enhanced evaporative emissions regulatory options discussed in this paper and
associated Chinese evaporative emissions inventory projections for 2014-2035, one can see why an earlier
adoption of ORVR would be even more helpful in creating blue skies for China. Evaporative emissions are a
large part of the VOC inventory in China, particularly in cities, where evaporative emissions can account for 30-
40% of total VOCs. Since VOC-produced SOAs account for 47% of haze and 20-30% of PM2.5, ORVR and other
advanced evaporative controls could single-handedly cut haze by 15-20% and PM2.5 by 7-12%.
4. A cost-benefit analysis, with estimates for China based on the US experience with ORVR, shows that
advanced evaporative controls, including ORVR, are economically advantageous to the vehicle owner.
ORVR is a very attractive investment, as the value of gasoline it recovers greatly exceeds the cost of the control
technology. There will always be up-front investments required to cut emissions and automakers may

Page 5 of 45
complain about their costs, but mandating ORVR installation on vehicles will actually be a sound investment
for automotive industry customers. To only a slightly lesser degree, the same would be true for the other
advanced vehicle-based evaporative controls. Stage II gasoline refueling vapor recovery programs, however,
will only slightly reduce the growth rate of VOC emissions, and Stage II programs are very expensive to operate
and maintain. In the end, all costs and profits of evaporative control technologies are passed along to the
vehicle owners, by the automakers and the oil companies, so economics should be considered important.
5. ORVR and Stage II evaporative emissions controls can operate together without regulated community
confusion to maximize refueling control until widespread use of ORVR is achieved.
ORVR and Stage II vapor recovery can operate together, but the overall effectiveness of ORVR can be affected
by Stage II to a small degree unless precautions are taken to limit the amount of pure air returned to the
underground storage tank (UST) or to treat the vent-stack emissions using Stage III post-processors, such as
those now used in Beijing. Nonetheless, any adverse effect of Stage II on ORVR is minor, and no retrofits to
Stage II are really necessary when implementing ORVR.
6. ORVR and other advanced evaporative controls can be placed on all vehicles in the fleet, including micro
cars and micro vans used in China.
ORVR and other advanced evaporative controls can be cost-effectively engineered onto any light-duty vehicle,
including micro cars and micro vans. It must be noted that every vehicle, including micro cars, are presently
required in China and elsewhere to have evaporative controls to meet the Type IV diurnal requirements.
Installing advanced evaporative controls only mean making the presently installed/implemented evaporative
controls more effective. The constraints that affect the design of the systems include: (1) designing an
additional 1-1.5 liters of space for the canister onto the vehicle; and (2) designing a filler-pipe that will prevent
vapors from escaping. If the automakers are given adequate time to make design changes and procure parts,
these constraints will pose no problems. The ChangAn micro-van has already been commercialized with ORVR
to address issues with the use of high volatility methanol-containing fuels in the region in which this vehicle is
sold.
7. Without early action to implement enhanced evaporative emissions controls such as ORVR, Stage II
refueling emissions controls currently are the only, and costly and limited, option to address existing/pre-
ORVR vehicle fleets; Stage II is not a substitute for enhanced evaporative emissions controls such as ORVR;
Stage II alone without ORVR will not adequately minimize the enormous air pollution burdens associated
with projected 3 million metric tons per year of evaporative emissions over the next ten years.
As expensive and moderate in reducing evaporative emissions as Stage II gasoline refueling vapor controls are,
Stage II is the currently only option for reducing refueling emissions from the existing/pre-ORVR fleet of
vehicles that use inefficient, non-advanced evaporative controls. As such, it is important to understand that
Stage II has never reduced a significant proportion of evaporative emissions on its own, but essentially served
as minimum starting point for evaporative emissions control. Further to this point, Stage II is not a substitute
for advanced evaporative controls, including ORVR. The reason is that refueling emissions account for only
about 20% of the total evaporative emissions that are coming from gasoline vehicles in China. Running loss
and diurnal emissions also dominate the mix of evaporative emissions, and the only way to reduce these is by
adding ORVR and a combination of other advanced diurnal and running loss controls. At the same time,
Chinese regulators should not feel that it is wasteful to combine Stage II, either. It is critical that VOC
emissions be reduced, and the best way to minimize these emissions is to combine ORVR with Stage II.

Page 6 of 45
8. ORVR technology design, manufacturing, and related services do not involve a small number of
companies. Indeed, implementation of ORVR and related applications would benefit quite broad range of
companies including Chinese domestic companies.
ORVR is a refueling standard that requires the gasoline vapors are contained on the vehicle to the extent that
less than 0.05 grams of vapors emit for each liter of fuel dispensed during an entire refueling event. ORVR
does not specify how meeting this standard is accomplished, but the common approach used by all
automakers in the US market, because of low cost and ease of implementation, is to add capacity to the
existing diurnal canister and reroute the tank venting system. Assuming the same approach would be taken in
China, a broad range of Chinese domestic and multinational suppliers would benefit from the added vehicle
content.
Companies that manufacture tank venting and anti-spit-back valves would increase their content on the
vehicle. Vapor hose suppliers would be able to supply a larger diameter hose. The large number of canister
manufacturers would supply a larger canister, which would require more plastic (polypropylene, nylon, and
polyethylene), springs, filter materials, and activated carbon. These Tier II and Tier III sub-suppliers would
benefit as well. Moreover, the number of purge valve manufacturers would likely supply a higher-flow version
of their valves. Fuel tank, filler-pipe, and fuel-cap manufacturers would continue to supply their products, but
with small modifications. So, the additional 36-210 RMB of vehicle content would be spread out over a large
number of suppliers. Fuel economy improvements of 0.5-1% would directly benefit the vehicle owner and
greatly offset their initial investment in the control at the time of vehicle purchase. The reduction in VOC
emissions would result in reduced urban haze (i.e. more blue sky days), reduced PM2.5, and reduced ozone –
all of which have economic and social value. The beneficiaries of ORVR would be widespread.
According to the Office of Transportation and Air Quality and Office of Air and Radiation at the US EPA, an
average driver can expect to save as much as 150-180 RMB per year in gasoline per year with ORVR at a cost of
36 RMB to the manufacturer.1 Automotive manufacturers report in China that their costs could be as high as
210 RMB. Ultimately, the vehicle purchaser bears the added cost of the control, and they clearly benefit
economically with the investment in the control. There is a larger economic and social benefit that comes with
the improvement to air quality, as well.
9. VOC emissions from LDVs contribute a significant portion of total VOC emissions and therefore should be
prioritized for control together with stationary VOC emission sources such as petrochemical facilities.
Urban air quality – including haze, PM2.5, and ozone – is a major concern in China, and VOCs are major
contributors to this problem. Almost 90% of VOC emissions are converted into SOA, and these SOAs account
for about 47% of haze and 20-30% of total PM2.5. VOCs also react with NOx to generate ozone. Light-duty
vehicles (LDV) are concentrated in urban centers, and this LDV fleet is a large and growing single contributor of
VOCs. The Beijing EPB and Tsinghua University estimate that the LDV fleet now accounts for over 38%-60% of
VOC emissions in Beijing, but lower figures do not fully account for evaporative emissions. The Shanghai EPB
estimates that vehicle exhaust accounts for 12% of VOCs, which suggests that including evaporative emissions
would increase to about 40% of the inventory because evaporative emissions are five to ten times higher than
exhaust emissions. The LDV VOC inventory is growing with the vehicle population, and adding advanced
1 See http://www.haldemanfordkutztown.com/Onboard-Refueling-Vapor-Recovery/.

Page 7 of 45
evaporative emissions controls, such as ORVR, is the only way to decrease evaporative VOC emissions yet
allow the vehicle population to continue growing.
Point source (such as petrochemical facilities) reductions can also reduce the total VOC inventory for China,
but these facilities are generally located outside of city centers, and emissions from these facilities are
increasing at a slower rate than for evaporative emissions. The vehicle population is growing at a rate of 15%
per year, and evaporative emissions are growing at that rate as well. The research and testing results
supporting evaporative controls are thorough and complete. The economics associated with evaporative
controls demonstrate that the value of gasoline recovered is three times the cost of the controls, Additionally,
the evaporative controls for vehicles could be implemented quickly. Since vehicles are in the fleet for 10-15
years with no means to retrofit and reduce evaporative emissions, it would be disappointing if China invested
billions of dollars in point source controls but the haze problem continued to stay the same or grow worse in
the cities. China needs to quickly address evaporative emissions from the growing LDV fleet.
DISCUSSION
1. The United States (US), including the federal and California governments, are more advanced with
respect to vehicle emissions control laws than the European Union (EU).
Both the European Union and the US Environmental Protection Agency (US EPA) re-evaluate and strengthen
their gasoline light-duty vehicle (LDV) exhaust standards on a regular basis and publish new standards and
regulations to improve air quality (AQ) as available technology and cost-effectiveness permit. Since 2007, US
NOx and non-methane hydrocarbon (NMHC) exhaust standards have been reduced to levels below their
European counterparts. As shown in Figure 1-A, the US EPA’s 2007 Tier 2 exhaust standards for NOx and
NMHC are about 20% lower than both Europe’s 2010 Euro 5 and 2015 Euro 6 gasoline exhaust standards. The
2017 US Tier 3 standards will further reduce exhaust nitrogen oxide (NOx) and NMHC emissions to levels 80%
lower than the latest European 6 standards.
The European and Chinese gasoline LDV evaporative standards trail even further behind those of the US
Federal and California regulations. Prior to 1995, US vehicles had similar evaporative control technology
packages as those used in Europe and China today. Figure 1-B shows that prior to 1996, the US evaporative
standards, from a technology package perspective, looked very similar to the Euro 3, 4, and 5 (equivalent to
the China III, IV, and V) requirements. European and Chinese vehicles have a 24-hour “Type IV” diurnal
requirement with a 2 g/day standard, 60-minute drive cycle to purge the canister, and a hot-soak test. These
vehicles also have a purge-valve continuity requirement. Since 1996, however, new iterations of evaporative
requirements have been placed on US vehicles that result in surpassed control of these emissions. These new
iterations are listed below.
(1) A 48-hour diurnal test and a 0.65 g/day certification and in-use standard with a 30-minute purge-
down drive cycle, mimicking heavy traffic conditions and short driving events, to ensure canister purge
remains active during all driving conditions including slow speeds.
(2) A 72-hour diurnal with a 0.5 g/day standard and a 0.03 g/km running-loss standard to ensure that
the canisters are high capacity and well-designed, that fuel tank temperatures are moderated, and
that the canister purge remains strong during all driving conditions. This test is in addition to the
above 48-hour test.

Page 8 of 45
(3) Onboard refueling vapor recovery (ORVR) with a 0.05 g/L standard to minimize refueling emissions
(98% in-use recovery efficiency obtained).
(4) Onboard diagnostics (OBD) to identify and alert the vehicle of fuel-system vapor leaks.
Figure 1-A. Comparison of European and US (federal) exhaust standards for gasoline LDVs. Note, carbon monoxide limits are ten-times
that shown in the figure.
As far back as the 1970s, the US EPA and the California, via the California Air Resources Board (CARB),
recognized that gasoline LDVs were major volatile organic compound (VOC) contributors leading to high ozone
concentrations and the formation of secondary organic aerosols (SOAs) that makeup PM2.5 and haze. Even
with the stringent US Tier 2 requirements, US EPA and CARB have evidence that a significant level of
evaporative and exhaust emissions remain and can economically be controlled to lower levels. The need to
further improve air quality in the US has led to the harmonized 2017 California LEV III and US Tier 3 emissions
standards, as US EPA announced on March 3, 2014. These new Tier 3 standards will effectively bring
evaporative VOC emissions to near-zero levels. In order to reduce ozone levels, the EPA and CARB had to Figure
Figure 1-B. Comparison of European and US (federal) evaporative LDV standards. Modern European and Chinese evaporative
standards are basically equivalent to pre-Tier 1 “Enhanced” Evaporative standards of the early 1990s.
reduce both NOx and VOC emissions, which is why these agencies imposed the most stringent exhaust and
evaporative requirements in the world. Likewise, PM10 and PM2.5 levels are minimized by limiting NOx, SOx,
primary particulate, and VOC emissions from vehicles. The result of these strict tailpipe and evaporative
emissions requirements – plus complimentary, strong stationary-source emissions requirements -- is that air
quality is better in the US than in Europe.
Standard China IV/V US ≤ 1995 US ≥ 1996-2004
ORVR
24-hr Diurnal
48-hr Diurnal
72-hr Diurnal
Evap Standard = 2 g/day
Evap Standard < 0.5-0.65 g/day
Hot Soak
Running Loss
OBD

Page 9 of 45
Figure 1-C. Comparison of annual mean PM2.5 levels across major cities of the US and Europe in 2008-2009. Data taken from the WHO
global air quality database. Average PM2.5 levels are twice as high in Europe as in the US. Left: raw day; right: statistical distribution.
Figure 1-D. Comparison of annual mean PM10 levels across major cities of the US and Europe in 2008-2009. Data taken from the WHO
global air quality database. Average PM10levels are almost twice as high in Europe as in the US. Left: raw day; right: statistical distr.
Figure 1-E. Comparison of the average daily ambient 8-hour maximum ozone concentrations for major cities across North America and
Europe. The Analysis shows that ozone levels are very similar between North America and Europe, but the average is about 5 ppb higher
in North America. Left: raw day; right: statistical distribution.

Page 10 of 45
The World Health Organization (WHO) maintains a database of urban outdoor PM2.5 and PM10 air pollution
monitoring from over 1100 cities across 91 countries.2 Air quality data were compiled for cities across the US
and Europe and are shown in Figures 1-C and 1-D. The analysis shows that the PM2.5 and PM10 levels are
twice as high in Europe as they are in the US. A similar analysis, shown in Figure 1-E, was assembled by
Environment Canada comparing average annual 8-hour daily maximum ozone concentrations in cities across
North America and Europe in 2011.3 This analysis shows that mean ozone levels are only about 5 ppb higher
across North America than in Europe, but the large majority of the distributions overlay each other. VOCs are
the primary cause of excessive ozone. Even though the number of gasoline LDVs in North America are double
those in Europe (269 million in North America versus 148 million in Europe), and temperatures and sunlight
intensity are much higher in North America versus Europe (Europe is at a higher latitude than the majority of
North America), the effectiveness of the VOC control programs across the US and Canada has resulted in
relatively low ozone and good air quality. Air quality has improved in the US tremendously since the early
1990s, but if the US had maintained vehicle standards equivalent to those in Europe, these air quality
improvements would not have occurred.
China has similar climatic and vehicle fleet characteristics as the US. China is also working to overcome an air
quality problem that the US has worked to solve over the last four decades. China can learn from that
experience and incorporate best practices to rapidly improve its air quality situation. In China, the LDV fleet is
comprised of about 100 million gasoline vehicles. Each vehicle is producing about 9 kg/year of evaporative
emissions, combined from diurnal, refueling, running loss, and permeation losses. So, the fleet is producing
about one million metric tons of evaporative emissions per year, representing the equivalent of 1.4 billion
liters of liquid gasoline evaporating into the atmosphere each year. Improved evaporative controls can only
be installed on new vehicles; retrofitting vehicles to reduce evaporative emissions is not realistic. The fleet
population is expected to grow to 400-500 million vehicles over the next ten to twenty years – about three
times the number of gasoline vehicles in the European fleet and almost double the US fleet size. If the Chinese
evaporative emissions standards are not significantly improved, evaporative emissions will reach about 4
million metric tons of VOCs per year. Grounds for this improvement lie in the fact is that the US Tier 2 and
ORVR standards reduced evaporative emissions on US vehicles to less than 0.5 kg/year from the same level of
about 10 kg/year during the early 1990s. The same technology package of evaporative controls could be cost-
effectively regulated onto Chinese vehicles and have the same beneficial impact to Chinese air quality and
energy savings.
Summary
It is a common misperception that Europe has the most stringent and effective motor vehicle emissions
standards in the world. Since 2007, however, the US has had stricter standards than Europe for exhaust NOx
and hydrocarbon standards, and the upcoming US Tier 3 standards will further widen the gap between the US
and Europe. Also, the evaporative emissions standards of Europe lag the US standards by twenty years. Since
1996, the US has forced technology onto its gasoline vehicle fleet, through regulatory measures, to control
extended parking emissions, running loss, refueling control on all vehicles, permeation, and leaks; plus the US
has improved in-use performance by forcing automakers to calibrate the vehicle to purge the evaporative
control canister during slow or short driving events and added in-use compliance and monitoring standards.
Yet, the European standards remain fixed at a 24-hour diurnal, high emissions standard, with no in-use
2 See http://www.who.int/phe/health_topics/outdoorair/databases/en/.
3 See http://ec.gc.ca/indicateurs-indicators/default.asp?lang=en&n=FDBB2779-1#r2.

Page 11 of 45
requirements. The result of the more stringent vehicle emissions standards, among other measures, is that
the US has cleaner air than Europe. Ambient PM2.5 and PM10 concentrations are twice as high in Europe’s
cities as they are in the US. At the same time, ozone levels remain almost the same between these two
regions of the globe. The range of temperature conditions and LDV fleet makeup, and thus the potential for
vehicle exhaust and evaporative emissions, are very similar between the US and China. In light of these facts,
Chinese regulators should reconsider whether the European or US vehicle emissions standards would serve as
a better model to lessen vehicle emissions and improve Chinese air quality.
2. Evaporative emissions are four times higher than the total exhaust NOx and NMHC
emissions in circumstances involving typical driving styles in normal temperature conditions.
To develop a total emissions inventory for the vehicle fleet in China, inventory developers must account for
total evaporative and exhaust emissions. Developing an inventory for exhaust emissions from the gasoline
vehicle fleet is fairly straightforward. The exhaust emissions factors for NOx, NMHC, and carbon monoxide can
be well-characterized over representative drive cycles and expressed in terms of grams of emissions per
kilometer traveled. The total inventory of exhaust emissions can be determined by multiplying the Chinese
vehicle population by their appropriate exhaust emissions factors in Table 2-1 and vehicle mileage traveled
(VMT). In this case, the emissions factors are assumed equal to the exhaust standards. In practice, the in-use
emissions factors may be higher or lower than the standards.
Table 2-1. Chinese Gasoline LDV Exhaust Standards
Years for National Standard
Exhaust NMHC Emissions Standard
(g/km)
Exhaust NOx Emissions Standard
(g/km)
Exhaust CO Emissions Standard
(g/km)
China III 2008 – 2011 0.2 0.15 2.3
China IV 2011 – 2018 0.1 0.08 1.0
China V 2018 – XXXX 0.1 0.06 1.0
There is currently no accurate estimate of the evaporative emissions factors or inventory in China, however,
and the same is true for Europe. The only evaporative emissions factor that has been published from Europe is
a 0.22 g/day estimate that was generated by Emisia using the COPERT 4 model. The evaporative COPERT 4
model and the resulting evaporative emissions estimate are flawed for a number of reasons:
There is no accounting for running loss emissions in the Emisia model;
There is no accounting for permeation losses in the Emisia model;
There is no accounting for refueling emissions in the Emisia model;
Emisia’s estimate for diurnal emissions is inaccurately low, because:
o The maximum calculated parking event is 12 hours, but over half of the total parking hours are
much greater than 12 hours;
o The Emisia model does not account for real-world driving conditions and the impact on
canister purge and capacity regeneration;

Page 12 of 45
o The Emisia model assumes canister capacities that are double typical in-use levels.
If the COPERT 4 0.22 g/day emissions factor is put on an annual basis, the European estimate is only 80 grams
of evaporative emissions per year. Accurately quantified estimates of in-use evaporative emissions factors
were developed in the US and are many times higher than the Emisia estimates. As shown in Figure 2-A, the
US EPA estimates that Tier 2 and LEV II vehicles are producing about 500 g/vehicle year of evaporative
emissions, which is about six times higher than the COPERT estimate. Given the laxness of the EU
requirements versus the US Tier 2 standards, Emisia’s 0.22 g/vehicle day estimate is severely flawed. The US
EPA’s and California’s estimates were derived using the sophisticated US MOVES2010 evaporative inventory
model that is based on empirical model-year data, rigorously acquired over many years. LEV II/Tier 2 vehicles
must meet the most stringent evaporative requirements in the world and are equipped with evaporative
control technology packages much more effective at cutting in-use emissions than those required in Europe
and China today. The reality is that modern European and Chinese vehicles are equipped with 1995 and earlier
evaporative control technology packages and should be expected to emit like early 1990s US vehicles.
Chinese and European vehicles are producing about 8000-9000 grams of evaporative emissions each year --
levels about one hundred times higher than the emissions factor published by Emisia.
The COPERT 4 model and its 0.22 g/day evaporative emissions factor do not fully account for all processes that
affect total evaporative emissions. Evaporative emissions are comprised of gasoline vapors that emit from
various sources on a vehicle during parking, driving, and refueling conditions. There are five major classes of
evaporative emissions:
(1) refueling displacement; (2) diurnal (also called cold soak or parking emissions), (3) running loss, (4) permeation, and (5) gasoline liquid and vapor fuel system leaks.
Figure 2-A. Full annual evaporative emissions estimate for US vehicles based on MOVES2010 and diurnal and refueling modeling. Annual emissions are reduced with increased regulatory control. Chinese vehicles have the same technology package as US<1995 (pre-enhanced) vehicles.

Page 13 of 45
The first four classes of evaporative emissions are described in Figure 2-B. Each of these individual classes of
emissions can be large, depending upon the level of regulated control, vehicle design, the local gasoline vapor
pressure (RVP), and local temperature conditions. The US EPA, in cooperation with the Coordinated Research
Council (CRC), conducted rigorous studies45 on hundreds of vehicles, spanning several decades of model years,
to quantify evaporative emissions and establish emissions factors for running loss, permeation, and hot soak
emissions6 to be used in the MOVES2010 US emissions inventory model.
Unlike the US EPA’s MOBILE series of models that quantified emissions in distinct modes based on the test
procedures used to measure them (running loss, hot soak, diurnal, and refueling), the MOVES2010 model
groups evaporative emissions based on the evaporative mechanism associated with permeation, tank vapor
venting, liquid leaks, and refueling emissions. In this way, the emission process can be modeled using the
different factors that affect it.
4 Fuel Permeation from Automotive Systems, Final Report, CRC Project No. E-65, Prepared for the California Air Resources
Board and Coordinated Research Council by Harold Haskew and Dennis McClement, September 2004. 5 A Report on Vehicle Evaporative Emission Mechanisms: A Pilot Study, CRC Project E-77, June 2008. NOTE, this report
references four other CRC reports on evaporative emissions: (1) 300 vehicle Auto-Oil Hot Soak Pilot Study, 1993, (2) 150 vehicle CRC E-9 Real-Time Diurnal Study, 1996, (3) 150 vehicle CRC E-35 Running Loss Study, 1997, and (4) 50 vehicle CRC E-41 Late Model In-Use Evap Emissions, 1998. 6 Calculations for the Motor Vehicle Emissions Simulator MOVES2010, Final Report, Assessment and Standards Division,
Office of Transportation and Air Quality, US Environmental Protection Agency, September 2012.
Figure 2-B. Four major classes of evaporative emissions.

Page 14 of 45
The emissions factors for hot soak, running loss, and baseline permeation (baseline of 72°F and adjusted to
local temperatures) are grouped within MOVES2010 by technology packages adopted by automakers to meet
regulatory emissions requirements. The emissions factors and technology packages are shown in Table 2-2
and align with the technology packages compared in Figure 1-B. Adjustment of these baseline values, per the
computations developed for MOVES2010, result in the annual emissions shown in Figure 2-A. Diurnal and
refueling emissions estimates from MOVES2010 cannot readily be applied to Chinese conditions, so these
emissions were modeled separately.
Tsinghua University, MeadWestvaco, and the University of Tennessee have collaborated to develop a diurnal
and refueling model that can be applied to the Chinese vehicle fleet to estimate the inventory of VOC
emissions from these two evaporative classes. The model uses vehicle parking activity, local fuel vapor
pressures, and local temperatures on a monthly basis to establish cumulative tank vapor-venting estimates,
based on the Wade-Reddy equations, for major cities across China. To estimate diurnal emissions, vehicle
driving activity and measured canister purge data for technology packages are used to establish the extent to
which canisters are regenerated prior to a parking event. A correlation between total vapor generation and
canister capacity is then used to estimate diurnal emissions based upon existing and possible future
technology packages. To estimate refueling emissions, a refueling recovery efficiency of 70% is used for Stage
II vapor recovery; this estimate is based upon a study, using California Air Resources Board (CARB)
measurements,78 on pre-EVR (enhanced vapor recovery) efficiency. This same efficiency is used by the US EPA
to estimate the effectiveness of the 47,500 gas stations equipped with Stage II gasoline refueling vapor
recovery controls across the US. A refueling recovery efficiency of 98% was applied to ORVR in the model,
based on the US EPA’s published in-use performance findings through the EPA’s extensive in-use verification
program (IUVP).
Table 2-2. US MOVES2010 Evaporative Emissions Factors for Hot-Soak, Running Loss, and Permeation
*The European Euro 3, 4, and 5 and China III, IV, and V standards have the equivalent technology package as US Pre-enhanced 1978-1995 vehicles.
7 “Vapor Recovery Test Report,” California EPA Air Resources Board Compliance Division, April 1999.
8 Glenn Passavant: Memorandum “Calculating Vacuum Assist Stage II VRS and ORVR Excess Emissions,” Public Docket
EPA-HQ-OAR-2010-1076, May 7, 2012.
Regulatory Grouping Technology Package
US Model Years of Vehicle Grouping
Non-I/M Hot Soak Emissions
Factor (g/hr)
Running Loss Emissions
Factor (g/hr driving)
Baseline (72°F) Permeation
Rate (g/hr)
US Pre-Enhanced 24-hr diurnal + HS and 2 g/d standard * Continuity requirement for purge valve *
1978 – 1995 0.627 11.6 0.0554
US Tier 1 48-hr diurnal + HS and 2.5 g/d standard 72-hr diurnal and 2.0 g/d standard 0.05 g/mile running loss test and standard OBD leak test and 0.04 inch leak standard ORVR and 0.2 g/gallon standard In-use compliance standard
1996 – 2003 0.124 0.72 0.0102
US Tier 2 48-hr diurnal + HS and 1.2 g/d standard 72-hr diurnal and 0.95 g/d standard 0.05 g/mile running loss test and standard OBD leak test and 0.04 inch leak standard ORVR and 0.2 g/gallon standard In-use compliance standard
2004+ 0.060 0.234 0.0102

Page 15 of 45
The magnitude of diurnal emissions are affected by the amount of gasoline vapor generated (vapor
generation) during a parking event and the capacity of the canister used to control those emissions. The vapor
generation rate is most significantly affected by local temperatures, the duration of the parking event, and the
vapor pressure of the fuels. These vapor generation rates are most often calculated using the well-established
set of Wade-Reddy equations. Vapor generation rates and diurnal emissions will increase as climatic
temperature increase, thereby, toward lower latitudes. Average daily diurnal vapor generation rates were
calculated for a number of major cities across the US, Europe, China, Japan, India, South Korea, and Thailand
using monthly local temperatures, local monthly gasoline vapor pressures, and typical driving and parking
activity data.9 The monthly calculations were then averaged over an entire year to generate an average daily
diurnal vapor generation rate. These average diurnal vapor generation rates were plotted against geographic
latitude in Figure 2-C.
In Figure 2-C, it is seen that conditions in the high latitudes of Europe result in very low vapor generation rates,
because of a relatively cool to moderate climate. Conditions in the warmer central latitudes across China,
however, cause vapor generation rates to equal or exceed those in the US, which has a similar climate as
China. It should be expected that diurnal emissions in China will exceed those in Europe, simply due to
ambient temperature differences. Because the US climate is similar to that across China, US diurnal emissions
factors should be more applicable to China than European emissions factors.
9 Driving activity data provided by Emisia from a set of GPS data from Florence, Italy.
Figure 2-C. Average daily diurnal vapor generation rates for cities across the northern hemisphere
as a function of geographical latitude.

Page 16 of 45
Refueling vapor generation rates can be expressed similarly -- on an average daily, per-vehicle basis -- as
diurnal emissions and generally increase with warmer temperatures and latitude. As shown in Figure 2-D,
refueling vapor generation rates are lowest in Europe, where temperatures are relatively low, and
approximately equal between the US and China.
Combined diurnal and refueling per-vehicle emissions factors for each city were estimated and summed using
the developed, empirical diurnal and refueling control models by applying the current local diurnal and
refueling regulated control requirements (shown in Table 2-3). The combined remaining diurnal and refueling
emissions for each major city were plotted versus geographic latitude in Figure 2-E. Three linear trends were
identified: First, those cities that had only 24-diurnal requirements and no refueling requirements have the
highest emissions, generating 6 to 11 g/vehicle∙day of emissions. Second, those cities the gas stations of which
are outfitted with Stage II vapor recovery and the vehicles of which must meet a 24-hour diurnal requirement
have intermediate levels of combined diurnal and refueling emissions. Combined emissions in Europe range
between 2 and 4 g/vehicle∙day but range between 4 and 8 g/vehicle∙day in China, because of higher
temperatures. Third, the cities across the US that have stringent diurnal and refueling requirements, including
ORVR, have the lowest combined emissions of only 1 g/vehicle∙day. The US EPA’s and California’s evaporative
requirements are resulting in very low combined diurnal and refueling emissions and contribute toward the
high air quality in the US relative to Europe and China.
The emissions factors for hot soak, running loss, and permeation were estimated for Chinese conditions by
adjusting the US EPA’s published emissions factors shown in Table 2-1 to characteristic local monthly
temperatures and fuel vapor pressures for the cities of Beijing, Chongqing, Guangzhou, Hangzhou, Harbin, and
Shanghai. The factors were adjusted to an annual figure using an average VMT of 12,414 km/yr.10 The
evaporative emissions modeling analysis was used to develop the diurnal and refueling factors. The total
10
Vehicle Mileage Traveled (VMT) provided from IHS Global Insight database.
Figure 2-D. Average annual refueling emissions factors for cities across the northern hemisphere as a
function of geographical latitude.
Page 17 of 45
Table 2-3. Evaporative Emissions Standards Applied to Diurnal and Refueling Modeling Analysis.
Region City Diurnal Control Refueling Control(s)
China Beijing 24-hr and 2 g/d standard Stage II
Chongqing 24-hr and 2 g/d standard None
Guangzhou 24-hr and 2 g/d standard Stage II
Harbin 24-hr and 2 g/d standard None
Shanghai 24-hr and 2 g/d standard Stage II
Europe Athens 24-hr and 2 g/d standard Stage II
Frankfurt 24-hr and 2 g/d standard Stage II
London 24-hr and 2 g/d standard Stage II
Paris 24-hr and 2 g/d standard Stage II
Stockholm 24-hr and 2 g/d standard Stage II
India Bangalore 24-hr and 2 g/d standard None
Delhi 24-hr and 2 g/d standard None
Mumbai 24-hr and 2 g/d standard None
Japan Kagoshima 24-hr and 2 g/d standard None
Sapporo 24-hr and 2 g/d standard None
Tokyo 24-hr and 2 g/d standard None
South Korea Busan 24-hr and 2 g/d standard None
Daegu 24-hr and 2 g/d standard None
Seoul 24-hr and 2 g/d standard Less than 50% Stage II
Thailand Bangkok 24-hr and 2 g/d standard None
US Chicago 48-hr and 0.65 g/d standard 72-hr and 0.50 g/d standard
ORVR Stage II
Houston 48-hr and 0.65 g/d standard 72-hr and 0.50 g/d standard
ORVR Stage II
Los Angeles 48-hr and 0.65 g/d standard (70%) 72-hr and 0.50 g/d standard (70%) 48-hr and 0.35 g/d standard (30%) 72-hr and 0.35 g/d standard (30%)
ORVR Stage II + Enhanced Vapor Recovery
New York 48-hr and 0.65 g/d standard 72-hr and 0.50 g/d standard
ORVR Stage II
Figure 2-E. Average annual per-vehicle evaporative emissions for vehicles in cities
across the northern hemisphere, grouped by region, with all current standards
implemented.

Page 18 of 45
evaporative emissions estimates – including hot soak, running loss, permeation, refueling, and diurnal
estimates -- are shown in Figure 2-F. On average, vehicles in China are estimated to be producing over 8,100
grams per vehicle per year of evaporative emissions but vary by city. Major differences in refueling emissions
between Chinese cities are due to temperature differences and the presence of Stage II gasoline refueling
vapor recovery controls in some cities. Hot soak accounts for 6% of the emissions, running loss is the highest
contributor with 54%, permeation accounts for 5%, refueling emissions account for 20%, and diurnal emissions
account for 15% of the total 8,181 g/vehicle∙year.
Even if Stage II gasoline refueling vapor recovery controls were fully implemented across all Chinese cities and
countryside, evaporative emissions would remain above 7,000 g/vehicle∙year. A more comprehensive
approach, involving further regulation of refueling emissions, diurnal emissions, running loss, and permeation,
should be considered to bring these emissions to levels below the 500 g/vehicle∙year currently being achieved
in the US.
Total average per-vehicle evaporative, NOx, and exhaust hydrocarbon emissions were also estimated, based
on assuming that in-use emissions are equivalent to the certification standard. In practice, exhaust emissions
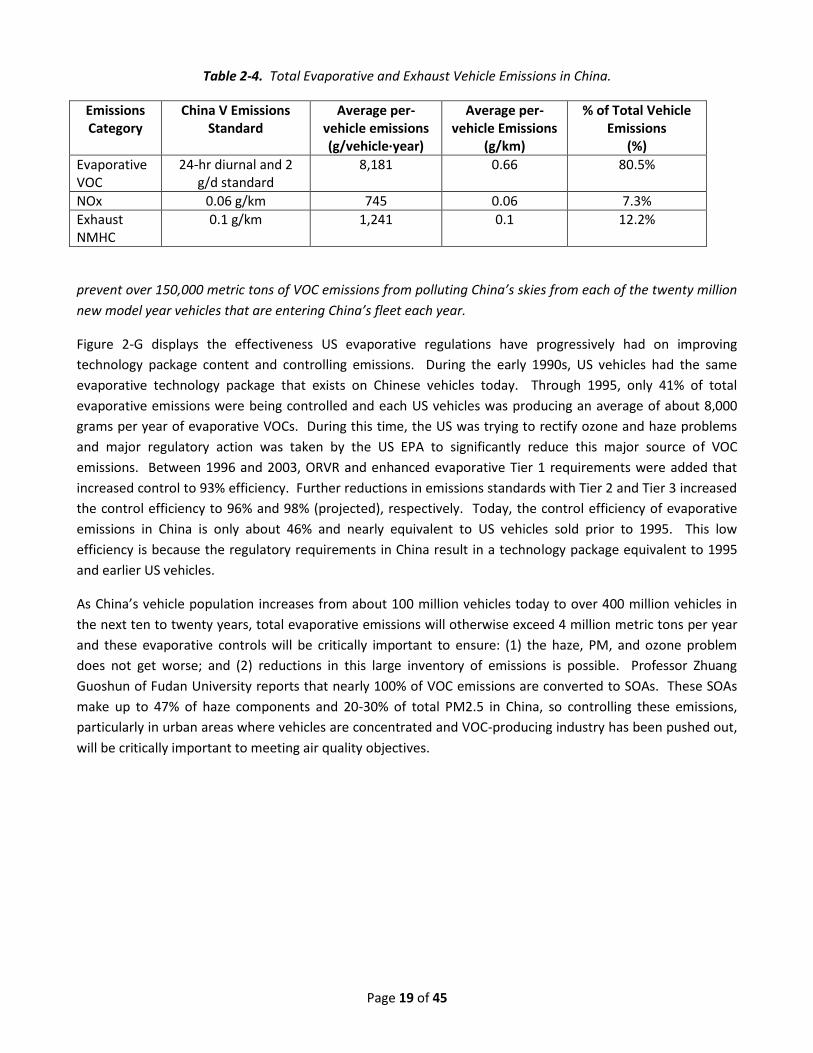
could lie well above or below the standards. As shown in Table 2-4, each vehicle in China is estimated to
produce 10,167 grams of combined evaporative VOC, NOx, and NMHC emissions per year. Evaporative
emissions make up 80.5% of these total emissions and 87% of the total hydrocarbon (evaporative VOC +
exhaust NMHC) emissions from a vehicle. Adding enhanced evaporative control requirements -- including
ORVR, diurnal, and running loss requirements -- present the greatest opportunity to eliminate emissions from
a vehicle and to reduce VOCs that lead to ozone, haze, and secondary organic aerosol (PM2.5) formation.
If evaporative emissions were reduced to levels required on US vehicles sold in the US, China could
Figure 2-F. Average annual per-vehicle total evaporative emissions (including hot soak, running
loss, permeation, refueling, and diurnal) for vehicles from cities across China and the average.
Page 19 of 45
Table 2-4. Total Evaporative and Exhaust Vehicle Emissions in China.
Emissions Category
China V Emissions Standard
Average per-vehicle emissions (g/vehicle∙year)
Average per-vehicle Emissions
(g/km)
% of Total Vehicle Emissions
(%)
Evaporative VOC
24-hr diurnal and 2 g/d standard
8,181 0.66 80.5%
NOx 0.06 g/km 745 0.06 7.3%
Exhaust NMHC
0.1 g/km 1,241 0.1 12.2%
prevent over 150,000 metric tons of VOC emissions from polluting China’s skies from each of the twenty million
new model year vehicles that are entering China’s fleet each year.
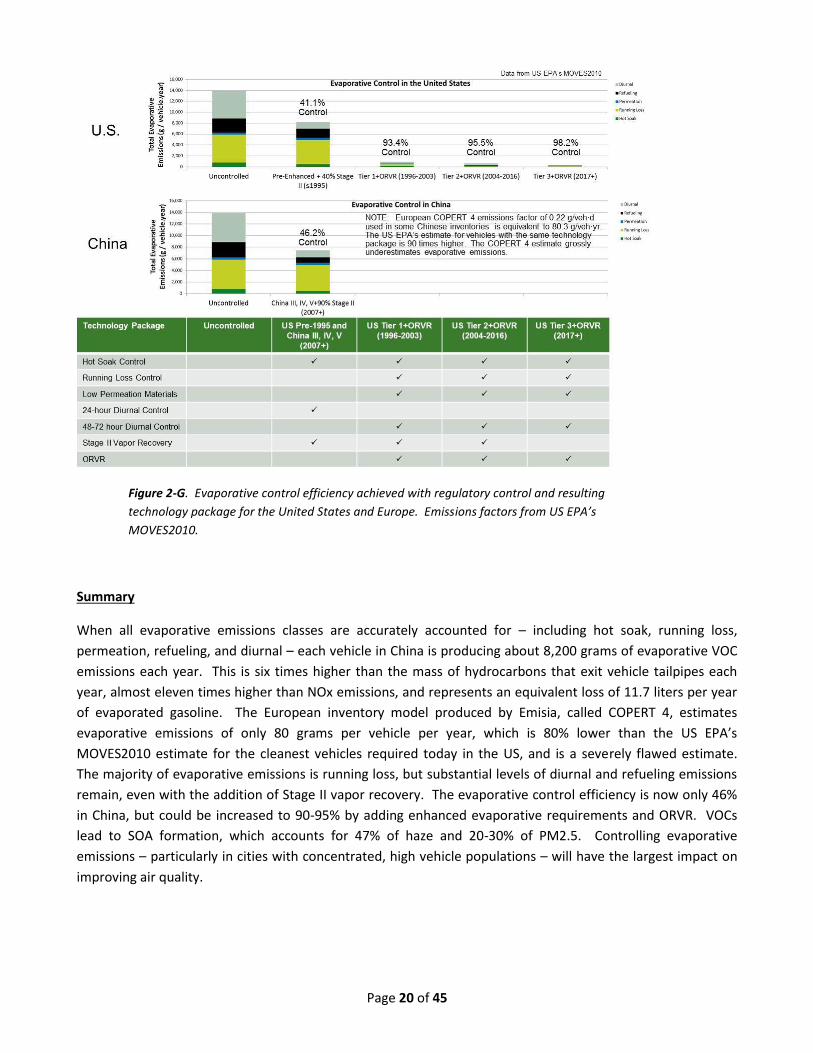
Figure 2-G displays the effectiveness US evaporative regulations have progressively had on improving
technology package content and controlling emissions. During the early 1990s, US vehicles had the same
evaporative technology package that exists on Chinese vehicles today. Through 1995, only 41% of total
evaporative emissions were being controlled and each US vehicles was producing an average of about 8,000
grams per year of evaporative VOCs. During this time, the US was trying to rectify ozone and haze problems
and major regulatory action was taken by the US EPA to significantly reduce this major source of VOC
emissions. Between 1996 and 2003, ORVR and enhanced evaporative Tier 1 requirements were added that
increased control to 93% efficiency. Further reductions in emissions standards with Tier 2 and Tier 3 increased
the control efficiency to 96% and 98% (projected), respectively. Today, the control efficiency of evaporative
emissions in China is only about 46% and nearly equivalent to US vehicles sold prior to 1995. This low
efficiency is because the regulatory requirements in China result in a technology package equivalent to 1995
and earlier US vehicles.
As China’s vehicle population increases from about 100 million vehicles today to over 400 million vehicles in
the next ten to twenty years, total evaporative emissions will otherwise exceed 4 million metric tons per year
and these evaporative controls will be critically important to ensure: (1) the haze, PM, and ozone problem
does not get worse; and (2) reductions in this large inventory of emissions is possible. Professor Zhuang
Guoshun of Fudan University reports that nearly 100% of VOC emissions are converted to SOAs. These SOAs
make up to 47% of haze components and 20-30% of total PM2.5 in China, so controlling these emissions,
particularly in urban areas where vehicles are concentrated and VOC-producing industry has been pushed out,
will be critically important to meeting air quality objectives.
Page 20 of 45
Summary
When all evaporative emissions classes are accurately accounted for – including hot soak, running loss,
permeation, refueling, and diurnal – each vehicle in China is producing about 8,200 grams of evaporative VOC
emissions each year. This is six times higher than the mass of hydrocarbons that exit vehicle tailpipes each
year, almost eleven times higher than NOx emissions, and represents an equivalent loss of 11.7 liters per year
of evaporated gasoline. The European inventory model produced by Emisia, called COPERT 4, estimates
evaporative emissions of only 80 grams per vehicle per year, which is 80% lower than the US EPA’s
MOVES2010 estimate for the cleanest vehicles required today in the US, and is a severely flawed estimate.
The majority of evaporative emissions is running loss, but substantial levels of diurnal and refueling emissions
remain, even with the addition of Stage II vapor recovery. The evaporative control efficiency is now only 46%
in China, but could be increased to 90-95% by adding enhanced evaporative requirements and ORVR. VOCs
lead to SOA formation, which accounts for 47% of haze and 20-30% of PM2.5. Controlling evaporative
emissions – particularly in cities with concentrated, high vehicle populations – will have the largest impact on
improving air quality.
Figure 2-G. Evaporative control efficiency achieved with regulatory control and resulting
technology package for the United States and Europe. Emissions factors from US EPA’s
MOVES2010.

Page 21 of 45
3. ORVR is the most efficient and effective evaporative emissions control tool, particularly for countries
with warm seasonal temperatures and predominantly gasoline-powered, LDV fleets such as China
Evaporative emissions from gasoline LDVs are presently major contributors to the VOC emissions inventory of
China, averaging about 7,500 grams of emissions per vehicle per year in areas with Stage II gasoline refueling
vapor recovery controls and about 9,000 grams per vehicle per year in areas without such Stage II controls –
totaling about 1.1 million metric tons of VOC emissions from the 108 million gasoline vehicles across China in
2013. As shown in Figure 3-A, the Chinese vehicle population is expected to grow to 400 million vehicles in the
next 20 years11, and this will cause evaporative emissions to increase almost four-fold. Figure 3-B(a) shows
the projected evaporative emissions based upon the current Chinese evaporative standards and the vehicle
population growth projections for China. If the evaporative standards remain unchanged, total evaporative
emissions will reach almost 4 million metric tons per year by 2035, representing an equivalent of 5.7 billion
liters/year of gasoline evaporating into the air, and causing further production of ozone and secondary organic
aerosol (SOA) PM2.5 formation. If ORVR were implemented as a standalone measure or with China VI in 2018,
evaporative emissions could be reduced to 1.1 million mt/year by 2035. Further reductions could be possible by
also adding US Tier 2- or Tier 3-level diurnal and running loss standards, which would reduce the VOC inventory
to 0.6 or 0.3 million mt/year, respectively.
The analysis clearly finds that: (1) evaporative emissions are very large now and China should prepare for the
consequences of them growing worse; (2) Stage II vapor recovery will have only minor effects on reducing
emissions; and (3) because retrofit technologies do not exist to control evaporative emissions, quick regulatory
action must be taken by the Chinese government.
China has many regulatory options available to reduce these emissions from new vehicles, and advanced
standards applied in other countries can serve as a basis. The differences between the options include the
benefit in reducing VOC emissions and recovering otherwise lost energy to the consumer, the level of
11
IHS Insight CERA, IHS Automotive Scenarios Dataset—Outlook to 2035, Global Redesign Scenario, December 2013 Update: VERSION 2.0.
Figure 3-A. IHS Global Insights Chinese Gasoline LDV PARC and Annual Sales Forecast (est. 2013).

Page 22 of 45
development and certification testing required by the automaker necessary to meet the standards, and the
cost of the controls to the automaker.
Table 3-1 provides a list of the evaporative standards and test procedures applied or being considered
throughout the world. Of these, only a 24-hour diurnal plus hot-soak “Type IV” standard and a partially
implemented Stage II gasoline refueling vapor recovery standard have been applied in China.
California currently has the most stringent evaporative standards in the world, but the March 2014 completion
of the US EPA’s Tier 3 standards has created one unified set of standards at both the US federal and California
levels. South Korea has also adopted the US Tier 2 standards and plans to implement Tier 3 standards
beginning in 2018. Europe and China, plus those other countries that adopt the European standards, have the
most lenient evaporative standards and tend to lag the US and California by 20-40 years for implementing
advanced evaporative standards.
California and the US EPA began implementing enhanced evaporative standards in 1995, and progress to the
current standards has developed regularly over the last nineteen years as control technology has developed
and matured. With each incremental regulatory improvement, including Tier 3, the US EPA has rigorously
proven the cost-effectiveness of the incremental control requirements.
There is no reason that the same sequence of regulatory advancement must necessarily be followed in China,
particularly given the current severe air pollution issues. Further, lessons learned from jurisdictions
implementing stringent evaporative emissions controls allow China to advance regulations more cost-
effectively and with less effort by the automakers and authorities. The goal for China should be to adopt those
regulations that would have the greatest positive environmental impact, are most effective at reducing haze
and PM2.5, and could be implemented quickly by the large number of automakers present in China and
advance to best-world standards as sophistication permits.
The key technical issues that any regulator considers when evaluating an existing or future set of evaporative
regulations include:
1. Do the in-service evaporative canisters have the capacity to contain the vapors generated for the
distribution of parking event durations for the vehicle fleet?
o As municipalities restrict the use of vehicles on certain days, the distribution of parking events
will shift towards longer durations.
o The current 24-hour diurnal regulations necessitate an average 0.8 liter canister that has
about 40 grams of gasoline vapor capacity. Full canister breakthrough occurs when a vehicle
is parked for longer than one day, and daily vapor generation rates can exceed 30-40 g/day.
o A 48-hour diurnal regulation requires about 1.3 liters of carbon, and a 72-hour diurnal
regulation requires about 1.8 liters of carbon.
o An ORVR canister requires about 2.1 liters of carbon, and an integrated ORVR canister will
inherently provide more than 72-hours of diurnal control in addition to the refueling control
capability. Higher canister capacity not only means lower emissions for extended parking
events, but it also means reduced emissions for short parking events.

Page 23 of 45
2. Do the regulations result in sufficient canister regeneration during all driving conditions that are
unique to China?
o Canister purge rates are calibrated based on the duration of the certification drive cycle
(currently 59 minutes in China and Europe), the canister volume, and the diurnal standard.
o If the canister volume increases and/or the drive-cycle duration decreases, then the
automakers will configure the engine calibration to increase purge rates. Increasing the purge
rate makes the canister more effective in-use during off-cycle conditions.
Figure 3-B. Projected evaporative VOC inventory for China with regulatory controls: (a) status-quo,
current Type IV controls and limited Stage II introduction, (b) status-quo, current Type IV and Stage II
implemented at 100% of GDFs across China by 2018, (c) Type IV diurnal supplemented with ORVR in
2018, (d) ORVR and 48-hr and running loss requirements added that are equivalent to US Tier 2
standards, and (e) ORVR and diurnal and running loss standards equivalent to US Tier 3 standards

Page 24 of 45
Table 3-1. Global Evaporative Standards
Control Standard Drive Cycle Drive (Purge) Time
Drive Distance
Ave Drive Speed
PC SHED standard
Average Canister Volume
Typical SHED Test Canister Emissions Allocation
Diurnal 24-hour
Euro 3,4,5 (2000) ECE+2xEUDC+ECE+EUDC+ECE
59 minutes 33.021 km 33.63 km/hr 2.0 g/day 0.8 L 0.5-1.0 g/day
China III, IV, V (2001)
ECE+2xEUDC+ECE+EUDC+ECE
59 minutes 33.021 km 33.63 km/hr 2.0 g/day 0.8 L 0.5-1.0 g/day
Japan (2005) 2x JC08 40 minutes 16.4 km 24.4 km/hr 2.0 g/day 0.8 L 0.5-1.0 g/day
Diurnal 48-hour
US Tier I (1996) EPA III 31 min 17.806 km 34.19 km/hr 2.5 g/day 1.3 L < 1.0 g/day
US Tier 2 (2004) EPA III 31 min 17.806 km 34.19 km/hr 1.2 g/day 1.3 L < 0.23 - 0.5 g/day
CA LEV I (1995) EPA III 31 min 17.806 km 34.19 km/hr 2.5 g/day 1.3 L < 1.0 g/day
CA LEV II (2001) EPA III 31 min 17.806 km 34.19 km/hr 0.65 g/day 1.3 L < 0.230 g/day
PZEV (2001) CA LEV III (2013)
EPA III 31 min 17.806 km 34.19 km/hr 0.35 g/day 0.30 g/day
1.3 L < 0.010 g/day
Korea Tier 2 (2013)
EPA III 31 min 17.806 km 34.19 km/hr 1.2 g/day 1.3 L < 0.5 g/day
US Tier 3 (likely) EPA III 31 min 17.806 km 34.19 km/hr 0.30 g/day 1.3 L < 0.010 g/day
Euro 6 (likely) ECE+EUDC+2xECE 45.3 min 19.111 km 25.28 km/hr 2.0 g/day 1.3 L < 1.0 g/day
Diurnal 72-hour
US Tier I (1996) EPA III+EPA II +2xNYCC+EPA II
97 min 45.645 km 27.11 km/hr 2.0 g/day 1.8 L < 1.0 g/day
US Tier 2 (2004) EPA III+EPA II +2xNYCC+EPA II
97 min 45.645 km 27.11 km/hr 0.95 g/day 1.8 L < 0.08 – 0.3 g/day
CA LEV I (1995) EPA III+EPA II +2xNYCC+EPA II
97 min 45.645 km 27.11 km/hr 2.0 g/day 1.8 L < 1.0 g/day
CA LEV II (2001) EPA III+EPA II +2xNYCC+EPA II
97 min 45.645 km 27.11 km/hr 0.50 g/day 1.8 L < 0.08 g/day
PZEV (2001) CA LEV III (2013)
EPA III+EPA II +2xNYCC+EPA II
97 min 45.645 km 27.11 km/hr 0.35 g/day 0.30 g/day
1.8 L < 0.010 g/day
US Tier 3 (likely) EPA III+EPA II +2xNYCC+EPA II
97 min 45.645 km 27.11 km/hr 0.30 g/day 1.8 L < 0.010 g/day
Running Loss
US Tier 1 EPA III+EPA II +2xNYCC+EPA II
97 min 45.645 km 27.11 km/hr 0.03 g/km 1.8 L << 0.03 g/km
Refueling ORVR
US ORVR (1998) EPA III+EPA II +2xNYCC+EPA II
97 min 45.645 km 27.11 km/hr 0.053 g/L 2.1 L < 0.025 g/L
Draft China Type VII ORVR
ECE+2xEUDC+ECE+EUDC+2xECE+EUDC+ECE
93 min 48.08 km 31.55 km 0.05 g/L 2.1 L < 0.025 g/L
Refueling Stage II Vapor Recovery
California (1972)
US EPA (1992)
China (2008)
Europe (2011)
o On average, the existing Chinese regulations permit a 0.8 liter canister to be used, and this
canister is purged over 59 minutes of driving. As shown in Figure 3-C, an unforeseen
consequence of the lax Euro/China test procedures is that some European and Chinese
vehicles are calibrated to only purge the canister at highway speeds and not during urban
conditions but still meet the certification requirements. During heavy traffic, in-use
conditions, a vehicle that is calibrated to purge only during highway driving conditions is likely
producing uncontrolled diurnal and running-loss emissions. The only way to ensure against
this situation is to develop regulations that result in a large canister and a short drive cycle
distance and time. This could be achieved by enlarging the canister, via ORVR or three-day
diurnal requirements, and reducing the certification drive cycle. The automaker would choose
to calibrate the vehicle at only highway speeds to reduce the cost of exhaust controls and to
simplify calibration to maximize drivability. This lower cost to the automaker is at the expense
of the environment and fuel capture for the consumer.

Page 25 of 45
o ORVR would result in purge rates about 50-75% higher than present levels in China. If ORVR
was combined with a 48-hour diurnal with a 30 minute drive cycle -- like the US Tier 1, 2, and
3 requirements – then canister purge rates would be 125-150% higher than today, and the
calibration problem shown in Figure 3-C would not be possible
3. Do the regulations directly or indirectly influence the factors that limit the magnitude of running loss
emissions?
o Running-loss emissions are unregulated in China. These emissions can be substantial and are
reduced by minimizing fuel tank temperatures by thermal shielding, choice of fuel pump
technologies, maintaining purge rates during all driving conditions, and enlarging the canister
to serve as a buffer.
o Running-loss emissions were the highest source of evaporative emissions on US vehicles prior
to the 1996 enhanced evaporative requirements that included running-loss standards. These
emissions are now nearly zero in the US.
o Approximately 50% of new Chinese vehicles utilize a recirculating fuel pump that can result in
very high fuel-tank temperatures that reach gasoline’s boiling point.
o Tank temperatures can easily surpass 50-60°C for all vehicles in China, due to heat from the
road surface, engine, and exhaust components. This temperature is near or above the boiling
point of gasoline. If purge rates and canister capacity are not sufficient, running losses can
overwhelm the canister and result in significant levels of emissions. Running-loss also
negatively impacts the regeneration of the canister and also results in the high diurnal
emissions.
o ORVR would provide higher canister capacity and purge rates and reduce running-loss emissions by about 70%. Adding a running loss standard is the only way to ensure running-loss emissions are at near-zero levels (i.e. below 0.03 g/km).
4. Are the diurnal standards sufficiently low to ensure low permeation materials are included onto new
vehicles?
o The present 2 g/day standard can be met by using poorly performing, low cost, high
permeation materials that result in high permeation emissions. Lowering the standard to 0.3
– 1.2 g/day is the only way to ensure low permeation materials will be used.
o
Figure 3-C. Purge Traces, measured by the Joint Research Center of the European Commission (figures
courtesy of Giorgio Martini, JRC, Ispra, Italy) for two vehicles meeting the Euro V standards. The
vehicle on the left shows fairly uniform purge over both the urban and highway cycles of the NEDC.
The vehicle on the right is calibrated by the automaker to purge only at highway speeds and does not
purge in urban traffic conditions.

Page 26 of 45
o About 30-50% or more of the tanks in Europe and China are still fluorinated, which do not
provide long-term control of permeation, especially when alcohol-containing fuels are used.
Fluorinated tanks are not used in the US, because initial certification diurnal requirements
cannot be met, and they lack the durability performance to meet in-use requirements.
5. Do the regulations promote the use of well-designed, efficient canisters to provide robust control over
the vehicle’s lifetime?
o Canister design affects the physical durability, and adsorbent selection affects working
performance.
o Well-designed canisters ensure uniform flow distribution across the canister’s cross-section
and often utilize multiple chambers to allow redistribution of vapors and prevent short-
circuiting.
o Well-designed canisters maximize the use of purge to clean the canister and minimize the
effect of diffusion on diurnal emissions.
o A canister designed for 72-hours or more of capacity will have near-zero emissions on days
one and two of the diurnal. This minimizes emissions for most parking situations.
o Having a certification test is useless if in-use performance is not maintained on the vehicle. In-
use standards and compliance monitoring insures the consistency of production and
emissions are being controlled over the vehicle’s lifetime.
o ORVR requires a high capacity canister and will result in very low diurnal emissions.
6. Is China using the most efficient method for controlling refueling emissions long-term and
nationwide?
o Stage II gasoline refueling vapor recovery can be expected to achieve 70% recovery efficiency
in-use, and it can be installed and reduce the emissions from the existing fleet. During non-
ideal conditions, even the best working Stage II systems will provide less than their 90%
certification-level performance. In reality, in-use efficiencies will be far below this level as
dispensed and vehicle fuel temperatures differ, equipment wears and breaks, and
components drift out of calibration.
o ORVR can provide 98% efficiency, increase the canister capacity to over 72-hours capacity and
running loss buffering, and result in higher purge rates to improve running loss and in-use
canister regeneration.
o When ORVR and conventional Stage II gasoline refueling vapor recovery are combined, ORVR
continues to maintain 98% recovery efficiency at the vehicle. The Stage II system draws in
fresh air, however, which results in the creation of vent-stack emissions. The magnitude of
vent-stack emissions is linearly proportional to the percentage of ORVR vehicles in the fleet
and reaches a maximum of 8% of the level of uncontrolled refueling emissions at on ORVR
penetration of 100%. Therefore, the net refueling efficiency for ORVR vehicles ranges
between 98% (at 0% ORVR vehicles) and 90% (at 100% ORVR vehicles). The effects of
combining ORVR and Stage II are summarized more fully in Section 5.
In short, the diurnal test duration, diurnal standards, refueling standards, drive cycles used in the test
procedures, running loss standards, and in-use requirements all affect the level of in-use evaporative
emissions, which is what regulators should be most concerned about. To demonstrate how the standards
impact emissions, four different regulatory options were analyzed to predict how each would affect individual
vehicle and long-term emissions inventories in China. As discussed in section 1, there are five major classes of
evaporative emissions sources: (1) hot soak; (2) running loss; (3) permeation; (4) refueling; and (5) diurnal.
Page 27 of 45
Figure 2-A in the previous section shows the annual emissions factors for these classes that are used in the US
MOVES2010 fleet inventory. US pre-1995 vehicles had the highest emissions factors, and these emissions
factors could be considered worst-case for China, as specified in Table 3-2. Best-case emissions factors would
be those for California LEV II-Tier 2 and LEV III-Tier 3 vehicles, and these are also shown in Table 3-2.
Evaporative standards have remained unchanged in China since China III vehicles were introduced and Stage II
gasoline refueling vapor recovery controls have been partly implemented, and current Chinese emissions
factors lie between the best-case and the worst-case conditions. The impact of these four regulatory options
on the emissions factors for the five major evaporative emissions classes are shown in Table 3-2 and Figure 3-
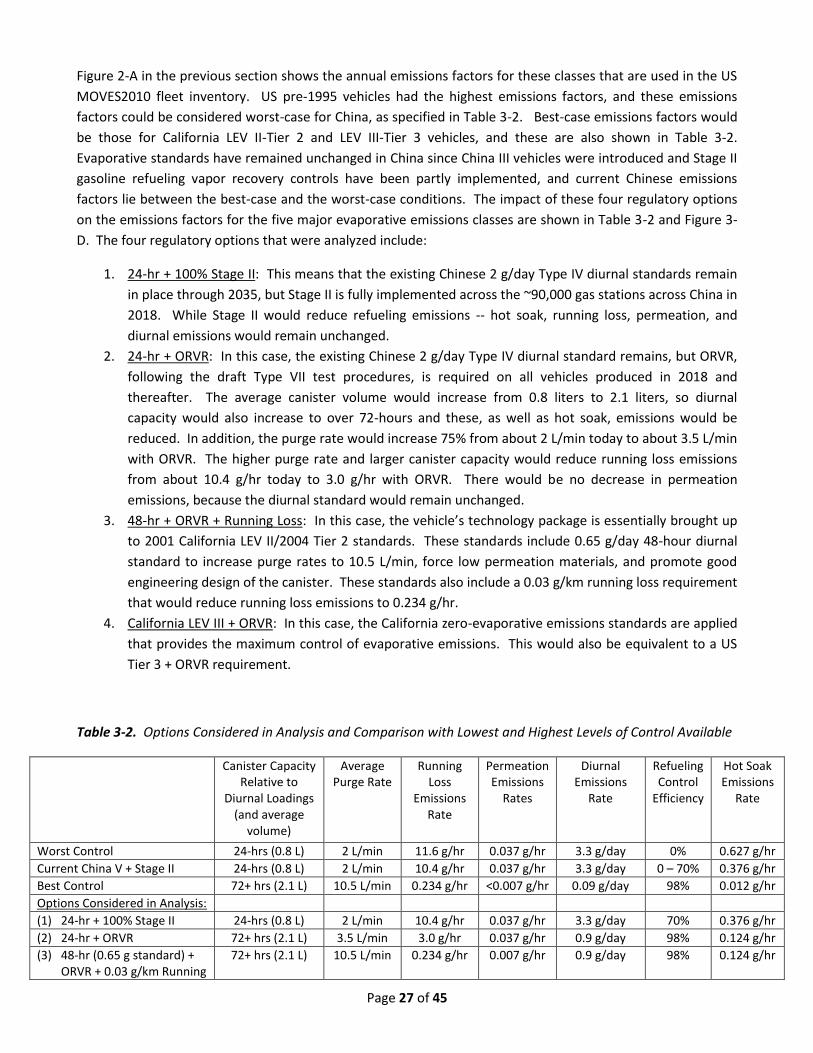
D. The four regulatory options that were analyzed include:
1. 24-hr + 100% Stage II: This means that the existing Chinese 2 g/day Type IV diurnal standards remain
in place through 2035, but Stage II is fully implemented across the ~90,000 gas stations across China in
2018. While Stage II would reduce refueling emissions -- hot soak, running loss, permeation, and
diurnal emissions would remain unchanged.
2. 24-hr + ORVR: In this case, the existing Chinese 2 g/day Type IV diurnal standard remains, but ORVR,
following the draft Type VII test procedures, is required on all vehicles produced in 2018 and
thereafter. The average canister volume would increase from 0.8 liters to 2.1 liters, so diurnal
capacity would also increase to over 72-hours and these, as well as hot soak, emissions would be
reduced. In addition, the purge rate would increase 75% from about 2 L/min today to about 3.5 L/min
with ORVR. The higher purge rate and larger canister capacity would reduce running loss emissions
from about 10.4 g/hr today to 3.0 g/hr with ORVR. There would be no decrease in permeation
emissions, because the diurnal standard would remain unchanged.
3. 48-hr + ORVR + Running Loss: In this case, the vehicle’s technology package is essentially brought up
to 2001 California LEV II/2004 Tier 2 standards. These standards include 0.65 g/day 48-hour diurnal
standard to increase purge rates to 10.5 L/min, force low permeation materials, and promote good
engineering design of the canister. These standards also include a 0.03 g/km running loss requirement
that would reduce running loss emissions to 0.234 g/hr.
4. California LEV III + ORVR: In this case, the California zero-evaporative emissions standards are applied
that provides the maximum control of evaporative emissions. This would also be equivalent to a US
Tier 3 + ORVR requirement.
Table 3-2. Options Considered in Analysis and Comparison with Lowest and Highest Levels of Control Available
Canister Capacity Relative to
Diurnal Loadings (and average
volume)
Average Purge Rate
Running Loss
Emissions Rate
Permeation Emissions
Rates
Diurnal Emissions
Rate
Refueling Control
Efficiency
Hot Soak Emissions
Rate
Worst Control 24-hrs (0.8 L) 2 L/min 11.6 g/hr 0.037 g/hr 3.3 g/day 0% 0.627 g/hr
Current China V + Stage II 24-hrs (0.8 L) 2 L/min 10.4 g/hr 0.037 g/hr 3.3 g/day 0 – 70% 0.376 g/hr
Best Control 72+ hrs (2.1 L) 10.5 L/min 0.234 g/hr <0.007 g/hr 0.09 g/day 98% 0.012 g/hr
Options Considered in Analysis:
(1) 24-hr + 100% Stage II 24-hrs (0.8 L) 2 L/min 10.4 g/hr 0.037 g/hr 3.3 g/day 70% 0.376 g/hr
(2) 24-hr + ORVR 72+ hrs (2.1 L) 3.5 L/min 3.0 g/hr 0.037 g/hr 0.9 g/day 98% 0.124 g/hr
(3) 48-hr (0.65 g standard) + ORVR + 0.03 g/km Running
72+ hrs (2.1 L) 10.5 L/min 0.234 g/hr 0.007 g/hr 0.9 g/day 98% 0.124 g/hr

Page 28 of 45
Canister Capacity Relative to
Diurnal Loadings (and average
volume)
Average Purge Rate
Running Loss
Emissions Rate
Permeation Emissions
Rates
Diurnal Emissions
Rate
Refueling Control
Efficiency
Hot Soak Emissions
Rate
Loss Standard
(4) California LEV III equivalent + ORVR
72+ hrs (2.1 L) 10.5 L/min 0.234 g/hr <0.007 g/hr 0.09 g/day 98% 0.012 g/hr
Figure 3-D. Annual evaporative emissions factors for Chinese vehicles as a function of regulatory standard
applied to the vehicles. China’s current vehicle population is represented by “Current 24-hr + Stage II.”
Nationalizing Stage II across China provides only a modest reduction in the refueling emissions and overall
emissions factor, while ORVR and other evaporative vehicle requirements can provide major reductions in all
evaporative classes.
If Stage II were adopted at all gas stations in China, it could certainly have a positive impact on reducing
refueling emissions from all vehicles. As shown in Figure 3-D, Stage II can reduce vehicle emissions by about
1900 g/vehicle∙year. Unfortunately, even with Stage II, Chinese vehicles will continue to emit almost 7,300
g/vehicle∙year of evaporative VOCs because of hot soak, running loss, permeation, remaining diurnal, and
remaining refueling emissions. With the rapidly increasing vehicle population in China and with Stage II
expanding to 100% of gasoline dispensing facilities (GDFs) across China by 2018, Figure 3-B(b) shows that the
evaporative VOC inventory will continue increasing with the vehicle population to a level of 3.3 million metric
tons/year by 2035. This level of emissions is over 3.5 times higher than the current inventory and will
overwhelm all other sources of VOC emissions. Essentially, this means that VOC-formed SOAs will continue
increasing and thereby PM2.5 and haze will be difficult, if not impossible, to reduce in urban areas. Reducing
hot soak, running loss, permeation, remaining refueling, and remaining diurnal emissions through regulatory

Page 29 of 45
action is vital to reducing these emissions both in the short term and the long term to reduce PM2.5 and haze.
Because ORVR has a beneficial impact on diurnal, running loss, and hot soak emissions, in addition to its
refueling control functionality, Stage II should not be considered a direct alternative to ORVR.
Table 3-4 shows the emissions factors and emissions inventories (also shown in Figure 3-B) for the three
advanced evaporative control regulatory options in comparison with the status quo situation in China. As can
be seen, over the short term through 2020, status quo controls will increase evaporative emissions to 2.0
million metric tons of VOCs per year. Options 2, 3, and 4 will, for the most part, hold VOC emissions near 2017
levels in 2020, but still about 40% higher than 2013 levels. Longer term (that is, 2025), options 2, 3, and 4 will
substantially reduce evaporative emissions well below the 2017 levels, with option 4 (LEV III-Tier 3) bringing
emissions down to 2014 levels. The only way China has to reduce evaporative emissions and continue to grow
the vehicle fleet is to add very stringent requirements such as options 2 or 3. Without such action, the
contribution of evaporative VOC emissions towards ozone, haze, and PM2.5 formation will continue to get
worse. This is why it is critical for China to take immediate steps to further regulate these emissions;
otherwise, the problem will get worse and it will take decades to remedy the situation, since there are no
retrofit options for reducing evaporative emissions.
In the near-term, adding an ORVR requirement, possibly in combination with a 48-hour diurnal standard of
0.65-1.2 g/day and a shortened drive cycle, would be a very beneficial first step. ORVR technology has been
available for over sixteen years and could be quickly implemented onto vehicles; the same is true for a 48-hour
diurnal standard. Meeting the stringent LEV III-Tier 3 evaporative standards is challenging today, and this
requirement would be a better long-term approach.
Regulatory Option
Emissions Factor (g/vehicle∙year)
Chinese Evaporative Inventory in
2014 (mt/yr)
Chinese Evaporative Inventory in
2017 (mt/yr)
Chinese Evaporative Inventory in
2020 (mt/yr)
Chinese Evaporative Inventory in
2025 (mt/yr)
Chinese Evaporative Inventory in
2035 (mt/yr)
(1) 24-hr + 100% Stage II 7,291 1,142,000 1,607,000 2,021,000 2,621,000 3,286,000
(2) 24-hr + ORVR 2,241 1,142,000 1,607,000 1,636,000 1,562,000 1,132,000
(3) 48-hr (0.65 g standard) + ORVR + 0.03 g/km Running Loss Standard
922 1,142,000 1,607,000 1,535,000 1,285,000 570,000
(4) California LEV III equivalent + ORVR
249 1,142,000 1,607,000 1,484,000 1,144,000 283,000
Table 3-4. Chinese Evaporative Inventory as a Result of Regulatory Action
Summary
ORVR is the most efficient and effective evaporative emissions control tool, particularly for countries with
warm seasonal temperatures and predominantly gasoline-powered, light-duty vehicle fleets. The larger
canister capacity and higher purge rates that come with ORVR will provide the greatest incremental reduction
possible. Ideally, ORVR would be combined with a low 48-hour diurnal standard and shortened drive cycle.
Advanced evaporative controls must be regulated on Chinese vehicles to keep VOC emissions and the resulting
PM2.5 and haze components from continuing to climb. ORVR can moderate these emissions over the very
short-term and reduce the emissions over the long-term as the Chinese vehicle population continues growing.
Looking at the enhanced evaporative emissions regulatory options discussed in this paper and associated
Chinese evaporative emissions inventory projections for 2014-2035, one can see why an even earlier adoption

Page 30 of 45
of ORVR would be even more helpful in creating blue skies for China. Evaporative emissions are a large part of
the VOC inventory in China, particularly in cities, where evaporative emissions can account for 30-40% of total
VOCs. Since VOC-produced SOAs account for 47% of haze and 20-30% of PM2.5, ORVR and other advanced
evaporative controls could single-handedly cut haze by 15-20% and PM2.5 by 7-12%.
4. A cost-benefit analysis, with estimates for China based on the US experience with ORVR,
shows that advanced evaporative controls, particularly ORVR, are economically advantageous to the vehicle
owner.
Not only are advanced evaporative controls necessary to reduce the VOC emissions inventory, but a cost-
benefit analysis of the four considered options in Table 3-4 shows that these enhanced evaporative controls
are also economically advantageous to the vehicle owner. Even though the cost of the controls will be passed
on to the vehicle owner from the automaker, the monetary value of the evaporative controls greatly exceeds its
cost as soon as the vehicle is purchased. Contrarily, Stage II gasoline refueling vapor controls are a net cost to
the gasoline dispensing facility (GDF) owner, and there is no direct net economic benefit.
When refueling emissions are captured using Stage II, the value of that gasoline is credited to the GDF owner.
Likewise, when evaporative emissions (including refueling, hot soak, running loss, permeation, and diurnal) are
recovered using a canister or other components on the vehicle, the value of that gasoline is credited to the
vehicle owner. The credit from recovering gasoline offsets the cost of the control technology. The analysis
considers the capital and any maintenance costs of the control technology and the value of the gasoline
recovered over a ten year period. It is standard protocol at the US EPA and in Europe to use a ten-year Net
Present Value (NPV) method, since much of the cost of the control technology is front-end loaded, but the
benefit in recovering gasoline is spread out over ten years or the lifetime of the vehicle. A conservative
discount factor of 6% was used in the analysis.
Table 4-1 provides the costs for Stage II gasoline refueling vapor controls and Table 4-2 provides the costs for
advanced evaporative controls used in the analysis. The Stage II costs were prepared by Don Gilson of Gilson
Environmental.12 The advanced evaporative controls costs are based on discussions in China and are higher
than estimates assembled by the US EPA in their cost estimates to ensure the analysis is considered
conservative. For example, the US EPA estimates the incremental cost for ORVR was US $6/vehicle (36
RMB/vehicle), but a conservative estimate of 183 RMB/vehicle was used in this analysis.
Table 4-1. Installation and Maintenance Costs for Stage II Vapor Recovery in China
Installation Cost
(RMB/site)
Annual Maintenance Cost
(RMB/site∙year)
% of Sites Used
Net Installation Cost
(RMB/site)
Net Annual Maintenance Cost
(RMB/site)
Primary Stage II Vapor Recovery
325,000 40,121 100% 325,000 40,121
Secondary Stage III Post-Processor
225,000 25,920 33% 74,250 8,554
(1) Total Stage II Costs
399,250 48,675
12
Donald Gilson, “Vapor Recovery at Gasoline Filling Stations in China,” June 21, 2011.

Page 31 of 45
Table 4-2. Cost of Advanced Evaporative Controls in China
Incremental Cost to Include Technology by the Automaker
(RMB/vehicle)
Annual Maintenance Costs
(RMB/vehicle∙year)
(2) 24-hr + ORVR 183 0
(3) 48-hr (0.65 g standard) + ORVR +
0.03 g/km Running Loss Standard 300 0
(4) California LEV III equivalent + ORVR 420 0
The NPV method assumes that the value of money declines with time, because of inflation and lost investment
opportunity for that money. Commonly, a discount rate of 6% is used, which is double a normal rate of
inflation. The analysis covers a ten year period. Stage II is assumed to phase in over five years at a rate of 10%,
15%, 25%, 25%, and 25%, summing to 100% of all 90,000 stations. Stage II equipment normally has a seven-
year turnover period for vacuum pumps and Stage III post-processors, so these replacement costs are
annualized and included in the Stage II maintenance costs shown in Table 4-1. Since evaporative controls on
vehicles require no normal maintenance, maintenance costs are zero, so the entire investment is made up-
front by the automaker and passed along to the consumer.
The spreadsheet in Figure 4-A shows the results of the analysis, that are graphically displayed in Figure 4-B.
The NPV result is the net savings enjoyed by the final stakeholder (i.e., GDF owner for Stage II gasoline
refueling vapor controls or vehicle owner for advanced evaporative controls) at Year 0). A zero-value NPV
means that the initial and on-going cost of control is exactly equal to the long-term value of the gasoline that is
recovered. A positive NPV means that the cost of the control is more than off-set by the long-term value of
the recovered gasoline, and the control is economically beneficial. A negative NPV means that the cost of
control is greater than the long-term value of the recovered gasoline, and the control is economically
disadvantaged. As seen in Figure 4-B, Stage II vapor recovery has a negative NPV. This means that the cost of
controlling VOCs using Stage II is 9,401 RMB per metric ton of gasoline recovered, and the GDF owner bears
this cost. This is not necessarily bad, however, since there are health, agricultural, and societal costs of the
pollution that likely greatly outweigh the cost of control. However, when more effective and lower cost
control options exist, those should probably be considered as well. The analysis also assumes that the number
of GDFs remain constant at 90,000 sites, while the vehicle population increases according to Figure 3-A. This
assumption is very conservative, because the amount of gasoline that is recovered at each GDF is increasing at
a rate equal to vehicle population growth. In reality, the number of GDFs across China will continue growing at
some rate slightly lower than the vehicle population growth rate and the NPV cost of Stage II will be more
economically unfavorable.
All advanced vehicle-based evaporative controls have positive NPVs, with ORVR being the highest. Essentially,
this can be interpreted in two ways described below.
For every metric ton of VOCs recovered using advanced evaporative controls, an equivalent of 2,881
RMB (for Option 2: LEV III + ORVR) to 4,840 RMB (for Option 4: 24-hr + ORVR) of net value is returned
to the final stakeholders (i.e. vehicle owners) at Year 0 of the investment.
On a vehicle-basis, the cost of the advanced evaporative controls is passed on from the automaker to

Page 32 of 45
the vehicle owner when the vehicle is purchased. The 183-420 RMB that must be paid for the
advanced controls have a net value 255-332 RMB above the cost at the time of purchase. This is the
same as a person paying 183 RMB to an automaker, then receiving a debit card that can be used to
purchase gasoline over a 10 year period with a value of 515 RMB (183 RMB + 332 RMB); all of this
relative to a 6% rate of return. This is a very good economic investment in addition to the value of
taking out millions of metric tons of VOCs from the inventory.
From an economic-investment perspective alone, advanced evaporative controls make terrific sense. This is
why the US EPA and California are able to continue passing more stringent standards. The economics of
gasoline recovery, alone, much more than offset the cost of the advanced evaporative emissions controls. The
improved environmental and health of society occur with a profit! This is not the case, however, with Stage II
vapor recovery, which will always operate at negative profitability and provides only very limited benefit.
Of the control options analyzed, ORVR is the most economical, although all advanced evaporative control
options are clearly favorable. A 48-hour diurnal requirement is nearly as economical and could be easily
phased in with ORVR or shortly thereafter. The greatest challenge for meeting a 48-hour diurnal requirement
with a low diurnal emissions standard in China would be the effort required by tank suppliers to build capacity
of low-permeation tank production.
Summary
ORVR is a very attractive investment, as the value of gasoline it recovers greatly exceeds the cost of the control
technology. There will always be up-front investments required to cut emissions and automakers may
complain about their costs, but mandating ORVR installation on vehicles will actually be a sound investment
for automotive industry customers. To only a slightly lesser degree, the same would be true for the other
advanced vehicle-based evaporative controls. Stage II gasoline refueling vapor recovery programs, however,
will only slightly reduce the growth rate of VOC emissions, and Stage II programs are very expensive to operate
and maintain. In the end, all costs and profits of evaporative control technologies are passed along to the
vehicle owners, by the automakers and the oil companies, so economics should be considered important.

Page 33 of 45
Inst
alla
tio
nA
nn
ual
% o
fN
et
Ne
t
Co
stM
ain
tSt
atio
ns
Inst
alla
tio
nM
ain
ten
ance
Stag
e II
Co
sts
(RM
B/s
t)(R
MB
/st.
yr)
(%)
(RM
B/s
t)(R
MB
/st.
yr)
Pri
mar
y St
age
II32
5,00
040
,121
100%
325,
000
40,1
21
Seco
nd
ary
Stag
e II
I22
5,00
025
,920
33%
74,2
508,
554
We
igh
ted
Co
st S
tage
II39
9,25
048
,675
Dis
cou
nt
Rat
e -
----
--->
0.06
Year
-->
01
23
45
67
89
NP
V
Stag
e II
Stag
e II
Imp
lem
en
tati
on
%10
%15
%25
%25
%25
%0%
0%0%
0%0%
Tota
l No
. of
GD
Fs90
000
9000
090
000
9000
090
000
9000
090
000
9000
090
000
9000
0
Ve
hic
le P
op
ula
tio
n10
8.40
126.
7414
6.25
166.
5418
7.40
208.
2722
8.87
249.
2226
9.38
289.
31
GD
F St
age
II C
on
vers
ion
Co
sts,
RM
B3,
593,
250,
000
5,38
9,87
5,00
08,
983,
125,
000
8,98
3,12
5,00
08,
983,
125,
000
00
00
0
Stag
e II
Mai
nte
nan
ce C
ost
s, R
MB
043
8,07
5,25
71,
095,
188,
143
2,19
0,37
6,28
63,
285,
564,
429
4,38
0,75
2,57
14,
380,
752,
571
4,38
0,75
2,57
14,
380,
752,
571
4,38
0,75
2,57
1
Tota
l An
nu
al In
vest
me
nt
into
GD
Fs, R
MB
-3,5
93,2
50,0
00-5
,827
,950
,257
-10,
078,
313,
143
-11,
173,
501,
286
-12,
268,
689,
429
-4,3
80,7
52,5
71-4
,380
,752
,571
-4,3
80,7
52,5
71-4
,380
,752
,571
-4,3
80,7
52,5
71
Me
tric
To
ns
Gas
oli
ne
Re
cove
red
, mt
19,7
0657
,600
132,
929
227,
062
340,
666
378,
615
416,
052
453,
056
489,
705
525,
935
An
nu
al C
red
it f
or
Re
cove
red
Gas
oli
ne
, RM
B19
6,87
8,68
657
5,47
0,72
11,
328,
058,
812
2,26
8,51
7,07
03,
403,
502,
765
3,78
2,64
1,20
24,
156,
665,
228
4,52
6,36
4,88
94,
892,
513,
884
5,25
4,47
4,72
8
Ne
t C
ost
to
GD
Fs (
Co
st+C
red
it),
RM
B-3
,396
,371
,314
-5,2
52,4
79,5
36-8
,750
,254
,331
-8,9
04,9
84,2
16-8
,865
,186
,664
-598
,111
,369
-224
,087
,343
145,
612,
318
511,
761,
312
873,
722,
157
-28,
592,
383,
197
RM
B
Ne
t C
ost
on
Pe
r-V
eh
icle
Bas
is, R
MB
/ve
h-3
1.3
-41.
4-5
9.8
-53.
5-4
7.3
-2.9
-1.0
0.6
1.9
3.0
-193
.9R
MB
/ve
h
Ne
t C
on
tro
l Co
st, R
MB
/mt
VO
C-1
72,3
51-9
1,18
8-6
5,82
6-3
9,21
8-2
6,02
3-1
,580
-539
321
1,04
51,
661
-9,4
01R
MB
/mt
Cu
rre
nt
24-h
r +
OR
VR
Tota
l Ve
hic
le In
vest
me
nt,
RM
B-1
830
00
00
00
00
Me
tric
To
ns
Gas
oli
ne
Re
cove
red
, mt
0.00
6868
398
0.00
6868
398
0.00
6868
398
0.00
6868
398
0.00
6868
398
0.00
6868
398
0.00
6868
398
0.00
6868
398
0.00
6868
398
0.00
6868
398
An
nu
al C
red
it f
or
Re
cove
red
Gas
oli
ne
68.6
68.6
68.6
68.6
68.6
68.6
68.6
68.6
68.6
68.6
Ne
t C
ost
to
Ve
hic
le O
wn
er
(Co
st+C
red
it),
RM
B/v
eh
-114
.468
.668
.668
.668
.668
.668
.668
.668
.668
.633
2.4
RM
B/v
eh
Ne
t C
on
tro
l Co
st, R
MB
/mt
VO
C-1
6,65
3.0
9,99
0.7
9,99
0.7
9,99
0.7
9,99
0.7
9,99
0.7
9,99
0.7
9,99
0.7
9,99
0.7
9,99
0.7
4,83
9.7
RM
B/m
t
Ne
t C
on
tro
l Co
st, R
MB
/mt
VO
C
Tota
l Ve
hic
le In
vest
me
nt,
RM
B-3
000
00
00
00
00
Me
tric
To
ns
Gas
oli
ne
Re
cove
red
, mt
0.00
8187
720.
0081
8772
0.00
8187
720.
0081
8772
0.00
8187
720.
0081
8772
0.00
8187
720.
0081
8772
0.00
8187
720.
0081
8772
An
nu
al C
red
it f
or
Re
cove
red
Gas
oli
ne
81.8
81.8
81.8
81.8
81.8
81.8
81.8
81.8
81.8
81.8
Ne
t C
ost
to
Ve
hic
le O
wn
er
(Co
st+C
red
it),
RM
B/v
eh
-218
.281
.881
.881
.881
.881
.881
.881
.881
.881
.831
9.0
RM
B/v
eh
Ne
t C
on
tro
l Co
st, R
MB
/mt
VO
C-2
6,64
9.5
9,99
0.7
9,99
0.7
9,99
0.7
9,99
0.7
9,99
0.7
9,99
0.7
9,99
0.7
9,99
0.7
9,99
0.7
3,89
6.6
RM
B/m
t
Ne
t C
on
tro
l Co
st, R
MB
/mt
VO
C
Tota
l Ve
hic
le In
vest
me
nt,
RM
B-4
200
00
00
00
00
Me
tric
To
ns
Gas
oli
ne
Re
cove
red
, mt
0.00
8860
293
0.00
8860
293
0.00
8860
293
0.00
8860
293
0.00
8860
293
0.00
8860
293
0.00
8860
293
0.00
8860
293
0.00
8860
293
0.00
8860
293
An
nu
al C
red
it f
or
Re
cove
red
Gas
oli
ne
88.5
88.5
88.5
88.5
88.5
88.5
88.5
88.5
88.5
88.5
Ne
t C
ost
to
Ve
hic
le O
wn
er
(Co
st+C
red
it),
RM
B/v
eh
-331
.588
.588
.588
.588
.588
.588
.588
.588
.588
.525
5.3
RM
B/v
eh
Ne
t C
on
tro
l Co
st, R
MB
/mt
VO
C-3
7,41
1.8
9,99
0.7
9,99
0.7
9,99
0.7
9,99
0.7
9,99
0.7
9,99
0.7
9,99
0.7
9,99
0.7
9,99
0.7
2,88
1.3
RM
B/m
t
NP
V S
avin
gsN
PV
Sav
ings
fro
m
Pe
r V
eh
icle
Co
ntr
oll
ing
VO
Cs
Sum
mar
y(R
MB
/ve
hic
le)
(RM
B/m
t V
OC
co
ntr
oll
ed
)
Cu
rre
nt
24-h
r +
100%
Sta
ge II
-193
.9-9
,401
Cu
rre
nt
24-h
r +
OR
VR
332.
44,
839.
7
48-h
r +
OR
VR
+ R
un
nin
g Lo
ss31
9.0
3,89
6.6
LEV
III +
OR
VR
255.
32,
881.
3
Fi
gu
re 4
-A.
Co
st-B
enef
it R
esu
lts
An
aly
sis
Res
ult
s M
atr
ix

Page 34 of 45
Figure 4-B. NPV Cost-Benefit Results for Stage II and Advanced Evaporative Control Options
5. ORVR and Stage II can operate together to maximize refueling control without regulated community
confusion.
ORVR and Stage II gasoline refueling vapor recovery can operate together, but the overall effectiveness of
ORVR can be affected by Stage II to a small degree unless precautions are taken to limit the amount of pure air
returned to the underground storage tank (UST) or to treat the vent-stack emissions using Stage III post-
processors, such as those now used in Beijing. The issue is that when a conventional Stage II system, without
a post-processor, is used to refuel an ORVR-equipped vehicle, the Stage II system draws in pure air rather than
a mixture of air and gasoline vapors. Even with Stage II, the ORVR system maintains 98% control efficiency at
the vehicle, and no vapors escape through the filler neck to be ingested by the Stage II system. When pure air
is pumped into the UST from the Stage II system, the vapors in the UST headspace are diluted below saturation
levels, causing gasoline to evaporate. As vapor volume is produced during evaporation, the UST pressurizes
and releases gasoline vapors to the atmosphere from the vent stack. Since vapors are released from the vent
stack, these emissions negatively affect the net (or overall) efficiency of ORVR refueling control, and the effect
is proportional to the percentage of ORVR vehicles in the fleet, according to the fourth column of Table 5-1.
There are two methods by which Stage II systems can be made completely ORVR compatible and the net 98%
ORVR refueling control efficiency can be maintained. But even if a conventional Stage II system is used in
combination with ORVR, net ORVR efficiency will be reduced to only 90%, at worst when ORVR penetration
reaches 100%. The methods available to provide ORVR compatibility are discussed below.
The first method is to replace the conventional Stage II nozzles with ORVR-compatible refueling nozzles at the
gas pump. These nozzles mechanically (not electronically) sense an induced vacuum when an ORVR-equipped
vehicle is being refueled, and they cut-off the flow of air into the UST. These nozzles are sold for the California
market by a number of manufacturers, including:
o Franklin Fueling Systems – Models 800-02G3 FS and 800-02G3 SS nozzles certified in California in
combination with the VP1000 Series Vacuum Pump (see
http://www.franklinfueling.com/americas/en/800-series-orvr#Highlights)
o OPW – Model 21GV-0400 Accuflo nozzle to replace any existing nozzle without any change to the
dispenser (see http://www.opwglobal.com/Product.aspx?pid=474).
o Healy – Healy 800 Series ORVR Nozzle. Converts any new or existing dispenser to a California Air

Page 35 of 45
Resources Board (CARB) certified system for ORVR compatibility (see
http://erlingsales.com/Store/nozzles-breakaways-and-swivels/nozzles/healy800.html).
The second method to obtain ORVR compatibility is to install Stage III (sometimes called “back-end”) post-
processors onto the vent stack to control pressure in the UST by treating the vapors released through the vent
stack. These Stage III systems are common at gas stations in Beijing. About one-third of Beijing’s gas stations
are already ORVR compatible, so no changes to the refueling nozzles at these stations are necessary.
Figure 5-A graphically shows how overall fleet refueling efficiency is affected by the percentage of ORVR
vehicles in the fleet for three conditions:
(1) Conventional Stage II systems that are not ORVR compatible (blue line on the graph);
(2) ORVR only, without Stage II installed in any gas stations (red line on the graph), and
(3) ORVR-Compatible Stage II systems, with ORVR compatible nozzles and/or Stage III processors
(green line on the graph).
A Stage II efficiency of 70% is assumed (see dashed reference line on the graph), based on the estimate used
by the US EPA and California (via CARB) in their inventory estimates. The graph shows that the maximum
refueling control is achieved when using ORVR-compatible Stage II in combination with ORVR, because the
refueling control efficiency increases linearly from 70% to 98% as ORVR becomes fully implemented. This
best-case condition would be the case for Beijing if ORVR was implemented and Stage III processors were
installed at all gas stations.
Table 5-1. Overall Refueling Control Efficiency for ORVR using Conventional and ORVR-Compatible Stage II Systems
Percentage of ORVR Vehicles
in the Fleet (%)
Refueling Control Efficiency for ORVR at
the Vehicle (%)
Conventional Stage II System without Stage III (or Back-End) Processor
ORVR Compatible Stage II System and/or Conventional Stage II System with Stage III (Back-End) Processor
Vent Stack Emissions Net Effect on Overall
Refueling Control (%)
Net Refueling Efficiency for
ORVR Vehicles (%)
Vent Stack Emissions Net
Effect on Overall Refueling Control
(%)
Net Refueling Efficiency for
ORVR Vehicles (%)
0% 98% 0% 98% 0% 98%
25% 98% -2% 96% 0% 98%
50% 98% -4% 94% 0% 98%
75% 98% -6% 92% 0% 98%
100% 98% -8% 90% 0% 98%

Page 36 of 45
When ORVR is combined with conventional Stage II gasoline refueling vapor recovery systems, the net benefit
is better than either ORVR or Stage II alone, until ORVR fleet penetration reaches the point of “Widespread
Use.” So, as soon as ORVR is implemented in combination with Stage II, a net reduction in VOCs will be
received, not including the even greater benefit ORVR would provide in also reducing hot soak, running loss,
and diurnal emissions. At the point of Widespread Use, net refueling control efficiency is better without Stage
II, because of the creation of vent stack emissions. The US reached this point in 2013, and Stage II is being
phased out of all states except California. Table 5-2 provides a summary of the US states that require or
required Stage II, the number of GDFs in those states equipped with Stage II, and the program status (i.e.
maintained, phasing out, or eliminated) as of March 2014. In the US, a total of 49,485 GDFs were equipped
with Stage II, which accounted for almost 40% of the total gasoline throughput. Assuming that California will
be the only state that will maintain Stage II, the number of GDFs with Stage II will be reduced to 11,707. This
data was courtesy of the US EPA.
Further, both ORVR and Stage II gasoline refueling vapor recovery can be required simultaneously and
problematic confusion of the regulated community can be avoided. As shown above, for a number of years
after the introduction of ORVR, a combined ORVR-Stage II solution results in a lower amount of refueling
emissions than either Stage II or ORVR alone. The amount of time that the symbiotic relationship exists is
extended if ORVR-compatible nozzles and/or Stage III post-processors are utilized. Regulatory confusion and
any concern for wastefulness can be avoided if the ORVR or Stage II requirement is amended to state that
Stage II is only necessary until ORVR reaches widespread use. Until widespread use is attained, the rollout and
compliance enforcement of Stage II should continue at its current pace. The precedent for this approach was
established in the United States as discussed above.
0%
10%
20%
30%
40%
50%
60%
70%
80%
90%
100%
0%
10
%
20
%
30
%
40
%
50
%
60
%
70
%
80
%
90
%
10
0%
Fle
et
Re
fue
ling
Re
cove
ry E
ffic
ien
cy (
%)
ORVR Penetration into Fleet (%)
Conventional Stage II (not ORVR compatible) + ORVR ORVR Only
Compatible Stage II + ORVR
Stage II Efficiency Line
Emissions lost due to incompatibility by conventional Stage II nozzles
Benefit from ORVR Point of "Widespread Use" and best to phase out Stage II with conventional nozzles
Case for Beijing, because Stage III is already installed
Figure 5-A. Overall refueling control efficiency as a function of the percentage of ORVR
vehicles in the fleet.

Page 37 of 45
Table 5-2. Status of US Stage II Program
State Number of GDFs with Stage II
% of Total US Gasoline Consumption
Stage II Program Status
Connecticut 1780 1.06% Eliminated
Delaware 380 0.31% Phasing out
Washington DC 159 0.13% Phasing out
Maryland 1539 1.62% Phasing out
Massachusetts 3205 1.92% Eliminated
New Hampshire 440 0.30% Eliminated
New Jersey 3128 2.60% Phasing out
New York 3200 2.43% Phasing out
Pennsylvania 1573 1.50% Phasing out
Rhode Island 514 0.31% Phasing out
Vermont 332 0.36% Eliminated
Virginia 1109 1.05% Phasing out
Maine 120 0.19% Eliminated
Arizona 984 1.08% Phasing out
California 11707 11.14% Maintained
Georgia 2221 1.68% Phasing out
Illinois 2418 1.68% Phasing out
Indiana 655 0.29% Phasing out
Louisiana 463 0.22% Phasing out
Missouri 875 0.78% Phasing out
Texas 6392 3.74% Phasing out
Wisconsin 880 0.66% Phasing out
Kentucky 402 0.38% Phasing out
Nevada 763 0.54% Phasing out
Ohio 1907 1.64% Phasing out
Oregon 263 0.43% Pending
Tennessee 750 0.49% Phasing out
Washington 1326 1.32% Pending
TOTAL 49,485 39.58%
Summary
ORVR and Stage II vapor recovery can operate together, but the overall effectiveness of ORVR can be affected
by Stage II to a small degree unless precautions are taken to limit the amount of pure air returned to the
underground storage tank (UST) or to treat the vent-stack emissions using Stage III post-processors, such as
those now used in Beijing. Nonetheless, adverse effect of Stage II on ORVR are minor, and no retrofits to Stage
II are really necessary when implementing ORVR.
6. ORVR and other advanced evaporative controls can be placed on all vehicles in the fleet,
including micro cars and micro vans.
ORVR and other advanced evaporative controls can be cost-effectively engineered onto any light-duty vehicle,
and it is a fallacy for anyone to suggest otherwise. It must be noted that every vehicle, including micro cars,

Page 38 of 45
are presently required in China to have evaporative controls on them to meet the Type IV diurnal
requirements. Installing advanced evaporative controls only means making the presently
installed/implemented evaporative controls more effective. The constraints that affect the design of the
systems include: (1) designing an additional 1-1.5 liters of space for the canister onto the vehicle; and (2)
designing a filler-pipe that will prevent vapors from escaping. If the automakers are given adequate time to
make design changes and procure parts, these constraints will pose no problems.
Like China, very small micro cars are sold in the US. These US micro cars must meet the same safety and
emissions requirements as larger vehicles, and several automakers have successfully designed, certified, and
sold micro cars in the US. Table 6-1 provides details on the four vehicles that the US EPA considers micro cars.
These vehicles include the Smart forTwo, Mini Cooper, Scion IQ, and Fiat 500. Photographs of these vehicles
are provided in Figure 6-A. These vehicles are as small as any vehicle sold in China, and they are all certified to
the US Tier 2 and ORVR standards. As can be seen in the table, these vehicles have canister volumes ranging
from 1.4 to 2.2 liters, and obviously sufficient room was found on the vehicle and still maintain substantial
interior and tank volume. There is no reason that that the same engineering could be applied to Chinese
vehicles.
Chinese micro-vans can also be equipped with ORVR. ORVR has already been engineered and applied on the
ChangAn micro-van as a means to control large vapor emissions from methanol-containing fuels used in the
region where these vehicles are sold. Figure 6-B shows the layout of the ORVR system on these vehicles.
If designing a filler pipe to produce a liquid seal and provide suitable refueling capability becomes an issue, a
mechanical seal can be used in place of a liquid seal. Although the use of a mechanical seal is very rare in the
US, its incorporation on a vehicle accomplishes two things: (1) the filler pipe can be dropped to the level of the
fuel tank; and (2) it reduces the needed canister capacity and volume by about 20%, because air entrainment,
during refueling, is reduced to zero. Both of these accomplishments reduce the size of the ORVR system
substantially without compromising functionality.
Table 6-1. Details of Micro-Cars and Canisters in US, certified to Tier 2 and ORVR Standards
US Micro-Car Passenger Volume
Tank Volume Engine Displacement
Fuel Economy Canister Butane Working Capacity
Canister Volume
Smart ForTwo
1.29 m3 32.9 L 1.0 L 6.52 L/100 km
85 g ~1.4 L
Mini Cooper 2.09 m3 50.0 L 1.6 L 7.34 L/100 km
130 g ~2.2 L
Scion IQ 2.09 m3 32.2 L 1.3 L 6.35 L/100 km
85 g ~1.4 L
Fiat 500 2.15 m3 39.7 L 1.4 L 6.91 L/100 km
100 g 1.7 L

Page 39 of 45
Figure 6-A. US Micro-Cars certified to US Tier 2 and ORVR standards (upper left-
SmartforTwo; upper right: Mini Cooper; lower left: Scion IQ; and lower right: Fiat 500).
Figure 6-B. Layout of ORVR system on Chinese Micro-van.

Page 40 of 45
Summary
ORVR and other advanced evaporative controls can be cost-effectively engineered onto any light-duty vehicle,
including micro cars and micro vans. It must be noted that every vehicle, including micro cars, are presently
required in China and elsewhere to have evaporative controls to meet the Type IV diurnal requirements.
Installing advanced evaporative controls only mean making the presently installed/implemented evaporative
controls more effective. The constraints that affect the design of the systems include: (1) designing an
additional 1-1.5 liters of space for the canister onto the vehicle; and (2) designing a filler-pipe that will prevent
vapors from escaping. If the automakers are given adequate time to make design changes and procure parts,
these constraints will pose no problems. The ChangAn micro-van has already been commercialized with ORVR
to address issues with the use of high volatility methanol-containing fuels in the region in China in which this
vehicle is sold.
7. Without early action to implement enhanced evaporative emissions controls such as ORVR,
Stage II refueling emissions controls currently are the only, and costly and limited, option to address
existing/pre-ORVR vehicle fleets; Stage II is not a substitute for enhanced evaporative emissions controls
such as ORVR; Stage II alone without ORVR will not adequately minimize the enormous air pollution burdens
associated with projected 3 million metric tons of evaporative emissions over the next ten years.
In the past, China has aligned with European light-duty vehicle emissions regulations. This approach lacked the
benefit of a full understanding of the environmental consequences from its own unique circumstances,
including a high gasoline vehicle-fleet percentage, warmer climate, and high level of SOAs and ozone in its mix
of smog and haze components. As the Chinese vehicle population continues growing at a remarkable pace,
the Chinese environment is bearing the consequence of these past policy approaches. As shown in Figure 3-A,
the Chinese vehicle population has rapidly grown from 50 million gasoline vehicles in 2010 to over 100 million
today, and evaporative emissions now exceed 1 million mt/year. The Chinese gasoline vehicle population is
expected to continue quickly growing and will reach almost 300 million in the next ten years. Evaporative
emissions will climb to over 3 million metric tons per year over this time period unless evaporative control
regulatory measures are taken.
The issue is that it is likely that ORVR, 48-hour diurnal requirements, and running loss standards could not be
implemented in China any sooner than 2017 or 2018 -- the same time at which we understand that the Beijing
EPB currently plans to publish new evaporative emissions standards, including ORVR. By this time, the gasoline
vehicle population will have reached about 150 million. There are no vehicle-based retrofit technologies
offered to reduce evaporative emissions. This means that the 150 million pre-2018 cars in the fleet will be
generating about 1.5 million metric tons of evaporative emissions until they are taken out of service, which
could be as late as 2033. This is where the limited though costly benefit of Stage II is realized. As expensive
and limited in reducing evaporative emissions as Stage II is, it is the only option for reducing any evaporative
emissions from the existing fleet of vehicles with the current inefficient, non-advanced evaporative controls.
To get substantial reductions, ORVR and advanced evaporative controls are necessary.
It can be seen, in fact, that the efficacy of fleet refueling emission controls is maximized for many years when
Stage II is used in combination with ORVR. Figure 7-A shows a comparison of refueling emissions for four (4)
scenarios of varying refueling controls:

Page 41 of 45
Scenario 1: No Stage II or ORVR. This is the uncontrolled scenario to provide a base-case to determine
the effectiveness of a control option.
Scenario 2: 100% Stage II Only. In this case, Stage II implementation reaches 100% in 2018.
Scenario 3: ORVR Only. In this case, ORVR is required on new vehicles, beginning in 2018
Scenario 4: 100% Stage II + ORVR. In this case, Stage II implementation reaches 100% in 2018. At the
same time, ORVR is also required on new vehicles, beginning in 2018.
Figure 7-A shows that in 2018, Stage II can provide about 200,000 mt/year of immediate short-term refueling
emissions reductions relative to the ORVR-only case. This combined approach is the strategy that was taken in
the US, where Stage II gasoline refueling vapor controls were mandated in the early 1990s then followed by
ORVR in 1998. Because of the high cost of Stage II and difficulty in enforcing compliance, however, the US EPA
only strategically required Stage II in geographical areas that were experiencing moderate to severe pollution.
Stage II was required on about 47,000 of the ~170,000 GDFs that existed in the US, and this was done to
minimize refueling emissions until ORVR provided sufficient control on its own. The fact was, Stage II never
sufficiently reduced evaporative emissions on its own, but essentially served as minimum starting point for
evaporative emissions control.
As mentioned previously in this report, what cannot be forgotten is that Stage II is not a substitute for
advanced evaporative controls, including ORVR. The reason is that refueling emissions account for only about
20% of the total evaporative emissions that are coming from gasoline vehicles in China. Running loss and
diurnal emissions also dominate the mix of evaporative emissions, and the only way to reduce these is by
Figure 7-A. Comparison of refueling emissions inventory with combinations of ORVR and Stage II. The lowest projected emissions result from combining ORVR with Stage II.

Page 42 of 45
adding ORVR and a combination of other advanced diurnal and running loss controls. At the same time,
Chinese regulators should not consider that combining Stage II with ORVR wasteful, either. It is critical that
VOC emissions be controlled to reduce PM2.5 and substantially cut haze, and the best way to minimize these
emissions is to combine ORVR with Stage II.
If China wants both immediate and long-term VOC reductions, the ideal means to obtain these reductions will
be by adding a 48-hour diurnal requirement with a low diurnal standard and shortened drive cycle, a running
loss test procedure, and ORVR. As Figure 7-B shows, refueling emissions represent only about 20% of the
evaporative emissions inventory. Even if Stage II is fully implemented nationwide, it will provide less than a
15% reduction in total VOCs. This is a significant figure, because the inventory is so large and growing rapidly
but negligible compared to the non-refueling evaporative emissions (see Figure 7-B(b)). If ORVR is added, the
inventory can be quickly stabilized, because both refueling and non-refueling emissions are affected (see
Figure 7-B(c)). To achieve major reductions, both short term and long-term, advanced evaporative
requirements in combination with ORVR will reduce emissions in a very short period of time and bring the
inventory down to 50% of present levels by 2035. Again, it is critical that advanced evaporative controls be
implemented quickly, because emissions will become overwhelming with the rapid vehicle growth.
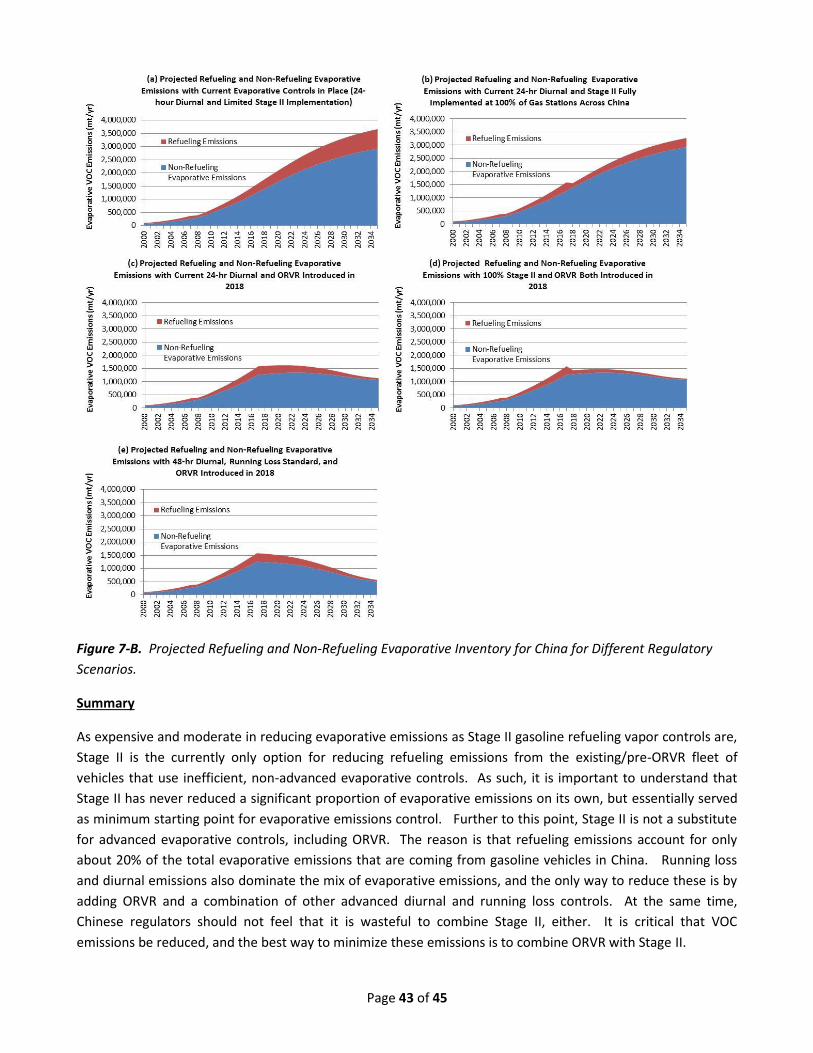
Page 43 of 45
Figure 7-B. Projected Refueling and Non-Refueling Evaporative Inventory for China for Different Regulatory
Scenarios.
Summary
As expensive and moderate in reducing evaporative emissions as Stage II gasoline refueling vapor controls are,
Stage II is the currently only option for reducing refueling emissions from the existing/pre-ORVR fleet of
vehicles that use inefficient, non-advanced evaporative controls. As such, it is important to understand that
Stage II has never reduced a significant proportion of evaporative emissions on its own, but essentially served
as minimum starting point for evaporative emissions control. Further to this point, Stage II is not a substitute
for advanced evaporative controls, including ORVR. The reason is that refueling emissions account for only
about 20% of the total evaporative emissions that are coming from gasoline vehicles in China. Running loss
and diurnal emissions also dominate the mix of evaporative emissions, and the only way to reduce these is by
adding ORVR and a combination of other advanced diurnal and running loss controls. At the same time,
Chinese regulators should not feel that it is wasteful to combine Stage II, either. It is critical that VOC
emissions be reduced, and the best way to minimize these emissions is to combine ORVR with Stage II.

Page 44 of 45
8. ORVR technology design, manufacturing, and related services do not involve a small number
of companies. Indeed, implementation of ORVR and related applications would benefit quite broad range of
companies including Chinese domestic companies
ORVR is a refueling standard that requires the gasoline vapors are contained on the vehicle to the extent that
less than 0.05 grams of vapors emit for each liter of fuel dispensed during an entire refueling event. ORVR
does not specify how meeting this standard is accomplished, but the common approach used by all
automakers in the US market, because of low cost and ease of implementation, is to add capacity to the
existing diurnal emissions canister and reroute the tank venting system. Assuming the same approach would
be taken in China, a broad range of Chinese domestic and multinational suppliers would benefit from the
added vehicle content.
Companies that manufacture tank venting and anti-spit-back valves would increase their content on the
vehicle. Vapor hose suppliers would be able to supply a larger diameter hose. The large number of canister
manufacturers would supply a larger canister, which would require more plastic (polypropylene, nylon, and
polyethylene), springs, filter materials, and activated carbon. These Tier II and Tier III sub-suppliers would
benefit as well. Moreover, the number of purge valve manufacturers would likely supply a higher-flow version
of their valves. Fuel tank, filler-pipe, and fuel-cap manufacturers would continue to supply their products, but
with small modifications. So, the additional 36-210 RMB of vehicle content would be spread out over a large
number of suppliers. Fuel economy improvements of 0.5-1% would directly benefit the vehicle owner and
greatly offset their initial investment in the control at the time of vehicle purchase. The reduction in VOC
emissions would result in reduced urban haze (i.e. more blue sky days), reduced PM2.5, and reduced ozone –
all of which have economic and social value. The beneficiaries of ORVR would be widespread.
According to the Office of Transportation and Air Quality and Office of Air and Radiation at the US EPA, an
average driver can expect to save as much as 150-180 RMB per year in gasoline per year with ORVR at a cost of
36 RMB to the manufacturer.13 Automotive manufacturers report in China that their costs could be as high as
210 RMB. Ultimately, the vehicle purchaser bears the added cost of the control, and they clearly benefit
economically with the investment in the control. There is a larger economic and social benefit that comes with
the improvement to air quality, as well.
9. VOC emissions from LDVs contribute a significant portion of total VOC emissions and
therefore should be prioritized for control together with stationary VOC emission sources such as
petrochemical facilities.
Urban air quality – including haze, PM2.5, and ozone – is a major concern in China, and VOCs are major
contributors to this problem. Almost 90% of VOC emissions are converted into SOA, and these SOAs account
for about 47% of haze and 20-30% of total PM2.5. VOCs also react with NOx to generate ozone. Light-duty
vehicles (LDV) are concentrated in urban centers, and this LDV fleet is a large and growing single contributor of
VOCs. The Beijing EPB and Tsinghua University estimate that the LDV fleet now accounts for over 38%-60% of
VOC emissions in Beijing, but lower figures do not fully account for evaporative emissions. The Shanghai EPB
estimates that vehicle exhaust accounts for 12% of VOCs, which suggests that including evaporative emissions
would increase to about 40% of the inventory because evaporative emissions are five to ten times higher than
exhaust emissions. The LDV VOC inventory is growing with the vehicle population, and adding advanced
13
See http://www.haldemanfordkutztown.com/Onboard-Refueling-Vapor-Recovery/.

Page 45 of 45
evaporative emissions controls, such as ORVR, is the only way to decrease evaporative VOC emissions yet
allow the vehicle population to continue growing.
Point source (such as petrochemical facility) reductions can also reduce the total VOC inventory for China, but
point-source facilities are generally located outside of city centers, and emissions from these facilities are
increasing at a slower rate than for evaporative emissions. The vehicle population is growing at a rate of 15%
per year, and evaporative emissions are growing at that rate as well. The research and testing results
supporting evaporative controls are thorough and complete. The economics associated with evaporative
controls demonstrate that the value of gasoline recovered is three times the cost of the controls, Additionally,
the evaporative controls for vehicles could be implemented quickly. Since vehicles are in the fleet for 10-15
years with no means to retrofit and reduce evaporative emissions, it would be disappointing if China invested
billions of dollars in point source controls but the haze problem continued to stay the same or grow worse in
the cities. China needs to quickly address evaporative emissions from the growing LDV fleet.