Reducing agency conflict between bank stakeholders: the ... · Reducing agency conflict between...
55
1 Reducing agency conflict between bank stakeholders: the role of minority directors Thierno Amadou Barry a , Laetitia Lepetit a , Frank Strobel b , Thu Ha Tran a 1 a Université de Limoges, LAPE, 5 rue Félix Eboué, 87031 Limoges Cedex, France b University of Birmingham, Department of Economics, Birmingham, UK This draft: 2 June, 2017 Abstract We examine for a panel of European banks whether having a board structure that includes directors that are related to minority shareholders is effective in limiting expropriation by insiders, but also prevents excessive risk taking. We find that the inclusion of such minority directors increases bank board effectiveness for both controlled and widely held banks as it reduces the probability of default and results in higher market valuations. However, the inclusion of such directors is more likely to be successful if bank-level governance is accompanied by a strict supervisory regime. JEL Classification: G21, G28, G32 Keywords: Ownership structure, agency conflicts, minority directors, European banking, regulation 1 Corresponding authors: (T.H. Tran: [email protected]; L. Lepetit: [email protected]).
-
Upload
truongthuy -
Category
Documents
-
view
216 -
download
0
Transcript of Reducing agency conflict between bank stakeholders: the ... · Reducing agency conflict between...
1
Reducing agency conflict between bank stakeholders: the role of
minority directors
Thierno Amadou Barrya, Laetitia Lepetita, Frank Strobelb, Thu Ha Trana 1
a Université de Limoges, LAPE, 5 rue Félix Eboué, 87031 Limoges Cedex, France
b University of Birmingham, Department of Economics, Birmingham, UK
This draft: 2 June, 2017
Abstract
We examine for a panel of European banks whether having a board structure that includes
directors that are related to minority shareholders is effective in limiting expropriation by
insiders, but also prevents excessive risk taking. We find that the inclusion of such minority
directors increases bank board effectiveness for both controlled and widely held banks as it
reduces the probability of default and results in higher market valuations. However, the
inclusion of such directors is more likely to be successful if bank-level governance is
accompanied by a strict supervisory regime.
JEL Classification: G21, G28, G32
Keywords: Ownership structure, agency conflicts, minority directors, European banking,
regulation
1 Corresponding authors: (T.H. Tran: [email protected]; L. Lepetit: [email protected]).
2
1. Introduction
Failure of a variety of internal governance mechanisms has been highlighted as a major
contributing factor to the 2007–2008 financial crisis (Kirkpatrick, 2009; Basel Committee on
Banking Supervision, 2010; Board of Governors of the Federal Reserve System, 2010). Corporate
governance, and board oversight in particular, are essential in addressing agency problems and
controlling risk within the firm; hence, several international reform initiatives regarding the
corporate governance of banks are underway. The Basel Committee on Banking Supervision
(2015) indicates in particular that “the primary objective of bank corporate governance should be
safeguarding stakeholders’ interest in conformity with public interest on a sustainable basis.
Among stakeholders, shareholders’ interest would be secondary to depositors’ interest”. This is in
line with the OECD (2010) and European Union (2010) recommendations that corporate
governance of banks should have multi-faceted objectives of enhancing welfare, not only of
shareholders, but also of depositors and regulators, and society more widely. In this paper, we
query what forms of corporate governance in banks could help attain the most efficient outcome
for society in terms of both performance and financial stability. We examine in particular whether
calls made by several European countries to create a new type of board of directors, one
accountable to minority shareholders, are an effective way of achieving these objectives.
Financial firms, and banks in particular, are different from nonfinancial firms, due to their
specific regulation, capital structure (i.e. deposit funding with high leverage), and their inherent
complexity and opacity. Debtholders such as depositors cannot easily prevent bank shareholders
from pursuing more risk, as issuing ‘complete’ debt contracts is generally impossible due to high
information asymmetry (Dewatripont and Tirole, 1994). As a consequence, bank shareholders
have strong incentives to favor ‘excessively’ risky investments, with potential losses largely
shifted to the deposit insurer and/or taxpayers (Galai and Masulis, 1976; Jensen and Meckling,
1976; Merton, 1977). As the traditional corporate governance approach focuses only on the
interests of shareholders, it largely abstracts from these features. This insufficiency can explain
why the proposals drawn up by the Basel Committee (2010, 2015), OECD (2010) and the
European Union (2010) refer to multiple objectives for bank corporate governance.
Strong corporate governance is supposed to encourage insiders to act in the best interest of all
shareholders and other stake-holders (Shleifer & Vishny, 1997). However for banks, tight
regulation combined with restrictions on bank entry and activities limits the effectiveness of many
mechanisms intended to address corporate governance problems (Billett et al., 1998; Levine,
2004). Furthermore, external governance mechanisms such as takeovers hardly exist in banking,

3
unlike in other industries (Prowse, 1997; Levine, 2004). All combined, these elements strengthen
the important role for more effective monitoring by boards of directors in the banking sector (Basel
Committee on Banking Supervision, 2006).
How effective a board is in monitoring bank insiders, and limiting their opportunistic behavior,
depends on its setup and also on the ownership structure of the bank. Apart from the agency
conflict between shareholders and debtholders, the agency conflict arising between insiders and
minority shareholders is different when banks have dispersed or concentrated ownership structure.
In banks with a dispersed ownership structure, the agency conflict is between managers and
dispersed (minority) shareholders, as managers have incentives to maximize their own benefits at
the cost of shareholders, while dispersed shareholders do not have incentives to monitor managers
(Shleifer and Vishny, 1997). In banks with concentrated ownership, the conflict of interest is
between controlling and minority shareholders. Controlling shareholders might have the incentives
and ability to monitor managers to make decisions that increase overall shareholder value and
thereby benefit all shareholders (Jensen and Meckling, 1976; Shleifer and Vishny, 1986). On the
other hand, controlling shareholders may also be tempted to reap private benefits of control
through diversion of assets and profits outside of the firm (Johnson et al., 2000). Internal corporate
governance mechanisms are less well suited to limiting such agency problems as controlling
shareholders elect representatives to the board of directors that will represent their interests.
Some jurisdictions in Europe where concentrated ownership structure is prevalent, such as Italy
and Spain, have created a new type of board director in their Corporate Governance Code which
is nominated by, or at least linked to, minority shareholders. These directors, being related to
minority shareholders, should be effective in reducing the occurrence of value being expropriated
from minority shareholders in firms with concentrated ownership structures, as they are not
appointed by controlling shareholders. While the presence of such minority directors might lead
potentially to an increase in firm value more generally, if it is an effective way to curtail agency
problems between controlling and minority shareholders, for banking firms it might also intensify
the agency conflict arising between shareholders and debtholders/regulators. The presence of
minority directors that are related to minority shareholders, who have fewer shares and might have
a more short term focus, could lead to greater risk-taking in banks with concentrated ownership
structure if their risk appetite is higher than that of controlling shareholders. Furthermore, in banks
with dispersed ownership structure, the presence of directors that are independent from managers
but related to shareholders could lead to greater risk-taking as their outlook will be more
shareholder focused than that of generally more risk-averse managers.

4
The institutional and regulatory environment in place may further affect the ability and
incentives of minority directors to effectively monitor insiders. Firstly, strict banking supervision
might provide incentives to minority directors to soundly and effectively monitor insiders, as
regulators may fine or dismiss bank directors without trial or hearing in such an environment. In
addition, the effectiveness of minority directors’ monitoring might depend crucially on the quality
of the country-level governance, which includes the law protecting minority shareholders and the
institutions that enforce the law.
The existing theoretical and empirical literature examines the impact of director independence
on firm performance without allowing for the fact that some of those directors may in fact be
related to minority shareholders. Mixed results are provided on whether there is in fact effective
monitoring by independent directors. The majority of prior empirical papers, mostly focusing on
listed US firms generally characterized by a dispersed ownership structure, point to the
contribution of independent directors to firm performance being either insignificant (e.g.
MacAvoy et al. 1983; Bhagat and Black, 1999, 2002 and, more specifically, Adams and Mehran,
2012; Aebi et al., 2012; Minton et al. 2014 for banks) or even negative (e.g. Agrawal and Knoeber,
1996 for nonfinancial firms and Pathan and Faff, 2013, and Andres and Vallelado 2008 for banks).
An exception is Dahya et al. (2008) who find a positive relationship between the fraction of
independent directors and Tobin’s Q in the case of nonfinancial firms with a concentrated
ownership structure, especially in countries with weak legal protection of minority shareholders.
Several theoretical explanations could be advanced to underpin these conflicting findings. Fama
and Jensen (1983) argued that independent directors have incentives to monitor insiders, as this
may strengthen their reputation of effective and independent decision making. These independent
directors can therefore monitor the insiders on behalf of minority shareholders and play an
important role in limiting extraction of private benefits, potentially leading to an increase in firm
value (Bhagat and Black, 2002; Hermalin and Weisbach, 2003; Dyck and Zingales, 2004; Adams
and Ferreira, 2007, Adams et al. 2008). However, several factors may also limit the effectiveness
of independent directors. Their independence might e.g. be compromised by the fact that they are
appointed by insiders, or alternatively by “independent” nomination committees which may in turn
depend on insiders. Independent directors may therefore avoid actions that could encourage
insiders to replace them, although reputation and human capital arguments may limit this effect
(Fama and Jensen, 1983). A further complication may arise through the fact that insiders may be
reluctant to provide relevant inside information to independent directors, limiting their scope for
exercising effective governance (Adams and Ferreira, 2007; Kumar and Sivaramakrishnan, 2008;
Harris and Raviv, 2008). These different elements may make it difficult for insiders to credibly

5
commit to outsiders through the appointment of independent directors. The presence of directors
nominated by or at least linked to minority shareholders might be seen as a way to resolve these
different problems, but might also be accompanied by either lower or higher default risk in the
case of banking firms, as outlined above. These different potential impacts of the presence of
minority directors on performance and risk-taking behavior have not been examined on theoretical
or empirical levels to date. Furthermore, most of the empirical research on the corporate
governance of banks adopts the traditional corporate governance approach and hence ignores the
interests of other stakeholders. However, as the main goal of shareholders is to increase share
value, this might invariably be in conflict with the principal aim of debtholders and regulators to
reduce excessive risk taking.
Our paper thus aims to complement the literature on corporate governance mechanisms in banks
addressing agency problems between stakeholders, by examining in detail the potential role played
by minority directors, which are considered as independent from insiders but are in fact related to
minority shareholders. This will allow us to determine whether there are advantages for the
different stakeholders in having a board structure of banks that includes such minority directors,
in the sense that it can be effective in limiting expropriation of minority shareholders by insiders
without increasing excessive risk taking by banks. A bank board could then be considered “strong”
both from the perspective of minority shareholders as well as for debtholders and regulators if the
inclusion of such minority directors can increase a bank’s market valuation without necessarily
impacting its probability of default. We pay particular attention to the fact that the interplay of
agency problems concerned varies significantly depending on whether banks are widely held or
have controlling shareholders, and is generally also heavily influenced by the institutional and
regulatory environment in place.
For our investigation of whether the presence of minority directors in bank board is effective
for reducing agency conflicts between the different stakeholders, we use a novel data set on the
ultimate ownership structure and board composition of a sample of 118 listed European banks. We
find that the presence of minority directors in European banks’ boards is important, as they
represent on average around 18% of board members in controlled banks and 13% in widely held
banks. Most of these minority directors are related to shareholders through being employed by one
of them. Our results show that the presence of minority directors within boards is effective to
curtail the agency conflict either between insiders and outside shareholders, and between
shareholders and debtholders, for both controlled and widely held banks. Deeper investigations
show that for controlled banks that the inclusion of such minority directors is more likely to be
successful in countries with strict supervisory regime. We also find that effective monitoring of
6
minority directors is less essential countries with higher levels of minority shareholder protection.
For widely held banks, our results highlight that incentives of minority directors to effectively and
soundly monitor insiders do not depend on the regulatory and institutional environment.
Our contributions to the literature are manifold: we firstly contribute to the corporate
governance literature more generally by examining what constitutes a strong board for banks. In
this, we highlight the potentially important role played by minority directors in addressing the
complex interplay of agency problems faced by the many stakeholders relevant for banks, and also
contribute to the wider discussion relating to the ownership structure of banks. We also contribute
to the literature on bank regulation through our focus on how potential novel aspects of bank
boards currently under discussion interact with the institutional and regulatory environment that
banks operate in, and their consequent impact on financial stability in general.
The remainder of the paper is organized as follows. Section 2 presents the background and the
hypotheses tested; Section 3 describes our sample, defines the ultimate ownership variables and
the indices of directors relatedness, and provides some statistics. Section 4 presents the
methodology we use to conduct our empirical investigation; Section 5 discusses our results;
Section 6 contains robustness checks; and Section 7 concludes the paper and provides relevant
policy implications.
2. Governance of banks and codes of corporate governance: key empirical issues
Self-regulatory codes designed to improve corporate governance and share best practices have
been adopted by a number of countries.2 These codes introduce standards for the role and
composition of boards of directors, information disclosure, structure and functioning of internal
committees, and remuneration of directors. The Corporate Governance Codes are usually
implemented without either independent monitoring or enforcement mechanisms, and instead
based on voluntary compliance.3 Companies choosing not to comply are required to give reasons
for the non-compliance (“comply or explain” principle). Effective adoption hence relies on firms’
concern regarding reputation and investors being able to punish companies for potential non-
2 The first code of good governance was issued by the U.S. in 1978, followed by Hong Kong in 1989, Ireland in 1991
and the United Kingdom in 1992 with the influential Cadbury report. Codes of good governance have since spread
around the world, encouraged by the World Bank and the Organization for Economic Cooperation and Development
(OECD) with its Principles of Corporate Governance published for the first time in 1999. See Aguilera and Cuervo-
Cazurra (2009) for further details. 3 Corporate Governance Code can be implemented either through mandatory (laws) or voluntary regulation. However,
mandatory is rarely used, with the exception of the 2002 Sarbanes-Oxley Act in the U.S..

7
compliance with provisions of the Code. This implies that firms within the same country can offer
varying degrees of protection to their stakeholders.
Corporate Governance Codes worldwide tend to be similar for nonfinancial and financial firms;
however, as argued above, governance of the two should ideally be differentiated as the interests
of shareholders of financial firms and those of their debtholders and regulators often do not
coincide. Despite this, it is only following the recent crisis that the Basel Committee on Banking
Supervision (2010, 2015) and the OECD (2010) recommend that corporate governance of banks
should be different from those of nonfinancial firms, with the two objectives of not only enhancing
welfare of shareholders but also of depositors/regulators.
One of the prevailing recommendations of Corporate Governance Codes is that the presence of
independent directors can be a signal of a “strong” board to curtail the agency conflict between
insiders and dispersed/minority shareholders, as independent directors should be able to effectively
control and monitor insiders.4 While independence should take different forms in firms with
dispersed or concentrated ownership structure in order to obtain a “strong” board, relevant
recommendations in Corporate Governance Codes are generally not conditional on ownership
structure. In most countries, the code only recommends that the majority of the directors shall be
independent of the company and its management board, without indicating that these directors
should be independent of managers in widely-held firms, or of controlling shareholders in firms
with concentrated ownership structure. Also, whereas criteria of independence from managers or
controlling shareholders are often defined, apart from in some countries such as Germany,
Corporate Governance Codes do not recommend that a sufficient number of board members are
independent of managers or controlling shareholders. Following best practice codes, most
companies report increasing proportions of independent directors (Linck et al. 2009), but without
indicating what the independence is relative to.
Existing empirical results are far from supporting the high expectations that policy-makers have
placed in the value of board independence. As discussed in the introduction, independent directors
might have neither the incentives nor the ability to control insiders; this is a particularly acute
problem in firms with a concentrated ownership structure. As surveyed by De Haan and Vlahu
(2016) for banks and Nguyen and Nielsen (2010) for non-financial firms, existing studies mostly
focus on listed U.S. firms which are generally characterized by a dispersed ownership structure.
4 Most codes have some recommendations on the following seven governance practices: (1) a sufficient number of
independent directors; (2) the need for board size limits; (3) a clear division of responsibilities between the chairman
and the chief executive officer; (4) the need for timely and quality information provided to the board; (5) formal and
transparent procedures for the appointment of new directors; (6) balanced and understandable financial reporting; and
(7) maintenance of a sound system of internal control.

8
Most studies find that the presence of directors independent from managers has no significant
impact on performance. To our knowledge, Dahya et al (2008) is the only previous study that
investigates the relationship between corporate value and board independence in the case of
concentrated ownership structure, for a large panel of nonfinancial firms from 22 countries; they
find that a higher proportion of the board being independent from the largest controlling
shareholder is associated with higher performance, especially in countries with weak legal
protection of shareholders. Another strand of the literature uses data on board attributes provided
by RiskMetrics through their Corporate Governance Quotient (CGQ) rating system,5 which
capture aspects related not only to board independence, but also to composition of committees,
size, transparency, and how business is conducted. While some of these studies only focus on U.S.
firms (e.g. Brown and Caylor, 2006; Aggarwal and Williamson, 2006; Aggarwal et al. 2009 for
nonfinancial firms), a few others use a worldwide sample including countries where concentrated
ownership dominates (e.g. Chhaochharia and Laeven, 2009 and Bruno and Claessens, 2010 for
nonfinancial firms; Beltratti and Stulz, 2012 for banks). They all find that a stronger CGQ index,
i.e. the presence of a “stronger” board, has a significant and positive impact on the valuation of
firms. Whereas the CGQ rating system seems adequate for widely-held firms, this is not the case
for firms with concentrated ownership structure as it does not explicitly refer to director
independence from controlling shareholders. For example, a director employed by the firm is
considered as dependent from managers, while a director employed by another firm that the
controlling shareholder owns would be inaccurately defined as independent.
The existing literature, mentioned above, that analyses the impact of board independence on
bank performance mainly focuses on the agency conflict between insiders and minority/dispersed
shareholders, ignoring the interest of depositors/regulators. Only recently, i.e. after the financial
crisis of 2007-2008, some empirical studies have considered the interests of depositors/regulators
by examining the relationship between the number of independent directors and bank risk-taking
behavior. Their findings show either no significant relationship (Erkens et al. 2012; Minton et al.,
2014), or that board independence is associated with lower risk (Pathan, 2009; Wang and Hsu,
2013; Brandão Marques and Opper, 2014). These results are in line with the hypothesis that
independent directors have incentives to control insiders to forge their reputation, as suggested by
Fama and Jensen (1983). However, all these studies only consider the independence of directors
from managers, and do not define board independence conditionally on the presence (or not) of
5 ISS and RiskMetrics have offered the corporate-governance-rating system named Corporate Governance Quotient
since 2002. Before it was acquired by RiskMetrics in 2007, its shareholder-advisory services operated independently
as Institutional Shareholder Services (ISS).
9
controlling shareholders; this applies even to Erkens et al. (2012) and Brandão Marques and Opper
(2014) who include countries other than the U.S. in their sample where concentrated ownership
structures can dominate.
As some European jurisdictions, where firms with controlling shareholders predominate even
for large publicly traded firms, recommend in their Corporate Governance Code to have some
minority directors, it is important to differentiate between directors who are independent from
insiders and those who are independent from insiders but related to minority shareholders. The
inclusion of minority directors in the board could be a way for controlling shareholders to signal
that they will refrain from expropriation. If minority shareholders perceive a lower risk of
expropriation within a bank with minority directors, the market value discount attributed to the
ability of controlling shareholders to divert corporate resources from minority shareholders to
themselves should decrease. Similarly, including minority directors in the board of widely held
banks could also curtail the agency conflicts between managers and shareholder by reducing the
agency costs associated with a separation of ownership and control. On the other hand, the
presence of minority directors could also create an additional agency conflict as non-controlling
shareholders that nominate or are at least linked to such directors could benefit from certain
degrees of decision power. However, this might not neutralize or even reverse the potential
positive effect of the presence of minority directors on market valuation. This leads us to examine
the following hypothesis:
H1: The presence of minority directors increases the market value of banks independently of their
ownership structure.
According to the Basel Committee on Banking Supervision (2015), a “strong” board for banks
should safeguard not only the interest of minority shareholders, but also those of depositors. In
banks with a concentrated ownership structure, the presence of directors that are not appointed by
controlling shareholders, but instead by minority shareholders, would lead to higher risk taking if
the risk appetite of the latter is higher, given they have fewer shares and might have more of a
short term focus. On the other hand, minority directors may have incentives to supervise and
control risk taking if a director’s reputation is important in the market for directorships, as
suggested by Fama and Jensen (1983); a good reputation might lead to being offered more board
seats. However, minority directors should have no incentive to act against the interest of minority
shareholders, especially if their connection is through being employed by one of them. Similarly,
the presence of minority directors that are related to shareholders in banks with dispersed
ownership structure could lead to greater risk-taking if they seek to maximize shareholder wealth.

10
These minority directors are after all independent from managers who may prefer less risk than
that desired by shareholders due to their non-diversifiable human capital investment in the
companies they manage (Faleye and Krishnan, 2010). We examine this issue through the following
hypothesis:
H2: The presence of minority directors increases the default risk for banks independently of their
ownership structure.
Our third hypothesis is related to the influence of the regulatory environment. In strict
supervisory systems, supervisors can issue fines against, or even dismiss, bank directors without
formal proceedings, and or mandate new board elections. As we are interested in determining
whether stronger supervisory regimes could give minority directors incentives to soundly monitor
insiders, we examine the following hypothesis:
H3: The presence of minority directors does not increases the default risk of banks located in
countries with stronger supervisory regimes.
Finally, we examine whether country-level governance, more specifically the degree of
minority shareholder protection, plays a major role in minority directors’ actions to reduce agency
conflicts between insiders and minority shareholders. The effectiveness of minority directors’
monitoring might depend crucially on the quality of any anti-self-dealing regulation. Similarly, if
minority shareholders want to nominate directors to board positions, they then need to rely on the
existence of formal legal procedures to oversee and safeguard the process, making strong minority
shareholder laws an additional complementary corporate governance mechanism. This leads to
the following hypothesis
H4a: Strong minority shareholder laws and the presence of minority directors are complementary
corporate mechanisms.
On the other hand, greater minority shareholder protection might constrain the opportunistic
expropriation behavior of bank insiders. Effective monitoring by minority directors may therefore
be less essential in controlling potential agency conflicts in countries with higher levels of minority
shareholder protection. These observations lead us to consider the alternative hypothesis:
H4b: Strong minority shareholder laws and the presence of minority directors are substitute
corporate mechanisms.

11
3. Data sources and ownership and board structures
3.1. Sampling procedure and data sources
We focus our analysis on European countries as some jurisdictions there recommend in their
Corporate Governance Codes to have minority directors. Moreover, European banks show a
substantial amount of variability between individual levels of ownership concentration given the
lack of regulatory limitations on the percentage of bank capital owned by a single entity in Europe.
We only consider European banks listed on the stock market as we were not able to collect data
on the board structure of non-listed banks (even from their annual reports).
Our sample includes bank holding companies, commercial banks and investment banks, from
17 European countries (Austria, Belgium, Denmark, Finland, France, Germany, Greece, Ireland,
Italy, Luxembourg, Netherlands, Norway, Portugal, Spain, Sweden, Switzerland, and the United
Kingdom). We identify all active listed banks as at the end of December 2013 provided by BvD
Bankscope, resulting in 145 banks. As the main concern in our study is the relatedness of the board
of directors to shareholders and managers, we only retain banks for which we have information on
their board structure, leaving us with a sample of 124 banks. Additionally, we also exclude banks
for which there is no information to compute the variables of interest. Consequently, we end up
with a final sample of 118 banks in 17 countries (Table 1 gives a breakdown of these by country).
On average, our sample covers more than 97% of banks’ total assets of all listed banks provided
by BvD Bankscope (see Table 1).
We assemble data on ownership structure and board of directors as of 2013 for our 118 banks.
We use Bloomberg, BvD Bankscope, Amadeus, as well as websites of banks/firms for information
on ownership structure. The data on board structure and the biographies of the board of directors
are in part taken from Bloomberg, but mostly hand-collected from corporate governance reports
or annual reports. We further collect financial statement data from BvD Bankscope, market data
from Bloomberg, and macroeconomic data from the World Bank over the period 2011-2015.
[Insert Table 1 here]
3.2. Codes of Good Governance on board independence
The European Parliament called on the Commission of the European Communities to propose
rules to strengthen shareholders’ rights and protection for creditors, employees and the other
parties companies deal with. The Commission of the European Communities published a list of
recommendations in 2005 (Commission of the European Communities, 2005), with the objective
to improve corporate governance standards in the EU with a certain degree of harmonization. A

12
report published in 2007 shows that most Member States follow almost fully or to a large extent
the provisions of the Recommendation (Commission of the European Communities, 2007).
All Member States now recommend the presence of independent directors in boards through
the principle of "comply or explain", but without indicating what the independence is relative to
(see Table 2 for our sample).6 Differences in the definition of independence and in the proportion
of independent board members recommended within the board make standards uneven. The
recommendation to have boards independent from controlling shareholders in concentrated
ownership has furthermore only been endorsed in a few Member States (in our sample: Austria,
Finland, Netherlands, Norway, and Sweden), and with a very small number of a minimum of one
or two independent directors.
Regarding the presence of minority directors, this is only recommended in two European
countries, with no obligation for companies to either comply with or justify deviations from it.
Spain has introduced a proportional voting system that allows for a minority of shareholders to
appoint directors in proportion to their equity stake in the corporation, for both listed and non-
listed corporations. An Italian reform of 2005, on the other hand, gives listed companies the right
to reserve at least one seat on the board of directors to persons that are not appointed by controlling
shareholders.
[Insert Table 2 here]
3.3. Identifying controlling shareholders
We need to build the control chain to determine if a bank is widely held or is controlled by one
or several shareholders. In this we follow the existing literature (La Porta et al., 1999); Claessens
et al., 2000; Facio and Lang, 2002) by using the control threshold of 20%.7 Besides control rights
of controlling shareholders, we also compute their relative voting power by taking into account
the probability of coalition between them.
Construction of control chains
Our first step is to build control chains for each bank to identify both direct and indirect owners,
and their control rights in the control chain. Previous studies (La Porta et al., 1999; Shleifer, 1999;
Barry et al., 2011) show that ownership structure is relatively stable over time. As one may argue
that this is less true during a period of banking crisis, we construct the control chains for the year
6 We collect the last Corporate Governance Code available for the 17 European countries included in our sample from
the European Corporate Governance Institute (http://www.ecgi.org/). 7 Alternatively, we apply a threshold of 10% in the robustness tests.

13
2013, after the subprime and the sovereign debt crises, and consider them to be unchanged for our
study period.
At the first level in the control chain, we divide our sample into banks controlled by at least one
controlling shareholder holding at least 20% of outstanding shares, and widely held banks (no
controlling shareholders). We consider a controlling shareholder to be an ultimate owner when it
is an individual/family, a government, or a widely held firm (industrial, mutual funds or financial
firm). At this level, ultimate owners are direct shareholders of the banks. For banks with
controlling shareholders for whom we can continue building the control chains, we collect
information on ownership structure of controlling shareholders at each of the following levels in
the chain. We continue the control chains until we find all indirect ultimate owners of a bank.8
We use the method of La Porta et al. (1999) to compute control rights of controlling
shareholders. An ultimate owner can control a bank directly and/or indirectly. We define their
direct control rights as the percentage of the bank’s shares directly held, and their indirect control
rights as the shares held by an entity at the first level that the ultimate shareholder controls through
the intermediate entities in the chain of control. The aggregate control rights of a shareholder are
the sum of their direct and indirect voting rights held in the bank (see Figure A1 in Appendix 1 for
an example of a chain of control).9
Relative voting power of controlling shareholders
As the real voting power of a given controlling shareholder also depends on the possible
coalitions between the other controlling shareholders, we use a measure of “relative voting power”
alternatively to the control rights to estimate the potential influence of each controlling shareholder
in the decision process. If the probability of coalition of multiple large shareholders is high, the
voting power of the largest ultimate owner relatively decreases, i.e. they may not be the ones
making decisions in this bank (see Figure A1 in Appendix 1 for an example of such a coalition).
We use the “Banzhaf Power Index” (BPI) to measure the relative voting power of each
controlling shareholder. This index takes into account voting rights, and the possibility to unite
with other shareholders to make decisions in a bank (see Appendix 2 for details). We compute the
BPI index using the algorithms for voting power analysis (using the method of generating
8 In our sample, the maximum number of levels in a bank’s control chain is eight. 9 We have some cases where we have several ultimate owners for a same controlling shareholder at the first level in
the control chain. We then consider as the ultimate owner the one holding the largest number of shares.

14
functions) provided by Dennis Leech at the University of Warwick.10 This index ranges from 0 to
1; the higher the index, the more relative voting power has the shareholder. In widely held banks
there are no controlling shareholders, so we set voting power of all shareholders of these banks
equal to 0. For banks with concentrated ownership structure, we calculate the relative voting power
for direct shareholders and for ultimate owners at the last level in the control chain. The relative
voting power of ultimate owners is calculated as the product of control rights they have at each
intermediate level and the relative voting power of the shareholder at the first level in the control
chain. As for the ownership structure, we compute the BPI index for each controlling shareholder
for the year 2013, and suppose that relative voting power is also unchanged for our study period.
3.4. Indices of relatedness of directors
Our next step is to identify board members that are related to either controlling shareholders or
minority (non-controlling) shareholders. We collect for that information on the biographies of
directors for the year 2013. As board terms range normally from 3 to 4 years, we suppose that the
measures of relatedness we are computing remain the same over our period of analysis.11 Instead
of using directly the percentage of directors that are independent/dependent as in previous studies
(e.g. Dahya et al., 2008; Adams and Mehran, 2012; Pathan and Faff, 2013), we build more refined
measures by assigning weights to three factors that characterize the strength of the relatedness
between a director and a shareholder/ultimate owner.
The first factor we consider is whether a director is related to either a direct shareholder
(controlling or minority) or indirect controlling shareholders (ultimate owners). We consider a
director to be related to a direct shareholder if: (1) they are an employee of the direct shareholder;
(2) they are one of the direct shareholders of the bank; (3) they have the same family name as one
of the direct shareholders of the bank; or (4) they are a politician or employee of a government
agency when the bank is state owned. To determine if directors are related to the ultimate owners
of the bank, we further need to consider if they are related to any firms in the control chain. A
director is then identified as related to an ultimate owner in one of the following cases: (1) they
are an employee either of the ultimate owner or in one of the firms controlled by the ultimate owner
in the control chains of the bank; (2) they are one of the ultimate owners or one of the indirect
minority shareholders in the control chain of the bank; (3) they have the same family name as the
10 See http://homepages.warwick.ac.uk/~ecaae/ipgenf.html. 11 Blomberg provided information on board structure of 62 banks among the 118 banks in our sample from 2011 to
2013. We notice that the board structure of these banks did not change for this period. Therefore, for the 42 remaining
banks, we use 2013 annual reports for information on board structure, and also suppose that their board structure is
stable during the period of study.

15
ultimate owner or as one of the indirect minority shareholders in the control chain of a bank; (4)
they are shareholders in at least one of the firms controlled by the ultimate owner in the control
chains of the bank; or (5) they are a politician or employee of a government agency when one of
the ultimate owner is state owned. A director who is not considered to be related to a shareholder
or an ultimate owner is considered to be independent from shareholders.12
The second factor we are taking into account to compute our indices of relatedness of directors
is whether their relationship with shareholders is in the present or in the past. When directors are,
for example, current employees of shareholders of the bank, they might have strong incentives to
act in the interest of the person that can fire them. However, when the relatedness is already in the
past, the related director is just related to, but not controlled by shareholders, thus their influence
should be less significant than in the first case.
The third factor we considered is the position of directors in the board. We distinguish if
directors are Chairman/Vice Chairman of the board, or other board members. The Chairman of the
board has more rights in the directors meeting. In some countries (such as Italy and Portugal),
when votes in the board are tied, the Chairman of the board can have the casting vote to make a
decision. Besides the Chairman and the Vice Chairman can act in the Chairman’s place such as
presiding over board meetings, if the Chairman is not present. Therefore, when Chairman or Vice
Chairman are related to shareholders, they might have greater opportunities to act in the interest
of shareholders.
We use the three factors described above to compute several complementary indices to measure
the strength of independence/dependence of the board of director for each bank (see Appendix 3
for details). These different indices are computed using either control rights or the Banzhaf Power
Index to measure the decision power of the shareholders (based on the threshold of 20%). For
controlled banks, we compute three indices measuring, respectively, the presence/influence of
directors in their board that are (i) related to minority shareholders (Minority), (ii) related vis-a-vis
controlling shareholders (Controlling), and (iii) independent from shareholders (Independent).
These three indices range from 0 to 10. For widely held banks, we first construct an index
measuring the presence/influence of directors in their board that are related to minority
shareholders (Minority); this index also ranges from 0 (no directors are independent) to 10 (all
directors are independent). We also measure the presence of directors that are dependent from
12 In our sample, we also have 18 directors (1.51%) who are related to both controlling and non-controlling
shareholders. We treat separately each of these 18 cases to make them related to only either controlling or non-
controlling shareholders in function of the strength of their link with them. In robustness tests, we remove these 18
cases from the sample.

16
managers through the percentage of dependent directors, as provided in annual reports of each
bank for the year 2013 (Manageri).
[Insert Table 3 here]
3.5. Some descriptive statistics
We have in our sample 44 widely held banks (37%) and 74 banks controlled by at least one
shareholder (63%). Among the latter, 32 banks (43%) have several controlling shareholders.
Hence, these can enter coalitions with other shareholders to obtain the excess control rights over
the largest ultimate owner to make decisions in banks. However, potential coalitions might be
limited in a majority of banks as the average voting rights of the largest shareholder in our sample
are around 56% (see Table 4). Besides, minority shareholders hold on average around 42% of the
shares.
In our sample of controlled banks, we have on average 18.29% of directors that are related to
minority shareholders and 13.44% that are related to controlling shareholders (direct or indirect),
and 68.27% that are independent (see Table 5). The proportion of minority directors is therefore
relatively high on average, especially in Spain (62.75%) where the Corporate Governance Law
recommends to include such directors in the board, but also in other countries that do not have
such recommendations (Austria 27.63%, France 20.29%, Sweden 26.92%, the UK 34.69%). In the
sample of widely held banks, the relatedness of directors to managers is the greatest concern of
shareholders. The average percentage of related directors to managers of widely held banks in our
sample is 43.88%. Moreover, we also observe that the proportion of minority directors is high in
widely-held banks, with an average value of 29.18%.13
Table 6 further provides statistics on the five different criteria used to determine if a director is
related to a shareholder. We find that on average 82.82% and 76.76% of directors identified as
related, in controlled and widely held banks, respectively, are related to shareholders through being
employed by one of them. Directors that are shareholders of the bank represent more than 10% of
the cases of related directors, while the three other criteria of relatedness account for only around
1% of the cases.
[Insert Tables 4, 5 and 6 here]
13 In this study, we cannot identify related directors to managers, we only take into account the percentage of related
directors to managers which is reported in annual report of each bank. Therefore a director in widely held banks can
be related to both shareholders and managers. The statistics on relatedness to managers and to shareholders in the
Table 4 reports two separate aspects of relatedness of directors in widely held banks.
17
4. Methodology
4.1. Empirical specifications
We use two different specifications to test our four hypotheses developed above.
Specification to test hypotheses H1-H2
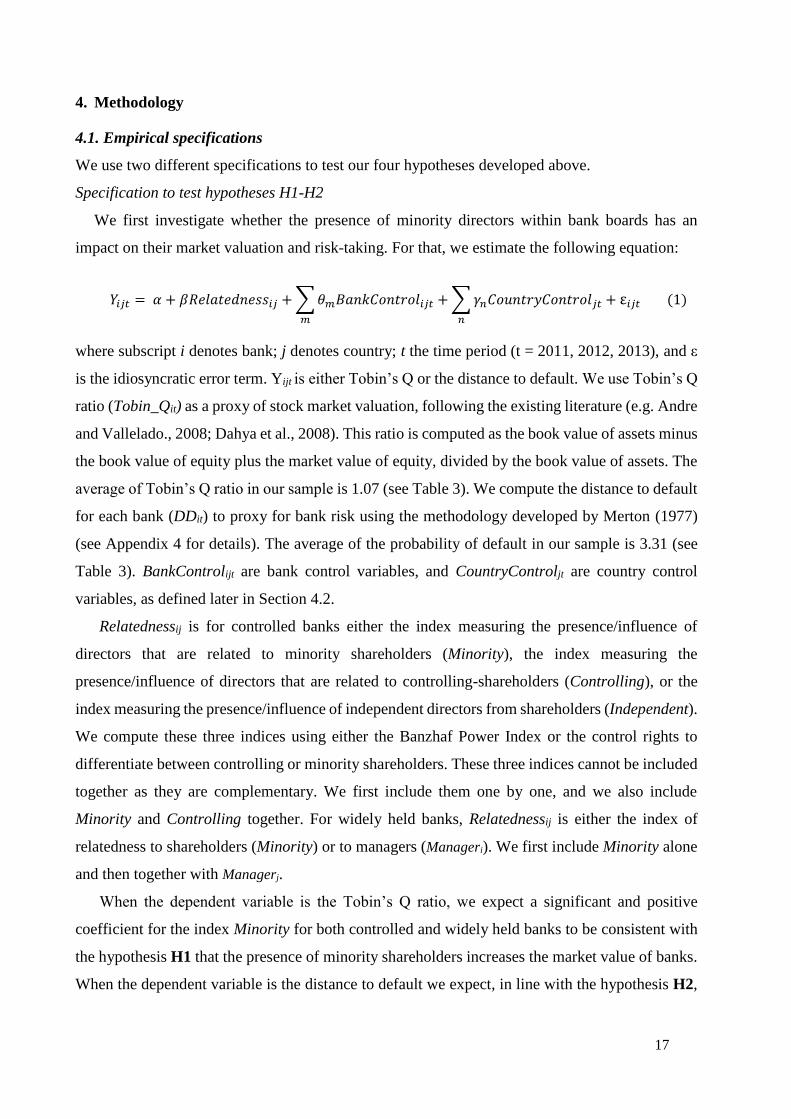
We first investigate whether the presence of minority directors within bank boards has an
impact on their market valuation and risk-taking. For that, we estimate the following equation:
𝑌𝑖𝑗𝑡 = 𝛼 + 𝛽𝑅𝑒𝑙𝑎𝑡𝑒𝑑𝑛𝑒𝑠𝑠𝑖𝑗 + ∑ 𝜃𝑚𝐵𝑎𝑛𝑘𝐶𝑜𝑛𝑡𝑟𝑜𝑙𝑖𝑗𝑡 + ∑ 𝛾𝑛𝐶𝑜𝑢𝑛𝑡𝑟𝑦𝐶𝑜𝑛𝑡𝑟𝑜𝑙𝑗𝑡 + ε𝑖𝑗𝑡 (1)
𝑛𝑚
where subscript i denotes bank; j denotes country; t the time period (t = 2011, 2012, 2013), and ε
is the idiosyncratic error term. Yijt is either Tobin’s Q or the distance to default. We use Tobin’s Q
ratio (Tobin_Qit) as a proxy of stock market valuation, following the existing literature (e.g. Andre
and Vallelado., 2008; Dahya et al., 2008). This ratio is computed as the book value of assets minus
the book value of equity plus the market value of equity, divided by the book value of assets. The
average of Tobin’s Q ratio in our sample is 1.07 (see Table 3). We compute the distance to default
for each bank (DDit) to proxy for bank risk using the methodology developed by Merton (1977)
(see Appendix 4 for details). The average of the probability of default in our sample is 3.31 (see
Table 3). BankControlijt are bank control variables, and CountryControljt are country control
variables, as defined later in Section 4.2.
Relatednessij is for controlled banks either the index measuring the presence/influence of
directors that are related to minority shareholders (Minority), the index measuring the
presence/influence of directors that are related to controlling-shareholders (Controlling), or the
index measuring the presence/influence of independent directors from shareholders (Independent).
We compute these three indices using either the Banzhaf Power Index or the control rights to
differentiate between controlling or minority shareholders. These three indices cannot be included
together as they are complementary. We first include them one by one, and we also include
Minority and Controlling together. For widely held banks, Relatednessij is either the index of
relatedness to shareholders (Minority) or to managers (Manageri). We first include Minority alone
and then together with Managerj.
When the dependent variable is the Tobin’s Q ratio, we expect a significant and positive
coefficient for the index Minority for both controlled and widely held banks to be consistent with
the hypothesis H1 that the presence of minority shareholders increases the market value of banks.
When the dependent variable is the distance to default we expect, in line with the hypothesis H2,

18
the coefficient associated with Minority to be negative and significant if the presence of minority
directors decreases the distance to default.
Regarding the other indices of relatedness we consider, we furthermore expect a stronger
presence/influence of directors related to either controlling shareholders in controlled banks
(Controlling) or to managers in widely held banks (Managerj) to significantly decrease Tobin’s Q
ratio, as it might increase the risk of expropriation. On the contrary, the presence of directors that
are independent from both controlling and minority shareholders in controlled banks
(Independent) would increase the market value of banks if minority shareholders have confidence
in the independence of these directors. We also expect, in widely held banks, that the presence of
directors related to managers would increase the distance to default if managers are more risk-
averse than shareholders. Similarly, a stronger presence/influence of directors related to
controlling shareholders in controlled banks would decrease the risk of default if controlling
shareholders have large shares and a long term focus compared to minority shareholders.
Specification to test hypotheses H2-H3
We further analyze whether a strong regulatory and institutional environment (Envj), more
specifically strong supervisory regimes and high levels of shareholder protection, could influence
the role played by minority directors in addressing the complex agency conflicts faced by the
different banks’ stakeholders. For this, we augment Equation (1) with interaction terms between
the different indices of relatedness and the variable Envj as follows:
𝑌𝑖𝑗𝑡 = 𝛼 + 𝛽𝑅𝑒𝑙𝑎𝑡𝑒𝑑𝑛𝑒𝑠𝑠𝑖𝑗 + 𝛿𝐸𝑛𝑣𝑗 × 𝑅𝑒𝑙𝑎𝑡𝑒𝑑𝑛𝑒𝑠𝑠𝑖𝑗 + 𝜌𝐸𝑛𝑣𝑗
+ ∑ 𝜃𝑚𝐵𝑎𝑛𝑘𝐶𝑜𝑛𝑡𝑟𝑜𝑙𝑖𝑗𝑡 + ∑ 𝛾𝑛𝐶𝑜𝑢𝑛𝑡𝑟𝑦𝐶𝑜𝑛𝑡𝑟𝑜𝑙𝑗𝑡 + ε𝑖𝑗𝑡 (2)
𝑛𝑚
For the regulatory and institutional environment Envj, we first consider an index for strength of
supervisory regime (SupPowj), drawn from the World Bank’s 2013 Bank Regulation and
Supervision database, in line with Laeven and Levine (2009) and Shehzad et al. (2010). It measures
propensities of regulatory authorities to do on-site examinations in order to make an overall
assessment of banks to determine their economic condition, and their ability to remove and replace
managers and directors or to force a bank to change its internal organizational structure when
problems are detected (see Table 3 for details). The index SupPowj ranges in principle from 0 to
13, with a higher index indicating stronger supervisory strength. In our sample, the index has a
median of 10 and ranges from 4 to 13 (see Table 3). If stronger supervisory regimes provide
19
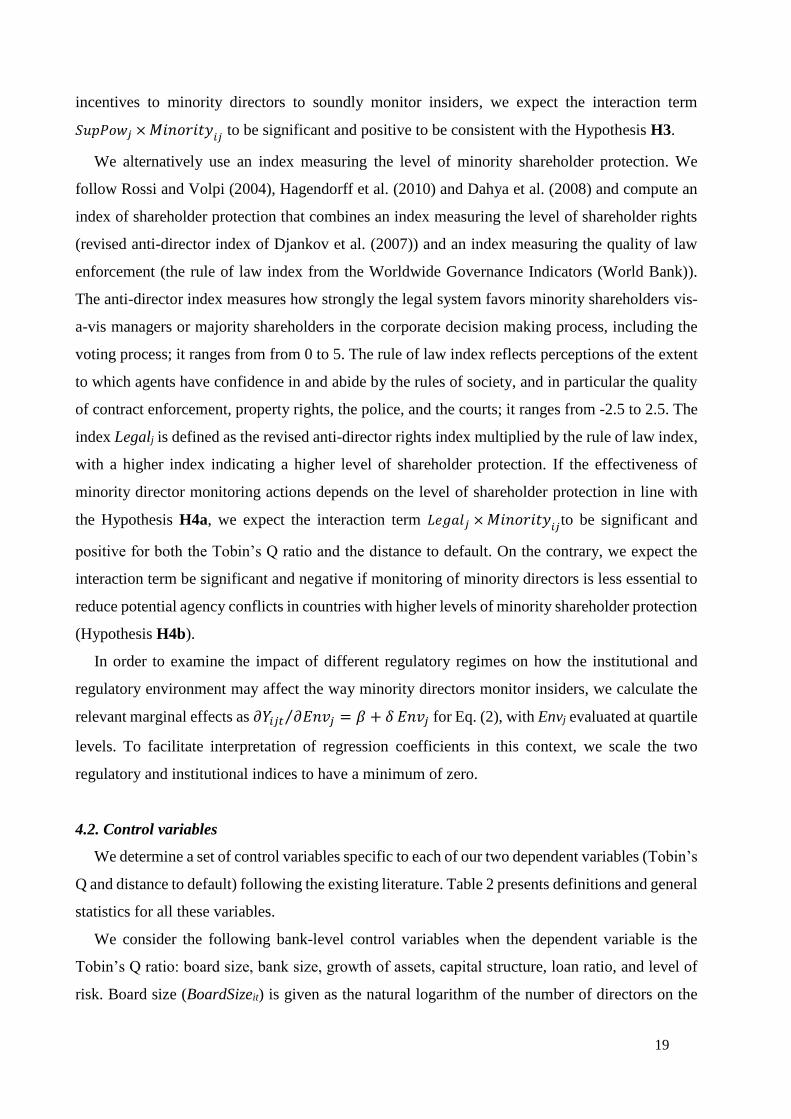
incentives to minority directors to soundly monitor insiders, we expect the interaction term
𝑆𝑢𝑝𝑃𝑜𝑤𝑗 × 𝑀𝑖𝑛𝑜𝑟𝑖𝑡𝑦𝑖𝑗
to be significant and positive to be consistent with the Hypothesis H3.
We alternatively use an index measuring the level of minority shareholder protection. We
follow Rossi and Volpi (2004), Hagendorff et al. (2010) and Dahya et al. (2008) and compute an
index of shareholder protection that combines an index measuring the level of shareholder rights
(revised anti-director index of Djankov et al. (2007)) and an index measuring the quality of law
enforcement (the rule of law index from the Worldwide Governance Indicators (World Bank)).
The anti-director index measures how strongly the legal system favors minority shareholders vis-
a-vis managers or majority shareholders in the corporate decision making process, including the
voting process; it ranges from from 0 to 5. The rule of law index reflects perceptions of the extent
to which agents have confidence in and abide by the rules of society, and in particular the quality
of contract enforcement, property rights, the police, and the courts; it ranges from -2.5 to 2.5. The
index Legalj is defined as the revised anti-director rights index multiplied by the rule of law index,
with a higher index indicating a higher level of shareholder protection. If the effectiveness of
minority director monitoring actions depends on the level of shareholder protection in line with
the Hypothesis H4a, we expect the interaction term 𝐿𝑒𝑔𝑎𝑙𝑗 × 𝑀𝑖𝑛𝑜𝑟𝑖𝑡𝑦𝑖𝑗
to be significant and
positive for both the Tobin’s Q ratio and the distance to default. On the contrary, we expect the
interaction term be significant and negative if monitoring of minority directors is less essential to
reduce potential agency conflicts in countries with higher levels of minority shareholder protection
(Hypothesis H4b).
In order to examine the impact of different regulatory regimes on how the institutional and
regulatory environment may affect the way minority directors monitor insiders, we calculate the
relevant marginal effects as 𝜕𝑌𝑖𝑗𝑡 𝜕𝐸𝑛𝑣𝑗 = 𝛽 + 𝛿⁄ 𝐸𝑛𝑣𝑗 for Eq. (2), with Envj evaluated at quartile
levels. To facilitate interpretation of regression coefficients in this context, we scale the two
regulatory and institutional indices to have a minimum of zero.
4.2. Control variables
We determine a set of control variables specific to each of our two dependent variables (Tobin’s
Q and distance to default) following the existing literature. Table 2 presents definitions and general
statistics for all these variables.
We consider the following bank-level control variables when the dependent variable is the
Tobin’s Q ratio: board size, bank size, growth of assets, capital structure, loan ratio, and level of
risk. Board size (BoardSizeit) is given as the natural logarithm of the number of directors on the

20
board, and bank size (Sizeit) is measured by the logarithm of total assets of banks. Growth of assets
(Growthit) is measured by the change of total assets between year t-1 and year t, divided by the
total assets in year t-1. Capital structure (Capitalit) is measured as the ratio of equity to total assets
of a bank, and the loan ratio (Loanit) is the ratio of loans to total assets. Following Hail and Leuz
(2009), we use return variability, i.e. the standard deviation of monthly stock returns over the last
twelve months, to proxy for the risk of banks (Riskit).
In the regressions using the distance to default as dependent variable, the bank-level control
variables are board size, bank size, growth of assets, capital structure, loan ratio, the deposit,
operating ratios and return on equity. The deposit ratio (Depositit) is computed as the ratio of
deposits to total assets, the operating ratio (Operating) is the ratio of total operating expenses to
total operating income, and the return on equity (ROE) is calculated as the ratio of net income to
total equity. The other control variables BoardSizeit, Sizeit, Growthit, Capitalit , Loanit are computed
as defined above.
We furthermore include in all regressions the growth rate of GDP (GDPjt) and the index
measuring the level of minority shareholder protection for each country (Legalj).
We checked the correlation among our variables of interest and do not find any multicollinearity
problem (see Table A1 in Appendix 1).
4.3. Endogeneity issues
One of the main concerns of studies on corporate governance in general, and regarding the
board of directors in particular, is the endogeneity problem, which is raised in previous studies
such as Mak and Li (2001), Hermalin and Weibach (1998, 2003). However, the “Code of Best
Practices for Corporate Governance” is implemented in all countries in our sample, thus banks
have to set their board of directors in compliance with the recommendations in the “Code of Best
Practices”; if this is not the case, they have to explain this to regulators. From this point of view,
the board of directors can arguably be considered as exogenously determined.
However, we still empirically test for the presence of endogeneity problems for the variables
of relatedness of board of directors to shareholders in our study. We use the two-stage least squares
(2SLS) method, finding instrument variables for each index of relatedness of board in each of the
regressions on Tobin’s Q and distance to default. After each regression, we carry out tests to verify
the validity of our model specification. We obtain the Sargan-Hansen statistic for test of over-
identification, the Cargg-Donald Wald F statistic for test of weak identification, and the LM
statistic for under-identification test. The results show that the instrument variables are valid in

21
each regression (see Tables A2-A4 in Appendix 1 for definition and result of the tests of validity
of instrument variables in each regression).
Thereafter, we carry out the endogeneity tests14 to test the endogeneity problem for our
variables of interest. The results show that we cannot reject the null hypothesis in the endogeneity
tests (with p-value strictly greater than 10%); we can therefore conclude that the variables of
relatedness of board of directors to shareholders in our sample are strictly exogenous.
Having discarded the need to correct for endogeneity, we estimate Eq. (1) and (2) using the
generalized least square (GLS) random effects technique. The random effects model has the
benefit of taking into account time-invariant explanatory variables that are eliminated by first-
differencing when using the fixed effects model. Moreover, it also accounts for unobserved,
individual-specific variation, which reduces potentially omitted variables bias. In order to test
whether the individual-specific effect is not correlated with explanatory variables, we use the
method described by Arellano (1993) and Wooldridge (2002), which is a robust Hausman test that
is equivalent to the traditional Hausman test under conditional homoscedasticity. The robust
Hausman test indicates that the random effect method is suitable in our panel. However, we cannot
reject that the data does not have first order- autocorrelation. Consequently, we use the generalized
least square (GLS) random effect technique, which is also robust to first-order autocorrelation
disturbances.
5. Empirical results
5.1. Relatedness of directors to shareholders and agency conflicts
The estimation results for Eq. (1) are given in Tables 7 and 8 for controlled banks using,
respectively, the Banzhaf Power Index and control rights to differentiate between controlling or
minority shareholders. Results for widely held banks are provided in Table 9 for both the Banzhaf
Power Index and control rights.
We find for both the sample of widely held and controlled banks that the presence and influence
of minority directors in the board (Minority) has a significant and positive impact on Tobin’s Q.
Results are similar when we use either relative voting power or control rights to identify controlling
shareholders (columns 1 and 3 of Tables 7 and 8, and columns 1-2 and 5-6 of Table 9). These
results are consistent with the hypothesis H1 that having directors that are related to minority
shareholders is effective to convince outside shareholders that insiders will refrain from diverting
14 Null hypothesis is that there is no systematic difference between the estimator of the 2SLS technique and the one
of the GLS random effects technique. Alternative hypothesis is that there is a systematic difference between the two
estimators.

22
resources. The reduction of the market value discount results in an increase in stock market
valuation. Our results further show that the presence and influence of minority directors in the
board significantly decreases the probability of default for the sample of controlled banks, while
there is no significant impact for widely held banks (columns 5 and 7 of Tables 7 and 8, and
columns 3-4 and 7-8 of Table 9). This is not consistent with our hypothesis H2. The results indicate
that minority directors are better placed to supervise and control risk taking if a director’s
reputation is important in the market for directorships. Having directors that are related to minority
shareholders seems therefore effective to curtail the agency problem we have in banks between
insiders and outsider shareholders, as well as between shareholders and debtholders.
As expected, our results show for the sample of controlled banks that the presence/influence of
directors that are related to controlling shareholders (Controlling) contribute to amplify the agency
conflicts between the different stakeholders, as we find that this is associated with a decrease in
Tobin’s Q and an increase in the probability of default (columns 2 and 6 Tables 7 and 8). Regarding
the presence of directors that are independent from shareholders (Independent), we find that this
is associated with a significant decrease in Tobin’s Q and no significant impact on the distance to
default (columns 4 and 8 Tables 7 and 8). This result is in contrast to those of Dahya et al. (2008)
on non-financial firms who find a significant and positive relationship. This can be explained by
the fact that we exclude from these independent directors those that are related to minority
shareholders, for which we find a positive and significant impact on Tobin’s Q. The negative
relationship between independent directors and stock market valuation might be explained by the
difficulty for controlling shareholders to credibly commit to not expropriating by including
independent directors in the board, knowing that the latter are appointed by them, or alternatively
by “independent” nomination committees which may also depend on them. For the sample of
widely held banks, we find that the presence of directors that are independent from managers is
associated with a significant increase in the distance to default, while having no significant impact
on Tobin’s Q (columns 2, 4, 6 and 8 of Table 9).
In summary, these different results seem to indicate that the presence/influence of minority
directors is effective to curtail the agency conflict either between insiders and outside shareholders,
and between shareholders and debtholders, for both controlled and widely held banks. On the
contrary, the presence/influence of directors related to controlling shareholders in controlled banks
is detrimental for agency conflicts and results in lower market valuation and higher default risk
[Insert Tables 7 to 9 here]

23
5.2. Role of institutional and regulatory environment
We now examine whether the institutional and regulatory environment may affect the way
minority directors monitor insiders. The estimation results for Eq. (2) are given in Tables A3 and
A4 in Appendix 1 where we only present the results obtained when we compute the indices of
relatedness using the Banzhaf Power Index as we find similar results with control rights.15 To
facilitate the interpretation, we comment the marginal effects evaluated at quartile levels for the
index of strength of supervisory regime (Table 10) and the index of minority shareholder
protection (Table 11).
On the one hand, we observe for the sample of controlled banks that the strength of the
supervisory regimes impacts the way minority directors monitor insiders, in line with the
hypothesis H3. We observe from Table 10 that the positive impact of the presence/influence of
minority directors on Tobin’s Q and on the distance to default is increasing with the strength of
supervisory regimes. These results are in line with the argument that a complementary relationship
exists between the strength of supervision and the incentives of minority directors to monitor
insiders. The stronger is the mandate that regulators have been given to intervene and discipline,
the greater is the “threat of action” (Booth et al., 2002) that regulators pose to minority directors.
On the contrary, we find that the positive impact of the presence/influence of minority directors
on Tobin’s Q and the distance to default is decreasing for higher levels of minority shareholder
protection, with no significant impact on Tobin’s Q at all for the highest levels of protection (see
Table 11). This is consistent with the hypothesis H4b that strong minority shareholder protection
and the presence of minority directors are substitute corporate mechanisms, rather than
complementary mechanisms. We further find that the market value discount imposed by minority
shareholders when there is a strong presence of directors related to controlling shareholders is no
longer imposed in countries with higher levels of shareholder protection (see Table 11). This result
is consistent with the argument that the effectiveness of minority shareholders to limit any potential
expropriation behavior of controlling shareholders depends on the quality of anti-self-dealing
regulation. Similarly, we find that the negative impact of the presence of directors related to
controlling shareholders on Tobin’s Q is decreasing for stronger supervisory regimes.
On the other hand, we find for the sample of widely held banks that neither the strength of
supervisory regime nor levels of minority shareholder protection have an impact on the way that
minority directors monitor insiders. The presence/influence of minority directors has a positive
impact on Tobin’s Q while having no significant impact on the distance to default (Tables 10 and
15 These estimation results are available on request.

24
11), independently of the regulatory and institutional environment. Hypotheses H3 and H4a/H4b
do not therefore hold for the sample of widely held banks. Having minority directors is effective
to reduce the agency conflicts between managers and shareholders, and between shareholders and
debtholders, without regard to levels of supervisory regimes and minority shareholder protection.
We find similarly that the impact of the presence of directors related to managers on both Tobin’s
Q and the distance to default does not depend on the regulatory and institutional environment.
[Insert Tables 10 to 11 here]
6. Robustness tests
We further check the robustness of our results as discussed in section 5 in several ways.16
First, we exclude from the initial sample banks cross-listed on a US exchange. Theoretical and
empirical works on corporate governance show that cross-listing on a more transparent market,
with higher requirements in terms of published information, is considered a mechanism to reduce
risk of expropriation from insiders (e.g. Reese and Weisback, 2002; Doidge et al., 2004). As our
study is on Western European countries, where stock markets are developed and quite transparent,
we take the US exchange as a reference of an even more transparent market compared to the stock
market of countries in our study. We exclude eight banks that are cross-listed on a US exchange
from the initial sample in order to exclude the effect of cross-listing on Tobin’s Q and distance to
default. Our main results are unchanged.
Next, we exclude from the initial sample banks having dual class shares. The existence of dual
class shares can bias voting rights in a bank (Faccio and Lang 2002), and thereby might weaken
the relevance of minority directors in our study. Therefore, we exclude eight banks having dual
class stock, with our conclusions from the section 5 still prevailing in reduced sample.
We then verify our results using alternative measures of our dependent variables. For the market
valuation, we alternatively use shareholder market return (SMR), in line with Andres and
Vallelado (2008). In order to compute the SMR, we calculate monthly returns from share prices
of each bank, calculate the average monthly returns for each year, and then annualize them. We
still find that for the sample of controlled banks that the presence of minority directors on the board
ameliorates Tobin’s Q and decrease the default risk, whereas the presence of independent directors
or directors related to controlling shareholders have no significant impact. The presence of
minority directors in the board of widely held banks still decrease the default risk, with however
no significant impact on Tobin’s Q.
16 While we do not include the estimation results discussed in this section, they are available on request.

25
We also consider an alternative measure of bank risk of insolvency, i.e. the widely used Z-score
defined as 𝑍𝑅𝑂𝐴 = 𝜇𝑅𝑂𝐴 + 𝐸𝑄 𝜎𝑅𝑂𝐴⁄ , with 𝜇𝑅𝑂𝐴 and 𝜎𝑅𝑂𝐴 respectively the mean and the standard
deviation of ROA, and EQ the bank's capital-asset ratio (Lepetit and Strobel (2013, 2015)). We
compute Z-scores using moving mean and standard deviation estimates for ROA, with window
widths of three observations, and current values of EQ. A higher Z-score indicates that a bank is
more stable, and thus has a lower risk of insolvency; as Z-scores tend to be skewed, we use their
natural logarithm. We still find that the presence of minority directors on the board reduces
insolvency risk of controlled banks, more specifically in countries with stronger supervisory
regimes. Our results also confirmed that the presence of minority directors decreases the default
risk of widely held banks, independently of the strength of supervisory regimes.
We then reestimate Eq. (1) and (2) using alternative measures of relatedness of board directors
to shareholders. Firstly, we use the percentage of relatedness of board to shareholders; results are
unchanged. Our results are thus robust to different measures of the representation of minority
directors on the board.
We also alternatively use a threshold of control of 10% to identify controlling shareholders,
following La Porta et al. (1999, 2002), Caprio et al. (2007) and Lepetit et al. (2015). We then have
96 controlled banks and 22 widely held banks, and we can only run regressions for Eq. (1). Our
main results remain unchanged.
We had considered “having the same family name with shareholder” as one of the criteria to
identify “related directors”. In our main results, we only considered related directors having the
same family name with shareholders when it is not a common family name in each country. As a
robustness test, in order to ensure that the presence or absence of related director in our sample
according to “having the same family name” criterion does not drive our principal results, we
exclude all the 8 related directors according to this criterion from the initial sample. Our main
conclusions are unchanged;
Finally, we consider excluding from the initial sample directors relating to both controlling and
minority shareholders. In our initial sample, there are 18 directors relating to both controlling and
minority shareholders. In the main regressions, we treated each case of these 18 directors to
classify them to one of the two categories: related to controlling or related to minority shareholders.
In the robustness test, we exclude these 18 related directors from the initial sample. Results are
similar to those obtained before.

26
7. Conclusion
We examine whether having a board structure of banks that includes minority directors which
are related to minority shareholders is effective in limiting expropriation by insiders without
increasing the default risk of banks. For this, we analyse the impact of the presence/influence of
such minority directors on stock market valuation and the distance to default of both controlled
and widely held banks. As a secondary focus, we also explore whether the institutional and
regulatory environment may affect the way minority directors monitor insiders. For this purpose,
we assemble a novel hand-collected data set on banks’ ultimate control, ownership structure and
board composition for a sample of 118 European listed banks from 17 countries.
We find for both controlled and widely held banks that the presence and influence of minority
directors appears effective in convincing outside shareholders that insiders will refrain from
diverting resources, as we observed a positive and significant impact on Tobin’s Q. We
furthermore find that the presence/influence of minority directors in the board decreases the default
risk of both controlled and widely held banks, consistent with the argument that such directors are
better placed to supervise and control risk taking. The introduction of minority directors seems
therefore effective to curtail not only the agency problem between insiders and outside
shareholders, but also the one between shareholders and debtholders. In comparison, we find for
the sample of controlled banks that the presence of independent directors does not contribute to
reducing either these two agency conflicts, while directors related to controlling shareholders
strengthen them. For widely held banks, the presence of directors related to managers does not
lead to lower market valuation and is associated with lower default risk.
We furthermore find for controlled banks that stronger supervisory regimes increase the
incentives of minority directors to monitor insiders more effectively and soundly. This result
suggests that the inclusion of such directors is more likely to be successful if bank-level
governance is accompanied by a strict supervisory regime. Our results also show that effective
monitoring of minority directors is less essential in controlling potential agency conflicts in
countries with higher levels of minority shareholder protection. For widely held banks, our results
show that incentives of minority directors to soundly monitor insiders do not depend on the
regulatory and institutional environment.
Our findings contribute to the current policy debate on what forms of corporate governance in
banks could lead to the most efficient outcome for society in terms of both market valuation and
financial stability. It has been suggested by some regulators to introduce in Code of Corporate
Governance the recommendation that at least one director should be nominated by banking
regulators to reduce the agency conflict between shareholders and debtholders (De Haan and

27
Vlahu, 2016). However, such a recommendation might not be seen as a palatable for many banks’
insiders and might then not be widely applied. Our work suggests instead that recommending the
presence of a minimum of minority directors could increase bank board effectiveness for both
controlled and widely held banks. Firstly, it could ensure that the risk-taking incentives of insiders
are better aligned with the interests of other stakeholders such as depositors, debt holders, banking
supervisors, and society in general. Secondly, it could also allow insiders to credibly commit that
they will not divert corporate resources, reflected in higher market valuations. As a consequence,
it seems advisable that Corporate Governance Law should recommend allowing minority directors
to be present in bank boards. However, another important implication of our work is that regulation
and governance cannot and should not be viewed in isolation. Attempts to raise directors’ ability
to soundly and effectively monitor controlling shareholders are more likely to be successful if
bank-level governance is accompanied by a strict supervisory regime.
28
References
Adams, R., Ferreira, D., 2007. A theory of friendly boards. Journal of Finance 62, 217–250.
Adams, R., Hermalin, B., Weisbach, M., 2008. The role of boards of directors in corporate
governance: a conceptual framework and survey. NBER Working Paper 14486.
Adams, R., Mehran, M., 2012. Bank board structure and performance: Evidence for large bank
holding companies. Journal of Financial Intermediation, 21, 243-267.
Aebi, V., Gabriele S., Schmid, M., 2012. Risk management, corporate governance, and bank
performance in the financial crisis. Journal of Banking and Finance 36, 3213-3226.
Aggarwal, R., Erel, I., Stulz, R., Williamson R. 2009. Differences in governance practices between
US and foreign firms: measurement, causes and consequences. The Review of Financial
Studies.
Aggarwal, R., and R. Williamson, 2006, Did New Regulations Target the Relevant Corporate
Governance Attributes?, Working Paper, Georgetown University.
Agrawal, A., Knoeber, C.R., 1996. Firm performance and mechanisms to control agency problems
between managers and shareholders. Journal of Financial and Quantitative Analysis 31, 377-
390.
Aguilera R. V., Cuervo-Cazurra, A., 2009. Codes of Good Governance. Corporate Governance:
An International Review 17, 376-387.
Andres, P., Vallelado, E., 2008. Corporate governance in banking: the role of the board of
directors. Journal of Banking and Finance 32, 2570–2580.
Arellano, M., 1993. On the testing of correlated effects with panel data. Journal of Econometrics
59, 87-97.
Barry, T.A., Lepetit, L., Tarazi, A., 2011. Ownership structure and risk in publicly held and
privately owned banks. Journal of Banking and Finance 35, 1327–1340.
Basel Committee on Banking Supervision, 2006. Core principles for effective banking
supervision. Basel, Switzerland: Bank for International Settlements.
Basel Committee on Banking Supervision, 2010. Principles for enhancing corporate governance.
Basel, Switzerland: Bank for International Settlements.
Basel Committee on Banking Supervision, 2015. Corporate governance principles for banks.
Basel, Switzerland: Bank for International Settlements.
Beltratti, A., Stulz, R., M., 2012. The credit crisis around the globe: why did some banks perform
better?. Journal of Financial Economics 105, 1-17.
Berger, A. N., Kick, T., Schaeck, K., 2014. Executive board composition and bank risk taking.
Journal of Corporate Finance 28, 48–65.
Bhagat, S.,Black B., 1999. The uncertain relationship between board composition and firm
performance. Business Lawyer 54, 921-963.
Bhagat, S., Black, B., 2002. The non-correlation between board independence and long-term firm
performance. Journal of Corporation Law 27, 1231–1273.
Bharath, S.T., Shumway, T., 2008. Forecasting Default with Merton Distance to Default Model.
The review of Financial Studies, Vol.21 No.3, 1339-1369.
Billett, M.T., Garfinkel, J.A., O’Neal, E.S., 1998. The cost of market versus regulatory discipline
in banking. Journal of Financial Economic 3, 333–358.
Board of Governors of the Federal Reserve System, 2010. Bank holding company supervision
manual. Washington, DC: Board of Governors of the Federal Reserve System. Suppl. 38.
Booth, J. R., Cornett, M. M. and Tehranian, H., 2002. Boards of Directors, Ownership, and
Regulation, Journal of Banking & Finance 26, 1973-1996.
Brown, L.D., Caylor M.L., 2006. Corporate governance and firm valuation, Journal of Accounting
and Public Policy 25, 409-434.
Bruno, V., Claessens, S. 2010. Corporate governance and regulation: can there be too much of a
good think. Journal of Financial Intermediation 19, 461-482.
29
Caprio, G.,Laeven,L., Levine,R., 2007. Governance and bank valuation. Journal of Financial
Intermediation 16, 584–617.
Chhaochharia, V., Laeven, L., 2009. Corporate governance norms and practices ». Journal of
Financial Intermediation 18, 405-431.
Claessens, S., Djankov, S., Lang, L.H.P., 2000. The separation of ownership and control in East
Asian Corporations. Journal of Financial Economics 81–112.
Commission of the European Communities, 2005. Commission Recommendation on the role of
non-executive or supervisory directors of listed companies and on the committees of the
(supervisory) board. Official Journal of the European Union.
Commission of the European communities, 2007. Report on the application by the Member States
of the EU of the Commission. Recommendation on the role of non-executive or supervisory
directors of listed companies and on the committees of the (supervisory) board. Commission
staff working document.
Dahya, J., Dimitrov, O., McConnell, J.J., 2008. Dominant shareholders, corporate boards, and
corporate value: a cross-country analysis. Journal of Financial Economics 87, 2008.
De Haan, J., Vlahu, R., 2016. Corporate governance of banks: a survey. Journal of Economic
Survey.
Dewatripont, M., Tirole, J., 1994. The Prudential Regulation of Banks. MIT Press, Cambridge,
MA.
Djankov, S., La Porta, R., Lopez-de-Silanes, F., Shleifer, A., 2007. The law and economics of self
-dealing. Journal of Financial Economics 88, 430-465.
Doige, C, Karolyi, G.A., Stulz, R.M., 2004, Why are Foreign firms listed in the U.S worth more?,
Journal of Financial Economics 71, 205-238.
Dyck, A., Zingales, L., 2004. Private benefits of control: an international comparison. Journal of
Finance 59, 537–600.
Erkens, D., Hung, M., Matos, P., 2012. Corporate governance in the 2007–2008 financial crisis:
Evidence from financial institutions worldwide. Journal of Corporate Finance 18(2), 389–411.
European Union, 2010. Commission Staff Working Document on Corporate Governance in
Financial Institutions: Lessons to be drawn from Current Financial Crisis, Best Practices, 1-45.
Faccio, M., Lang, L.H.P., 2002. The ultimate ownership of Western European corporations.
Journal of Financial Economics 65, 365–395.
Faleye, Olubunmi and Karthik Krishnan, 2010. Risky lending: Does bank corporate
governance matter? Electronic copy available at: http://ssrn.com/abstract=1661837.
Fama, E.F., Jensen, M.C., 1983. Separation of ownership and control. Journal of Law &
Economics 26 (2), 301–325.
Galai, D., Masulis, R.W., 1976. The option pricing model and the risk factor of stock. Journal of
Financial Economics 3, 53–81.
Hagendorff, J., Collins, M., Keasey, K., 2010. Board monitoring, regulation, and performance in
the banking industry: Evidence from the market for corporate control. Corporate Governance:
An International Review 18(5), 381–395.
Hail L., Leuz C., 2009, Cost of capital effects and changes in growth expectations around U.S.
cross-listings. Journal of Financial Economics 93, 428-454.
Harris, M., Raviv, A., 2008. A theory of board control and size. Review of Financial Studies 21,
1797–1832.
Hermalin, B.E., Weisbach, M.S., 1998. Endogenously chosen boards of directors. American
Economic Review 88 (1), 96–118.
Hermalin, B.E., Weisbach, M.S., 2003. Boards of directors as an endogenously determined
institution: a survey of the economic literature. Federal Reserve Bank of New York Economic
Policy Review, 7–26.

30
Jensen, M.C., Meckling, W.H., 1976. Theory of the firm: Managerial behavior, agency costs and
ownership structure. Journal of Financial Economics 3, 305–460.
Johnson, S., La Porta, R., Lopez-de-Silanes, F., Shleifer, A., 2000. Tunneling. American Economic
Review, 90(2), 22-27.
Kirkpatrick, G., 2009. The corporate governance lessons from the financial crisis. Financial
Markets Trends, 2009/1, OECD.
Kumarand, P., Sivaramakrishnan, K., 2008. Who monitors the monitor? The effect of board
independence on executive compensation and firm value. Review of Financial Studies 21,
1371–1401.
Laeven L., Levine R., 2009. Bank governance, regulation and risk taking. Journal of Financial
Economics 93,259–275.
La Porta, R., Lopez-de-Silanes, F., Shleifer, A., 1999. Corporate ownership around the world. The
Journal of Finance 54, 471-517.
La Porta, R., Lopez-de-Silanes, F., Shleifer, A., Vishny, R., 2000. Investor protection and
corporate governance. Journal of financial economics 58, 3–27.
Lepetit L., Strobel. F., 2015. Bank Insolvency Risk and Z-Score Measures : A Refinement. Finance
Research Letters, 13, 214–224.
Lepetit L., Strobel. F., 2013. Bank insolvency risk and time-varying Z-score measures. Journal of
International Financial Markets, Institutions and Money 25, 73-87.
Levine, R.E., 2004. The Corporate Governance of Banks: A Concise Discussion of Concepts and
Evidence. Unpublished Working Paper. World Bank Policy Research Working Paper No. 3404.
Linck, J., Netter, J., Yang, T., 2009. Effects and unintended consequences of the Sarbanes-Oxley
Act on corporate boards. Rev. Financ. Stud. 22, 3287–3328.
MacAvoy, P., Cantor, S., Dana, J., Peck, S., 1983. All proposals for increased control of the
corporation by the board of directors: An economic analysis. Statement of the Business
Roundtable on the American Law Institute’s Proposed “Principles of Corporate Governance
and Structure: Restatement and Recommendations.” New York: Business Roundtable.
Mak, Y. T., Li, Y. 2001,'Determinants of Corporate Ownership and Board Structure: Evidence
from Singapore, Journal of Corporate Finance 7, 236-256.
Marques, L.B., Oppers S.E., (team leader), 2014. Risk-taking by banks: the role of governance and
executive pay. IMF Global Financial Stability Report: Risk taking, liquidity, and shadow
banking – Curing excess while promoting growth, 2014.
Merton, R.C., 1977. An analytic derivation of the cost of deposit insurance and loan guarantees.
Journal of Banking and Finance 1, 3–11.
Minton, B., Taillard, J., Williamson, R., 2014. Financial expertise of the board, risk taking, and
performance: Evidence from bank holding companies. Journal of Financial and Quantitative
Analysis 49(2), 351–380.
Nguyen, B.D., Nielsen, K.M., 2010. The value of independent directors: evidence from sudden
death. Journal of Financial Economics 98, 550–567.
OECD, 2010. Corporate Governance and Financial Crisis. OECD Steering Group on Corporate
Governance, Paris 1-34.
Pathan, S., 2009. Strong boards, CEO power and bank risk-taking. Journal of Banking & Finance
33(7), 1340–1350.
Pathan, S., Faff, R., 2013. Does board structure in banks really affect their performance? Journal
of Banking and Finance 37(5), 1573–1589.
Prowse, S., 1997. Corporate control in commercial banks. Journal of Financial Research 20, 509–
527.
Reese, W.A., and Weisback, M.S., 2002. Protection of minority shareholder interests, cross-listing
in the United States, and subsequent equity offerings. Journal of Financial Economics 66, 65-
104.

31
Rossi, S., Volpin., P., 2004. Cross-Country Determinants of Mergers and Acquisitions. Journal of
Financial Economics, 74(2): 277–304.
Shehzad, C.T., de Haan, J., Scholtens, B., 2010. The impact of bank ownership concentration on
impaired loans and capital adequacy. Journal of Banking & Finance 34, 399–408.
Shleifer, A., Vishny, R. W., 1997. A survey of corporate governance. Journal of Finance, 52(2),
737–783.
Shleifer, A., Vishny, R., 1986. Large Shareholders and Corporate Control. Journal of Political
Economy 94, 461-88.
Wang, T., Hsu, C., 2013. Board composition and operational risk events of financial institutions.
Journal of Banking and Finance 37, 2042-2051.
Wooldridge, J.M., 2002. Econometric Analysis of Cross Section and Panel Data. Cambridge, MA:
MIT Press.

32
Table 1: Number of banks in each country
Country Number of
listed banks
Number of banks in
the sample
Total assets of the sample
banks divided by total assets
of all listed banks in
Bankscope (%)
Austria 6 5 99.91
Belgium 4 3 98.98
Denmark 28 14 98.88
Finland 4 3 81.36
France 9 9 100
Germany 13 12 99.99
Greece 7 6 99.26
Ireland 2 2 100
Italy 19 16 99.13
Luxembourg 2 1 97.52
Netherlands 5 4 99.68
Norway 2 2 100
Portugal 4 3 93.78
Spain 7 7 100
Sweden 5 4 99.99
Switzerland 16 15 93.49
United Kingdom 12 12 100
Total 145 118 97.54

33
Table 2. Summary of Corporate Governance Codes on independent directors
Country First
code
Last
update
Definition of criteria of
independence Presence of independent directors Presence of
minority
directors
Disclosure on
Controlling
shareholders Generala Managers Controlling
shareholders Generala Managers
Controlling
shareholders
Austria 2002 2012 N N Y Majority / C N ≥ 1 / C N N
Belgium 1995 2009 Y Y Y ≥ 3 / C N N N Y
Denmark 2000 2014 Y Y Y Majority / C N N N N
Finland 2003 2015 Y Y Y Majority / C N ≥ 2 / C N N
France 1995 2016 Y Y Y Majority for widely held,
33% for concentrated / C N N N N
Germany 1996 2015 N N N Sufficient number / C N N N Y
Greece 1999 2013 Y Y Y ≥ 30% / C N N N N
Ireland 1991 2013 Y Y Y Majority / C N N N N
Italy 1999 2015 Y Y Y ≥ 2 / C N N Y / R N
Luxembourg 2006 2013 Y Y Y ≥ 2 / C N N N N
Netherlands 1996 2016 Y Y Y Majority / C N ≥ 1 / C N N
Norway 2004 2014 Y N Y Majority / C N ≥ 2 / C N N
Portugal 1999 2012 Y Y Y 25% / C N N N N
Spain 1996 2015 Y Y Y Majority / C N N Y / R Y
Sweden 1994 2015 Y Y Y Majority / C N ≥ 2 / C N N
Switzerland 2002 2014 N N Y Majority / C N N N N
UK 1992 2014 Y Y Y Majority / C N N N N
Source: Corporate Governance Code, European Corporate Governance Institute.
Note: N = No; Y = Yes; C = Comply or Explain; R = Recommendation. a Criteria of independence are defined, but without indicating what the independence is relative to.

34
Table 3: Variable definition, data sources and summary statistics
Variables Definition Source Mean Median Standard
Deviation Min. Max
Dependent variables
Tobin_Q Bank value: Book value of assets minus the book value of equity plus the market value
of equity divided by the book value of assets Bloomberg 1.07 0.99 0.38 0.56 6.74
DD Distance to default computed using the Merton model (see Appendix 4 for details). Bloomberg,
Bankscope 3.31 2.84 3.08 -5.45 19.51
Indices of relatedness of board of directors
Minority
Index on the relatedness of board of directors to minority shareholders having either
Bloomberg,
annual reports
(Details on the
calculation of
these indices are
given in
Appendix 3)
- less than 20% of relative power 3.63 3 3.54 0 10
- less than 20% of control rights 3.47 2 3.55 0 10
Controlling
Index on the relatedness of board of directors to controlling shareholders having either
- more than 20% of relative voting power 2.26 0 3.33 0 10
- more than 20% of control rights 2.13 0 3.25 0 10
Independent
Index on the independence of board of directors to both controlling and minority
shareholders
- at the threshold of 20% of relative voting power 6.28 6.5 2.91 0 10
- at the threshold of 20% of control rights 6.43 6.5 2.85 0 10
Manager Percentage of directors that are related to managers. Annual Reports 51.57 50.00 27.81 0 100

35
Bank-level variables
BoardSize Natural logarithm of the number of directors on the board Bloomberg 2.31 2.40 0.50 0.69 3.25
Size Natural logarithm of Total Assets
Bankscope
16.94 16.95 2.83 8.60 21.75
Risk The standard deviation of monthly stock returns over the last twelve months 2.79 0.33 29.24 0.20 522.7
GrowthAsset The annual change in total asset from year t to year t-1 divided by total assets year t-1
(%) 0.09 0.02 0.70 -0.35 12.67
Loan The ratio of gross loan to total assets (%) 0.49 0.54 0.25 0 0.91
Capital Total equity divided by total assets (%) 0.14 0.07 0.18 -0.02 0.99
Deposit Deposits divided by total assets (%) 0.58 0.57 0.20 0.01 0.94
Operating ratio The ratio of total operating expenses over total operating income (%) 1.38 1.49 7.82 -3.75 23.56
ROE Return on equity ratio (%) 0.15 0.05 2.55 -3.12 6.70
Country-level variables
GDP GDP growth rate (%) World Bank 0.36 0.58 1.61 -4.02 3.59
Legal
Product of Revised anti-director index (RADI) and index Rule of Law (RoL)
RADI: Takes the value of 1 for each of these indicators: Vote by mail, Shares not
deposited, Cumulative voting, Oppressed non-controlling, Pre-emptive rights and
Capital to call a meeting
RoL: index measuring the quality of law enforcement
Djankov et al.
(2008)
Worldwide
Governance
Indicators (World
Bank
5.24 5.27 2.32 0.71 8.83
SupPow
Index measuring the strength of supervisory regime. The yes/no responses to the
following questions are coded as 1/0: (1) Does the supervisory agency have the right to
meet with external auditors to discuss their report without the approval of the bank? (2)
Are auditors required by law to communicate directly to the supervisory agency any
presumed involvement of bank directors or senior managers in illicit activities, fraud,
or insider abuse? (3) Can supervisors take legal action against external auditors for
negligence? (4) Can the supervisory authority force a bank to change its internal
organizational structure? (5) Are off-balance sheet items disclosed to supervisors? (6)
Can the supervisory agency order the bank’s directors or management to constitute
Bank regulation
and supervision
database (The
World Bank
2003)
10 11 2.33 4 13

36
provisions to cover actual or potential losses? (7) Can the supervisory agency suspend
directors’ decision to distribute: (a) Dividends? (b) Bonuses? (c) Management fees? (8)
Can the supervisory agency legally declare - such that this declaration supersedes the
rights of bank shareholders - that a bank is insolvent? (9) Does the Banking Law give
authority to the supervisory agency to intervene that is, suspend some or all ownership
rights in a problem bank? And (10) Regarding bank restructuring and reorganization,
can the supervisory agency or any other government agency do the following: (a)
Supersede shareholder rights? (b) Remove and replace management? (c) Remove and
replace directors? A higher value indicates wider and stronger authority for bank
supervisors.
Instrument variables
indy Independence : percentage of years since 1776 that a country has been independent
Beck et al. (2003)
0.94 1 0.18 0.29 1
avelf Ethnic fractionalization - probability that two randomly selected individuals in a
country will not speak the same language 0.12 0.07 0.11 0.0025 0.36
lat_llsv Latitude: absolute value of the latitude of a country 0.54 0.56 0.09 0.20 0.71
legor_uk British legal origin (dummy variable) 0.12 0 0.33 0 1
legor_fr French legal origin (dummy variable) 0.40 0 0.49 0 1
legor_ge German legal origin (dummy variable) 0.27 0 0.45 0 1
legor_sc Scandinavian legal origin (dummy variable) 0.21 0 0.40 0 1
RoL Rule of Law
Worldwide
Governance
Indicators (2016)
1.45 1.72 0.59 0.24 2.12
Avg_DepRel Average of the percentage of directors related to controlling shareholders in a country - 2.12 2.33 1.09 0 5.5

37
Table 4: Statistics on ownership structure (threshold of control at 20%)
% of widely
held banks
% of
controlled
banks
Controlled banks
Banks with
only direct
controlling
shareholders
(%)
Banks with
pyramidal
structure
(%)
Average voting
rights of the
biggest
shareholder
(%)
Average
voting rights
of controlling
shareholders
(%)
Average voting
rights of
minority
shareholders
(%)
Austria 20 80 0 80 71.25 71.25 28.75
Belgium 0 100 33.33 66.67 41.34 41.34 58.66
Denmark 57.14 42.86 28.57 14.29 51.96 55.76 44.24
Finland 33.33 66.67 33.33 33.33 61.35 61.35 38.65
France 14.29 85.71 57.14 28.57 54.46 63.15 36.85
Germany 33.33 66.67 41.67 25 66.67 66.67 33.34
Greece 0 100 50 50 53.11 58.16 41.84
Ireland 50 50 50 0 99.42 99.42 0.58
Italy 25 75 50 25 48.65 55.51 44.49
Luxembourg 100 0 0 0 - - -
Netherlands 50 50 50 0 97.81 97.81 2.19
Norway 0 100 100 0 32.50 32.50 67.50
Portugal 66.67 33.33 33.33 0 46.22 46.22 53.78
Spain 42.86 57.14 28.57 28.57 48.42 48.42 51.58
Sweden 50 50 25 25 21.20 21.20 78.80
Switzerland 50 50 14.29 35.71 56.49 59.34 40.66
United
Kingdom 58.33 41.67 33.33 8.33 49.74 55.11 44.89
AVERAGE 38 62 - - 56.29 58.33 41.67

38
Table 5: Statistic on relatedness of board of directors to shareholders in widely held and controlled banks (threshold of control at
20%)
Controlled banks Widely held banks
Number
of
directors
(average)
Relatedness to shareholders
Number
of
directors
(average)
Relatedness to shareholders Relatedness to managers
Related
directors to
Controlling
SH (%)
Related
directors to
minority SH
(%)
Independent
directors from
shareholders
(%)
Related
directors to
minority SH
(%)
Independent
directors
from minority
SH (%)
Related
directors to
managers (%)
Independent
directors
from
managers (%)
Austria 18.2 14.47 27.63 57.89 15 26.67 73.33 66.67 33.33
Belgium 15.33 23.91 10.87 65.22 - - - -
Denmark 9.21 17.54 3.51 78.95 9 5.56 94.44 74.60 25.40
Finland 7.67 6.67 6.67 86.67 8 75 25 12.50 87.50
France 11.86 26.09 20.29 53.62 14 14.29 85.71 28.57 71.43
Germany 10.5 22.37 3.95 73.68 12.5 4 96 70 30
Greece 14.5 0 3.45 96.55 - - - -
Ireland 12.5 0 9.09 90.91 14 14.29 85.71 42.86 57.14
Italy 13 14.49 10.87 74.64 17.5 24.29 75.71 34.41 65.59
Luxembourg - - - - 8 0 100 37.50 62.50
Netherlands 7.75 5.26 5.26 89.47 6 25 75 0 100
Norway 6.5 0 15.38 84.62 - - - - -
Portugal 22 13.04 15.22 71.74 20 5 95.00 65 35
Spain 13.57 13.73 62.75 23.53 14.67 72.73 27.27 36.01 63.99
Sweden 11 3.85 26.92 69.23 9 38.89 61.11 45.83 54.17
Switzerland 7.86 35 5 60 8.33 12 88 50.21 49.79
United
Kingdom 12 6.12 34.69 59.18 13.57 60 40 41.51 58.49
AVERAGE 11.55 13.44 18.29 68.27 11.67 29.18 70.82 43.88 56.12
Note: SH=Shareholders

39
Table 6: Statistic on the relatedness of board of directors to shareholders according to different criteria (threshold of control at 20%)
Controlled banks Widely held banks
Employee of
shareholder(s)
(%)
Shareholder
of the bank
(%)
Same family
name with
shareholder(s)
(%)
Shareholder
of
shareholders
of the bank
(%)
Politician /
Employee
of
government
agency (%)
Employee of
shareholder(s)
(%)
Shareholder
of the bank
(%)
Same family
name with
shareholder(s)
(%)
Shareholder
of
shareholders
of the bank
(%)
Politician /
Employee
of
government
agency (%)
Austria 100 0 0 0 0 100 0 0 0 0
Belgium 87.50 0 0 0 12.50 - - - - -
Denmark 100 0 0 0 0 100 0 0 0 0
Finland 80.00 20.00 0 0 0 100 0 0 0 0
France 88.89 2.78 8.33 0.00 0 100 0 0 0 0
Germany 94.74 5.26 0 0 0 100 0 0 0 0
Greece 100.00 0.00 0 0 0 - - - - -
Ireland 100 0 0 0 0 50 0 0 0 50
Italy 64.71 35.29 0 0 0 100 0 0 0 0
Luxembourg - - - - - 0 0 0 0 0
Netherlands 100 0 0 0 0 100 0 0 0 0
Norway 100 0 0 0 0 - - - - -
Portugal 85.71 7.14 7.14 0 0 100 0 0 0 0
Spain 16.67 83.33 0 0 0 11.76 85.29 2.94 0 0
Sweden 100 0 0 0 0 85.71 14.29 0 0 0
Switzerland 80.65 0 0 19.35 0 16.67 83.33 0 0 0
United
Kingdom 26.32 68.42 5.26 0 0 33.33 64.91 1.75 0 0
AVERAGE 82.82 13.89 1.30 1.21 0.78 76.73 19.06 0.36 0 3.85

40
Table 7: Relatedness of directors to shareholders and agency conflicts in controlled banks (Eq. (1) using threshold of control at 20% of relative
voting power, GLS random effects estimators)
Tobin’s Q Distance to default
(1) (2) (3) (4) (5) (6) (7) (8)
Minority 0.0695*** 0.0624*** 0.124*** 0.124***
(7.58) (4.82) (7.04) (6.73)
Controlling -0.0187*** -0.0164* -0.0516*** -0.0485***
(-2.96) (-1.82) (-3.92) (-3.47)
Independent -0.0253** -0.0243
(-2.13) (-1.00)
BoardSize 0.0189 0.179*** 0.0216 -0.0275 0.833*** 1.004*** 0.873*** 0.882***
(0.23) (3.72) (0.26) (-0.29) (6.61) (8.08) (5.80) (5.09)
Size -0.129*** -0.158*** -0.124*** -0.133*** -0.376*** -0.313*** -0.380*** -0.307***
(-7.82) (-9.65) (-6.96) (-6.75) (-13.64) (-10.14) (-12.53) (-8.76)
Growth -0.158** -0.151* -0.157** -0.173** 1.440*** 1.703*** 1.297*** 1.689***
(-2.00) (-1.88) (-1.99) (-2.15) (9.55) (11.90) (8.75) (10.30)
Capital -1.070*** -0.890*** -0.897*** -0.860*** 5.120*** 6.486*** 4.976*** 6.517***
(-5.81) (-4.95) (-5.06) (-4.38) (10.00) (12.14) (9.78) (11.64)
Loan -0.405*** -0.425*** -0.468*** -0.425*** 0.820*** 0.860*** 0.649*** 1.003***
(-3.26) (-4.18) (-3.20) (-3.20) (3.82) (4.51) (2.83) (4.97)
Risk 0.00309*** 0.00277*** 0.00289*** 0.00272***
(3.81) (3.69) (3.54) (3.44)
Deposit -2.562*** -2.495*** -2.338*** -2.689***
(-10.20) (-9.62) (-9.56) (-9.64)
Operating 0.00124 0.000865 0.000915 0.00146
(1.13) (0.74) (0.86) (1.21)
ROE 0.00428 0.00382 -0.000163 0.0109
(0.31) (0.26) (-0.01) (0.72)
Legal -0.0624*** -0.0446*** -0.0620*** -0.0450*** 0.0145 0.0563** -0.000279 0.0515**
(-4.98) (-4.03) (-4.84) (-3.50) (0.64) (2.56) (-0.01) (2.19)
GDP -0.00388 -0.00460 -0.00188 -0.00750 -0.00348 0.00720 0.0186 0.00417
(-0.47) (-0.56) (-0.23) (-0.85) (-0.21) (0.44) (1.01) (0.21)
_cons 3.671*** 3.895*** 3.649*** 4.112*** 5.651*** 4.180*** 5.852*** 4.422***
(18.38) (16.35) (16.73) (15.18) (9.02) (6.76) (10.06) (5.76)
N 216 216 216 216 220 220 220 220
Robust Hausman test
Chi-square 5.577 3.841 5.177 4.717 8.072 8.656 8.085 8.429
p-value 0.6945 0.8712 0.7385 0.7874 0.5269 0.4696 0.5256 0.4915
See Table 3 for Definition of variables. z-statistics are in parentheses, with *, **, and *** denote significance at 10%, 5% and 1%

41
Table 8: Relatedness of directors to shareholders and agency conflicts in controlled banks (Eq. (1) using threshold of control at 20% of control
rights, GLS random effects estimators)
Tobin’s Q Distance to default
(1) (2) (3) (4) (5) (6) (7) (8)
Minority 0.0600*** 0.0534*** 0.0954*** 0.0867***
(6.41) (5.72) (5.54) (4.38)
Controlling -0.0287*** -0.0175** -0.0532*** -0.0271*
(-3.05) (-2.12) (-3.89) (-1.70)
Independent -0.0242 -0.0195
(-1.59) (-0.71)
BoardSize -0.0682 -0.0797 -0.0127 0.761*** 1.000*** 0.697*** 0.897***
(-0.67) (-0.82) (-0.13) (6.90) (9.12) (5.37) (5.16)
Size -0.119*** -0.131*** -0.112*** -0.138*** -0.359*** -0.308*** -0.335*** -0.302***
(-6.46) (-10.33) (-6.09) (-7.03) (-12.53) (-10.40) (-11.47) (-8.60)
Growth -0.150* -0.170** -0.149* -0.173** 1.483*** 1.699*** 1.475*** 1.715***
(-1.89) (-2.11) (-1.89) (-2.17) (9.20) (11.62) (9.22) (10.58)
Capital -1.027*** -0.968*** -1.027*** -0.938*** 5.224*** 6.447*** 5.411*** 6.624***
(-5.44) (-5.26) (-5.60) (-4.61) (9.68) (11.94) (9.99) (11.77)
Loan -0.407*** -0.586*** -0.533*** -0.513*** 0.888*** 0.805*** 0.797*** 0.998***
(-3.29) (-4.58) (-3.91) (-3.27) (3.86) (4.17) (2.97) (4.61)
Risk 0.00294*** 0.00214*** 0.00267*** 0.00275***
(3.72) (2.93) (3.36) (3.48)
Deposit -2.704*** -2.528*** -2.670*** -2.661***
(-10.95) (-9.71) (-10.83) (-9.57)
Operating 0.00129 0.000831 0.00116 0.00143
(1.12) (0.71) (1.02) (1.19)
ROE 0.00679 0.00424 0.00752 0.0107
(0.47) (0.29) (0.53) (0.71)
Legal -0.0599*** -0.0331*** -0.0592*** -0.0436*** 0.0373* 0.0569*** 0.0168 0.0513**
(-4.75) (-3.04) (-4.72) (-3.22) (1.79) (2.72) (0.71) (2.15)
GDP -0.00417 -0.00303 -0.00100 -0.00652 -0.00338 0.00329 0.0124 0.00431
(-0.48) (-0.34) (-0.12) (-0.74) (-0.19) (0.21) (0.66) (0.22)
_cons 3.710*** 3.944*** 3.758*** 4.203*** 5.560*** 4.139*** 5.466*** 4.243***
(17.69) (16.47) (17.53) (15.21) (8.99) (6.79) (8.69) (5.49)
N 216 216 216 216 220 220 220 220
Robust Hausman test
Chi-square 5.010 3.962 4.870 4.730 8.269 8.649 8.275 8.477
p-value 0.7565 0.8606 0.7714 0.7860 0.5073 0.4703 0.5067 0.4869
See Table 3 for Definition of variables. z-statistics are in parentheses, with *, **, and *** denote significance at 10%, 5% and 1%.

42
Table 9: Relatedness of directors to shareholders and agency conflicts in widely held banks (Eq. (1) using threshold of control at 20% of relative
voting power or control rights, GLS random effects estimators)
Relative voting power Control rights
Tobin’s Q Distance to default Tobin_Q Distance to default
(1) (2) (3) (4) (5) (6) (7) (8)
Minority 0.00470** 0.00728** -0.0390 -0.00483 0.00408* 0.00722** -0.0479* -0.00562
(2.01) (2.50) (-1.46) (-0.19) (1.80) (2.38) (-1.77) (-0.21)
Manager 0.000547 0.0181*** 0.000529 0.0182***
(1.48) (5.14) (1.39) (5.08)
BoardSize -0.0222 -0.0256 -0.115 -0.286 -0.0233 -0.0287 -0.0588 -0.276
(-1.06) (-1.10) (-0.47) (-1.31) (-1.10) (-1.19) (-0.23) (-1.23)
Size -0.00452 -0.00568 -0.0292 0.00897 -0.00292 -0.00400 -0.0335 0.0163
(-1.09) (-1.16) (-0.46) (0.12) (-0.72) (-0.84) (-0.53) (0.23)
Growth 0.0852** 0.0824** 3.015*** 2.855*** 0.0821** 0.0753* 3.185*** 2.882***
(2.13) (1.98) (3.81) (4.00) (2.04) (1.80) (4.00) (4.04)
Capital 0.0187 -0.0351 16.94*** 18.18*** 0.0413 -0.00650 17.42*** 18.59***
(0.36) (-0.54) (5.54) (5.80) (0.77) (-0.09) (5.67) (5.93)
Loan -0.0855*** -0.110*** -0.0866 -0.811* -0.0679** -0.0869** -0.112 -0.867*
(-3.26) (-3.10) (-0.15) (-1.79) (-2.35) (-2.19) (-0.19) (-1.85)
Risk -0.0000381 -0.0000914 -0.0000314 -0.0000787
(-0.60) (-0.80) (-0.38) (-0.67)
Deposit -2.878*** -2.139*** -2.948*** -2.139***
(-4.18) (-3.26) (-4.25) (-3.25)
Operating 0.0171 0.0337* 0.0161 0.0330*
(0.88) (1.95) (0.83) (1.90)
ROE 0.540 0.0727 0.584 0.0524
(1.10) (0.17) (1.18) (0.12)
Legal 0.00818** 0.00765* 0.0787 0.0694 0.00723** 0.00657 0.0852* 0.0735
(2.20) (1.65) (1.55) (1.29) (2.01) (1.42) (1.69) (1.34)
GDP 0.00621** 0.00605** 0.211*** 0.215*** 0.00618** 0.00619** 0.217*** 0.211***
(2.23) (1.97) (3.80) (4.21) (2.22) (2.03) (3.89) (4.08)
_cons 1.099*** 1.112*** 1.283 0.120 1.069*** 1.080*** 1.244 -0.0712
(15.66) (13.22) (0.90) (0.07) (15.00) (12.58) (0.87) (-0.04)
N 129 120 120 111 129 120 120 111
Robust Hausman test
Chi-square 4.317 9.370 12.466 13.487 4.257 9.331 12.018 13.113
p-value 0.7427 0.3121 0.1883 0.1977 0.7497 0.3151 0.2123 0.2174
See Table 3 for Definition of variables. z-statistics are in parentheses, with *, **, and *** denote significance at 10%, 5% and 1%.
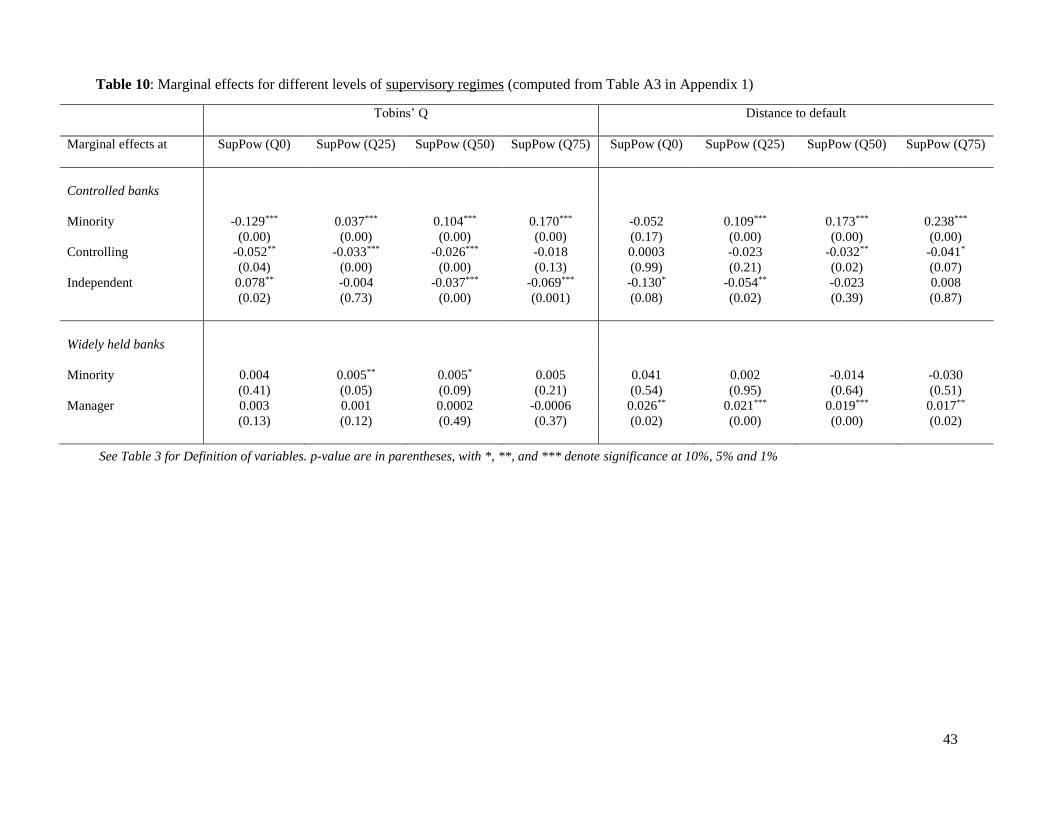
43
Table 10: Marginal effects for different levels of supervisory regimes (computed from Table A3 in Appendix 1)
Tobins’ Q Distance to default
Marginal effects at
SupPow (Q0) SupPow (Q25) SupPow (Q50) SupPow (Q75) SupPow (Q0) SupPow (Q25) SupPow (Q50) SupPow (Q75)
Controlled banks
Minority -0.129*** 0.037*** 0.104*** 0.170*** -0.052 0.109*** 0.173*** 0.238***
(0.00) (0.00) (0.00) (0.00) (0.17) (0.00) (0.00) (0.00)
Controlling -0.052** -0.033*** -0.026*** -0.018 0.0003 -0.023 -0.032** -0.041*
(0.04) (0.00) (0.00) (0.13) (0.99) (0.21) (0.02) (0.07)
Independent 0.078** -0.004 -0.037*** -0.069*** -0.130* -0.054** -0.023 0.008
(0.02) (0.73) (0.00) (0.001) (0.08) (0.02) (0.39) (0.87)
Widely held banks
Minority 0.004 0.005** 0.005* 0.005 0.041 0.002 -0.014 -0.030
(0.41) (0.05) (0.09) (0.21) (0.54) (0.95) (0.64) (0.51)
Manager 0.003 0.001 0.0002 -0.0006 0.026** 0.021*** 0.019*** 0.017**
(0.13) (0.12) (0.49) (0.37) (0.02) (0.00) (0.00) (0.02)
See Table 3 for Definition of variables. p-value are in parentheses, with *, **, and *** denote significance at 10%, 5% and 1%

44
Table 11: Marginal effects for different levels of minority shareholders protection (computed from Table A4 in Appendix 1)
Tobin’s Q Distance to default
Marginal effects at Legal (Q0) Legal (Q25) Legal (Q50) Legal (Q75) Legal (Q0) Legal (Q25) Legal (Q50) Legal (Q75)
Controlled banks
Minority 0.269*** 0.108*** 0.054*** -0.013 0.282*** 0.178*** 0.143*** 0.099***
(0.00) (0.00) (0.00) (0.31) (0.00) (0.00) (0.00) (0.00)
Controlling -0.036** -0.011 -0.003 0.007 -0.083*** -0.048*** -0.036*** -0.021
(0.02) (0.15) (0.69) (0.47) (0.00) (0.00) (0.01) (0.23)
Independent -0.111*** -0.039*** -0.015 0.015 0.136** 0.006 -0.038* -0.093***
(0.00) (0.001) (0.20) (0.32) (0.01) (0.82) (0.09) (0.00)
Widely held banks
Minority 0.007** 0.007*** 0.008*** 0.008*** 0.018 -0.005 -0.012 -0.021
(0.04) (0.01) (0.00) (0.00) (0.78) (0.88) (0.64) (0.47)
Manager 0.0008 0.0007 0.0006 0.0006 0.071*** 0.034*** 0.022*** 0.006
(0.569) (0.28) (0.15) (0.17) (0.00) (0.00) (0.00) (0.17)
See Table 3 for Definition of variables. p-value are in parentheses, with *, **, and *** denote significance at 10%, 5% and 1%

45
Appendix 1
Figures and Tables
Figure A1. Example on the chain of control
We have two minority (non-controlling) shareholders: B5 and B6
We have three controlling shareholders:
- One direct controlling shareholder: B4, with 20% of control rights.
- Two indirect ultimate owners: D1 and D3, with respectively 40% (20% + 20%) and 30% of
control rights.
Coalitions are possible between D1 and D3, and between B4 and D1 to obtain a total control
rights of at least 51%.
B1 (20%) B2 (30%) B3 (20%)
C1 (10%) C2 (40%) C3 (40%)
D1
(50%)
D2
(10%)
D3
(40%)
Bank A
B4 (20%) B5 (5%)
D1 (30%)
B6 (5%)

46
Table A1. Matrix of correlation
1 2 3 4 5 6 7 8 9 10 11 12 13 14 15 16 17 18 19
1 Tobin_Q 1 2 DD 0.660*** 1
3 Minority (BPI) 0.105* 0.134** 1
4 Controlling (BPI) -0.0728 -0.0309 -0.147** 1 5 Independent (BPI) -0.0286 -0.0996* -0.825*** -0.297*** 1
6 Minority (CR) 0.0902 0.137** 0.916*** -0.0552 -0.805*** 1
7 Controlling (CR) -0.0366 -0.0406 -0.0945 0.829*** -0.276*** -0.194*** 1 8 Independent (CR) -0.0349 -0.0909 -0.815*** -0.257*** 0.970*** -0.819*** -0.251*** 1
9 Manager 0.0454 0.182*** -0.0350 0.293*** -0.0448 -0.0221 0.295*** -0.0166 1
10 BoardSize -0.157** -0.111* 0.148** 0.0412 -0.207*** 0.203*** 0.00149 -0.213*** 0.0487 1 11 Size -0.374*** -0.393*** 0.235*** -0.129* -0.216*** 0.184*** -0.0513 -0.222*** -0.276*** 0.056 1
12 GrowthAsset 0.114* 0.0663 0.0274 0.0936 -0.0688 0.0311 0.0779 -0.0634 0.0904 -0.102* -0.0949 1
13 Capital 0.391*** 0.629*** 0.0217 0.0808 -0.00917 0.0343 0.0587 0.0150 0.231*** -0.210*** -0.561*** -0.0112 1 14 Loan -0.197*** -0.398*** 0.00674 -0.122* 0.0603 0.0123 -0.134** 0.0758 0.0254 0.183*** 0.205*** -0.0792 -0.464*** 1
15 Risk -0.0119 -0.0285 -0.0512 -0.0424 0.0634 -0.0548 -0.0330 0.0643 0.0777 0.00436 0.00833 -0.0128 -0.0185 0.0218 1
16 Deposit -0.181*** -0.268*** -0.123* 0.0157 0.0866 -0.114* -0.0121 0.123* 0.0743 -0.200*** -0.181*** 0.0553 -0.373*** 0.438*** 0.0264 1 17 Operating -0.00106 -0.0240 -0.0388 -0.0546 0.0598 -0.0407 -0.0522 0.0620 -0.0427 0.0146 0.0245 -0.00453 -0.0567 0.0708 0.00881 0.0272 1
18 Legal -0.0293 0.0727 0.193*** -0.109* -0.116* 0.172*** -0.0828 -0.145** -0.00331 -0.257*** 0.0129 -0.0692 -0.0529 0.0158 0.0625 0.0617 -0.0905 1
19 GDP 0.0621 0.107* 0.173*** 0.0652 -0.184*** 0.151** 0.0762 -0.179*** 0.0952 -0.199*** -0.00675 -0.0523 0.0972 -0.190*** 0.0432 -0.00989 -0.171*** 0.579*** 1
Note: BPI = the “Banzhaf Power Index” (BPI) is used to measure the relative voting power of each controlling shareholder; CR = control rights are used to differentiate between controlling or minority shareholders.

47
Table A2: Tests of endogeneity
I/ Sample of controlled banks (Eq. (1) using threshold of control at 20% of relative voting power)
Tobin’s Q Distance to default
(1) (2) (3) (4) (5) (6)
Minority 0.0299 0.206
(0.79) (1.41)
Controlling -0.0512 -0.107
(-1.37) (-1.02)
Independent -0.0131 -0.0347
(-0.17) (-0.20)
BoardSize 0.0165 0.0554 0.0124 0.660** 0.858** 0.692**
(0.18) (0.51) (0.12) (2.06) (2.50) (2.03)
Size -0.0774*** -0.0732*** -0.0746*** -0.306*** -0.271*** -0.272***
(-3.92) (-3.24) (-3.66) (-3.96) (-3.74) (-3.73)
Growth -0.0802 -0.0660 -0.0774 0.627 0.880* 0.797*
(-0.88) (-0.73) (-0.84) (1.27) (1.83) (1.66)
Capital -0.318 -0.247 -0.250 6.399*** 7.152*** 7.092***
(-1.12) (-0.81) (-0.87) (5.36) (6.73) (6.49)
Loan -0.203 -0.249 -0.193 0.253 0.332 0.558
(-1.33) (-1.37) (-1.16) (0.42) (0.56) (1.01)
Risk -0.000200 -0.000628 -0.000317
(-0.13) (-0.43) (-0.21)
Deposit -1.716** -1.858*** -2.028***
(-2.39) (-2.64) (-3.01)
Operating 0.000221 0.0000388 0.000273
(0.11) (0.02) (0.14)
ROE -0.00576 -0.00546 -0.00281
(-0.24) (-0.22) (-0.12)
Legal -0.0193 -0.0122 -0.0128 0.00655 0.0621 0.0710
(-0.98) (-0.63) (-0.65) (0.09) (1.08) (1.21)
GDP -0.00491 -0.0000413 -0.00542 -0.0620 -0.0282 -0.0583
(-0.50) (-0.00) (-0.51) (-1.24) (-0.51) (-1.08)
_cons 2.503*** 2.549*** 2.587*** 4.442*** 3.858*** 4.137*
(8.42) (7.21) (3.23) (3.02) (2.78) (1.77)
N 217 217 217 222 222 222
Instrument
variables
Avelf
legor_fr
avg_DelRel
indy
Legor_sc avelf
legor_fr
avg_DelRel
lat_llsv
lat_llsv
avelf
F-test 12.33 13.51 11.10 11.46 10.66 13.31
[0.00] [0.00] [0.00] [0.00] [0.00] [0.00]
LM statistics 23.20 25.17 11.049 21.92 20.53 13.23
[0.00] [0.00] [0.00] [0.00] [0.00] [0.00]
Hasen statistic 1.641 0.002 - 0.608 0.223 0.223
[0.20] [0.96] - [0.44] [0.64] [0.64]
Endogeneity test 0.12 3.67 0.09 1.17 0.78 0.15
[0.99] [0.88] [1.00] [0.98] [0.99] [0.99]
See Table 3 for Definition of variables. z-statistics are in parentheses of 2SLS regressions, p-values are in
parentheses of tests of endogeneity, with *, **, and *** denote significance at 10%, 5% and 1%

48
II/ Sample of controlled banks (Eq. (1) using threshold of control at 20% of control rights)
Tobin’s Q Distance to default
(1) (2) (3) (4) (5) (6)
Minority 0.0724* 0.190
(1.67) (1.43)
Controlling -0.0503 -0.118
(-1.29) (-1.10)
Independent 0.0449 -0.0386
(0.71) (-0.24)
BoardSize -0.0686 0.00500 0.0409 0.405 0.692** 0.691**
(-0.62) (0.05) (0.39) (1.03) (2.16) (2.07)
Size -0.0687*** -0.0646*** -0.0715*** -0.264*** -0.250*** -0.272***
(-3.25) (-2.78) (-3.35) (-3.53) (-3.33) (-3.76)
Growth -0.0885 -0.0772 -0.0721 0.609 0.824* 0.803*
(-0.95) (-0.84) (-0.77) (1.24) (1.72) (1.69)
Capital -0.434 -0.269 -0.190 6.403*** 6.980*** 7.109***
(-1.41) (-0.89) (-0.65) (5.29) (6.43) (6.66)
Loan -0.227 -0.283 -0.234 0.195 0.250 0.561
(-1.37) (-1.50) (-1.35) (0.31) (0.40) (1.01)
Risk -0.000192 -0.000616 -0.000537
(-0.13) (-0.42) (-0.35)
Deposit -1.822** -2.005*** -2.011***
(-2.56) (-2.91) (-2.97)
Operating 0.000147 -0.0000202 0.000279
(0.07) (-0.01) (0.14)
ROE -0.00368 -0.00429 -0.00279
(-0.15) (-0.18) (-0.12)
Legal -0.0302 -0.0120 -0.00575 0.0124 0.0608 0.0706
(-1.43) (-0.63) (-0.29) (0.17) (1.05) (1.22)
GDP -0.00471 -0.000885 -0.00280 -0.0631 -0.0325 -0.0580
(-0.47) (-0.09) (-0.27) (-1.25) (-0.61) (-1.11)
_cons 2.528*** 2.515*** 2.015*** 4.420*** 4.029*** 4.157*
(7.91) (7.30) (2.87) (2.95) (2.84) (1.93)
N 217 217 217 222 222 222
Instrument
variables
Legor_ge
Legor_sc
avg_DepRel
MINOR_20
avelf
indy
Avelf
Legor_fr
avg_DepRel
lat_llsv
lat_llsv
avelf
F-test 10.66 13.64 10.63 10.06 11.52 13.08
[0.00] [0.00] [0.00] [0.00] [0.00] [0.00]
LM statistics 20.36 25.38 20.30 19.47 22.02 24.66
[0.00] [0.00] [0.00] [0.00] [0.00] [0.00]
Hasen statistic 1.423 0.185 0.124 0.316 0.024 0.203
[0.23] [0.67] [0.72] [0.57] [0.88] [0.65]
Endogeneity test 1.18 1.49 0.07 1.94 0.99 0.49
[0.98] [0.96] [1.00] [0.93] [0.98] [0.99]
See Table 3 for Definition of variables. z-statistics are in parentheses of 2SLS regressions, p-values are in
parentheses of tests of endogeneity, with *, **, and *** denote significance at 10%, 5% and 1%

49
III/ Sample of widely held banks (Eq. (1) using threshold of control at 20% of relative voting power
or control rights)
Relative voting power Control rights
Tobin’s Q Distance to default Tobin’s Q Distance to default
Minority 0.0107 0.358 0.0243 0.613**
(0.55) (1.60) (1.42) (2.05)
BoardSize -0.0908* -0.897 -0.124** -1.292*
(-1.70) (-1.38) (-2.15) (-1.87)
Size 0.00210 -0.187 -0.000763 -0.246
(0.13) (-0.87) (-0.05) (-1.04)
Growth 0.192*** 0.612 0.187*** 0.579
(2.86) (0.99) (2.77) (0.94)
Capital 0.235 20.35*** 0.213 18.95***
(1.14) (5.63) (1.04) (5.19)
Loan -0.0635 -2.154* -0.0417 -1.645
(-0.72) (-1.67) (-0.44) (-1.15)
Risk -0.0000138 0.00000264
(-0.09) (0.02)
Deposit -0.338 -0.231
(-0.33) (-0.22)
Operating 0.00902 0.0104
(0.65) (0.75)
ROE -0.140 -0.142
(-0.29) (-0.29)
Legal 0.00881 0.0779 0.00256 -0.00443
(0.71) (0.46) (0.20) (-0.02)
GDP 0.00378 0.0962** 0.00387 0.0874*
(0.69) (2.07) (0.70) (1.90)
_cons 1.099*** 4.496 1.200*** 5.653
(3.51) (1.13) (4.29) (1.31)
N 129 121 129 121
Instrument variables legor_uk
legor_fr
legor_ge
legor_sc
legor_ge
legor_sc
RoL
avelf
F-test 14.68 14.70 17.25 12.64
[0.00] [0.00] [0.00] [0.00]
LM statistics 25.70 25.73 29.30 22.96
[0.00] [0.00] [0.00] [0.00]
Hasen statistic 1.292 0.135 1.035 0.554
[0.26] [0.71] [0.31] [0.46]
Endogeneity test 2.15 2.17 0.22 7.49
[0.98] [0.98] [1.00] [0.76]
See Table 3 for Definition of variables. z-statistics are in parentheses of 2SLS regressions, p-values are in
parentheses of tests of endogeneity, with *, **, and *** denote significance at 10%, 5% and 1%

50
Table A3: Role of institutional and regulatory environment (Eq. (2) using threshold of control at 20% of relative voting power, GLS random effects
estimators)
Env = Supervisory Regime Env = Shareholder protection
Tobin’s Q Distance to default Tobin’s Q Distance to default
(1) (2) (3) (4) (5) (6) (7) (8)
Minority -0.129*** -0.0519 0.269*** 0.282***
(-7.18) (-1.36) (13.11) (6.97)
Minority * Env 0.0333*** 0.0322*** -0.0461*** -0.0299***
(10.88) (4.43) (-11.45) (-4.42)
Controlling -0.0515** 0.000301 -0.0358** -0.0832***
(-1.98) (0.01) (-2.34) (-3.20)
Controlling * Env 0.00368 -0.00458 0.00703** 0.0101*
(0.93) (-0.61) (2.17) (1.74)
Independent 0.0782** -0.130* -0.111*** 0.136**
(2.25) (-1.70) (-4.32) (2.46)
Independent * Env -0.0164*** 0.0153 0.0206*** -0.0374***
(-2.88) (1.20) (3.82) (-3.20)
Control variables Yes Yes Yes Yes Yes Yes Yes Yes
N 216 216 220 220 216 216 220 220
Robust Hausman test
Chi 2 - stat 3.486 4.508 7.993 8.495 5.947 4.584 8.779 9.371
p-value 0.8367 0.7198 0.4341 0.3867 0.8197 0.8690 0.6423 0.4973
See Table 3 for Definition of variables. In the main tests, z-statistics are in parentheses. In the marginal effects tests, p-value is given in parentheses. *, **, and *** denote
significance at 10%, 5% and 1%.

51
Table A4: Role of institutional and regulatory environment (Eq. (2) using threshold of control at
20% of relative voting power, GLS random effects estimators)
Env = Supervisorty regime Env = Shareholder protection
Tobin_Q
(1)
Distance to default
(2)
Tobin’s Q
(3)
Distance to default
(4)
Minority 0.00420 0.0410 0.00668** 0.0178
(0.82) (0.61) (2.29) (0.27)
Minority * Env 0.000132 -0.00787 0.000180 -0.00639
(0.15) (-0.71) (0.19) (-0.52)
Manager 0.00318 0.0261** 0.000793 0.0714***
(1.51) (2.22) (0.57) (4.16)
Manager * Env -0.000421 -0.00104 -0.0000349 -0.0107***
(-1.42) (-0.34) (-0.14) (-3.44)
Control variables Yes Yes Yes Yes
N 120 111 120 111
Robust Hausman test
Chi 2 – stat 8.679 14.925 11.212 15.099
p-value 0.2766 0.1030 0.2614 0.2361
See Table 3 for Definition of variables. In the main tests, z-statistics are in parentheses. *, **, and *** denote
significance at 10%, 5% and 1%.

52
Appendix 2
The Banzhaf Power Index (BPI)17
1. Notation
A coalition is any group of players that join forces to vote together.
The total number of votes controlled by a coalition is called the weight of the coalition.
A winning coalition is one with enough votes to win.
A losing coalition is one without enough votes to win.
A player whose desertion of a winning coalition turns it into a losing one is called
a critical player.
A player’s power is proportional to the number of times the player is critical.
The quota is the minimum number votes needed to pass a decision.
2. Computing the BPI for Player P
STEP 1: Determine all WINNING coalitions.
STEP 2: Determine the critical players in each winning coalition.
STEP 3: Find the number of times all players are critical.
STEP 4: Find the number of times Player P is critical.
STEP 5: BPI(P) is the number of times Player P is critical (from STEP 4) divided by the number
of times all players are critical (from STEP 3).
3. Example
We determine relative voting power BPI for ultimate owners of bank A in the control chain in
the Appendix 1.
Voting rights of B4, D3, D1 are 20%, 30%, 40% respectively. The quota is 51%.
STEP 1: Determine all WINNING coalitions.
Winning Coalitions Explanation
{D1, D3}
{B4, D1}
Shareholder D1 and D3 together have enough control rights to win.
Shareholder B4 and D1 together have enough control rights to win.
There are 2 winning coalitions having two players.
{B3, D1, D3} The coalition containing all 3 ultimate owners wins.
STEP 2: Determine the critical players in each winning coalition.
17 Extract from the website of the University of Alabama

53
To determine whether or not a Player is a critical Player in a winning coalition, count the
number of votes the coalition has without that particular Player. If the coalition no longer has
enough votes to win, then that Player is critical.
The critical Players are underlined below.
In {B4, D1}, both are critical since the coalition loses if either shareholder leaves.
In {D1, D3}, both are critical since the coalition loses if either shareholder leaves.
In {B4, D1, D3}, only D1 is critical since the coalition still wins if B4 leaves or if D3 leaves
(but not if D1 leaves).
STEP 3: Find the number of times all players are critical.
5 (underlined above).
STEP 4: Find the number of times Player P is critical.
(See the underlined Players in STEP 2 above.)
D1 is critical 3 times, D3 is critical 1 time, B4 is critical 1 time.
STEP 5: BPI(P) is the number of times Player P is critical (from STEP 4) divided by the
number of times all players are critical (from STEP 3).
BPI(D1) = 3/5 = 0.6 BPI(D3) = 1/5 =0.2 BPI(B4) = 1/5 = 0.2

54
Appendix 3
Construction of the indices of relatedness of directors
We assign weights to the four factors we consider in characterizing the relatedness of a
director, by giving a weight of one (as compared to zero) for each of the following criteria: (1)
the director is considered to be related to a shareholder; (2) the director is related to a controlling
shareholder; (3) the relatedness between the director and the shareholder is current; or (4) the
director is Chairman or Vice Chairman of the board.
For each director, we sum up the number of ones for all the connections they have with
shareholders to obtain what we call the “score of relatedness” of a director. A “score of
relatedness” is then computed at the bank level by taking the average of the “score of
relatedness” of all directors. We then use theses scores to compute our indices.
If the “score of relatedness” of a bank is zero, it indicates that its board of directors is totally
independent from shareholders, and we set the index of relatedness at 0. For banks with a
positive “score of relatedness”, we rank them into deciles to obtain an index of relatedness that
ranges from 1 to 10. Finally, our index of relatedness of directors to shareholders varies from 0
to 10. The higher the index, the more the board of directors is related to shareholders.
We compute for both controlled and widely held banks the index Minorityi that measures the
presence/influence of minority directors in their board. For controlled banks, we additionally
compute the index Controllingi that measures the presence/influence of directors that are related
to controlling shareholders. An index measuring the presence/influence of independent
directors in controlled banks is also computed by subtracting the average of the two indices of
relatedness of board to controlling and to minority shareholders from the highest value of the
index (i.e. from 10):
Independenti = 10 - (𝑀𝑖𝑛𝑜𝑟𝑖𝑡𝑦𝑖+𝐶𝑜𝑛𝑡𝑟𝑜𝑙𝑙𝑖𝑛𝑔𝑖)
2
The higher the index of independence, the more independent from shareholders is the bank.

55
Appendix 4
Merton (1977) approach to compute distance to default
According to this approach, firstly, we need solve the following nonlinear system of
equations to find the value of assets (𝑉𝑎) and the volatility of assets (𝜎𝑎):
{𝑉𝑎 ∗ 𝑁(𝑑1) − 𝐷 ∗ 𝑒−𝑟∗𝑇 ∗ 𝑁(𝑑2) − 𝑉𝑒 = 0
𝑉𝑎
𝑉𝑒∗ 𝑁(𝑑1) ∗ 𝜎𝑎 − 𝜎𝑒 = 0
where d1 = ln(
𝑉𝑎
𝐷)+𝑟𝑇
𝜎𝑎 +
𝜎𝑎
2 and d2 =
ln(𝑉𝑎
𝐷)+𝑟𝑇
𝜎𝑎 -
𝜎𝑎
2
and 𝑉𝑒 is the value of equity, 𝜎𝑒 is the volatility of equity, D is debt value, r is risk free rate,
and T is time of debt’s maturity.
Secondly, we can compute the distance to default as following:
DD(it) = ln(
𝑉𝑎
𝐷)+(𝑟−
1
2𝜎𝑎
2)(𝑇−𝑡)
𝜎𝑎√𝑇−𝑡