Reduced Salt Usage in Dyeing of 100% Cotton...
125
Reduced Salt Usage in Dyeing of 100% Cotton Fabric A thesis presented in total fulfilment of the requirements For the degree of Master of Technology By Daniela Bernadette Gentile Bachelor App Sci (Textile Technology) School of Fashion & Textiles College of Design & Social Context RMIT University July, 2009
-
Upload
nguyenkien -
Category
Documents
-
view
218 -
download
1
Transcript of Reduced Salt Usage in Dyeing of 100% Cotton...

Reduced Salt Usage in Dyeing of 100% Cotton Fabric
A thesis presented in total fulfilment of the requirements
For the degree of
Master of Technology
By
Daniela Bernadette Gentile
Bachelor App Sci (Textile Technology)
School of Fashion & Textiles
College of Design & Social Context
RMIT University
July, 2009

ii
Declaration
This is to certify that this thesis comprises only the original work of the author, except
where due acknowledgement has been made, and has not been previously submitted
for assessment for any other degree.
Daniela Bernadette Gentile

iii
Acknowledgements
I wish to thank and acknowledge Dr. Rajiv Padhye and Adjunct Professor Max White
(my supervisors) and Mac Fergusson for their guidance and support through out this
work.
I would also like to thank and acknowledge the following for their assistance:
Nigel Corby and Audra Liubinas, of City West Water: for their assistance in funding
for this study and their support and encouragement.
RMIT Textile Testing Services, in particular Trudie Orchard and Fiona Greygoose:
for their assistance with the colourfastness testing section of this work. Also for their
guidance and support.
Henry Orlinski: for the assistance with locating chemicals and auxiliaries.

iv
Abstract
This study primarily focuses on the reduction of salts during the dyeing of cotton.
Cotton fabrics were pretreated with Chitosan and Cibafix ECO respectively, and then
dyed with reactive and direct dyes with various amount of salt in a dye bath, to
determine the optimum pre-treatment conditions of a reduced salt concentration.
Cotton fabric was dyed with two different classes of reactive dyes and a direct dye
with 100%, 75%, 50% and 0% of the recommended amount of salt. Various methods
of pre-treatment application were trialed to determine the most effective and efficient
method, as well as to determine the optimum conditions of the pre-treatments.
Exhaustion levels of the dye bath as well as Total Dissolved Solids (TDS) levels
were measured. Colour strength measurements were also studied along with
colourfastness properties.
It was found that cotton fabric pre-treated with Cibafix ECO and dyed with 25% less
salt was more effective than fabric pre-treated with Chitosan and dyed with 25% less
salt. Any greater reduction in salt has detrimental effects on the levelness of dyeing.
When using only 75% of the recommended amount of salt, the pre-treated fabrics
showed higher extents of exhaustion compared with samples dyed without the pre-
treatment. At optimum pre-treatment conditions a saving of 25% salt usage was
observed for cotton dyed with direct and reactive dyes. In addition these samples also
showed moderate to very high fastness properties.
v
Table of Contents
Declaration ........................................................................................................... ii
Acknowledgements ................................................................................................ iii
Abstract ................................................................................................................. iv
Table of Contents .................................................................................................. v
Figures .................................................................................................................. x
Tables .................................................................................................................... xiii
Chapter 1:Introduction and Literature Review ............................ 1
1.1 Introduction ....................................................................................................... 2
1.2 Aims and Objectives ......................................................................................... 3
1.3 Effluent ............................................................................................................. 4
1.3.1 Problems with Salt ....................................................................................... 4
1.3.2 Textile Dye Houses and Salt ....................................................................... 4
1.3.3 Methods of Salt Removal ............................................................................ 5
1.3.3.1 Membrane Technique/Reverse Osmosis ................................................ 5
1.3.3.2 Evaporation Method ............................................................................... 6
1.3.3.3 Dilution .................................................................................................. 7
1.3.3.4 Reducing Salt at the Source ................................................................... 7
1.3.3.5 Evaluation of Salt Removal Methods ..................................................... 8
1.4 Salt and Textile Fibres ...................................................................................... 8
1.4.1 Effect of Colour in Effluent ......................................................................... 9
1.4.2 Viscose Rayon and Cotton .......................................................................... 10
1.4.2.1 Consumption of Viscose Rayon ............................................................. 10
1.4.2.2 Consumption of Cotton .......................................................................... 10
1.4.3 Salt Sources in Cotton Processing ............................................................... 11
1.5 Dyeing Processes for Cotton ............................................................................. 12
1.5.1 Direct Dyes .................................................................................................. 13
1.5.1.1 Chemical Properties of Direct Dyes ....................................................... 13
1.5.1.2 Direct Dye Classifications ...................................................................... 13
1.5.1.3 Dyeing with Direct Dyes ........................................................................ 14
1.5.1.4 Problems in Batch Dyeing with Direct Dyes ......................................... 14
vi
1.5.2 Reactive Dyes .............................................................................................. 14
1.5.2.1 Chemical Properties of Reactive Dyes ................................................... 15
1.5.2.2 Bifunctional Reactive Dyes .................................................................... 16
1.5.2.3 Dyeing with Reactive Dyes .................................................................... 16
1.5.2.4 Problems in Dyeing with Reactive Dyes ................................................ 17
1.6 Dyeing Processes .............................................................................................. 17
1.6.1 Fibre Dyeing Processes ............................................................................... 17
1.6.2 Yarn Dyeing Processes ................................................................................ 18
1.6.2.1 Yarn Dyeing Cones of Cotton ................................................................ 18
1.6.3 Fabric Dyeing Processes .............................................................................. 18
1.6.3.1 Fabric Preparation for Dyeing ................................................................ 18
1.6.3.2 Continuous Dyeing ................................................................................. 20
1.6.3.3 Exhaust Dyeing ...................................................................................... 20
1.6.4 Garment Dyeing Processes .......................................................................... 23
1.7 Options for Reducing Salt ................................................................................. 23
1.7.1 Low Salt Dyes ............................................................................................. 23
1.7.2 Pre-treatments .............................................................................................. 24
1.7.2.1 Pre-treatment of Cotton with Cationic Agents ....................................... 24
1.7.2.2 Pre-treatment of Cotton with Fibre Reactive Chitosan Derivatives ....... 26
1.7.2.3 Pre-treatment of Cotton with Poly(vinylamine chloride) ....................... 29
1.8 Summary ........................................................................................................... 30
Chapter 2: Materials and Methodology ........................................... 32 2.1 Introduction ....................................................................................................... 33
2.2 Materials ........................................................................................................... 33
2.2.1 Fabric ........................................................................................................... 33
2.2.2 Pre-treatments .............................................................................................. 33
2.2.2.1 Chitosan .................................................................................................. 33
2.2.2.2 Cibafix ECO ........................................................................................... 34
2.2.3 Dyestuff ....................................................................................................... 34
2.2.4 Chemicals and Auxiliaries ........................................................................ 35
2.3 Pre-treatment of Fabrics .................................................................................... 35
2.3.1 Initial Application of Chitosan and Cibafix ECO ....................................... 35

vii
2.3.2 Pre-treat, Rinse, No Dry .............................................................................. 36
2.3.3 Pre-treat, No Rinse, No Dry ........................................................................ 36
2.4 Dyeing of Fabrics .............................................................................................. 37
2.4.1 Dyeing with Sumifix Supra Navy 3GF 150% ............................................. 37
2.5 One-bath Method .............................................................................................. 38
2.5.1 Pre-treatment Chemical Added in Dye Bath ............................................... 39
2.5.2 Pre-treatment as Post-treatment ................................................................... 39
2.6 Dyeing with Procion Brilliant Scarlett H-EXL ................................................. 40
2.7 Dyeing with Solophenyl Rubine RNL .............................................................. 41
2.8 TDS Evaluation by Evaporation ....................................................................... 42
2.9 Measurement of Exhaustion Levels .................................................................. 42
2.10 Colour Strength Evaluation ............................................................................. 44
2.10.1 K/S Values ................................................................................................. 44
2.11 Colourfastness Testing .................................................................................... 45
2.11.1 Colourfastness to Washing ........................................................................ 46
2.11.2 Colourfastness to Perspiration ................................................................... 46
2.11.3 Colourfastness to Rubbing ......................................................................... 46
2.11.4 Colourfastness to Light .............................................................................. 46
Chapter 3: Results and Discussion .................................................... 47 3.1 Introduction ....................................................................................................... 48
3.2 Samples dyed with Sumifix Supra Navy 3GF 150% ........................................ 48
3.2.1 Rate and Extent of Dye Exhaustion ............................................................. 48
3.2.1.1 Pre-treated Samples Dyed – 100% Salt .................................................. 48
3.2.1.2 Pre-treated Samples Dyed – 75% Salt .................................................... 51
3.2.1.3 Pre-treated Samples Dyed – 50% Salt .................................................... 52
3.2.1.4 Pre-treated Samples Dyed – 25% Salt .................................................... 54
3.2.1.5 Pre-treated Samples Dyed – With No Salt ............................................. 56
3.2.2 Pre-treat, Rinse, Dye – 75% Salt ................................................................. 59
3.2.3 Pre-treat, No Rinse, Dye – 75% Salt ........................................................... 60
3.2.4 Pre-treatment Chemical Added in Dye Bath ............................................... 61
3.2.5 Cibafic ECO as a Post-treatment ................................................................. 63
3.3 Total Dissolved Solids – Sumifix Supra Navy 3GF 150% ............................... 63

viii
3.3.1 Pre-treated Samples Dyed with 100% of the Required Salt ........................ 64
3.3.2 Pre-treated Samples Dyed with 75% of the Required Salt .......................... 65
3.3.3 Pre-treated Samples Dyed with 50% of the Required Salt .......................... 66
3.3.4 Pre-treated Samples Dyed with 25% of the Required Salt .......................... 66
3.3.5 Pre-treat, Rinse, No Dry & Pre-treat, No Rinse, No Dry with 75% of the
Required Salt ...............................................................................................
67
3.3.6 Pre-treatment Chemical Added in Dye Bath ............................................... 69
3.4 Colour Strength Evaluation – Sumifix Supra Navy 3GF 150% ....................... 69
3.4.1 Pre-treated Samples Dyed with 100% of the Required Salt ........................ 70
3.4.2 Pre-treated Samples Dyed with 75% of the Required Salt .......................... 70
3.4.3 Pre-treated Samples Dyed with 50% of the Required Salt .......................... 72
3.4.4 Pre-treated Samples Dyed with 25% & 0% of the Required Salt ............... 73
3.4.5 Pre-treat, Rinse, Dry, Dye & Pre-treat, No Rinse, No Dry Dyed – 75%
Salt ...............................................................................................................
74
3.5 Evaluation of Colourfastness Properties – Sumifix Supra Navy 3GF 150% .... 76
3.6 Samples dyed with Procion Brilliant Scarlett H-EXL ...................................... 86
3.6.1 Rate and Extent of Dye Exhaustion ............................................................. 86
3.7 Total Dissolved Solids – Procion Brilliant Scarlett H-EXL ............................. 87
3.8 Colour Strength Evaluation – Procion Brilliant Scarllet H-EXL ...................... 88
3.9 Samples Dyed with Solophenyl Rubine RNL .................................................. 88
3.9.1 Rate and Extent of Dye Exhaustion ............................................................. 88
3.10 Total Dissolved Solids – Solophenyl Rubine RNL ........................................ 89
3.11 Colour Strength Evaluation – Solophenyl Rubine RNL ................................. 90
3.12 Summary ......................................................................................................... 91
Chapter 4: Conclusions and Recommendations ............................. 92 4.1 Introduction ....................................................................................................... 93
4.2 Chitosan vs. Cibafix ECO ................................................................................. 93
4.3 Reduction in Salt ............................................................................................... 93
4.4 Optimal Pre-treatment – Dyeing Method ......................................................... 93
4.5 Recommendations ............................................................................................. 94
References .............................................................................................................. 95

ix
Appendix I ............................................................................................................... 99
Appendix II .............................................................................................................. 105

x
Figures
Chapter 1
1.1 Sources of Salinity in Flows to the Western Treatment Plant ........................... 4
1.2 Effluent Evaporation Process ............................................................................ 6
1.3 Scanning electron micrographs of cotton fibre before and after treatment with
26% sodium hydroxide .....................................................................................
12
1.4 Molecular Structure of Dye CI Direct Red 16 (27680) ..................................... 13
1.5 Nucleophilic Substitution (a, azo) and addition reactions (b, anthroquinone)
of reactive dyes with cellulose .........................................................................
15
1.6 Triphendodioxazine (1) and copper phthalocyanine (2) reactive dyes ............. 15
1.7 Hydroxyl ion attaching ether bond of dyed fibre resulting in hydrolysis ......... 16
1.8 Cross section of a jig dyeing machine ............................................................... 21
1.9 Functions of a jet dyeing machine ..................................................................... 22
1.10 Cross section of a winch dyeing machine ....................................................... 22
1.11 Application methods for cationic fixing agents (numbers in brackets refers
to aftertreatment conditions) ............................................................................
25
1.12 Dyeing Method ................................................................................................ 25
1.13 Covalent bonding between NMA-HTCC and cotton ...................................... 27
1.14 Application method of direct dyes .................................................................. 28
1.15 Application method of reactive dyes ............................................................... 28
1.16 Molecular structure of PVAmHCL ................................................................. 29
Chapter 2
2.1 Chemical structure of Chitosan ......................................................................... 33
2.2 (1) Sumifix Supra Navy 3GF 150%, (2) Procion Brilliant Scarlett H-EXL, (3)
Solophenyl Rubine RNL ..................................................................................
34
2.3 Dye method as illustrated by Sumitomo pattern card ....................................... 37
2.4 Dye method as illustrated by Ciba pattern card ................................................ 41
2.5 Hitachi/Model 101 Absorption Spectrophotometer .......................................... 42
2.6 Calibration Curve .............................................................................................. 42
2.7 Datacolor Spectraflash (SF) 600 spectrophotometer ......................................... 44
2.8 James Heal & Co. Gyrowash ............................................................................ 45

xi
2.9 Steel canisters inside the Gyrowash .................................................................. 45
Chapter 3
3.1 Extent of exhaustion of Chitosan samples dyed with 100% salt ....................... 49
3.2 Extent of exhaustion of Cibafix ECO samples dyed with 100% salt ................ 50
3.3 Extent of exhaustion of Chitosan samples dyed with 75% salt ......................... 51
3.4 Extent of exhaustion of Cibafix ECO samples dyed with 75% salt .................. 51
3.5 Extent of exhaustion of Chitosan samples dyed with 50% salt ......................... 53
3.6 Extent of exhaustion of Cibafix ECO samples dyed with 50% salt .................. 53
3.7 Extent of exhaustion of Chitosan samples dyed with 25% salt ......................... 55
3.8 Extent of exhaustion of Cibafix ECO samples dyed with 25% salt .................. 55
3.9 Extent of exhaustion of Chitosan samples dyed with no salt ............................ 56
3.10 Extent of exhaustion of Cibafix ECO samples dyed with no salt ................... 57
3.11 Extent of exhaustion vs levels of salt when using Chitosan ............................ 58
3.12 Extent of exhaustion vs levels of salt when using Cibafix ECO ..................... 58
3.13 Extent of exhaustion of samples dyed with 75% salt with a rinse in between 59
3.14 Extent of exhaustion of samples dyed with 75% salt with no rinse in between ... 60
3.15 Extent of exhaustion – 75% salt with pre-treatment used in the same bath as
dyeing ...............................................................................................................
61
3.16 Dye bath liquor of 7.0% Cibafix ECO during one bath process ..................... 62
3.17 Extent of exhaustion – 75% salt with pre-treatment added at the 45th minute
as a post-treatment ............................................................................................
63
3.18 TDS levels of dye bath liquid dyed with 100% salt ........................................ 64
3.19 TDS levels of dye bath liquid dyed with 75% salt .......................................... 65
3.20 TDS levels of dye bath liquid dyed with 50% salt .......................................... 66
3.21 TDS levels of dye bath liquid dyed with 25% salt .......................................... 66
3.22 TDS levels of dye bath liquid dyed with 75% salt with a rinse in between
pre-treatment and dyeing ..................................................................................
67
3.23 TDS levels of dye bath liquid dyed with 75% salt with no rinse in between
pre-treatment and dyeing ..................................................................................
68
3.24 TDS levels of dye bath liquid dyed with 75% salt with a rinse in between
pre-treatment and dyeing ..................................................................................
68
3.25 K/S values of pre-treated samples dyed with 100% salt ................................. 69

xii
3.26 K/S values of pre-treated samples dyed with 75% salt ................................... 71
3.27 K/S values of pre-treated samples dyed with 50% salt ................................... 72
3.28 K/S values of pre-treated samples dyed with 25% salt ................................... 73
3.29 K/S values of pre-treated samples dyed with 0% salt ..................................... 73
3.30 K/S values of pre-treated samples dyed with a rinse in between .................... 74
3.31 K/S values of pre-treated samples dyed with a no rinse in between ............... 75
3.32 Extent of exhaustion of samples dyed with Procion Brilliant Scarlett H-EXL
pre-treated with 2.0% Cibafix ECO dyed with 75% salt .................................
86
3.33 TDS levels of samples dyed with Procion Brilliant Scarlet H-EXL pre-
treated with 2.0% Cibafix ECO dyed with 75% salt ........................................
87
3.35 Extent of exhaustion of samples dyed with Solophenyl Rubine RNL pre-
treated with 2.0% Cibafix ECO dyed with 75% salt ........................................
89
3.36 TDS levels of samples dyed with Solophenyl Rubine RNL pre-treated with
2.0% Cibafix ECO dyed with 75% salt ............................................................
90
3.37 K/S values of pre-treated Solophenyl Rubine RNL samples dyed with 75%
salt ....................................................................................................................
90

xiii
Tables
Chapter 1
1.1 Classification of dyes according to the principal fibre classes .......................... 9
1.2 Average dye salt use in g/l ................................................................................ 9
1.3 Degree of fixation for different dye/fibre combinations ................................... 10
1.4 Worldwide consumption of cellulosic fibres ..................................................... 11
1.5 Chemical composition of cotton ........................................................................ 19
Chapter 2
2.1 Fabric groups and levels of salt used for dyeing ............................................... 38
2.2 Procedure for calculation of TDS levels by evaporation .................................. 43
Chapter 3
3.1 Residual dye in bath on completion of dyeing – 100% salt .............................. 50
3.2 Residual dye in bath on completion of dyeing – 75% salt ................................ 52
3.3 Residual dye in bath on completion of dyeing – 50% salt ................................ 54
3.4 Residual dye in bath on completion of dyeing – 25% salt ................................ 56
3.5 Residual dye in bath on completion of dyeing – 0% salt .................................. 57
3.6 Comparison of TDS levels between trials where a rinse and no rinse was
employed ............................................................................................................
68
3.7 K/S values of pre-treated samples dyed with 25% salt and 0% salt .................. 74
3.8 Colourfastness results for reference sample dyes as per pattern card ............... 76
3.9 Colourfastness results for pre-treated samples dyed according to the pattern
card with 100% of the required amount of salt ...................................................
78
3.10 Colourfastness results for pre-treated samples dyed according to the pattern
card with 75% of the required amount of salt ...................................................
79
3.11 Colourfastness results for pre-treated samples dyed according to the pattern
card with 50% of the required amount of salt .....................................................
80
3.12 Colourfastness results for pre-treated samples dyed according to the pattern
card with 25% of the required amount of salt .....................................................
82
3.13 Colourfastness results for pre-treated samples dyed according to the pattern
card with 0% of the required amount of salt .......................................................
83

xiv
3.14 Colourfastness results for samples pre-treated with no rinse in between and
dyed according to the pattern card with 75% of the required amount of salt .....
84
3.15 Colourfastness results for samples pre-treated with a rinse in between and
dyed according to the pattern card with 75% of the required amount of salt .....
85

Chapter 1
Introduction and Literature Review

2
1.1 Introduction
Salt is an essential requirement for the dyeing of cotton with both reactive and direct
dyes. However, the presence of large quantities of salt in dye house effluent streams
creates problems for treatment plants and limits the opportunities for recycling treated
effluent. City West Water, Melbourne, proposed a study be made into opportunities
for reducing the amount of salt required in the reactive dyeing of cotton fabrics.
City West Water is a water-retailing business which is 100% owned by the Victorian
Government [1]. As stated in their mission statement, “City West Water are proud to
contribute to the environmental, economic and social well-being and growth of
Victoria through the operation of a commercial organisation…” and “Guarantee
affordable and safe water for today and tomorrow”.
In the greater metropolitan Melbourne area, City West Water is one of three retail
water businesses along with South East Water and Yarra Valley Water. All three
companies also provide sewerage, trade waste and recycled water services in
Melbourne’s Central Business District (CBD) and the surrounding inner and western
suburbs. Compared to the other metropolitan Melbourne water retailers, City West
Water has the smallest customer base. They provide roughly 276,000 residential and
31,000 industrial and commercial customers with clean drinking water. However the
majority of these are industrial and commercial customers. The industrial customer
base includes automotive manufacturing, oil refining, brewing, chemical and textile
manufacturing [2].
City West Water [3] operates a “Cleaner Production Strategy” program. This was
developed in October 2004 in partnership with the Environmental Protection Agency
Victoria (EPA) to reduce Melbourne’s potable water consumption and minimise the
release of pollutants including Total Dissolved Solids (TDS) in trade waste. A
common limiting factor for effluent re-use is the TDS load present in the sewer,
resulting in higher than acceptable levels at the Western Treatment Plant, Werribee.
In turn, this effects the long-term recycling options in the area. A major portion of the
TDS load entering the Western Treatment Plant is a result of the commercial dyeing

3
processes used by a number of textile mills in City West Water’s customer base [N.
Corby 2006, Private Communication via email, 30 July].
1.2 Aims and Objectives
The intended outcome of this study was to reduce the amount of salt, and possibly the
amount of water, used in dyeing cotton fabric. These reductions in salt and water use
should not impact on the final quality of the textile material. Any modifications to the
cotton dyeing process should be cost effective and low risk in order for the industry to
implement them.
This study aims to:
1. Investigate the effectiveness of selected pre-treatments in the reactive dyeing
process.
2. Determine optimal requirement of salt when using a fabric that has been pre-
treated.
3. Measure the effectiveness of rinsing when using a fabric that has been pre-
treated.
4. Ascertain the dye exhaustion after pre-treatment.
5. Determine the basic economics surrounding the take up of pre-treatment for
industry use.
All experiments were conducted in a laboratory using equipment designed to simulate
commercial dyeing practice.

4
1.3 Effluent
1.3.1 Problems with Salt
A limiting factor for effluent recycling is the amount of Total Dissolved Solids (TDS)
in trade waste. In the Western Treatment Plant, the volume of wastewater that is
discharged from industry is 44% shown in Figure 1.1 [4].
Figure 1.1 Sources of Salinity in Flows to the Western Treatment Plant [4]
Hard water, by definition, has high levels of TDS from calcium and magnesium salts.
This can lead to problems such as scale build up in filters, pipes and valves as well as
increasing maintenance costs and reduced performance of equipment [5].
According to the EPA [6], high salinity levels can also severely damage soil, leaving
it unsuitable for cultivation. It can also kill aquatic animals, plants and land animals
living near streams and leave water unsuitable for drinking.
1.3.2 Textile Dye Houses and Salt
Traditionally, textile dye houses have consumed large amounts of water and energy
and generated large volumes of waste. One kilogram of a finished cotton textile
25%
44%
5%
5%
21%
Domestic Discharges - Residential/Commercial Trade Waste Discharges - Industrial/CommercialWet Weather Inflows Sewer InfiltrationUnaccounted Contributions
5
product can use up to 200 litres of water [M. Fergusson 2009, Private Communication
via face to face interview, 24 May]. Thus a high demand for water, and serious
effluent management problems can arise. Textile dye houses discharge hot, coloured
effluent containing a wide variety of chemicals including salts into the sewer causing
serious environmental issues [7].
The addition of salt is commonly required for some dyeing processes within the
textile industry and is an important issue.
In terms of cost, salts such as sodium chloride and sodium sulphate are cheap.
Therefore, their appeal for recovery as well as the small size of their ions makes them
problematic when trying to remove them through standard effluent treatments.
Biological treatments are of no use in the removal of salts and therefore removal by
physical or chemical means is left as the only option [7].
1.3.3 Methods of Salt Removal
There are many physical and chemical means available for the removal of salt from
textile dye house effluent. Costs can be quite high and are a critical factor when
determining the most effective and economically attractive method of salt removal.
1.3.3.1 Membrane Technique/Reverse Osmosis
Skelly [8] has highlighted that membrane techniques and reverse osmosis for effluent
treatment and salt removal have been of some interest for water recycling. Reverse
osmosis involves a membrane with pores that prevent organic chemicals and soluble
dyes of average molecular weight (between 100 – 2000) to pass through. However
each dye house needs a separate examination to determine which pore size would be
most suitable for the effluent produced. Once the effluent has moved through the
membrane, all that remains is a concentrate, which contains the soluble dye and salt.
Some advantages to the membrane/reverse osmosis technique are that it can be used
to remove both inorganic and organic compounds. The process is relatively simple
and the technology has little need for the use of chemicals. Some disadvantages are
6
that the membranes are sensitive to abuse and require a reliable source of energy.
There is also a risk of bacterial contamination within the membranes which can cause
odour and poor taste to form in the newly cleaned water [9]. Further, membrane
plants are expensive to install and have high operating costs.
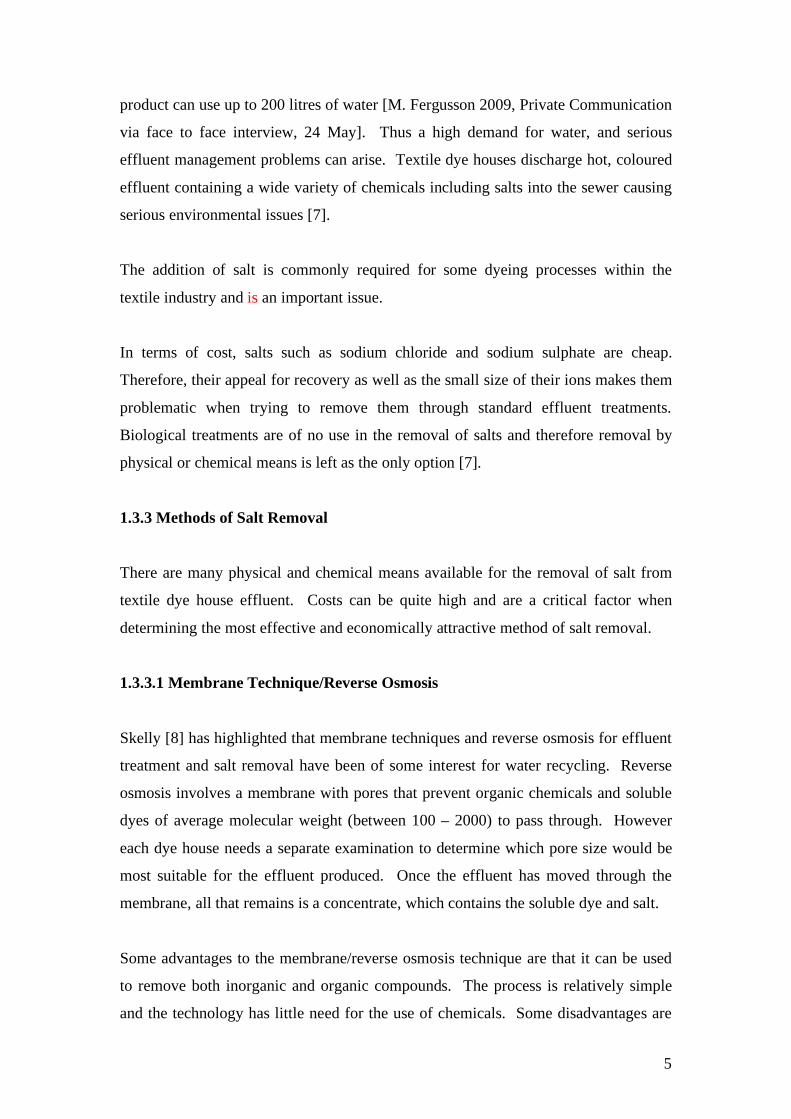
1.3.3.2 Evaporation Method
The evaporation method involves three steps:
1. Initial evaporation when the effluent is preheated and concentrated close to the
level of salt saturation;
2. The crystallization of salts is encouraged by exposing the concentrated
effluent liquid to a process of evaporation and cooling;
3. Followed by centrifuging the crystallized salts to remove any excess liquid. If
required the salts can be dried [10].
The process is illustrated in Figure 1.2.
Figure 1.2 Effluent Evaporation Process

7
1.3.3.3 Dilution
If effluent has previously been treated and still contains some organic matter, a
dilution method can be employed. In order for the remaining effluent to have a lower
demand for dissolved oxygen it is mixed with extra water to further dilute the
wastewater and reduce the Biological Oxygen Demand (BOD). The remaining
inorganic compounds become food for the micro-organisms, which convert the waste
into inoffensive compounds. The treated effluent can then be discharged [11].
1.3.3.4 Reducing Salt at the Source
Another method of reducing the amount of salt in effluent is removing the salt at the
dyeing stage. Salt plays a major role in promoting dye exhaustion and it is important
to find alternatives that will allow the dyer to reduce the amount of salt, while
maintaining the same quality of dyeing. One option is dyeing at a lower liquor ratio.
Gokarneshan [12] states that lowering the liquor ratio lowers the volume of effluent,
as less water is required. Dosing of the chemicals and auxiliaries required for dyeing
are measured as grams per litre. Therefore the quantities of chemicals and auxiliaries
being released in the effluent can be significantly reduced.
An additional method of reducing salt loads at the source is the use of dyes that
require less salt. CIBACRON® LS dyes offer high fixation rates using only a quarter
of the conventional amount of salt. This is possible because CIBACRON® LS dyes
are a type of bifunctional dye [13]. Bifunctional dyes contain reactive groups within
the one dye. They can be two different reactive groups, or two of the same reactive
groups. Because these dyes have higher fixation they are less prone to hydrolysis,
thus soaping is reduced. This is of benefit, as soaping often requires 4 times more
water than the actual dyeing. Bifunctional dyes are also less sensitive to liquor ratio
and temperature variations [14]. As a result, the time required for dyeing and material
costs are reduced.
Pre-treating the fabric before dyeing with a cationic agent is another method of salt
removal at the source. This involves modifying the surface characteristics of the

8
fabric to induce a positive charge at the fibre surface that will attract the dye to the
fabric [15].
1.3.3.5 Evaluation of Salt Removal Methods
The above review suggests that the simplest and most cost effective method of salt
removal is to reduce salt use in the dyeing process. In other words, for textile dye
houses it is potentially easier to refrain from adding salt into the dye bath rather than
trying to remove it from the effluent at the end of the process.
1.4 Salt and Textile Fibres
Salt acts as an electrolyte in the dye bath solution, promoting the exhaustion of the
dye onto the fibre. Cellulosic fibres in water are negatively charged. Salt, as either
sodium chloride or sodium sulphate, induces a positive charge at the fibre surface.
This neutralises the electrostatic repulsion between the dyestuff and the fabric. The
amount of salt required for dyeing depends on the fibre being dyed and the depth of
shade, which in turn dictates which dye is to be used.
Textile fibres are often divided into four general categories, each category requiring
differing amounts of salt [16]:
a. Cellulosic fibres which are made primarily from cellulose and can be
found in vegetable material, such fibres include cotton, flax and viscose
rayon;
b. Protein fibres which are derived from animal proteins and consist of fibres
such as wool, mohair, cashmere, alpaca and silk;
c. Cellulose acetates which are derived from the raw material of cellulose
and include fibres known as di-acetate and tri-acetate;
d. Synthetic polymer fibres such as polyester, nylon and the differing acrylics
(Acrilan, Courtelle, Orlon).
As dyeing occurs in an aqueous medium, the majority of the dyestuffs are supplied in
a water-soluble form. Dyes may be classified according to their application method

9
or their chemical constitution. It is common when referring to the application method
to include the fibre type. Table 1.1 shows the classification of dyes based on the
principal fibre classes [16].
Table 1.1 Classification of dyes according to the principal fibre classes
Cellulosic Wool
(Protein)
Cellulose
Acetates Nylon Acrylic Polyester
Direct
Sulphur
Azoic
Vat
Reactive
Acid
(including
metal-
complex)
Mordant
Reactive
Disperse Disperse
Acid
(including
metal-
complex)
Mordant
Basic
Acid
Disperse
Table 1.2 Cotton dyes – Average dye salt use (g/l) [47]
Type of Dye g/l
Direct Dyes 20
Sulphur Dyes 20 – 40
Azoic Dyes 30
Vat Dyes 6 – 10
Reactive Dyes 50 – 100
Table 1.2 shows the average amount of salt required when batch dyeing cellulosic
fibres. Although it appears a great deal of salt is required for sulphur dyes, this is
rarely the case as they are usually used in continuous dyeing processes where minimal
or no salt is required. Reactive dyes are the most commonly used dyes for cellulosic
fibres and as shown in Table 1.2, require the highest concentration of salt. This study
therefore, focuses on the dye class which is the major contributor to TDS in textile
effluent; i.e. reactive dyes.
1.4.1 Effect of Colour in Effluent
As salt directly affects the amount of dye exhausted onto the fibre, the passing of
colour to effluent is also a major environmental issue. Coloured effluent has become
a particular concern when dyeing cellulosic fibres such as viscose rayon and cotton

10
with reactive dyes. As shown in Table 1.3 up to 50% of reactive dye used may be lost
to effluent [17].
Table 1.3 Degree of fixation for different dye/fibre combinations [17]
Dye Class Fibre Estimated loss to
effluent %
Acid Polyamide 5 – 20
Basic Acrylic 0 – 5
Direct Cellulose 5 – 30
Metal – Complex Wool 2 – 10
Reactive Cellulose 10 – 50
Sulphur Cellulose 10 – 40
Vat Cellulose 5 – 20
1.4.2 Viscose Rayon and Cotton
The two most commonly used cellulosic fibres are viscose rayon and cotton. Each of
these fibres requires salt in the dyeing process; the amount of salt required depends on
the class, the particular dye and the depth of shade. As shown in Table 1.3 more dye
classes are available for cellulose than any of the other commonly used fibres.
1.4.2.1 Consumption of Viscose Rayon
Viscose rayon is regenerated cellulose, derived from wood pulp. The world demand
for viscose rayon – particularly within the non-woven industry is around 4% of total
world fibre demand [17].
1.4.2.2 Consumption of Cotton
In the United States alone the consumption of cotton is around 8.08 million bales
(217kg per bale) [45] per annum with 57% of that going towards apparel, a third
going towards home furnishings and the rest being used for industrial fabrics.
Apparel can be items such as work wear, fashion wear, jeans and underwear. Whereas
home furnishings are items such as bed sheets, towels and window shades. Industrial

11
use of cotton can be seen as medical supplies, bookbinding’s and zipper tapes [18].
Table 1.4 illustrates the worldwide consumption of cellulosic fibres.
Table 1.4 Worldwide consumption of cellulosic fibres
The total world consumption of cellulosic fibres is 44% making up nearly half of the
world’s consumption of fibres – both natural and man made.
1.4.3 Salt Sources in Cotton Processing
Acids, alkalis and salts are used extensively in processing woven and knitted cotton
fabrics. The three key processes that contribute significant quantities of TDS are
mercerising, scouring and bleaching.
Mercerisation is a process that causes the cotton fibre to undergo significant chemical
changes when it is treated under tension in a strong solution of sodium hydroxide. As
a general rule, the concentration of sodium hydroxide is between 240 and 280 g/l.
Mercerisation increases dye absorption for the cotton fibre. Figure 1.3 shows the
effect of mercerisation on cotton fibres [21].

12
Figure 1.3 Scanning electron micrographs of cotton fibre before and after treatment with 26%
sodium hydroxide [21]
Dyeing requires the use of salt when applying colour to cotton. The reason is that the
fibre and the dyestuff are both negatively charged. The need for an electrolyte in the
dye bath is essential in order for the dyestuff to be attracted to the fabric. As the salt
is added in the dye bath the charge of the fibre surface is changed from negative to
positive. Substantial amounts of salt are required usually between 50 – 100 grams per
litre depending on the depth of shade and the reactivity of the dye.
Of all the production stages for cotton, dyeing is the one that uses the most amount of
salt and thus poses the biggest problem for the industry.
1.5 Dyeing Processes for Cotton
Dyes are sourced from the dye class (vat, azoic, sulphur, direct and reactive)
according to the end use of the fabric. Vat, azoic and sulphur dyes are typically used
in the continuous dyeing where large volumes of single shades are required, for
example 20,000 metres for a light blue shirting fabric. Direct and reactive dyes are
typically used for batch dyeing of fashion wear fabrics.
13
1.5.1 Direct Dyes
Direct dyes are primarily used for pale to medium depth shades but are sometimes
used for deeper depths when fastness properties are not an issue.
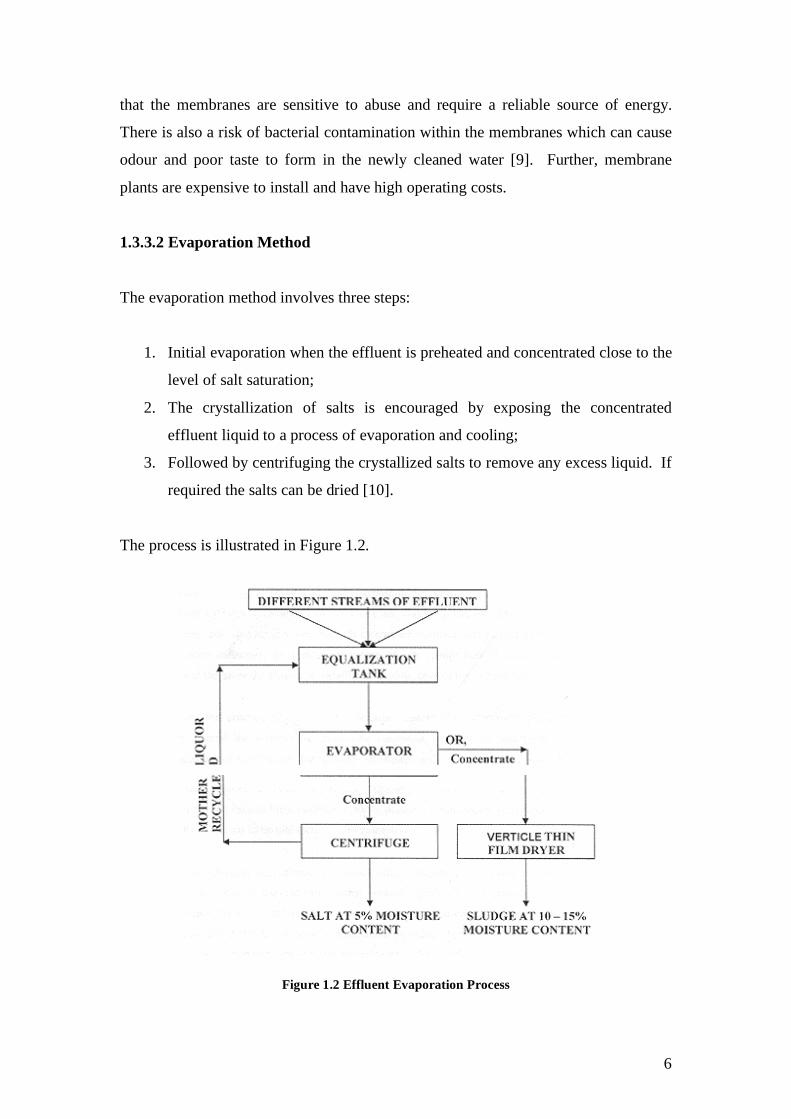
1.5.1.1 Chemical Properties of Direct Dyes
Direct dyes have planar molecular structures and predominantly consist of
sulphonated poly azo dyes (Figure 1.4). These compounds usually consist of bis-,
tris- or tetra-azo compounds typically with the latter compounds being brown and
black [14].
Figure 1.4 Molecular Structure of Dye CI Direct Red 16 (27680)
1.5.1.2 Direct Dye Classifications
Direct dyes have a wide variety of dyeing behaviours and as a result are classified into
groups according to their dyeing behaviour. The most familiar classifications are
those set out by the Society of Dyers and Colourists (SDC) which ‘separates the dyes
based on their levelling ability, their response to the increase in dyeing temperature
and to added salt during exhaust dyeing’ [14]. The three classes as set out by the
SDC are designated as A, B and C.
Direct dyes in class A have good migration and self-levelling properties and do
require a significant amount of salt due to their lower substantivity. Class B direct
dyes have poor levelling properties that are salt sensitive. Class B dyes also give an
increased exhaustion rate when small amounts of salt are added into the dye bath.
Class C dyes have poor migration properties and are both salt and temperature
sensitive. Class C dyes also have better wet fastness properties [14].

14
1.5.1.3 Dyeing with Direct Dyes
A neutral pH solution is required when dyeing direct dyes. To encourage distribution
and levelling of the dye, the dye bath is steadily heated and salt additions are made
gradually to exhaust the dye bath.
Generally, direct dyes have good solubility properties. However, in the presence of
salt the solubility lowers. This can cause a problem when dyeing deep shades at low
liquor ratios and temperatures. Any undissolved dye can attach to the surface of the
fabric leaving dark spots, giving the appearance of an unlevel dyeing [14].
1.5.1.4 Problems in Batch Dyeing with Direct Dyes
Some issues that arise when dyeing with direct dyes is the dullness in the range of
colours especially when fading after laundering [22]. It is also necessary for textile
materials dyed with direct dyes to undergo some form of post-treatment to improve
wash fastness properties. Such post-treatments may include chelation with salts of
metals such as copper or chromium, treatments with formaldehyde and cationic dye-
complexing resins [23].
Post-treatments such as those mentioned above can prove to be costly and difficult to
perform and can also pose a problem for colour matching and shade correction as
some post-treatments can often change the hue of the coloured textile material. Direct
dye post-treatments have limited use. Reactive dyes produce dyeings with higher
wash fastness properties [14].
1.5.2 Reactive Dyes
In 1956 Imperial Chemical Industries (ICI) introduced the Procion dyes
(dichlorotriazine) that gave excellent wash fastness while utilising a relatively simple
dyeing method. When compared to direct dyes, the reactive dyes had a much simpler
chemical structure and gave brighter dyeings [23]. Figure 1.5 shows the typical
structure of a dichlorotriazine dye (C.I. Reactive Red 1).

15
1.5.2.1 Chemical Properties of Reactive Dyes
The typical structures of reactive dyes include azo, anthraquinone, triphenodioxazine
or copper chromophores, shown here in Figure 1.5 and Figure 1.6. Each of the
structural features can influence the dyeing and fastness properties [14].
Figure 1.5 Nucleophilic Substitution (a, azo) and addition reactions (b, anthroquinone) of
reactive dyes with cellulose
Figure 1.6 Triphendodioxazine (1) and copper phthalocyanine (2) reactive dyes

16
1.5.2.2 Bifunctional Reactive Dyes
Bifunctional reactive dyes consist of either two different, or two identical, reactive
groupings and are referred as hetero bifunctional dyes and homo bifunctional dyes
respectively.
Homo bifunctional dyes that have two identical reactive groups have a higher
molecular weight than traditional reactive dyes, giving them an increase in
substantivity that is excellent for exhaust dyeing with higher liquor ratios.
Hetero bifunctional dyes with two different reactive groups have different optimal
fixation conditions and also give a more uniform degree of fixation. These types of
bifunctional reactive dyes have a higher degree of fixation, resulting in lower colour
in the effluent [14]. This is due to the lower tendency of the bifunctional dye to
hydrolyse.
1.5.2.3 Dyeing with Reactive Dyes
When dyeing cotton with reactive dyes, the dyeing occurs in a neutral to slightly acid
pH in the presence of salt to encourage exhaustion [14]. The principle reason for this
is to prevent premature fixation due to pH variations in the salt and water during the
exhaustion stage. If fixation is premature the dyeing will be unlevel [M. Fergusson
2009, Private Communication via face to face interview, 3 March].
When dyeing with a reactive dye there is a predisposition for the dye to hydrolyse.
This occurs when the hydroxide ions of the water react with the reactive group of the
dye under the alkaline conditions producing the hydrolysed dye, which cannot react
with the fibre. As a result any hydrolysed dye in the dye bath must be removed from
the cotton fibre through soaping, if not removed the wash fastness is reduced [14].
D – SO2CHCH2OH + H2O → D – SO2CH2CH2 – OH + OH- Figure 1.7 Hydroxyl ion attaching ether bond of dyed fibre resulting in hydrolysis [25]

17
1.5.2.4 Problems in Dyeing with Reactive Dyes
The low level of fixation can be a major problem when dyeing with reactive dyes
when less than 70% of the dye reacts with the fibre. This results in unfixed dye being
discharged into the dye house effluent. This problem, coupled with high salt
concentrations used when dyeing with reactive dyes, causes a significant
environmental problem [14].
1.6 Dyeing Processes
Dye can be applied to a textile material at the following stages:
• Fibre;
• Yarn;
• Fabric;
• Garment
At each stage a different dyeing method needs to be employed.
1.6.1 Fibre Dyeing Processes
Fibre dyeing is usually carried out in machines where the dye liquor is pumped
through a compressed pack of loose fibre. When dyeing in fibre form, extremely
good wet fastness properties are required as the fibre, usually spun into yarn, is going
to be exposed to a number of varying processes before completion. Levelness in
shade is less critical and shade matching is much easier when dyeing in fibre form
than in fabric form, as the fibres are more likely to be blended with other varying
batches during carding [26].
However, cotton fibre is rarely dyed in loose fibre form. This is due in part to the
problem of compacting and swelling resulting in poor dye penetration throughout the
fibre mass.

18
1.6.2 Yarn Dyeing Processes
Yarn dyeing is usually carried out in two forms: generally in hanks for embroidery
and craft yarns, and in cone form for knitting yarns.
1.6.2.1 Yarn Dyeing Cones of Cotton
Cone dyeing of cotton often follows this procedure:
1. Raw yarn is wound on to a spring tube - this allows the yarn to be packed in
suitable form to give maximum penetration of the dye into the yarn.
2. The packages are then slotted onto a dyeing carrier’s spindle and pressed to
achieve a suitable height and density of packing. Careful attention to the package
density is required to prevent channelling.
3. The liquor is alternately circulated from inside to outside and then from outside to
inside. This change in liquor circulation ensures level dyeing.
4. Once dyeing is complete the packages are unpacked and then hydro extracted to
remove excess water and dried.
The advantages of dyeing in yarn form are shades can be selected closer to the end
product making the choice of selecting more fashionable shades easier to predict.
Dyeing in yarn form also allows for more efficient spinning of undyed fibre [26].
1.6.3 Fabric Dyeing Processes
Before fabric can be dyed it requires pre-treatment to remove impurities and any
unwanted natural colour that may interfere with the final colour of the product. The
various pre-treatment processes include desizing, scouring, bleaching and in some
cases mercerisation [27].
1.6.3.1 Fabric Preparation for Dyeing
Size is applied to cotton yarns to improve their strength and bending properties.
Cotton warp yarns are invariably sized as weaving applies a high level of stress on the
19
yarns during weft insertion. The water-insoluble starch, that is applied as the size
needs to be removed once the fabric manufacturing process is complete. The size is
removed by treating the fabric in a hot enzyme bath [27]. The importance of
removing starch from the fabric is to prevent unlevel dyeing.
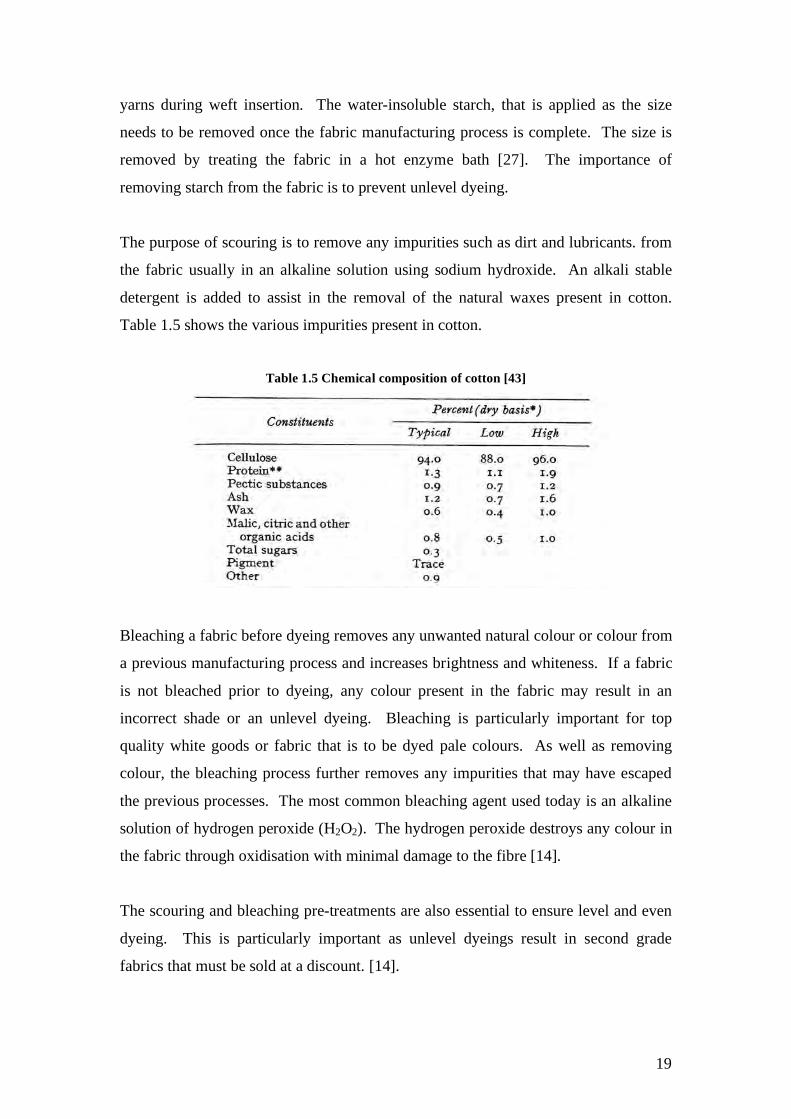
The purpose of scouring is to remove any impurities such as dirt and lubricants. from
the fabric usually in an alkaline solution using sodium hydroxide. An alkali stable
detergent is added to assist in the removal of the natural waxes present in cotton.
Table 1.5 shows the various impurities present in cotton.
Table 1.5 Chemical composition of cotton [43]
Bleaching a fabric before dyeing removes any unwanted natural colour or colour from
a previous manufacturing process and increases brightness and whiteness. If a fabric
is not bleached prior to dyeing, any colour present in the fabric may result in an
incorrect shade or an unlevel dyeing. Bleaching is particularly important for top
quality white goods or fabric that is to be dyed pale colours. As well as removing
colour, the bleaching process further removes any impurities that may have escaped
the previous processes. The most common bleaching agent used today is an alkaline
solution of hydrogen peroxide (H2O2). The hydrogen peroxide destroys any colour in
the fabric through oxidisation with minimal damage to the fibre [14].
The scouring and bleaching pre-treatments are also essential to ensure level and even
dyeing. This is particularly important as unlevel dyeings result in second grade
fabrics that must be sold at a discount. [14].

20
The colouring of a textile fabric usually occurs in one of two ways, continuous and
batch.
1.6.3.2 Continuous Dyeing
The continuous dyeing process is more appropriate when extremely long runs of the
same colour are required. Most commonly, the continuous process is used for dyeing
woven cotton and cotton/polyester blended fabrics. The continuous dyeing process
can be broken into four stages; dye application by padding, dye fixation, washing off
and drying [14].
Cold pad batch dyeing is often used for knitted fabrics. Pad steam dyeing is mostly
used for woven fabrics. In this process the dye solution, together with alkali and salt,
is padded onto the fabric, which is then immediately steamed at 105˚C in saturated
steam for 10 minutes.
1.6.3.3 Exhaust Dyeing
Exhaust dyeing is where the dye is exhausted from a larger volume of water into the
substrate or fabric. Dyeing time is longer and as dyeing progresses the concentration
of dye per litre of liquor decreases as the dye exhausts into the fibre. Batch dyeing is
more suited for shorter production runs, allowing for quicker colour changes if
required. Further, the machinery takes up less space also permitting multiple
machines to be set up for a range of colours.
Within the batch dyeing process there are three different basic methods available.
These are:
• the fabric circulates through the liquor;
• the water circulates through the fabric;
• both the fabric and liquor circulated together.
Batch dyeing can vary with the liquor ratio (the quantity of water used per kilogram
of fabric), the dyeing temperature and auxiliaries to be used, the type of dyestuff, the

21
rate and extent of exhaustion, the number of rinse baths required and any subsequent
post dyeing treatments [28].
In jig dyeing (Figure 1.8) the fabric is held at full width and passes through the dye
liquor. As the fabric is unwound from one roller, it passes through the dye bath and is
rewound on the second roller. This process continues until the required depth and
levelness in shade is achieved [29]. Salt concentrations can be very high in jig dyeing
because of the very low liquor ratio (3-5:1). However the liquor volumes are small
and can easily be segregated from the main effluent streams for separate treatment if
the dye house is under pressure to reduce salt or colour discharges.
Figure 1.8 Cross section of a jig dyeing machine [30]
Jet dyeing is a form of dyeing that involves the liquor moving around the fabric and
the fabric moving through the liquor typically in a pressure chamber. The dye liquor,
which is heated to the required temperature dependant on the dyes being used,
penetrates and dyes the fabric. After which, the fabric is then floated through a tube
where the liquor also passes through at a faster rate so that the fabric does not touch
the side of the tube. This type of dyeing is even ideal for delicate fabrics as there is
no tension or pressure applied on the fabric [29]. Jet dyeing represents the most
advanced and economical form of dyeing piece goods. Liquor ratios can be as low as
4:1 thereby reducing water usage. However because salts are added in proportion to
the fabric weight, the TDS of discharged effluents become greater. It is estimated that
over 80% of all fashion apparel world wide is dyed in a jet machine.

22
Figure 1.9 Functions of a jet dyeing machine [30]
In winch dyeing the fabric, in rope form, is drawn through the dye liquor by means of
a driven winch creel (Figure 1.10). The fabric is transported under low or zero
tension. Long liquor ratios up to 40:1 are employed and therefore high concentrations
of salt are required. Care must be taken to ensure that creasing does not occur, as this
may cause running marks on the fabric.
Figure 1.10 Cross section of a winch dyeing machine [30]

23
1.6.4 Garment Dyeing Processes
An alternative to fabric dyeing, where the fabric is coloured before being cut and
sewn into a garment, is garment dyeing [31]. This makes it possible for the dyer to
have a stock of greige garments and await instructions as to the colour required.
Therefore colouration can take place in a short amount of time. Also, the ability to
produce many small batches of different colours is more economically attractive than
dyeing cones of yarn various different shades [32].
The process works by loosely packing completed garments into a large nylon net bag.
The bag is then placed in a machine known as a paddle dyer, which contains a paddle
that agitates the liquor to ensure level dyeing. Garment dyeing is principally used for
colouring made up cotton garments [29].
1.7 Options for Reducing Salt
There are two principal ways of reducing the amount of salt used when dyeing cotton.
One is to use low salt dyes such as those developed by Ciba. Another option is to pre-
treat the fabric with a reagent that performs some of the functions attributed to salt, so
that the amount of salt added into the dye bath is reduced.
1.7.1 Low Salt Dyes
In 1995 Ciba developed a type of multifunctional dye known as the CIBACRON® LS
dye-stuff range which requires only 25% of the usual recommended amount of salt. It
is believed that these dyes contain two monofluorotriazine reactive groups [33].
CIBACRON® LS dyes are less sensitive to changes in the dye liquor ratio and are
designed for a hot-exhaust application on cellulosic fibres and fibre blends making it
easier to achieve consistent dyeings first time [34].
24
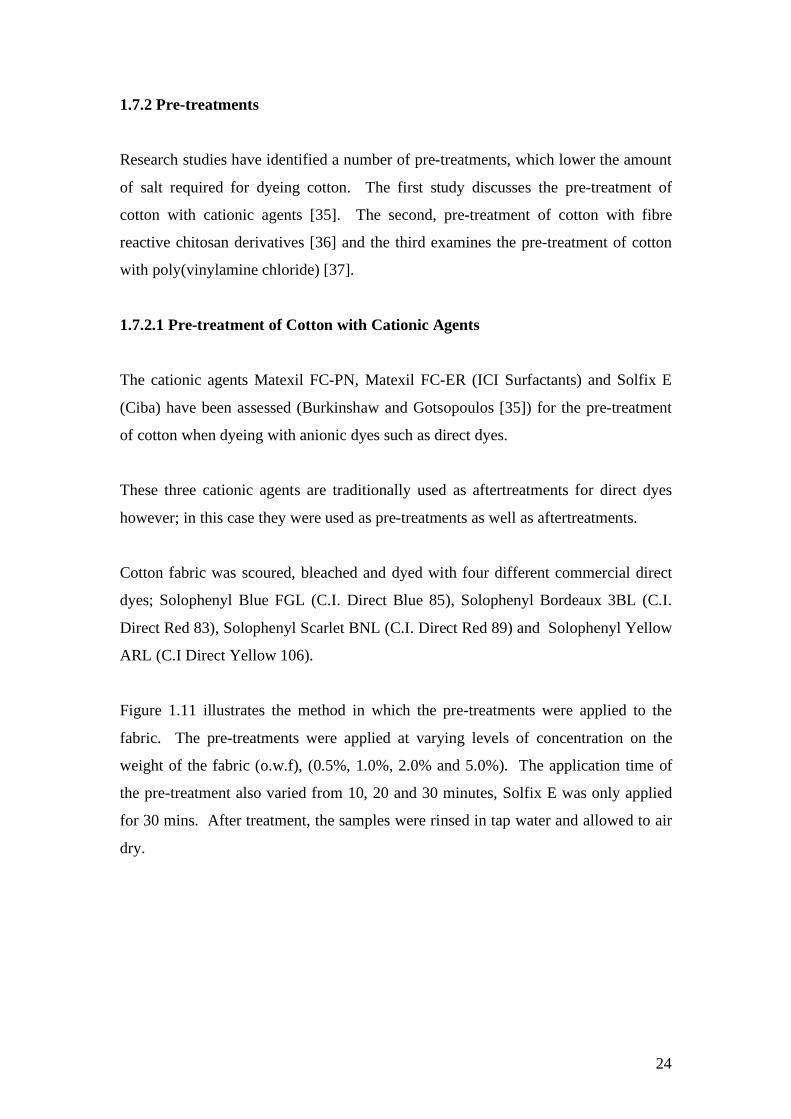
1.7.2 Pre-treatments
Research studies have identified a number of pre-treatments, which lower the amount
of salt required for dyeing cotton. The first study discusses the pre-treatment of
cotton with cationic agents [35]. The second, pre-treatment of cotton with fibre
reactive chitosan derivatives [36] and the third examines the pre-treatment of cotton
with poly(vinylamine chloride) [37].
1.7.2.1 Pre-treatment of Cotton with Cationic Agents
The cationic agents Matexil FC-PN, Matexil FC-ER (ICI Surfactants) and Solfix E
(Ciba) have been assessed (Burkinshaw and Gotsopoulos [35]) for the pre-treatment
of cotton when dyeing with anionic dyes such as direct dyes.
These three cationic agents are traditionally used as aftertreatments for direct dyes
however; in this case they were used as pre-treatments as well as aftertreatments.
Cotton fabric was scoured, bleached and dyed with four different commercial direct
dyes; Solophenyl Blue FGL (C.I. Direct Blue 85), Solophenyl Bordeaux 3BL (C.I.
Direct Red 83), Solophenyl Scarlet BNL (C.I. Direct Red 89) and Solophenyl Yellow
ARL (C.I Direct Yellow 106).
Figure 1.11 illustrates the method in which the pre-treatments were applied to the
fabric. The pre-treatments were applied at varying levels of concentration on the
weight of the fabric (o.w.f), (0.5%, 1.0%, 2.0% and 5.0%). The application time of
the pre-treatment also varied from 10, 20 and 30 minutes, Solfix E was only applied
for 30 mins. After treatment, the samples were rinsed in tap water and allowed to air
dry.

25
Figure 1.11 Application methods for cationic fixing agents (numbers in brackets refers to
aftertreatment conditions)
Figure 1.12 illustrates the dye application method, after which samples were again
rinsed under tap water and allowed to air dry. The samples were dyed with 2 levels of
salt concentration, one group was dyed with no salt and the other with 20g/l. The pre-
treatment chemicals were then reapplied as an aftertreatment in the same manner
demonstrated in Figure 1.11, however Matexil FC-PN and Matexil FC-ER were
applied at 4% o.w.f and Solfix E was applied at 6% o.w.f.
Figure 1.12 Dyeing Method

26
The colour strength values of the dyeings were analysed as well as the wash and light
fastness properties. The values were then compared with those of standard after
treated dyeings. The outcomes that arose were that the pre-treated samples had
increased colour strength. When dyed in the absence of an electrolyte the pre-treated
samples always had higher K/S values than those samples that were not pre-treated.
Of the three pre-treatment chemicals, it was found that Matexil FC-PN and Solfix E
behaved similarly. The higher the concentration of the chemical applied onto the
fabric, the higher the colour strength of the dyed sample. Overall however, Solfix E
was found to be more effective.
The samples that were pre-treated and dyed in the presence of an electrolyte were
found to have lower colour strength values, compared to the standard samples dyed
under the same conditions. It was also found that the wash fastness properties were
unaffected by the pre-treatments. However, the light fastness properties were found
to have decreased slightly compared to the light fastness properties of the standard
samples.
1.7.2.2 Pre-treatment of Cotton with Fibre Reactive Chitosan Derivatives
A trial on the pre-treatment of cotton was conducted by Lim and Hudson [36]. The
aim of their experiment was to trial a fibre-reactive chitosan derivative known as
chitosan chloride, with the fibre reactive group being O-acrylamidomethyl-N-[(2-
hydroxy-3-trimethyl-ammonium)propyl] – NMA-HTCC. To evaluate the dyeability
and fastness properties of the cotton fabric, also the claimed antimicrobial properties
were analysed. The NMA-HTCC was applied to the cotton fabric under alkaline
conditions and was able to form a covalent bond with the cotton fibre, demonstrated
here in Figure 1.13.

27
Figure 1.13 Covalent bonding between NMA-HTCC and cotton
In this work 100% cotton fabric that was previously bleached, desized and mercerised
was used. Two direct and two reactive dyes were tested, namely, C.I. Direct Blue 78
and C.I. Direct Red 80 and C.I. Reactive Blue 21 and C.I. Reactive Orange 107. The
pre-treatment agent NMA-HTCC was dissolved to give three solutions at varying
concentrations (0.25%, 0.5% and 1.0%). Each solution had 1.5% sodium hydroxide
added as a catalyst. The method of application was by padding with 100% wet pick-
up, the samples where then sealed in plastic bags to avoid penetration by air. The
samples were left sealed for 24 hours followed by a rinse under cold tap water and
then washed in a domestic washing machine for 6 minutes in warm water and air
dried.
Both the standard and pre-treated samples were dyed omitting the electrolyte in the
pre-treated sample dye bath, Figure 1.14 illustrates the dyeing method.
28
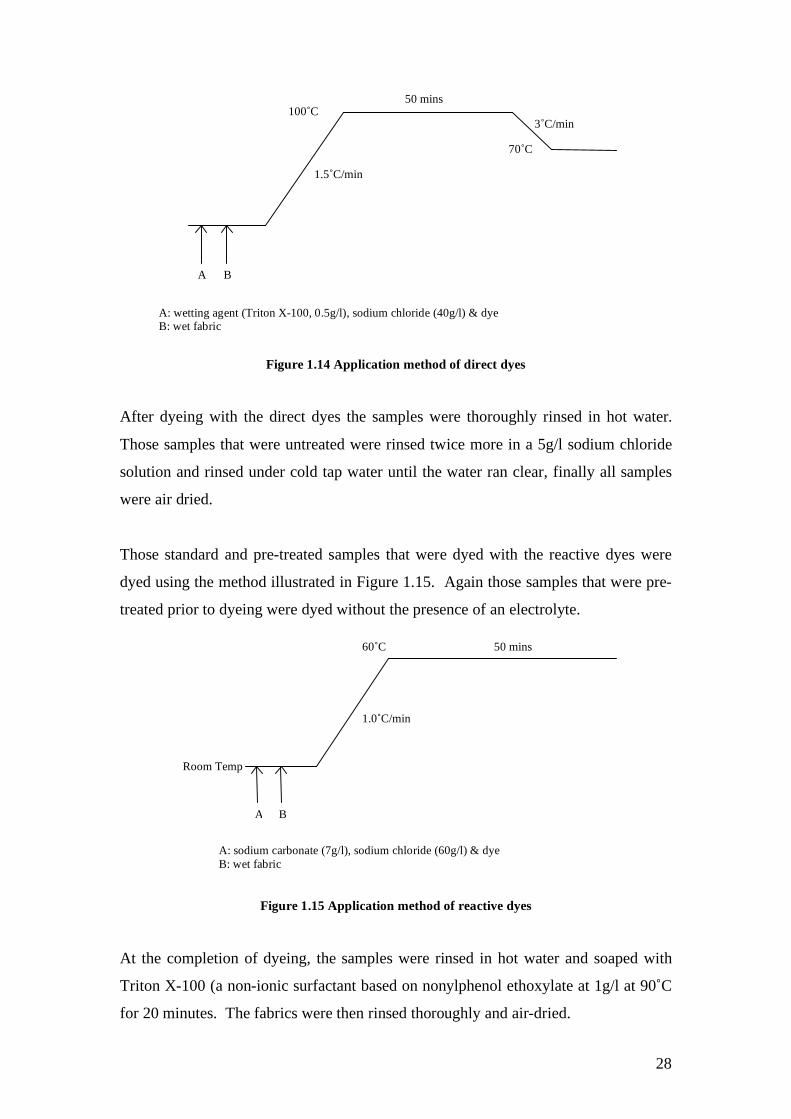
Figure 1.14 Application method of direct dyes
After dyeing with the direct dyes the samples were thoroughly rinsed in hot water.
Those samples that were untreated were rinsed twice more in a 5g/l sodium chloride
solution and rinsed under cold tap water until the water ran clear, finally all samples
were air dried.
Those standard and pre-treated samples that were dyed with the reactive dyes were
dyed using the method illustrated in Figure 1.15. Again those samples that were pre-
treated prior to dyeing were dyed without the presence of an electrolyte.
Figure 1.15 Application method of reactive dyes
At the completion of dyeing, the samples were rinsed in hot water and soaped with
Triton X-100 (a non-ionic surfactant based on nonylphenol ethoxylate at 1g/l at 90˚C
for 20 minutes. The fabrics were then rinsed thoroughly and air-dried.
A B
100˚C
1.5˚C/min
50 mins
70˚C
3˚C/min
A: wetting agent (Triton X-100, 0.5g/l), sodium chloride (40g/l) & dye B: wet fabric
Room Temp
A B
60˚C
1.0˚C/min
50 mins
A: sodium carbonate (7g/l), sodium chloride (60g/l) & dye B: wet fabric
29
The dyed samples were evaluated for their colour strength and fastness properties to
washing and light. All fastness tests were carried out according to the American
Association of Textile Chemists and Colourist (AATCC) methods.
After evaluating the results, it was found that the samples that were pre-treated with
1% NMA-HTCC and dyed with no salt, had higher colour strength values than those
samples that were dyed as per the recommended method in the pattern card with a
larger amount of salt. One of the dyes, C.I. Direct Blue 78 when used to dye a
sample at 3% o.w.f on fabric pre-treated with 1% NMA-HTCC gave complete dye
bath exhaustion and showed a higher colour strength than that of the untreated cotton
dyed at 4% o.w.f.
It was found that the wash fastness properties of the pre-treated cotton fabrics were
far superior to those of the untreated samples for both the direct and reactive dyes.
However, when the light fastness samples were examined it was found that the pre-
treated samples exhibited poorer light fastness properties than those of the untreated
samples. It was decided that further investigation would be required in order to
overcome this problem.
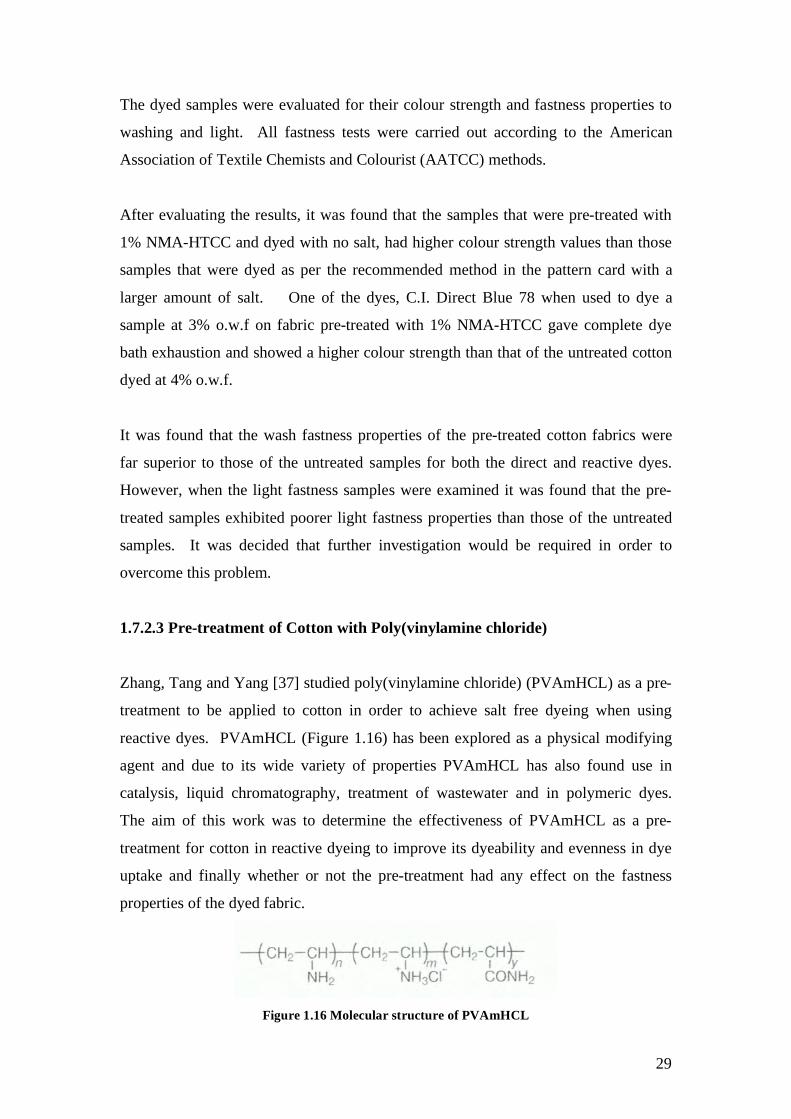
1.7.2.3 Pre-treatment of Cotton with Poly(vinylamine chloride)
Zhang, Tang and Yang [37] studied poly(vinylamine chloride) (PVAmHCL) as a pre-
treatment to be applied to cotton in order to achieve salt free dyeing when using
reactive dyes. PVAmHCL (Figure 1.16) has been explored as a physical modifying
agent and due to its wide variety of properties PVAmHCL has also found use in
catalysis, liquid chromatography, treatment of wastewater and in polymeric dyes.
The aim of this work was to determine the effectiveness of PVAmHCL as a pre-
treatment for cotton in reactive dyeing to improve its dyeability and evenness in dye
uptake and finally whether or not the pre-treatment had any effect on the fastness
properties of the dyed fabric.
Figure 1.16 Molecular structure of PVAmHCL

30
100% cotton fabric, which had previously been bleached, desized and mercerised was
dyed with six dyes namely, C.I Reactive Red 2, 3 and 195, C.I. Reactive Blue 4 and
19 and C.I. Reactive Orange 16.
The PVAmHCL was applied via the pad-bake method, applying 5g/l of the
PVAmHCL with 80% wet pick up. The fabric was dipped and nipped twice and then
dried at room temperature before being baked for 10 minutes at 100˚C.
As well as dyeing the pre-treated fabrics; standard fabrics were also dyed. Once
dyeing was complete the samples were rinsed in cold, hot and then cold water before
being boiled in a solution containing 2g/l of an anionic detergent followed by a final
rinsing. The samples were then allowed to air dry.
The degree of dye exhaustion was evaluated. Cross-sections of the fabrics were
examined microscopically, and the colourfastness to washing and rubbing determined.
The conclusions that arose from the experimental work were; fabrics pre-treated with
5g/l of PVAmHCL at pH 7, when compared to fabrics dyed in the conventional
manner, displayed improved reactivity and fixation for the majority of the reactive
dyes dyed without salt. Through a cross-section examination it was discovered that
the dye penetrated the entire fibre, from outer to core. The wash fastness and rub
fastness properties were reduced however; dye in the effluent was also reduced which
demonstrated the commercial potential of PVAmHCL as a pre-treatment for cotton.
1.8 Summary
Generally, it is now widely known that the amount of salt used in the direct dyeing
and reactive dyeing processes is having a serious impact on the environment. One
conclusion that a number of researchers have drawn to is to change the surface of the
cotton fabric/fibre in order for it to become more attractive to a direct or reactive dye
therefore reducing the need for such a large amount of salt.
This study aims to investigate two new pre-treatment agents on their ability to reduce
salt usage when dyeing 100% cotton fabric with reactive and direct dyes. The study

31
also explores the most efficient method of application of the pre-treatments. The
outcomes have applicability to jet dyeing woven and knitted cotton fabric.

Chapter 2
Materials and Methodology

33
2.1 Introduction
The aim of this research was to reduce the amount of salt used in dyeing of 100%
cotton fabric. Modification of steps within the dyeing process may reduce the
requirement for salt and water through out the process, without impacting upon the
final quality of the product. Such modifications would have to be cost effective and of
low risk for industry to implement.
2.2 Materials
2.2.1 Fabric
100% cotton fabric – bleached, scoured and ready to dye with the following
specifications was used in the present investigation:
Fabric weight: 188.7g/m2
Fabric construction: plain weave, 25 ends/cm and 20 picks/cm
2.2.2 Chemicals
2.2.2.1 Pre-treatment Chemicals
2.2.2.1 (A) Chitosan
Chitosan, a derivative of chitin, is a polysaccharide sourced from crab and lobster
shells (Figure 2.1).
Figure 2.1 Chemical structure of Chitosan [46]

34
Chitosan, when applied to cotton prior to dyeing, is known to increase the dyeability
of direct and reactive dyes. It is also known to minimise the colour difference
between mature and immature cotton on dyeing [40]. Chitosan used was supplied by
Sigma Aldrich [41] and a Material Safety Data Sheet for Chitosan can be found in
Appendix I.
2.2.2.1 (B) Cibafix ECO
Cibafix ECO is a proprietary polyethylene polyamine manufactured and supplied by
Ciba Specialty Chemicals, which is also free from formaldehyde and zinc. It is used
in industry to improve the wet fastness improver of dyeings. This product also
prevents dye migration after dyeing and protects the dye/fibre linkage of reactive dyes
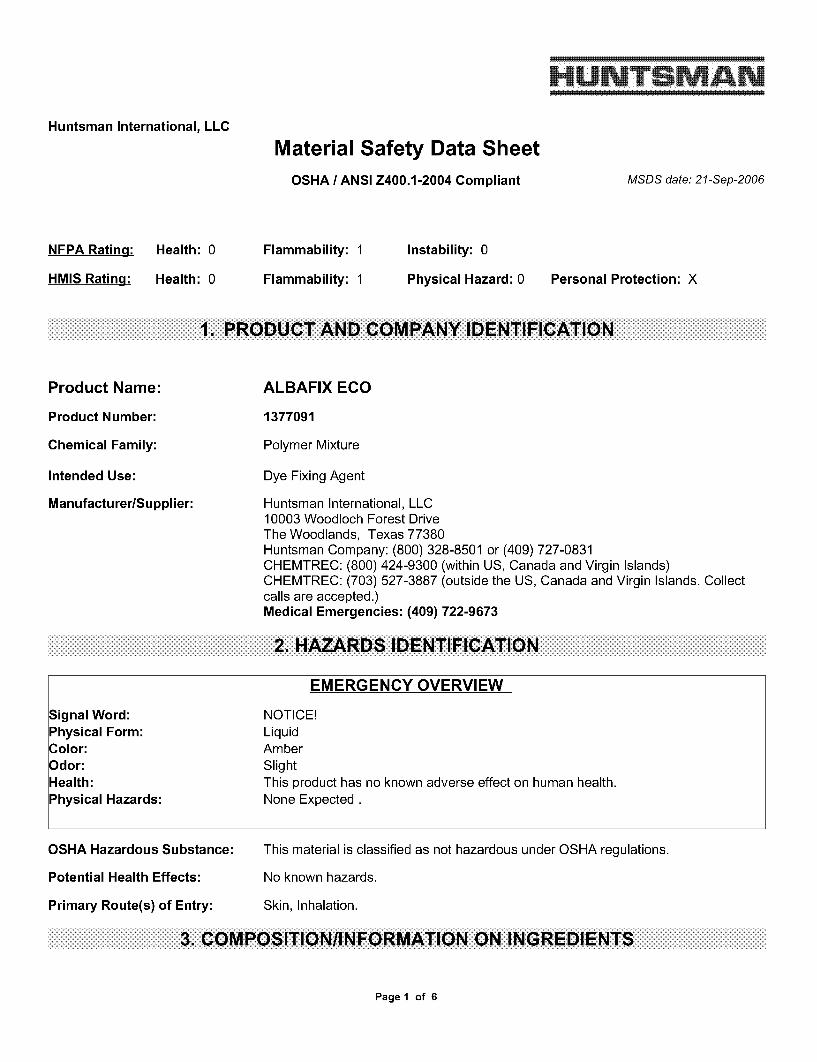
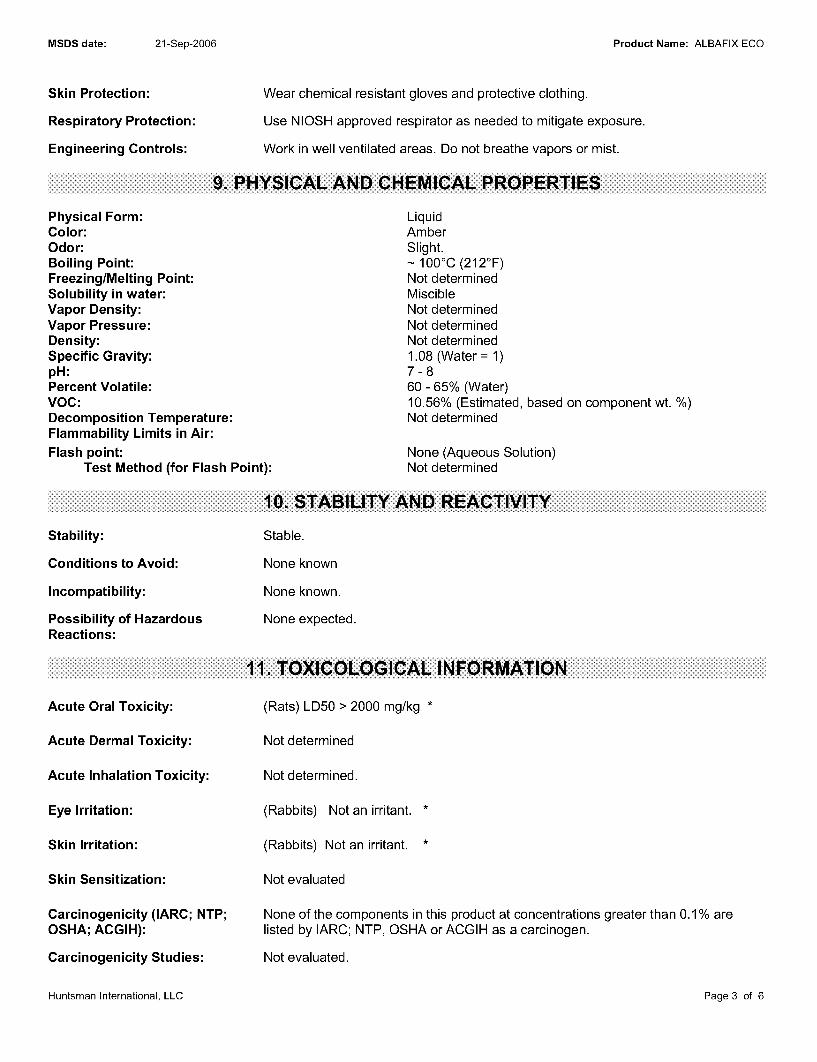
against acid hydrolysis and thermo-cracking [42]. A MSDS for Cibafix ECO (now
known as Albafix ECO) can be found in Appendix II.
2.2.2.2 Dyestuffs
Three dyes were used throughout this investigation. Two were different reactive
dyes; Sumifix Supra Navy 3GF 150% supplied by Sumitomo Chemicals a hetero
bifunctional reactive and Procion Brilliant Scarlett H-EXL a homo bifunctional
reactive supplied by BASF. The third dye used was a direct dye – Solophenyl Rubine
RNL a SDC class B direct supplied by Ciba Specialty Chemicals. The colour of the
three dyes is shown in Figure 2.2.
(1) (2) (3) Figure 2.2 (1) Sumifix Supra Navy 3GF 150%, (2) Procion Brilliant Scarlett H-EXL,
(3) Solophenyl Rubine RNL
The principal dye used throughout the trial was the Sumifix Supra Navy 3GF 150%
because this is a bifunctional dye which contains higher colour strength and higher
exhaustion properties.

35
2.2.3 Other Chemicals and Auxiliaries
A list of the various chemicals and auxiliaries used is given below along with the
supplier:
Sodium Hexametaphosphate Powder Ajax Chemicals
Glauber’s Salt Anhydrous GR Chemplas
Sodium Carbonate (Soda Ash) GR Science Supply Australia
Acetic Acid GR Science Supply Australia
Dispersant AD York Chem Australia Pty Ltd
Dispersant 2000 York Chem Australia Pty Ltd
2.3 Pre-treatment of Fabrics
A stock solution of Chitosan was prepared by dissolving Chitosan powder in a 1.25%
solution of acetic acid. Cibafix ECO was used in liquid form as received.
2.3.1 Application of Chitosan and Cibafix ECO – Method 1
Auxiliaries:
10% solution of sodium carbonate
1.67% solution of Chitosan (in 1.25% acetic acid) or,
Cibafix ECO
10% solution of acetic acid
During pre-treatment of cotton fabric the Chitosan and Cibafix ECO were both
applied to the cotton by exhaustion method using the Ahiba Turbocolour machine at a
liquor ratio at 10:1. Approximately 55g of cotton fabric was treated with 0.5, 0.8 and
1.0% of Chitosan, and 1.0, 2.0, 5.0 and 7.0% of Cibafix ECO respectively. The fabric
was wound onto a perforated cylinder, which allowed complete and even coverage by
the pre-treatment chemical onto the fabric. The cylinder was then placed in the
machine and the machine was filled with the initial amount of water. The pH was
adjusted to pH 7.5 – 8 and left to circulate for 5 minutes at room temperature. Either

36
Chitosan or Cibafix ECO was added to the baths as required and the temperature was
raised to 60˚C for Chitosan and 40˚C for Cibafix ECO, over 20 minutes. The fabrics
were then treated at this temperature for further 20 minutes. The pH was then
reduced to pH 5 – 5.5 with acetic acid and circulation was continued for 5 minutes,
followed by thorough rinsing in cold water. All samples were placed in a cabinet
dryer to be air-dried before dyeing.
2.3.2 Pre-treat, Rinse, No Dry – Method 2
Auxiliaries:
10% solution of sodium carbonate
1.67% solution of Chitosan or,
Cibafix ECO
10% solution of acetic acid
A second group of fabric samples was pre-treated in a similar manner to that
mentioned in 2.3.1. However in this instance, once the rinse bath was dropped a fresh
bath of water was immediately refilled ready for the dyeing process to begin.
2.3.3 Pre-treat, No Rinse, No Dry – Method 3
Auxiliaries:
10% solution of sodium carbonate
1.67% solution of Chitosan or,
Cibafix ECO
10% solution of acetic acid
A third group of fabrics were pre-treated also in a similar way to that discussed in
2.3.1 however, in this series, the final rinse was omitted and the bath immediately
refilled ready for the dyeing process to begin.

37
2.4 Dyeing of Fabrics
2.4.1 Dyeing with Sumifix Supra Navy 3GF 150%
The pre-treated fabric samples were dyed according to the procedure shown in Figure
2.3. Fabric samples pre-treated with Chitosan and Cibafix ECO were dyed with a
varying amount of salt from each group as given in Table 2.1. A reference sample
was also dyed with no pre-treatment being applied and as per the pattern card with
100% of the required amount of salt. This reference sample was then compared with
the dyed samples for colour strength and fastness properties.
Figure 2.3 Dye method from Sumitomo pattern card
Auxiliaries used in dyeing (as per pattern card):
1g/l Sodium Hexametaphosphate
50g/l Glauber’s Salt Anhydrous
20g/l Sodium Carbonate
20g/l Acetic Acid
2g/l Dispersant AD
Each group contained 7 fabric samples; three were pre-treated with Chitosan at the
concentrations of 0.5%, 0.8% and 1.0% and four were pre-treated with Cibafix ECO
at the concentrations of 1.0%, 2.0%, 5.0% and 7.0%.

38
Table 2.1 Fabric groups and levels of salt used for dyeing
Group 1 Group 2 Group 3 Group 4 Group 5
0.5%, 0.8% & 1.0%
Chitosan treated
1.0%, 2.0%, 5.0% &
7.0% Cibafix ECO
treated
100% salt
50g/l
75% salt
37.5g/l
50% salt
25g/l
25% salt
12.5g/l
0% salt
0g/l
Though the dye manufacturer’s pattern card recommends a liquor ratio of 20:1,
because of the limitations due to the capacity of the machine, the dyeings were carried
out at a liquor ratio of 10:1. Fabrics were dyed one at a time on an Ahiba
Turbocolour machine. The fabric samples were individually wound on to perforated
cylinders, similar to those used for the pre-treatment application and inserted into the
machine. Dyeing then proceeded according to the pattern card (Figure 2.3) except
with the varying amount of salt depending on which group was being dyed. Once
dyeing was complete, the dye bath was drained and a fresh bath of water was
introduced. The sample was then neutralised with acetic acid and left to circulate.
The bath was again drained and a fresh bath introduced. A hot rinse was then
performed with the temperature raised to 80 – 90˚C (85˚C) over 10 minutes and left to
circulate for a further 10 minutes. The holder was again emptied and refilled with
2g/l of dispersant AD and the temperature raised to 95 – 98˚C (97˚C) over 10 minutes
and continued to circulate for a further 10. Finally the liquor was drained, refilled
with water and a cold rinse was applied for 5 minutes. All samples were then left to
air dry in a cabinet dryer.
2.5 One-bath Method
During the study, the question was raised whether or not the pre-treatment chemical
could be added into the dye bath to create a one bath pre-treatment/dyeing process. If
so, would this allow the elimination of the pre-treatment as a separate step and result
in less water usage and a shorter process cycle? These trials were conducted with
2.0% Cibafix ECO and dyed with 75% of the recommended amount of salt.

39
2.5.1 Pre-treatment Chemical Added in Dye Bath
Auxiliaries used in dyeing (as per pattern card):
1g/l Sodium Hexametaphosphate
50g/l Glauber’s Salt Anhydrous
20g/l Sodium Carbonate
2.0% Cibafix ECO
20g/l Acetic Acid
2g/l Dispersant AD
Approximately 55g of cotton fabric was wound on a perforated cylinder and inserted
into the Ahiba Turbocolour machine. The machine was filled with water at a
temperature of 40˚C. The required amount of Cibafix ECO was introduced into the
bath and was left to circulate for 30 minutes. Dyeing then continued as normal
according to the Sumitomo pattern card illustrated in Figure 2.3. The samples were
rinsed as previously mentioned, with one hot rinse at 85˚C, a soaping off at 97˚C, and
a cold rinse. The samples were then air dried in a cabinet dryer.
2.5.2 Pre-treatment as Post-treatment
Auxiliaries used in dyeing (as per pattern card):
1g/l Sodium Hexametaphosphate
50g/l Glauber’s Salt Anhydrous
20g/l Sodium Carbonate
2.0% Cibafix ECO
20g/l Acetic Acid
2g/l Dispersant AD
Approximately 55g of cotton fabric was wound on a perforated cylinder and inserted
into the Ahiba Turbocolour machine. Dyeing was carried out according to the pattern
card (Figure 2.3). After 45 minutes of dyeing, the required amount of Cibafix ECO
was added, and dyeing continued as normal. The liquor was drained and refilled and
the sample was neutralised with acetic acid. The sample was rinsed at a temperature
of 80 – 90˚C (85˚C) for 10 minutes. This was followed by a soaping off in a fresh
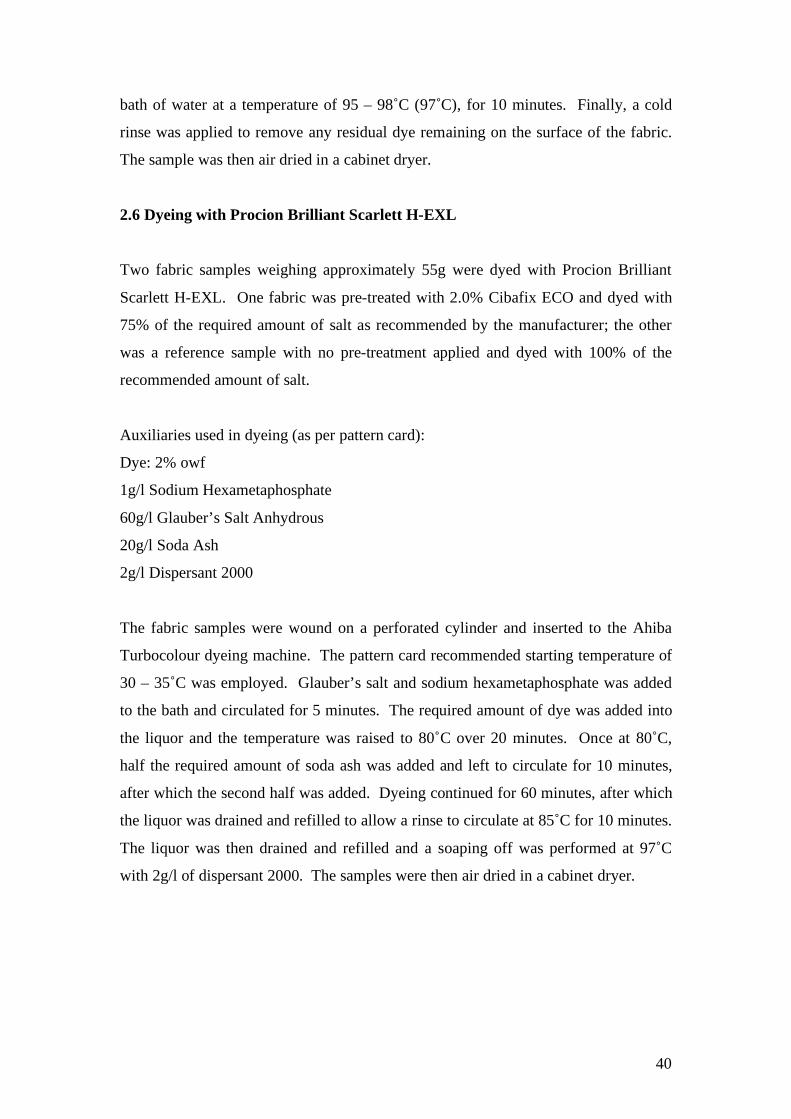
40
bath of water at a temperature of 95 – 98˚C (97˚C), for 10 minutes. Finally, a cold
rinse was applied to remove any residual dye remaining on the surface of the fabric.
The sample was then air dried in a cabinet dryer.
2.6 Dyeing with Procion Brilliant Scarlett H-EXL
Two fabric samples weighing approximately 55g were dyed with Procion Brilliant
Scarlett H-EXL. One fabric was pre-treated with 2.0% Cibafix ECO and dyed with
75% of the required amount of salt as recommended by the manufacturer; the other
was a reference sample with no pre-treatment applied and dyed with 100% of the
recommended amount of salt.
Auxiliaries used in dyeing (as per pattern card):
Dye: 2% owf
1g/l Sodium Hexametaphosphate
60g/l Glauber’s Salt Anhydrous
20g/l Soda Ash
2g/l Dispersant 2000
The fabric samples were wound on a perforated cylinder and inserted to the Ahiba
Turbocolour dyeing machine. The pattern card recommended starting temperature of
30 – 35˚C was employed. Glauber’s salt and sodium hexametaphosphate was added
to the bath and circulated for 5 minutes. The required amount of dye was added into
the liquor and the temperature was raised to 80˚C over 20 minutes. Once at 80˚C,
half the required amount of soda ash was added and left to circulate for 10 minutes,
after which the second half was added. Dyeing continued for 60 minutes, after which
the liquor was drained and refilled to allow a rinse to circulate at 85˚C for 10 minutes.
The liquor was then drained and refilled and a soaping off was performed at 97˚C
with 2g/l of dispersant 2000. The samples were then air dried in a cabinet dryer.

41
2.7 Dyeing with Solophenyl Rubine RNL
Two fabric samples weighing approximately 55g were dyed with Solophenyl Rubine
RNL. One fabric was pre-treated with 2.0% Cibafix ECO and dyed with 75% of the
required amount of salt recommended by the manufacturer; the other was a reference
sample with no pre-treatment applied and dyed with 100% of the recommended
amount of salt.
Auxiliaries used in dyeing (as per pattern card):
Dye: 2% owf
1g/l Sodium Hexametaphosphate
20g/l Glauber’s Salt Anhydrous
2g/l Dispersant 2000
The samples were wound on a perforated cylinder and inserted into the Ahiba
Turbocolour machine. The pattern card recommended a starting temperature of 50˚C.
The liquor was set to circulate for 5 minutes to wet out the fabric (Figure 2.4). The
glauber’s salt and sodium hexametaphosphate were then added to the bath and
circulated for 5 minutes. The required amount of dye was added to the liquor and the
temperature of the dye bath was raised to 100˚C over 30 minutes. The dyeing process
continued for 60 minutes. The dye bath was then drained and refilled, and a warm
(40˚C) rinse was carried out followed by soaping off with 2g/l of dispersant 2000.
The samples were then air dried in a cabinet dryer.
Figure 2.4 Dye method by Ciba pattern card

42
2.8 Measurement of Exhaustion Levels
During each of the dyeings, samples of liquor were taken at various stages to measure
the level of exhaustion through out the dyeing process. These stages were:
• Before the addition of alkali;
• Every 10 minutes after dye temperature was reached.
Dye liquor samples were then measured on a Hitachi/Model 101 Absorption
Spectrophotometer (Figure 2.5).
Figure 2.5 Hitachi/Model 101 Absorption Spectrophotometer
A calibration curve was generated to determine how much dye (g/l) remained in the
liquor at the various intervals during the dyeing process (Figure 2.6). This was
determined by having a known amount of dye in liquor and gradually diluting it to
obtain known transmission values.
Figure 2.6 Calibration Curve

43
The calibration curve illustrates that as the transmission value increases, the amount
of dye remaining in the liquor decreases. Using this graph in conjunction with the
other graphs produced it is possible to determine the amount of dye that has exhausted
onto the fabric during the dyeing process.
2.9 TDS Evaluation by Evaporation
A sample of the dye bath liquor was taken from each dyeing upon completion, and
TDS was measured through a process of evaporation. The procedure was as follows;
porcelain dishes were prepared by placing them in an oven to dry at 105˚C±3˚C for a
1 hour minimum. With tongs, the dishes were then removed from the oven and
placed into a desiccator, cooled for 2 hours. Each dish was weighed. A known
measurement of dye bath liquid (where possible, 25mls was taken otherwise the
maximum amount possible) was poured into the dish while still on the scales and the
weight recorded. Then the dish, filled with the dye bath liquor was placed in the oven
with a set temperature of 105˚C to evaporate overnight. Once evaporated the dishes
were removed from the oven with tongs and cooled in the desiccator for 2 hours. The
dishes were re-weighed and the weights recorded. Table 2.2 demonstrates the
calculation of TDS via the evaporation method.
Table 2.2. Procedure for calculation of TDS levels by evaporation
A B C D E
Mass of
porcelain dish
(g)
Mass of
porcelain dish
plus solids (g)
Mass of solids
(mg)
Total volume
(L)
TDS
(mg/l)
72.37 72.40 30 0.025 1200
Procedure for calculations.
A – mass of empty dish
B – mass of dish with dried solids
C – mass of solids (g) = B – A
D – total volume (L) = ml water / 1000
E – TDS = C/D

44
2.10 Colour Strength Evaluation
On completion of dyeing and drying the colour strength (K/S) was measured using a
Datacolor Spectraflash (SF) 600 spectrophotometer (Figure 2.7) and Datacolor
TOOLS® software. Three measurements were taken from each sample and then
averaged.
Figure 2.7 Datacolor Spectraflash (SF) 600 spectrophotometer
2.10.1 K/S Values
The Kubleka-Munk series of equations is the mathematical basis of all colour
measuring software (Tech Exchange, 2008). These equations indicate that “for
opaque samples such as textile materials, the ratio of total light absorbed and scattered
by a mixture of dyes is equal to the sum of the ratios of light absorbed and scattered
by the dyes measured separately”. If absorption is defined as ‘K’ and scattering
defined as ‘S’, Kublka-Munk states that:
K/S mixture = (K/S) dye 1 + (K/S) dye 2 + (K/S) dye 3 + …
K/S is calculated from the reflectance value of a sample (R) by the Kubleka-Munk
equation, which states:
K/S = (1 – R)
2R
One example, if a fabric has a reflectance of 20% at a 500nm wavelength, the K/S
value can be calculated as:

45
K/S = (1 – 0.2) = 1.6
2(0.2)
K/S equations can be used to calculate the build up of a particular dye. There is a
direct relationship between K/S and dye concentration. When dark shades such as
navy and black are used there can be considerable differences in reflectance at high
concentrations. This can result in divergences from the linearity from the Kubleka-
Munk theory mainly due to surface reflection characteristics resulting in lower
reflectances [22]. As the main dye used in this study was a navy blue this statement
may need to be considered when taking measurements for evaluation further on.
2.11 Colourfastness Testing
Colourfastness testing was performed on all dyed samples in order to evaluate the
fastness properties of the fabric when exposed to various conditions. All
colourfastness testing was carried out in the laboratories of RMIT Textile Testing
Services.
2.11.1 Colourfastness to Washing
Washing fastness was assessed in prolonged (60 minutes), moderate temperature
(60˚C) conditions of machine laundering in the presence of soap and sodium
carbonate and was carried out in a James Heal & Co. gyrowash featured in Figure 2.8
and 2.9. Tests were carried out according to AS 2001.4.15 – 2006, Colourfastness
tests – Determination of colourfastness to washing – Test E.
Figure 2.8 James Heal & Co. Gyrowash Figure 2.9 Steel canisters inside the Gyrowash

46
2.11.2 Colourfastness to Perspiration
Colourfastness to perspiration tests were carried out to determine the fastness
properties of the samples when exposed to both alkaline and acidic perspiration. The
test was carried out according to AS 2001.4.E04 – 2005, Colourfastness tests –
Determination of colourfastness to perspiration.
2.11.3 Colourfastness to Rubbing
Rubbing tests were carried out on a crockmeter to assess the level of dye transfer
when rubbed. Tests were carried out according to AS 2001.4.3 – 1995,
Colourfastness tests – Determination of colourfastness to rubbing.
2.11.4 Colourfastness to Light
Samples were exposed to an MBTF lamp for a total of 120 hours to measure their
resistance to fading when exposed to light. This is a modified test, which was carried
out according to AS 2001.4.21 – 2006, Colourfastness tests – Determination of
colourfastness to light using an artificial light source (mercury vapour, tungsten
filament, internally phosphor-coated lamp) with the modification being 120 hour
exposure.

Chapter 3
Results and Discussion

48
3.1 Introduction The experimental results are presented in a series of tables and graphs. This allows
evaluation of how the various pre-treatments and their different methods of
application affect the amount of colour and salt released to effluent. The amount of
colour remaining in the dye liquor on completion of dyeing was measured. TDS
levels were also measured on completion of dyeing. Colour strength was assessed
instrumentally and colourfastness properties were considered. The manufacturer’s salt recommendation was 50g/l; as such 100% salt indicates that
the total amount of salt recommended was used. Where 75% salt is stated this means
that only 37.5g/l of salt was used instead of the recommended 50g/l. 50% salt is
equal to 25g/l, 25% salt is equal to 12.5g/l and 0% salt means that no salt was used.
For simplicity and better understanding results, with different classes of dyes such as
Sumifix Supra Navy 3GF 150%, Procion Brillant Scarlett H-EXL and Solophenyl
Rubine RNL are discussed separately in 3.2.1 and 3.6 and 3.9 respectively. 3.2 Samples dyed with Sumifix Supra Navy 3GF 150% 3.2.1 Rate and Extent of Dye Exhaustion 3.2.1.1 Pre-treated Samples Dyed – 100% Salt These samples were dyed using Sumifix Supra Navy 3GF 150% using 100% salt.
The method of pre-treatment application through to dyeing was pre-treat, rinse, dry
and then dye.

49
Figure 3.1 Extent of exhaustion of Chitosan samples dyed with 100% salt
The presence of Chitosan accelerates the rate of dyeing and increases the exhaustion
level of the bath. For the first 40 minutes of dyeing the rate of dyeing increases as the
concentration of Chitosan on the fibre increases (Figure 3.1). After 40 minutes of
dyeing the rate differences between the different levels of Chitosan decreased. This
may be due to a transfer of Chitosan from the fabrics. While this may occur the
results clearly show that Chitosan increases both the rate of dyeing and the
exhaustion. The quality of the dyed samples was acceptable as there was no unlevel
appearance on the fabric surface.
The presence of Cibafix ECO also increases the exhaustion (Figure 3.2). However in
this case a concentration of 5% and 7% is required to produce a meaningful
improvement. The quality of the dyed sample was also acceptable as it had a level
appearance.
This shows that the presence of Chitosan and Cibafix ECO caused improved transfer
of dye from the bath to the fibre. Using the calibration curve shown in Figure 2.6,
along with Figures 3.1 and 3.2, the amount of dye remaining in the dye bath at the end
of the dyeing process was determined.
Tran
smis
sion
Extent of Exhaustion for Pre-treated samples dyed with 100% salt
Number of minutes after dye temperature was reached

50
Figure 3.2 Extent of exhaustion of Cibafix ECO samples dyed with 100% salt
The relevance of the exhaustion results indicates how much dye was exhausted from
the bath onto the fibre. With the exception of 1.0% Cibafix ECO sample all pre-
treated samples exhausted 2 – 3% more than the reference sample. This results in
more dye being passed onto the fibre and not into the effluent.
Table 3.1 Residual dye in bath on completion of dyeing – 100% salt
Type and Level of Pre-treatment Dye in liquor g/l
(initial amount 3g/l)
Exhaustion %
1.0% Chitosan 0.36 88.0
5.0% Cibafix ECO 0.37 87.7
0.5% Chitosan 0.38 87.7
7.0% Cibafix ECO 0.40 86.7
0.8% Chitosan 0.42 86.0
2.0% Cibafix ECO 0.45 85.0
Reference 0.47 84.3
1.0% Cibafix ECO 0.49 83.7
Tran
smis
sion
Extent of Exhaustion for Pre-treated samples dyed with 100% salt
Number of minutes after dye temperature was reached
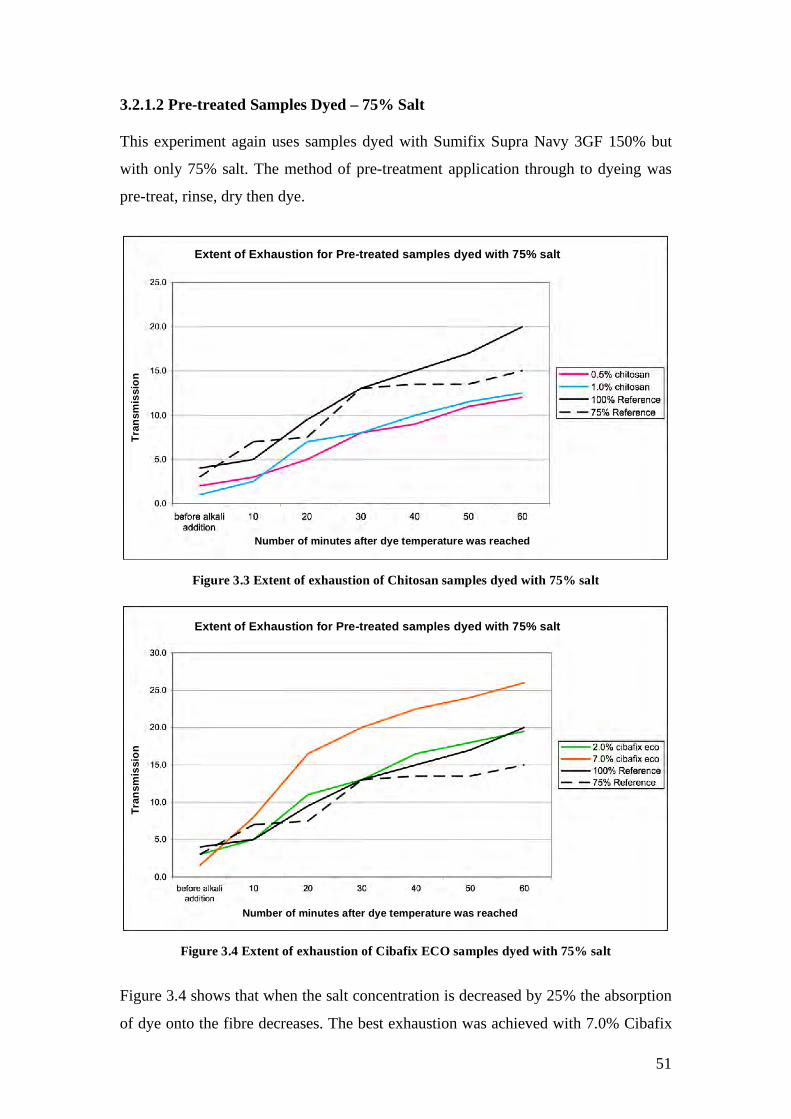
51
3.2.1.2 Pre-treated Samples Dyed – 75% Salt This experiment again uses samples dyed with Sumifix Supra Navy 3GF 150% but
with only 75% salt. The method of pre-treatment application through to dyeing was
pre-treat, rinse, dry then dye.
Figure 3.3 Extent of exhaustion of Chitosan samples dyed with 75% salt
Figure 3.4 Extent of exhaustion of Cibafix ECO samples dyed with 75% salt
Figure 3.4 shows that when the salt concentration is decreased by 25% the absorption
of dye onto the fibre decreases. The best exhaustion was achieved with 7.0% Cibafix
Extent of Exhaustion for Pre-treated samples dyed with 75% salt
Tran
smis
sion
Number of minutes after dye temperature was reached
Extent of Exhaustion for Pre-treated samples dyed with 75% salt
Tran
smis
sion
Number of minutes after dye temperature was reached

52
ECO closely followed by 2.0% Cibafix ECO sample, which finished just below the
reference sample dyed with 100% salt. However, both Cibafix ECO samples
achieved greater exhaustion than the reference sample dyed with 75% salt. The
extent of exhaustion of the Chitosan samples (Figure 3.3) was poorer than both the
reference samples.
Figure 3.3 shows that the dye uptake of the 7.0% Cibafix ECO sample was quite rapid
in the first twenty minutes after the dyeing temperature was reached. It then
continued to increase at a steady rate until the end of the dyeing, i.e. after the initial
phase of the dyeing the exhaustion rate slows down to become constant.
The initial dye uptake of the 2.0% Cibafix ECO sample was gradual until the interval
between the tenth and twentieth minutes. Here, there was a rapid increase in dye
uptake. From the twentieth minute onwards, the sample continued to absorb dye at a
steady rate.
For the 1.0% Chitosan sample, Figure 3.3 indicates that the exhaustion occurred in a
similar pattern to the 2.0% Cibafix ECO sample in Figure 3.4. Table 3.2
demonstrates the exhaustion rate in g/l.
Table 3.2 Residual dye in bath on completion of dyeing – 75% salt
Type and Level of Pre-treatment Dye in liquor g/l Exhaustion %
7.0% Cibafix ECO 0.31 89.7
2.0% Cibafix ECO 0.38 87.3
75% Reference 0.44 85.3
1.0% Chitosan 0.46 84.7
0.5% Chitosan 0.47 84.3
100% Reference 0.47 84.3
3.2.1.3 Pre-treated Samples Dyed – 50% Salt These samples were dyed with Sumifix Supra Navy 3Gf 150% using 50% salt. The
method of pre-treatment application through to dyeing was pre-treat, rinse, dry then
dye.

53
Figure 3.5 and Figure 3.6 clearly shows that when the amount of salt is significantly
reduced, the pre-treatments become negative in their effect on dye exhaustion. The exhaustion levels of both reference samples have superior exhaustion capabilities
than the pre-treated samples. 1.0% Cibafix ECO performed worse when dyed with
100% salt. This pre-treatment is most effective and results a degree of exhaustion
closest to the reference sample.
Figure 3.5 Extent of exhaustion of Chitosan samples dyed with 50% salt
Figure 3.6 Extent of exhaustion of Chitosan samples dyed with 50% salt
Tran
smis
sion
Tr
ansm
issi
on
Number of minutes after dye temperature was reached
Extent of Exhaustion for Pre-treated samples dyed with 50% salt
Extent of Exhaustion for Pre-treated samples dyed with 50% salt
Number of minutes after dye temperature was reached

54
Using the calibration curve, the amount of dye left in the liquor was determined and is
shown in Table 3.3.
As the level of salt used decreases, the performance of the Cibafix ECO appears
stronger than the Chitosan. Whereas, in comparison, Table 3.1 shows the performance
of exhaustion levels alternating between Chitosan and Cibafix ECO.
Table 3.3 Residual dye in bath on completion of dyeing – 50% salt
Type and Level of Pre-treatment Dye in liquor g/l Exhaustion %
100% Reference 0.47 84.3
1.0% Cibafix ECO 0.48 84.0
75% Reference 0.49 83.7
7.0% Cibafix ECO 0.50 83.3
2.0% Cibafix ECO 0.58 80.7
0.8% Chitosan 0.79 73.7
0.5% Chitosan 0.91 69.7
1.0% Chitosan 0.91 69.7
3.2.1.4 Pre-treated Samples Dyed – 25% Salt
These samples were dyed with Sumifix Supra Navy 3Gf 150% using 25% salt. The
method of pre-treatment application through to dyeing was pre-treat, rinse, dry then
dye.

55
Figure 3.7 Extent of exhaustion of Chitosan samples dyed with 25% salt
In Figure 3.7 and Figure 3.8 the pre-treated samples dyed with of 25% of the required
amount of salt along with those dyed with 50% salt, are not commercially viable.
Due to the poor exhaustion levels of the dye, the sample treated with 0.5% Chitosan
did not appear to absorb any dye until 30 minutes after dyeing temperature had been
reached. Figures 3.7 and 3.8 indicate that, salt is still an important part of the dyeing
process. This Figure also confirms that, as the salt concentration decreases, the
presence of Chitosan becomes increasingly negative on dye exhaustion. Figures 3.7
and 3.8 also confirm that dyeing becomes virtually ineffective at salt concentrations
less than 50% of the manufacturer’s recommended levels of salt.
Figure 3.8 Extent of exhaustion of Cibafix ECO samples dyed with 25% salt
Tran
smis
sion
Tr
ansm
issi
on
Number of minutes after dye temperature was reached
Extent of Exhaustion for Pre-treated samples dyed with 25% salt
Number of minutes after dye temperature was reached
Extent of Exhaustion for Pre-treated samples dyed with 25% salt

56
Table 3.4 Residual dye in bath on completion of dyeing – 25% salt
Type and Level of Pre-treatment Dye in liquor g/l Exhaustion %
100% Reference 0.47 84.3
7.0% Cibafix ECO 0.48 84.0
5.0% Cibafix ECO 0.65 78.3
2.0% Cibafix ECO 0.68 77.3
1.0% Cibafix ECO 0.80 73.3
25% Reference 0.90 70.0
1.0% Chitosan 0.98 67.3
0.5% Chitosan 1.15 61.7
0.8% Chitosan 1.15 61.7
Table 3.4 also indicates that Cibafix ECO pre-treatment is more effective as a ‘salt
replacement’ than Chitosan. This indicates that Cibafix ECO seems to be more viable
as a pre-treatment for commercial purposes.
3.2.1.5 Pre-treated Samples Dyed – With No Salt These samples were dyed with Sumifix Supra Navy 3Gf 150% without any salt. The
method of pre-treatment application through to dyeing was pre-treat, rinse, dry and
then dye.
Figure 3.9 Extent of exhaustion of Chitosan samples dyed with no salt
Tran
smis
sion
Number of minutes after dye temperature was reached
Extent of Exhaustion for Pre-treated samples dyed with no salt

57
Figure 3.9 and Figure 3.10 display extremely poor exhaustion levels for the pre-
treated samples. According to Figure 3.9, the 0.5% Chitosan sample appears to not
have absorbed any dye. This shows that some salt must be included in the dye bath to
promote exhaustion.
Figure 3.10 Extent of exhaustion of Cibafix ECO samples dyed with 0% salt
Table 3.5 Residual dye in bath on completion of dyeing – 0% salt
Type and Level of Pre-treatment Dye in liquor g/l Exhaustion %
100% Reference 0.47 84.3
1.0% Cibafix ECO 0.83 72.3
5.0% Cibafix ECO 1.15 61.7
7.0% Cibafix ECO 1.15 61.7
2.0% Cibafix ECO 1.21 59.7
0.5% Chitosan 1.27 57.7
0.8% Chitosan 1.27 57.7
1.0% Chitosan 1.27 57.7
Referring to Table 3.5, the amount of dye left in the dye bath liquor for all samples –
excluding the 1.0% Cibafix ECO sample, was greater than 1g/l. This amount is more
than double that of the reference sample when dyed with 100% salt. It can be
concluded that dyeing the pre-treated samples with 0% salt and 25% was not a viable
option for commercial use. Once again all the Cibafix ECO samples finished above
Tran
smis
sion
Number of minutes after dye temperature was reached
Extent of Exhaustion for Pre-treated samples dyed with 0% salt
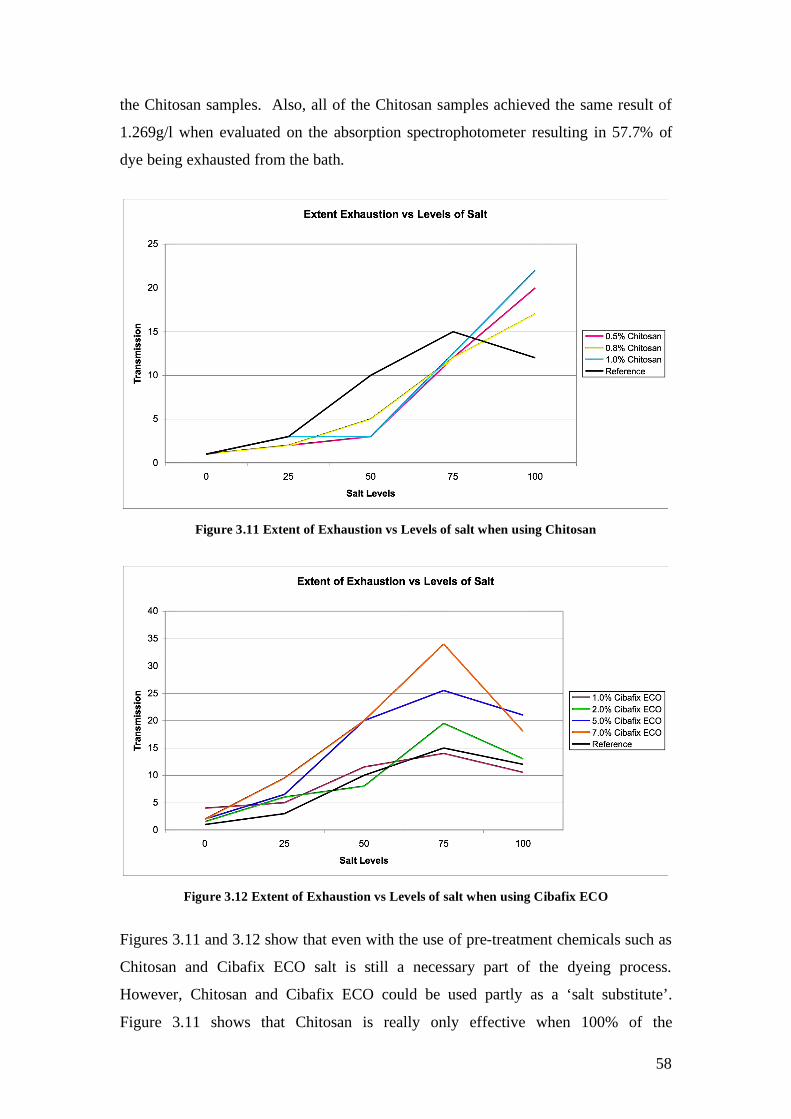
58
the Chitosan samples. Also, all of the Chitosan samples achieved the same result of
1.269g/l when evaluated on the absorption spectrophotometer resulting in 57.7% of
dye being exhausted from the bath.
Figure 3.11 Extent of Exhaustion vs Levels of salt when using Chitosan
Figure 3.12 Extent of Exhaustion vs Levels of salt when using Cibafix ECO
Figures 3.11 and 3.12 show that even with the use of pre-treatment chemicals such as
Chitosan and Cibafix ECO salt is still a necessary part of the dyeing process.
However, Chitosan and Cibafix ECO could be used partly as a ‘salt substitute’.
Figure 3.11 shows that Chitosan is really only effective when 100% of the

59
manufacturer’s recommended salt levels are used, whereas Figure 3.12 promotes
exhaustion relative to salt alone at all concentrations.
Having trialled varying amounts of salt in the dyeing process, it was concluded that
the optimum amount required when used in conjunction with the pre-treatment was
75%. This amount of salt was used in further trials.
3.2.2 Pre-treat, Rinse, Dye – 75% Salt
In the following series of experiments the drying step was omitted to provide a
simpler ‘one-step’ process. All other procedures remained the same.
Figure 3.13 Extent of Exhaustion of samples dyed with 75% salt with a rinse in between
All pre-treated samples began the dyeing process with higher exhaustion levels than
the reference sample (Figure 3.13). However, between the 10th and 20th minute, both
Chitosan samples begin to fall below the reference sample. The best performing
sample was the 7.0% Cibafix ECO treated sample finishing with 87% exhaustion.
The 0.5% and 1.0% Chitosan samples finished with an exhaustion level of 84% and
85% respectively. The 2.0% Cibafix ECO sample finishes with the same extent of
exhaustion as the reference sample – 84.3%.
Number of minutes after dye temperature was reached
Extent of Exhaustion for Pre-treated samples dyed – 75% salt with a rinse in between
Tran
smis
sion

60
When compared to Figure 3.3 and Figure 3.4, the samples in Figure 3.13 all finish
with lower exhaustion levels except for the sample pre-treated with 2.0% Cibafix
ECO which had an increase in exhaustion to 84.3% to match the reference sample.
3.2.3 Pre-treat, No Rinse, Dye – 75% Salt
This procedure is the same for the above experiment except that the rinse step is
omitted; again to simplify the process.
Again, all the samples in Figure 3.14 begin the process with an initial higher dye
uptake than the reference sample. Both Cibafix ECO samples resulted in a higher
level of dye exhaustion than the reference sample. The two Chitosan samples again
finished below the reference. The 0.5% Chitosan finished with an extent of
exhaustion of 84.5% and the 1.0% Chitosan treated finished with an exhaustion level
of 85%. The 7.0% Cibafix ECO finished with the highest exhaustion level of 90.2%.
Finally, the 2.0% Cibafix ECO sample also finished higher than the reference sample
with 87.7% of dye being exhausted from the dye bath.
Figure 3.14 Extent of exhaustion of samples dyed with 75% salt with no rinse in between
The exhaustion level of the samples dyed in Figure 3.14 is greater than those samples
dyed in Figure 3.3 and Figure 3.4. This is most likely due to the loss of Chitosan and
Number of minutes after dye temperature was reached
Extent of Exhaustion for Pre-treated samples dyed – 75% salt with no rinse in between
Tran
smis
sion

61
Cibafix ECO when the rinsing step is included as it was for the samples shown in
Figures 3.3 and 3.4.
The following experiments show the effectiveness of Cibafix ECO when the fabric is
firstly pre-treated as normal, and then in the same bath dyeing continued as normal.
The aim of this experiment was to determine if this pre-treatment process was still
effective while saving time by eliminating rinse cycles and also to see if any
additional water could be saved.
The second experiment where Cibafix ECO was used as a post-treatment, was to
determine the effectiveness of the chemical when added towards the end of the dyeing
process – as Cibafix ECO is traditionally used as an after treatment.
3.2.4 Pre-treatment Chemical Added in Dye Bath
This procedure is the same as 3.2.2 and 3.2.3 except that the dropping of the pre-
treatment bath was omitted in order to continue dyeing in the same liquid.
Figure 3.15 Extent of exhaustion – 75% salt with pre-treatment applied in the same bath as
dyeing As shown in Figure 3.15 the 0.5% and 1.0% Chitosan samples and 2.0% Cibafix ECO
sample complete the dyeing process with a lower extent of exhaustion than the
reference sample dyed with 100% salt. However, the 1.0% Chitosan and 2.0%
Cibafix ECO treatment exhausted more than the reference sample dyed with the same
Number of minutes after dye temperature was reached
Extent of Exhaustion of sample dyed with Pre-treatment in one bath
Tran
smis
sion
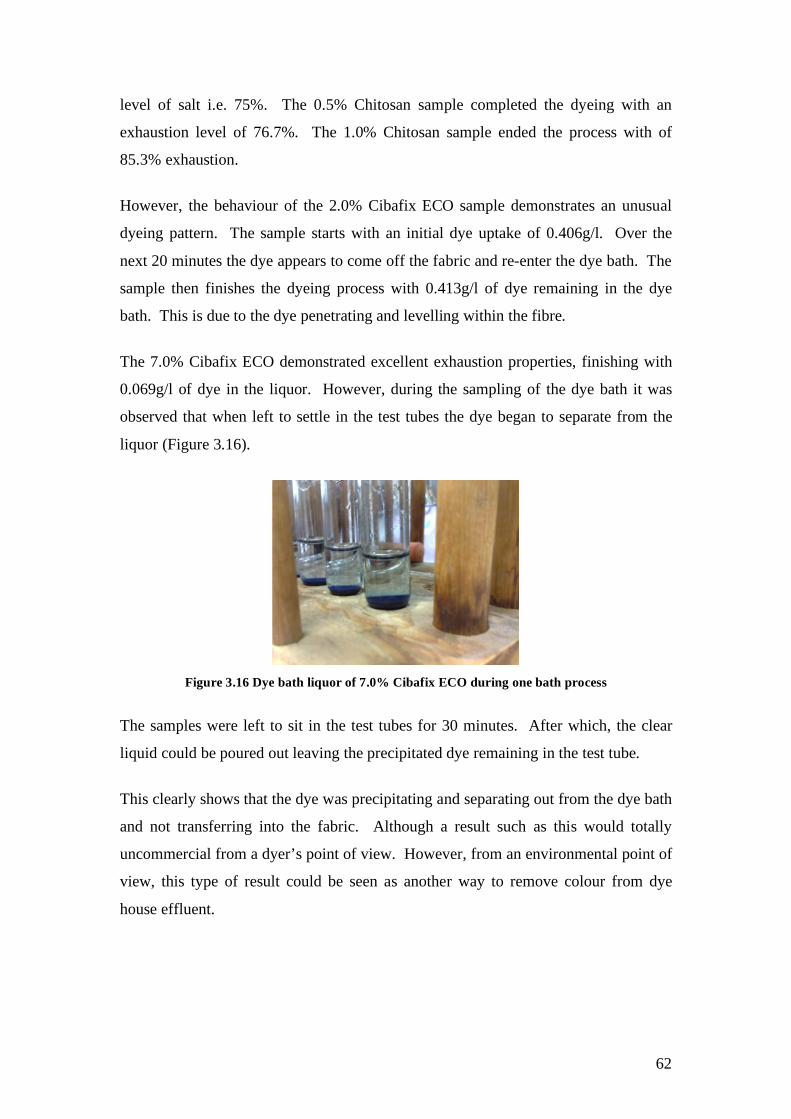
62
level of salt i.e. 75%. The 0.5% Chitosan sample completed the dyeing with an
exhaustion level of 76.7%. The 1.0% Chitosan sample ended the process with of
85.3% exhaustion.
However, the behaviour of the 2.0% Cibafix ECO sample demonstrates an unusual
dyeing pattern. The sample starts with an initial dye uptake of 0.406g/l. Over the
next 20 minutes the dye appears to come off the fabric and re-enter the dye bath. The
sample then finishes the dyeing process with 0.413g/l of dye remaining in the dye
bath. This is due to the dye penetrating and levelling within the fibre.
The 7.0% Cibafix ECO demonstrated excellent exhaustion properties, finishing with
0.069g/l of dye in the liquor. However, during the sampling of the dye bath it was
observed that when left to settle in the test tubes the dye began to separate from the
liquor (Figure 3.16).
Figure 3.16 Dye bath liquor of 7.0% Cibafix ECO during one bath process
The samples were left to sit in the test tubes for 30 minutes. After which, the clear
liquid could be poured out leaving the precipitated dye remaining in the test tube.
This clearly shows that the dye was precipitating and separating out from the dye bath
and not transferring into the fabric. Although a result such as this would totally
uncommercial from a dyer’s point of view. However, from an environmental point of
view, this type of result could be seen as another way to remove colour from dye
house effluent.
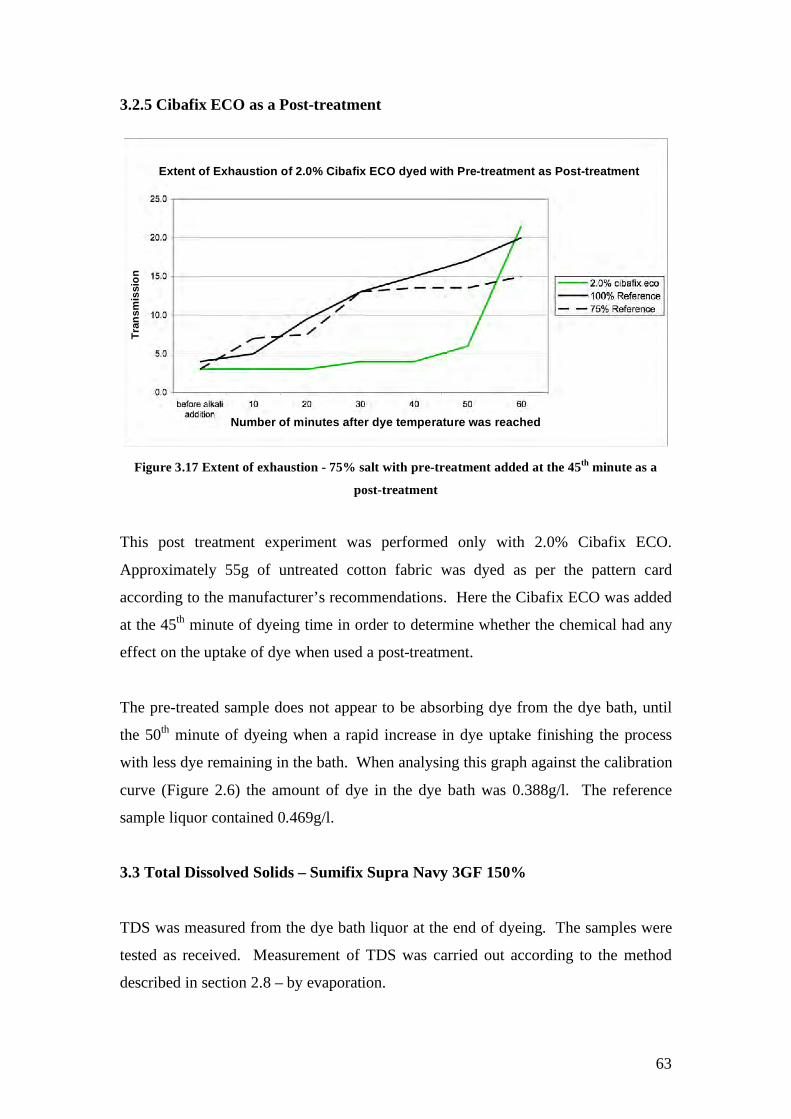
63
3.2.5 Cibafix ECO as a Post-treatment
Figure 3.17 Extent of exhaustion - 75% salt with pre-treatment added at the 45th minute as a
post-treatment
This post treatment experiment was performed only with 2.0% Cibafix ECO.
Approximately 55g of untreated cotton fabric was dyed as per the pattern card
according to the manufacturer’s recommendations. Here the Cibafix ECO was added
at the 45th minute of dyeing time in order to determine whether the chemical had any
effect on the uptake of dye when used a post-treatment.
The pre-treated sample does not appear to be absorbing dye from the dye bath, until
the 50th minute of dyeing when a rapid increase in dye uptake finishing the process
with less dye remaining in the bath. When analysing this graph against the calibration
curve (Figure 2.6) the amount of dye in the dye bath was 0.388g/l. The reference
sample liquor contained 0.469g/l.
3.3 Total Dissolved Solids – Sumifix Supra Navy 3GF 150%
TDS was measured from the dye bath liquor at the end of dyeing. The samples were
tested as received. Measurement of TDS was carried out according to the method
described in section 2.8 – by evaporation.
Tran
smis
sion
Number of minutes after dye temperature was reached
Extent of Exhaustion of 2.0% Cibafix ECO dyed with Pre-treatment as Post-treatment ?

64
3.3.1 Pre-treated Samples Dyed with 100% of the Required Salt
Figure 3.18 TDS levels of dye bath liquid dyed with 100% salt
All the three Chitosan samples had higher TDS readings than the reference sample.
This suggests that during dyeing some of the Chitosan has been removed from the
fabric and re-entered the dye bath liquid. However, if this is the case, the effect on
TDS should increase with Chitosan concentration. The results clearly show that the
TDS decreased with increasing concentration of Chitosan.
The four Cibafix ECO dyeings resulted in TDS readings either equal to or lower than
the reference sample (Figure 3.18). This shows that even when the fabrics are dyed
with the same amount of salt and dye the amount of TDS is reduced.
The right hand column shows the TDS result for a blank dyeing with 2.0% Cibafix
ECO. The TDS of this blank dyeing is slightly lower than the 2.0% Cibafix ECO
dyeing using 100% salt. Note however, that the higher levels of Cibafix ECO on the
fabric result in lower TDS. The effect is substantial, and increases with the
concentration of Cibafix ECO on the fabric. One explanation could be that the
Cibafix ECO is acting to cause the salt to be absorbed by the fabric.
mg/
l
TDS levels of dye bath liquid of samples dyed with 100% salt
Type and levels of Pre-treatment

65
3.3.2 Pre-treated Samples Dyed with 75% of the Required Salt
Figure 3.19 TDS levels of dye bath liquid dyed with 75% salt
Figure 3.19 shows the TDS levels of the pre-treated samples were greater than the
relevant control (75% salt). Yet, all pre-treated samples have a higher TDS level than
the 75% salt reference sample, possibly due to the pre-treatment which is the only
difference between the them. This shows a direct link between the amount of salt
used and the amount of TDS at the end of the dyeing process.
However, this group does not reveal the same trend as the samples dyed with 100%
salt. The fabrics with the lower percentage of pre-treatment applied have lower TDS
levels than the fabrics with the higher percentage of pre-treatment. Previously the
higher the concentration of pre-treatment chemical, the lower the TDS. This suggests
some complex interaction between salt and the pre-applied chemicals which, is
outside the scope of this study.
mg/
l
Type and levels of Pre-treatment
TDS levels of dye bath liquid of samples dyed with 75% salt

66
3.3.3 Pre-treated Samples Dyed with 50% of the Required Salt
Figure 3.20 TDS levels of dye bath liquid dyed with 50% salt
As shown in Figure 3.20 TDS levels of the pre-treated samples are at least half of the
100% reference sample and are all equal to or less than the 50% salt reference sample.
Data from both reference samples confirms a linear correlation between the amount of
salt used, and the level of TDS remaining in the dye bath.
3.3.4 Pre-treated Samples Dyed with 25% of the Required Salt
Figure 3.21 TDS levels of dye bath liquid dyed with 25% salt
mg/
l m
g/l
Type and levels of Pre-treatment
TDS levels of dye bath liquid of samples dyed with 50% salt
Type and levels of Pre-treatment
TDS levels of dye bath liquid of samples dyed with 25% salt

67
In particular Figure 3.21 shows the 2.0% and 5.0% Cibafix ECO samples obtain TDS
levels lower than 2000mg/l, which is a 95% reduction from the reference sample. 3.3.5 Pre-treat, Rinse, No Dry & Pre-treat, No Rinse, No Dry with 75% of the
Required Salt
Figure 3.22 TDS levels of dye bath liquid dyed with 75% salt with a rinse in between pre-
treatment and dyeing
The results of the two experiments shown in Figures 3.22 and 3.23 are almost
identical. Both graphs indicate that the 0.5% Chitosan treated and the 2.0% Cibafix
ECO treated have the lowest TDS levels. Overall the 2.0% Cibafix ECO treated
sample has the lowest TDS reading of both trials.
mg/
l
TDS levels of dye bath liquid of samples pre-treated separately with a rinse in between
Type and levels of Pre-treatment

68
Figure 3.23 TDS levels of dye bath liquid dyed with 75% salt with no rinse in between pre-
treatment and dyeing
As can be seen in Table 3.6, there is very little difference between the TDS levels for
the no rinse trial and the rinse trial that Figures 3.22 and 3.23 are almost identical.
Table 3.6. Comparison of TDS levels between trials where a rinse and no rinse was employed
Type and Level of Pre-
treatment No Rinse With Rinse
0.5% Chitosan 32, 381mg/l 32, 857mg/l
1.0% Chitosan 36, 410mg/l 37, 368mg/l
2.0% Cibafix ECO 31, 905mg/l 31, 579mg/l
7.0% Cibafix ECO 36, 410mg/l 37, 083mg/l
Between the two experiments, no rinse in between pre-treatment and dyeing had
lower TDS readings than the group that had a rinse in between.
mg/
l
Type and levels of Pre-treatment
TDS levels of dye bath liquid of samples pre-treated separately with no rinse in between

69
3.3.6 Pre-treatment Chemical Added in Dye Bath
Figure 3.24 TDS levels of dye bath liquid dyed with 75% salt with pre-treatment chemical added
in dye bath
The 0.5% Chitosan treated and the 2.0% and 7.0% Cibafix ECO treated performed
similarly shown in Figure 3.24. The 1.0% Chitosan treated performed the best in the
one bath process with a TDS saving of 28.7%. Figure 3.24, when compared with
Figure 3.19 appear to be very similar showing that Chitosan and Cibafix ECO display
similar characteristics whether being applied directly to the fabric or added in the dye
bath.
The samples in this experiment appear to have performed, on average 2.0% better
than the trial where the pre-treatment was applied separately using the same amount
of salt. The result was a more level dyeing.
3.4 Colour Strength Evaluation – Sumifix Supra Navy 3GF 150%
The change in shade of those samples dyed with no pre-treatment and as per the
manufacturer’s recommendations, were analysed against the samples that were pre-
treated and dyed with varying reductions in salt. As differences in shade are
important to the colour matching process, and the ability of a dyer to reproduce the
same shade time and time again. The K/S values were measured to determine how
mg/
l
Type and levels of Pre-treatment
TDS levels of dye bath liquid of samples dyed with pre-treatment chemical in dye bath
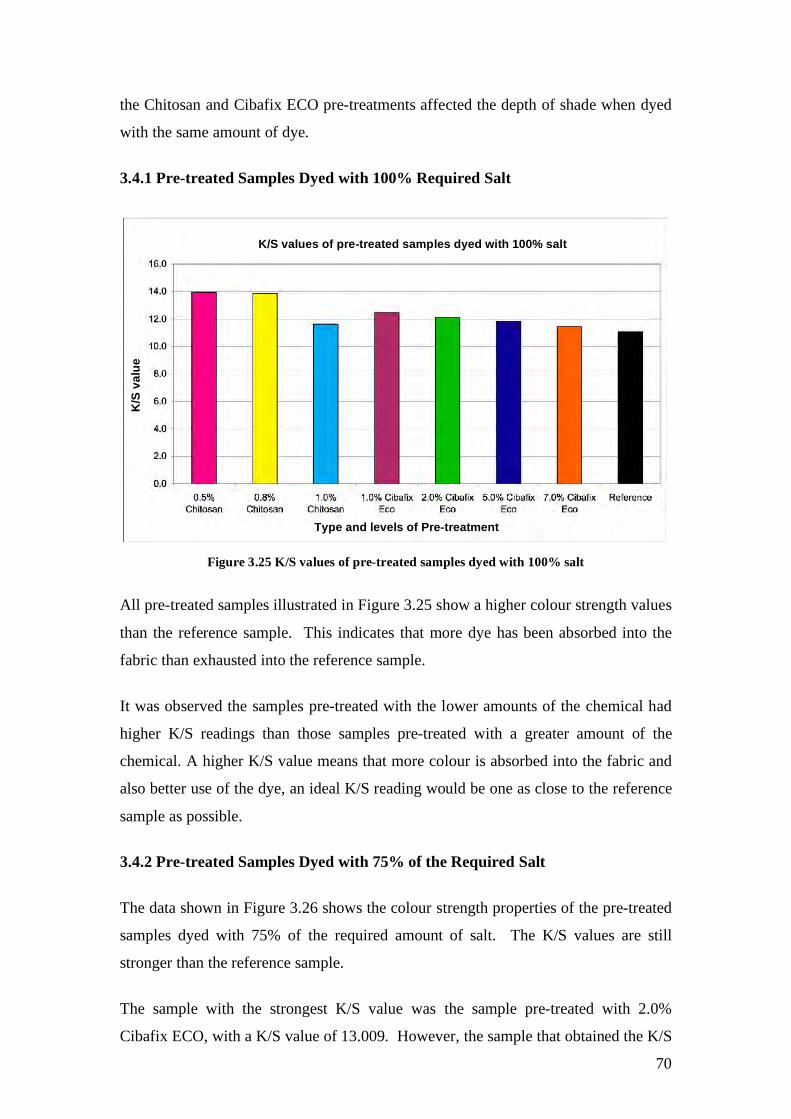
70
the Chitosan and Cibafix ECO pre-treatments affected the depth of shade when dyed
with the same amount of dye.
3.4.1 Pre-treated Samples Dyed with 100% Required Salt
Figure 3.25 K/S values of pre-treated samples dyed with 100% salt
All pre-treated samples illustrated in Figure 3.25 show a higher colour strength values
than the reference sample. This indicates that more dye has been absorbed into the
fabric than exhausted into the reference sample.
It was observed the samples pre-treated with the lower amounts of the chemical had
higher K/S readings than those samples pre-treated with a greater amount of the
chemical. A higher K/S value means that more colour is absorbed into the fabric and
also better use of the dye, an ideal K/S reading would be one as close to the reference
sample as possible.
3.4.2 Pre-treated Samples Dyed with 75% of the Required Salt
The data shown in Figure 3.26 shows the colour strength properties of the pre-treated
samples dyed with 75% of the required amount of salt. The K/S values are still
stronger than the reference sample.
The sample with the strongest K/S value was the sample pre-treated with 2.0%
Cibafix ECO, with a K/S value of 13.009. However, the sample that obtained the K/S
K/S
val
ue
K/S values of pre-treated samples dyed with 100% salt
Type and levels of Pre-treatment

71
value closest to the reference sample was the 7.0% Cibafix ECO treated sample with a
K/S value of 11.884, a colour that is 7.2% stronger than the reference.
Figure 3.26 K/S values of pre-treated samples dyed with 75% salt
One way to counteract the difference in the colour depth would be to reduce the
amount of dye that is added to the dye bath. Reducing the amount of dye included in
the dyeing process could potentially cover the costs of the pre-treatment chemical if
adopted for industry use.
K/S
val
ue
K/S values of pre-treated samples dyed with 75% salt
Type and levels of Pre-treatment

72
3.4.3 Pre-treated Samples Dyed with 50% of the Required Salt
Figure 3.27 K/S values of pre-treated samples dyed with 50% salt
Figure 3.27 reveals all samples, with the exclusion of two, fall below the reference
sample. The 7.0% Cibafix ECO treated sample has the closest K/S value to the
reference and 5.0% Cibafix ECO finished with the strongest depth of shade.
What has been confirmed in Figure 3.27 is the correlation between salt and the
amount of colour exhausted into the fabric. In turn this has a direct effect on the
colour strength of the fabric. Nevertheless, two of the samples pre-treated with
Cibafix ECO – the 5.0% and the 7.0% have still maintained higher K/S values than
the reference sample.
K/S
val
ue
K/S values of pre-treated samples dyed with 50% salt
Type and levels of Pre-treatment

73
3.4.4 Pre-treated Samples Dyed with 25% & 0% of the Required Salt
Figure 3.28 K/S values of pre-treated samples dyed with 25% salt
Figure 3.29 K/S values of pre-treated samples dyed with 0% salt
The reduction in the amount of salt used in the dyeing process effects the amount of
colour exhausted onto the fabric (Figure 3.28 and Figure 3.29). It is also
demonstrated that similarly to those samples dyed with 50% salt, the Cibafix ECO
samples are showing higher K/S values than the Chitosan samples. In this graph, the
gap between the two chemicals has increased, with none of the samples having K/S
K/S
val
ue
K/S
val
ue
K/S values of pre-treated samples dyed with 25% salt
Type and levels of Pre-treatment
K/S values of pre-treated samples dyed with no salt
Type and levels of Pre-treatment

74
values as strong as the reference sample. A list of the exact K/S values is displayed in
Table 3.7.
Table 3.7 K/S values of pre-treated samples dyed with 25% salt and 0% salt
Type and Level of Pre-
treatment
K/S Values of 25% of required
amount of salt
K/S Values of 0% of required
amount of salt
0.5% Chitosan 8.05 3.49
0.8% Chitosan 8.70 3.31
1.0% Chitosan 8.53 3.35
1.0% Cibafix ECO 9.77 3.60
2.0% Cibafix ECO 10.25 4.63
5.0% Cibafix ECO 10.38 4.64
7.0% Cibafix ECO 9.50 4.88
75% Reference 10.95
100% Reference 11.08
Table 3.7 demonstrates a 57.2% difference in shade between the two groups and since
all trialled samples fall below the reference sample, none would be practical for
industry use. 3.4.5 Pre-treat, Rinse, Dry, Dye & Pre-treat, No Rinse, No Dry Dyed – 75% Salt
Figure 3.30 K/S values of pre-treated samples dyed with a rinse in between
K/S
val
ue
Type and levels of Pre-treatment
K/S values of samples pre-treated and then dyed with a rinse in between

75
Figure 3.31 K/S values of pre-treated samples dyed with a no rinse in between
The poorest performing sample was the 0.5% Chitosan treated sample from the trial
where a rinse was included between pre-treatment and dyeing. It gave a K/S value of
6.43. The strongest K/S value belongs to the 2.0% Cibafix ECO sample with a value of
12.91 for the trial where no rinse was applied. This same sample also has the
strongest colour shade in the trial where a rinse was applied with a K/S value of
10.64. A value, which is 17.5% weaker than the same level of pre-treatment, dyed
with no rinse in between. Again, the 2.0% Cibafix ECO sample, which had the attributes most like the reference
sample. This sample has a K/S value that is 16.5% higher when trialled with no rinse
in between samples and has performed 4.0% weaker than the reference sample when
a rinse was applied after the pre-treatment before the dyeing process. Even though the difference between one sample is a lot smaller when compared to the
reference sample than the other, it is believed the 2.0% Cibafix ECO sample would be
more feasible in industry use. This is because the amount of dye will need to be
reduced to achieve the same colour shade as the reference sample, therefore saving
the dyer money. As mentioned previously, this cost saving in dye could potentially
cover the cost of the pre-treatment chemical.
K/S
val
ue
K/S values of samples pre-treated and then dyed with no rinse in between
Type and levels of Pre-treatment

76
3.5 Evaluation of Colourfastness Properties – Sumifix Supra Navy 3GF 150%
Each sample tested for colourfastness to washing and perspiration were prepared
using Society of Dyers and Colourists (SDC) standard Multifibre Fabric. Also
standard grey scales for assessing change in colour (ISO 105 A02) and staining (ISO
105 A03) were used to obtain ratings. Table 3.8 outlines the results of the reference
sample.
Table 3.8 Colourfastness results for reference sample dyes as per pattern card
Colourfastness to washing
Staining Colour
Change Wool Acrylic Polyester Nylon 6.6 Cotton Acetate
4-5 4-5 4-5 4-5 4-5 4-5 4-5
Colourfastness to perspiration - alkali
Staining Colour
Change Wool Acrylic Polyester Nylon 6.6 Cotton Acetate
4-5 4-5 4-5 4-5 4-5 4-5 4-5
Colourfastness to perspiration - acid
Staining Colour
Change Wool Acrylic Polyester Nylon 6.6 Cotton Acetate
4-5 4-5 4-5 4-5 4-5 4-5 4-5
Colourfastness to rubbing
DRY Stain Mark off WET Stain Mark off
Length 4-5 4-5 Length 3-4 4-5
Width 4-5 4-5 Width 3-4 4-5
Colourfastness to light
4
The grey scales for colour change and staining is a scale of 1 to 5; 5 being the best
with no colour change or staining occurring and 1 being the worst where there is a
large colour change from the original sample or staining from the tested sample to the
standard fabric. The grey scales are used to rate any change in colour or any staining
that occurs on samples that have been tested for their colourfastness properties to

77
washing, perspiration, water and rubbing. A blue scale is used to rate samples that
have been tested for colourfastness to light. The blue scale is exposed with the tested
samples, the rating scale from 1 to 8; 8 being the best with no change and 1 being the
worst with significant change.
The colourfastness results for the reference sample indicate that it has relatively good
colourfastness properties. Table 3.8 shows that for the colourfastness to washing and
both the acid and alkali perspiration tests, the reference sample received a grey scale
rating of 4-5. For the colourfastness to rubbing test the reference sample received a
rating of 3-4 and for the colour fastness to light a blue scale rating of 4 was achieved.
The data illustrated in Table 3.9 shows overall, the best performing sample is the
0.5% Chitosan treated. This sample performed the best in all the colourfastness tests
receiving ratings of 4-5 for the colourfastness to washing and both perspiration tests, a
4-5 for the dry rubbing test and a 3 for the wet rubbing test and finally a rating of 4
for the colourfastness to light test.
Table 3.10 presents the results of the colourfastness testing for the groups dyed with
75% of the required amount of salt. The best performing sample was the 2.0%
Cibafix ECO treated sample. This sample had the best colourfastness properties in
four of the five tests performed; receiving a 4-5 for the colourfastness to washing,
alkali perspiration and acid perspiration and a 4 for colourfastness to light. The best
performing sample in the colourfastness to rubbing test was the 1.0% Chitosan
sample, which received a 2-3 for the wet rubbing, only half a grade higher than the
rating of 2 which the 2.0% Cibafix ECO sample acquired.
The Figures in Table 3.11 show that the best sample for this group was 7.0% Cibafix
ECO receiving the highest rating in four of the five tests. This sample received a 4
for the colourfastness to washing test a 4-5 for both the colourfastness to perspiration
tests and a 3-4 for the colourfastness to light. Again, a Chitosan sample received the
best result, a 3, for the colourfastness to rubbing which was the 0.5% treated sample.

78
Table 3.9 Colourfastness results for pre-treated samples dyed according to the pattern card with
100% of the required amount of salt. Colourfastness to washing
Staining Sample
Colour Change Wool Acrylic Polyester Nylon 6.6 Cotton Acetate
0.5% Chitosan
1.0% Chitosan
4-5
2.0% CibafixECO 3-4
7.0% CibafixECO
4-5 4-5 4-5 4-5 4-5
3-4
4-5
Colourfastness to perspiration - alkali Staining
Sample Colour Change Wool Acrylic Polyester Nylon 6.6 Cotton Acetate
0.5% Chitosan
1.0% Chitosan
2.0% CibafixECO
4-5
7.0% CibafixECO
4-5 4-5 4-5 4-5 4-5
3
4-5
Colourfastness to perspiration - acid Staining
Sample Colour Change Wool Acrylic Polyester Nylon 6.6 Cotton Acetate
0.5% Chitosan
1.0% Chitosan
2.0% CibafixECO
7.0% CibafixECO
4-5 4-5 4-5 4-5 4-5 4-5 4-5
Colourfastness to rubbing Sample DRY Stain Mark off WET Stain Mark off
Length Length 0.5% Chitosan Width Width
3
Length Length 3 1.0% Chitosan Width Width 2-3
Length Length 2.0% CibafixECO Width Width
2-3
Length Length 7.0% CibafixECO Width
4-5 4-5
Width 2
4-5
Sample Colourfastness to light 0.5% Chitosan 1.0% Chitosan
2.0% Cibafix ECO 7.0% CibafixECO
4

79
Table 3.10 Colourfastness results for pre-treated samples dyed according to the pattern card
with 75% of the required amount of salt. Colourfastness to washing
Staining Sample
Colour Change Wool Acrylic Polyester Nylon 6.6 Cotton Acetate
0.5% Chitosan 3
1.0% Chitosan 3-4
2.0% CibafixECO 4-5
7.0% CibafixECO
4-5 4-5 4-5 4-5 4-5
4
4-5
Colourfastness to perspiration - alkali Staining
Sample Colour Change Wool Acrylic Polyester Nylon 6.6 Cotton Acetate
0.5% Chitosan 3 1
1.0% Chitosan 4 2
2.0% CibafixECO
7.0% CibafixECO
4-5 4-5
4-5
4-5 4-5
4-5
4-5
Colourfastness to perspiration - acid Staining
Sample Colour Change Wool Acrylic Polyester Nylon 6.6 Cotton Acetate
0.5% Chitosan
1.0% Chitosan
2.0% CibafixECO
7.0% CibafixECO
4-5 4-5 4-5 4-5 4-5 4-5 4-5
Colourfastness to rubbing Sample DRY Stain Mark off WET Stain Mark off
Length Length 2 0.5% Chitosan Width Width 2-3
Length Length 1.0% Chitosan Width Width
2-3
Length Length 2.0% CibafixECO Width Width
Length Length 7.0% CibafixECO Width
4-5 4-5
Width
2
4-5
Sample Colourfastness to light 0.5% Chitosan 1.0% Chitosan
2.0% Cibafix ECO 7.0% CibafixECO
4

80
Table 3.11 Colourfastness results for pre-treated samples dyed according to the pattern card
with 50% of the required amount of salt. Colourfastness to washing
Staining Sample
Colour Change Wool Acrylic Polyester Nylon 6.6 Cotton Acetate
0.5% Chitosan 2-3
1.0% Chitosan
2.0% CibafixECO
3-4
7.0% CibafixECO
4-5 4-5 4-5 4-5 4-5
4
4-5
Colourfastness to perspiration - alkali Staining
Sample Colour Change Wool Acrylic Polyester Nylon 6.6 Cotton Acetate
0.5% Chitosan 2-3 1
1.0% Chitosan 3-4 1-2
2.0% CibafixECO
7.0% CibafixECO
4-5 4-5
4-5
4-5 4-5
4-5
4-5
Colourfastness to perspiration - acid Staining
Sample Colour Change Wool Acrylic Polyester Nylon 6.6 Cotton Acetate
0.5% Chitosan
1.0% Chitosan
2.0% CibafixECO
7.0% CibafixECO
4-5 4-5 4-5 4-5 4-5 4-5 4-5
Colourfastness to rubbing Sample DRY Stain Mark off WET Stain Mark off
Length Length 0.5% Chitosan Width Width
3
Length Length 1.0% Chitosan Width Width
Length Length 2.0% CibafixECO Width Width
Length Length 7.0% CibafixECO Width
4-5 4-5
Width
2-3 4-5
Sample Colourfastness to light 0.5% Chitosan 1.0% Chitosan
2.0% Cibafix ECO 7.0% CibafixECO
3-4
81
In Table 3.12, both the 2.0% Cibafix ECO and the 7.0% Cibafix ECO treated samples
received the best ratings. Both received a 4 and a 4-5 for the washing test and
perspiration tests respectively and a 3-4 for the light test. Again, the 0.5% Chitosan
sample received the highest rating of 3 for the wet rubbing test whereas the 2.0%
Cibafix ECO sample received a rating of 2-3. The 7.0% sample received a 2 for the
wet rubbing in the length direction and a 2-3 in width direction.
Again there were two samples revealed in Table 3.13 – the group dyed with 0% of the
required amount of salt that performed the best overall. These two samples are the
1.0% Chitosan sample and the 2.0% Cibafix ECO sample. The samples performed
the best in three out of the five tests however; the best results obtained for these
samples were from different groups. For the colourfastness to washing test the 2.0%
Cibafix ECO sample received a rating of 4-5 and the same for both perspiration tests.
The 1.0% Chitosan sample received a 4-5 the colourfastness to acid perspiration test
and a 3-4 for the wet rubbing tests in both the length and width directions and a rating
of 2 for the colourfastness to light test.
The results for the group where the pre-treatment chemical was applied separately and
then dyed with no rinse in between is given in Table 3.14. The sample that performed
the best in this group of colourfastness tests was the again the 2.0% Cibafix ECO
sample. It achieved a rating of 4 for the washing test and a 4-5 for both perspiration
tests. The 1.0% Chitosan sample performed the best in the colourfastness to rubbing
test with a rating of 3. The 2.0% Cibafix ECO sample received a rating of 3-4.
Finally, Table 3.15 was also pre-treated separately but a rinse was used in between
pre-treatment and dyeing. In this group the best performing sample was the 7.0%
Cibafix ECO treated sample, receiving the highest rating in four out of the five tests.
The sample received a 4-5 for the colourfastness to washing test and both the
perspiration tests and a blue scale rating of 4 for the colourfastness to light test. Once
again it was a Chitosan treated sample – 0.5% treated, that performed the best for the
colourfastness to rubbing test receiving a grey scale rating of 3 in the length and 3-4
in the width.

82
Table 3.12 Colourfastness results for pre-treated samples dyed according to the pattern card
with 25% of the required amount of salt. Colourfastness to washing
Staining Sample
Colour Change Wool Acrylic Polyester Nylon 6.6 Cotton Acetate
0.5% Chitosan 3
1.0% Chitosan 3-4
2.0% CibafixECO
7.0% CibafixECO
4-5 4-5 4-5 4-5 4-5
4
4-5
Colourfastness to perspiration - alkali Staining
Sample Colour Change Wool Acrylic Polyester Nylon 6.6 Cotton Acetate
0.5% Chitosan 3-4 1
1.0% Chitosan 3 1-2
2.0% CibafixECO
7.0% CibafixECO
4-5 4-5
4-5
4-5 4-5
4-5
4-5
Colourfastness to perspiration - acid Staining
Sample Colour Change Wool Acrylic Polyester Nylon 6.6 Cotton Acetate
0.5% Chitosan
1.0% Chitosan
2.0% CibafixECO
7.0% CibafixECO
4-5 4-5 4-5 4-5 4-5 4-5 4-5
Colourfastness to rubbing Sample DRY Stain Mark off WET Stain Mark off
Length Length 0.5% Chitosan Width Width
3
Length Length 1.0% Chitosan Width Width
Length Length 2.0% CibafixECO Width Width
2-3
Length Length 2 7.0% CibafixECO Width
4-5 4-5
Width 2-3
4-5
Sample Colourfastness to light 0.5% Chitosan 1.0% Chitosan
2.0% Cibafix ECO 7.0% Cibafix ECO
3-4

83
Table 3.13 Colourfastness results for pre-treated samples dyed according to the pattern card
with 0% of the required amount of salt. Colourfastness to washing
Staining Sample
Colour Change Wool Acrylic Polyester Nylon 6.6 Cotton Acetate
0.5% Chitosan
1.0% Chitosan
4
2.0% CibafixECO 4-5
7.0% CibafixECO
4-5 4-5 4-5 4-5 4-5
4
4-5
Colourfastness to perspiration - alkali Staining
Sample Colour Change Wool Acrylic Polyester Nylon 6.6 Cotton Acetate
0.5% Chitosan
1.0% Chitosan
2-3
2.0% CibafixECO
7.0% CibafixECO
4-5 4-5 4-5 4-5 4-5
4-5
4-5
Colourfastness to perspiration - acid Staining
Sample Colour Change Wool Acrylic Polyester Nylon 6.6 Cotton Acetate
0.5% Chitosan
1.0% Chitosan
2.0% CibafixECO
7.0% CibafixECO
4-5 4-5 4-5 4-5 4-5 4-5 4-5
Colourfastness to rubbing Sample DRY Stain Mark off WET Stain Mark off
Length Length 0.5% Chitosan Width Width
3
Length Length 1.0% Chitosan Width Width
3-4
Length Length 3-4 2.0% CibafixECO Width Width 3
Length Length 3-4 7.0% CibafixECO Width
4-5 4-5
Width 3
4-5
Sample Colourfastness to light 0.5% Chitosan 1.0% Chitosan
2
2.0% Cibafix ECO 1-2 7.0% Cibafix ECO 2

84
Table 3.14 Colourfastness results for samples pre-treated with no rinse in between and dyed
according to the pattern card with 75% of the required amount of salt. Colourfastness to washing
Staining Sample
Colour Change Wool Acrylic Polyester Nylon 6.6 Cotton Acetate
0.5% Chitosan
1.0% Chitosan
3-4
2.0% CibafixECO
7.0% CibafixECO
4-5 4-5 4-5 4-5 4-5
4
4-5
Colourfastness to perspiration - alkali Staining
Sample Colour Change Wool Acrylic Polyester Nylon 6.6 Cotton Acetate
0.5% Chitosan
1.0% Chitosan
2-3
2.0% CibafixECO
7.0% CibafixECO
4-5 4-5 4-5 4-5 4-5
4-5
4-5
Colourfastness to perspiration - acid Staining
Sample Colour Change Wool Acrylic Polyester Nylon 6.6 Cotton Acetate
0.5% Chitosan
1.0% Chitosan
2.0% CibafixECO
7.0% CibafixECO
4-5 4-5 4-5 4-5 4-5 4-5 4-5
Colourfastness to rubbing Sample DRY Stain Mark off WET Stain Mark off
Length Length 2-3 0.5% Chitosan Width Width 3
Length Length 1.0% Chitosan Width Width
3
Length Length 2 2.0% CibafixECO Width Width 2-3
Length Length 7.0% CibafixECO Width
4-5 4-5
Width 2-3
4-5
Sample Colourfastness to light 0.5% Chitosan 1.0% Chitosan
2.0% Cibafix ECO 3-4
7.0% Cibafix ECO 3

85
Table 3.15 Colourfastness results for samples pre-treated with a rinse in between and dyed
according to the pattern card with 75% of the required amount of salt. Colourfastness to washing
Staining Sample
Colour Change Wool Acrylic Polyester Nylon 6.6 Cotton Acetate
0.5% Chitosan 3
1.0% Chitosan 2-3
2.0% CibafixECO 4
7.0% CibafixECO
4-5 4-5 4-5 4-5 4-5
4-5
4-5
Colourfastness to perspiration - alkali Staining
Sample Colour Change Wool Acrylic Polyester Nylon 6.6 Cotton Acetate
0.5% Chitosan 4-5 2
1.0% Chitosan 4 1-2
2.0% CibafixECO
7.0% CibafixECO
4-5 4-5
4-5
4-5 4-5
4-5
4-5
Colourfastness to perspiration - acid Staining
Sample Colour Change Wool Acrylic Polyester Nylon 6.6 Cotton Acetate
0.5% Chitosan
1.0% Chitosan
2.0% CibafixECO
7.0% CibafixECO
4-5 4-5 4-5 4-5 4-5 4-5 4-5
Colourfastness to rubbing Sample DRY Stain Mark off WET Stain Mark off
Length Length 3 0.5% Chitosan Width Width 3-4
Length Length 1.0% Chitosan Width Width
2-3
Length Length 2-3 2.0% CibafixECO Width Width 3
Length Length 7.0% CibafixECO Width
4-5 4-5
Width 3
4-5
Sample Colourfastness to light 0.5% Chitosan 3 1.0% Chitosan 3-4
2.0% Cibafix ECO 7.0% Cibafix ECO
4

86
3.6 Samples dyed with Procion Brilliant Scarlett H-EXL
3.6.1 Rate and Extent of Dye Exhaustion
The same pre-treatment process was used for the dyeing of Procion Brilliant Scarlett
H-EXL as discussed in section 3.2.3. Following the pre-treatment process dyeing
continued as normal according to the manufacturer’s recommendation. The dyeing
temperature for this type of dye was 80˚C.
Figure 3.32 Extent of exhaustion of samples dyed with Procion Brilliant Scarlet H-EXL pre-
treated with 2.0% Cibafix ECO dyed with 75% salt As shown in Figure 3.32 the reference sample dye with 100% salt, initial strike did
not occur until the 20th minute of dyeing. Once exhaustion for the reference sample,
it continued at a constant rate until the end of dyeing. The dye strike for the reference
sample dyed with 75% was further delayed (30 minutes) moved through the dyeing
process at a steady rate until the 50th minute when the sample experienced a marked
increase in dye uptake.
The pre-treated sample had a higher initial strike rate where the dye exhausted on the
fibre more quickly. High exhaustion rates can result in an unlevel dyeing. However,
this did not occur. The levelness of the pre-treated sample was good with no flecks of
dye or dark/light spots on the fabric.
Tran
smis
sion
Number of minutes after dye temperature was reached
Extent of Exhaustion for Pre-treated samples dyed with 75% salt

87
3.7 Total Dissolved Solids – Procion Brilliant Scarlett H-EXL
TDS was measured from the dye bath liquor at the end of dyeing. The samples were
used as received. Measurement of TDS was carried out according to the method
described in section 2.8 via an electronic TDS meter.
Figure 3.33 TDS levels of samples dyed with Procion Brilliant Scarlet H-EXL pre-treated with
2.0% Cibafix ECO dyed with 75% salt
The TDS levels of the samples dyed with Procion Brilliant Scarlett H-EXL are shown
in Figure 3.33. With a 25% reduction in salt use the amount of TDS remaining in the
dye bath has decreased by approximately 45%. The reference sample finished the
dyeing process with a TDS level of 69,500mg/l and the sample pre-treated with
Cibafix ECO finished with a TDS value of 37,800mg/l. Initially the assumption was
that a 25% reduction in salt use would amount to a 25% reduction in TDS. However
in this experiment as well as throughout the previous trials Cibafix ECO has shown to
be an effective agent in lowering the level of TDS released to dye house effluent,
though not yet on a universal scale.
mg/
l
Type and levels of Pre-treatment
TDS levels of dye bath liquid of samples dyed with 75% salt

88
3.8 Colour Strength Evaluation – Procion Brilliant Scarlett H-EXL
Figure 3.34 K/S values of pre-treated Procion Brilliant Scarlet H-EXL samples dyed with 75%
salt The K/S values shown in Figure 3.34 demonstrate that the pre-treated sample had a
greater depth of shade compared to the reference sample. There is a 4.7% difference
in shade between the two samples. Although a difference in shade is not ideal for the
dyer, a reduction in the amount of dye used in order to match the original shade could
potentially save the dyer money in the long run.
3.9 Samples dyed with Solophenyl Rubine RNL
3.9.1 Rate and Extent of Dye Exhaustion
The same pre-treatment process was used for the dyeing of Solophenyl Rubine RNL
as discussed in section 3.2.3. Following, the pre-treatment process dyeing continued
as normal according to the manufacturer’s recommendations. The dyeing temperature
for this type of dye was 100˚C.
K/S
val
ue
K/S values of pre-treated samples dyed with 75% salt
Type and levels of Pre-treatment

89
Figure 3.35 Extent of exhaustion of samples dyed with Solophenyl Rubine RNL pre-treated with
2.0% Cibafix ECO dyed with 75% salt Figure 3.35 shows the dyeing behaviour of the sample pre-treated with 2.0% Cibafix
ECO and dyeing with 75% of the required amount of salt and the reference sample
dyed with 100% of the required amount of salt were very similar. The pre-treated
sample had a higher extent of exhaustion with more dye being exhausted onto the
fibre than the reference sample. This shows promise in that Cibafix ECO can reduce
the amount of salt used when dyeing with not only reactive dyes but also direct dyes.
The improvement in dye utilisation (90% transmission in the presence of Cibafix
ECO versus 67% transmission for the standard dyeing) was marked and may have a
cost benefit for dye houses.
3.10 Total Dissolved Solids – Solophenyl Rubine RNL
TDS was measured from the dye bath liquor at the end of dyeing. The samples were
used as received. Measurement of TDS was carried out according to the method
described in section 2.8 via an electronic TDS meter.
In Figure 3.36 the TDS levels of the samples dyed with the direct dye Solophenyl
Rubine RNL are shown. The reference sample ended the dyeing process with a TDS
level of 20,960mg/l. The sample that was pre-treated with 2.0% Cibafix ECO and
dyed with 75% of the required amount of salt ended the dyeing process with
11,970mg/l of TDS remaining in the dye bath liquor.
Tran
smis
sion
Number of minutes after dye temperature was reached
Extent of Exhaustion for Pre-treated samples dyed with 75% salt

90
Figure 3.36 TDS levels of samples dyed with Solophenyl Rubine RNL pre-treated with 2.0%
Cibafix ECO dyed with 75% salt The TDS level of the direct dye is reduced by 43%, a similar value to what was
achieved in the experiment using the Procion reactive dye.
3.11 Colour Strength Evaluation – Solophenyl Rubine RNL
Figure 3.37 K/S values of pre-treated Solophenyl Rubine RNL samples dyed with 75% salt
Figure 3.37 shows the K/S values of the samples dyed with Solophenyl Rubine RNL.
The K/S value of the pre-treated sample compared to the reference sample is 103%
mg/
l
Type and levels of Pre-treatment
TDS levels of dye bath liquid of samples dyed with 75% salt K
/S v
alue
K/S values of pre-treated samples dyed with 75% salt
Type and levels of Pre-treatment

91
stronger resulting in a much darker shade. Again this could be corrected by reducing
the amount of dye used to match the shade of the reference sample.
3.12 Summary
The extent of exhaustion, TDS levels, K/S values and fastness properties of all
samples were evaluated.
The results of this study suggest:
• the amount of salt used in dyeing can be reduced;
• both pre-treatments aid in reduction of salt use when dyeing 100% cotton
fabrics with reactive dyes;
• less water can be used by eliminating a rinse cycle after pre-treatment;
• the elimination of a drying process can save time and energy when processing a
sample;
• Cibafix ECO is effective when dyeing with different types of reactive dyes as
well as direct dyes.
Overall, Cibafix ECO was found to be a more effective pre-treatment when dyeing
cotton fabrics with reactive dyes at 75% salt.

Chapter 4
Conclusions and Recommendations

93
4.1 Introduction
This study has demonstrated that salt remains an important factor in the reactive
dyeing process. Further, it confirms the removal of salt equates to poorer exhaustion
of the dye onto the fibre, and hence, reduced yields.
4.2 Chitosan vs. Cibafix ECO
It was concluded the performance of Cibafix ECO was more viable and economical
for industry use over Chitosan. The most effective amount of pre-treatment chemical
applied was Cibafix ECO at a 2.0% concentration. Cibafix ECO is also a more cost
effective and easier to use product than Chitosan. A lesser amount of Cibafix ECO is
required. Cibafix ECO is also considerably cheaper in comparison to Chitosan and
may be more attractive to industry.
4.3 Reduction in Salt
The study has shown that a 25% reduction in salt can be achieved. Greater
reductions, even at higher concentrations of Cibafix ECO were not successful due to
lower dye yields. Further, dyeings carried out with a reduction in salt of more than
25% were uneven and unlevel.
4.4 Optimal Pre-treatment – Dyeing Method
The following pre-treatment application/dyeing processes were investigated:
• Two stage; pre-treatment, drying and then dyeing process;
• Pre-treatment chemical added into dye bath to create a one bath process;
• Pre-treatment chemical added as a post-treatment;
• Two stage; pre-treatment application with no drying before dyeing and;
• Pre-treatment but, with no rinse and no drying before dyeing.
It was concluded that last application/dyeing method was the most effective and time
saving process for applying the pre-treatment chemical and dyeing the fabric. With
the elimination of the rinse cycle in between the pre-treatment application process and

94
the dyeing process, a saving in water usage of 14% was achieved. Also, the removal
of the drying stage in between pre-treatment and dyeing cuts down on energy
requirements and time.
4.5 Recommendations
This study has demonstrated the effectiveness of Cibafix ECO in reducing the amount
of salt needed for reactive dyeing of cotton. This product is established in the
industry as a post-treatment to improve wet fastness and prevent dye migration after
dyeing.
The viability of the 25% reduction in salt used achieved under laboratory conditions
should be confirmed through industry trials at the recommended liquor ratio of 20:1.
Being limited to laboratory equipment meant that a reduced liquor ratio (10:1) was
used. The suitability of the method developed for reducing salt use by 25% should be
extended to cover a wider range of reactive and direct dyes.
The results of this research also suggest that Cibafix ECO may be a suitable cost
effective flocculant for removal of colour from dye house effluent.

95
References
[1] City West Water, 2008, Mission, Vision, Values, viewed 27 February 2008,
http://www.citywestwater.com.au/about/mission_vision_values.htm
[2] City West Water, 2008, Our Company, viewed 27 February 2008,
http://www.citywestwater.com.au/about/our_company.htm
[3] City West Water, 2008, Total Dissolved Solids (TDS) Loading, viewed 27
February 2008,
http://www.citywestwater.com.au/about/reports/2005/our_services/tws_tds_lo
ading.htm
[4] City West Water, 2004, Western Treatment Plant Salinity Management Plan,
viewed 24 January 2009,
http://www.citywestwater.com.au/business/docs/Western_Treatment_Plant_S
alinity_Management_Plan-FINAL_Dec_2004.doc
[5] Wikipedia, 2008, Total Dissolved Solids, viewed 24 January 2009,
http://en.wikipedia.org/wiki/Total_dissolved_solids
[6] Environmental Protection Authority, 2006, Increasing Salinity,
http://www.epa.vic.gov.au/water/threats/salinity.asp
[7] Environmental Protection Authority, 1998, Environmental Guidelines for the
Textile Dyeing and Finishing Industry, viewed 10 April 2008,
http://www.epanote2.epa.vic.gov.au/EPA/Publications.NSF
[8] Skelly, K, 2000, ‘Water Recycling’, Review of Progress in Colouration,
vol.30, pp.21 – 34.
[9] Organization of American States, 1997, viewed 18 January 2009,
http://www.oas.org/usde/publications/unit/oea59e/ch20.htm#TopOfPage
[10] SSP, 2008, Effluent From Textile Dyeing Industries, viewed 20 January
2008, http://www.industrialeffluenttreatment.com/textile-dyeing-
industries.html
[11] Microbiology Procedure, 2008, Effluent Disposal, viewed 28 December
2008, http://www.microbiologyprocedure.com/waste-water-
microbiology/effluent-disposal.htm
[12] Gokarneshan, N, 2008, ‘Recent Trends in Dyeing of Cotton’, Fibre 2
Fashion, viewed 27 December 2008, http://www.fibre2fashion.com/industry-
article/16/1547/recent-trends-in-dyeing-of-cotton1.asp

96
[13] Ciba Specialty Chemicals, 2000, ‘Expansion of Dyes in Consideration of
Environment Sales Start of New Product “CIBACRON LS” and Expansion of
LANASOL CE”’, Kato Gijutsu, viewed 5 January 2009, http://science
links.jp/j-east/article/200011/000020001100A0362467.php
[14] Broadbent, A.D, 2001, Basic Principles of Textile Colouration, Society of
Dyers and Colourists, West Yorkshire.
[15] Wang, C.X., Zhang, Y.H., 2007, Effect of Cationic Pretreatment on Modified
Pigment Printing of Cotton, College of Textile and Garments, W.S. Maney &
Son Ltd., China.
[16] Duff, D.G., Sinclair, R.S., 1989, Gile’s Laboratory Course in Dyeing, 4th
edn, Society of Dyers and Colourists, West Yorkshire.
[17] Cooper, P, 1995, Colour in Dyehouse Effluent, Society of Dyers and
Colourists, West Yorkshire.
[18] Raghavendra, R.H., Kamath, M.G., Dahiya, A., 2004, Fiber and Fiber
Consumption in Nonwovens, Materials Science and Engineering 554, viewed
25 January 2009,
http://www.engr.utk.edu/mse/pages/Textiles/Fiber%20and%20fiber%20consu
mption%20in%20nonwovens.htm
[19] Cotton Counts, 2008, ‘Cotton’s Major Uses’, Cotton: From Field to Fabric,
viewed 2 January 2009,
http://www.cotton.org/pubs/cottoncounts/fieldtofabric/uses.cfm
[20] Fibre Source, 2008, ‘Rayon Fiber (Viscose)’, Fibre Source, viewed 10
January 2009, http://www.fibersource.com/F-TUTOR/rayon.htm
[21] Cook, J.G., 1984, Handbook of Textile Fibres: Natural Fibres, 5th edn,
Merrow Publishing Co. Ltd, Durham.
[22] Fergusson, S.M., 2008, ‘The Effect of Laundry Detergents and Residual
Alkali on the Fastness of Reactive Dyes on 100% Cotton’, Master of
Technology, Royal Melbourne Institute of Technology.
[23] Burch, P., 2009, Direct Dyes, viewed 15 January 2009,
http://www.pburch.net/dyeing/directdyes.html
[24] Hunger, K., 2004, ‘Dyes, General Survey’, Industrial Dyes, Johann-Straufl-
Str, Frankfurt, Germany, viewed 30 January 2009,
http://dx.doi.org/10.1002/3527602011.ch1

97
[25] Holme, I., 2004, ‘Development of the Reactive Dye Market in India and its
Future Trends’, Reactive Dyes: A Celebration of 50 Years of Innovation, An
International Symposium, UMIST, UK April 14 – 16, 2004.
[26] Wen, J., Zhenghua, Z., Kongchang, C., 1989, ‘Study on the Hydrolysis
Kinetics of Vinylsulphonyl Reactive Dye-Fiber Bond’, Dyes and Pigments,
vol. 10, no. 3, pp. 217 – 237.
[27] Australian Wool Innovation, 2007, Wool Colouration, viewed 20 January
2009,
http://www.merinoinnovation.com/wps/wcm/resources/file/eb1c7e0d700fa9e/
wetpro_colouration.pdf
[28] Water 3 Engineering Inc., 2005, Final Analysis of the Potential Benefits of
Recycled Water Use in Dye Houses, viewed 8 February 2009,
http://www.owue.water.ca.gov/recycle/docs/RW_Dye.pdf.
[29] Dyes and Pigments, 2009, Batch Dyeing Process, viewed 4 February 2009,
http://www.dyespigments.com/batch-dyeing-process.html
[30] Textile Manufacture Techniques, 2008, Lesson 12: Selection of Dyeing
Method, Rai University, viewed 18 December 2008,
http://www.rocw.raifoundation.org/fashion/BAfashion-
mktg/textilemanufacturingtechniques/lecture-notes/lecture-12.pdf
[31] Dyes and Pigments, 2009, Machinery, viewed 4 February 2009,
http://www.dyespigments.com/machinery.html
[32] The Dye House, 2007, Why Garment Dye, viewed 6 January 2009,
http://dyehouseltd.com/why.html
[33] Scotney, J., 1988, ‘The Scope of Garment-Dyeing’, Textile Institute, vol. 19,
no. 2, pp. 29 – 32.
[34] Zollinger, H., 2003, Colour Chemistry Syntheses Properties and
Applications of Organic Dyes and Pigments, 3rd edn, Heletica Chimica Acta,
Zurich.
[35] Adivarebar, R.V., Kangoogo, N., 2008, ‘Textile Wet Processing Scenario in
India’, The Indian Textile Journal, viewed 10 November 2008,
http://www.indiantextilejournal.com/articles/FAdetails.asp?id=793
[36] Burkinshaw, S.M., Gotsopoulos, A., 1999, ‘Pretreatment of Cotton to
Enhance its Dyeability; Part 2 Direct Dyes’, Dyes and Pigments, vol. 42, pp.
179 – 195.

98
[37] Lim, S.H., Hudson S.M., 2004, ‘Application of a Fibre-Reactive Chitosan
Derivative to Cotton Fabric as a Zero-Salt Dyeing Auxiliary’, Colouration
Technology, vol. 120.
[38] Zhang, W.M.S., Tang, B., Yang, J., 2005, ‘Pretreatment of Cotton with
Poly(vinylamine chloride) for Salt-Free Dyeing with Reactive Dyes’,
Colouration Technology, vol. 121, no. 4, pp.193 – 197.
[39] Moncrieff, R.W., 1975, Man-Made Fibres, 6th edn, Newnes-Butterworths,
London.
[40] Textile Exchange, 2008, Chitin and Chitosan – Eco Friendly Textile
Finishes, viewed 15 February 2008, http://www.teonline.com/knowledge-
centre/chitin-chitosan.html
[41] www.sigma-aldrich.com
[42] Melliand, 2006, International Textile Auxiliaries Buyer’s Guide 2006/2007,
Deutscher Fachverlag, Germany.
[43] Peters, R.H., 1967, Textile Chemistry Volume 2: Impurities of Fibres;
Purification of Fibres, Elsevier Publishing Company, London.
[44] Robinson, J.W., 1995, Undergraduate Instrumental Analysis, 5th edn, Marcel
Dekker Inc., New York.
[45] FAS Online, 2005, viewed 3 June 2009, http://www.fas.usda.gov/cotton
/circular/2001/07/master 2.htm
[46] Sigma Aldrich, 2009, viewed 21 June 2009,
http://www.sigmaaldrich.com/catalog
[47] Various dye pattern cards.

Appendix I


Appendix II